contents · population a continuous supply of locally refined and packed edible oils of...
TRANSCRIPT


CONTENTS
At a Glance Financial Highlights Corporate Information
2-4 5-7 8
Chairman’s Report Directors’ Profile Senior Management Team
9 12-13 16
Corporate Governance Report
Statement of Directors’ Responsibilities Statement of Compliance
18-27 30 30
Statutory Disclosures Secretary’s CertificateIndependent Auditors’ Report to the Members
31-33 36 37-39
Statements of Financial Position Statements of Profit or Loss
Statements of Profit or Loss and Other Comprehensive Income
40 41 42
Statements of Changes in Equity Statements of Cash Flows
Notes to the Financial Statements
43-44 45 46-93
Dear Shareholder,
The Board of Directors is pleased to present the Annual Report of Mauritius Oil Refineries Limited and its subsidiaries for the year ended June 30, 2017, the contents of which are listed below.
This report was approved by the Board of Directors on September 27, 2017.
G. Allain D. de Spéville M.D.P André Espitalier NoëlChairman Managing Director
1MAURITIUS OIL REFINERIES LIMITED ANNUAL REPORT 2017

Mauritius Oil Refineries Limited (MOROIL) started its commercial operations in 1968. In line with the national import substitution policy, MOROIL set out to guarantee the Mauritian population a continuous supply of locally refined and packed edible oils of international quality, at competitive prices.
MOROIL’s core business is the refining and marketing of edible oil. Besides the selling of crude oil and its by-products, the marketing of a selected range of quality food products; the administrative and investment operations form part of the other business activities of the company,
The MSB certificate mark has been awarded to MOROIL since 1983 and in the year 2000, the company became HACCP certified. MOROIL also holds the SA8000:2008 (Social Accountability) certification since March 2011 demonstrating its commitment towards international human rights norms and national labour laws.
MOROIL’s acknowledged competencies have also been conducive in the setting up of partnerships with renowned European producers, namely Lesieur from France, Sovena and Angel Camacho from Spain and Attianese from Italy for the representation and marketing of their products on the Mauritian market.
Company Profile
MAURITIUS OIL REFINERIES LIMITED ANNUAL REPORT 20172

3
VALUES• Integrity
• Team work
• Customer driven
• Accountability
• Fairness
• Exemplarity
MISSIONWe shall strive to achieve sustainable growth and to create value for our stakeholders through efficient :
• Production and commercialisation of quality vegetable oils.• Marketing of selected food products.• Operation of diversified activities in compliance with
international standards.
A recognised regional leader in our field of expertise.
VISION
MAURITIUS OIL REFINERIES LIMITED ANNUAL REPORT 2017

Key aspects of our business and highlights for 2017
Edible OilsQuality Food ProductsMetal Cans and Plastic Containers
Sectors of activity3
The Company is certified SA8000:2008 since 2011; the standard on Social Accountability issued by Social
Accountability International (USA).
Social Accountability
DedicatedEmployees
Products
187 91+ 24CSR socialprojects
HACCPMAURITIUS STANDARDS BUREAU
SA 8000: 2008KOSHER CERTIFIEDHALAL CERTIFIED
Our Certifications
4MAURITIUS OIL REFINERIES LIMITED ANNUAL REPORT 2017
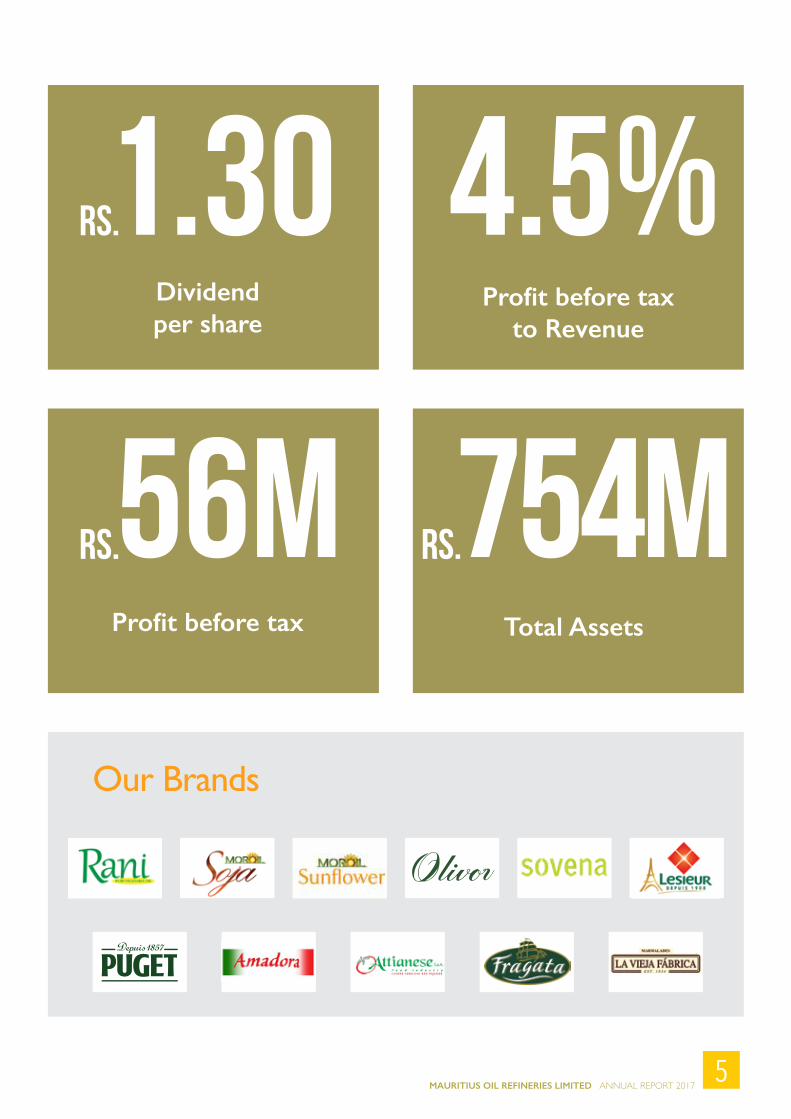
1.30Rs.
56mRs. 754mRs.
4.5%
Our Brands
Dividendper share
Profit before tax to Revenue
Total AssetsProfit before tax
5MAURITIUS OIL REFINERIES LIMITED ANNUAL REPORT 2017
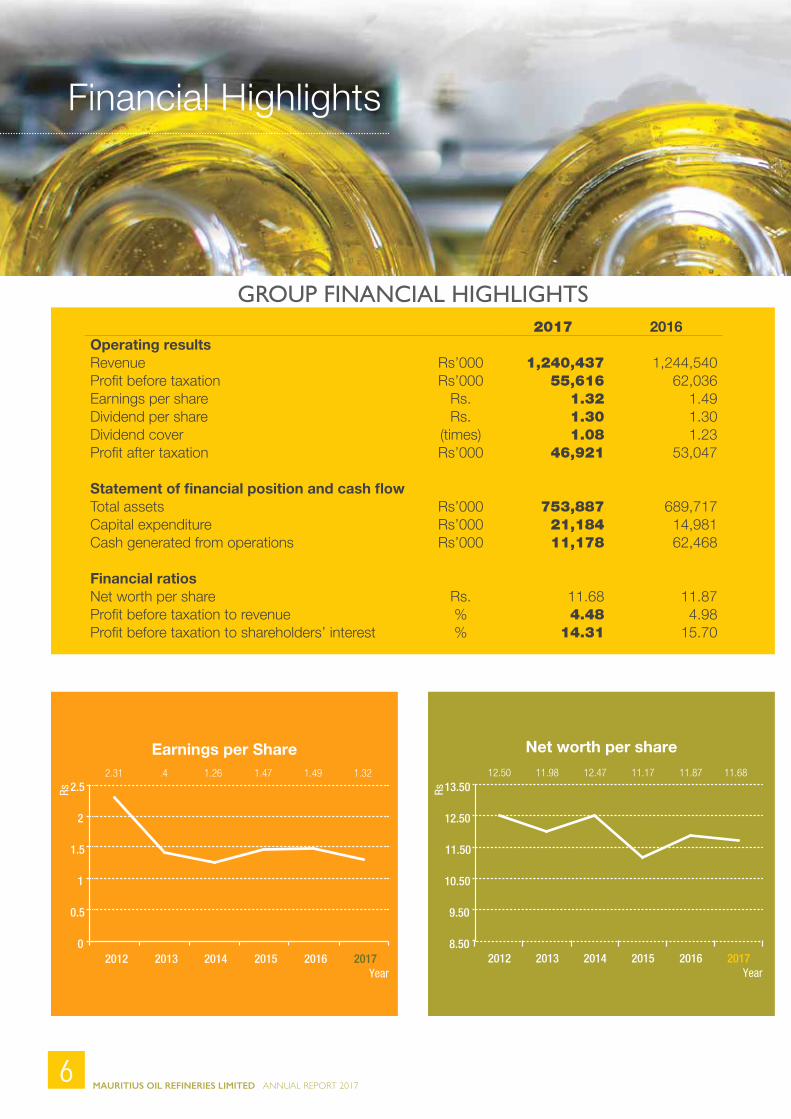
0
0.5
1
1.5
2
2.5
2012 2013 2014 2015 2016 2017
Rs
Year
2.31 .4 1.26 1.47 1.49 1.32
8.50
9.50
10.50
11.50
12.50
13.50
2012 2013 2014 2015 2016 2017
12.50 11.98 12.47 11.17 11.87 11.68
Rs
Year
6MAURITIUS OIL REFINERIES LIMITED ANNUAL REPORT 2017
2017 2016Operating resultsRevenue Rs’000 1,240,437 1,244,540 Profit before taxation Rs’000 55,616 62,036 Earnings per share Rs. 1.32 1.49 Dividend per share Rs. 1.30 1.30 Dividend cover (times) 1.08 1.23 Profit after taxation Rs’000 46,921 53,047
Statement of financial position and cash flowTotal assets Rs’000 753,887 689,717 Capital expenditure Rs’000 21,184 14,981 Cash generated from operations Rs’000 11,178 62,468
Financial ratiosNet worth per share Rs. 11.68 11.87 Profit before taxation to revenue % 4.48 4.98 Profit before taxation to shareholders’ interest % 14.31 15.70
Financial Highlights
Earnings per Share Net worth per share
GROUP FINANCIAL HIGHLIGHTS

7MAURITIUS OIL REFINERIES LIMITED ANNUAL REPORT 2017
Turnover
Profit after Taxation
Group
Group
Company
Company
2012 2013 2014 2015 2016 2017 Year
-
500.0
1,000.0
1,500.0
1,458 1,342 1,151 1,099 1,116 1,118Rs'M
2012 2013 2014 2015 2016 2017 Year
-
40.0
20.0
60.0
80.0
71 45 38 50 44 43Rs'M
2012 2013 2014 2015 2016 2017 Year
-
500.0
1,500.0
1,000.0
2,000.0
1,603 1,472 1,279 1,224 1,244 1,240Rs'M
2012 2013 2014 2015 2016 2017 Year
-
40.0
20.0
60.0
80.0
77 48 42 51 53 47Rs'M

Corporate Information
CompanySecretarySpeville Secretarial Services LtdChancery House, Lislet Geoffroy Street,Port Louis
Legal AdviserMe Yves Hein
BankersMauritius Commercial Bank LtdBarclays Bank Mauritius LtdState Bank of Mauritius LtdHongKong & Shanghai BankingCorporation LtdHabib Bank LimitedAfrasia Bank Ltd
RegistryHarel Mallac Corporate Services18 Edith Cavell Street,Port Louis
BusinessRegistrationNumberC09001521
AuditorsBDO & Co
Registered OfficeMauritius Oil Refineries LtdQuay RoadPort Louis, Mauritius
8MAURITIUS OIL REFINERIES LIMITED ANNUAL REPORT 2017

Chairman’s Report
Dear Shareholder,
It is my pleasure to present on behalf of the Board of Directors, the Annual Report of the MAURITIUS OIL REFINERIES LTD, as well as the Financial Results of the Group for the year ended June 30, 2017.
Once again Mr. André Espitalier Noël and his executive team have achieved a very good financial performance in a very competitive environment.
I am pleased to advise that the Strategic Committee Charter was approved by the Board of Directors on September 30, 2016; the Committee’s purpose is to assist the Board in fulfilling its responsibilities to monitor the development of and ultimately approve the Company’s strategies and strategic plan. With the expertise of a consultant in capacity building and organizational development, management is in the process of developing a three-year strategic plan which will be presented to the Board by March 2018.
The refining oil operations remain challenging due to fierce competition from some imported oils. Investigation is still ongoing with regards to the suspected unfair practices I mentioned in my last year’s report. The other business activities have positively impacted upon the overall results of the group.
The members of the Board of Directors were deeply saddened by the news of Mr. G. E. Mouser’s passing on September 14, 2017. Mr. Mouser (Geoff) was appointed Director of the Company on 24th February 1978 and resigned on 28th October 2005. The Directors want to put on record their sincere appreciation for Geoff’s immense contribution in MOROIL’s accomplishments during the 32 years he served the Company and present their heartfelt condolences to his family.
On behalf of the Board of Directors and in my own personal name, I would like to express my gratitude and thanks to the Managing Director, his Management Team and all the personnel of the Group for their contribution to the achievement of such positive results.
I also thank my fellow Directors for their support and particularly Mr. Paul Clarenc for his learned advices.
G. Allain D. DE SPEVILLE
27th September 2017
9MAURITIUS OIL REFINERIES LIMITED ANNUAL REPORT 2017

10MAURITIUS OIL REFINERIES LIMITED ANNUAL REPORT 2017
MOROIL employs some 187 active employees and considers its human capital as a vital asset. The Company ensures that its employment policy is fair and procedures adopted are transparent, merit based and in accordance to all legislations.
MOROIL spares no effort in attracting, motivating and retaining talented people who contribute to the success of the Company. Employees participate in a profit sharing scheme based on performance at work.
Training and Development are considered as top priority for all employees. MOROIL has always invested in development programmes where each employee acquires specific and adequate training to build capabilities.
We have always been committed to ensure a suitable work-life balance in a healthy and safe environment.
PEOPLE
11MAURITIUS OIL REFINERIES LIMITED ANNUAL REPORT 2017

Mr. G. Allain D. DE SPEVILLE (Non-Executive)
Mr. G.Allain D.DE SPEVILLE aged 65, joined the Board of Directors of Mauritius Oil Refineries Limited on September 29, 1995 and was appointed Chairman of the company on March 23, 2007. He is a Notary Public and is currently a director of the following listed company:
- Mauritius Chemical & Fertilizer Industry Ltd
Mr. M.D.P. André ESPITALIER NOEL (Executive)
Mr. M.D.P. André ESPITALIER NOEL aged 56, joined the Board of Directors of Mauritius Oil Refineries Limited on March 31, 2007 and is the Managing Director since January 1, 2015. He is also a director of the following listed companies:
- Plastic Industry (Mauritius) Ltd- ENL Ltd
Mr. R.J. Paul CLARENC(Non-Executive)
Mr. R.J.Paul CLARENC aged 73, joined the Board of Directors of the Mauritius Oil Refineries Limited on September 26, 1987 and is currently a director of the following listed companies:
- Plastic Industry (Mauritius) Ltd (Chairman)- Harel Mallac & Company Limited
Mr. Ashraf M. CURRIMJEE (Non-Executive)
Mr. Ashraf M. CURRIMJEE aged 55, joined the Board of Directors of Mauritius Oil Refineries Limited on June 22, 1994 and is the Managing Director of Soap & Allied Industries Limited.
Mr. Akhtar N.Y. DAWOOD (Independent)
Mr. Akhtar N.Y. DAWOOD aged 59, joined the Board of Directors on March 10, 2004 and is the Managing Director of ED Electronics Limited.
Mr. J.H. Maurice de MARASSE ENOUF (Independent)
Mr. J.H. Maurice de MARASSE ENOUF aged 72, joined the Board of Directors on February 26, 1986 and is a Director of the following listed companies:
- Innodis Ltd- Terra Mauricia Ltd
Directors’ Profile
12MAURITIUS OIL REFINERIES LIMITED ANNUAL REPORT 2017

Directors’ Profile
Mr. Hansraj RUHEE (Independent)
Mr. Hansraj RUHEE aged 75, joined the Board of Directors of Mauritius Oil Refineries Limited on November 16, 2005 and is a director of Ramphul Ltd and Les Moulins de la Concorde Ltée.
Mr. Yakub M.K. MORIA (Non-Executive)
Mr. Yakub M.K. MORIA aged 58, joined the Board of Directors of Mauritius Oil Refineries Limited on June 8, 1998.
Mr. S. Rehaz A. SAYED HASSEN (Executive)
Mr. S. Rehaz A. SAYED HASSEN aged 55, joined the Board of Directors of Mauritius Oil Refineries Limited on September 28, 2011. He is currently the Finance Manager of the Company.
Mr Jérôme P.E. CLARENC (Executive)
Mr. Jérôme P.E. CLARENC aged 40, joined the Board of Directors of Mauritius Oil Refineries Limited on September 29, 2014. He is currently the Marketing Manager of the Company.
ALTERNATE DIRECTOR’S PROFILE
Mr. Issa Muddine SAYED HASSEN
Mr. Issa Muddine SAYED HASSEN aged 84, was appointed as alternate director on February 13, 2015. He was previously the Finance Manager of the Company.
13MAURITIUS OIL REFINERIES LIMITED ANNUAL REPORT 2017

MOROIL SOYABEAN OIL
RANI VEGETABLE OIL
14MAURITIUS OIL REFINERIES LIMITED ANNUAL REPORT 2017

EXPERTISE, FOOD SECURITY & QUALITY
MOROIL prides itself in possessing a high tech refinery and a skilled personnel ensuring the production of quality products with the
appropriate food security and quality management systems.
Moroil Sunflower, Soya and Rani are produced from 100% vegetable crude oils, stringently selected on the world market and carefully
refined in Mauritius to ensure their stability and preserve the best of their nutritional values and organoleptic characteristics.
MOROIL SUNFLOWER OIL
15MAURITIUS OIL REFINERIES LIMITED ANNUAL REPORT 2017

THE COMPANY
Mr. M.D.P. André ESPITALIER NOËL
Mr. André Espitalier Noël, aged 56, is a Food Engineer of ENITA, Dijon, France. He has been appointed Managing Director on January 1, 2015 and was previously the Managing Director of Plastic Industry (Mauritius) Ltd.
Mr. Jérôme P.E. CLARENC
Mr. Jerome Clarenc, aged 40, joined the Company in September 2005 and was appointed Marketing Manager in 2007. He holds a Diploma in Marketing & Management (Cape Town) and worked for a period of three years up to August 2005 at IBL Group. He is currently an executive member of the Association of Mauritian Manufacturers.
Mr. S. Rehaz A. SAYED HASSEN
Mr. S. Rehaz A. Sayed Hassen, aged 55, joined the Company in January 1983. He holds an Advanced Certificate in Business Management. He was appointed Accountant in 1992 and Finance Manager in 2004. He is also responsible of the IT Department. He is a board member of MEF Provident Association since 2003.
Mr. Lynden LAREINE
Mr. Lynden Lareine, aged 51, joined the Company in June 1991 as Internal Auditor and is the Internal Audit Manager of the Group since 2004. He is an affiliate member of the Chartered Institute of Internal Auditors and holds a Diploma in Business Management.
Mr. John SMITH
Mr. John Smith, aged 48, joined the Company as Group Human Resources Manager in April 2004. He holds an MBA EBS Paris and worked as Assistant Human Resources Manager from 1990 to 2004 at Constance S.E. He resigned as from April 2017.
Mr. Ravish MUSRUCK
Mr. Ravish Musruck, aged 41, joined the company in October 2000 as Food Technologist. He holds an MSc Food Technology (Reading - UK) and an MBA (General). He was appointed Process Manager in July 2013.
Mr. J.L. Gilles PERRIER
Mr. J.L. Gilles Perrier, aged 63, joined the group in January 1974. He was appointed Service Manager in September 2002. He is involved in the infrastructure project and energy management.
THE SUBSIDIARIES
Mr. Y. Patrick PIN HARRY
Mr. Y. Patrick Pin Harry, aged 62, joined the company in 1971 in the Sales Department. He was appointed Bottling Manager in 1981 and is representing Mauritius Oil Refineries Limited as Manager of Pharmalab Plastic Supplies Limited since 1998.
Mr. Patrice HERMELIN
Mr. Patrice Hermelin, aged 60, joined the company in January 1974 in the Sales Department. He was appointed Accountant of Metal Can Manufacturers Ltd in 1981 and Finance and Administrative Manager in 2011.
Senior Management Team
16MAURITIUS OIL REFINERIES LIMITED ANNUAL REPORT 2017

FRANCE’S NUMBER 1 OLIVE OIL
Born in Marseilles in 1857, Puget has since built its reputation on its high quality and its passion for
Mediterranean flavour.Puget combines tradition, conviviality and taste with its range of olive oils and light vinaigrettes.
Puget Spécialités à Tartiner
Puget Olive Oils
Puget Vinaigrettes
17MAURITIUS OIL REFINERIES LIMITED ANNUAL REPORT 2017
Corporate Governance Report
COMPLIANCE STATEMENT
The Company is committed to the highest standard of business integrity, transparency and professionalism in all its activities to ensure that the activities within the Company are managed ethically and responsibly to enhance business value for stakeholders. As an essential part of this commitment, the board subscribes to and is fully committed to complying with the code of Corporate Governance of Mauritius.
The directors continuously consider the implications of best practice corporate governance and are of the opinion that the Company complies with the requirements of the code of corporate governance in all material respects.
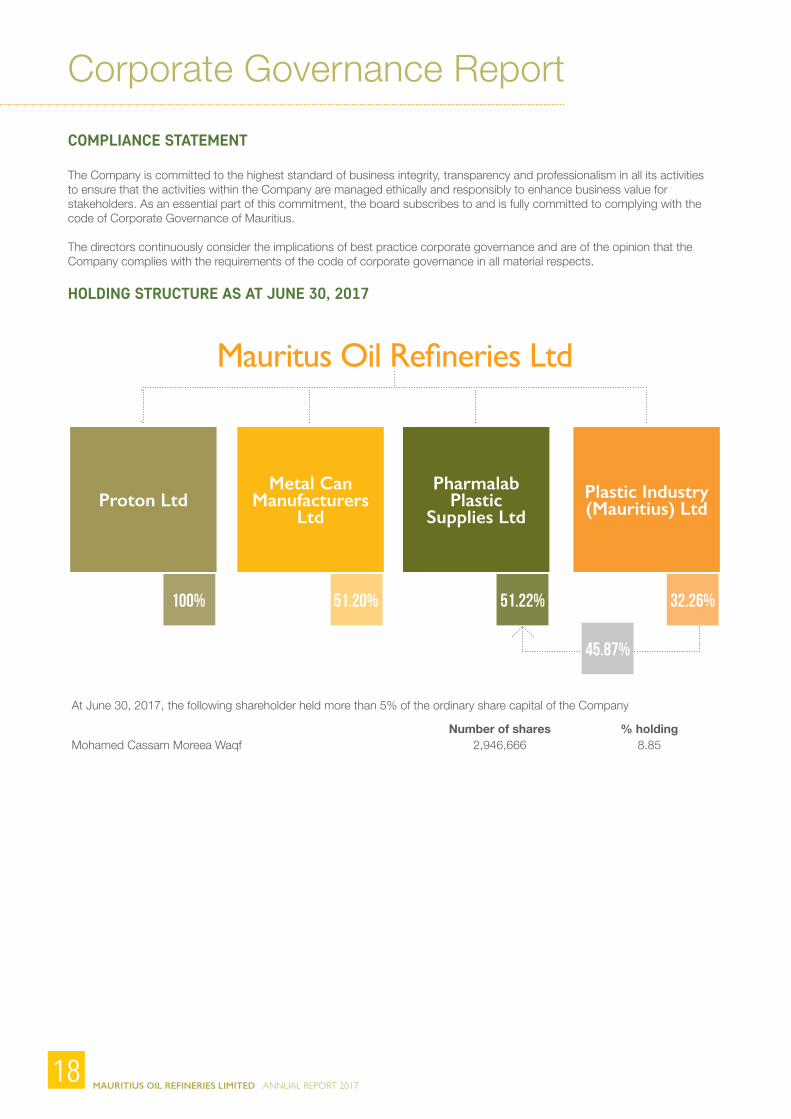
HOLDING STRUCTURE AS AT JUNE 30, 2017
At June 30, 2017, the following shareholder held more than 5% of the ordinary share capital of the Company
Number of shares % holdingMohamed Cassam Moreea Waqf 2,946,666 8.85
Proton LtdMetal Can
Manufacturers Ltd
Pharmalab Plastic
Supplies LtdPlastic Industry(Mauritius) Ltd
Mauritus Oil Refineries Ltd
45.87%
100% 51.20% 51.22% 32.26%
18MAURITIUS OIL REFINERIES LIMITED ANNUAL REPORT 2017

Corporate Governance Report
COMMON DIRECTORS AS AT JUNE 30, 2017
List of directors
Mauritius Oil Refineries
Limited Proton Limited
Metal Can Manufacturers
Limited
Pharmalab Plastic Supplies
Limited
Mr. G. Allain D. DE SPEVILLE n n n
Mr. M.D.P. André ESPITALIER NOEL n n n
Mr. R.J. Paul CLARENC n n n n
Mr. Akhtar N.Y. DAWOOD n
Mr. Ashraf M. CURRIMJEE n
Mr. Hansraj RUHEE n
Mr. J.H. Maurice de MARASSE ENOUF n
Mr. Yakub M.K. MORIA n
Mr. Jérôme P.E. CLARENC n
Mr. S. Rehaz A. SAYED HASSEN (Alternate to Mr. Issa Muddine SAYED HASSEN in Pharmalab Plastic Supplies Limited)
n n
Mr. Issa Muddine SAYED HASSEN (Alternate to Mr. S. Rehaz A. SAYED HASSEN in Mauritius Oil Refineries Limited and to Mr. R.J Paul CLARENC in Pharmalab Plastic Supplies Limited)
n n n n
PROFILE OF COMPANY ‘S SHAREHOLDERS AS AT JUNE 30, 2017
Size of shareholdingNumber of
shareholdersNumber of
shares owned % holding
1-500 519 95,868 0.288501-1,000 205 161,435 0.4851,001-5,000 548 1,405,611 4.2245,001-10,000 197 1,419,319 4.26510,001-50,000 284 6,540,274 19.65250,001-100,000 55 3,901,213 11.722100,001-250,000 34 5,284,614 15.879250,001-500,000 11 4,044,278 12.1520ver 500,000 10 10,427,644 31.333Total 1,863 33,280,256 100.000
SUMMARY BY SHAREHOLDING CATEGORY AS AT JUNE 30, 2017
Category of shareholdingNumber of
shareholdersNumber of
shares owned % holding
Individuals 1,617 15,926,587 47.856Insurance & Assurance companies 10 1,371,015 4.120Pension & Provident funds 56 2,688,382 8.078Investment & Trust companies 15 563,467 1.693Other Corporate Bodies 165 12,730,805 38.253Total 1,846 33,280,256 100.000
19MAURITIUS OIL REFINERIES LIMITED ANNUAL REPORT 2017

Corporate Governance Report
MAJOR SHAREHOLDERS
The list of major shareholders holding more than 5% of the equity share capital of the company is disclosed on page 18.
DIVIDEND POLICY
The Company’s policy is to distribute a reasonable amount of the after tax profit for the relevant period subject to the solvency test under the S6(1) of the Companies Act 2001 being satisfied. The Board gives due consideration to capital investment requirements and also ensures that there is no major fluctuation in dividend payments from one year to another.
During the year under review, the Board declared a dividend of Rs.1.30 (2016: Rs.1.30) per ordinary share.
THE BOARD OF DIRECTORS
CompositionDirectors’ profile appears on pages 12 and 13.
The Company’s constitution provides that the board of the Company shall consist of a minimum of 8 and a maximum of 15 directors.
The roles of the Chairman and the Managing Director are separated with Mr. G. Allain D. de Spéville and Mr. M.D.P. André Espitalier Noël appointed to these positions respectively.
Of the ten members serving at year-end, three were executive directors, four were non-executive and the remaining three were independent. The non-executives and independent directors come from diverse business backgrounds and possess the necessary knowledge, skills, objectivity, integrity, experience and commitment to make sound judgments on various key issues relevant to the business of the Company independent of management.
All directors receive timely information so that they are equipped to play as fully their part as possible in board meetings. All board members have access to the Company Secretary for any further information they require. The Company has already implemented measures for assessing the directors both individually (annually) and collectively as a board. The Secretary ensures that the board members receive appropriate training as necessary. Independent professional advice would be available to directors in appropriate circumstances, at the Company’s expense.
Three directors are required to submit themselves for re-election every year retiring by rotation according to section 100 of the Articles of Association of the Company. New directors are appointed to the board on the recommendation of the Nomination Committee.
The board has four standing board committees (as described on pages 21 and 22, which meet regularly under terms of reference set by the board.
DIRECTORS’ INTERESTS IN SHARES
Directors’ interest in shares is disclosed on page 32.
RELATED PARTY TRANSACTIONS
Related Party Transactions are discussed in note 33 of the financial statements.
DIRECTORS’ DEALINGS IN SHARES OF THE COMPANY
The directors follow the principles of the model code on securities transaction as detailed in Appendix 6 of the Mauritius Stock Exchange Listing Rules whenever they deal in the shares of the Company. During the year under review, none of the Company’s Directors traded in the Company’s shares.
SENIOR MANAGEMENT TEAM
The senior management teams of the Company and its subsidiaries are found on page 16.
MATERIAL CLAUSES OF THE COMPANY’S CONSTITUTION
- the Company has wide objects and powers;- there are no ownership restrictions or pre-emptive rights
attached to the shares;- the Board shall not be fewer than 8 directors nor more
than 15 directors;- the chairperson has casting vote;- there shall be a quorum for holding a General Meeting
where 4 shareholders holding at least ten percent 10% of the total number of issued shares of the Company are present or represented.
SHAREHOLDERS’ AGREEMENT
There is currently no shareholders’ agreement which affects the governance of the Company by the Board.
THIRD PARTY AGREEMENT
There was no agreement between third parties and the Company or its subsidiaries during the year under review.
REMUNERATION POLICY
The Corporate Governance Committee is responsible for the remuneration policy of the Company. The remuneration package consists of basic salary, fringe benefits and a profit sharing scheme for all employees. The remuneration package of the executive management also comprises a performance related reward consistent with the Group’s policy.
20MAURITIUS OIL REFINERIES LIMITED ANNUAL REPORT 2017
Corporate Governance Report
DIRECTORS’ FEES
All directors are paid directors’ fees based on their responsibilities on the Board. Directors sitting on Board Committees and on the Boards of subsidiary companies also receive additional fees.
DIRECTORS’ REMUNERATION
Directors’ remuneration is given on page 32. It has not been disclosed on an individual basis due to commercial sensitivity of that information.
BOARD COMMITTEES
Corporate Governance Committee
The Corporate Governance Committee, which includes the Nomination and Remuneration Committees, consists of four members namely: Mr. G. Allain D. DE SPEVILLE (Chairman), Mr. R.J. Paul CLARENC, Mr. Yakub M.K. MORIA and Mr. Hansraj RUHEE.
The main objects and functions of the Committee are:-
• to determine, agree and develop the Company’s general policy on corporate governance in accordance with the applicable Code of Corporate Governance.
• advise and make recommendations to the Board on all aspects of corporate governance, remuneration and appointments.
• prepare the Corporate Governance Report.
The Committee met twice this year and is satisfied that it has discharged its responsibilities for the year in compliance with its terms of reference.
Audit & Risk Committee
The Audit & Risk Committee is appointed by the Board and is governed by a charter updated and adopted by the board. The Committee consists of four members namely: Mr. Akhtar N.Y. DAWOOD (Chairman), Mr. J.H. Maurice DE MARASSE ENOUFMr. Hansraj RUHEEMr. Issa Muddine SAYED HASSEN
The Board considers that each member brings broad experience and professional knowledge of financial reporting to the Committee’s deliberations. The main objective of the Audit & Risk Committee is to assist and advise the Board of Directors on accounting aspects and financial reporting and ensure that risks are properly identified and managed.
The Audit & Risk committee focuses on.- The functioning of internal control systems and the
internal audit.- The constant identification of actual and potential risks
both operational and non-operational.- The proper implementation of Company’s risk policies.- The reliability, accuracy, and integrity of financial reporting.
- The Company’s compliance with applicable laws, and best corporate governance practices and regulatory requirements.
- The evaluation of the independence, effectiveness, objectivity of both the internal and external auditors.
- In attendance:- Mr. M.D.P Andre Espitalier Noel, Managing Director.- Mr. S. Rehaz A. Sayed Hassen, Finance Manager.- Mr. Lynden Lareine, Internal Audit Manager.
The Committee also invites the External Auditors to attend meetings and any member of management and of subsidiaries.
During the year, the committee examined and made recommendations to the Board on the group’s quarterly financial statements prior to filing and publication, and also examined all the company’s audited and interim accounts as well as that of its subsidiaries.
The Committee also reviewed and monitored management’s responsiveness to the internal and external audit findings and recommendations.
The Committee met five times during the year ended June 30, 2017 and fulfilled its responsibilities for the year under review, in compliance with its formal terms of reference.
Ethics Committee
The Ethics Committee was set up on May 14, 2010 with the following objectives:
a) assist the Board in overseeing that the Company is committed to the highest ethical standards;
b) promote an organisational culture that encourages law abiding and ethical conduct;
c) review the effectiveness of the compliance and enforcement frame work as provided in the code.
The committee is composed of Messrs Hansraj RUHEE (Non-Executive Director) - Chairman, M.D.P. André ESPITALIER NOEL (Managing Director), R.J. Paul CLARENC (Non-Executive Director) and S. Rehaz A. SAYED HASSEN (Secretary). It was assisted by Mr. John SMITH (Ex-Human Resources Manager) - the Compliance Officer. The aim of the committee is to ascertain that there is no deviation from the Ethics principle and culture. Appropriate corrective measures are taken as and when necessary.
The Ethics committee met in March 2017 to analyse and assess the level of compliance of the company’s code of Ethics and took note of the good initiative taken by the compliance officer to organise refresher course on the code of Ethics for employees and staff. The new code of corporate governance is still under study for eventual application on approval of the board.
The Ethics committee is satisfied with the level of Ethics maintained and wishes to express its appreciation to the workers and staff for their commitments and dedication with respect to the code of Ethics.
21MAURITIUS OIL REFINERIES LIMITED ANNUAL REPORT 2017
Strategic Committee
The Strategic Committee Charter was approved by the Board of Directors on September 30, 2016. The purpose of the committee is to assist the Board in fulfilling its responsibilities to monitor the development of and ultimately approve the Company’s strategies and strategic plan.
The committee consists of six board members namely Messrs. R.J. Paul CLARENC who is also the Chairman of the committee, Akhtar N.Y. DAWOOD, J.H. Maurice DE MARASSE ENOUF and three executive directors Messrs. M.D.P. André ESPITALIER NOEL, S. Rehaz A. SAYED HASSEN and Jérôme P.E. CLARENC.
During the year, the Board appointed a consultant, expert in capacity building and organizational development, to assist the company’s executive team in developing and recommending a three-year strategic plan. The committee met on four occasions and also held a number of workshops to, inter alia, scan the business environment and the resulting medium and long-term outlook, redefine the company’s charter and corporate values, and provide insights on the company’s overall strategy and operations of particular strategic importance. The Board is being constantly appraised of the proceedings of the committee.
Corporate Governance Report
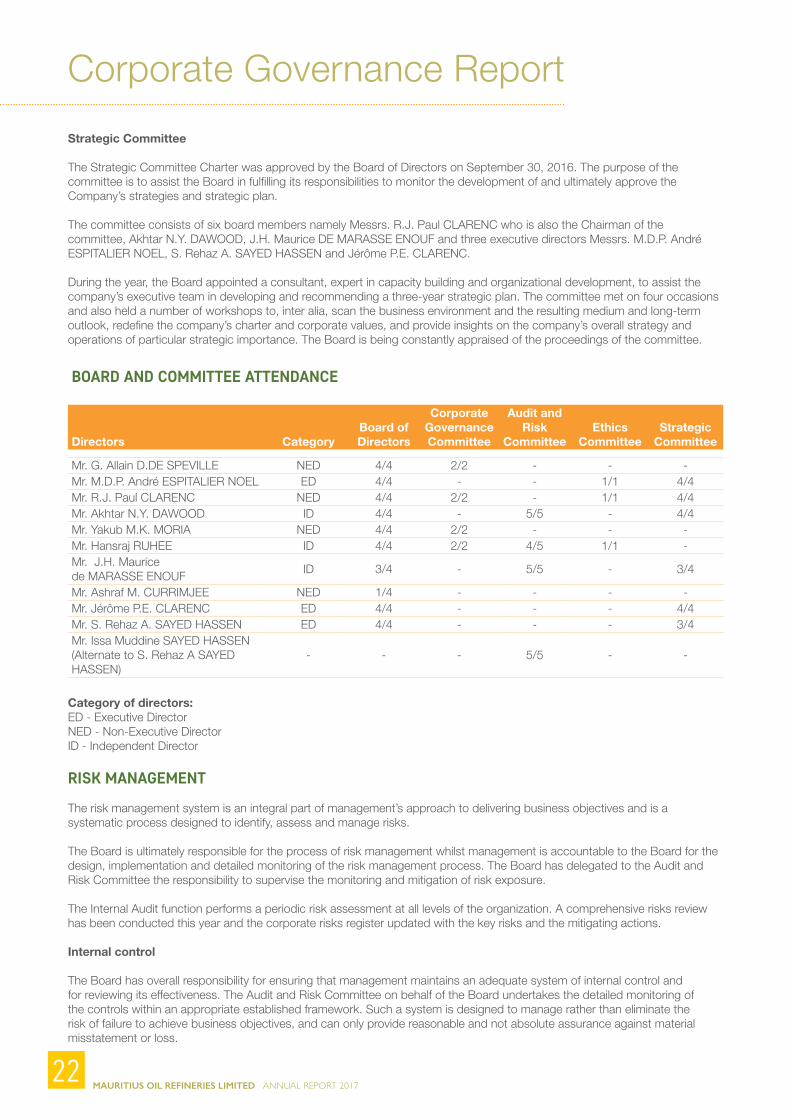
BOARD AND COMMITTEE ATTENDANCE
Directors CategoryBoard ofDirectors
CorporateGovernance Committee
Audit and Risk
CommitteeEthics
CommitteeStrategic
Committee
Mr. G. Allain D.DE SPEVILLE NED 4/4 2/2 - - -Mr. M.D.P. André ESPITALIER NOEL ED 4/4 - - 1/1 4/4Mr. R.J. Paul CLARENC NED 4/4 2/2 - 1/1 4/4Mr. Akhtar N.Y. DAWOOD ID 4/4 - 5/5 - 4/4Mr. Yakub M.K. MORIA NED 4/4 2/2 - - -Mr. Hansraj RUHEE ID 4/4 2/2 4/5 1/1 -Mr. J.H. Maurice de MARASSE ENOUF
ID 3/4 - 5/5 - 3/4
Mr. Ashraf M. CURRIMJEE NED 1/4 - - - -Mr. Jérôme P.E. CLARENC ED 4/4 - - - 4/4Mr. S. Rehaz A. SAYED HASSEN ED 4/4 - - - 3/4Mr. Issa Muddine SAYED HASSEN (Alternate to S. Rehaz A SAYED HASSEN)
- - - 5/5 - -
Category of directors:ED - Executive DirectorNED - Non-Executive DirectorID - Independent Director
RISK MANAGEMENT
The risk management system is an integral part of management’s approach to delivering business objectives and is a systematic process designed to identify, assess and manage risks.
The Board is ultimately responsible for the process of risk management whilst management is accountable to the Board for the design, implementation and detailed monitoring of the risk management process. The Board has delegated to the Audit and Risk Committee the responsibility to supervise the monitoring and mitigation of risk exposure.
The Internal Audit function performs a periodic risk assessment at all levels of the organization. A comprehensive risks review has been conducted this year and the corporate risks register updated with the key risks and the mitigating actions.
Internal control
The Board has overall responsibility for ensuring that management maintains an adequate system of internal control and for reviewing its effectiveness. The Audit and Risk Committee on behalf of the Board undertakes the detailed monitoring of the controls within an appropriate established framework. Such a system is designed to manage rather than eliminate the risk of failure to achieve business objectives, and can only provide reasonable and not absolute assurance against material misstatement or loss.
22MAURITIUS OIL REFINERIES LIMITED ANNUAL REPORT 2017

Corporate Governance Report
Systems and processes have been implemented and are reviewed on an ongoing basis by the Internal Audit function. The Audit and Risk Committee considers significant control matters raised by the internal and external auditors and reports its findings to the Board. Where weaknesses are identified, the Committee ensures that management takes appropriate action.
INTERNAL AUDIT
The Internal Audit Department carries out the audit of the Group’s operations by providing independent, objective assurance and consulting activity on risk management, internal control and governance processes. The objectives, authority and responsibilities of the Internal Audit function are elaborated in the approved Internal Audit Charter.
The Internal Audit Department has unrestricted access to all records, physical properties and personnel to discharge its responsibilities. The Internal Audit Manager reports functionally to the Audit and Risk Committee and administratively to the Managing Director.
The Internal Audit adopts a risk-based approach in formulating its audit plan. It assesses the adequacy of controls for key processes to mitigate risks identified. During the year, meetings were held regularly between the Internal Audit Manager, the Finance Manager together with senior management, to ensure any significant issues identified were addressed and to review progress on implementing audit recommendations. Updates on reviews and follow-ups were reported to the Audit and Risk Committee.
Risk factors
Set forth below are some of the risks and uncertainties that, if they were to occur, could materially and adversely affect our business or that could cause our actual results to differ materially.
Market Risks
The prices of crude oil may be volatile as a result of a number of factors, including general economic and climatic conditions, growing demand from emerging countries and the increasingly important requirements of the same raw materials by the biodiesel producers.
It is the Company’s policy that local prices should reflect the world market trends. Prices are adjusted accordingly in the best interests of our consumers whilst ensuring a reasonable return to our shareholders.
Refined oil operators have been facing severe competition from the COMESA and SADC countries .The injuries inflicted on the local edible oil manufacturers show how challenging the absence of level playing field may be and how damaging unfair practices could be.
Operational Risks
It is one of the Company’s main objectives to ensure a continuous supply of quality oil to all customers. In that respect, there is an efficient procurement policy in place.
However, shipments may be delayed for reasons beyond the Company’s control including, but not limited to, natural disasters, vessel’s attacks, geo-political tensions and other unexpected problems resulting in a shortage in the supply of crude oil. Nevertheless, management has a contingency plan to respond to this risk.
There is also the risk of a major machinery breakdown that could delay operations and disrupt market supply. This risk is mitigated with the stock on hand of critical parts and the ongoing maintenance programmes coupled with technical audits.
Food Safety Risk
The Company has implemented a Food Safety Management System based on HACCP (Hazard Analysis and Critical Control Point) principles, an internationally recognized and recommended approach to food safety. The Company was HACCP certified in December 2000 for the first time and has since successfully and consecutively passed all surveillance audits.
Food safety policy, procedures and activities are in place to ensure compliance with relevant standards, legislations and customer requirements. Furthermore, employees are regularly trained on proper food safety practices.
Management is fully committed for the continuous running of the HACCP food safety management system and is looking forward to building upon its already established framework to go a step further.
Financial risks
Information on financial risks management is given in note 3 to the financial statements.
Information Technology Risks
The Company relies considerably on the information technology environment to achieve its business objectives. In order to mitigate the risk of an information technology crash or major breakdown, the IT operating environment has been upgraded and secured to strategically ensure continuity in business information.
Information Security Management Procedures and Policy have been implemented since May 2015. An independent IT audit was conducted during the financial year and appropriate measures are being implemented.
Human Resources Risk
Loss of key personnel has been identified as major risk. In view of mitigating this risk, retention and reward policies have been implemented.
EMPLOYEE SHARE OPTION PLAN
No employee share option plan currently exists.
23MAURITIUS OIL REFINERIES LIMITED ANNUAL REPORT 2017

Corporate Governance Report
IMPORTANT EVENTS
Some of the key milestones were as follows:
Publication of condensed audited results for previous year September 2016Publication of condensed unaudited results for 1st quarter November 2016Dividend declaration - interim November 2016Annual Meeting of shareholders December 2016Publication of condensed unaudited results for 2nd quarter February 2017Publication of condensed unaudited results for 3rd quarter May 2017Dividend declaration - final May 2017
SHARE PRICE INDEX INFORMATION
The evolution of the Company’s share price over the last five years is as follows:
CHARITABLE DONATIONS
Charitable donation made by the Company during the year to one association, amounted to Rs 15,000 over and above CSR donation.
POLITICAL DONATIONS
The Company did not make any political donations during the year under review (2016: Rs.nil).
STAKEHOLDERS’ RELATIONS AND COMMUNICATION
The board aims to properly understand the information needs of all shareholders and places great importance on an open and meaningful dialogue with all those involved with the Company. It ensures that shareholders are kept informed on matters affecting the Company. Open lines of communication are maintained to ensure transparency and optimal disclosure. All board members are requested to attend the annual meeting, to which all shareholders are invited.
Jun-12
22.00
23.00
24.00
25.00
26.00
Rupe
es
Pric
e (R
s.)
27.00
28.00
29.00
30.00
Sep-12
Dec-12
Mar-13
Jun-13
Sep-13
Dec-13
Mar-14
Jun-14
Sep-14
Dec-14
Mar-15
Jun-15
Sep-15
Dec-15
Mar-15
Jun-16
Sep-16
Dec-16
Mar-17
Jun-17
24MAURITIUS OIL REFINERIES LIMITED ANNUAL REPORT 2017

Corporate Governance Report
SUSTAINABILITY REPORTING
We are committed to creating long-term value to our customers, other stakeholders and the community at large by continuously seeking to better integrate our sustainability efforts into our daily operations and actions.
CORPORATE GOVERNANCE
The Board of Directors is elected by the shareholders to oversee their interests in the long-term health and the overall success of the company’s business and its financial strength. As we keep moving towards our sustainability commitment, the Board has reviewed its composition and is now balanced; consisting of 3 Independent Directors, 3 Executive Directors and 4 Non-Executive Directors.
The three Board committees, namely the Corporate Governance Committee, the Audit and Risk Committee and the Ethics Committee are governed by their respective charters which address the identification and management of governance, economic, social and environmental issues.
The Board selects and oversees the members of senior management, who are charged with conducting the business of the company. The overall accountability for sustainability lies with the Managing Director and the Executive Committee. We strive to lead by example, guided by our high standards of corporate governance and ethics.
ENVIRONMENT
Business operations at MOROIL are undertaken in such a manner as to ensure that no significant disequilibrium of the ecosystem happens. MOROIL believes that this sustainable commitment can be best achieved through compliance to legal, statutory and to moral obligations. The agreement among stakeholders for sustainability objectives and the communication particularly to our personnel have been critical success factors over the years at MOROIL. Measurable targets along a defined time line have been put forward.
Current initiatives are mainly focused on the energy efficiency management and on the abatement of pollution load in the effluents. Independent report shows that the combustion efficiency of the coal fired boiler has been more than satisfactory and the gas oil monitoring, audited by Mauritius Revenue Authority, indicates efficient utilisation of energy fuels.
The PNEE (Programme National pour l’éfficience énergétique), supported by both AFD (Agence Française de Développement) and the European Union has set MOROIL’s energy management charter on very positive tracks since November 2016. Recommendations under this programme are also being adopted at the refinery process level.
The constructed wetland project, aiming at abating pollutants in our effluents, has gained considerable momentum. Both the Mauritius Research Council and the University of Mauritius are fully embarked on the project and preliminary phases have already been completed. Investments are still in line with the initial budget; and works are due to start at the end of September 2017.
25MAURITIUS OIL REFINERIES LIMITED ANNUAL REPORT 2017

SOCIAL
CORPORATE SOCIAL RESPONSIBILITY (CSR)
The company has been actively involved in social welfare activities since its creation. For the year ended June 30, 2017, the company has renewed its commitment to support the local registered NGOs, and a total amount of Rs 772,067 was dedicated towards the five priority areas of the national programme.
MOROIL continues to lay emphasis on education and training through the ZEP programme which provides assistance to all children of the Emmanuel Anquetil Government School and the Zippy Programme through the Roman Catholic Diocèse of Port-Louis aiming in educating and inculcating values to the students aged 5 to 7 years.
The company contributed to the rehabilitation and reintegration of ex-detainees through ‘Association Kinouete” as well as the rehabilitation of persons suffering from disabilities or mental diseases while continuing its support to environment sustainability projects of the Mauritian Wildlife and Mission Verte.
For the coming years, MOROIL is committed to continue meeting its social and community obligations.
Health
6%
10%Leisure & Sports
Environment
5%
43%Education & Training
Socio-Economic Development
36%
Rs.772,067Total amount of
Corporate Governance Report
26MAURITIUS OIL REFINERIES LIMITED ANNUAL REPORT 2017

Human Resources Practices & Policies
The company ensures that its employment policy is fair and procedures adopted are transparent, merit based and in accordance with all legislations.
Learning and development are considered as a continuous progress undertaken to improve employee knowledge, skills, attitude and behavior.
The company regularly assesses its future manpower requirements in line with its strategic goals and objectives.
To demonstrate its commitment and undertaking to comply with International Human Rights Norms and Mauritian labour laws so as to protect and empower its personnel the company is certified SA8000:2008 (Social Accountability) since March 2011.This certification is regularly audited by an external consultant and will be renewed in a new version SA8000-2014 for another three-year period up to March 2020. Employees fully participate in the monitoring of the standard through the Works Council Committee.
Safety, Health and Working environment
The company complies with the Occupational Safety and Health Act 2005 and the health and safety framework is overseen by a full time Safety & Health Officer with the collaboration of an Occupational Health Physician.
Regular risk assessment is performed by the company to improve the working environment.
Speville Secretarial Services LtdSecretary
NON-AUDIT SERVICES RENDERED BY EXTERNAL AUDITORS
Services Amount
Rs’000
Review of quarterly condensed financial statements 108
Total 108
Corporate Governance Report
27MAURITIUS OIL REFINERIES LIMITED ANNUAL REPORT 2017

FONTOLIVA OLIVE OIL
28MAURITIUS OIL REFINERIES LIMITED ANNUAL REPORT 2017

OLIVOR OLIVES
OLIVOR EXTRA VIRGIN OLIVE OIL
EXCELLENCE, CULTURED INTHE HEART OF ANDALUSIA
Situated in the heart of Andalusia, the largest production area of olive oil in the world, Sovena is a specialist in producing olive oil and table olives of
high sensorial characteristics for distribution channels worldwide.
The importance of sourcing is key to Sovena, with eminent control within the most important raw material suppliers for a complete value chain,
which ensures the excellence and competitiveness of products.
Olivor is suitable for all types of seasoning salads and vegetables, ideal for making fish and meat marinades and also suitable for frying
(recommended temperature 180ºc)
29MAURITIUS OIL REFINERIES LIMITED ANNUAL REPORT 2017

Statement of Directors’ Responsibilities
Statement of Compliance
Directors acknowledge their responsibilities for:
(i) adequate accounting records and maintenance of effective internal control systems,(ii) the preparation of financial statements which fairly present the state of affairs of the Company as at the end of the
financial year and the results of its operations and cash flows for that period and which comply with International Financial Reporting Standards (IFRS),
(iii) the selection of appropriate accounting policies supported by reasonable and prudent judgements.
The external auditors are responsible for reporting on whether the financial statements are fairly presented.
The directors report that:
(i) adequate accounting records and an effective system of internal controls and risk management have been maintained,(ii) appropriate accounting policies supported by reasonable and prudent judgements and estimates have been used
consistently,(iii) International Financial Reporting Standards have been adhered to. (iv) the Code of Corporate Governance has been adhered to. Reasons have been provided where there has not been
compliance.
Signed on behalf of the Board of Directors:
M.D.P André Espitalier Noël Akhtar N.Y. DawoodManaging Director Director
(Section 75 (3) of the Financial Reporting Act)
Name of the Public Interest Entity (“the PIE”): Mauritius Oil Refineries LimitedReporting Period: July 1, 2016 to June 30, 2017
We, the Directors of Mauritius Oil Refineries Limited, confirm to the best of our knowledge that the PIE has not complied with sections 2.2.6, 2.8.2 and 2.10.3 of the Code of Corporate Governance (“the Code”). Reasons for non-compliance to these sections of the Code are detailed in the Corporate Governance Report.
G. Allain D. de Spéville Hansraj RuheeChairperson Director
September 27, 2017
30MAURITIUS OIL REFINERIES LIMITED ANNUAL REPORT 2017

Statutory Disclosures
The directors have pleasure in submitting the Annual Report of Mauritius Oil Refineries Limited together with the audited financial statements for the year ended June 30, 2017.
PRINCIPAL ACTIVITIES The activities of the group consist of refining crude edible oil, packing and marketing of the finished products, the marketing of a selected range of quality food products and the manufacture of metal cans and plastic containers.
RESULTS AND DIVIDENDS The Group’s turnover remained stable during the year and the profit after tax decreased mainly due to lower profitability in our subsidiaries and associate.
The Group’s and the Company’s profit for the financial year ended June 30, 2017 amounted to Rs.46,921,000 (2016: Rs.53,047,000) and Rs.43,203,000 (2016: Rs.44,307,000) respectively. Dividends declared during the financial year have been paid as follows: An interim dividend of Re.0.95 per share in December 2016.A final dividend of Re.0.35 per share in June 2017.
LIST OF DIRECTORS AND ALTERNATE DIRECTORS
The directors and alternate directors of the Company and those of its subsidiary companies holding office during the year ended June 30, 2017 are as follows:
(a) Mauritius Oil Refineries Limited
Mr G. Allain D.DE SPEVILLE - Chairman Mr M.D.P.André ESPITALIER NOEL - Managing Director Messrs R.J.Paul CLARENC Akhtar N.Y. DAWOOD Ashraf M.CURRIMJEE Hansraj RUHEE J.H. Maurice DE MARASSE ENOUF Yakub M.K MORIA Jérôme P.E.CLARENC S.Rehaz A SAYED HASSEN Issa Muddine SAYED HASSEN (Alternate to
S.Rehaz.A.SAYED HASSEN)
(b) Proton Limited
Messrs G. Allain D. DE SPEVILLE R.J.Paul CLARENC Issa Muddine SAYED HASSEN
(c) Metal Can Manufacturers Limited Messrs M.D.P. André ESPITALIER NOEL
- Managing Director R.J. Paul CLARENC Issa Muddine SAYED HASSEN Jacques LI WAN PO G. Allain D.DE SPEVILLE G.A. Roland MAUREL
(d) Pharmalab Plastic Supplies Limited
Messrs R.J. Paul CLARENC Hassam M.VAYID M.D.P. André ESPITALIER NOEL Patrick Y.K. PIN HARRY Issa Muddine SAYED HASSEN
(also alternate to Mr. R.J.Paul CLARENC) S. Rehaz A. SAYED HASSEN
(alternate to Issa Muddine SAYED HASSEN)
DIRECTORS’ SERVICE CONTRACTS
Mr M.D.P. André Espitalier Noël, Mr Jerôme Paul Edouard Clarenc and Mr S. Rehaz A. Sayed Hassen have service contracts with the Company without expiry dates.
Mr R.J.Paul Clarenc has a service contract of three years as consultant with the Company which will expire on December 31, 2017.
Except for the above, none of the other directors have unexpired service contracts.
31MAURITIUS OIL REFINERIES LIMITED ANNUAL REPORT 2017

Statutory Disclosures
DIRECTORS
Remuneration and benefits received, or due and receivable from the Company and from its subsidiaries were as follows:
- Directors of Mauritius Oil Refineries Limited From the Company From Subsidiaries
2017 2016 2017 2016Rs’000 Rs’000 Rs’000 Rs’000
(3)Executive Directors (2016:3)- Full-time 10,805 10,482 - - - Part-time - - 579 589 (8)Non-executive Directors (2016:8) 6,385 6,278 469 451
17,190 16,760 1,048 1,040
2017 2016Rs’000 Rs’000
Directors of subsidiary companies(1) Executive (2016: 1)Full-time - - Part-time 41 41
(3) Non-executive (2016: 3) 134 129
CONTRACTS OF SIGNIFICANCE
There was no contract of significance subsisting during the year to which the Company or one of its subsidiaries is a party and in which a director is or was materially interested, either directly or indirectly.
DIRECTORS’ INTERESTS IN SHARES
The interests of the Directors of the Company in the Group as at June 30, 2017 were as follows:
Mauritius Oil Refineries Limited
Metal Can Manufacturers Limited
Number of ordinary shares
Number of ordinary shares
Messrs Direct Indirect Direct Indirectinterests interests interests interests
Yakub M.K MORIA 444,444 - 1,207 -G. Allain D. DE SPEVILLE - Chairman 310,000 6,666 129 -Issa Muddine SAYED HASSEN 104,277 - 782 - R.J.Paul CLARENC 38,400 - 9,087 -Hansraj RUHEE 12,441 34,071 - -Akhtar N.Y. DAWOOD 10,300 - 5,460 -S.Rehaz A SAYED HASSEN 821 34,282 2,015 339 J.H. Maurice DE MARASSE ENOUF - - - -Ashraf M.CURRIMJEE - - - -M.D.P. André ESPITALIER NOEL - MD - - - - Jérôme P.E. CLARENC - - - -
MAJOR SHAREHOLDER
No person has reported any material interest of 5% or more of the equity share capital of the Company except as disclosed on page 18.
32MAURITIUS OIL REFINERIES LIMITED ANNUAL REPORT 2017
Statutory Disclosures
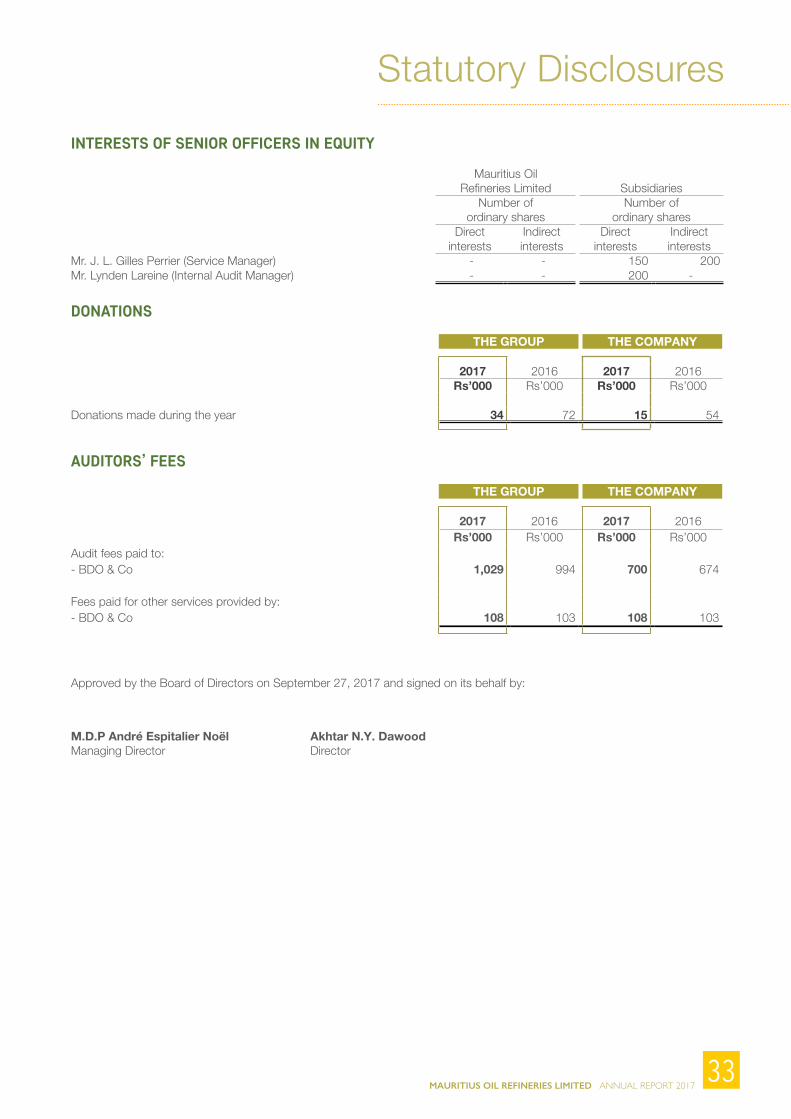
INTERESTS OF SENIOR OFFICERS IN EQUITY
Mauritius Oil Refineries Limited Subsidiaries
Number of ordinary shares
Number of ordinary shares
Direct Indirect Direct Indirectinterests interests interests interests
Mr. J. L. Gilles Perrier (Service Manager) - - 150 200 Mr. Lynden Lareine (Internal Audit Manager) - - 200 -
DONATIONS
THE GROUP THE COMPANY
2017 2016 2017 2016Rs’000 Rs’000 Rs’000 Rs’000
Donations made during the year 34 72 15 54
AUDITORS’ FEES
THE GROUP THE COMPANY
2017 2016 2017 2016Rs’000 Rs’000 Rs’000 Rs’000
Audit fees paid to:- BDO & Co 1,029 994 700 674
Fees paid for other services provided by:- BDO & Co 108 103 108 103
Approved by the Board of Directors on September 27, 2017 and signed on its behalf by:
M.D.P André Espitalier Noël Akhtar N.Y. DawoodManaging Director Director
33MAURITIUS OIL REFINERIES LIMITED ANNUAL REPORT 2017
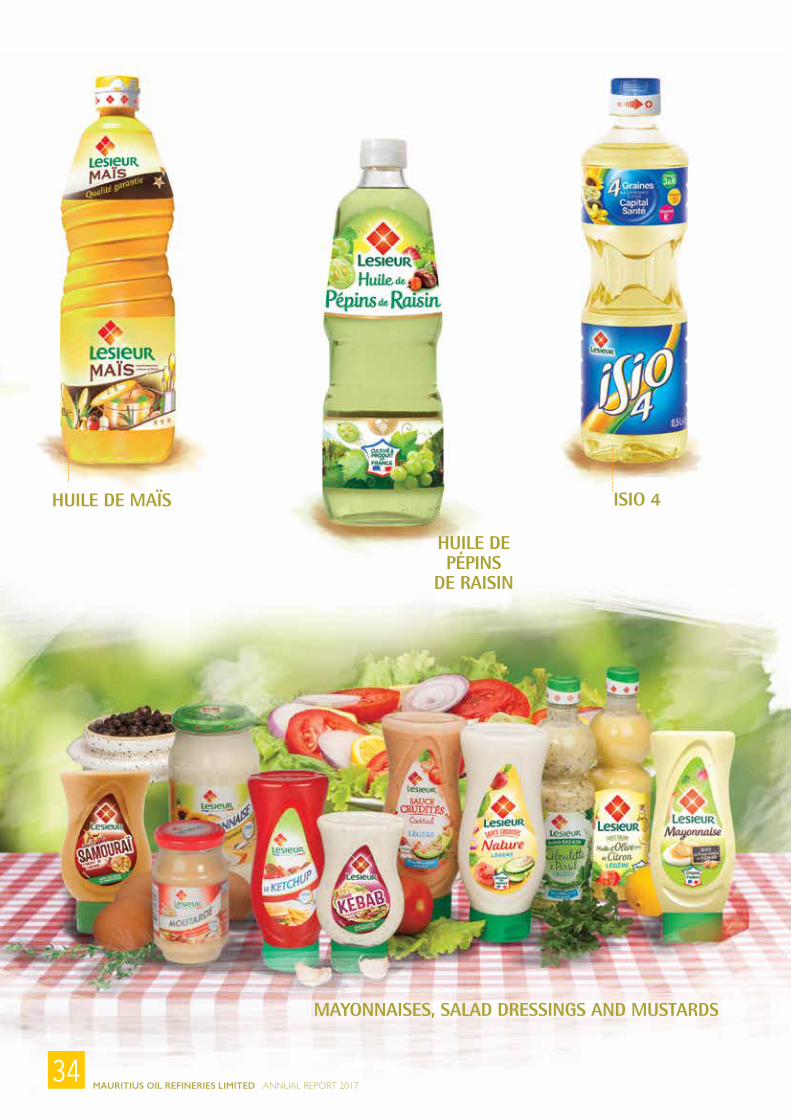
HUILE DE MAÏS
HUILE DE PÉPINS
DE RAISIN
ISIO 4
MAYONNAISES, SALAD DRESSINGS AND MUSTARDS
34MAURITIUS OIL REFINERIES LIMITED ANNUAL REPORT 2017

FLEUR DE COLZA OLIVE OIL
SESAME OIL
HUILE DE TOURNESOL
PAS D’ERREUR, C’EST LESIEUR!
Lesieur is an innovative expert on the edible french oil & dressings sector since 1908 and is committed to offering high-quality, natural oils. Lesieur’s finished products are guaranteed of any defects by a
strict regularly controlled quality and traceability policy from receipt of raw materials to release of finished products. All Lesieur refining
and packaging sites have been awarded international ISO 9001 2000 and International Food Standard (IFS) certification.
Lesieur offers a range of innovative products developed according to several themes: taste, quality, nutrition and environmental protection.
Lesieur mayonnaise is one of the most famous sauces in the French cuisine. Its creamy and tasty, texture comes from
the emulsion of oil and egg yolk.
35MAURITIUS OIL REFINERIES LIMITED ANNUAL REPORT 2017

Secretary’s Certificate
We certify that, to the best of our knowledge and belief, the Company has filed with the Registrar of Companies all such returns as are required of the Company under the Companies Act 2001. SPEVILLE SECRETARIAL SERVICES LTD Secretary September 27, 2017
36MAURITIUS OIL REFINERIES LIMITED ANNUAL REPORT 2017

Independent Auditors’ Report
This report is made solely to the members of Mauritius Oil Refineries Limited (the “Company”), as a body, in accordance with Section 205 of the Companies Act 2001. Our audit work has been undertaken so that we might state to the Company’s members those matters we are required to state to them in an auditor’s report and for no other purpose. To the fullest extent permitted by law, we do not accept or assume responsibility to anyone other than the Company and the Company’s members as a body, for our audit work, for this report, or for the opinions we have formed.
Report on the audit of the Financial Statements
Opinion
We have audited the consolidated financial statements of Mauritius Oil Refineries Limited and its subsidiaries (the Group), and the Company’s separate financial statements on pages 40 to 93 which comprise the statements of financial position as at June 30, 2017, and the statements of profit or loss and other comprehensive income, statements of changes in equity and statements of cash flows for the year then ended, and notes to the financial statements, including a summary of significant accounting policies.
In our opinion, the financial statements on pages 40 to 93 give a true and fair view of the financial position of the Group and of the Company as at June 30, 2017, and of their financial performance and their cash flows for the year then ended in accordance with International Financial Reporting Standards and comply with the Companies Act 2001.
Basis for Opinion
We conducted our audit in accordance with International Standards on Auditing (ISAs). Our responsibilities under those standards are further described in the Auditor’s Responsibilities for the Audit of the Financial Statements section of our report. We are independent of the Group and of the Company in accordance with the International Ethics Standards Board for Accountants’ Code of Ethics for Professional Accountants (IESBA Code) together with the ethical requirements that are relevant to our audit of the financial statements in Mauritius, and we have fulfilled our other ethical responsibilities in accordance with these requirements and the IESBA Code. We believe that the audit evidence we have obtained is sufficient and appropriate to provide a basis for our opinion.
Key Audit Matters
Key audit matters are those matters that, in our professional judgment, were of most significance in our audit of the financial statements of the current period. These matters were addressed in the context of our audit of the financial statements as a whole, and in forming our opinion thereon, and we do not provide a separate opinion on these matters.
1 Assessment of net realisable value of inventories
Key Audit Matter Inventory is carried in the financial statements at the lower of cost and net realisable value. The net carrying amount
of inventory at June 30, 2017 was Rs.130,630,414 for the Group and Rs.103,974,087 for the Company. The exercise for the assessment of the net realisable value involves the use of judgement and assumptions, in view of the significance of the value of inventory on the statement of financial position, we considered inventory to be a significant key audit matter.
Related DisclosuresRefer to note 13 of the accompanying financial statements.
Audit Response Our audit procedures were designed to challenge the basis used for assessing the net realisable value of inventory and included: Examining the trading patterns of inventory sold at full price and together with the margins achieved for each product line in order to gain comfort that stock has not been sold below cost.
2 Recoverability of trade debtors
Key Audit MatterThe recoverability of trade debtors amounting to Rs.254,947,933 for the Group and Rs.230,250,112 for the Company is considered to be a significant key audit matter due to the pervasive nature of these balances to the financial statements, and the importance of cash collection with reference to the working capital management.
Related DisclosuresRefer to note 14 of the accompanying financial statements.
Audit ResponseWe have: - assessed the design and implementation of key controls
around the monitoring of recoverability;- challenged management regarding the level and ageing
of trade receivables, along with the consistency and appropriateness of receivables provisioning by assessing recoverability with reference to cash received in respect of debtors.
- tested these balances on a sample basis through agreement to post period end invoicing and cash receipt; and
- considered the consistency of judgements regarding the recoverability of trade receivables made year on year to consider whether there is evidence of management bias through discussion with management on their rationale and obtaining evidence to support judgement areas.
3 Recognition of revenue
Key Audit MatterRevenue represents an amount of Rs.1,240,437,413 for the Group and Rs.1,118,089,556 for the Company consisting of a high volume of individually low value transactions. Revenue is an important measure used to evaluate the performance of the company. There is a risk that the revenue is presented for amounts higher than what has been actually generated by the company. Revenue is accounted for when the sales transactions have been completed, when goods are delivered to the customer and all economic risks have been transferred as a result. Based on the potential effects of inaccurate revenue transactions on margin, we have concluded that the accuracy of revenue is a key audit matter to be addressed in our audit.
To the Shareholders of Mauritius Oil Refineries Limited
37MAURITIUS OIL REFINERIES LIMITED ANNUAL REPORT 2017

Audit Response
Our audit procedures include testing of design, existence and operating effectiveness of internal control procedures implemented as well as test of details to ensure accurate processing of revenue transactions. We subsequently applied a combination of substantive analytical review procedures and tests of detail to obtain assurance over the validity and completeness. Furthermore, we have performed analytical procedures on gross-margin, as well as cut off procedures.
4 Property, plant and equipment
Key Audit MatterThis area was important to our audit due to the size of the production asset carrying value (35% of total assets as at June 30, 2017). Buidlings have been revalued by an external valuer as disclosed in note 5(e).
Related DisclosuresRefer to note 5 of the accompanying financial statements.
Audit Response Our audit procedures included, amongst others, assessing the reasonableness of the accounting policies and estimates regarding the depreciation of property, plant and equipment. We have reviewed the valuation report issued by the independent external valuers on June 30, 2017 and also considered the independence, reputation and capabilities of the external valuer.
Other information
The Directors are responsible for the other information. The other information which we obtained prior to the date of this auditor’s report comprises of the Corporate Governance Report, Statement of Directors’ Responsibilities and the Secretary’s certificate (but does not include the financial statements and our auditor’s report thereon).
Other information also comprise of the reports listed below,which is expected to be made available to us after the date of this auditor’s report:
- Chairman’s Report;
Our opinion on the financial statements does not cover the other information and we do not express any form of assurance conclusion thereon.
In connection with our audit of the financial statements, our responsibility is to read the other information and, in doing so, consider whether the other information is materially inconsistent with the financial statements or our knowledge obtained in the audit or otherwise appears to be materially misstated. If, based on the work we have performed, we conclude that there is a material misstatement of this other information, we are required to report that fact. We have nothing to report in this regard.
If, based on the work we have performed on the other information that we obtained prior to the date of this auditor’s report, we conclude that there is a material
misstatement of this other information, we are required to report that fact. We have nothing to report in this regard.
When we read the other information, which will be made available to us after the date of our auditors’ report, if we conclude that there is a material misstatement therein, we are required to communicate the matter to those charged with governance.
Responsibilities of Directors and Those Charged with Governance for the Financial Statements
The directors are responsible for the preparation and fair presentation of the financial statements in accordance with International Financial Reporting Standards and in compliance with the requirements of the Companies Act 2001, and for such internal control as the directors determine is necessary to enable the preparation of the financial statements that are free from material misstatement, whether due to fraud or error.
In preparing the financial statements, the directors are responsible for assessing the Group and the Company’s ability to continue as a going concern, disclosing, as applicable, matters related to going concern and using the going concern basis of accounting unless the directors either intend to liquidate the Group and the Company or to cease operations, or have no realistic alternative but to do so.
Those charged with governance are responsible for overseeing the Group and the Company’s financial reporting process.
Auditor’s Responsibilities for the Audit of the Financial Statements Our objectives are to obtain reasonable assurance about whether the financial statements as a whole are free from material misstatement, whether due to fraud or error, and to issue an auditor’s report that includes our opinion. Reasonable assurance is a high level of assurance, but is not a guarantee that an audit conducted in accordance with ISAs will always detect a material misstatement when it exists. Misstatements can arise from fraud or error and are considered material if, individually or in the aggregate, they could reasonably be expected to influence the economic decisions of users taken on the basis of these financial statements. As part of an audit in accordance with ISAs, we exercise professional judgment and maintain professional skepticism throughout the audit. We also: · Identify and assess the risks of material misstatement of
the financial statements, whether due to fraud or error, design and perform audit procedures responsive to those risks, and obtain audit evidence that is sufficient and appropriate to provide a basis for our opinion. The risk of not detecting a material misstatement resulting from fraud is higher than for one resulting from error, as fraud may involve collusion, forgery, intentional omissions, misrepresentations, or the override of internal control.
· Obtain an understanding of internal control relevant to the audit in order to design audit procedures that are appropriate in the circumstances, but not for the purpose of expressing an opinion on the effectiveness of the Group and the Company’s internal control.
Independent Auditors’ Report
38MAURITIUS OIL REFINERIES LIMITED ANNUAL REPORT 2017

· Evaluate the appropriateness of accounting policies used and the reasonableness of accounting estimates and related disclosures made by directors.
· Conclude on the appropriateness of directors’ use of the going concern basis of accounting and, based on the audit evidence obtained, whether a material uncertainty exists related to events or conditions that may cast significant doubt on the Group and the Company’s ability to continue as a going concern. If we conclude that a material uncertainty exists, we are required to draw attention in our auditor’s report to the related disclosures in the financial statements or, if such disclosures are inadequate, to modify our opinion. Our conclusions are based on the audit evidence obtained up to the date of our auditor’s report. However, future events or conditions may cause the Group and the Company to cease to continue as a going concern.
· Evaluate the overall presentation, structure and content of the financial statements, including the disclosures, and whether the financial statements represent the underlying transactions and events in a manner that achieves fair presentation.
· Obtain sufficient appropriate audit evidence regarding the financial information of the entities or business activities within the Group to express an opinion on the consolidated financial statements. We are responsible for the direction, supervision and performance of the group audit. We remain solely responsible for our audit opinion.
We communicate with those charged with governance regarding, among other matters, the planned scope and timing of the audit and significant audit findings, including any significant deficiencies in internal control that we identify during our audit. We also provide those charged with governance with a statement that we have complied with relevant ethical requirements regarding independence, and to communicate with them all relationships and other matters that may reasonably be thought to bear on our independence, and where applicable, related safeguards.
From the matters communicated with those charged with governance, we determine those matters that were of most significance in the audit of the financial statements of the current period and are therefore the key audit matters. We describe these matters in our auditor’s report unless law or regulation precludes public disclosure about the matter or when, in extremely rare circumstances, we determine that a matter should not be communicated in our report because the adverse consequences of doing so would reasonably be expected to outweigh the public interest benefits of such communication.
Report on Other Legal and Regulatory Requirements Companies Act 2001 We have no relationship with, or interests in, the Company or any of its subsidiaries, other than in our capacity as auditors, business advisers and dealings in the ordinary course of business. We have obtained all information and explanations we have required. In our opinion, proper accounting records have been kept by the Company as far as it appears from our examination of those records. Financial Reporting Act 2004 The Directors are responsible for preparing the corporate governance report. Our responsibility is to report the extent of compliance with the Code of Corporate Governance as disclosed in the annual report and on whether the disclosure is consistent with the requirements of the Code. In our opinion, the disclosure in the annual report is consistent with the requirements of the Code.
Port Louis, BDO & CoMauritius. Chartered AccountantsSeptember 27, 2017 Rookaya Ghanty, FCA Licensed by FRC
Independent Auditors’ Report
39MAURITIUS OIL REFINERIES LIMITED ANNUAL REPORT 2017
MAURITIUS OIL REFINERIES LIMITED ANNUAL REPORT 201740
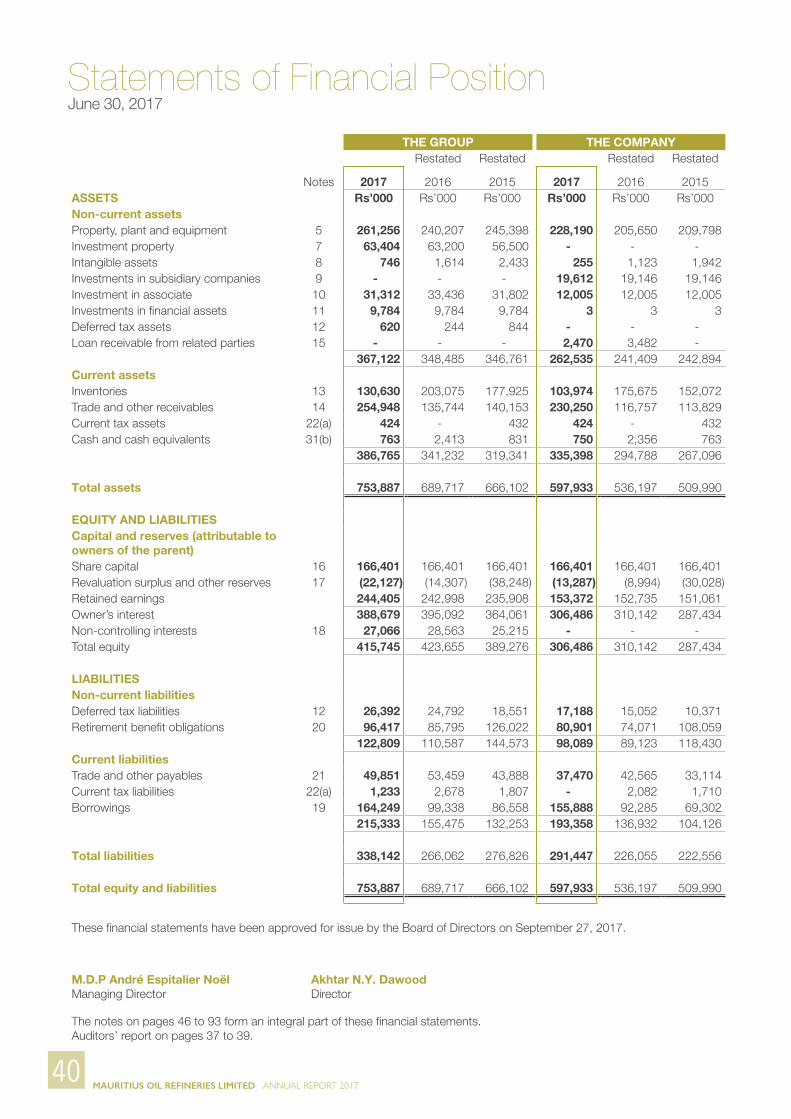
Statements of Financial PositionJune 30, 2017
THE GROUP THE COMPANYRestated Restated Restated Restated
Notes 2017 2016 2015 2017 2016 2015ASSETS Rs’000 Rs’000 Rs’000 Rs’000 Rs’000 Rs’000Non-current assetsProperty, plant and equipment 5 261,256 240,207 245,398 228,190 205,650 209,798 Investment property 7 63,404 63,200 56,500 - - - Intangible assets 8 746 1,614 2,433 255 1,123 1,942 Investments in subsidiary companies 9 - - - 19,612 19,146 19,146 Investment in associate 10 31,312 33,436 31,802 12,005 12,005 12,005 Investments in financial assets 11 9,784 9,784 9,784 3 3 3 Deferred tax assets 12 620 244 844 - - - Loan receivable from related parties 15 - - - 2,470 3,482 -
367,122 348,485 346,761 262,535 241,409 242,894 Current assetsInventories 13 130,630 203,075 177,925 103,974 175,675 152,072 Trade and other receivables 14 254,948 135,744 140,153 230,250 116,757 113,829 Current tax assets 22(a) 424 - 432 424 - 432 Cash and cash equivalents 31(b) 763 2,413 831 750 2,356 763
386,765 341,232 319,341 335,398 294,788 267,096
Total assets 753,887 689,717 666,102 597,933 536,197 509,990
EQUITY AND LIABILITIESCapital and reserves (attributable to owners of the parent)Share capital 16 166,401 166,401 166,401 166,401 166,401 166,401 Revaluation surplus and other reserves 17 (22,127) (14,307) (38,248) (13,287) (8,994) (30,028)Retained earnings 244,405 242,998 235,908 153,372 152,735 151,061 Owner’s interest 388,679 395,092 364,061 306,486 310,142 287,434 Non-controlling interests 18 27,066 28,563 25,215 - - - Total equity 415,745 423,655 389,276 306,486 310,142 287,434
LIABILITIESNon-current liabilitiesDeferred tax liabilities 12 26,392 24,792 18,551 17,188 15,052 10,371 Retirement benefit obligations 20 96,417 85,795 126,022 80,901 74,071 108,059
122,809 110,587 144,573 98,089 89,123 118,430 Current liabilitiesTrade and other payables 21 49,851 53,459 43,888 37,470 42,565 33,114 Current tax liabilities 22(a) 1,233 2,678 1,807 - 2,082 1,710 Borrowings 19 164,249 99,338 86,558 155,888 92,285 69,302
215,333 155,475 132,253 193,358 136,932 104,126
Total liabilities 338,142 266,062 276,826 291,447 226,055 222,556
Total equity and liabilities 753,887 689,717 666,102 597,933 536,197 509,990
These financial statements have been approved for issue by the Board of Directors on September 27, 2017.
M.D.P André Espitalier Noël Akhtar N.Y. DawoodManaging Director Director
The notes on pages 46 to 93 form an integral part of these financial statements.Auditors’ report on pages 37 to 39.

MAURITIUS OIL REFINERIES LIMITED ANNUAL REPORT 201741
Statements of Profit or LossYear Ended June 30, 2017
THE GROUP THE COMPANYRestated Restated
Notes 2017 2016 2017 2016Rs’000 Rs’000 Rs’000 Rs’000
Revenue 23 1,240,437 1,244,540 1,118,090 1,116,166
Cost of operations 24 (1,071,648) (1,071,457) (971,628) (966,826)
Gross profit 168,789 173,083 146,462 149,340
Other operating income 3,268 3,142 3,359 3,077
Distribution costs 24 (31,031) (28,757) (31,031) (28,757)
Administrative expenses 24 (83,113) (87,005) (70,997) (75,359)
57,913 60,463 47,793 48,301
Fair value gain on investment properties 7 - 1,953 - -
Gain on bargain purchase 96 - - -
Investment and other income 26 - - 5,693 6,158
Net finance costs 27 (3,453) (3,691) (2,956) (3,287)
54,556 58,725 50,530 51,172
Share of profit of associate 10(a) 1,060 3,311 - -
Profit before taxation 55,616 62,036 50,530 51,172
Income tax 22(b) (8,695) (8,989) (7,327) (6,865)
Profit for the year 28 46,921 53,047 43,203 44,307
Profit attributable to:Owners of the parent 43,973 49,723 43,203 44,307 Non-controlling interests 2,948 3,324 - -
46,921 53,047 43,203 44,307
Earnings per share (Rs) 29 1.32 1.49 1.30 1.33
The notes on pages 46 to 93 form an integral part of these financial statements.Auditors’ report on pages 37 to 39.

MAURITIUS OIL REFINERIES LIMITED ANNUAL REPORT 201742
Statements of Profit or Loss andOther Comprehensive IncomeYear Ended June 30, 2017
THE GROUP THE COMPANYRestated Restated
Notes 2017 2016 2017 2016Rs’000 Rs’000 Rs’000 Rs’000
Profit for the year 46,921 53,047 43,203 44,307
Other comprehensive income for the year:
Items that will not be reclassified to profit or loss:
Gain on property revaluation 20,276 - 20,276 -
Remeasurement of defined benefit obligations 20 (30,027) 29,924 (25,327) 24,746
Income tax relating to components of
other comprehensive income 12(c) 1,463 (4,489) 758 (3,712)
Share of other comprehensive income
of associate 10(a) (1,409) 582 - -
Other comprehensive income for the year (9,697) 26,017 (4,293) 21,034
Total comprehensive income for the year 37,224 79,064 38,910 65,341
Total comprehensive income attributable to:
Owners of the parent 36,153 73,664 38,910 65,341
Non-controlling interests 18 1,071 5,400 - -
37,224 79,064 38,910 65,341
The notes on pages 46 to 93 form an integral part of these financial statements.Auditors’ report on pages 37 to 39.

MAURITIUS OIL REFINERIES LIMITED ANNUAL REPORT 201743
Statements of Changes in EquityYear Ended June 30, 2017
Attributable to owners of the parent
Share Revaluation Actuarial gains/
Available-for- sale fair value Retained
Non- controlling Total
Notes capital surplus (losses) reserve earnings Total interests equityTHE GROUP Rs’000 Rs’000 Rs’000 Rs’000 Rs’000 Rs’000 Rs’000 Rs’000Balance at July 1, 2016- as previously stated 166,401 69,208 (86,247) 3,126 249,929 402,417 28,563 430,980 - Prior year adjustment (note 32) - - (394) - (6,931) (7,325) - (7,325)- as restated 166,401 69,208 (86,641) 3,126 242,998 395,092 28,563 423,655
Profit for the year - - - - 43,973 43,973 2,948 46,921 Other comprehensive income for the year - 17,235 (25,055) - - (7,820) (1,877) (9,697)Total comprehensive income for the year - 17,235 (25,055) - 43,973 36,153 1,071 37,224
Dividends 30 - - - - (43,264) (43,264) - (43,264)Dividends written back - - - - 698 698 - 698 Dividends paid to non-controlling interests - - - - - - (2,006) (2,006)Changes in ownership interest in subsidiary - - - - - - (562) (562)
Balance at June 30, 2017 166,401 86,443 (111,696) 3,126 244,405 388,679 27,066 415,745
Balance at July 1, 2015- as previously stated 166,401 69,208 (108,618) 3,126 241,756 371,873 25,215 397,088 - Prior year adjustment (note 32) - - (1,964) - (5,848) (7,812) - (7,812)- as restated 166,401 69,208 (110,582) 3,126 235,908 364,061 25,215 389,276
Profit for the year (restated) - - - - 49,723 49,723 3,324 53,047 Other comprehensive income for the year (restated) - - 23,941 - - 23,941 2,076 26,017 Total comprehensive income for the year - - 23,941 - 49,723 73,664 5,400 79,064
Dividends 30 - - - - (43,264) (43,264) - (43,264)Dividends written back - - - - 631 631 - 631 Dividends paid to non-controlling interests - - - - - - (2,052) (2,052)Balance at June 30, 2016 166,401 69,208 (86,641) 3,126 242,998 395,092 28,563 423,655
The notes on pages 46 to 93 form an integral part of these financial statements.Auditors’ report on pages 37 to 39.

MAURITIUS OIL REFINERIES LIMITED ANNUAL REPORT 201744
Statements of Changes in EquityYear Ended June 30, 2017
Share Revaluation Actuarial gains/ Retained
Notes capital surplus (losses) earnings TotalTHE COMPANY Rs’000 Rs’000 Rs’000 Rs’000 Rs’000
Balance at July 1, 2016- as previously stated 166,401 66,127 (74,728) 159,666 317,466 - Prior year adjustment (note 32) - - (393) (6,931) (7,324)- as restated 166,401 66,127 (75,121) 152,735 310,142
Profit for the year - - - 43,203 43,203 Other comprehensive income for the year - 17,234 (21,527) - (4,293)Total comprehensive income for the year - 17,234 (21,527) 43,203 38,910
Dividends 30 - - - (43,264) (43,264)Dividends written back - - - 698 698
Balance at June 30, 2017 166,401 83,361 (96,648) 153,372 306,486
Balance at July 1, 2015- as previously stated 166,401 66,127 (94,191) 156,909 295,246 - Prior year adjustment (note 32) - - (1,964) (5,848) (7,812)- as restated 166,401 66,127 (96,155) 151,061 287,434
Profit for the year (restated) - - - 44,307 44,307 Other comprehensive income for the year (restated)
- - 21,034 - 21,034
Total comprehensive income for the year - - 21,034 44,307 65,341
Dividends 30 - - - (43,264) (43,264)Dividends written back - - - 631 631 Balance at June 30, 2016 166,401 66,127 (75,121) 152,735 310,142
The notes on pages 46 to 93 form an integral part of these financial statements.Auditors’ report on pages 37 to 39.
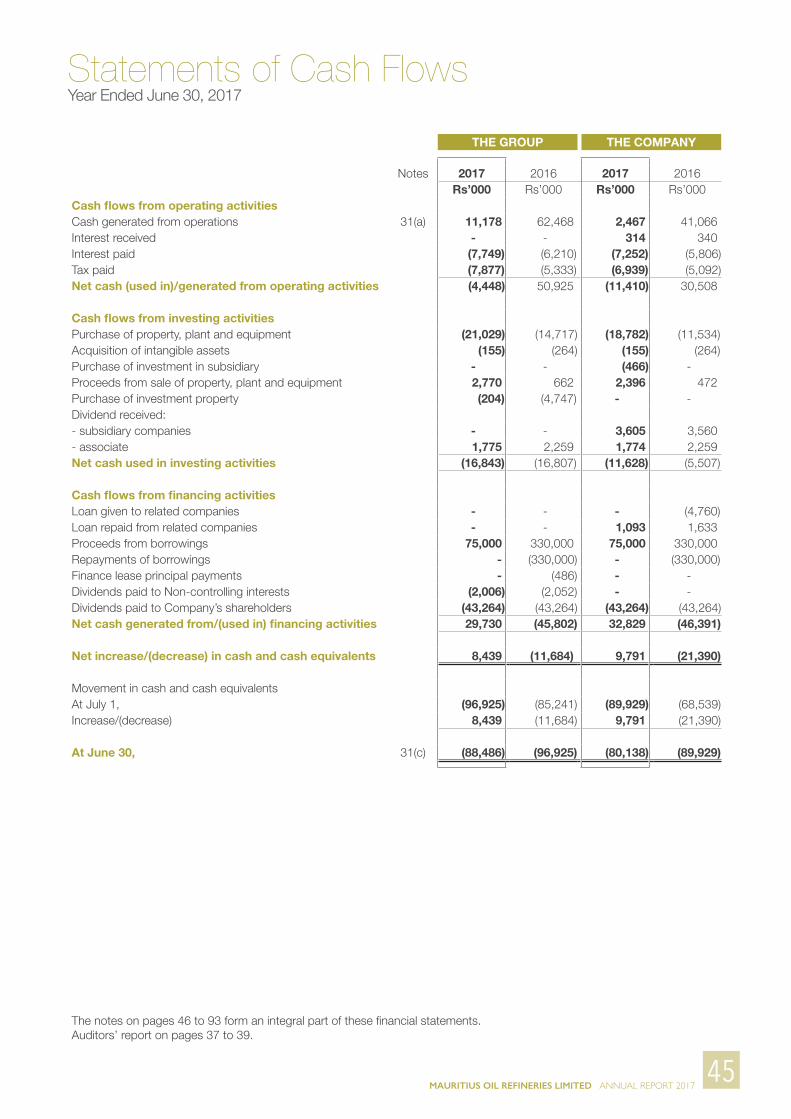
MAURITIUS OIL REFINERIES LIMITED ANNUAL REPORT 201745
Statements of Cash FlowsYear Ended June 30, 2017
THE GROUP THE COMPANY
Notes 2017 2016 2017 2016Rs’000 Rs’000 Rs’000 Rs’000
Cash flows from operating activitiesCash generated from operations 31(a) 11,178 62,468 2,467 41,066 Interest received - - 314 340 Interest paid (7,749) (6,210) (7,252) (5,806)Tax paid (7,877) (5,333) (6,939) (5,092)Net cash (used in)/generated from operating activities (4,448) 50,925 (11,410) 30,508
Cash flows from investing activitiesPurchase of property, plant and equipment (21,029) (14,717) (18,782) (11,534)Acquisition of intangible assets (155) (264) (155) (264)Purchase of investment in subsidiary - - (466) - Proceeds from sale of property, plant and equipment 2,770 662 2,396 472 Purchase of investment property (204) (4,747) - - Dividend received:- subsidiary companies - - 3,605 3,560 - associate 1,775 2,259 1,774 2,259 Net cash used in investing activities (16,843) (16,807) (11,628) (5,507)
Cash flows from financing activitiesLoan given to related companies - - - (4,760)Loan repaid from related companies - - 1,093 1,633 Proceeds from borrowings 75,000 330,000 75,000 330,000 Repayments of borrowings - (330,000) - (330,000)Finance lease principal payments - (486) - - Dividends paid to Non-controlling interests (2,006) (2,052) - - Dividends paid to Company’s shareholders (43,264) (43,264) (43,264) (43,264)Net cash generated from/(used in) financing activities 29,730 (45,802) 32,829 (46,391)
Net increase/(decrease) in cash and cash equivalents 8,439 (11,684) 9,791 (21,390)
Movement in cash and cash equivalentsAt July 1, (96,925) (85,241) (89,929) (68,539)Increase/(decrease) 8,439 (11,684) 9,791 (21,390)
At June 30, 31(c) (88,486) (96,925) (80,138) (89,929)
The notes on pages 46 to 93 form an integral part of these financial statements.Auditors’ report on pages 37 to 39.

MAURITIUS OIL REFINERIES LIMITED ANNUAL REPORT 2017
Notes to the Financial StatementsYear Ended June 30, 2017
46
1. GENERAL INFORMATION
Mauritius Oil Refineries Limited is a public company incorporated and domiciled in Mauritius. The address of its registered office is Quay D, Port Louis.
These financial statements will be submitted for consideration and approval at the forthcoming Annual Meeting of Shareholders of the company.
2. SIGNIFICANT ACCOUNTING POLICIES
The principal accounting policies adopted in the preparation of these financial statements are set out below. These policies have been consistently applied to all the years presented, unless otherwise stated.
(a) Basis of preparation
The financial statements of Mauritius Oil Refineries Limited comply with the Companies Act 2001 and have been prepared in accordance with International Financial Reporting Standards (IFRS). Where necessary comparative figures have been amended to conform with change in presentation in the current year.
The financial statements are prepared under the historical cost convention, except that: (i) freehold building and plant and machinery are carried at revalued amounts; (ii) investment property is stated at fair value; (iii) available-for-sale financial assets are stated at their fair values; and (iv) relevant financial assets and financial liabilities are carried at amortised cost/fair value.
Standards, Amendments to published Standards and Interpretations effective in the reporting period
IFRS 14 Regulatory Deferral Accounts provides relief for first-adopters of IFRS in relation to accounting for certain balances that arise from rate-regulated activities (‘regulatory deferral accounts’). IFRS 14 permits these entities to apply their previous accounting policies for the recognition, measurement, impairment and derecognition of regulatory deferral accounts. The standard is not expected to have any impact on the Group’s financial statements.
Accounting for Acquisitions of Interests in Joint Operations (Amendments to IFRS 11). The amendments clarify the accounting for the acquisition of an interest in a joint operation where the activities of the operation constitute a business. They require an investor to apply the principles of business combination accounting when it acquires an interest in a joint operation that constitutes a business. Existing interests in the joint operation are not remeasured on acquisition of an additional interest, provided joint control is maintained. The amendments also apply when a joint operation is formed and an existing business is contributed. The amendment has no impact on the Group’s financial statements.
Clarification of Acceptable Methods of Depreciation and Amortisation (Amendments to IAS 16 and IAS 38). The amendments clarify that a revenue-based method of depreciation or amortisation is generally not appropriate.
Amendments clarify that a revenue-based method should not be used to calculate the depreciation of items of property, plant and equipment. IAS 38 now includes a rebuttable presumption that the amortisation of intangible assets based on revenue is inappropriate. This presumption can be overcome under specific conditions. The amendment has no impact on the Group’s financial statements.
Equity method in separate financial statements (Amendments to IAS 27). The amendments allow entities to use the equity method in their separate financial statements to measure investments in subsidiaries, joint ventures and associates. IAS 27 currently allows entities to measure their investments in subsidiaries, joint ventures and associates either at cost or at fair value in their separate financial statements. The amendments introduce the equity method as a third option. The election can be made independently for each category of investment (subsidiaries, joint ventures and associates). Entities wishing to change to the equity method must do so retrospectively. The amendment has no impact on the Group’s financial statements.
Agriculture: Bearer Plants (Amendments to IAS 16 and IAS 41). IAS 41 now distinguishes between bearer plants and other biological asset. Bearer plants must be accounted for as property plant and equipment and measured either at cost or revalued amounts, less accumulated depreciation and impairment losses. The amendment has no impact on the Group’s financial statements.
Annual Improvements to IFRSs 2012-2014 cycle
• IFRS 5 is amended to clarify that when an asset (or disposal group) is reclassified from ‘held for sale’ to ‘held for distribution’ or vice versa, this does not constitute a change to a plan of sale or distribution and does not have to be accounted for as such. The amendment has no impact on the Group’s financial statements.
MAURITIUS OIL REFINERIES LIMITED ANNUAL REPORT 2017
Notes to the Financial StatementsYear Ended June 30, 2017
47
• IFRS 7 amendment provides specific guidance for transferred financial assets to help management determine whether the terms of a servicing arrangement constitute ‘continuing involvement’ and, therefore, whether the asset qualifies for derecognition. The amendment has no impact on the Group’s financial statements.
• IFRS 7 is amended to clarify that the additional disclosures relating to the offsetting of financial assets and financial liabilities only need to be included in interim reports if required by IAS 34. The amendment has no impact on the Group’s financial statements.
• IAS 19 amendment clarifies that when determining the discount rate for post-employment benefit obligations, it is the currency that the liabilities are denominated in that is important and not the country where they arise.
The amendment has no impact on the Group’s financial statements.
• IAS 34 amendment clarifies what is meant by the reference in the standard to ‘information disclosed elsewhere in the interim financial report’ and adds a requirement to cross-reference from the interim financial statements to the location of that information. The amendment has no impact on the Group’s financial statements.
Disclosure Initiative (Amendments to IAS 1). The amendments to IAS 1 provide clarifications on a number of issues. An entity should not aggregate or disaggregate information in a manner that obscures useful information.
Where items are material, sufficient information must be provided to explain the impact on the financial position or performance. Line items specified in IAS 1 may need to be disaggregated where this is relevant to an understanding of the entity’s financial position or performance. There is also new guidance on the use of subtotals. Confirmation that the notes do not need to be presented in a particular order. The share of OCI arising from equity-accounted investments is grouped based on whether the items will or will not subsequently be reclassified to profit or loss. Each group should then be presented as a single line item in the statement of other comprehensive income.
Investment entities: Applying the consolidation exception (Amendments to IFRS 10, IFRS 12 and IAS 28). The amendments clarify that the exception from preparing consolidated financial statements is also available to intermediate parent entities which are subsidiaries of investment entities. An investment entity should consolidate a subsidiary which is not an investment entity and whose main purpose and activity is to provide services in support of the investment entity’s investment activities. Entities which are not investment entities but have an interest in an associate or joint venture which is an investment entity have a policy choice when applying the equity method of accounting. The fair value measurement applied by the investment entity associate or joint venture can either be retained, or a consolidation may be performed at the level of the associate or joint venture, which would then unwind the fair value measurement. The amendment has no impact on the Group’s financial statements.
Standards, Amendments to published Standards and Interpretations issued but not yet effective
Certain standards, amendments to published standards and interpretations have been issued that are mandatory for accounting periods beginning on or after January 1, 2017 or later periods, but which the Group has not early adopted.
At the reporting date of these financial statements, the following were in issue but not yet effective:
IFRS 9 Financial Instruments IFRS 15 Revenue from Contract with Customers Sale or Contribution of Assets between an Investor and its Associate or Joint Venture (Amendments to IFRS 10 and IAS 28) IFRS 16 Leases Recognition of Deferred Tax Assets for Unrealised Losses (Amendments to IAS 12) Amendments to IAS 7 Statement of Cash Flows Clarifications to IFRS 15 Revenue from Contracts with Customers Classification and Measurement of Share-based Payment Transactions (Amendments to IFRS 2) Applying IFRS 9 Financial Instruments with IFRS 4 Insurance Contracts (Amendments to IFRS 4) Annual Improvements to IFRSs 2014-2016 Cycle IFRIC 22 Foreign Currency Transactions and Advance Consideration Transfers of Investment Property (Amendments to IAS 40) IFRS 17 Insurance Contracts IFRIC 23 Uncertainty over Income Tax Treatments
Where relevant, the Group is still evaluating the effect of these Standards, amendments to published Standards and Interpretations issued but not yet effective, on the presentation of its financial statements.
The preparation of financial statements in conformity with IFRS requires the use of certain critical accounting estimates. It also requires management to exercise its judgement in the process of applying the Group’s accounting policies. The areas involving a higher degree of judgement or complexity, or areas where assumptions and estimates are significant to the financial statements, are disclosed in Note 4.
MAURITIUS OIL REFINERIES LIMITED ANNUAL REPORT 2017
Notes to the Financial StatementsYear Ended June 30, 2017
48
(b) Property, plant and equipment
All property, plant and equipment is initially recorded at cost. Freehold buildings, held for use in the production or supply of goods or for administrative purposes, are stated at their fair value, based on periodic valuations by external independent valuers, less subsequent depreciation for buildings. Any accumulated depreciation at the date of revaluation is eliminated against the gross carrying amount of the asset and the net amount is restated to the revalued amount of the asset.
Up to June 30, 2001, plant and machinery was revalued every year by E.T.M Services Ltd on the basis of the depreciated replacement cost of the assets. As from June 30, 2002, the directors decided that plant and machinery would no longer be revalued each year to reflect their replacement value. From thereon, these assets are stated at their revalued amount at June 30, 2001 less subsequent depreciation. Additions subsequent to that date are recognised at cost. Other property, plant and equipment is stated at historical cost less depreciation. Historical cost includes expenditure that is directly attributable to the acquisition of the items.
Subsequent costs are included in the assets’ carrying amount or recognised as a separate asset as appropriate only when it is probable that future economic benefits associated with the item will flow to the Group and the cost of the item can be measured reliably.
Increases in the carrying amount arising on revaluation are credited to other comprehensive income and shown as revaluation surplus in shareholders’ equity. Decreases that offset previous increases of the same asset are charged against the revaluation surplus directly in equity; all other decreases are charged to profit or loss.
Properties in the course of construction for production, rental or administrative purposes or for purposes not yet determined are carried at cost less any recognised impairment loss. Cost includes professional fees and for qualifying assets, borrowing cost capitalised. Depreciation of these assets, on the same basis as other property assets, commences when the assets are ready for their intended use.
Depreciation is calculated on the straight line method to write off the cost or the revalued amounts of the assets, to their residual values over their estimated useful lives.
Freehold land is not depreciated.
The assets’ residual values and useful lives are reviewed and adjusted, if appropriate, at the end of each reporting period.
Where the carrying amount of an asset is greater than its estimated recoverable amount, it is written down immediately to its recoverable amount.
Gains and losses on disposal of property, plant and equipment are determined by comparing proceeds with carrying amount and are included in profit or loss. On disposal of revalued assets, the amounts included in revaluation surplus are transferred to retained earnings.
(c) Investment property
Investment property, held to earn rentals or for capital appreciation or both, is carried at fair value by the Group, representing open-market value determined annually by external independent valuers. Changes in fair values are included in profit or loss.
The annual rates used are as follows:Improvement to land 10%Freehold buildings 2% - 5%Plant & machinery 5% - 20%Yard 10%Furniture and fittings 10% - 20%Tools 10% - 20%Motor vehicles 12.5% - 20%Computer equipment and accessories 20% - 33%
2. SIGNIFICANT ACCOUNTING POLICIES (CONT’D)
Assets for which depreciation is calculated on a reducing balance basis:
Plant & machinery 5% - 20%
Oil storage complex 4%

MAURITIUS OIL REFINERIES LIMITED ANNUAL REPORT 2017
Notes to the Financial StatementsYear Ended June 30, 2017
49
(d) Intangible assets
(i) Goodwill Goodwill represents the excess of cost of acquisition over the Group’s interest in the fair value of the net identifiable
assets of the acquired subsidiary, associate or jointly controlled entity at the date of acquisition. Goodwill on acquisitions of subsidiaries is included in intangible assets. Any net excess of the Group’s interest in the net fair value of acquiree’s net identifiable assets over cost is recognised in the statement of profit or loss.
Goodwill on acquisitions of associates and jointly controlled entities is included in investments in associates.
Goodwill is tested annually for impairment and carried at cost less accumulated impairment losses.
On disposal of a subsidiary, associate or jointly controlled entity, the attributable amount of goodwill is included in the determination of the gains and losses on disposal.
Goodwill is allocated to cash-generating units for the purpose of impairment testing.
(ii) Computer software Acquired computer software licences are capitalised on the basis of costs incurred to acquire and bring to use the
specific software and are amortised using the straight-line method over their estimated useful lives.
The estimated useful life of computer software is 3- 5 years. (e) Investment in subsidiaries
Separate financial statements of the investor In the separate financial statements of the investor, investments in subsidiary companies are carried at cost. The carrying
amount is reduced to recognise any impairment in the value of individual investments.
Consolidated financial statements Subsidiaries are all entities (including structured entities) over which the Group has control. The Group controls an entity
when the Group is exposed to, or has rights to, variable returns from its involvement with the entity and has the ability to affect those returns through its power over the entity.
The acquisition method of accounting is used to account for business combinations by the Group. The consideration transferred for the acquisition of a subsidiary is the fair values of the assets transferred, the liabilities incurred and the equity interests issued by the Group. The consideration transferred includes the fair value of any asset or liability resulting from a contingent consideration arrangement. Acquisition-related costs are expensed as incurred. Identifiable assets acquired and liabilities and contingent liabilities assumed in a business combination are measured initially at their fair values at the acquisition date. On an acquisition-by-acquisition basis, the Group recognises any non-controlling interest in the acquiree at the non-controlling interest’s proportionate share of the acquiree’s net assets.
The excess of the consideration transferred, the amount of any non-controlling interest in the acquiree and the acquisition-date fair value of any previous equity interest in the acquiree over the fair value of the Group’s share of the identifiable net assets acquired is recorded as goodwill. If this is less than the fair value of the net assets of the subsidiary acquired in the case of a bargain purchase, the difference is recognised directly in profit or loss as a bargain purchase gain.
Inter-company transactions, balances and unrealised gains on transactions between group companies are eliminated.Unrealised losses are also eliminated. The subsidiaries have consistently applied all the policies adopted by the Group.
Transactions with non-controlling interests The Group treats transactions with non-controlling interests as transactions with equity owners of the Group. For
purchases from non-controlling interests, the difference between any consideration paid and the relevant share acquired of the carrying value of net assets of the subsidiary is recorded in equity. Gains or losses on disposals to non-controlling interests are also recorded in equity.
Disposal of subsidiaries When the Group ceases to have control, any retained interest in the entity is remeasured to its fair value, with the
change in carrying amount recognised in profit or loss. The fair value is the initial carrying amount for the purposes of subsequently accounting for the retained interest as an associate, joint venture or financial asset. In addition, any amounts previously recognised in other comprehensive income in respect of that entity are accounted for as if the Group had directly disposed of the related assets or liabilities. This may mean that amounts previously recognised in other comprehensive income are reclassified to profit or loss.

MAURITIUS OIL REFINERIES LIMITED ANNUAL REPORT 2017
Notes to the Financial StatementsYear Ended June 30, 2017
50
(f) Investment in associate
Separate financial statements of the investor In the separate financial statements of the investor, investments in associated companies are carried at cost. The carrying
amount is reduced to recognise any impairment in the value of individual investments.
Consolidated financial statements An associate is an entity over which the Group has significant influence but not control, or joint control, generally
accompanying a shareholding between 20% and 50% of the voting rights.
Investment in associate is accounted for using the equity method. The Group’s investment in associate includes goodwill (net of any accumulated impairment loss) identified on acquisition. Investment in associate is initially recognised at cost as adjusted by post acquisition changes in the Group’s share of the net assets of the associate less any impairment in the value of individual investments.
When the Group’s share of losses exceeds its interest in an associate, the Group discontinues recognising further losses, unless it has incurred legal or constructive obligation or made payments on behalf of the associate.
Unrealised profits and losses are eliminated to the extent of the Group’s interest in the associate. Unrealised losses are also eliminated unless the transaction provides evidence of an impairment of the asset transferred.
If the ownership interest in an associate is reduced but significant influence is retained, only a proportionate share of the amounts previously recognised in other comprehensive income is reclassified to profit or loss where appropriate.
The associate has consistently applied all the policies adopted by the Group.
(g) Financial instruments
Financial assets The Group classifies its financial assets as available-for-sale financial assets.
The classification depends on the purpose for which the investments were acquired. Management determines the classification of its investments at initial recognition and re-evaluates this designation at every reporting date.
(i) Available-for-sale financial assets Available for sale financial assets are non-derivatives that are either designated in this category or not classified in
any of the other categories. They are included in non-current assets unless management intends to dispose of the investment within twelve months of the end of the reporting period.
Purchases and sales of financial assets are recognised on trade-date, the date on which the Group commits to purchase or sell the asset. Investments in this category are initially measured at fair value plus transaction costs.
Financial assets are derecognised when the rights to receive cash flows from the investments have expired or have been transferred and the Group has transferred substantially all risks and rewards of ownership.
Available-for-sale financial assets are subsequently carried at fair values.
Investments in equity instruments that do not have a quoted market price in an active market and whose fair value cannot be reliably measured are measured at cost.
Unrealised gains and losses arising from changes in the fair value of financial assets classified as available-for-sale are recognised in other comprehensive income.
When financial assets classified as available-for-sale are sold or impaired, the accumulated fair value adjustments are included in profit or loss as gains and losses on financial assets.
If the market for a financial asset is not active, the company establishes fair value by using valuation techniques. These include the use of recent arm’s length transactions, reference to other instruments that are substantially the same, discounted cash flows analysis.
2. SIGNIFICANT ACCOUNTING POLICIES (CONT’D)
MAURITIUS OIL REFINERIES LIMITED ANNUAL REPORT 2017
Notes to the Financial StatementsYear Ended June 30, 2017
51
(ii) Impairment of financial assets The Group assesses at the end of each reporting period whether there is objective evidence that a financial asset
or a group of financial assets is impaired. In the case of equity investments classified as available-for- sale, a significant or prolonged decline in the fair value of the security below its cost is considered in determining whether the securities are impaired. If any such evidence exists for available-for-sale financial assets, the cumulative loss, measured as the difference between acquisition cost and the current fair value, less any impairment loss on that financial asset previously recognised in profit or loss - is removed from equity and recognised in profit or loss.Impairment losses for a financial asset classified as available-for-sale are not reversed through profit or loss.
(iii) Long term receivables Long term receivables with fixed maturity terms are measured at amortised cost using the effective interest rate
method, less provision for impairment. The carrying amount of the asset is reduced by the difference between the asset’s carrying amount and the present value of estimated cash flows discounted using the original effective interest rate. The amount of loss is recognised in profit or loss.
(iv) Trade receivables Trade receivables are recognised initially at fair value and subsequently measured at amortised cost using
the effective interest method, less provision for impairment. A provision for impairment of trade receivables is established when there is objective evidence that the Group will not be able to collect all amounts due according to the original terms of receivables.
The amount of the provision is the difference between the asset’s carrying amount and the present value of estimated future cash flows discounted at the effective interest rate. The amount of provision is recognised in profit or loss.
(v) Trade and other payables Trade and other payables are stated at fair value and subsequently measured at amortised cost using the effective
interest method.
(vi) Borrowings Borrowings are recognised initially at fair value being their issue proceeds net of transaction costs incurred. Borrowings
are subsequently stated at amortised cost; any difference between the proceeds (net of transaction costs) and the redemption value is recognised in profit or loss over the period of the borrowings using the effective interest method.
Borrowings are classified as current liabilities unless the Group has an unconditional right to defer settlement of the liability for at least twelve months after the end of the reporting period.
(vii) Cash and cash equivalents Cash and cash equivalents include cash in hand and bank overdrafts. Bank overdrafts are shown within borrowings
in current liabilities on the statement of financial position.
(viii) Share capital Ordinary shares are classified as equity.
(h) Current and deferred income tax The tax expense for the period comprises of current and deferred tax. Tax is recognised in profit or loss, except to the
extent that it relates to items recognised in other comprehensive income or directly in equity.
Current tax The current income tax charge is based on taxable income for the year calculated on the basis of tax laws enacted or
substantively enacted by the end of the reporting period.
Deferred tax Deferred income tax is provided in full, using the liability method, on temporary differences arising between the tax bases
of assets and liabilities and their carrying amounts in the financial statements. However, if the deferred income tax arises from initial recognition of an asset or liability in a transaction, other than a business combination, that at the time of the transaction affects neither accounting nor taxable profit or loss, it is not accounted for.
Deferred income tax is determined using tax rates that have been enacted or substantively enacted at the reporting date and are expected to apply in the period when the related deferred income tax asset is realised or the deferred income tax liability is settled.
Deferred tax assets are recognised to the extent that it is probable that future taxable profit will be available against which deductible temporary differences can be utilised.

MAURITIUS OIL REFINERIES LIMITED ANNUAL REPORT 2017
Notes to the Financial StatementsYear Ended June 30, 2017
52
(i) Inventories
Inventories are stated at the lower of cost and net realisable value. Cost is determined by the first-in first-out (FIFO) method and by the weighted average method. The cost of finished goods and work in progress comprises raw materials, direct labour, other direct costs and related production overheads (based on normal operating capacity) but excludes borrowings costs. Net realisable value is the estimated selling price in the ordinary course of business, less the costs of completion and applicable variable selling expenses.
(j) Retirement benefit obligations
(i) Defined benefit plan A defined benefit plan is a pension plan that is not a defined contribution plan. Typically defined benefit plans define an
amount of pension benefit that an employee will receive on retirement, usually dependent on one or more factors such as wage, years of service and compensation.
The liability recognised in the statement of financial position in respect of defined benefit pension plans is the present value of the defined benefit obligation at the end of the reporting period less the fair value of plan assets. The defined benefit obligation is calculated annually by independent actuaries using the projected unit credit method.
Remeasurement of the net defined benefit liability, which comprise actuarial gains and losses arising from experience
adjustments and changes in actuarial assumptions, the return on plan assets (excluding interest) and the effect of the asset ceiling (if any, excluding interest) is recognised immediately in other comprehensive income in the period in which they occur. Remeasurements recognised in other comprehensive income shall not be reclassified to profit or loss in subsequent period.
The Group determines the net interest expense/(income) on the net defined benefit liability/(asset) for the period by applying the discount rate used to measure the defined benefit obligation at the beginning of the annual period to the net defined benefit liability/(asset), taking into account any changes in the net defined liability/(asset) during the period as a result of contributions and benefits payments. Net interest expense/(income) is recognised in profit or loss.
Service costs comprising current service cost, past service cost, as well as gains and losses on curtailments and settlements are recognised immediately in profit or loss.
(ii) Defined contribution plans A defined contribution plan is a pension plan under which the Group pays fixed contributions into a separate entity. The
Group has no legal or constructive obligation to pay further contributions if the fund does not hold sufficient assets to pay all employees the benefits relating to employee service in the current and prior periods.
Payments to defined contribution plans are recognised as an expense when employees have rendered service that entitle them to the contributions.
(iii) Profit-sharing and bonus plans The Group recognises a liability and an expense for bonuses and profit-sharing, based on a formula that takes into
consideration the profit attributable to the Company’s shareholders after certain adjustments. The Group recognises a provision where contractually obliged or where there is a past practice that has created a constructive obligation.
(iv) Gratuity on retirement For employees who are not covered (or who are insufficiently covered by the above pension plans), the net present value
of gratuity on retirement payable under the Employment Rights Act 2008 is calculated by a qualified actuary and provided for. The obligations arising under this item are not funded.
(v) Unfunded pensioners In compliance with IAS 19, full liability of the retirement obligations has been recognised.
(k) Foreign currencies
(i) Functional and presentation currency Items included in the financial statements are measured using Mauritian rupees, the currency of the primary economic
environment in which the entity operates (“functional currency”). The consolidated financial statements are presented in Mauritian rupees, which is the Group’s functional and presentation currency.
2. SIGNIFICANT ACCOUNTING POLICIES (CONT’D)
MAURITIUS OIL REFINERIES LIMITED ANNUAL REPORT 2017
Notes to the Financial StatementsYear Ended June 30, 2017
53
(ii) Transactions and balances Foreign currency transactions are translated into the functional currency using the exchange rates prevailing on the dates
of the transactions. Foreign exchange gains and losses resulting from the settlement of such transactions and from the translation at year-end exchange rates of monetary assets and liabilities denominated in foreign currencies are recognised in profit or loss.
Non-monetary items that are measured at historical cost in a foreign currency are translated using the exchange rate at the date of the transaction.
Non-monetary items that are measured at fair value in a foreign currency are translated using the exchange rates at the date the fair value was determined.
(l) Impairment of non-financial assets
Assets that have an indefinite useful life are not subject to amortisation and are tested annually for impairment. Assets that are subject to amortisation are reviewed for impairment whenever events or changes in circumstances indicate that the carrying amount may not be recoverable. Any impairment loss is recognised for the amount by which the carrying amount of the asset exceeds its recoverable amount. The recoverable amount is the higher of an asset’s fair value less costs to sell and value in use. For the purposes of assessing impairment, assets are grouped at the lowest levels for which there are separately identifiable cash flows (cash-generating units).
(m) Revenue recognition
Revenue is measured at the fair value of the consideration received or receivable, and represents amounts receivable for goods supplied, stated net of discounts, returns, value added tax, rebates and other similar allowances and after eliminating sales within the Group.
(i) Sale of goods
Sales of goods are recognised when the goods are delivered and titles have passed, at which time all of the following conditions are satisfied:
• the Group has transferred to the buyer the significant risks and rewards of ownership of the goods; • the Group retains neither continuing managerial involvement to the degree usually associated with ownership nor
effective control over the goods sold; • the amount of revenue can be measured reliably; • it is probable that the economic benefits associated with the transaction will flow to the Group; and • the costs incurred or to be incurred in respect of the transaction can be measured reliably.
(ii) Other revenues earned by the Group are recognised on the following bases: . Interest and rental income - as it accrues unless collectability is in doubt, . Dividend income - when the shareholder’s right to receive payment is established.
(n) Provisions
Provisions are recognised when the Group has a present legal or constructive obligation as a result of past events; it is probable that an outflow of resources that can be reliably estimated will be required to settle the obligation.
(o) Leases
Lease are classified as finance leases where the terms of the lease transfer substantially all the risks and rewards of ownership to the lessee. All other leases are classified as operating leases. Payments made under operating leases (net of any incentives received from the lessor) are charged to profit or loss on a straight-line basis over the period of the lease.
(i) Accounting for leases - where Group is the lessee Finance leases are capitalised at the lease’s inception at the lower of the fair value of the leased property and the
present value of the minimum lease payments. Each lease payment is allocated between the liability and finance charges so as to achieve a constant rate of interest on the remaining balance of the liability. Finance charges are charged to profit or loss.
(ii) Operating leases Assets leased out under operating leases are included in investment property in the statement of financial position.
Rental income is recognised on a straight line basis over the lease term.

MAURITIUS OIL REFINERIES LIMITED ANNUAL REPORT 2017
Notes to the Financial StatementsYear Ended June 30, 2017
54
2. SIGNIFICANT ACCOUNTING POLICIES (CONT’D)
(p) Dividend distribution
Dividend distribution to the Company’s shareholders is recognised as a liability in the Group’s financial statements in the period in which the dividends are declared.
(q) Segment reporting
Segment information presented relate to operating segments that engage in business activities for which revenues are earned and expenses incurred.
3. FINANCIAL RISK MANAGEMENT
3.1 Financial Risk Factors
The Group’s activities expose it to a variety of financial risks, including: • Foreign exchange risk; • Credit risk; • Interest rate risk; • Liquidity risk; • Price risk; and • Market risk.
The Group’s overall risk management programme focuses on the unpredictability of financial markets and seeks to minimise potential adverse effects on the Group’s financial performance.
A description of the significant risk factors is given below together with the risk management policies applicable.
Foreign exchange risk The Group is exposed to foreign exchange risk arising from various currency exposures primarily with respect to the US
dollar and the Euro.
The Group’s dealings in foreign currency purchases is managed by seeking the best rates. Fluctuations arising on purchase transactions are partly offset by sales transactions, effected sometimes in US dollar. The Group uses forward contracts to hedge its exposure to foreign currency risk when future commercial transactions and recognised liabilities are denominated in a currency that is not the Group’s functional currency.
The Group At June 30, 2017, if the rupee had weakened/strengthened by 1% against the US dollar/Euro with all variables held
constant, post tax profit for the year would have been Rs.65,777 (2016: Rs.54,292) higher/lower, mainly as a result of foreign exchange gains/losses on translation of US dollar/Euro denominated assets and liabilities. Profit is more sensitive to movement in rupee/US dollar and rupee/Euro exchange rates in 2017 than 2016 because of the increased amount of US dollar/Euro net liabilities.
The Company At June 30, 2017, if the rupee had weakened/strengthened by 1% against the US dollar/Euro with all variables held
constant, post tax profit for the year would have been Rs.63,440 (2016: Rs.52,642) higher/lower, mainly as a result of foreign exchange gains/losses on translation of US dollar/Euro denominated assets and liabilities. Profit is more sensitive to movement in rupee/US dollar and rupee/Euro exchange rates in 2017 than 2016 because of the increased amount of US dollar/Euro net liabilities.
Credit risk The Group’s credit risk is primarily attributable to its trade receivables. The Group has policies in place to ensure that
sales of products and services are made to customers with an appropriate credit history. The amounts presented in the statement of financial position are net of allowances for doubtful receivables, estimated by the Group’s management based on prior experience and the current economic environment.
Cash transactions are limited to high credit quality financial institutions. The Group has policies that limit the amount of credit exposure to any financial institution.

MAURITIUS OIL REFINERIES LIMITED ANNUAL REPORT 2017
Notes to the Financial StatementsYear Ended June 30, 2017
55
Management does not expect any losses from non-performance of these customers.
Interest rate risk The Group’s/Company’s income and operating cash flows are exposed to interest rate risk as it sometimes borrows at
variable rates.
The Group At June 30, 2017, if interest rates on rupee-denominated borrowings had been 10 basis points lower/higher with all other
variables held constant, post-tax profit for the year would have been Rs.145,177 (2016: Rs.62,691) higher/lower, mainly as a result of lower/higher interest expense on floating rate borrowings.
If interest rates on rupee-denominated bank balances had been 10 basis points lower/higher with all other variables held constant, there would not have been a material impact on post-tax profit for the year ended June 30, 2017 and June 30, 2016.
The Company At June 30, 2017, if interest rates on rupee-denominated borrowings had been 10 basis points lower/higher with all other
variables held constant, post-tax profit for the year would have been Rs.137,228 (2016: Rs.57,723) higher/lower, mainly as a result of lower/higher interest expense on floating rate borrowings.
If interest rates on rupee-denominated bank balances had been 10 basis points lower/higher with all other variables held constant, there would not have been a material impact on post-tax profit for the year ended June 30, 2017 and June 30, 2016.
Liquidity risk Prudent liquidity risk management includes maintaining sufficient cash and marketable securities, the availability of funding
from an adequate amount of committed credit facilities and the ability to close out market positions. The Group aims at maintaining flexibility in funding by keeping committed credit lines available.
The table below shows the credit concentration of the Group and the Company at end of the reporting period:
THE GROUP THE COMPANY
2017 2016 2017 2016Counterparties: Rs’000 Rs’000 Rs’000 Rs’00010 major counterparties per company 34,840 41,614 27,999 39,271 Others (diversified risk) 63,610 70,473 54,735 61,096
98,450 112,087 82,734 100,367
The table below analyses the Group’s and the Company’s financial liabilities into relevant maturity groupings based on the remaining period at the end of the reporting period to the contractual maturity date.
The Group Less than Between 1 Between 2 Over1 year and 2 years and 5 years 5 yearsRs’000 Rs’000 Rs’000 Rs’000
At June 30, 2017Borrowings 164,249 - - - Trade and other payables 49,851 - - -
At June 30, 2016Borrowings 99,338 - - - Trade and other payables 53,459 - - -
The Company Less than Between 1 Between 2 Over1 year and 2 years and 5 years 5 years
Rs’000 Rs’000 Rs’000 Rs’000At June 30, 2017Bank overdrafts 155,888 - - - Trade and other payables 37,470 - - -
At June 30, 2016Bank overdrafts 92,285 - - - Trade and other payables 42,565 - - -

MAURITIUS OIL REFINERIES LIMITED ANNUAL REPORT 2017
Notes to the Financial StatementsYear Ended June 30, 2017
56
3. FINANCIAL RISK MANAGEMENT (CONT’D)
Price risk The Group is not exposed to price risk as it does not hold equity securities classified as available-for-sale which are
susceptible to future price uncertainties.
Market risk The Group is exposed to market risk arising from changes in oil prices and fluctuation in exchange rates. This risk will
directly impact on the performance of the company. There is a procurement committee to address these exposures as and when necessary.
3.2 Fair value estimation
The fair value of financial instruments traded in active markets is based on quoted market price at the end of the reporting period. A market is regarded as active if quoted prices are readily and regularly available from an exchange, dealer, broker, industry group, pricing service, or regulatory agency, and those prices represent actual and regularly occurring market transactions on an arm’s length basis. The quoted market price used for financial assets held by the Group is the current bid price. These instruments are included in level 1. Instruments included in level 1 comprise primarily quoted equity investments classified as trading securities or available-for-sale.
If one or more of the significant inputs is not based on observable market data, the instrument is included in level 3.
The nominal values less estimated credit adjustments of trade receivables and payables are assumed to approximate their fair values. The fair value of financial liabilities for disclosure purposes is estimated by discounting the future contractual cashflows at the current market interest rate that is available to the Group for similar financial instruments.
3.3 Capital risk management
The Group’s objectives when managing capital are: • to safeguard the Group’s ability to continue as a going concern, so that it can continue to provide returns for
shareholders and benefits for other stakeholders; and • to provide an adequate return to shareholders by pricing products and services commensurately with the level of risk.
The Group sets the amount of capital in proportion to risk. The Group manages the capital structure and makes adjustments to it in the light of changes in economic conditions and the risk characteristics of the underlying assets.
In order to maintain or adjust the capital structure, the Group may adjust the amount of dividends paid to shareholders, return capital to shareholders, issue new shares, or sell assets to reduce debt.
Consistent with others in the industry, the Group monitors capital on the basis of the debt-to-adjusted capital ratio. This ratio is calculated as net debt adjusted capital. Net debt is calculated as total debt (as shown in the statement of
financial position) less cash and cash equivalents. Adjusted capital comprises all components of equity (i.e. share capital, non-controlling interests, retained earnings and revaluation surplus).
During 2017, the Group’s strategy, which was unchanged from 2016, was to maintain the debt-to-adjusted capital ratio at the lower end, in order to secure access to finance at a reasonable cost.
The debt-to-adjusted capital ratios at June 30, 2017 and at June 30, 2016 were as follows:
THE GROUP THE COMPANY
2017 2016 2017 2016Rs’000 Rs’000 Rs’000 Rs’000
Total debt (note 19) 164,249 99,338 155,888 92,285 Less: cash and bank balances (note 31(b)) (763) (2,413) (750) (2,356)Net debt 163,486 96,925 155,138 89,929
Total equity 415,745 423,655 306,486 310,142
Debt-to-adjusted capital ratio 0.39:1 0.23:1 0.51:1 0.29:1

MAURITIUS OIL REFINERIES LIMITED ANNUAL REPORT 2017
Notes to the Financial StatementsYear Ended June 30, 2017
57
4. CRITICAL ACCOUNTING ESTIMATES AND JUDGEMENTS
Estimates and judgements are continuously evaluated and are based on historical experience and other factors, including expectations of future events that are believed to be reasonable under the circumstances.
4.1 Critical accounting estimates and assumptions
The Group makes estimates and assumptions concerning the future. The resulting accounting estimates will, by definition, seldom equal the related actual results. The estimates and assumptions that have a significant risk of causing adjustments to the carrying amounts of assets and liabilities within the next financial year are discussed below.
(a) Estimated impairment of goodwill The Group tests annually whether goodwill has suffered any impairment, in accordance with the accounting policy stated
in Note 2(d). These calculations require the use of estimates.
(b) Impairment of available-for-sale financial assets The Group follows the guidance of IAS 39 on determining when an investment is other-than-temporarily impaired. This
determination requires significant judgement. In making this judgement, the Group evaluates, among other factors, the duration and extent to which the fair value of an investment is less than its cost, and the financial health of and near-term business outlook for the investee, including factors such as industry and sector performance, changes in technology and operational and financing cash flow.
(c) Pension benefits The present value of the pension obligations depends on a number of factors that are determined on an actuarial basis
using a number of assumptions. The assumptions used in determining the net cost/(income) for pensions include the discount rate. Any changes in these assumptions will impact the carrying amount of pension obligations.
The Group determines the appropriate discount rate at the end of each year. This is the interest rate that should be used to determine the present value of estimated future cash outflows expected to be required to settle the pension obligations. In determining the appropriate discount rate, the Group considers the interest rates of high-quality corporate bonds that are denominated in the currency in which the benefits will be paid, and that have terms to maturity approximating the terms of the related pension obligation.
Other key assumptions for pension obligations are based in part on current market conditions. Additional information is disclosed in Note 20.
(d) Revaluation of property, plant and equipment and investment properties The Group carries its investment properties at fair value, with changes in fair value being recognised in profit or loss.
In addition, it measures land and buildings at revalued amounts with changes in fair value being recognised in other comprehensive income. The Group engaged independent valuation specialists to determine fair value of investment properties as at June 30, 2017 and fair value of freehold buildings as at June 30, 2017. The valuation has been arrived at by reference to market evidence of transaction prices for similar properties.
The determined fair value of the investment properties is most sensitive to the estimated yield as well as the long term vacancy rate. The key assumptions used to determine the fair value of the investment properties, are further explained in Note 7.
(e) Asset lives and residual values Property, plant and equipment are depreciated over its useful life taking into account residual values, where appropriate.
The actual lives of the assets and residual values are assessed annually and may vary depending on a number of factors. In reassessing asset lives, factors such as technological innovation, product life cycles and maintenance programmes are taken into account. Residual value assessments consider issues such as future market conditions, the remaining life of the asset and projected disposal values. Consideration is also given to the extent of current profits and losses on the disposal of similar assets.

MAURITIUS OIL REFINERIES LIMITED ANNUAL REPORT 2017
Notes to the Financial StatementsYear Ended June 30, 2017
58
4. CRITICAL ACCOUNTING ESTIMATES AND JUDGEMENTS (CONT’D)
(f) Depreciation policies Property, plant and equipment are depreciated to their residual values over their estimated useful lives. The residual value
of an asset is the estimated net amount that the Group would currently obtain from disposal of the asset, if the asset was already of the age and in condition expected at the end of its useful life.
The directors therefore make estimates based on historical experience and use best judgement to assess the useful lives of assets and to forecast the expected residual values of the assets at the end of their expected useful lives.
(g) Limitation of sensitivity analysis Sensitivity analysis in respect of market risk demonstrates the effect of a change in a key assumption while other
assumptions remain unchanged. In reality, there is a correlation between the assumptions and other factors. It should also be noted that these sensitivities are non-linear and larger or smaller impacts should not be interpolated or extrapolated from these results.
Sensitivity analysis does not take into consideration that the Group’s assets and liabilities are managed. Other limitations include the use of hypothetical market movements to demonstrate potential risk that only represent the Group’s view of possible near-term market changes that cannot be predicted with any certainty.

MAURITIUS OIL REFINERIES LIMITED ANNUAL REPORT 2017
Notes to the Financial StatementsYear Ended June 30, 2017
59
5.P
RO
PE
RT
Y, P
LAN
T A
ND
EQ
UIP
ME
NT
Free
hold
la
ndIm
prov
emen
t to
land
Free
hold
bu
ildin
gsP
lant
&
mac
hine
ryYa
rdFu
rnitu
re&
fit
tings
Tool
sM
otor
ve
hicl
es
Com
pute
r eq
uipm
ent &
ac
cess
orie
sO
il st
orag
e co
mpl
exTo
tal
(a)
TH
E G
RO
UP
Rs’
000
Rs’
000
Rs’
000
Rs’
000
Rs’
000
Rs’
000
Rs’
000
Rs’
000
Rs’
000
Rs’
000
Rs’
000
(i)C
OS
T O
R
VA
LUA
TIO
N
At J
uly
1, 2
016
8,8
32
279
1
01,5
82
328
,121
1
0,77
2 2
1,86
0 3
,737
4
9,41
0 1
0,85
6 2
1,28
9 5
56,7
38
Add
ition
s -
-
1
56
14,
563
-
533
4
0 4
,648
3
75
714
2
1,02
9 D
ispo
sals
-
-
-
(8,1
96)
-
-
-
(4,3
66)
-
-
(12,
562)
Rev
alua
tion
surp
lus
-
-
14,
157
-
-
-
-
-
-
-
14,
157
At
June
30,
201
7 8
,832
2
79
115
,895
3
34,4
88
10,
772
22,
393
3,7
77
49,
692
11,
231
22,
003
579
,362
DE
PR
EC
IATI
ON
At J
uly
1, 2
016
-
84
4,0
75
228
,490
9
,196
1
7,57
5 3
,490
3
1,95
3 1
0,06
6 1
1,60
2 3
16,5
31
Cha
rge
for
the
year
-
28
2,0
45
8,7
91
290
1
,233
1
03
4,7
23
661
4
52
18,
326
Dis
posa
l adj
ustm
ents
-
-
-
(6,7
53)
-
-
-
(3,8
78)
-
-
(10,
631)
Rev
alua
tion
adju
stm
ent
-
-
(6,1
20)
-
-
-
-
-
-
-
(6,1
20)
At
June
30,
201
7 -
1
12
-
230
,528
9
,486
1
8,80
8 3
,593
3
2,79
8 1
0,72
7 1
2,05
4 3
18,1
06
NE
T B
OO
K V
ALU
ES
At
June
30,
201
7 8
,832
1
67
115
,895
1
03,9
60
1,2
86
3,5
85
184
1
6,89
4 5
04
9,9
49
261
,256
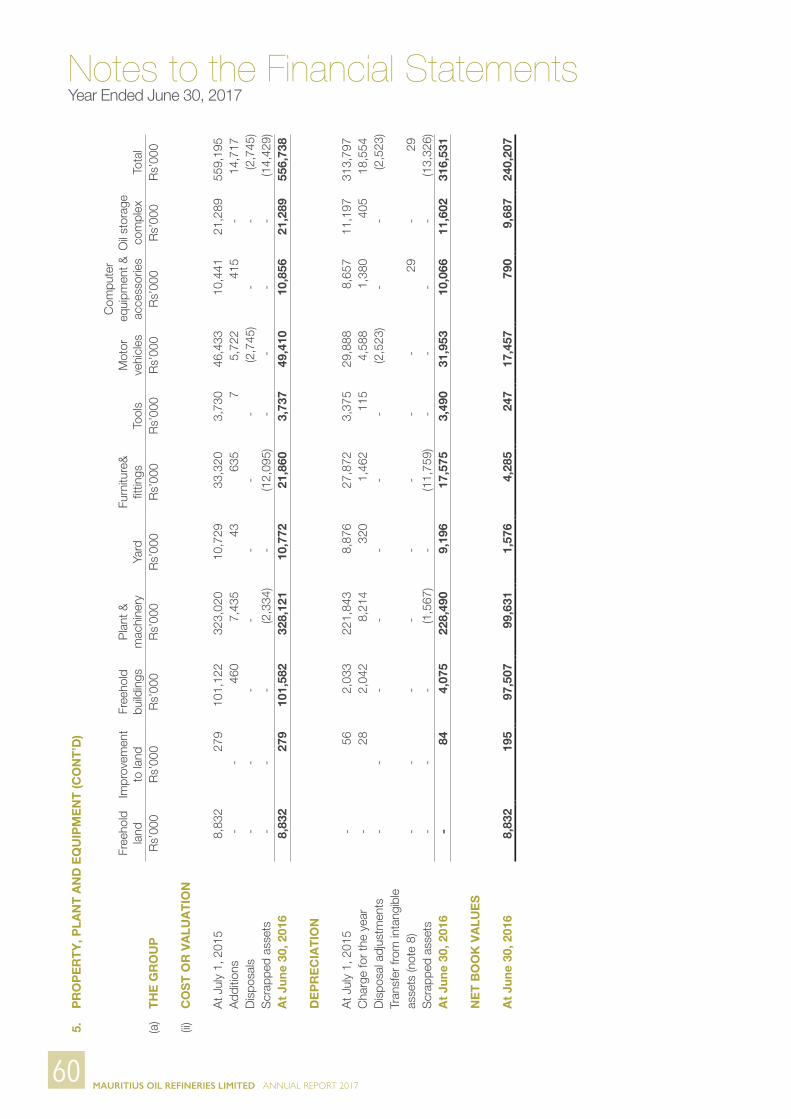
MAURITIUS OIL REFINERIES LIMITED ANNUAL REPORT 2017
Notes to the Financial StatementsYear Ended June 30, 2017
60
5.P
RO
PE
RT
Y, P
LAN
T A
ND
EQ
UIP
ME
NT
(CO
NT
’D)
Free
hold
la
ndIm
prov
emen
t to
land
Free
hold
bu
ildin
gsP
lant
&
mac
hine
ryYa
rdFu
rnitu
re&
fit
tings
Tool
sM
otor
ve
hicl
es
Com
pute
r eq
uipm
ent &
ac
cess
orie
sO
il st
orag
e co
mpl
exTo
tal
(a)
TH
E G
RO
UP
Rs’
000
Rs’
000
Rs’
000
Rs’
000
Rs’
000
Rs’
000
Rs’
000
Rs’
000
Rs’
000
Rs’
000
Rs’
000
(ii)
CO
ST
OR
VA
LUA
TIO
N
At J
uly
1, 2
015
8,8
32
279
1
01,1
22
323
,020
1
0,72
9 3
3,32
0 3
,730
4
6,43
3 1
0,44
1 2
1,28
9 5
59,1
95
Add
ition
s -
-
4
60
7,4
35
43
635
7
5
,722
4
15
-
14,
717
Dis
posa
ls -
-
-
-
-
-
-
(2
,745
) -
-
(2
,745
)S
crap
ped
asse
ts -
-
-
(2
,334
) -
(1
2,09
5) -
-
-
-
(1
4,42
9)A
t Ju
ne 3
0, 2
016
8,8
32
279
1
01,5
82
328
,121
1
0,77
2 2
1,86
0 3
,737
4
9,41
0 1
0,85
6 2
1,28
9 5
56,7
38
DE
PR
EC
IAT
ION
At J
uly
1, 2
015
-
56
2,0
33
221
,843
8
,876
2
7,87
2 3
,375
2
9,88
8 8
,657
1
1,19
7 3
13,7
97
Cha
rge
for
the
year
-
28
2,0
42
8,2
14
320
1
,462
1
15
4,5
88
1,3
80
405
1
8,55
4 D
ispo
sal a
djus
tmen
ts -
-
-
-
-
-
-
(2
,523
) -
-
(2
,523
)Tr
ansf
er fr
om in
tang
ible
asse
ts (n
ote
8) -
-
-
-
-
-
-
-
2
9 -
2
9 S
crap
ped
asse
ts -
-
-
(1
,567
) -
(1
1,75
9) -
-
-
-
(1
3,32
6)A
t Ju
ne 3
0, 2
016
-
84
4,0
75
228
,490
9
,196
1
7,57
5 3
,490
3
1,95
3 1
0,06
6 1
1,60
2 3
16,5
31
NE
T B
OO
K V
ALU
ES
At
June
30,
201
6 8
,832
1
95
97,
507
99,
631
1,5
76
4,2
85
247
1
7,45
7 7
90
9,6
87
240
,207

MAURITIUS OIL REFINERIES LIMITED ANNUAL REPORT 2017
Notes to the Financial StatementsYear Ended June 30, 2017
61
5.P
RO
PE
RT
Y, P
LAN
T A
ND
EQ
UIP
ME
NT
(CO
NT
’D)
Free
hold
bu
ildin
gsP
lant
&
mac
hine
ryYa
rdFu
rnitu
re&
fit
tings
Tool
sM
otor
ve
hicl
es
Com
pute
r eq
uipm
ent &
ac
cess
orie
sO
il st
orag
e co
mpl
exTo
tal
(b)
TH
E C
OM
PA
NY
Rs’
000
Rs’
000
Rs’
000
Rs’
000
Rs’
000
Rs’
000
Rs’
000
Rs’
000
Rs’
000
(i)C
OS
T O
R V
ALU
AT
ION
At J
uly
1, 2
016
102
,088
2
57,6
01
10,
582
13,
805
429
4
3,38
7 1
0,65
4 2
1,28
9 4
59,8
35
Add
ition
s 1
56
13,
111
-
490
4
0 3
,928
3
43
714
1
8,78
2 D
ispo
sals
-
(8,0
41)
-
-
-
(4,3
66)
-
-
(12,
407)
Rev
alua
tion
surp
lus
14,
156
-
-
-
-
-
-
-
14,
156
At
June
30,
201
7 1
16,4
00
262
,671
1
0,58
2 1
4,29
5 4
69
42,
949
10,
997
22,
003
480
,366
DE
PR
EC
IAT
ION
At J
uly
1, 2
016
4,0
75
179
,606
9
,004
1
0,48
2 3
32
29,
220
9,8
64
11,
602
254
,185
C
harg
e fo
r th
e ye
ar 2
,044
6
,457
2
90
1,0
27
46
3,7
97
544
4
52
14,
657
Dis
posa
l adj
ustm
ents
-
(6,6
69)
-
-
-
(3,8
78)
-
-
(10,
547)
Rev
alua
tion
adju
stm
ent
(6,1
19)
-
-
-
-
-
-
-
(6,1
19)
At
June
30,
201
7 -
1
79,3
94
9,2
94
11,
509
378
2
9,13
9 1
0,40
8 1
2,05
4 2
52,1
76
NE
T B
OO
K V
ALU
ES
At
June
30,
201
7 1
16,4
00
83,
277
1,2
88
2,7
86
91
13,
810
589
9
,949
2
28,1
90

MAURITIUS OIL REFINERIES LIMITED ANNUAL REPORT 2017
Notes to the Financial StatementsYear Ended June 30, 2017
62
5.P
RO
PE
RT
Y, P
LAN
T A
ND
EQ
UIP
ME
NT
(CO
NT
’D) Fr
eeho
ld
build
ings
Pla
nt &
m
achi
nery
Yard
Furn
iture
& fi
ttin
gsTo
ols
Mot
or
vehi
cles
Com
pute
r eq
uipm
ent
&ac
cess
orie
sO
il st
orag
e co
mpl
exTo
tal
(b)
TH
E C
OM
PA
NY
Rs’
000
Rs’
000
Rs’
000
Rs’
000
Rs’
000
Rs’
000
Rs’
000
Rs’
000
Rs’
000
(ii)
CO
ST
OR
VA
LUA
TIO
N
At J
uly
1, 2
015
101
,628
2
51,0
00
10,
539
25,
266
422
4
1,96
4 1
0,24
4 2
1,28
9 4
62,3
52
Add
ition
s 4
60
6,6
01
43
634
7
3
,379
4
10
-
11,
534
Dis
posa
ls -
-
-
-
-
(1
,956
) -
-
(1
,956
)S
crap
ped
asse
ts -
-
-
(1
2,09
5) -
-
-
-
(1
2,09
5)A
t Ju
ne 3
0, 2
016
102
,088
2
57,6
01
10,
582
13,
805
429
4
3,38
7 1
0,65
4 2
1,28
9 4
59,8
35
DE
PR
EC
IAT
ION
At J
uly
1, 2
015
2,0
33
173
,607
8
,684
2
1,16
5 2
73
27,
132
8,4
63
11,
197
252
,554
C
harg
e fo
r th
e ye
ar 2
,042
5
,999
3
20
1,0
76
59
3,8
23
1,3
72
405
1
5,09
6 D
ispo
sal a
djus
tmen
ts -
-
-
-
-
(1
,735
) -
-
(1
,735
)Tr
ansf
er fr
om in
tang
ible
asse
ts (n
ote
8) -
-
-
-
-
-
2
9 -
2
9 S
crap
ped
asse
ts -
-
-
(1
1,75
9) -
-
-
-
(1
1,75
9)A
t Ju
ne 3
0, 2
016
4,0
75
179
,606
9
,004
1
0,48
2 3
32
29,
220
9,8
64
11,
602
254
,185
N
ET
BO
OK
VA
LUE
S
At
June
30,
201
6 9
8,01
3 7
7,99
5 1
,578
3
,323
9
7 1
4,16
7 7
90
9,6
87
205
,650

MAURITIUS OIL REFINERIES LIMITED ANNUAL REPORT 2017
Notes to the Financial StatementsYear Ended June 30, 2017
63
(g) Depreciation charge for the year has been included in:
THE GROUP THE COMPANY
2017 2016 2017 2016Rs’000 Rs’000 Rs’000 Rs’000
Cost of operations 13,433 12,860 10,995 10,548 Distribution costs 2,091 2,100 2,091 2,100 Administrative expenses 2,802 3,594 1,571 2,448
18,326 18,554 14,657 15,096
(h) If freehold buildings and plant and machinery were stated on the historical cost basis, the amounts would be as follows:
THE GROUP AND THE COMPANYFreehold buildings Plant and Machinery
2017 2016 2017 2016Rs’000 Rs’000 Rs’000 Rs’000
Cost 36,185 36,030 177,820 171,182 Accumulated depreciation (16,717) (15,993) (139,733) (134,399)Net book values 19,468 20,037 38,087 36,783
5. PROPERTY, PLANT AND EQUIPMENT (CONT’D)
(c) No assets were acquired under finance leases during the year (2016: Rs.nil).
(d) Leased assets for the Group included above comprise of plant and machinery:
2017 2016Rs’000 Rs’000
Cost - capitalised finance leases 3,989 3,989 Accumulated depreciation (1,308) (1,109)Net book amount 2,681 2,880
(e) The Company’s freehold buildings were revalued by Messrs Broll Indian Ocean Limited, independent chartered valuers, on June 30, 2017. Valuations were made based on market value using depreciated replacement cost approach. The revaluation surplus net of deferred income taxes was credited to revaluation surplus in shareholders’ equity (note 17).
(f) Land included in one of the subsidiaries was revalued by Gexim Real Estate Ltd, independent valuers on August 28, 2013. Valuations were made on the basis of open market value. The revaluation surplus was credited to revaluation surplus in the shareholder’s equity (note 17). The directors consider the carrying amount not to be materially different from its fair value at June 30, 2017.
The Group’s freehold land and buildings are categorised as level 2 of the fair value hierarchy as at June 30, 2017.
There were no transfers between level 1 and 2 during the year.
THE GROUP Freehold land
2017 2016Rs’000 Rs’000
Cost 2,683 2,683 Accumulated depreciation - - Net book values 2,683 2,683
(i) Bank borrowings are secured by floating charges on the assets of the Group including property, plant and equipment (note 19).

MAURITIUS OIL REFINERIES LIMITED ANNUAL REPORT 2017
Notes to the Financial StatementsYear Ended June 30, 2017
64
6. LEASEHOLD LAND PAYMENTS
The lease with the Mauritius Ports Authority are as follows:(i) 20,472.4 m2 of land and(ii) 3,698 m2 of land which expired on June 30, 2011.
The lease agreement in respect of 3,698 m2 of land on lease from MPA, is due for renewal as from July 01, 2011.The company has agreed to the terms and conditions of a new lease for the plot of land of 3,698 m2 with the MPA. The agreement will be signed in the near future.
7. INVESTMENT PROPERTY
THE GROUP
2017 2016Fair value model Rs’000 Rs’000At July 1, 63,200 56,500 Addtions during the year 204 4,747 Increase in fair value - 1,953 At June 30, 63,404 63,200
The investment property consists of buildings owned by a subsidiary, Proton Limited, which is on land of 5,909.22 m² under a lease with the Mauritius Ports Authority. The investment property has been valued at fairvalue by Messrs Broll Indian Ocean Limited, independent Chartered surveyor, on a depreciated replacement cost approach on June 30, 2017. The investment property consists of building categorised as level 2 of the fair valuehierarchy as at June 30, 2017.
The company has agreed to the terms and conditions of a new lease for the plot of land of 5,909.22 m² with the Mauritius Ports Authority. The agreement will be signed in the near future.
There were no transfers between level 1 and level 2 during the year.
The following amounts have been recognised in profit or loss: THE GROUP
2017 2016Rs’000 Rs’000
Rental income from investment property 4,817 4,337
Direct operating expenses from investment property that generates rental income 517 545

MAURITIUS OIL REFINERIES LIMITED ANNUAL REPORT 2017
Notes to the Financial StatementsYear Ended June 30, 2017
65
8. INTANGIBLE ASSETS
Goodwill on Computerconsolidation software Total
(a) THE GROUP Rs’000 Rs’000 Rs’000
(i) COSTAt July 1, 2016 491 9,335 9,826 Additions - 155 155
At June 30, 2017 491 9,490 9,981
AMORTISATIONAt July 1, 2016 - 8,212 8,212 Charge for the year - 1,023 1,023
At June 30, 2017 - 9,235 9,235
NET BOOK VALUES
At June 30, 2017 491 255 746
(ii) COSTAt July 1, 2015 491 9,071 9,562 Additions - 264 264 At June 30, 2016 491 9,335 9,826
AMORTISATIONAt July 1, 2015 - 7,129 7,129 Charge for the year - 1,112 1,112 Transfer to property, plant and equipment (note 5) - (29) (29)At June 30, 2016 - 8,212 8,212
NET BOOK VALUESAt June 30, 2016 491 1,123 1,614
(b) THE COMPANY
Computer software
2017 2016COST Rs’000 Rs’000At July 1, 9,335 9,071 Additions 155 264 At June 30, 9,490 9,335
AMORTISATIONAt July 1, 8,212 7,129 Charge for the year 1,023 1,112 Transfer to property, plant and equipment (note 5) - (29)At June 30, 9,235 8,212
NET BOOK VALUESAt June 30, 255 1,123
(c) Amortisation charge of Rs.1,023,124 (2016: Rs.1,112,020) for the Group and for the Company has been included in administrative expenses.
(d) Impairment testing for cash-generating units containing goodwillFor the purpose of impairment testing, goodwill is allocated to the Group’s operating divisions which represent the lowest level within the Group at which the goodwill is monitored for internal management purposes, which is not higher than the Group’s operating segments as reported in note 23. The recoverable amounts of these cash-generating units have been assessed based on the Group’s share in the net asset of the investee.
Following this exercise, no impairment (2016: Rs.nil) was recognised during the year.
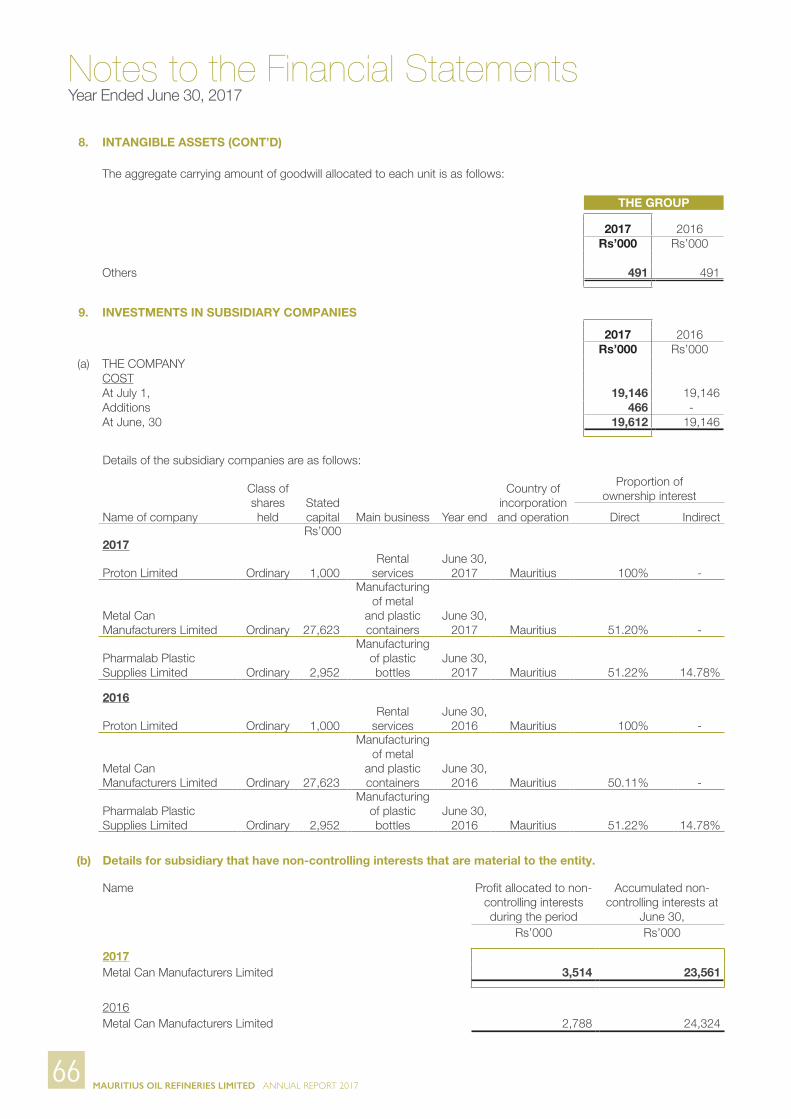
MAURITIUS OIL REFINERIES LIMITED ANNUAL REPORT 2017
Notes to the Financial StatementsYear Ended June 30, 2017
66
8. INTANGIBLE ASSETS (CONT’D)
The aggregate carrying amount of goodwill allocated to each unit is as follows:
THE GROUP
2017 2016Rs’000 Rs’000
Others 491 491
9. INVESTMENTS IN SUBSIDIARY COMPANIES
2017 2016Rs’000 Rs’000
(a) THE COMPANYCOSTAt July 1, 19,146 19,146 Additions 466 - At June, 30 19,612 19,146
Details of the subsidiary companies are as follows:
Name of company
Class of shares held
Stated capital Main business Year end
Country of incorporation and operation
Proportion of ownership interest
Direct IndirectRs’000
2017
Proton Limited Ordinary 1,000 Rental
servicesJune 30,
2017 Mauritius 100% -
Metal Can Manufacturers Limited Ordinary
27,623
Manufacturing of metal
and plastic containers
June 30, 2017 Mauritius 51.20% -
Pharmalab Plastic Supplies Limited Ordinary 2,952
Manufacturing of plastic bottles
June 30, 2017 Mauritius 51.22% 14.78%
2016
Proton Limited Ordinary 1,000 Rental
servicesJune 30,
2016 Mauritius 100% -
Metal Can Manufacturers Limited Ordinary
27,623
Manufacturing of metal
and plastic containers
June 30, 2016 Mauritius 50.11% -
Pharmalab Plastic Supplies Limited Ordinary 2,952
Manufacturing of plastic bottles
June 30, 2016 Mauritius 51.22% 14.78%
(b) Details for subsidiary that have non-controlling interests that are material to the entity.
Name Profit allocated to non-controlling interests during the period
Accumulated non-controlling interests at
June 30, Rs’000 Rs’000
2017Metal Can Manufacturers Limited 3,514 23,561
2016Metal Can Manufacturers Limited 2,788 24,324

MAURITIUS OIL REFINERIES LIMITED ANNUAL REPORT 2017
Notes to the Financial StatementsYear Ended June 30, 2017
67
9IN
VE
ST
ME
NT
S IN
SU
BS
IDIA
RY
CO
MP
AN
IES
(CO
NT
’D)
(c)
Sum
mar
ised
fina
ncia
l inf
orm
atio
n on
sub
sidi
ary
with
mat
eria
l non
-con
trol
ling
inte
rest
s.
(i)S
umm
aris
ed s
tate
men
t of fi
nanc
ial p
ositi
on a
nd s
tate
men
t of p
rofit
or
loss
and
oth
er c
ompr
ehen
sive
inco
me:
-
Nam
eC
urre
nt
asse
tsN
on-c
urre
nt
asse
tsC
urre
nt
liabi
litie
sN
on-c
urre
nt
liabi
litie
sR
even
ueP
rofit
for
the
year
Oth
er
com
preh
ensi
ve
inco
me
for
the
year
Tota
l co
mpr
ehen
sive
in
com
e fo
r th
e ye
arR
s’00
0R
s’00
0R
s’00
0R
s’00
0R
s’00
0R
s’00
0R
s’00
0R
s’00
020
17
Met
al C
an M
anuf
actu
rers
Lim
ited
42,
690
30,
453
13,
334
11,
528
106
,536
7
,140
(3
,504
) 3
,636
2016
Met
al C
an M
anuf
actu
rers
Lim
ited
37,
458
31,
263
10,
608
9,3
58
111
,090
5
,589
3
,647
9
,236
(ii)
Sum
mar
ised
cas
h flo
w in
form
atio
n:-
Nam
eO
pera
ting
activ
ities
Inve
stin
g ac
tiviti
esFi
nanc
ial
activ
ities
Net
(dec
reas
e)/
incr
ease
in
cash
and
cas
h eq
uiva
lent
sR
s’00
0R
s’00
0R
s’00
0R
s’00
020
17
Met
al C
an M
anuf
actu
rers
Lim
ited
4,8
12
(1,7
97)
(4,1
11)
(1,0
96)
2016
Met
al C
an M
anuf
actu
rers
Lim
ited
15,
766
(2,1
57)
(4,5
97)
9,0
12
10.
INV
ES
TM
EN
T IN
AS
SO
CIA
TE
201
7 2
016
Rs’
000
Rs’
000
(a)
THE
GR
OU
PA
t Jul
y 1,
33,
436
31,
802
Sha
re o
f pro
fit a
fter
tax
1,0
60
3,3
11
Sha
re o
f oth
er c
ompr
ehen
sive
inco
me
(1,4
09)
582
D
ivid
end
rece
ived
(1,7
75)
(2,2
59)
At
June
30,
3
1,31
2 3
3,43
6

MAURITIUS OIL REFINERIES LIMITED ANNUAL REPORT 2017
Notes to the Financial StatementsYear Ended June 30, 2017
68
10.
INV
ES
TM
EN
T IN
AS
SO
CIA
TE
(CO
NT
’D)
(b)
The
resu
lts o
f the
ass
ocia
te s
tate
d be
low
hav
e be
en in
clud
ed in
the
cons
olid
ated
fina
ncia
l sta
tem
ents
:
Com
pany
Year
end
Cou
ntry
of
inco
rpor
atio
n%
Dire
ct
Hol
ding
Cur
rent
as
sets
Non
- cu
rrent
as
sets
Cur
rent
lia
bilit
ies
Non
- cu
rrent
lia
bilit
ies
Rev
enue
Pro
fit fo
r th
e ye
ar
Oth
er
com
preh
ensi
ve
inco
me
for t
he
year
Tota
l co
mpr
ehen
sive
in
com
e fo
r the
ye
ar
Div
iden
d re
ceiv
ed
durin
g th
e ye
arR
s’00
0R
s’00
0R
s’00
0R
s’00
0R
s’00
0R
s’00
0R
s’00
0R
s’00
0R
s’00
020
17
Pla
stic
Indu
stry
(M
aurit
ius)
Ltd
June
30,
Mau
ritiu
s32
.26
101,
070
103,
742
57,
616
43,
436
207
,921
3
,285
(4
,369
) (1
,084
) 1
,775
2016
Pla
stic
Indu
stry
(M
aurit
ius)
Ltd
June
30,
Mau
ritiu
s32
.26
93,
719
10
6,90
5 5
0,15
5 4
0,12
6 2
35,5
49
11,
132
1,8
03
12,
935
2,2
59
(c)
As
at J
une
30, 2
017,
the
fair
valu
e of
the
Gro
up’s
inte
rest
in it
s as
soci
ate
whi
ch is
list
ed o
n th
e st
ock
exch
ange
of M
aurit
ius
was
Rs.
42,5
79,6
36 (2
016:
Rs.
38,7
08,7
60)
base
d on
the
quot
ed m
arke
t pric
e av
aila
ble,
whi
ch is
a le
vel 1
inpu
t in
term
s of
IFR
S 1
3.
(d)
THE
CO
MPA
NY
2017
2016
Rs’
000
Rs’
000
CO
ST
At J
uly
1, 2
016
and
June
30,
201
7 1
2,00
5 1
2,00
5

MAURITIUS OIL REFINERIES LIMITED ANNUAL REPORT 2017
Notes to the Financial StatementsYear Ended June 30, 2017
69
11. INVESTMENTS IN FINANCIAL ASSETS
THE GROUP THE COMPANY
2017 2016 2017 2016(a) Available-for-sale Rs’000 Rs’000 Rs’000 Rs’000
At July 1, 2016 and June 30, 2017 9,784 9,784 3 3
(b) Available-for-sale financial assets include the following: THE GROUP THE COMPANY
2017 2016 2017 2016Level 3 Rs’000 Rs’000 Rs’000 Rs’000
- Unlisted equity securities - at fair value 9,784 9,784 3 3
The Directors consider the carrying amounts of the unlisted equity securities to approximate their fair values.
(c) Available-for-sale financial assets are denominated in Mauritian Rupees.
(d) None of the financial assets is either past due or impaired.
12. DEFERRED TAX ASSETS/(LIABILITIES)
Deferred income tax is calculated on all temporary differences under the liability method at 15% (2016: 15%).
(a) There is a legally enforceable right to offset current tax assets against current tax liabilities and deferred income tax assets and liabilities when the deferred income taxes relate to the same fiscal authority on the same entity. The following amounts are shown on the statements of financial position:
THE GROUP THE COMPANY Restated Restated
2017 2016 2017 2016 Rs’000 Rs’000 Rs’000 Rs’000
Deferred tax assets 620 244 - - Deferred tax liabilities (26,392) (24,792) (17,188) (15,052)
(25,772) (24,548) (17,188) (15,052)
(b) Tax losses
THE GROUP THE COMPANY
2017 2016 2017 2016 Rs’000 Rs’000 Rs’000 Rs’000
Unused tax losses at end of the reporting date 1,299 - - -
Deferred tax assets recognised on tax losses 1,299 - - -
Deferred tax assets not recognised on tax losses - - - -
At the end of the reporting period, the Group had unused tax losses of Rs.1,298,970 (2016: Rs.nil) available for offset against future profits. Deferred tax assets have been recognised in respect of Rs.1,298,970 (2016: Rs.nil) of such losses.

MAURITIUS OIL REFINERIES LIMITED ANNUAL REPORT 2017
Notes to the Financial StatementsYear Ended June 30, 2017
70
12. DEFERRED TAX ASSETS/(LIABILITIES) (CONT’D)
(c) The movement on the deferred income tax account is as follows:THE GROUP THE COMPANY
2017 2016 2017 2016 At July 1, Rs’000 Rs’000 Rs’000 Rs’000- as previously stated (25,840) (19,084) (16,344) (11,749)- Prior year adjustment (note 32) 1,292 1,378 1,292 1,378 - as restated (24,548) (17,706) (15,052) (10,371)Profit or loss charge (note 22(b)) (2,687) (2,353) (2,894) (969)Credit/(charge) to other comprehensive income 1,463 (4,489) 758 (3,712)At June 30, (25,772) (24,548) (17,188) (15,052)
(d) The movement in the deferred tax assets and liabilities during the year, without taking into consideration the offsetting of balances within the same fiscal authority on the same entity is as follows:
(i) THE GROUP
Accelerated tax
depreciationRevaluation
of assets TotalRs’000 Rs’000 Rs’000
Deferred tax liabilitiesAt June 30, 2015 (12,809) (24,596) (37,405)Charge to profit or loss (12) - (12)At June 30, 2016 (12,821) (24,596) (37,417)Charge to profit or loss (3,095) (133) (3,228)
At June 30, 2017 (15,916) (24,729) (40,645)
(ii) THE GROUP
Tax losses
Retirement benefit
obligations TotalDeferred tax assets Rs’000 Rs’000 Rs’000At July 1,- as previously stated 904 17,416 18,320 - Prior year adjustment (note 32) - 1,378 1,378 - as restated 904 18,794 19,698 Charge to statement of profit or loss (restated) (904) (1,437) (2,341)Credit to other comprehensive income (restated) - (4,488) (4,488)At June 30, 2016 - 12,869 12,869 Credit to statement of profit or loss 195 (2,695) (2,500)Credit to other comprehensive income - 4,504 4,504
At June 30, 2017 195 14,678 14,873
(iii) Net deferred tax liabilities 2017 2016Rs’000 Rs’000
Deferred tax liabilities (40,645) (37,417)Deferred tax assets 14,873 12,869
(25,772) (24,548)

MAURITIUS OIL REFINERIES LIMITED ANNUAL REPORT 2017
Notes to the Financial StatementsYear Ended June 30, 2017
71
12. DEFERRED TAX ASSETS/(LIABILITIES) (CONT’D)
(iv) THE COMPANY
Accelerated tax
depreciationRevaluation
of assets TotalDeferred tax liabilities Rs’000 Rs’000 Rs’000At June 30, 2015 (1,983) (24,596) (26,579)Credit to statement of profit or loss 417 - 417 At June 30, 2016 (1,566) (24,596) (26,162)Charge to statement of profit or loss (3,028) - (3,028)Charge to other comprehensive income - (133) (133)
At June 30, 2017 (4,594) (24,729) (29,323)
(v) THE COMPANY
Retirement benefit
obligations Deferred tax assets Rs’000At June 30, 2015- as previously stated 14,829 - Prior year adjustment (note 32) 1,378 - as restated 16,207 Charge to profit or loss (restated) (1,385)Charge to other comprehensive income (restated) (3,712)At June 30, 2016 11,110 Charge to profit or loss (2,774)Credit to other comprehensive income 3,799
At June 30, 2017 12,135
Restated
(vi) Net deferred tax liabilities 2017 2016Rs’000 Rs’000
Deferred tax liabilities (29,323) (26,162)Deferred tax assets 12,135 11,110
(17,188) (15,052)
13. INVENTORIES
THE GROUP THE COMPANY
2017 2016 2017 2016 Rs’000 Rs’000 Rs’000 Rs’000
(a) Raw materials 69,596 134,032 54,698 117,855 Finished goods 44,784 52,270 40,044 47,768 Consumables and spare parts 16,250 16,773 9,232 10,052
130,630 203,075 103,974 175,675
(b) The cost of inventories recognised as expense and included in the cost of operations amounted to Rs.973,819,091 (2016: Rs.969,000,981) for the Group and Rs.897,304,736 (2016: Rs.889,751,919) for the Company.
(c) Bank borrowings are secured by floating charges on the assets of the Company, including inventories.

MAURITIUS OIL REFINERIES LIMITED ANNUAL REPORT 2017
Notes to the Financial StatementsYear Ended June 30, 2017
72
14. TRADE AND OTHER RECEIVABLES
THE GROUP THE COMPANY
2017 2016 2017 2016 Rs’000 Rs’000 Rs’000 Rs’000
Trade receivables 98,536 112,087 82,820 100,367 Less provision for impairment (86) - (86) - Trade receivables - net 98,450 112,087 82,734 100,367 Receivables from related parties (note 33) 7,728 6,526 631 598 Loan receivable from related parties (Note 15) - - 1,045 1,126 Advance payments to suppliers 139,872 5,885 139,872 5,885 Other receivables 4,809 3,482 4,777 3,468 Prepayments 4,089 7,764 1,191 5,313
254,948 135,744 230,250 116,757
The carrying amounts of other receivable approximate their fair values.
(a) As of June 30, 2017, trade receivables of Rs. 85,991 (2016: Rs.nil) were impaired for the Group and the Company. The amount of the provision for impairment was Rs. 85,991 (2016: Rs.nil). The individually impaired receivables mainly related to wholesalers, which were in unexpectedly difficult economic situations.
The ageing analysis of these trade receivables is as follows:
THE GROUP ANDTHE COMPANY
2017 2016Rs’000 Rs’000
Over 6 months 86 -
As of June 30, 2017, trade receivables of Rs.4,523,298 (2016: Rs.4,121,594) were past due but not impaired for the Group and the Company. These relate to a number of independent customers for whom there is no recent history of default.
The ageing of these receivables is as follows: THE GROUP ANDTHE COMPANY
2017 2016Rs’000 Rs’000
3 to 6 months 4,523 4,122
(b) The carrying amounts of trade and other receivables are denominated in the following currencies:
THE GROUP THE COMPANY
2017 2016 2017 2016 Rs’000 Rs’000 Rs’000 Rs’000
Mauritian Rupee 248,166 125,362 223,694 106,489 US Dollar 6,556 1,249 6,556 1,249 Euro 226 9,133 - 9,019
254,948 135,744 230,250 116,757
The receivables denominated in US Dollar arise on sales to local customers in this currency. Furthermore, the receivables denominated in Euro pertain mainly to deposits and prepayments.

MAURITIUS OIL REFINERIES LIMITED ANNUAL REPORT 2017
Notes to the Financial StatementsYear Ended June 30, 2017
73
14. TRADE AND OTHER RECEIVABLES (CONT’D)
(c) Movements on the provision for impairment of trade receivables are as follows: THE GROUP ANDTHE COMPANY
2017 2016Rs’000 Rs’000
At July 1, - 151 Receivables written off during the year as uncollectible - (151)Provision for the year 86 - At June 30, 86 -
(d) The other classes within trade and other receivables do not contain impaired assets. The maximum exposure to credit risk at the reporting date is the fair value of each class of receivable mentioned above. The Group does not hold any collateral as security.
15. LOAN RECEIVABLE FROM RELATED PARTIES
THE COMPANY
2017 2016Rs’000 Rs’000
Loan receivable from subsidiary companies (note 33) 3,515 4,608
Analysed as follows: Non-current 2,470 3,482 Current (Note 14) 1,045 1,126
3,515 4,608
Loan receivable from subsidiaries is unsecured and bears interest at the rate of 7.25% p.a (2016: 7.65%).
16. SHARE CAPITAL
THE GROUP ANDTHE COMPANY
2017 2016Rs’000 Rs’000
Authorised40,000,000 ordinary shares of Rs.5 each 200,000 200,000
THE GROUP ANDTHE COMPANY
2017 2016Rs’000 Rs’000
Issued and fully paid33,280,256 ordinary shares of Rs.5 each 166,401 166,401

MAURITIUS OIL REFINERIES LIMITED ANNUAL REPORT 2017
Notes to the Financial StatementsYear Ended June 30, 2017
74
17. REVALUATION SURPLUS AND OTHER RESERVES
THE GROUP THE COMPANYRestated Restated
2017 2016 2017 2016Rs’000 Rs’000 Rs’000 Rs’000
Revaluation surplus (note 17(a)) 86,443 69,208 83,362 66,127 Fair value reserves (note 17(b)) 3,126 3,126 - - Actuarial losses (note 17(c)) (111,696) (86,641) (96,649) (75,121)
(22,127) (14,307) (13,287) (8,994)
(a) Revaluation surplusThe revaluation surplus arises from the revaluation of freehold land and buildings and plant & machinery.
THE GROUP THE COMPANY
2017 2016 2017 2016Rs’000 Rs’000 Rs’000 Rs’000
At July 1, 69,208 69,208 66,127 66,127 Total comprehensive income for the year 17,235 - 17,235 - At June 30, 86,443 69,208 83,362 66,127
(b) Fair value reserves
THE GROUP THE COMPANY
2017 2016 2017 2016Rs’000 Rs’000 Rs’000 Rs’000
At July 1, 2016 and June 30, 2017 3,126 3,126 - -
(c) Actuarial gains/(losses)
THE GROUP THE COMPANY
2017 2016 2017 2016Rs’000 Rs’000 Rs’000 Rs’000
At July 1,- as previously stated (86,248) (108,618) (74,729) (94,191)- Prior year adjustment (note 32) (393) (1,964) (393) (1,964)- as restated (86,641) (110,582) (75,122) (96,155)Total comprehensive income for the year (25,055) 23,941 (21,527) 21,034 At June 30, (111,696) (86,641) (96,649) (75,121)
18. NON-CONTROLLING INTERESTS
THE GROUP
2017 2016Rs’000 Rs’000
At July 1, 28,563 25,215 Changes in ownership interest in subsidiary (562) - Share of total comprehensive income for the year 1,071 5,400 Dividend (2,006) (2,052)At June 30, 27,066 28,563

MAURITIUS OIL REFINERIES LIMITED ANNUAL REPORT 2017
Notes to the Financial StatementsYear Ended June 30, 2017
75
19. BORROWINGS
THE GROUP THE COMPANY
2017 2016 2017 2016Current Rs’000 Rs’000 Rs’000 Rs’000Bank overdrafts 89,249 99,338 80,888 92,285 Bank loan 75,000 - 75,000 - Total borrowings 164,249 99,338 155,888 92,285
(a) Bank overdrafts and bank loan are secured by floating charges on the assets of the Group including property, plant and equipment and inventories (note 5 and 13). The rates of interest on borrowings vary between 3.95% p.a and 6.25% p.a.
(b) The exposure of the Group’s and the Company’s borrowings to interest rate changes and the contractual repricing dates are as follows:
6 months 6 -12 1 - 5 OverTHE GROUP or less months years 5 years Total
Rs’000 Rs’000 Rs’000 Rs’000 Rs’000
At June 30, 2017Total borrowings 164,249 - - - 164,249
At June 30, 2016Total borrowings 99,338 - - - 99,338
THE COMPANY 6 months 6 -12 1 - 5 Overor less months years 5 years Total Rs’000 Rs’000 Rs’000 Rs’000 Rs’000
At June 30, 2017Total borrowings 155,888 - - - 155,888
At June 30, 2016Total borrowings 92,285 - - - 92,285
(c) The effective interest rates at the end of the reporting period were as follows:
THE GROUP THE COMPANY
2017 2016 2017 2016% % % %
Bank overdrafts 6.25 6.65 6.25 6.65 Bank loan 3.95 - 3.95 -
(d) The carrying amounts of the Group’s and the Company’s borrowings are denominated in Mauritian rupees and are not materially different from their fair values.

MAURITIUS OIL REFINERIES LIMITED ANNUAL REPORT 2017
Notes to the Financial StatementsYear Ended June 30, 2017
76
20. RETIREMENT BENEFIT OBLIGATIONS
THE GROUP THE COMPANYRestated Restated
2017 2016 2017 2016Rs’000 Rs’000 Rs’000 Rs’000
Amount recognised in the statement of financial position as non-current liabilities:-Pension benefits (note (a) (iii)) 76,525 65,988 61,213 54,627 -Other post retirement benefits (note (b) (i)) 19,892 19,807 19,688 19,444
96,417 85,795 80,901 74,071
Amount charged to profit or loss:-Pension benefits (note (a) (vi)) 14,644 17,096 11,738 13,905 -Other post retirement benefits (note (b) (ii)) 2,410 1,730 2,330 1,650
17,054 18,826 14,068 15,555
Amount charged/(credited) to other comprehensive income:-Pension benefits (note 20 (a)(vii)) 29,788 (29,239) 24,848 (24,682)-Other post retirement benefits (note (b) (ii)) 240 (685) 479 (64)
30,028 (29,924) 25,327 (24,746)
(a) Pension benefits
(i) The assets of the fund are held independently and administered by Swan Pensions Limited.
The most recent actuarial valuations of plan assets and the present value of the defined benefit obligations were carried out at June 30, 2017 by Aon Hewitt Ltd (Actuarial Valuer). The present value of the defined benefit obligations, and the related current service cost and past service cost, were measured using the Projected Unit Credit Method.
(ii) The amounts recognised in the statement of financial position are as follows:
THE GROUP THE COMPANYRestated Restated
2017 2016 2017 2016Rs’000 Rs’000 Rs’000 Rs’000
Present value of funded obligations 257,542 245,783 208,354 202,116 Fair value of plan assets (181,017) (179,795) (147,141) (147,489)Liability in the statement of financial position 76,525 65,988 61,213 54,627

MAURITIUS OIL REFINERIES LIMITED ANNUAL REPORT 2017
Notes to the Financial StatementsYear Ended June 30, 2017
77
20. RETIREMENT BENEFIT OBLIGATIONS (CONT’D)
(a) Pension benefits (cont’d)
(iii) The movements in the statement of financial position are as follows:
THE GROUP THE COMPANY
2017 2016 2017 2016Rs’000 Rs’000 Rs’000 Rs’000
At July 1,- as previously stated 57,372 95,273 46,011 78,214 - Prior year adjustment (note 32) 8,616 9,190 8,616 9,190 - as restated 65,988 104,463 54,627 87,404 Charged to profit or loss (note 25) 14,644 17,096 11,738 13,905 Charged/(credited) to other comprehensive income 29,788 (29,239) 24,848 (24,682)Contributions paid (33,895) (26,332) (30,000) (22,000)At June 30, 76,525 65,988 61,213 54,627
(iv) The movement in the defined benefit obligations over the year is as follows:
THE GROUP THE COMPANY
2017 2016 2017 2016Rs’000 Rs’000 Rs’000 Rs’000
At July 1,- as previously stated 237,167 251,380 193,500 205,672 - Prior year adjustment (note 32) 8,616 9,190 8,616 9,190 - as restated 245,783 260,570 202,116 214,862 Current service cost 9,900 10,689 7,725 8,543 Interest cost 17,039 17,869 13,899 14,735 Actuarial losses/(gains) 22,715 (32,554) 18,825 (27,137)Benefits paid (37,895) (10,791) (34,211) (8,887)At June 30, 257,542 245,783 208,354 202,116
(v) The movement in the fair value of plan assets of the year is as follows:
THE GROUP THE COMPANY
2017 2016 2017 2016Rs’000 Rs’000 Rs’000 Rs’000
At July 1, 179,795 156,107 147,489 127,458 Interest income 12,295 11,462 9,886 9,373 Return on plan assets excluding interest income (7,073) (3,315) (6,023) (2,455)Employer contributions 33,895 26,332 30,000 22,000 Benefits paid (37,895) (10,791) (34,211) (8,887)At June 30, 181,017 179,795 147,141 147,489

MAURITIUS OIL REFINERIES LIMITED ANNUAL REPORT 2017
Notes to the Financial StatementsYear Ended June 30, 2017
78
20. RETIREMENT BENEFIT OBLIGATIONS (CONT’D)
(a) Pension benefits (cont’d)
(vi) The amounts recognised in profit or loss are as follows:THE GROUP THE COMPANY
2017 2016 2017 2016Rs’000 Rs’000 Rs’000 Rs’000
Current service cost 9,900 10,689 7,725 8,543 Interest cost 4,744 6,407 4,013 5,362 Total included in employee benefit expense 14,644 17,096 11,738 13,905
Total included in employee benefit expense can be analysed as follows: THE GROUP THE COMPANY
2017 2016 2017 2016Included in: Rs’000 Rs’000 Rs’000 Rs’000- cost of operations 7,405 10,223 5,937 7,033 - distribution costs 1,707 1,620 1,367 1,620 - administrative expenses 5,531 5,252 4,433 5,252
14,644 17,096 11,738 13,905
(vii) The amounts recognised in other comprehensive income are as follows:THE GROUP THE COMPANY
2017 2016 2017 2016Rs’000 Rs’000 Rs’000 Rs’000
Liability experience losses/(gains) 5,647 (3,161) 5,328 (10,558)Actuarial losses/(gains) arising from changes in financial assumptions 17,068 (29,393) 13,497 (16,579)Actuarial (gains)/losses 22,715 (32,554) 18,825 (27,137)Return on plan assets excluding interest income 7,073 3,315 6,023 2,455
29,788 (29,239) 24,848 (24,682)
(viii) The assets in the plan were:
THE GROUP THE COMPANY
2017 2016 2017 2016 % % % %
Qualifying insurance policies 100 100 100 100
(ix) The funding policy is to pay contributions to an external legal entity at the rate recommended by the Group’s actuary. Expected contributions to post employment benefit plans for the year ending June 30, 2018 are Rs.35,699,000 for the Group and Rs.31,570,000 for the Company.
(x) The weighted average duration of the defined benefit obligations for the Company at the end of the reporting period is 17 years (2016: 16 years).

MAURITIUS OIL REFINERIES LIMITED ANNUAL REPORT 2017
Notes to the Financial StatementsYear Ended June 30, 2017
79
20. RETIREMENT BENEFIT OBLIGATIONS (CONT’D)
(a) Pension benefits (cont’d)
(xi) The principal actuarial assumptions used for accounting purposes were:
THE GROUP AND THE COMPANY
2017 2016% %
Discount rate 6.5 7.5Future salary increases 5.0/6.0 6.0/7.0Future pension increases 0.0/3.0 0.0/3.0
(xii) Sensitivity analysis on defined benefit obligations at end of the reporting date:THE GROUP THE COMPANY
Restated Restated
2017 2016 2017 2016 Rs’000 Rs’000 Rs’000 Rs’000
- Increase due to 1% decrease in discount rate 46,464 42,509 37,800 34,894 - Decrease due to 1% increase in discount rate 37,181 33,835 30,221 28,087
An increase/decrease of 1% in other principal actuarial assumptions would not have a material impact on defined benefit obligations at the end of the reporting period.
(xiii) The plan exposes the Group to normal risks associated with defined benefit pension plans, such as investment, interest, longevity and salary risks.
Investment risk (where the plan is funded)The plan liability is calculated using a discount rate determined by reference to government bond yields; if the return on plan assets is below this rate, it will create a plan deficit and if it is higher, it will create a plan surplus.
Interest riskA decrease in the bond interest rate will increase the plan liability; however, this may be partially offset by an increase in the return on the plan’s debt investments and a decrease in inflationary pressures on salary and pension increases.
Longevity risk (where the plan is funded and an annuity is paid over life expectancy)The plan liability is calculated by reference to the best estimate of the mortality of plan participants both during and after their employment. An increase in the life expectancy of the plan participants will increase the plan liability.
Salary riskThe plan liability is calculated by reference to the future projected salaries of plan participants. As such, an increase in the salary of the plan participants above the assumed rate will increase the plan liability whereas an increase below the assumed rate will decrease the liability.

MAURITIUS OIL REFINERIES LIMITED ANNUAL REPORT 2017
Notes to the Financial StatementsYear Ended June 30, 2017
80
20. RETIREMENT BENEFIT OBLIGATIONS (CONT’D)
(a) Pension benefits (cont’d)
Salary risk (cont’d)The Group had a residual obligation imposed by the Employment Rights Act 2008 on top of its defined contribution plan. It is therefore particularly exposed to investment under-performance of the defined contribution plan.
There has been no plan amendment, curtailment or settlement during the year, except for some data adjustments.
(b) Other post retirement benefits
Other post retirement benefits comprise mainly of gratuity on retirement payable under the Employment Rights Act 2008, those which are not sufficiently covered under the pension plan and unfunded pensioners.
(i) The amounts recognised in the statement of financial position are as follows:THE GROUP THE COMPANY
2017 2016 2017 2016 Rs’000 Rs’000 Rs’000 Rs’000
Retirement gratuity 1,969 2,288 1,765 1,925 Unfunded pensioners 17,923 17,519 17,923 17,519
19,892 19,807 19,688 19,444
(ii) The movements in the statement of financial position are analysed as follows: THE GROUP THE COMPANY
2017 2016 2017 2016 Rs’000 Rs’000 Rs’000 Rs’000
At July 1, 19,807 21,559 19,444 20,655 Charged to profit or loss (Note 25) 2,410 1,730 2,330 1,650 Charged/(credited) to other comprehensive income 240 (685) 479 (64)Benefits paid (2,565) (2,797) (2,565) (2,797)At June 30, 19,892 19,807 19,688 19,444
(iii) The movement in other post retirement benefits over the year is as follows:THE GROUP THE COMPANY
2017 2016 2017 2016 Rs’000 Rs’000 Rs’000 Rs’000
At July 1, 19,807 21,559 19,444 20,655 Current service cost 200 228 146 211 Interest cost 1,391 1,502 1,364 1,439 Past service cost 820 - 820 - Benefits paid (2,565) (2,797) (2,565) (2,797)Liability experience (gain)/loss (714) (440) (554) 180 Liability loss/(gain) due to change in financial assumptions 953 (245) 1,033 (244)At June 30, 19,892 19,807 19,688 19,444

MAURITIUS OIL REFINERIES LIMITED ANNUAL REPORT 2017
Notes to the Financial StatementsYear Ended June 30, 2017
81
20. RETIREMENT BENEFIT OBLIGATIONS (CONT’D)
(b) Other post retirement benefits (cont’d)
(iv) The funding policy is to pay benefits out of the reporting entity’s cash flow as and when due. Expected contributions to post employment benefit plans for the year ending June 30, 2018 are Rs.2,931,000 for the Group and Rs.2,931,000 for the Company.
(v) The weighted average duration of the defined benefit obligations for the Company at the end of the reporting period is 17 years (2016: 16 years).
(vi) The principal actuarial assumptions used for accounting purposes were: THE GROUP AND
THE COMPANY
2017 2016% %
Discount rate 6.5 7.5Future salary increases 5.5/6.5 6.0/7.0Future pension increases 0.0 0.0
(vii) Sensitivity analysis on defined benefit obligations at end of the reporting date:THE GROUP THE COMPANY
2017 2016 2017 2016 Rs’000 Rs’000 Rs’000 Rs’000
- Increase due to 1% decrease in discount rate 1,755 1,712 1,771 1,691 - Decrease due to 1% increase in discount rate 1,428 1,106 1,461 1,071
(viii) An increase/decrease of 1% in other principal actuarial assumptions would not have a material impact on retirement gratuity at the end of the reporting period.
The sensitivity analysis above has been determined based on a method that extrapolates the impact on retirement gratuity as a result of reasonable changes in key assumptions occurring at the end of the reporting period.
The sensitivity analysis may not be representative of the actual change in the retirement gratuity as it is unlikely that the change in assumptions would occur in isolation of one another as some of the assumptions may be correlated.
21. TRADE AND OTHER PAYABLES
THE GROUP THE COMPANY
2017 2016 2017 2016 Rs’000 Rs’000 Rs’000 Rs’000
Trade payables 15,720 18,662 13,041 16,664 Other payables and accruals 27,350 32,135 24,117 25,682 Amount due to related parties (note 33) 6,781 2,662 312 219
49,851 53,459 37,470 42,565
The carrying amounts of trade and other payables approximate their fair values.

MAURITIUS OIL REFINERIES LIMITED ANNUAL REPORT 2017
Notes to the Financial StatementsYear Ended June 30, 2017
82
22. INCOME TAX
THE GROUP THE COMPANY
2017 2016 2017 2016 Rs’000 Rs’000 Rs’000 Rs’000
(a) Statement of financial position- Current tax assets (424) - (424) - - Current tax liabilities 1,233 2,678 - 2,082
809 2,678 (424) 2,082
Statement of financial positionAt July 1, 2,678 1,375 2,082 1,278 Current tax on the adjusted profit for the year at15% (2016: 15%) 5,574 6,636 3,999 5,896 Tax paid during the year (7,877) (5,333) (6,939) (5,092)Under provision in previous year 434 - 434 - At June 30, 809 2,678 (424) 2,082
(b) Statement of profit or loss Current tax on the adjusted profit for the yearat 15% (2016: 15%) 5,574 6,636 3,999 5,896 Under provision in previous year 434 - 434 -
6,008 6,636 4,433 5,896 Deferred tax (note 12(c)) 2,687 2,353 2,894 969 Tax charge 8,695 8,989 7,327 6,865
(c) Tax reconciliationThe tax on the Group’s and Company’s profit before taxation differs from the theoretical amount that would arise using the basic tax rate of the Group and the Company as follows:
THE GROUP THE COMPANYRestated Restated
2017 2016 2017 2016 Rs’000 Rs’000 Rs’000 Rs’000
Profit before taxation 55,616 62,036 50,530 51,172
Tax calculated at 15% (2016: 15%) 8,342 9,305 7,580 7,676 Income not subject to tax (317) (699) (924) (1,048)Expenses not deductible for tax purposes 236 498 237 237 Under provision in previous year 434 - 434 - Utilisation of previously unrecognised tax losses - (115) - - Tax charge 8,695 8,989 7,327 6,865

MAURITIUS OIL REFINERIES LIMITED ANNUAL REPORT 2017
Notes to the Financial StatementsYear Ended June 30, 2017
83
23.
SE
GM
EN
T IN
FOR
MA
TIO
N
(a)
The
Gro
up h
as th
ree
repo
rtin
g se
gmen
ts: O
il pr
oduc
ts, M
etal
Can
s &
pla
stic
con
tain
ers
and
impo
rted
food
pro
duct
s.
“Oth
ers”
com
pris
e of
oth
er b
usin
ess
activ
ities
and
ope
ratin
g se
gmen
ts th
at a
re n
ot re
port
able
. Rev
enue
incl
uded
in th
is s
egm
ent c
onsi
sts
of R
s.16
,043
,412
(201
6:
Rs.
17,5
56,8
91).
The
acco
untin
g po
licie
s of
the
oper
atin
g se
gmen
ts a
re th
e sa
me
as th
ose
desc
ribed
in th
e su
mm
ary
of s
igni
fican
t acc
ount
ing
polic
ies.
Mau
ritiu
s O
il R
efine
ries
Lim
ited
eval
uate
s pe
rform
ance
on
the
basi
s of
pro
fit o
r lo
ss fr
om o
pera
tions
bef
ore
tax
expe
nse.
Mau
ritiu
s O
il R
efine
ries
Lim
ited
acco
unts
for
inte
rseg
men
ts s
ales
and
tran
sfer
s as
if th
e sa
les
or th
e tr
ansf
ers
wer
e to
third
par
ties,
i.e.
cur
rent
mar
ket p
rices
.
(b)
The
segm
ent r
esul
ts fo
r th
e ye
ar e
nded
Jun
e 30
, 201
7 ar
e as
follo
ws:
Oil
Pro
duct
sM
etal
Can
s &
plas
tic
cont
aine
rsIm
port
ed fo
od p
rodu
cts
Oth
ers
Tota
lR
esta
ted
Res
tate
d
2017
2016
2017
2016
2017
2016
2017
2016
2017
2016
Rs’
000
Rs’
000
Rs’
000
Rs’
000
Rs’
000
Rs’
000
Rs’
000
Rs’
000
Rs’
000
Rs’
000
Tota
l seg
men
t rev
enue
994
,819
9
98,9
44
106
,536
1
11,0
90
123
,270
1
17,2
22
22,
025
26,
676
1,2
46,6
50
1,2
53,9
32
Inte
r-se
gmen
t rev
enue
-
-
(231
) (2
73)
-
-
(5,9
82)
(9,1
19)
(6,2
13)
(9,3
92)
Rev
enue
from
ext
erna
l cus
tom
ers
994
,819
9
98,9
44
106
,305
1
10,8
17
123
,270
1
17,2
22
16,
043
17,
557
1,2
40,4
37
1,2
44,5
40
Seg
men
t res
ult
26,
675
30,
752
8,7
69
7,1
77
21,
119
17,
546
1,3
50
4,9
88
57,
913
60,
463
Gai
n on
bar
gain
pur
chas
e 9
6 -
-
-
-
-
-
-
9
6 -
Fa
ir va
lue
gain
/(los
s) o
n re
valu
atio
n of
inve
stm
ent p
rope
rtie
s -
-
-
-
-
-
-
1
,953
-
1
,953
N
et fi
nanc
e co
sts
(2,0
30)
(2,6
53)
(414
) (3
37)
(925
) (7
01)
(84)
-
(3,4
53)
(3,6
91)
Sha
re o
f pro
fit o
f ass
ocia
te -
-
1
,060
3
,311
-
-
-
-
1
,060
3
,311
P
rofit
bef
ore
taxa
tion
24,
741
28,
099
9,4
15
10,
151
20,
194
16,
845
1,2
66
6,9
41
55,
616
62,
036
Taxa
tion
(4,1
59)
(4,2
33)
(1,2
15)
(1,2
51)
(3,1
68)
(2,6
32)
(153
) (8
73)
(8,6
95)
(8,9
89)
Pro
fit fo
r th
e ye
ar 2
0,58
2 2
3,86
6 8
,200
8
,900
1
7,02
6 1
4,21
3 1
,113
6
,068
4
6,92
1 5
3,04
7
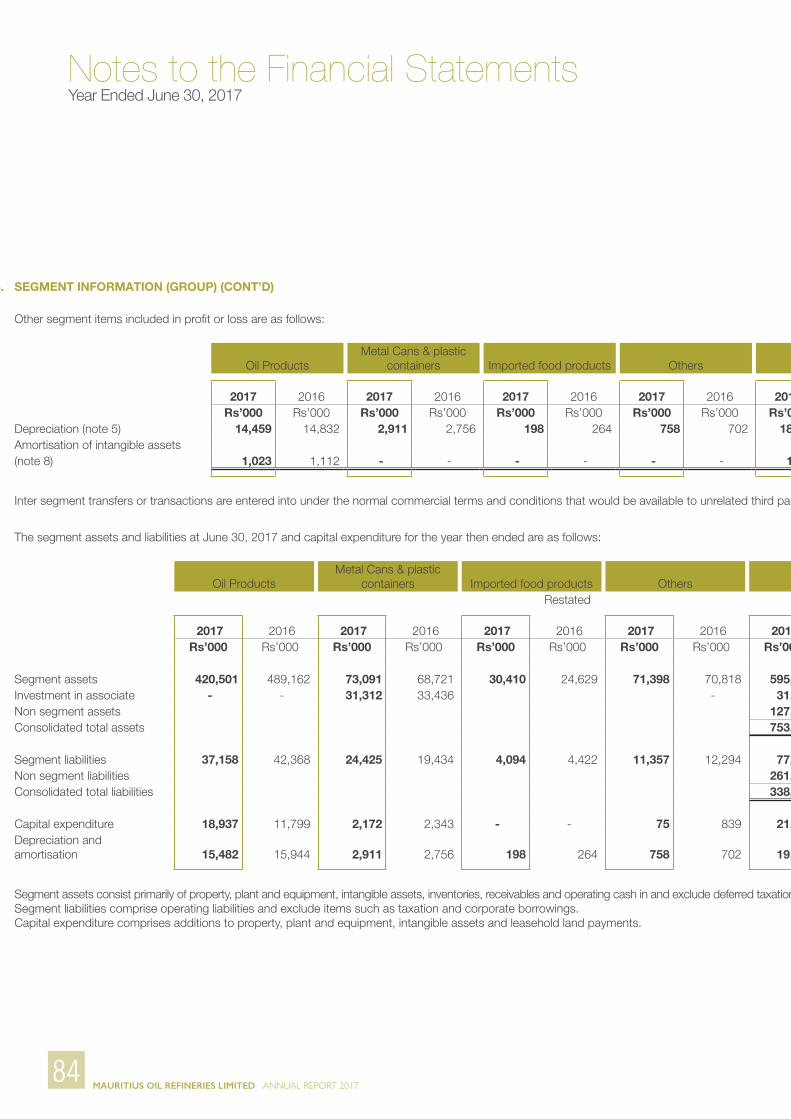
MAURITIUS OIL REFINERIES LIMITED ANNUAL REPORT 2017
Notes to the Financial StatementsYear Ended June 30, 2017
84
23. SEGMENT INFORMATION (GROUP) (CONT’D)
Other segment items included in profit or loss are as follows:
Oil ProductsMetal Cans & plastic
containers Imported food products Others Total
2017 2016 2017 2016 2017 2016 2017 2016 2017 2016Rs’000 Rs’000 Rs’000 Rs’000 Rs’000 Rs’000 Rs’000 Rs’000 Rs’000 Rs’000
Depreciation (note 5) 14,459 14,832 2,911 2,756 198 264 758 702 18,326 18,554 Amortisation of intangible assets(note 8) 1,023 1,112 - - - - - - 1,023 1,112
Inter segment transfers or transactions are entered into under the normal commercial terms and conditions that would be available to unrelated third parties.
The segment assets and liabilities at June 30, 2017 and capital expenditure for the year then ended are as follows:
Oil ProductsMetal Cans & plastic
containers Imported food products Others TotalRestated Restated
2017 2016 2017 2016 2017 2016 2017 2016 2017 2016Rs’000 Rs’000 Rs’000 Rs’000 Rs’000 Rs’000 Rs’000 Rs’000 Rs’000 Rs’000
Segment assets 420,501 489,162 73,091 68,721 30,410 24,629 71,398 70,818 595,400 653,330 Investment in associate - - 31,312 33,436 - 31,312 33,436 Non segment assets 127,175 2,951 Consolidated total assets 753,887 689,717
Segment liabilities 37,158 42,368 24,425 19,434 4,094 4,422 11,357 12,294 77,034 78,518 Non segment liabilities 261,108 187,544 Consolidated total liabilities 338,142 266,062
Capital expenditure 18,937 11,799 2,172 2,343 - - 75 839 21,184 14,981 Depreciation and amortisation 15,482 15,944 2,911 2,756 198 264 758 702 19,349 19,666
Segment assets consist primarily of property, plant and equipment, intangible assets, inventories, receivables and operating cash in and exclude deferred taxation and investments.Segment liabilities comprise operating liabilities and exclude items such as taxation and corporate borrowings. Capital expenditure comprises additions to property, plant and equipment, intangible assets and leasehold land payments.

MAURITIUS OIL REFINERIES LIMITED ANNUAL REPORT 2017
Notes to the Financial StatementsYear Ended June 30, 2017
85
23. SEGMENT INFORMATION (GROUP) (CONT’D)
Other segment items included in profit or loss are as follows:
Oil ProductsMetal Cans & plastic
containers Imported food products Others Total
2017 2016 2017 2016 2017 2016 2017 2016 2017 2016Rs’000 Rs’000 Rs’000 Rs’000 Rs’000 Rs’000 Rs’000 Rs’000 Rs’000 Rs’000
Depreciation (note 5) 14,459 14,832 2,911 2,756 198 264 758 702 18,326 18,554 Amortisation of intangible assets(note 8) 1,023 1,112 - - - - - - 1,023 1,112
Inter segment transfers or transactions are entered into under the normal commercial terms and conditions that would be available to unrelated third parties.
The segment assets and liabilities at June 30, 2017 and capital expenditure for the year then ended are as follows:
Oil ProductsMetal Cans & plastic
containers Imported food products Others TotalRestated Restated
2017 2016 2017 2016 2017 2016 2017 2016 2017 2016Rs’000 Rs’000 Rs’000 Rs’000 Rs’000 Rs’000 Rs’000 Rs’000 Rs’000 Rs’000
Segment assets 420,501 489,162 73,091 68,721 30,410 24,629 71,398 70,818 595,400 653,330 Investment in associate - - 31,312 33,436 - 31,312 33,436 Non segment assets 127,175 2,951 Consolidated total assets 753,887 689,717
Segment liabilities 37,158 42,368 24,425 19,434 4,094 4,422 11,357 12,294 77,034 78,518 Non segment liabilities 261,108 187,544 Consolidated total liabilities 338,142 266,062
Capital expenditure 18,937 11,799 2,172 2,343 - - 75 839 21,184 14,981 Depreciation and amortisation 15,482 15,944 2,911 2,756 198 264 758 702 19,349 19,666
Segment assets consist primarily of property, plant and equipment, intangible assets, inventories, receivables and operating cash in and exclude deferred taxation and investments.Segment liabilities comprise operating liabilities and exclude items such as taxation and corporate borrowings. Capital expenditure comprises additions to property, plant and equipment, intangible assets and leasehold land payments.
23. SEGMENT INFORMATION (GROUP) (CONT’D)
(c) Geographical information
The Group’s activities and assets are based in Mauritius.
Revenue from external customers
Non-current assets
Restated
2017 2016 2017 2016Rs’000 Rs’000 Rs’000 Rs’000
Mauritius 1,240,437 1,244,540 367,122 348,485
(i) There are no revenue from external customers attributable to individual foreign countries during the year (2016: Rs.nil).
Sales revenue is based on the country in which the customer is located. Total assets are shown by the geographical area in which the assets are located.
(d) Analysis of sales
2017 2016Rs’000 Rs’000
Sale of goods 1,232,796 1,237,379 Sale of services 2,824 2,824 Rental income 4,817 4,337
1,240,437 1,244,540
For method of recognition of revenue, see note 2(n).
24. EXPENSES BY NATURE
THE GROUP THE COMPANYRestated Restated
2017 2016 2017 2016Rs’000 Rs’000 Rs’000 Rs’000
Raw materials and consumables used 973,819 969,001 897,305 889,752 Employee benefit expense (note 25) 123,411 130,519 95,583 101,808 Depreciation (note 5(g)) 18,326 18,554 14,657 15,096 Factory repairs and maintenance 8,697 8,876 5,247 7,277 Motor vehicle repairs 1,357 1,735 1,191 1,114 Changes in inventories of finished goods 7,486 7,779 7,724 7,305 Advertising 11,945 9,978 11,945 9,978 CSR contribution 820 635 772 602 Amortisation of intangible assets (note 8) 1,023 1,112 1,023 1,112 Office expenses 3,159 3,484 3,159 3,485 General expenses 8,930 9,720 8,691 9,486 Licences 2,355 2,591 2,242 2,478 Distribution expenses 3,124 3,096 3,124 3,096 Miscellaneous expenses 21,340 20,139 20,993 18,353 Total cost of operations, distribution costs and administrative expenses 1,185,792 1,187,219 1,073,656 1,070,942
Miscellaneous expenses refer to other expenses incurred in the day to day operation of the Group and the Company.

MAURITIUS OIL REFINERIES LIMITED ANNUAL REPORT 2017
Notes to the Financial StatementsYear Ended June 30, 2017
86
25. EMPLOYEE BENEFIT EXPENSE
THE GROUP THE COMPANYRestated Restated
2017 2016 2017 2016Rs’000 Rs’000 Rs’000 Rs’000
Wages and salaries including termination benefits 101,203 106,580 77,287 82,043 Social security costs 4,387 4,357 3,461 3,454 Pension - defined contribution plans 767 756 767 756 Pension - defined benefit plans (note 20(a)(iii)) 14,644 17,096 11,738 13,905 Pension- other post retirement benefit (note 20(b)(ii)) 2,410 1,730 2,330 1,650
123,411 130,519 95,583 101,808
26. INVESTMENT AND OTHER INCOME
THE GROUP THE COMPANY
2017 2016 2017 2016Rs’000 Rs’000 Rs’000 Rs’000
Interest income - - 314 340
Dividend income - Listed - - 1,774 2,258 - DEM quoted - - - - - Unquoted - - 3,605 3,560
- - 5,379 5,818
- - 5,693 6,158
27. NET FINANCE COSTS
THE GROUP THE COMPANY
2017 2016 2017 2016 Rs’000 Rs’000 Rs’000 Rs’000
Net foreign exchange (losses)/gains (256) 314 (256) 314 Interest expense:- Bank overdrafts (5,472) (4,428) (4,975) (4,041)- Bank loans repayable by instalments (2,277) (1,765) (2,277) (1,765)- Finance leases - (17) - -
(7,749) (6,210) (7,252) (5,806)Interest transferred to cost of operations 4,552 2,205 4,552 2,205
(3,197) (4,005) (2,700) (3,601)
(3,453) (3,691) (2,956) (3,287)

MAURITIUS OIL REFINERIES LIMITED ANNUAL REPORT 2017
Notes to the Financial StatementsYear Ended June 30, 2017
87
28. PROFIT FOR THE YEAR
THE GROUP THE COMPANYRestated Restated
2017 2016 2017 2016Profit for the year is arrived at after Rs’000 Rs’000 Rs’000 Rs’000Crediting:Profit on disposal of property, plant and equipment 840 439 536 253 and charging:Depreciation on property, plant and equipment- owned assets 18,127 18,355 14,657 15,096 - leased assets under finance leases 199 199 - - Amortisation of intangible assets 1,023 1,112 1,023 1,112 Cost of inventories consumed 973,819 969,001 897,305 889,752 Employee benefit expense (note 25) 123,411 130,519 95,583 101,808
29. EARNINGS PER SHARE
THE GROUP THE COMPANYRestated Restated
2017 2016 2017 2016 Net profit attributableto owners of the parent Rs’000 43,973 49,723 43,203 44,307
Number of ordinary shares in issue (in thousand) 33,280 33,280 33,280 33,280
Earnings per share Rs. 1.32 1.49 1.30 1.33
30. DIVIDENDS
THE GROUP AND THE COMPANY
2017 2016 Rs’000 Rs’000
Dividend declared during the year can be analysed as follows:Interim dividend of Re.0.95 per share paid in December 2016(December 2015: Re.0.95) 31,616 31,616 Final dividend of Re.0.35 per share paid in June 2017 (June 2016: Re 0.35 per share) 11,648 11,648
43,264 43,264
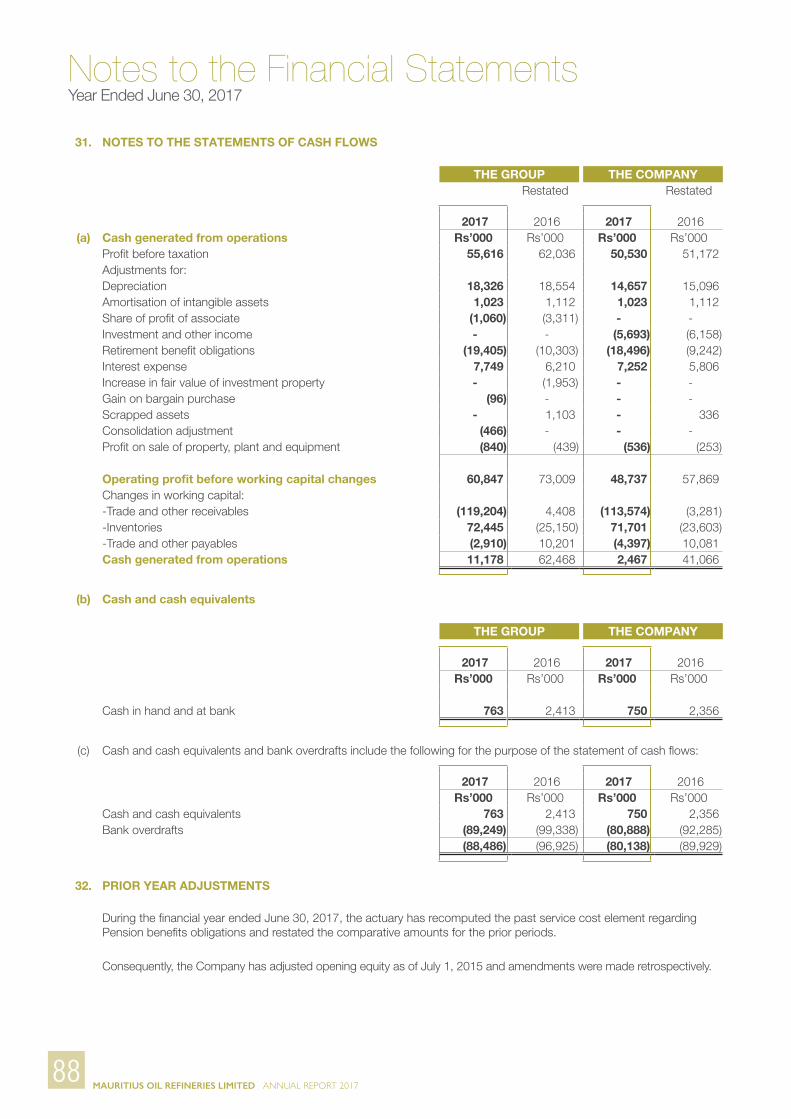
MAURITIUS OIL REFINERIES LIMITED ANNUAL REPORT 2017
Notes to the Financial StatementsYear Ended June 30, 2017
88
31. NOTES TO THE STATEMENTS OF CASH FLOWS
THE GROUP THE COMPANYRestated Restated
2017 2016 2017 2016 (a) Cash generated from operations Rs’000 Rs’000 Rs’000 Rs’000
Profit before taxation 55,616 62,036 50,530 51,172 Adjustments for:Depreciation 18,326 18,554 14,657 15,096 Amortisation of intangible assets 1,023 1,112 1,023 1,112 Share of profit of associate (1,060) (3,311) - - Investment and other income - - (5,693) (6,158)Retirement benefit obligations (19,405) (10,303) (18,496) (9,242)Interest expense 7,749 6,210 7,252 5,806 Increase in fair value of investment property - (1,953) - - Gain on bargain purchase (96) - - - Scrapped assets - 1,103 - 336 Consolidation adjustment (466) - - - Profit on sale of property, plant and equipment (840) (439) (536) (253)
Operating profit before working capital changes 60,847 73,009 48,737 57,869 Changes in working capital:-Trade and other receivables (119,204) 4,408 (113,574) (3,281)-Inventories 72,445 (25,150) 71,701 (23,603)-Trade and other payables (2,910) 10,201 (4,397) 10,081 Cash generated from operations 11,178 62,468 2,467 41,066
(b) Cash and cash equivalents
THE GROUP THE COMPANY
2017 2016 2017 2016 Rs’000 Rs’000 Rs’000 Rs’000
Cash in hand and at bank 763 2,413 750 2,356
(c) Cash and cash equivalents and bank overdrafts include the following for the purpose of the statement of cash flows:
2017 2016 2017 2016 Rs’000 Rs’000 Rs’000 Rs’000
Cash and cash equivalents 763 2,413 750 2,356 Bank overdrafts (89,249) (99,338) (80,888) (92,285)
(88,486) (96,925) (80,138) (89,929)
32. PRIOR YEAR ADJUSTMENTS
During the financial year ended June 30, 2017, the actuary has recomputed the past service cost element regarding Pension benefits obligations and restated the comparative amounts for the prior periods.
Consequently, the Company has adjusted opening equity as of July 1, 2015 and amendments were made retrospectively.

MAURITIUS OIL REFINERIES LIMITED ANNUAL REPORT 2017
Notes to the Financial StatementsYear Ended June 30, 2017
89
32. PRIOR YEAR ADJUSTMENTS (CONT’D)
THE GROUPThe effects on the statement of financial position were as follows:
Retirement benefit
obligationsDeferred
tax liabilities
Revaluation surplus
and other reserves
Retained earnings
Rs ‘000 Rs ‘000 Rs ‘000 Rs ‘000Balance as reported at July 1, 2015- as previously stated 116,832 19,929 (36,284) 241,756 - effect of recomputing past service cost of pension benefits obligations 9,190 (1,378) (1,964) (5,848)- as restated 126,022 18,551 (38,248) 235,908
Balance as reported at July 1, 2016- as previously stated 77,179 26,084 (13,913) 249,929 - effect of recomputing past service cost of pension benefits obligations on 2015 figures 9,190 (1,378) (1,964) (5,848)- effect of recomputing past service cost of pension benefits obligations on 2016 figures (574) 86 1,570 (1,083)- as restated 85,795 24,792 (14,307) 242,998
THE COMPANY The effects on the statement of financial position were as follows:
Retirement benefit
obligationsDeferred
tax liabilities
Revaluation surplus
and other reserves
Retained earnings
Rs ‘000 Rs ‘000 Rs ‘000 Rs ‘000Balance as reported at July 1, 2015- as previously stated 98,869 11,749 (28,064) 156,909 - effect of recomputing past service cost of pension benefits obligations 9,190 (1,378) (1,964) (5,848)- as restated 108,059 10,371 (30,028) 151,061
Balance as reported at July 1, 2015- as previously stated 65,455 16,344 (8,601) 159,666 - effect of recomputing past service cost of pension benefits obligations on 2015 figures 9,190 (1,378) (1,964) (5,848)- effect of recomputing past service cost of pension benefits obligations on 2016 figures (574) 86 1,571 (1,083)- as restated 74,071 15,052 (8,994) 152,735
The effect on the income statement is as follows: The Groupand the
Company 2016: Rs ‘000
Increase in administrative expenses (1,274)Decrease of income tax expense 191 Decrease in profit (1,083)
The effect on the statement of other comprehensive income is as follows: The Groupand the
Company 2016: Rs ‘000
Increase in remeasurement of defined benefit obligations 1,847 Increase in income tax relating to components of other comprehensive income (277)Increase in other comprehensive income 1,570

MAURITIUS OIL REFINERIES LIMITED ANNUAL REPORT 2017
Notes to the Financial StatementsYear Ended June 30, 2017
90
33. RELATED PARTY TRANSACTIONS
Purchase of goods or
Sale of goods or Loan
Amount owed by related
Amount owed to related
(a) THE GROUP services services payable parties partiesRs’000 Rs’000 Rs’000 Rs’000 Rs’000
Year ended June 30, 2017Associate 35,456 14,858 - 2,280 4,816 Enterprises in which directors havesignificant influence 1,276 49,108 - 5,448 1,965
36,732 63,966 - 7,728 6,781
Year ended June 30, 2016Associate 42,153 15,709 - 2,045 2,662 Enterprises in which directors havesignificant influence 125 50,154 - 4,481 -
42,278 65,863 - 6,526 2,662
Purchase
of goods orSale a of goods or Loan
Amount owed by related
Amount owed to related
(b) THE COMPANY services services receivable parties partiesRs’000 Rs’000 Rs’000 Rs’000 Rs’000
Year ended June 30, 2017Subsidiaries 6,212 7,330 3,515 631 312 Associate 1,493 1,031 - - -
7,705 8,361 3,515 631 312
Year ended June 30, 2016Subsidiaries 9,391 8,052 4,608 598 170 Associate 2,037 1,059 - - 49
11,428 9,111 4,608 598 219

MAURITIUS OIL REFINERIES LIMITED ANNUAL REPORT 2017
Notes to the Financial StatementsYear Ended June 30, 2017
91
33. RELATED PARTY TRANSACTIONS (CONT’D)
(c) (i) The above transactions have been made on normal commercial terms and in the normal course of business.
(ii) Loan receivable from subsidiary bears interest rate of PLR + 1% (2015: PLR + 1%) per annum and is repayable at call.
(iii) For the year ended June 30, 2017, the Group and the Company have not recorded any impairment of receivables relating to amounts owed by related parties (2016: nil). This assessment is undertaken each financial year through examining the financial position of the related party and the market in which the related party operates.
(d) Key management personnel compensation, including directors remuneration and benefits
THE GROUP THE COMPANY Restated Restated
2017 2016 2017 2016 Rs’000 Rs’000 Rs’000 Rs’000
Salaries and short term employee benefits 25,348 24,552 24,285 24,010 Post employment benefits 2,565 2,797 2,565 2,797
27,913 27,349 26,850 26,807
34. CONTINGENCIES
(a) Contingent liabilities
At June 30, 2017, the Company had contingent liabilities in respect of bank and other guarantees and other matters arising in the ordinary course of business from which it is anticipated that no material liabilities would arise.
(b) Capital commitments
No capital expenditure were contracted for at the end of the reporting period but not yet incurred.
(c) Operating lease
(i) Property, plant and equipmentAs stated in note 6 (b), land is leased from Mauritius Ports Authority (MPA) on which the Company’s premises is constructed. The lease agreement is in respect of 20,472.4 m2 of land.
The lease agreement in respect of 3,698 m2 of land on lease from MPA, is due for renewal as from July 01, 2011.The company has agreed to the terms and conditions of a new lease for the plot of land of 3,698 m2 with the MPA. The agreement will be signed in the near future.
Operating lease commitmentsThe future minimum lease payments under non-cancellable operating lease are as follows:
THE COMPANY
2017 2016Rs’000 Rs’000
Within one year 2,612 2,612 After one year but before five years 11,409 11,026 After five years 32,420 35,415
46,441 49,053
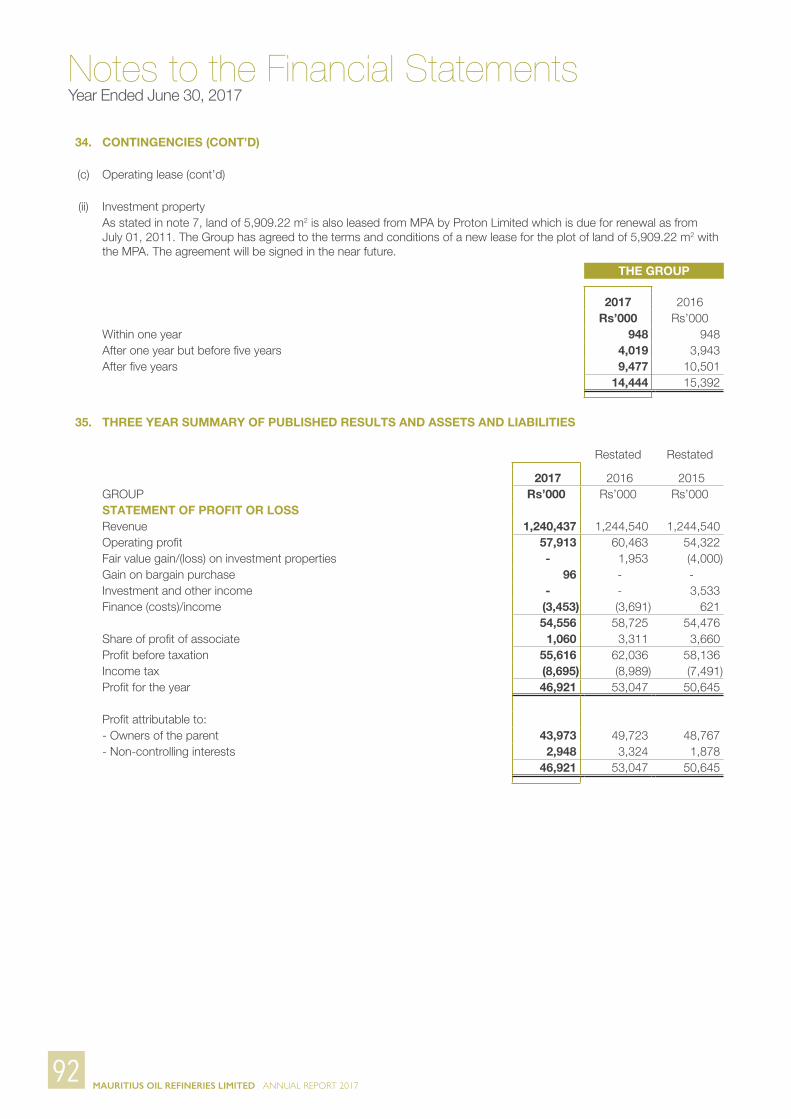
MAURITIUS OIL REFINERIES LIMITED ANNUAL REPORT 2017
Notes to the Financial StatementsYear Ended June 30, 2017
92
34. CONTINGENCIES (CONT’D)
(c) Operating lease (cont’d)
(ii) Investment propertyAs stated in note 7, land of 5,909.22 m2 is also leased from MPA by Proton Limited which is due for renewal as from July 01, 2011. The Group has agreed to the terms and conditions of a new lease for the plot of land of 5,909.22 m2 with the MPA. The agreement will be signed in the near future.
THE GROUP
2017 2016Rs’000 Rs’000
Within one year 948 948 After one year but before five years 4,019 3,943 After five years 9,477 10,501
14,444 15,392
35. THREE YEAR SUMMARY OF PUBLISHED RESULTS AND ASSETS AND LIABILITIES
Restated Restated
2017 2016 2015 GROUP Rs’000 Rs’000 Rs’000STATEMENT OF PROFIT OR LOSSRevenue 1,240,437 1,244,540 1,244,540 Operating profit 57,913 60,463 54,322 Fair value gain/(loss) on investment properties - 1,953 (4,000)Gain on bargain purchase 96 - - Investment and other income - - 3,533 Finance (costs)/income (3,453) (3,691) 621
54,556 58,725 54,476 Share of profit of associate 1,060 3,311 3,660 Profit before taxation 55,616 62,036 58,136 Income tax (8,695) (8,989) (7,491)Profit for the year 46,921 53,047 50,645
Profit attributable to:- Owners of the parent 43,973 49,723 48,767 - Non-controlling interests 2,948 3,324 1,878
46,921 53,047 50,645
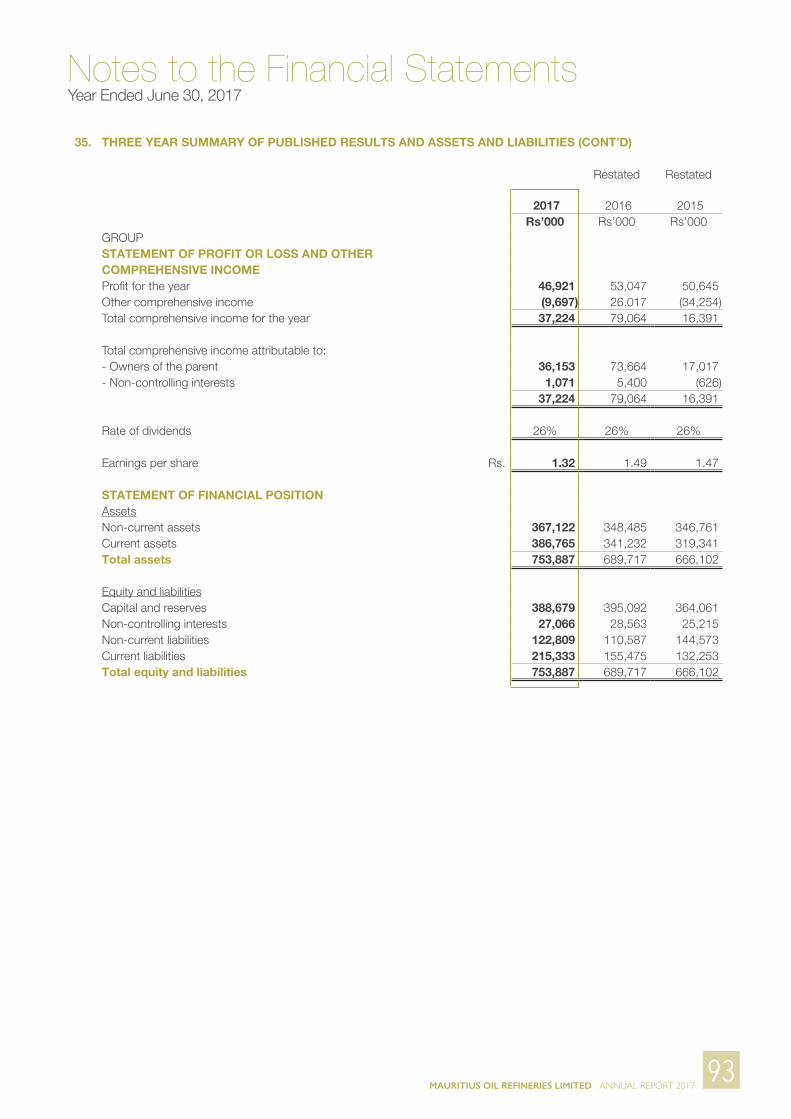
MAURITIUS OIL REFINERIES LIMITED ANNUAL REPORT 2017
Notes to the Financial StatementsYear Ended June 30, 2017
93
35. THREE YEAR SUMMARY OF PUBLISHED RESULTS AND ASSETS AND LIABILITIES (CONT’D)
Restated Restated
2017 2016 2015 Rs’000 Rs’000 Rs’000
GROUPSTATEMENT OF PROFIT OR LOSS AND OTHER COMPREHENSIVE INCOMEProfit for the year 46,921 53,047 50,645 Other comprehensive income (9,697) 26,017 (34,254)Total comprehensive income for the year 37,224 79,064 16,391
Total comprehensive income attributable to:- Owners of the parent 36,153 73,664 17,017 - Non-controlling interests 1,071 5,400 (626)
37,224 79,064 16,391
Rate of dividends 26% 26% 26%
Earnings per share Rs. 1.32 1.49 1.47
STATEMENT OF FINANCIAL POSITIONAssetsNon-current assets 367,122 348,485 346,761 Current assets 386,765 341,232 319,341 Total assets 753,887 689,717 666,102
Equity and liabilitiesCapital and reserves 388,679 395,092 364,061 Non-controlling interests 27,066 28,563 25,215 Non-current liabilities 122,809 110,587 144,573 Current liabilities 215,333 155,475 132,253 Total equity and liabilities 753,887 689,717 666,102

Notes
Mauritius Oil Refineries LimitedNotice of Meeting
NOTICE is hereby given that the Annual Meeting of the Shareholders of the Company will be held at the Registered Office of the Company, 2 Quay Road, Port Louis, on Wednesday 6th December 2017 at 10.30 hours.
ORDER OF THE DAY
1. To receive the Directors’ Report and the Auditors’ Report.2. To adopt the Group’s and Company’s Accounts made up to June 30, 2017.3. To elect three Directors in the place of Messrs. R.J. Paul CLARENC, Jerome CLARENC and
J.H. Maurice de MARASSE ENOUF retiring by rotation. Messrs. R.J. Paul CLARENC and J.H. Maurice de MARASSE ENOUF also seek re-election as Director of the Company until the next Annual Meeting in accordance with Section 138(6) of the Companies Act 2001. The retiring Directors offer themselves for reelection.
4. To re-appoint Mr. Hansraj RUHEE, who seeks re-election as Director of the Company until the next Annual Meeting in accordance with Section 138(6) of the Companies Act 2001.
5. To appoint an Auditor until the next Annual Meeting and fix his remuneration.6. To ratify the dividends declared in November 2016 and May 2017.
By Order of the BoardSPEVILLE SECRETARIAL SERVICES LTDSecretary
A member of the Company entitled to attend and vote at this Meeting may appoint a person, whether a member or not, to attend the Meeting and vote on his behalf. Proxy forms must be lodged at the Registered Office of the Company not less than forty-eight hours before the Meeting.
18th October 2017

