contents · ken bolton ted cadsby ross lamont colleen sidford human resources colleen sidford -...
TRANSCRIPT


ContentsOur Story
Message from the Board Chair
Message from the President & CEO
Board & Management Team
Corporate Governance Report
Corporate Highlights
Commitment to Communities
Management Discussion & Analysis
Core Business & Strategy
Key Performance Drivers
Capability to Deliver Results
Consolidated Financial Results
Capital Management
Risk Management
2018 Outlook
Consolidated Financial Statements
Index to the Consolidated Financial Statements
Independent Auditor’s Report
Consolidated Balance Sheet
Consolidated Income Statement
Consolidated Statement of Comprehensive Income
Consolidated Statement of Changes in Equity
Consolidated Statement of Cash Flows
Notes to the Consolidated Financial Statements
Meridian Locations
22017 ANNUAL REPORT | Contents
.................................................................................4
............................................5
................................6
..............................................7
..............................................8
............................................................17
.............................................18
.................................20
.................................................................21
..................................................................22
............................................................23
........................................................25
........................................................................33
.............................................................................34
.....................................................................................35
...................................37
...........................38
.........................................................39
............................................................40
......................................................41
.....................42
..............................43
..........................................44
...........................45
.............................................................105

3 2017 ANNUAL REPORT

42017 ANNUAL REPORT | Our Story
Meridian is Ontario’s largest credit union, helping to grow the lives of its quarter of a million Members.
As a credit union, we are 100 per cent owned by our Members. We work only for them, with profits returned to our Members in the form of the best products and services we can offer. We are not motivated by short-term profit objectives like publicly traded organizations. Rather, we take a long-term view and act in the best interests of our Members and the communities they live in.
We get to know our Members so that we can proactively advise them on ways to save money, invest for the future and determine financial solutions that are in their best interests. We believe financial well-being is a key ingredient to overall well-being.
Our Members know that we have their backs. Our employees — more than 1,900 in over 90 branches, 8 Commercial Business Centres and 2 corporate offices — have the ability and power to make decisions on the spot, because they know our Members and their circumstances best.
Meridian combines exceptional Member service with a full range of products and services, such as telephone, mobile and online electronic banking services, which allow our Members to securely access their money anywhere, anytime.
Meridian’s wholly owned subsidiary, Meridian OneCap Credit Corp., is a leading supplier ofcustomized commercial equipment leasing solutions. Meridian OneCap has built a solid reputation of superior customer service with its team of knowledgeable industry leaders.
Our Story

Throughout 2017, Meridian’s Board of Directors provided oversight and input to Meridian’s executive leadership team to help shape and support Meridian’s Strategic Plan, which is ultimately focused on delivering value to our Members and the communities we serve.
Good and effective governance is essential to ensuring Meridian is well-positioned and equipped to address future opportunities and challenges in the competitive Canadian marketplace. Meridian’s Board of Directors is committed to ensuring Meridian’s corporate governance framework reflects modern and industry best standards. The Board is
extremely proud of the work it has completed on its ongoing Governance 2.0 Project, which will see a full review of Meridian’s corporate governance framework. We are happy to report that the first phase of this project has been completed.
As a Board dedicated to ensuring the best and highest standards of corporate governance, many key initiatives were completed in 2017 to ensure the effectiveness and efficiency of our Board. During our June Board Planning Session, the Board worked with an external facilitator to focus on future trends to best address our evolving Member needs. As Meridian continues to grow and diversify its business and revenue streams, the Board has proactively taken measures to learn more about Meridian OneCap’s business model in order to provide better oversight of the subsidiary. The Board has also implemented a fulsome and market-leading Board evaluation process to ensure its continued effectiveness.
Last spring, Meridian enthusiastically welcomed two new Board Members, Mike Valente and Peter Patchet, while bidding farewell to two long-serving Board Members, Don Ariss and Richard Owen, who retired from the Board. On behalf of the Board, I want to thank Don and Richard for their passion, commitment and service to Meridian.
The Board recognizes Bill Maurin and his leadership team for their ongoing focus and dedication to making Meridian a market-leading financial institution. The Board also extends a special thank you to Meridian’s more than 1,900 employees for their exceptional work in 2017 and their ongoing dedication to serving our Members.
John MurphyChair, Board of Directors
5 2017 ANNUAL REPORT | Message from the Board Chair
Message from the Board Chair

I’m happy to report that 2017 was another banner year for Meridian. Our strong record of growth continued with more than 34,000 new Members joining us last year, a new record. That helped fuel record relationship growth for the organization and by year-end we held $18 billion in assets under management, a 13 per cent growth over 2016. We also opened six new branches in 2017 and saw our branch footprint continue to expand by adding locations in Mississauga, Brampton, Markham and Toronto while introducing our unique brand of cooperative banking to the Waterloo community.
Over the last five years Meridian has almost doubled in size. This strong growth trajectory helps ensure that Meridian is well capitalized and remains relevant in a rapidly changing and increasingly competitive financial services marketplace. More importantly, it means we can continue on our primary
focus—you, our Members— delivering you value, superior service and innovative solutions for all your financial needs. For example, we launched our new suite of VISA retail and business credit cards, which offer our Members a range of options to suit their needs, including cash back, travel rewards and US dollar cards. There’s also our Family and Friends mortgage solution, which enables up to four Members to pool their financial resources to afford a shared home. This unique andinnovative mortgage solution is very relevant, especially given the expensive GTA housing market.
As banking services continue to evolve in the digital age, Meridian has made several enhancements to our digital banking platforms. In October, we launched our completely redesigned retail online banking and small business online banking platforms from the ground up to make the Member experience easier and more intuitive. The redesign reinforces Meridian’s commitment to improving the Member experience and our digital capabilities. Last November, we also launched our new secured and unsecured digital lending platforms, which allow Members to apply for a mortgage or loan completely online through a streamlined and convenient application and approval process.
I am extremely proud that Meridian was recognized as a Platinum Level Best Employer in Canada by Aon Hewitt and one of Canada’s Most Admired Corporate Cultures of 2017 by WaterstoneHuman Capital. As I have said many times before: Meridian’s greatest asset is our employees. All of our achievements and successes this past year are a direct result of our talented, committed and passionate employees.
As we look forward to 2018, Meridian will keep seeking more efficient ways to better serve you. 2018 will be a very ambitious year for Meridian as we are gearing up to launch our national banking entity. The work completed in 2017 has laid a very strong foundation for us to continue to meet the banking needs of our Members—here in Ontario and throughoutCanada.
On behalf of Meridian’s Leadership Team, I’d like to thank Members for your continued feedback, support and loyalty as Meridian continues on its journey to grow lives and build prosperous communities.
Bill MaurinPresident andChief Executive Officer
62017 ANNUAL REPORT | Message from the President & CEO
Message from the President & CEO

Board & Management TeamExecutive Leadership Team
Board of DirectorsBack row left to right:
Jeff Chesebrough
Larry Doran
Ken Bolton
Ted Cadsby
Ross Lamont
Mike Valente
Peter Patchet
Front row left to right:
Carol Hunter
Colleen Sidford
John Murphy (Chair)
Tamara Paton (Vice Chair)
Karen Farbridge
Audit & FinanceKen Bolton - ChairTed CadsbyKaren FarbridgeCarol HunterPeter Patchet
GovernanceJohn Murphy - ChairKen BoltonTed CadsbyRoss LamontColleen Sidford
Human ResourcesColleen Sidford - ChairLarry DoranJohn MurphyPeter PatchetTamara Paton
Nominating Carol Hunter - ChairJeff ChesebroughLarry DoranTamara Paton
RiskKaren Farbridge - ChairJeff ChesebroughRoss LamontTamara PatonMike Valente
Back row left to right:
Leo Gautreau - SVP & Chief Risk Officer
Bill Maurin - President & CEO
David Baldarelli - SVP, Digital Banking &Enterprise Analytics
Gary Genik - SVP & Chief Information and Technology Officer
Front row left to right:
Tim Smart - SVP & Chief Financial Officer
Anne Berend - SVP & Chief Employee Experience Officer
Sunny Sodhi - SVP & Chief Legal Officer, ChiefInnovation Officer
7 2017 ANNUAL REPORT | Board & Management Team

82017 ANNUAL REPORT | Corporate Governance Report
Corporate Governance Report
Meridian’s Board of Directors continues to be committed to the highest standards of Corporate Governance in order to demonstrate our stewardship to Members, employees and the communities we serve. We believe this is essential for continued success and enduring trust from our Members.
Meridian operates a principle-based governance philosophy with key principles that provide the foundation for its governance policies and practices, such as:
• Fulfilling its legal and fiduciary obligations and ensuring it is adhering at all times to statutory and regulatory requirements;
• Acting in the best interests of Meridian and the totality of its Membership;
• Continually educating the Membership on the role of the Board and other key governance issues, including efforts to
ensure that Members can effectively exercise their rights and obligations in respect of the election process;
• Ensuring the Credit Union has the means, capability and willingness to put into practice effective measures to direct itself prudently;
• Ensuring the Credit Union has a clear strategic direction;
• Ensuring effective stewardship of business operations and management of risk, particularly through an effective enterprise-wide risk management framework;
• Reflecting the Credit Union’s commitment to integrity, open communication, teamwork and continuous improvement; and
• Continually assessing its effectiveness in fulfilling these responsibilities.
Meridian operates within a comprehensive regulatory framework. We are established under provincial legislation: the Credit Union and Caisses Populaires Act, 1994 (the “Act”). Credit Unions are regulated by two primary bodies: i) the Financial Services Commission of Ontario (“FSCO”); and ii) the Deposit Insurance Corporation of Ontario (“DICO”).
The Ministry of Finance is responsible for developing and establishing the legislative and regulatory framework under which credit unions must operate. FSCO is responsible for ensuring that credit unions operate in accordance with the requirements of the Act and the regulations thereunder, particularly with respect to issues involving market conduct relating to Members and the general public. DICO is responsible for overseeing compliance with solvency rules and for providing deposit insurance protection for deposits held in Ontario credit unions and caisses populaires up to prescribed limits. As part of this responsibility, DICO has the authority to issue by-laws to ensure that insured institutions operate in accordance with
sound business and financial practices. In early 2015, DICO issued Guidance Notes respecting desired practices in Corporate Governance for the Board, Management and the Audit & Finance Committee of the Board. Meridian has conducted a gap analysis against this Guidance and is pleased to report that no gaps were identified. To promote responsible governance through strength and stability, Meridian meets quarterly with DICO representatives, provides regular reporting to DICO and participates in periodic risk-based examinations. Although it is not the practice of FSCO to schedule regular meetings with Ontario credit unions, as a best practice Meridian proactively advises FSCO of matters relating to its business of which we believe the regulator should be aware.
A review of the Act commenced in 2014. Meridian was very actively engaged in contributing to this review, which culminated in the Minister of Finance proposing certain recommended changes to the Act that came into effect on January 1, 2018.
Approach to Governance at Meridian
Governing Legislation and Regulation
9 2017 ANNUAL REPORT | 9 2017 ANNUAL REPORT | Corporate Governance Report
The Board of Directors protects and enhances Meridian’s assets and is responsible for ensuring that Meridian has a clear strategic direction. The Board’s goal is to protect the best interests of Meridian’s Members and stakeholders. It is further responsible for overseeing Management to ensure that Meridian’s operations are managed in a sound and prudent manner, thereby assuring Members that all statutory and regulatory requirements are met. Every Director is responsible for exercising independent judgment with honesty and integrity. In accordance with its mandate, the
Board proactively contributes to the development of, and ultimately approves, the long-term vision of Meridian. Establishing this vision is an important responsibility of the Board, as it is the basis upon which the strategy of Meridian is developed and serves as our aspirational guidepost for the future. During 2017, the Board confirmed Meridian’s longer-term vision statements, central to which is our goal to be known as the financial services partner that attracts and retains Members because of a differentiated Member experience.
In accordance with our By-laws, Meridian’s Board is composed of 12 Directors, all of whom are independent. The process for the election of Directors is comprehensive. Each year the Board reviews the skills, knowledge and experience of the Board to determine whether any gaps exist in order to ensure the highest quality Board composition. The Board’s Nominating Committee is requested by the Board to seek to fill any identified gaps as they solicit candidates for nomination from Meridian’s Members. Prospective candidates receive an extensive package of information.
In recent years, DICO used this package as the basis for a sample Director Candidate Information Guide, released to the Ontario credit union system.
All eligible candidates are placed in nomination. The Nominating Committee interviews all eligible candidates and evaluates them against a set of criteria defined by the Board in advance.The Nominating Committee then recommends to our Members those candidates who are considered best qualified to serve Meridian to fill the number of vacancies. Nominees who are not recommended are eligible to remain on the ballot for election.
Our Members can vote for the election of Directors by casting a ballot electronically via the Internet or at any of our Branches. Meridian’s Directors are elected for three-year terms and represent a broad range of skills, experiences and backgrounds.
Meridian’s Board has adopted a Statement of Intent, which states that Meridian recognizes and embraces the benefits of diversity in Board members. The Board demonstrates a diversity of thought that aligns with the needs of the demographic composition of the communities we serve today and in the future. A truly diverse Board includes and makes good use of differences in the skills, regional and industry experience, background, race, gender, ethnicity, indigenous status and other attributes of Directors. Meridian considers diversity
of thought, experience and background equally important. The best qualified candidates will be recommended for election to the Board, taking into account broad diversity differences required to represent our Membership of today and tomorrow. The current 12 Directors bring to the Board table gender diversity as well as a spectrum of education and experience, in particular significant professional experience.
Board Mandate
Board Composition and Election
Board Diversity

102017 ANNUAL REPORT | Corporate Governance Report 102017 ANNUAL REPORT | Corporate Governance Report
New Directors are offered a comprehensive orientation program to familiarize themselves with Meridian’s Governance processes and business operations. Every year we conduct a formal debriefing of the orientation session to capture enhancement opportunities for subsequent years. The Governance Committee continues to evaluate this program to ensure the most effective orientation is provided to new Directors. Recently, a formal revamp of the orientation program was undertaken to ensure that a robust program will continue to be offered to new Directors. Individual Committees of the Board have also established their own orientation programs to better educate new Committee members on their responsibilities. The Board has an approved budget for ongoing Director training and development, including educational sessions for the Board as a whole, industry-sponsored seminars and other
conferences for individual Directors that are relevantto Meridian’s business. The Board established a policy in late 2012 that sets an objective for the majority of Meridian’s Directors to receive an external director accreditation designation. We are pleased to note that at the end of 2017, 10 Directors held either the Institute of Corporate Directors or Director’s College designation. Based on these efforts, the objective set by the Board has been accomplished.
In 2017, several Board education sessions were held to address topics considered to be particularly important or novel in light of the evolving business of Meridian.
Orientation and Continuing Education
The Board is committed to effective governance and continuous improvement. Annually, the Governance Committee facilitates a Board evaluation process to assess the effectiveness of the Board. Generally, external consultants are engaged to conduct these engagements. Starting in 2016, and continuing in 2017, a bold initiative commenced, led by the Board working closely with an external consultant, to review Meridian’s governance framework in order to identify enhancements and efficiencies that would ensure such framework continues to adhere to the highest standards. Interviews of Committee members and Management support staff were conducted, leading to a comprehensive report for the Board.
Board Evaluations

11 2017 ANNUAL REPORT | Corporate Governance Report
The Board has delegated the oversight for monitoring adherence to its policies to five Committees with the following primary accountabilities:
Board Committees
• Review of financial statements, internal controls, accounting policies and reporting procedures;
• Review the Credit Union’s financial performance relative to established metrics;
• Ensure the integrity of financial reporting;
• Oversight of internal and external audit processes;
• Monitor the independence of external auditors;
• Oversight of compliance with applicable statutory and regulatory requirements, and monitoring compliance with all Board policies; and
• Oversight of the reporting relationship of the Chief Audit Executive.
Audit & Finance Committee
• Maintain a healthy governance culture and oversight of all Governance policies;
• Assess the effectiveness of the Board, its Committees, and Committee Chairs;
• Oversight of the Board’s annual planning process; and
• Oversight of the development plans for Directors.
Governance Committee
• Oversight of the HR policies and programs, to ensure that they are developed, implemented and adhered to by Management in support of the business strategies of the Credit Union;
• Review and recommend Director compensation;
• Administer the process for review of the CEO’s performance and compensation;
• Oversight of the employee pension plans; and
• Oversight of the succession planning for the President & CEO, Executive Leadership Team, and Corporate Secretary.
Human Resources Committee
• Oversight of the nomination, assessment and recommendation of candidates for the Board;
• Assess the adequacy of the candidate pool to ensure it addresses any identified gaps;
• Oversight of the Director election process;
• Accountable for the general content, objectives and guidelines of Meridian’s annual report; and
• Oversight of the activities associated with the Annual General Meeting and any Special Members’ Meetings.
Nominating Committee
• Ensure a robust process for identifying, managing and monitoring critical risks;
• Ensure that policy guidelines and systems are in place to ensure that enterprise risks are at an acceptable level;
• Provide strategic oversight to risk management policies and DICO standards;
• Oversight of the establishment of a risk appetite framework; and
• Review and approve individual connected and restricted party credit applications.
Risk Committee
122017 ANNUAL REPORT | Corporate Governance Report
The following are the members of the Board, their respective year of election, as well as the Committees served on in 2017:
Years of Service on the Board and Committee Membership 2017
Chair Ken Bolton Ted Cadsby Karen Farbridge Carol Hunter Peter Patchet
Elected in 2015 Elected in 2016 Elected in 2015 Elected in 2016 Elected in 2017
Audit & Finance Committee
Chair John Murphy Ken Bolton Ted Cadsby Ross Lamont Colleen Sidford
Elected in 2010
Elected in 2012 Elected in 2012
Governance Committee
Chair Collen Sidford Larry Doran John Murphy Peter Patchet Tamara Paton
Elected in 2014
Elected in 2013
Human Resources Committee
Chair Carol HunterJeff Chesebrough Larry Doran Tamara Paton
Elected in 2015
Nominating Committee
Chair Karen Farbridge Jeff Chesebrough Ross Lamont Tamara Paton Mike Valente Elected in 2017
Risk Committee

13 2017 ANNUAL REPORT | Corporate Governance Report
The Board believes it is important to offer a level of transparency in its interactions with the Members. To that end, the Board provides the Members with information on its activities.
The Board is pleased to advise of the following initiatives implemented in 2017:
• Conducted a comprehensive Board evaluation that focused on the overall effectiveness and efficiency of the governance framework;
• Conducted a mid-year planning session that provided direction to Management to further enhance and expand a bold 10-year strategic vision;
• Completed the sixth iteration of individual Director self-assessments against the nine competencies required under the DICO Guidance Notes, as well as four additional competencies developed by Meridian, and undertook a comprehensive validation of those results;
• Led by the Board Chair, used the results of the above to establish updated individual Director plans, including specific objectives for their own development and specific action plans;
• Continued to participate in dialogue among Board Chairs of the 15 largest credit unions in Canada;
• Undertook a robust review of Governance Policies to continue to adhere to the highest standards; and
• Completed a review of Meridian’s By-laws for consideration and approval by Members at the 2017 Annual General Meeting.
2017 Board Initiatives
Meridian’s Board has adopted a policy that outlines the duties and obligations of Directors, and annually requires each Director to sign a statement of
Director Commitment, which confirms that they have read the Board’s policies and agree to respect and abide by them at all times.
Board Code of Conduct
Meridian’s Human Resources Committee is responsible for recommending Director compensation. As stated in the Board’s compensation policy, a comprehensive review is undertaken every two years in this regard. The last comprehensive bi-annual review was conducted in 2016, with implementation effective January 1, 2016.
Meridian recognizes the importance of attracting and retaining a high quality and dedicated Board of Directors, and therefore offers a level of remuneration that both reflects our co-operativeheritage and makes us competitive in the marketplace.
In accordance with an established compensation policy, Director remuneration will be reasonable and competitive as compared to organizations that place a similar level of importance on the role of Directors, and that require Directors to achieve a high degree of ongoing education and technical proficiency. The Director compensation philosophy aligns strategically with Meridian’s employee compensation philosophy.
Director Compensation
142017 ANNUAL REPORT | Corporate Governance Report
Listed below are the retainers paid to Meridian’s Directors in 2017.
Meridian Director RetainersBoard Chair
Board Vice Chair
Director
Audit & Finance Committee Chair
Other Committee Chair
$50,000
$30,000
$25,000
$10,000
$5,000
Meridian also recognizes that there may be extraordinary circumstances (i.e. significant additional time required to be spent on a matter), that justify an additional payment be made to a Director. In keeping with good governance practice
of disclosure, the table below summarizes the total compensation (excluding expense reimbursement) received by each Director during 2017:
Director Total CompensationDon Ariss (served as Director until 4/17)
Ken Bolton (Audit & Finance Committee Chair)
Ted Cadsby
Jeff Chesebrough
Larry Doran (Human Resources Committee Chair until 4/17)
Karen Farbridge (Risk Committee Chair effective 4/17)
Carol Hunter (Nominating Committee Chair effective 4/17)
Ross Lamont
John Murphy (Board Chair and Governance Committee Chair)
Richard Owen (served as Director until 4/17)
Peter Patchet (elected to serve as Director effective 4/17)
Tamara Paton (Board Vice Chair; Nominating Committee Chair until 4/17)
Colleen Sidford (Risk Committee Chair until 4/17; Human Resources Committee Chair effective 4/17)
Mike Valente (elected to serve as Director effective 4/17)
$18,583
$55,500
$42,250
$41,750
$44,917
$47,583
$48,833
$43,900
$78,600
$13,833
$28,917
$55,042
$48,750
$27,917

15 2017 ANNUAL REPORT | Corporate Governance Report
Meridian’s Human Resources Committee is responsible for recommending to the Board the compensation of the CEO and ensuring that the compensation practices relating to the Executive Leadership Team are consistent with Meridian’s Compensation Philosophy. A third party executive compensation specialist is engaged by the Committee to assist it in this work, including support in selecting appropriate market references (i.e. data sources, peer group development principles, benchmark positions) and guidance in interpreting market pay levels and practices.
The third party review is a robust process, which involves using comparator organizations from both financial services and general business/industry. Peer group development and target positioning guide an examination of Meridian’s competitive position as compared to organizations of comparable size and complexity within the Canadian financial industry. Where applicable, Meridian considers market references from broader Canadian general industry reflecting the diverse talent market that may be considered for certain executive roles at Meridian. Market compensation data from just over 90 peer organizations, identified as a representative market for executive talent, are reviewed to ensure the Committee is equipped with an understanding of market practice to make informed executive pay decisions.
The CEO and Executive Leadership Team roles are benchmarked against external, market comparable roles. Again, both financial services and general industry are used as part of the benchmark role review.
The Board determines the form and amount of CEO compensation based on this review and resulting recommendations from the Committee.
Meridian’s Executive compensation consists of both a short-term incentive plan, in line with the incentive plan applicable to all employees, and a long-term incentive plan. The performance metrics upon which both of these plans are based are closely reviewed by the Committee and ultimately approved by the Board annually. Detailed information regarding Executive compensation can be found within the Notes to the Consolidated Financial Statements, which are included in the Annual Report.
The Committee is also responsible for developing performance objectives for the CEO and evaluating the CEO’s performance against those objectives annually. The CEO’s goals are clearly stated and aligned to strategic imperatives. There is an orientation toward qualitative evaluation, with the understanding that quantitative results against the enterprise scorecard (which has a broad range of quantitative plan targets) are part of the overall evaluation process. Emphasis is placed on the appropriate balance to incent achievement of both short- and long-term objectives while ensuring Meridian’s long-term success.
Executive Compensation & CEO Performance Management
The Board has a policy for “Attendance by Directors” and receives semi-annual reporting of individual attendance. While the policy reflects a 12-month rolling attendance record due to the need to capture consecutive meeting attendance, the following chart reflects Director attendance during the 2017 calendar year. It includes former and newly elected Directors whose terms ended and/or commenced concurrent with the Annual
General Meeting in April 2017. The percentages pertain to the attendance at both Board and Committee meetings held during the period January 1, 2017, to December 31, 2017. Overall, this translates to a 99% average attendance by Meridian’s Directors.
Director Attendance
162017 ANNUAL REPORT | Corporate Governance Report
12 Months of 2017
Ariss, Don (until 4/17)
Bolton, Ken
Cadsby, Ted
Chesebrough, Jeff
Doran, Larry
Farbridge, Karen
Hunter, Carol
Lamont, Ross
Murphy, John
Owen, Richard (until 4/17)
Patchet, Peter (eff. 4/17)
Paton, Tamara
Sidford, Colleen
Valente, Mike (eff. 4/17)
Board of Directors Committee Total
Attend Held Attend Held Attend Held %Director
3
7
7
7
7
7
7
7
7
3
4
7
6
4
3
7
7
7
7
7
7
7
7
3
4
7
7
4
7
12
10
9
11
12
12
9
9
3
8
13
16
5
7
12
10
9
11
12
12
11
9
3
8
13
16
5
10
19
17
16
18
19
19
16
16
6
12
20
22
9
10
19
17
16
18
19
19
18
16
6
12
20
23
9
100
100
100
100
100
100
100
89
100
100
100
100
96
100
The Board continues to be very pleased with the progress that Meridian has made since inception in 2005. Many of Meridian’s recent successes are highlighted in the Management Discussion & Analysis that follows. Your Board would like to thank all Members for your continued loyalty and patronage in 2017.
You may contact the Board through our Governance office by writing to:
Email: [email protected] Mail:Meridian Credit Union c/o Corporate Secretary 3280 Bloor Street WestCentre Tower, Suite 2700Toronto, ON M8X 2X3
For further information about Meridian’s Board, please visit:
www.meridiancu.ca/About-Meridian/Corporate/Governance/Board-of-Directors.aspx
Contacting the Board

17 2017 ANNUAL REPORT | Corporate Highlights
Corporate HighlightsGrowing Our Branch Network Throughout 2017, Meridian opened six new branches, expanding our presence in Mississauga, Brampton, Markham and Toronto while introducing our unique brand of cooperative banking to the Waterloo community.
Enhanced Online Member Experience In 2017, Meridian made several enhancements to our digital banking capabilities. In an effort to improve our online Member experience, Meridian conducted a complete redesign of our retail online banking and small business banking platforms. In addition to having a more modern design, the new platforms provide our Members with a more intuitive and overall convenient online experience.
As a financial institution that prides itself on innovation and addressing the unmet needs of our Members, Meridian was very proud to launch our unsecured and secured lending platforms late last year. These platforms allow Members to apply for a mortgage or loan completely online through a streamlined and convenient application and approval process.
Completing a Successful Share OfferingIn 2017, Meridian successfully completed our Grow Your Tomorrow Class A Shares – Series 17 share offering. This successful investment offering will help strengthen Meridian’s operating base, support future growth and position us to better serve our Members—all this while providing investing Members the opportunity to take advantage of a target annual dividend rate of 4.25 per cent on their investment.
Delivering Innovative Products and Services Meridian takes great pride in offering our Members innovative and competitive solutions to meet all their financial needs. In early 2017, Meridian launched our new suite of VISA credit cards to better suit the needs of our retail and business Members.
In February of last year, Meridian introduced its Family and Friends Mortgage, an innovative and practical mortgage solution that allows families and friends to join forces to pool their financial resources together to purchase a home.
Employer of Choice Meridian remained an employer of choice in 2017 and was honoured with several top employer recognitions. Last June, Meridian was recognized as one of the 50 Most Engaged Workplaces in North America for the seventh time. Meridian was also named a Platinum Level Best Employer in Canada by Aon Hewitt and one of Canada’s Most Admired Corporate Cultures of 2017 by Waterstone Human Capital.

182017 ANNUAL REPORT | Commitment to Communities
Commitment to Communities
Meridian’s Commitment to Communities is based on our fundamental belief in our role in empowering Member, employee and community wellbeing.We believe that by developing community programs and partnerships that engage, educate and empower Canadians, we are fulfilling our promise to put our Members first and ensure that they always feel good about banking with us. Here are highlights of the many ways we are demonstrating this commitment.
Good Neighbour Program
Our branches participated in nearly 400 community events, programs and initiatives with over $600,000 in community sponsorships. We are proud to make a bold impact while engaging and empowering our employees, Members and communities. Visit meridiancu.ca/ goodneighbour to apply for a non-profit sponsorship by our branches.
My Commitment to Communities Employee Program
Our leading employee community engagement program gives employees access to $1,500 per year — up to $1,000 to match donations and fundraising to any Canadian charity and up to $500 to reward volunteer time with any non-profit organization. In 2017, we matched our employees’ contributions with $250,000.In celebration of Canada’s 150th, we joined the Canadian Credit Union Association’s national volunteer challenge - Inspired Canadians, Inspiring Communities - to volunteer at least 5,000 hours, which we exceeded at 8,100 hours.
For Aspiring Entrepreneurs
Entrepreneurs with mentors are more likely to succeed so since 2015, Meridian and Futurpreneur Canada have supported over 2,000 young entrepreneurs. In 2017, 107 entrepreneurs ages 18-39 were supported by Meridian and Futurpreneur Canada at coffee meetups in 15 neighbourhoods through our Owners Wanted Ontario program. 1,567 young entrepreneurs tuned into our first ever virtual meetup on Facebook Live. Our Small Business and One Cap Credit Corp. leaders also co-hosted Expert Exchange workshops engaging 126 growth-ready young entrepreneurs.
SmartSAVER RESP Education
In 2014, we were a founding partner of SmartSAVER.org, created by Omega Foundation, to teach parents about saving for their children’s education with the Registered Education Savings Plan and the Canada Learning Bond. Since 2015, over 460,000 Canadians have used the site to learn about opening RESP’s to access up to $2,000 in government grants through the Canada Learning Bond. Nearly 12,000 have digitally applied for an RESP using this new tool.

19 2017 ANNUAL REPORT | Commitment to Communities
In school, I began to see how my help and volunteerism made an impact and helped make a difference in the lives of many people, so I decided to explore different options to get involved — anything I can do to help and be a leader in my community I would like to do.”
Heba Shahaed 2017 Sean Jackson Scholarship Winner
“
Save the Camp! Mobile Game
In 2017, we launched our mobile game, Save the Camp!, to teach kids about money through game-based learning in partnership with national charity The Learning Partnership and digital studio Tiny Hearts. Within one month, the app became a top educational game on the App Store and was featured in the media. Teachers across Ontario have used it as an education tool aligned to the Ministry of Education curriculum for grades 7 to 10.
Visit SavetheCamp.ca to view the trailer, play or download the app, and use the Teacher Handbook.
Funny Money
Meridian teamed up with the Ontario Government and Ontario Chamber of Commerce to make financial literacy fun by sponsoring a province-wide series of 400 comedy shows. Between September 2016 and December 2017, Funny Money shows were performed at 289 high school assemblies, bringing the show to 120,728 students in grades 11 and 12.
Learn more at FunnyMoneyInc.com
Investing in Education
Meridian awards an annual $10,000 scholarship, named in honour of our first CEO Sean Jackson, to one exemplary Ontario student. Over 200 scholarship applications were received and Heba Shahaed was selected; a community and youth advocate who took an entrepreneurial approach to bridging the divide between youth and seniors in Aurora.7 Meridian teen Members were awarded scholarships to attend the Ontario Co-operative Association’s Co-operative Young Leaders program.

202017 ANNUAL REPORT | Management’s Discussion & Analysis
Caution Regarding Forward-Looking Statements This MD&A includes forward-looking statements, which by their very nature require management to make assumptions and involve inherent risks and uncertainties. Forward-looking statements are typically identified by the words “believe”, “expect”, “anticipate”, “intend”, “estimate”, “may increase”, “may impact”, and other similar expressions, or future or conditional verbs such as “will”, “should”, “would” and “could”. A number of important factors, many of which are beyond management’s control, could cause actual future results, conditions, actions or events to differ materially from the targets, projections, expectations, estimates or intentions expressed in forward-looking statements. These factors include, but are not limited to, changes in general economic conditions in Canada, particularly those in Ontario; legislative or regulatory developments; changes in accounting standards or policies; and Meridian’s success in anticipating and managing the risks inherent in these factors. Readers are cautioned that the foregoing list is not exhaustive. Undue reliance should not be placed on forward-looking statements as actual results may differ materially from expectations. Meridian does not undertake to update any forward-looking statements contained in this MD&A.
Management’s Discussion & Analysis
This management’s discussion and analysis (“MD&A”) gives readers an overview of Meridian Credit Union Limited (“Meridian”), and enables them to assess Meridian’s financial condition and results of operations for the fiscal year 2017, as compared to prior years. The MD&A should be read in conjunction with the audited financial statements, which have been prepared in accordance with International Financial Reporting Standards (“IFRS”). Unless otherwise indicated all amounts in the MD&A are expressed in Canadian dollars. The MD&A commentary is as of March 6, 2018. In accordance with its terms of reference, Meridian’s Audit and Finance Committee of the Board of Directors has reviewed the content of the MD&A and recommended its approval to the Board of Directors. The MD&A was approved by Meridian’s Board of Directors.
Core Business & Strategy
Corporate Overview
Our Corporate Strategy
Key Performance Drivers
Capability to Deliver Results
Consolidated Financial Results
2017 Financial Overview
2017 Financial Performance Review
Total Revenue
Net Interest Income
Provision for Credit Losses
Credit Portfolio Quality
Non-Interest Income
Non-Interest Expenses
Financial Conditions Review
Balance Sheet Summary
Liquidity Review
Capital Management
Overview
Managing and Monitoring Capital
Capital Review
Internal Capital Adequacy Assessment Process
Risk Management2018 Outlook
...........................21
......................................21
.................................21
...........................22
......................23
...................25
...............................25
................27
..........................................27
.................................27
.........................29
..............................29
................................30
.............................30
...........................31
...........................31
......................................32
.................................33
....................................................33
...................33
.............................................33
......................................................34
.....................................34
...........................................35

21 2017 ANNUAL REPORT | Management’s Discussion & Analysis
Core Business & Strategy
Corporate Overview
Meridian exists to make it simpler for Canadians to achieve a better life.
As Ontario’s largest credit union, we grow lives by delivering financial products and services to over 300,000 Members, through a network of 90 branches, and access to commercial banking services at 11 locations, a Member Contact Centre, and online services.
Our Members own Meridian. We work only for them and always put their interests first. Our employees take the time to understand the financial goals and aspirations of our Members, which then allows us to proactively offer solutions that meet their needs.
We also grow lives through a commitment to invest money, time and talent to help build prosperous, resilient communities. Our Commitment to Communities is based on the co-operative values and beliefs our Members and employees share.
Our Corporate Strategy
Meridian strives to be the leader in Member-centric banking. We focus on strategies that are in the best long-term interest of our Members, not short-term corporate earnings objectives. In so doing, we grow the lives of our Members by deepening relationships with existing Members and building relationships with new Members. In 2017, our strategic imperatives continued to support Meridian’s longer-term sustainability and our ability to deliver on what we call Our Value Proposition. These imperatives were as follows:
1. Membership Growth
• We want to bring the Meridian experience to as many Canadians as possible, while ensuring that we reflect the demographics of the markets we serve.
• We will leverage existing initiatives such as digital banking enhancements, branch expansion, strategic alliances, and new products and services, while identifying new strategies to ensure a more holistic approach to how we grow our Membership.
2. Building Community
• We are focused on our Members, their families, and the communities in which they live.
• Our goal is to foster stronger and more resilient communities while remaining true to our cooperative principles.
• Our knowledge of the communities in which we operate is a key ingredient for how we help strengthen communities.
3. Business Model Diversification
• Our goal is to identify options to evolve our business model to support planned growth and
diversify revenue streams in an efficient, cost-effective and sustainable manner.
• This supports our aspirations to add value to our Members by building a financially successful and secure business.
4. Deliver a Differentiated Member Experience
• Our goal is to deliver a Member experience that is second to none.
• This experience is delivered daily through interactions with Members.
• Our employees deliver a consistent and meaningful sales and service experience.
• Our products and services demonstrate Our Value Proposition, which is focused on growing the lives of our Members, having their best interests at heart and always having their backs.
5. Ownership Culture
• Our goal is to create a differentiated ownership experience for our employees.
• This is supported by programs which help employees grow their lives personally, professionally and financially.
• By empowering employees, we aim to establish a company-wide risk awareness culture.
222017 ANNUAL REPORT | Management’s Discussion & Analysis
We continue to review our strategic imperatives to ensure they support Our Value Proposition. Going forward we have refined our five strategic imperatives as follows: Market & Membership Growth, Differentiated Member Experience, Social Commitment, Diversified Business Model, and Exceptional Employee Experience.
Key Performance Drivers
Critical to our success are our Members, our employees and our presence in the community. These ultimately drive our performance, creating a financially sound and sustainable credit union. We strive to be successful by listening to what our Members say, ensuring that the marketplace is aware of Meridian’s value proposition and ensuring that our employees are fully engaged.
Vo ice of Member
Voice of Member is a Member Experience program that provides Meridian an opportunity to hear the opinions of our Members and measure satisfaction and loyalty. It enables us to better respond to Member needs and truly add value as we grow their lives. Favourable Member ratings is a direct indicator that we are delivering on Our Value Proposition and results in growth in our relationship value with Members, which includes lending, deposits and wealth management.
Research indicates that Meridian’s overall Voice of Member score continues to significantly surpass benchmark performance of the Big 5 banks. It also exceeds that of the Credit Union collective.
Relationships per Member continued to grow, as more Members consider Meridian to be their primary financial institution.
Awareness of Meridian
We regularly assess awareness of Meridian and our unique value proposition. We monitor our progress over time, in the areas of awareness, differentiated Member experience and access. These factors influence our ability to deliver Our Value Proposition to more Ontarians.
Continued focus on Meridian and what makes us unique will be paramount in driving new Members, and converting existing Members to “primary” status.
Our research shows Meridian’s unaided awareness increased from 3% to 6%.
Continued focus on Our Value Proposition will be paramount in driving new Member growth, and converting existing Members to have Meridian be their “primary” financial institution.
Employee Engagement
We continuously undertake activities that ensure our employees are engaged and empowered to make decisions in the best interest of the Member. We provide tools to help them effectively manage risks, just like an
owner. We also promote the well-being of our employees through our iMwell program and engage in activities to help grow their lives.
Meridian has won the Achiever’s Most Engaged Workplaces Award and has been named one of Canada’s Most Admired Corporate Cultures for 2017!
Meridian continues to receive high employee engagement scores, resulting in a greater ability to service the needs of our Members. We had a 74% engagement score, and Meridian’s results exceeded the benchmarks for the credit union and financial services industries in the provider database. This has resulted in Meridian receiving the Aon Platinum Level Best Employer Award, which is a premier engagement award in Canada. We continue to use survey results to develop action plans, which will be implemented at both the enterprise and local levels.
Membership Growth
Growth in Membership means that Meridian is able to help more lives grow, as over time we will have an opportunity to deepen our relationships with Members. Growth in our Membership base is influenced by increased awareness of Meridian and an expansion in Meridian’s points of access.
The number of total members increased nearly 25,000 in 2017, which surpasses 2016 net membership growth by over 27%. In 2017, we attracted 24,796 net new members, a record.
Capital Position
A key indicator of our financial soundness and ability to exist as a going concern is the strength of our capital base, which consists mainly of Member shares and retained earnings. A strong capital position allows us to absorb shocks stemming from economic downturns and market risk, and reinvest in activities that add value to our Members, and helps to protect Members’ deposits. We continue to focus on maintaining strong capital ratios by building our capital base, using high quality retained earnings that can be used in the event of a shock, or can be deployed to better meet the needs of Members.

23 2017 ANNUAL REPORT | Management’s Discussion & Analysis
Meridian’s capital and risk weighted capital ratio remained strong and well within regulatory limits in 2017.
Meridian issued $167 million of Class A investment shares in 2017. This is to help build our capital to better meet the needs of our Members.
Capability to Deliver Results
Meridian’s long-term sustainability hinges on our success in achieving our strategic imperatives, which are supported by multiple initiatives. We continue to strengthen our capabilities in our delivery network, organizational processes, technology, organizational structure and employees. The following 2017 successes and current initiatives highlight our ability to achieve our strategic imperatives and meet current and future needs of Members:
Differentiated Member Experience
Digital Strategy
Our digital strategy remains focused on a robust, convenient and user-friendly Member experience. The following capabilities were added in 2017:
• Ability to open unsecured lending products and mortgages online • Ability to transact on mortgages digitally • Re-design of our Online Banking platform to create a more user-friendly, convenient
way for Members to access their funds • Significant enhancements in our Member Online Onboarding • Live chat feature added to Online Banking • Ability for joint accounts to be opened online • Re-design of e-Transfer capabilities
Commercial
Lending Platform
New technology, iLend, has been introduced in both Commercial and Small Business Channels that will enhance the Member experience into the future. The iLend loan origination system has presented efficiencies that enable employees to spend more time building relationships and focusing on value-added services with business Members.
Business Model Diversification
Meridian Bank Meridian’s application to obtain a bank license will enable Meridian’s value proposition to be delivered nationally, to a larger cross section of Canadians. The application process is in Phase 2 and the project to build operational infrastructure is on track for a successful launch in 2019. Along with the bank, we are always considering other businesses to join the Meridian family.
Visa Credit Card Offering
Meridian successfully launched a range of Visa Credit Cards to complement our robust line of banking products. The launch included three market leading cashback reward cards, two travel reward cards, three business reward cards, and a US dollar card.
Membership Growth
New Branches
We will continue to expand our branch footprint in targeted Ontario markets. Meridian opened six new branches in 2017, relocated one location in Barrie, and consolidated two branches in Owen Sound, making it easier for existing and future Members to access our services.
• Five new GTA locations (Davisville, Steeles & Birchmount, Erin Mills & Folkway, Danforth & Logan, and Chinguacousy South Brampton)
• One new location in the Kitchener/Waterloo region

242017 ANNUAL REPORT | Management’s Discussion & Analysis
Good to Grow High Interest
Savings Account
The Good to Grow high interest savings account, launched in 2014, helps grow the lives and savings of our Members. It is a superior “no gimmick” product, offered at an interest rate higher than permanent rates available at the banks. Interest is earned on every dollar and there is no minimum monthly balance or fees. This product generated significant interest for existing and new Members.
We’ve Got Your Back Mortgages
Meridian offered Members “We’ve Got Your Back” mortgages at a market-leading rate. A substantial number of Members realized their dreams by taking advantage of this offer.
• Meridian launched a “Friends and Family” mortgage offering in 2017, making it easier for Members to purchase a home.
Building Community
Meridian’s Commitment to Communities
Meridian delivered on four goals to demonstrate our commitment to communities:
• Improve f inanc ial lit erac y – Meridian developed and delivered community programs for new and aspiring entrepreneurs with regional, provincial and national partners, including local programs with OwnersWanted.ca, and Action Entrepreneurship. For youth, Meridian jointly developed and launched SavetheCamp.ca mobile game for grades 7 – 10, which peaked as one of the top 4 Educational Games on the App Store in Canada, and FunnyMoneyInc.com educational comedy tour for grades 11 – 12, which has engaged approximately 80,000 students. To support families with saving for education and accessing government grants, we expanded our partnership with SmartSAVER.org, which has turned to RESP applications referred by the Toronto and Niagara District School Boards.
• Invest in our c ommunit ies – Meridian’s Commitment to Communities has contributed over $376,000 and 5,600 hours of volunteer work to over 250 Canadian charities and non-profits. Meridian’s Good Neighbour Program has sponsored 284 local community events. Meridian also invests through the Co-operative Young Leaders Program and the Sean Jackson scholarship award.
• Engage our employees – Meridian offers a best-in-class employee giving program - My Commitment to Communities – matching personal volunteering, donations and fundraising to local causes of their choice. Employee engagement in this program has increased, highlighting that Meridian employees are more engaged with their communities.
• Support a strong co-operative sector – Meridian collaborates with the co-operative and credit union sectors to raise awareness and understanding of the advantages of co-operative leadership among youth and business owners.
Ownership Culture
Unique People Programs
Meridian offers unique people programs that enable our employees to grow their lives personally, professionally and financially. These programs promote career and self-development; health; emotional, mental and financial well-being; community service; diversity; rewards and recognition; performance and goal setting; and culture. It is imperative we attract and retain next generation employees, allowing us to build our overall organizational strength and capability in support of our performance goals.
Diversity and Inclusion
Diversity and Inclusion (“D&I”) are a key focus for Meridian, as we believe an inclusive culture and diverse workforce can drive innovation, create trusted partnerships with our Members and community, and contribute to the overall success and growth of the business. We are committed to being inclusive in how we work with our Members and our colleagues; and in our ongoing efforts to attract, motivate and retain a diverse workforce. Earlier this year, Meridian launched the Diversity and Inclusion Leadership Advisory Council. This council works together to build Meridian’s diversity and inclusion strategy and develop tactics to support this important focus.
Innovation At the heart of Meridian’s capability to deliver results is innovation-fueled growth. This will require Meridian leaders and employees to embrace new ways of thinking and behaving, and do it in a way that remains true to our core values.

25 2017 ANNUAL REPORT | Management’s Discussion & Analysis
Consolidated Financial Results
2017 Financial Overview
Over the past year, the Bank of Canada had two interest rate increases with the overnight rate at 1% at the close of the year, compared to 0.5% in 2016. This move has started to increase loan rates, while deposit rates stayed flat in the market, resulting in an increased financial margin through the second half of the year.
Recent changes to mortgage rules has had an impact on the housing market in 2017, which is expected to continue in 2018. Some relief has been recognized and is expected to continue as the prime rate is forecasted to steadily increase and financial margin compression dissipates.
Meridian continues to invest in a mix of strategic and foundational initiatives, which will continue over the next five years, as we continue to expand our digital capabilities, add more branches, diversify our business and enhance our supporting infrastructure. The anticipated launch of the bank in 2019 will also be a significant investment for Meridian, which will become a contributing factor to our performance in the future years as it continues to grow.
The investments we made in our strategic and foundational initiatives in recent years put downward pressure on our key ratios. However, this trend has reversed as the benefits arising from our investments begin to deliver. Meridian is focused on ensuring the right balance between investments, earnings performance, funding requirements and capital are maintained.
As part of our business model diversification strategy, Meridian Credit Union acquired Meridian OneCap in 2016, to form a wholly owned leasing subsidiary. In accordance with IFRS, the Audited Financial Statements have been presented on a consolidated basis.
Overall, Meridian’s operating performance was strong with significant growth in relationships with Members. Total assets grew by $1.7 billion to $15.6 billion at the end of 2017, driven largely by lending to Members for mortgages and Commercial business activities. Assets under management, which include off-balance sheet Wealth management assets, increased by $2.1 billion to $18.1 billion. Wealth asset growth continued to be exceptional in 2017. Our deposit portfolio grew $1.3 billion or 13% to $11.6 billion, while our loan portfolio increased $1.8 billion or 16% to $13.0 billion in 2017.
Meridian continued to operate profitably in 2017, despite significant investment in initiatives to support our long-term sustainability.
Meridian generated $58.6 million in pre-tax earnings, an increase of $17.6 million over the previous year. The increased earnings were attributable to increased relationships with Members; an increase in the number of Members, which drives Financial Margin and Non-Interest Revenue; exceptional loan loss expense and related recoveries; as well as the sale of Meridian’s St. Catharines Corporate Office. Meridian experienced a gain in Other Comprehensive Income (“OCI”) of $19.4 million, mainly the result of changes in the fair value of cash flow hedges, which is subject to volatility in interest rates. These factors contributed to an after-tax return on equity (“ROE”) of 7.3% in 2017 compared to 6.1% achieved in 2016. ROE represents total comprehensive income as a percentage of average total equity. Removing the impact of the OCI gain, focusing on profits attributable to Members would result in an ROE of 5.2% in 2017 and 4.7% in 2016.
Operating margin was $50.7 million or 18% higher than the 2016 results, totalling $331.0 million in 2017. The main drivers of this increase were the significant growth in relationships with Members, which resulted in higher net interest and non-interest income as well as some significant recoveries on previous loan impairments. Favourable revenue was slightly offset by an increase in operating expenses, largely attributable to higher costs associated with our workforce growth, our first full year of OneCap’s operating expenses, branch expansion, increased community investment, and investments in strategic initiatives. In 2017, this included the second phase of obtaining a bank license, enabling Meridian to expand nationally. We are investing in infrastructure, people, processes, technology, marketing, and products and services, which created short-term earnings pressures in 2016 and 2017, thus putting pressure on our ROE and efficiency ratios. ROE increased in 2017, showing Meridian’s investments will improve our long-term financial outlook and allow us to achieve sustainable growth in the years to come.
10.3%
5.8%
2.9%
6.1% 7.3%
2013 2014 2015 2016 2017
Return on Average Equity

262017 ANNUAL REPORT | Management’s Discussion & Analysis
The efficiency ratio is a measure of productivity and is calculated as non-interest expense divided by operating margin, expressed as a percentage. Faster growth in revenues relative to increased expenses, previously described, resulted in a lower efficiency ratio of 82.3% in 2017 compared to 85.4% in 2016.
Meridian’s Capital and Risk Weighted Capital ratios increased to 7.0% and 13.6%, respectively, in 2017 due to our earnings and share issuance, which increased Capital by $167 million. These ratios remain well above the minimum regulatory requirements of 4.0% and 8.0%, respectively.
Meridian’s liquidity ratio decreased to 10.5% during 2017 from 13.0% a year earlier due to increased lending growth. This ratio remains well above the minimum operating target of 8.25%.
Meridian’s leverage ratio declined to 13.1% from 14.6% in 2016, resulting from decreased external funding requirements due to strong deposit growth.
72.1% 77.8% 83.9% 85.4% 82.3%
2013 2014 2015 2016 2017
Efficiency Ratio
6.6% 6.4% 7.1%
6.3% 7.0%
2013 2014 2015 2016 2017
Capital Ratio
13.4% 13.2% 14.3% 12.0%
13.6%
2013 2014 2015 2016 2017
Risk Weighted Capital Ratio
11.1% 10.5% 11.7% 13.0%
10.5%
2013 2014 2015 2016 2017
Liquidity Ratio
12.1% 13.4% 13.0% 14.6% 13.1%
2013 2014 2015 2016 2017
Leverage Ratio

27 2017 ANNUAL REPORT | Management’s Discussion & Analysis
CONSOLIDATED INCOME STATEMENTFor the year ended December 31, 2017
2016
Net Interest Income 263,043 226,366Less: Provision for credit losses 9,277 10,204Non-Interest income 72,525 63,590Share of profits from investment in associates (27) 252Share of profits from investment in joint venture 4,715 240Operating Margin 330,979 280,244
NON-INTEREST EXPENSESSalaries and employee benefits 161,896 135,084Administration 72,172 73,090Occupancy 17,913 17,060Amortization of intangible assets 9,753 5,367Depreciation 10,640 8,656Total non-interest expenses 272,374 239,257
Pre-Tax Earnings 58,605 40,987Income tax expense 11,227 4,601Profits attributable to Members 47,378$ 36,386
2017
2017 Financial Performance Review
Total Revenue
Total revenue, which consists of net interest and non-interest income before provisions for credit losses, grew $49.8 million to $340.3 million in 2017. The increase was largely driven by strong growth in relationships with Members, and our OneCap leasing portfolio receivables. Increased net interest income was generated from growth in lending to Members and partly offset by the cost of deposits and other sources used to fund lending. Wealth management assets also grew significantly, influenced by Members’ preferences to invest in products yielding a higher return in a low interest rate environment. This resulted in higher trailer fee revenue, which was a significant contributor to Meridian’s year-over-year increased non-interest income.
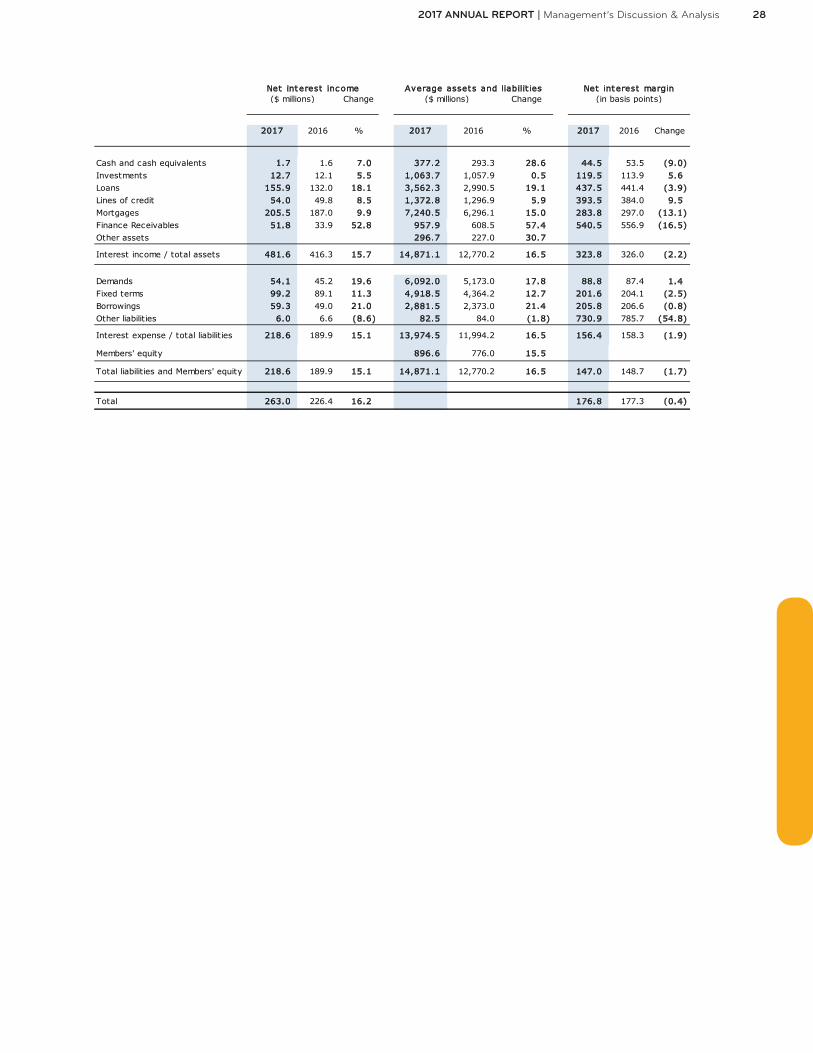
Net Interest Income
Net interest income is comprised of interest income on assets such as loans, securities and receivables, less interest expense paid on liabilities such as deposits and wholesale funding. For the year, net interest income was $263.0 million, an increase of $36.6 million or 16.2% over 2016. Interest income on assets increased $65.3 million or 15.7% while interest expense on liabilities increased $28.7 million or 15.1%.
Net interest margin is the ratio of net interest income to average total assets, expressed as a percentage. In 2017, net interest margin was 1.77%, down less than half a basis point from the prior year. Growth in net interest margin remains challenged by a low interest rate environment, although improving, and an increasingly competitive financial services sector in both Commercial and Retail portfolios. However, increasing contributions from new lines of business such as the OneCap leasing portfolio and a bank subsidiary should improve this ratio.
Meridian’s average total assets increased $2.1 billion or 16.5% in 2017, due primarily to Member loan growth. Member loan growth increased $1.6 billion or 15.0% in 2017, while the interest revenue associated with these loans increased 12.6%. Loan growth has continued to outpace revenue growth, as high-yielding loans continue to mature and have been replaced with loans that are priced according to the current competitive financial sector.
Asset growth was mainly funded through exceptional deposit growth in demands and fixed terms through 2017. Deposit growth increased $1.4 billion or 13.0%. The remaining asset growth, related mostly to OneCap, was supported through external sources of funding such as securitization and the use of borrowing facilities as necessary.
Net interest income is affected by fluctuations in capital markets beyond normal operating activities. As necessary, Meridian undertakes hedging activities, which may include the transacting of derivative instruments to protect Meridian and its Members from changes in external market conditions. These hedging activities, in turn, generate their own net interest income or loss, countering the impact on the underlying item.
Over the course of 2017, Meridian entered into receive fixed swaps with a total notional amount of $250 million and pay fixed swaps with a notional amount of $425 million, intended to hedge the risk to net interest margin attributable to changing interest rates. The notional amounts of our derivatives represent the amount to which a rate or price is applied in order to calculate the amount of cash that must be exchanged under the contract. Notional amounts do not represent assets or liabilities and therefore are not recorded in our consolidated balance sheet. The fair value of over-the-counter (“OTC”) derivative contracts is recorded in our consolidated balance sheet. The interest income or expense associated with quarterly cash settlements are reflected in the profit and loss.
282017 ANNUAL REPORT | Management’s Discussion & Analysis
Net interest inc ome Average assets and liabilit ies B Net interest margin
Change Change
2017 2016 % 2017 2016 % 2017 2016 Change
Cash and cash equivalents 1.7 1.6 7.0 377.2 293.3 28.6 44.5 53.5 (9.0)
Investments 12.7 12.1 5.5 1,063.7 1,057.9 0.5 119.5 113.9 5.6
Loans 155.9 132.0 18.1 3,562.3 2,990.5 19.1 437.5 441.4 (3.9)
Lines of credit 54.0 49.8 8.5 1,372.8 1,296.9 5.9 393.5 384.0 9.5
Mortgages 205.5 187.0 9.9 7,240.5 6,296.1 15.0 283.8 297.0 (13.1)
Finance Receivables 51.8 33.9 52.8 957.9 608.5 57.4 540.5 556.9 (16.5)
Other assets 296.7 227.0 30.7
Interest income / total assets 481.6 416.3 15.7 14,871.1 12,770.2 16.5 323.8 326.0 (2.2)
Demands 54.1 45.2 19.6 6,092.0 5,173.0 17.8 88.8 87.4 1.4
Fixed terms 99.2 89.1 11.3 4,918.5 4,364.2 12.7 201.6 204.1 (2.5)
Borrowings 59.3 49.0 21.0 2,881.5 2,373.0 21.4 205.8 206.6 (0.8)
Other liabilities 6.0 6.6 (8.6) 82.5 84.0 (1.8) 730.9 785.7 (54.8)
Interest expense / total liabilities 218.6 189.9 15.1 13,974.5 11,994.2 16.5 156.4 158.3 (1.9)
Members' equity 896.6 776.0 15.5
Total liabilities and Members' equity 218.6 189.9 15.1 14,871.1 12,770.2 16.5 147.0 148.7 (1.7)
Total 263.0 226.4 16.2 176.8 177.3 (0.4)
($ millions) ($ millions) (in basis points)

29 2017 ANNUAL REPORT | Management’s Discussion & Analysis
Provision for Credit Losses
The provision for credit losses (“PCL”) was $9.3 million in 2017, compared to $10.2 million in 2016. The PCL for the Commercial loan portfolio was a net recovery of ($1.4) million ($1.3 million loss in 2016). A $1.7 million loss was attributable to the Retail and Small Business loan portfolios ($1.6 million in 2016,) and a $9.0 million loss ($7.3 million in 2016) was attributable to Finance Receivables related to the OneCap business. Commercial losses are composed of a relatively small number of larger and sometimes individually significant losses. Due to the specialized nature of the underlying security, it can take several years to sell properties or realize on the security. In 2017 the Commercial PCL included adjustments related to several significant impairments dating back to 2010. Of the $1.4 million recovery on the Commercial portfolio, $4.8 million resulted from adjustments to security valuations on pre-2017 impairments, offset by $1.0 million related to new Commercial impairments ($2.2 million in 2016) and $2.4 million increase to the Commercial collective allowance. Finance receivables losses are comprised of a larger number of small- and medium-sized amounts. The Finance Receivables PCL was comprised of $6.6 million
($5.2 million in 2016) related to individual losses and $2.4 million ($2.1 million in 2016) increase to the collective allowance. Generally, there is a period of time between when a loss event occurs and when management is able to identify the specific accounts that are impacted. The collective allowance estimates incurred losses in the existing credit portfolio that cannot yet be identified on an individual loan basis. This is based on historical average loss rates. The total PCL represented 0.07% of the total loan portfolio in 2017, which was a decrease from 0.08% in 2016. The Commercial PCL was a net recovery for 2017 and reflects a reduction from 0.13% in 2016. The Retail PCL, at 0.03% of the respective portfolio, is generally consistent with the 2016 level. The annualized finance receivable PCL is 0.86%, which is a reduction of 0.49% from 2016. Though the finance receivable portfolio is considered higher risk than the Credit Union’s mortgage and loan portfolios, the loss rate for the year incorporated buildup of collective provisions on new business since acquisition. It is expected that the PCL rate will decline over time as these factors stabilize.
Credit Portfolio Quality
Loan and finance receivable loss provisioning is determined in accordance with an established policy. Management reviews the loan and finance receivable allowance position and impairment levels on a monthly basis. Management also reviews the status of all high-risk accounts (“Watchlist” accounts), which are actively monitored. Provisioning is adjusted where necessary to ensure compliance with policies and to include management’s best estimate of losses based on the currently available information. The gross impaired loans and finance receivables balance is $39.8 million ($74.2 million in 2016) and represents 0.28% of the total loan and finance receivable portfolio. The total allowance for impaired loans and finance receivables, at $26.7 million, was $7.8 million lower than the prior year. The decrease was due mainly to the resolution of several large pre-2017 Commercial impairments causing a decline of $11.4 million in the Commercial portfolio allowance, offset by an increase of $3.0 million related to the finance receivable portfolio. The $26.7 million allowance for impaired loans and finance receivables includes $8.1 million attributable to specific impairments and $18.6 million attributable to collective allowances. The allowance for impaired loans and finance receivables, as a ratio to total loans and finance receivables, was 0.19% in 2017, of which 0.06% represented the specific allowance and 0.13% was the collective allowance. The specific allowance decreased as a percentage of total loans by 0.11% from 2016. This was largely the result of growth in total loans and pay
down, and a write-off of some existing Commercial impairments.
A risk rating system is utilized to assess and monitor the risk profile of our Commercial loan portfolio. The model is based on an in-depth assessment of the borrower’s risk of default, which is measured by industry, business, management and financial risk factors, along with the risk of loss given default. The risk of loss given default is based on an assessment of security composition and relative historical recovery experience. The Commercial loan portfolio, stratified by risk rating ranging from “very
Asset quality coverage - loans and finance receivables
($ millions) 2017 2016
Total Loans, December 31 14,072.5 12,150.8
Gross Impaired Loans ("GIL") 39.8 74.2
Allow ance for Impaired Loans 26.7 34.5
Provision for Credit Losses 9.3 10.2
GIL as % of total loans 0.28% 0.61%
GIL as % of Members equity 3.89% 9.30%
Allow ance as % of total loans 0.19% 0.28%
PCL as % of total loans 0.07% 0.08%
Commercial loans:
% Better than average 14.50% 19.50%
% Average 63.70% 61.80%
78.20% 81.30%

302017 ANNUAL REPORT | Management’s Discussion & Analysis
low” to “impaired” is reviewed monthly. Most of the portfolio continued to fall into the combined “better than average” and “average” categories. Collectively, these two ratings accounted for approximately 78.2% of the total Commercial portfolio (81.3% in 2016). In addition, a comprehensive Early Warning System allows for timely identification of accounts that require follow-up, and additional attention through the adjudication process or an increase in risk rating to Watchlist status, with the
objective of correcting issues that may otherwise result in future impairment of the account. Meridian continues to enhance credit management processes through updating advanced early warning systems that identify potential credit deterioration, a more stringent control environment, improved credit based analytics and reporting, as well as an enriched Member experience.
Non-Interest Income
Non-interest income rose by $13.1 million or 20.5% to $77.2 million in 2017. OneCap contributed $2.3 million to the increase in non-interest income. Revenue from service fees rose $1.3 million to $16.0 million. Our OneCap leasing business contributed $1.0 million, and existing and increased Membership accounted for the remaining $0.3 million. Mutual fund revenue accounted for $2.7 million of the increase in non-interest income, growing by 19.0% to $16.6 million. Mutual fund revenue is driven by the significant growth in wealth balances due to exceptional sales during the year, and a strong market experienced in 2017. Sales were influenced by an increase in Meridian’s overall Wealth management workforce and a growing affinity by Members for wealth products that are capable of yielding higher returns, given the low interest rate environment.
Loan servicing fees grew by $4.0 million to $17.4 million driven by increased Commercial lending volumes. During 2017, our Commercial loan portfolio grew $407 million. Additionally, Commercial Members continue to renew their loans prior to maturity, taking advantage of the low interest rate environment.
Insurance commissions grew by $0.5 million to $7.7 million due to life insurance sales, as we encouraged Members to engage in their overall estate planning; as well as our insurance commissions in OneCap. Foreign exchange income increased by $0.3 million to $4.8 million. This was influenced by the gain on Meridian’s US dollar accounts held with Central 1, reflecting the
continued strength of the US dollar versus the Canadian dollar. Dividend income represents income from shares, predominately held with Central 1. We received dividends of $2.0 million in 2017, which is an increase of $0.5 million from 2016.
Other non-interest income increased $0.5 million to $5.7 million driven by end of term and other miscellaneous gains from the OneCap leasing business.
The following table summarizes the composition of Meridian’s non-interest income.
Non-Interest Expenses
Non-interest expenses rose to $272.4 million in 2017 from $239.3 million in 2016. The 13.8% increase in expenses was mainly associated with activities that support Meridian’s strategic imperatives. Higher spending was related to branch expansion, community investment, marketing to build brand awareness, investments in strategic initiatives, our first full year of OneCap, and application costs related to the bank.
Personnel expenses, which include all employee salaries, benefits and incentive compensation, accounted for 81% of the increase in expenses. Higher personnel expenses
are largely attributable to incremental employees required to support our expanded network of branches, to strong growth within our existing network of people, and to support strategic initiatives. Additional support was provided to our existing Delivery network to ensure Members could truly be provided a differentiated experience and that relationships could be deepened.
General operating expenses decreased 21.4% or $5.5 million, the decrease is driven by the acquisition costs that happened in 2016 related to OneCap.
Occupancy costs increased by $0.9 million to $17.9
Non- Interest Inc ome
($ millions) 2017 2016%
C hange
Service fees 16.0 14.7 9.1%
Mutual fund revenue 16.6 13.9 19.0%
Loan servicing fees 17.4 13.4 29.5%
Insurance commissions 7.7 7.2 7.1%
Foreign exchange 4.8 4.5 7.0%
Dividend Income 2.0 1.5 32.6%
Interac revenue 1.7 1.9 -8.0%
Credit card revenue 0.8 1.3 -37.5%
Share of Profits from
Investments4.7 0.5 853.5%
Other 5.7 5.2 7.8%
Total 77.2 64.1 20.5%
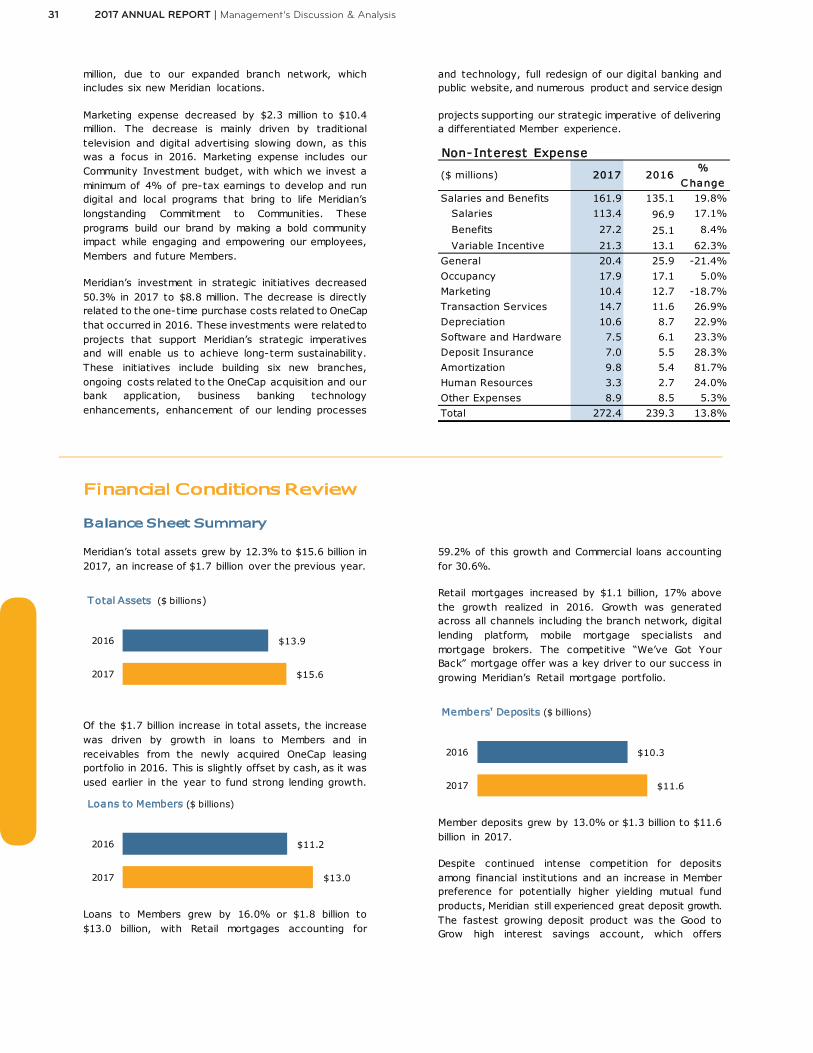
31 2017 ANNUAL REPORT | Management’s Discussion & Analysis
Non- Interest Expense
($ millions) 2017 2016%
C hange
Salaries and Benefits 161.9 135.1 19.8%
Salaries 113.4 96.9 17.1%
Benefits 27.2 25.1 8.4%
Variable Incentive 21.3 13.1 62.3%
General 20.4 25.9 -21.4%
Occupancy 17.9 17.1 5.0%
Marketing 10.4 12.7 -18.7%
Transaction Services 14.7 11.6 26.9%
Depreciation 10.6 8.7 22.9%
Software and Hardware 7.5 6.1 23.3%
Deposit Insurance 7.0 5.5 28.3%
Amortization 9.8 5.4 81.7%
Human Resources 3.3 2.7 24.0%
Other Expenses 8.9 8.5 5.3%
Total 272.4 239.3 13.8%
million, due to our expanded branch network, which includes six new Meridian locations.
Marketing expense decreased by $2.3 million to $10.4 million. The decrease is mainly driven by traditional television and digital advertising slowing down, as this was a focus in 2016. Marketing expense includes our Community Investment budget, with which we invest a minimum of 4% of pre-tax earnings to develop and run digital and local programs that bring to life Meridian’s longstanding Commitment to Communities. These programs build our brand by making a bold community impact while engaging and empowering our employees, Members and future Members.
Meridian’s investment in strategic initiatives decreased 50.3% in 2017 to $8.8 million. The decrease is directly related to the one-time purchase costs related to OneCap that occurred in 2016. These investments were related to projects that support Meridian’s strategic imperatives and will enable us to achieve long-term sustainability. These initiatives include building six new branches, ongoing costs related to the OneCap acquisition and our bank application, business banking technology enhancements, enhancement of our lending processes
and technology, full redesign of our digital banking and public website, and numerous product and service design
projects supporting our strategic imperative of delivering a differentiated Member experience.
Financial Conditions Review
Balance Sheet Summary
Meridian’s total assets grew by 12.3% to $15.6 billion in 2017, an increase of $1.7 billion over the previous year.
Of the $1.7 billion increase in total assets, the increase was driven by growth in loans to Members and in receivables from the newly acquired OneCap leasing portfolio in 2016. This is slightly offset by cash, as it was used earlier in the year to fund strong lending growth.
Loans to Members grew by 16.0% or $1.8 billion to $13.0 billion, with Retail mortgages accounting for
59.2% of this growth and Commercial loans accounting for 30.6%.
Retail mortgages increased by $1.1 billion, 17% above the growth realized in 2016. Growth was generated across all channels including the branch network, digital lending platform, mobile mortgage specialists and mortgage brokers. The competitive “We’ve Got Your Back” mortgage offer was a key driver to our success in growing Meridian’s Retail mortgage portfolio.
Member deposits grew by 13.0% or $1.3 billion to $11.6 billion in 2017.
Despite continued intense competition for deposits among financial institutions and an increase in Member preference for potentially higher yielding mutual fund products, Meridian still experienced great deposit growth. The fastest growing deposit product was the Good to Grow high interest savings account, which offers
$15.6
$13.9
2017
2016
Total Assets ($ billions)
$13.0
$11.2
2017
2016
Loans to Members ($ billions)
$11.6
$10.3
2017
2016
Members' Deposits ($ billions)

322017 ANNUAL REPORT | Management’s Discussion & Analysis
Members an opportunity to grow their savings faster with a market competitive interest rate. The Business Advantage Plus was the account of choice for business Members to grow their deposits. Tax Free Savings Accounts (“TFSAs”) continued to perform well in 2017, with balances growing by $122.0 million, while growth in term deposits was restrained due to the low interest rate environment and a continual shift in Member deposit preference from fixed terms to high interest savings accounts. Other than deposits, Meridian’s most significant change in liabilities was secured borrowings, which grew by $135.8 million. The increase supported funding for Meridian’s OneCap investment. Although we increased our secured borrowings, less external funding was required than in 2016 due to strong organic deposit growth.
Meridian’s off-balance sheet assets consist of our wealth portfolio, which is comprised largely of mutual fund assets held by Members.
Meridian’s wealth portfolio continued to experience significant growth in 2017. Member balances rose 18.7% or $0.4 billion to $2.4 billion. This strong growth represents net sales of $265.6 million along with appreciation in the market value of Members’ investments of $116.8 million, despite market volatility halfway through the year.
Overall, the total Member relationships managed by Meridian, which includes lending, deposits and wealth, grew by 14.9% to $27.1 billion in 2017.
Growth was diversified across business lines and across product categories. Wealth grew the fastest, a clear indicator that Members are focused on retirement and overall financial planning, seeking to maximize their return with the help of Meridian’s Advisors.
Liquidity Review
Managing liquidity and funding risk is critical to ensure the safety and soundness of Meridian, depositor confidence and stability in earnings. Meridian’s policies ensure that there are sufficient liquid assets and available funding capacity to meet financial commitments, even in times of stress. Meridian’s Board policy stipulates the maintenance of a minimum liquidity ratio, which is the ratio of cash and cash equivalents to Members’ deposits and borrowings, of 8.25%. As of December 31, 2017, Meridian’s liquidity ratio was 10.46% compared to 13.00% at the end of 2016, well above the minimum requirement established by the Board. Meridian maintains a prudent and disciplined approach to managing liquidity risk. Meridian targets a 90-day survival horizon under a combined Meridian-specific and market-wide stress scenario, and maintains a minimum buffer over regulatory requirements prescribed by the Deposit Insurance Corporation of Ontario (“DICO”) liquidity guidelines. Under the liquidity guidelines, Ontario Credit Unions are required to maintain a Liquidity Coverage Ratio (“LCR”), which is the ratio of net cash outflows calculated using the prescribed liquidity stress scenario to high quality liquid assets held for liquidity, at
a minimum of 100%. As of December 31, 2017, Meridian’s Liquidity Coverage Ratio was 126%. Meridian’s funding strategy follows a sustainable growth approach in that the funding of organic lending growth is primarily accomplished through organic deposit growth. Meridian maintains a large and stable base of Member deposits that, along with our strong capital base, supports the maintenance of a sound liquidity position and reduces our reliance on wholesale funding. Member deposits include Retail, and Commercial fixed rate deposits.
Securitization remains an attractive funding strategy for Meridian, as it provides stable long-term funding at a low cost. Meridian mortgage securitization issuances decreased by 45% compared to the prior year as a result of the Department of Finance announcing and implementing more stringent eligibility requirements for mortgage insurance. Diversification of external funding sources is an important aspect of Meridian’s overall liquidity management strategy. Meridian continues to maintain and investigate a diversity of funding sources in the event that securitization funding may not be available in the future or may only be available at significantly higher rates.
$2.4
$2.0
2017
2016
Wealth ($ billions)
$27.1
$23.6
2017
2016
Total Relationships ($ billions)

33 2017 ANNUAL REPORT | Management’s Discussion & Analysis
Capital Management
Overview
Meridian is committed to a disciplined approach to capital management and maintaining a strong capital base to support the risks associated with its business activities. Maintaining a strong capital position contributes to safety for our Members, promotes confidence in attracting new Members to Meridian, maintains strong returns to Meridian’s Class A Shareholders and allows Meridian to take advantage of growth opportunities.
Meridian’s capital management philosophy is to remain adequately capitalized at all times and to maintain a prudent cushion of equity to ensure its ongoing economic stability as well as finance new growth opportunities.
The principles and key elements of our capital management framework are outlined in the Board Capital Management Policy. This policy establishes and assigns
the responsibilities related to capital, and sets forth both general and specific policy guidelines related to capital management and the reporting mechanisms.
The Board of Directors and its Risk Committee provide ultimate oversight and approval of capital management, including the Capital Management Policy and Annual Capital Plan. They regularly review Meridian’s capital position and key capital management activities. The Executive Leadership Team provides senior management oversight of the capital management process, including review and discussion of significant capital policies, issues and action items. The Risk Committee has strategic oversight of the Capital Management Policy while the Audit & Finance Committee monitors compliance with the policy.
Managing and Monitoring Capital
Meridian has a comprehensive risk management framework to ensure that the risks taken while conducting business activities are consistent with its risk appetite. In managing our capital position, close attention is paid to the cost and availability of the types of capital, desired leverage, changes in both assets and risk weighted assets, and the opportunities to profitably deploy capital.
Capital levels are monitored monthly and compared to forecasted levels for both capital and risk-weighted capital. Our monitoring and forecasting procedures track the expected growth rate in assets relative to earnings to determine if additional share capital is required. These projections also take full account of any future impact of changes in accounting standards. A detailed discussion of capital management is provided in the notes to the audited consolidated financial statements.
Capital Review
Meridian’s regulatory capital ratios are strong and well exceed the requirements of the Credit Unions and Caisses Populaires Act, 1994 (the “Act”) that regulates Ontario Credit Unions and underlies Board policy requirements. These ratios underscore Meridian’s strength and, long-term stability and commitment to a disciplined approach to capital management that balances the interests and requirements of Members and regulators.
Meridian’s capital adequacy ratio was 7.0% as of December 31, 2017, compared to 6.3% at the end of 2016 and in excess of the 4.0% stipulated in the Act.
Meridian’s risk weighted capital adequacy ratio was 13.6% at the end of 2017, up from 12.0% at the end of 2016, and well in excess of the 8.0% stipulated in the Act.
Meridian’s capital quality also exceeds regulatory minimum requirements. Provincial regulations require that at least 50% of a credit union’s capital base be comprised of primary or Tier 1 capital. In order to maintain an appropriate level of conservatism, our internal capital management philosophy is to keep our Tier 1 capital as a percentage of total capital greater than 60%. As of year-end, 92.0% of Meridian’s capital base consisted of Tier 1 capital, an increase of 1.7% from 2016 and well in excess of internal and provincial minimums.
342017 ANNUAL REPORT | Management’s Discussion & Analysis
Internal Capital Adequacy Assessment Process
Meridian performs an Internal Capital Adequacy Assessment Process (“ICAAP”) and Stress Testing program, in line with Deposit Insurance Corporation of Ontario (“DICO”) requirements. Meridian performs an ICAAP for the purpose of setting internal capital targets and developing strategies to achieve them. The ICAAP builds on Meridian’s minimum regulatory capital
requirements, using a comprehensive assessment of risks and consideration of relevant stress testing to determine minimum capital levels that are appropriate to support Meridian’s unique risk profile. The ICAAP is integrated with Meridian’s strategic and business planning function, operational departments, and Enterprise Risk Management function.
Risk Management
Effective risk management is critical to the attainment of the strategic imperatives of Meridian. The Board of Directors and all employees are responsible for ensuring that the risks to which Meridian is exposed are aligned to the Board-approved risk appetite. Meridian has established a risk appetite framework across the organization for Management and the Board of Directors to communicate, understand, and assess the level of risk that they are willing to accept. A clear risk appetite enables Meridian to make better strategic and tactical decisions based on a risk-reward basis with consideration for its capacity to manage associated risks.
Meridian uses Enterprise Risk Management (“ERM”) to fully consider risk in all decision-making to ensure that the risk exposures of Meridian are effectively and prudently managed. Meridian’s ERM framework complies with Deposit Insurance Corporation of Ontario (“DICO”) By-Law No. 5 Standards of Sound Business and Financial Practices, and gives consideration to guidance provided by other relevant regulatory bodies and industry best practices.
Meridian and its subsidiaries maintain an ERM framework to identify, assess, respond to and monitor risk, including:
i. Technology and tools that facilitate the efficient and convenient execution of its ERM processes;
ii. A risk register of the risks to which Meridian is exposed;
iii. Processes to identify, assess and monitor its risks;
iv. Processes to respond to risk exposures in excess of the Board-approved risk appetite; and
v. A risk culture embodying the philosophy that risk management is the responsibility of everyone at Meridian, including the Board of Directors, management and all employees.
Meridian adheres to the Three Lines of Defence model of risk management such that:
i. Business units within Meridian form the First Line of Defence, performing day-to-day risk management activities;
ii. Risk oversight functions form the Second Line of Defence, facilitating the first line to effectively manage risk and providing independent, effective challenge to first line risk management actions; and
iii. Internal Audit Services forms the Third Line of Defence, providing independent, objective assurance.
Meridian recognizes four broad types of risk: Strategic Risk, Operational Risk, Credit Risk and Financial Risk. There are numerous specific risks, many of which are beyond Meridian’s direct control. Their impact can be difficult to predict and could cause our results to differ significantly from our plans, imperatives and estimates. Meridian considers it critical to regularly assess its operating environment and highlight top and emerging risks. Risks are identified, discussed and actioned by members of the Senior Leadership Team and reported quarterly to the Management Risk Committee, the Risk Committee of the Board and the Board of Directors. Specific plans to mitigate top and emerging risks are prepared, monitored and adjusted as required.
St rategic Risk
Strategic Risk is the risk that Meridian is unable to develop or implement appropriate business plans and strategies, effectively allocate resources, build or maintain a sustainable competitive advantage, or meet the ongoing needs and expectations of its Members. As described herein, Meridian considers a range of potential future situations in developing its strategies and develops plans which provide for optimal outcomes. Over time, the key assumptions used to determine the strategies are monitored and may be adjusted appropriately. Meridian continuously evolves its business model to support its planned growth and maintain a culture of growing the lives of our Members.

35 2017 ANNUAL REPORT | Management’s Discussion & Analysis
Operat ional Risk
Operational Risk is the risk that Meridian’s processes, technology or people fail to deliver the required results. This can include responding to external events including legal or regulatory actions. Meridian has a number of programs which manage specific risks under the Operational Risk umbrella including people-related risks, criminal risks (Fraud, AML), physical and information security risks, business continuity risk, as well as outsourcer and vendor risks. Meridian maintains an Operational Risk Management Framework that integrates the various operational risk programs. Meridian effectively balances the risk it accepts in its day-to-day operations while striving to enable business solutions that create Member value.
Credit Risk
Credit Risk is the risk of financial loss when a borrowing Member fails to meet their contractual obligations. Credit risk can be exacerbated by broad impacts to markets in which Meridian’s business is concentrated. Meridian’s lending philosophy is established by the Board of Directors through the Credit Risk Management Policy. The Credit Risk Management Policy provides direction to management relative to operational credit policies, lending authorities, assessment and limits of specific and aggregate credit risk, individual and industry sector
concentration limits, as well as monitoring and reporting requirements. Meridian will extend credit to Members and businesses of strong character with a demonstrated willingness and ability to repay. A detailed discussion of the management of credit risk is provided in the audited consolidated financial statements.
F inanc ial Risk
Financial Risk is the risk that Meridian is unable to secure adequate, timely, and reasonably priced funding or that key factors in financial markets change resulting in financial impacts to Meridian. These risks include changes to interest rates and foreign exchange rates, risks that Meridian’s pension is not adequately funded, and Funding and Liquidity Risks. Liquid assets are a critical element of Meridian’s ongoing operations, both to manage short-term cash flows in normal operations and to fund the lending growth laid out in Meridian’s financial plans. Meridian’s strategy includes planned levels of both deposits and diverse external funding sources. Meridian updates funding requirement levels daily to ensure both funding diversification and adequate contingency lines. Meridian manages interest rate, liquidity and funding risks in line with its risk appetite and in support of its profitability objectives. A detailed discussion of the management of funding and liquidity risk is provided in the audited consolidated financial statements.
2018 Outlook
Economic prospects in Canada have increased, driven by consumer spending, and a pickup in machinery and equipment investments, but is expected to decrease in 2018 as consumer spending slows, and a potential decline in residential investment is anticipated. The Bank of Canada is winding down monetary stimulus injected in the economy over the last few years and, as such, interest rates are anticipated to gradually rise as the economy grows. These increases will be highly dependent on the results of economic data, and it is anticipated that policy makers will pace the rate increases accordingly to allow highly leveraged households to adjust to increases in debt costs. In contrast to Canada, Ontario’s outlook appears promising for 2018, as Ontario is expected to outpace most other provinces. Consumer spending will continue to support the economy, along with a boost in public sector infrastructure investment, while residential investments level off. A healthy labour market will support continued growth in household consumption. Job creation has been steady in 2017, and Ontario is expected to create 130,000 jobs over the next two years, which will support wage increases and boost household disposable income. The phased increase in Ontario’s minimum wage, which will start in 2018, will boost the
income of low-wage workers but may weigh on employment growth. The housing market has cooled, as provincial and federal government policy measures introduced in 2017 are having their desired effect on the market. This trend is expected to continue in 2018, especially with mortgage rates on the rise. In 2018, borrowers will be subject to a stress test against their ability to pay their mortgage if rates were as high as the Bank of Canada five-year posted rate. These new policies have slowed new builds as development companies are waiting to see how they will fully affect the market. New home builds and existing home sales are expected to continue to trend low.
Meridian Implic at ions:
Meridian is well positioned to take advantage of the opportunities presented by the economic outlook for Ontario. The following outlines some of the major initiatives, which are planned for 2018: • Enhanced Sales and Service Experienc e: Meridian is
looking to build on bringing a service that is second to none. We want to deliver a unique and personalized experience and we will be bringing that experience in

362017 ANNUAL REPORT | Management’s Discussion & Analysis
a consistent manner through all channels – branch, digital, contact centre, and our mobile sales force.
• Line of Business Diversification: We will continue to be diligent in investigating selective acquisitions and/or builds of new business lines to join the Meridian family. Meridian will leverage OneCap to seek opportunities where it enables profitable expansion into transformational business lines. OneCap, along with our pending launch of the bank, are two large-scale strategic initiatives oriented towards diversifying our business model and bringing Meridian’s value proposition to a greater number of Canadians.
• Branch & Commercial Banking Expansion: Meridian
will continue to invest in new Retail branches. These will include locations in specifically targeted areas. As these new locations grow their portfolio of Members and product balances, they will start to contribute to Meridian’s profitability.
• New Produc ts: Meridian continues to strive to bring
innovative and market-leading products to our Members to address unmet needs and differentiate us from our competition. In 2018, Meridian will continue to build on the next phases of digital lending, offering a range of options to suit our Members’ personal and business needs. To focus on the needs of our Members we will be constantly looking for opportunities to address these needs from a product and technology perspective.
Anticipated strong growth in relationships is expected to result in increased revenue, which will help grow net interest margin, especially with interest rates now on the rise. Pre-tax earnings growth will help to support investment in strategic initiatives and maintain a strong capital base. The continued focus on strategic investments is expected to benefit Meridian’s long-term sustainability and ultimately Meridian’s Members; however, there will be downward pressure on earnings in the short-term. Effective January 1, 2018, the Credit Union will implement the new International Financial Reporting Standard 9 - Financial Instruments (“IFRS 9”). Among other changes relating to the classification and measurement of financial assets and liabilities and hedging, the standard requires that the Credit Union calculate credit losses in its portfolio on an expected basis rather than an incurred basis as is currently required. It is expected that the changes will result in an increase in allowance for impaired loans and earlier recognition of impairment losses within the consolidated income statement. The current estimated impact to the Credit Union’s consolidated balance sheet on January 1, 2018, the date of initial application, is an increase to allowance for credit losses and a reduction to retained earnings in the range of $10-15 million, net of tax. There is no restatement of comparative period financial information required. We will continue to review and
refine certain components of our impairment process throughout 2018. Capital is essential to allow Meridian to continue to invest strategically to support Members’ future needs. Management is committed to implementing strategies to maintain capital levels that are financially sound and will employ long-term strategies to further strengthen Meridian’s capital base.

Consolidated Financial Statements of
MERIDIAN CREDIT UNION LIMITED
Year ended December 31, 2017
37 2017 ANNUAL REPORT | Consolidated Financial Statements

MERIDIAN CREDIT UNION LIMITED INDEX TO THE CONSOLIDATED FINANCIAL STATEMENTS For the year ended December 31, 2017
Page
Independent auditor’s report
Consolidated balance sheet
Consolidated income statement
Consolidated statement of comprehensive income
Consolidated statement of changes in equity
Consolidated statement of cash flows
Notes to the consolidated financial statements:
Note Page Note
1 Nature of operations 13 Investment in associates
2 Basis of preparation 14 Investment in joint venture
2.1 Statement of compliance 15 Intangible assets
2.2 Use of estimates and judgments 16 Goodwill
2.3 Regulatory compliance 17 Property, plant and equipment
3 Summary of significant accounting policies 18 Deferred income taxes
3.1 Basis of consolidation 19 Other assets
3.2 Business combinations 20 Members’ deposits
3.3 Foreign currency translation 21 Borrowings
3.4 Financial assets and financial liabilities 22 Payables and other liabilities
3.5 Interest income and expense 23 Secured borrowings
3.6 Fee and commission income 24 Mortgage securitization liabilities
3.7 Impairment of financial assets 25 Pension and other employee obligations
3.8 Intangible assets 26 Share capital
3.9 Property, plant and equipment 27 Net-interest income
3.10 Goodwill 28 Non-interest income
3.11 Impairment of non-financial assets 29 Income tax expense
3.12 Leases 30 Related party transactions
3.13 Provisions 31 Contingent liabilities and commitments
3.14 Employee benefits 32 Regulatory information
3.15 Income taxes 33 Financial risk management
3.16 Share capital 33.1 Credit risk
4 Changes in accounting policies 33.2 Market risk
5 Acquisitions 33.3 Liquidity risk
6 Cash and cash equivalents 33.4 Fair value of financial assets and financial
7 Receivables liabilities
8 Financial Investments 33.5 Capital management
9 Loans to Members 34 Reconciliation of liabilities arising from financing
10 Finance Receivables activities
11 Derivative financial instruments 35 Authorization of consolidated financial statements
12 Investments available for sale
382017 ANNUAL REPORT | Consolidated Financial Statements
45
45
45
45
46
46
47
47
47
47
50
50
51
52
52
52
53
53
53
53
54
54
55
56
57
57
58
58
61
63
65
39
40
41
42
43
44
45
65
67
68
69
69
70
71
72
72
73
73
74
75
80
85
85
86
87
88
90
91
91
93
96
99
103
104
104
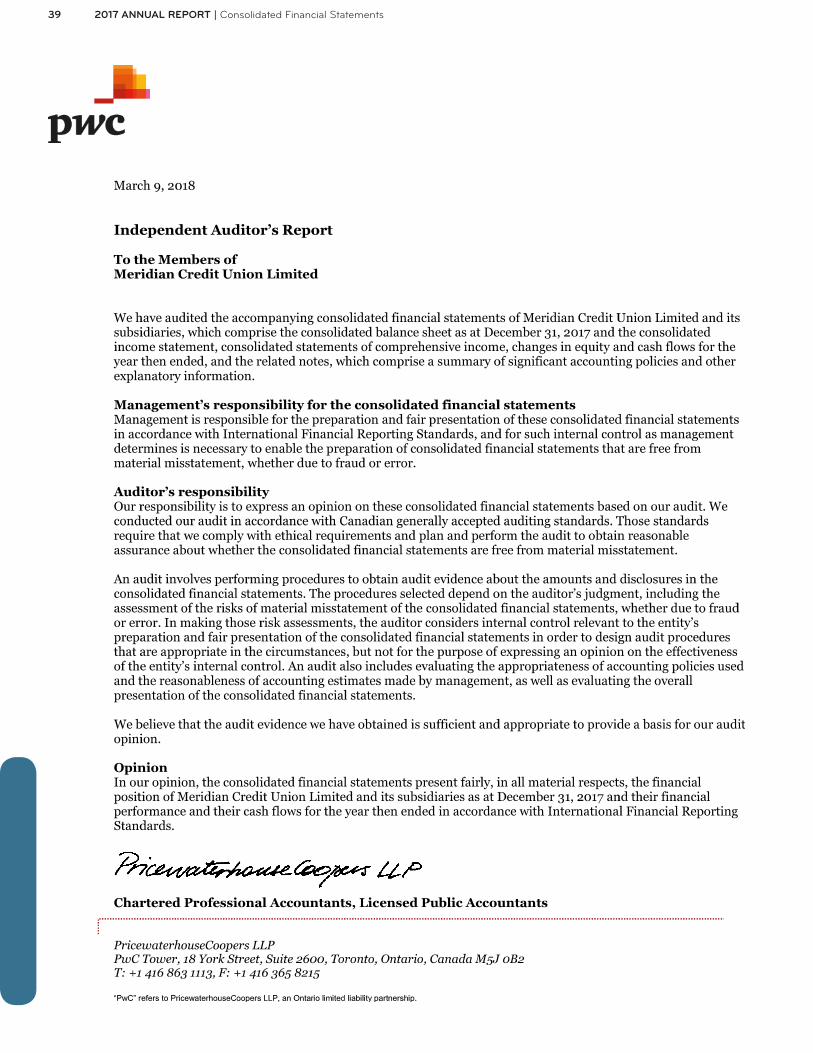
39 2017 ANNUAL REPORT | Consolidated Financial Statements

MERIDIAN CREDIT UNION LIMITED CONSOLIDATED BALANCE SHEET As at December 31, 2017 with comparative figures for 2016
Note (thousands of Canadian dollars) December 31
2017
December 31 2016
ASSETS
6 Cash and cash equivalents $ 343,874 $ 500,632
7 Receivables 7,197 26,830
8 Financial investments 839,832 877,303
9 Loans to Members 13,023,478 11,230,320
10 Finance receivables 1,049,061 920,458
11 Derivative financial assets 41,474 20,843
12 Investments available for sale 68,210 64,911
13 Investment in associates 328 11,434
14 Investment in joint venture 1,536 1,820
15 Intangible assets 43,725 51,785
16 Goodwill 73,232 73,232
17 Property, plant and equipment 50,537 49,866
18 Deferred income tax assets 43,161 54,901
19 Other assets 42,901 35,926
Total assets $ 15,628,546 $ 13,920,261
LIABILITIES
20 Members’ deposits $ 11,624,483 $ 10,286,348
21 Borrowings 32,822 11,294
22 Payables and other liabilities 37,869 29,403
29 Current income tax payable 3,007 32,121
23 Secured borrowings 937,293 801,508
24 Mortgage securitization liabilities 1,920,761 1,910,113
11 Derivative financial liabilities 2,014 12,215
25 Pension and other employee obligations 49,105 38,728
26 Membership shares 321 295
Total liabilities 14,607,675 13,122,025
MEMBERS’ EQUITY
26 Members’ capital accounts 548,694 377,227
Contributed surplus 104,761 104,761
Retained earnings 355,553 323,925
Accumulated other comprehensive income (loss) 11,863 (7,677)
Total equity attributable to Members 1,020,871 798,236
Total liabilities and Members’ equity $ 15,628,546 $ 13,920,261
The accompanying notes are an integral part of these consolidated financial statements
402017 ANNUAL REPORT | Consolidated Financial Statements

MERIDIAN CREDIT UNION LIMITED CONSOLIDATED INCOME STATEMENT For the year ended December 31, 2017 with comparative figures for 2016
Note (thousands of Canadian dollars) 2017
2016
INTEREST INCOME
Interest income - loans to Members $ 415,372 $ 368,772
Interest income - other 66,273 47,516
Total interest income 481,645 416,288
INTEREST EXPENSE
Interest expense - Members’ deposits 160,530 140,891
Interest expense - other 58,072 49,031
Total interest expense 218,602 189,922
27 Net interest income 263,043 226,366
9, 10 Provision for credit losses 9,277 10,204
Net interest income after provision for credit losses 253,766 216,162
28 Non-interest income 72,525 63,590
13 Share of profits (losses) from investment in associates (27) 252
14 Share of profits from investment in joint venture 4,715 240
Net interest and non-interest income 330,979 280,244
NON-INTEREST EXPENSES
25 Salaries and employee benefits 161,896 135,084
Administration 72,172 73,090
Occupancy 17,913 17,060
15 Amortization of intangible assets 9,753 5,367
17 Depreciation of property, plant and equipment 10,640 8,656
Total non-interest expenses 272,374 239,257
Operating earnings 58,605 40,987
29 Income tax expense 11,227 4,601
Profits for the year attributable to Members $ 47,378 $ 36,386
The accompanying notes are an integral part of these consolidated financial statements
41 2017 ANNUAL REPORT | Consolidated Financial Statements

MERIDIAN CREDIT UNION LIMITED CONSOLIDATED STATEMENT OF COMPREHENSIVE INCOME For the year ended December 31, 2017 with comparative figures for 2016
Note (thousands of Canadian dollars) 2017
2016
Profits for the year attributable to Members $ 47,378 $ 36,386
OTHER COMPREHENSIVE INCOME
Items that will not be reclassified to profit or loss
25 Actuarial losses in defined benefit pension plans (232) (1,317)
29 Related income taxes 45 257
(187) (1,060)
Items that may be subsequently reclassified to profit or loss Cash flow hedges – effective portion of changes in fair value 24,143 13,493
Cash flow hedges – reclassified to profit or loss 944 1,097
29 Related income taxes (5,547) (2,935)
19,540 11,655
Other comprehensive income for the year, net of income taxes 19,353 10,594
Total comprehensive income for the year attributable to Members $ 66,731 $ 46,980
The accompanying notes are an integral part of these consolidated financial statements
422017 ANNUAL REPORT | Consolidated Financial Statements

MERIDIAN CREDIT UNION LIMITED CONSOLIDATED STATEMENT OF CHANGES IN EQUITY For the year ended December 31, 2017 with comparative figures for 2016
Note (thousands of Canadian dollars) Members’
capital Contributed
surplus Retained earnings
Hedging reserves
Total equity
Balance as at January 1, 2017 $ 377,227 $ 104,761 $ 323,925 $ (7,677) $ 798,236
26 Dividends on Members’ capital accounts - - (15,563) - (15,563)
26 Shares issued to Members net of redemptions 158,477 - - - 158,477
26 Shares issued as dividends 12,990 - - - 12,990
Transactions with owners 171,467 - (15,563) - 155,904
Profits for the year attributable to Members - - 47,378 - 47,378
Other comprehensive income (loss) for the year, net of income taxes:
Actuarial losses in defined benefit pension plans - - (187) - (187)
Cash flow hedges – effective portion of changes in fair value - - - 18,812 18,812
Cash flow hedges – reclassified to profit or loss - - - 728 728
Total comprehensive income (loss) for the year attributable to Members
- - 47,191 19,540 66,731
Balance as at December 31, 2017 $ 548,694 $ 104,761 $ 355,553 $ 11,863 $1,020,871
Note (thousands of Canadian dollars) Members’
capital Contributed
surplus Retained earnings
Hedging reserves
Total equity
Balance as at January 1, 2016 $ 366,910 $ 104,761 $ 300,876 $ (19,332) $ 753,215
26 Dividends on Members’ capital accounts - - (12,277) - (12,277)
26 Shares issued as dividends 10,317 - - - 10,317
Transactions with owners 10,317 - (12,277) - (1,960)
Profits for the year attributable to Members - - 36,386 - 36,386
Other comprehensive income (loss) for the year, net of income taxes:
Actuarial losses in defined benefit pension plans - - (1,060) - (1,060)
Cash flow hedges – effective portion of changes in fair value
- - - 10,763 10,763
Cash flow hedges – reclassified to profit or loss - - - 892 892
Total comprehensive income (loss) for the year attributable to Members - - 35,326 11,655 46,981
Balance as at December 31, 2016 $ 377,227 $ 104,761 $ 323,925 $ (7,677) $ 798,236
The accompanying notes are an integral part of these consolidated financial statements
43 2017 ANNUAL REPORT | Consolidated Financial Statements
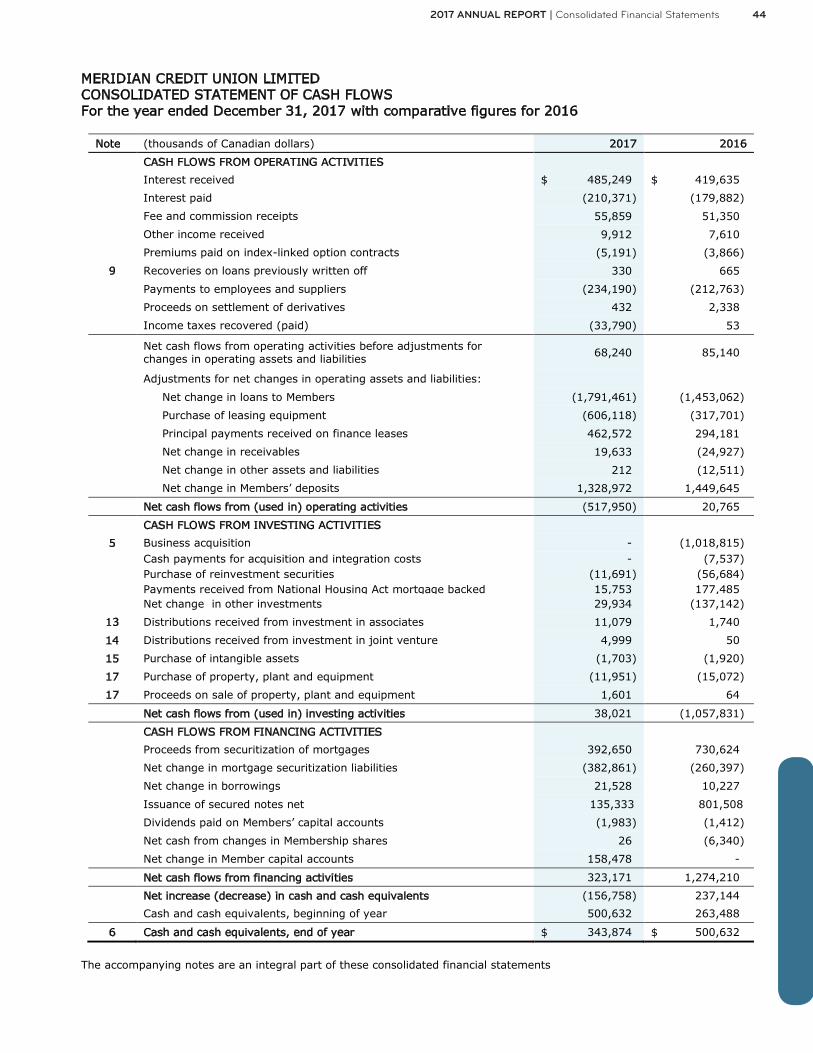
MERIDIAN CREDIT UNION LIMITED CONSOLIDATED STATEMENT OF CASH FLOWS For the year ended December 31, 2017 with comparative figures for 2016
Note (thousands of Canadian dollars) 2017 2016
CASH FLOWS FROM OPERATING ACTIVITIES Interest received $ 485,249 $ 419,635
Interest paid (210,371) (179,882)
Fee and commission receipts 55,859 51,350
Other income received 9,912 7,610
Premiums paid on index-linked option contracts (5,191) (3,866)
9 Recoveries on loans previously written off 330 665
Payments to employees and suppliers (234,190) (212,763)
Proceeds on settlement of derivatives 432 2,338
Income taxes recovered (paid) (33,790) 53
Net cash flows from operating activities before adjustments for changes in operating assets and liabilities 68,240 85,140
Adjustments for net changes in operating assets and liabilities:
Net change in loans to Members (1,791,461) (1,453,062)
Purchase of leasing equipment (606,118) (317,701)
Principal payments received on finance leases 462,572 294,181
Net change in receivables 19,633 (24,927)
Net change in other assets and liabilities 212 (12,511)
Net change in Members’ deposits 1,328,972 1,449,645
Net cash flows from (used in) operating activities (517,950) 20,765
CASH FLOWS FROM INVESTING ACTIVITIES
5 Business acquisition - (1,018,815)
Cash payments for acquisition and integration costs - (7,537) Purchase of reinvestment securities (11,691) (56,684) Payments received from National Housing Act mortgage backed
securities 15,753 177,485
Net change in other investments 29,934 (137,142)
13 Distributions received from investment in associates 11,079 1,740
14 Distributions received from investment in joint venture 4,999 50
15 Purchase of intangible assets (1,703) (1,920)
17 Purchase of property, plant and equipment (11,951) (15,072)
17 Proceeds on sale of property, plant and equipment 1,601 64
Net cash flows from (used in) investing activities 38,021 (1,057,831)
CASH FLOWS FROM FINANCING ACTIVITIES Proceeds from securitization of mortgages 392,650 730,624
Net change in mortgage securitization liabilities (382,861) (260,397)
Net change in borrowings 21,528 10,227
Issuance of secured notes net 135,333 801,508
Dividends paid on Members’ capital accounts (1,983) (1,412)
Net cash from changes in Membership shares 26 (6,340)
Net change in Member capital accounts 158,478 -
Net cash flows from financing activities 323,171 1,274,210
Net increase (decrease) in cash and cash equivalents (156,758) 237,144
Cash and cash equivalents, beginning of year 500,632 263,488
6 Cash and cash equivalents, end of year $ 343,874 $ 500,632
The accompanying notes are an integral part of these consolidated financial statements
442017 ANNUAL REPORT | Consolidated Financial Statements

MERIDIAN CREDIT UNION LIMITED NOTES TO THE CONSOLIDATED FINANCIAL STATEMENTS For the year ended December 31, 2017 with comparative figures for 2016
1 Nature of operations
Meridian Credit Union Limited (“the Credit Union” or “Meridian”) is incorporated in Canada under the Credit Unions and Caisses Populaires Act (the “Act”), and is a member of the Deposit Insurance Corporation of Ontario (“DICO”) and of Central 1 Credit Union (“Central 1”). The Credit Union is headquartered at 75 Corporate Park Drive in St. Catharines, ON. The Credit Union primarily is involved in the raising of funds and the application of those funds in providing financial services to Members. The activities of the Credit Union are regulated by DICO. The Credit Union has 90 branches and 11 commercial business centres across Ontario. On April 22, 2016, the Credit Union acquired Meridian OneCap Credit Corp. (“OneCap”), a wholly owned subsidiary that is primarily involved in lease financing that operates throughout Canada.
2 Basis of preparation
2.1 Statement of compliance
The consolidated financial statements of the Credit Union have been prepared in accordance with International Financial Reporting Standards (“IFRS”) and International Financial Reporting Interpretations Committee (“IFRIC”) interpretations as issued by the International Accounting Standards Board (“IASB”) and legislation for Ontario’s Credit Unions and Caisses Populaires. Unless otherwise indicated, all amounts except for per share figures are expressed in thousands of Canadian dollars.
2.2 Use of estimates and judgments
The preparation of the consolidated financial statements requires management to make estimates and judgments that affect the reported amounts of assets and liabilities and the disclosure of contingent assets and liabilities at the consolidated balance sheet date and the reported amounts of revenue and expenses during the reporting period. Actual results could differ from such estimates. Estimates and judgments are continually evaluated and are made based on historical experience and other factors, including expectations of future events that are reasonable under the circumstances.
The items subject to the most significant application of judgment and estimates are as follows:
Fair value of financial instruments As described in note 33.4, where the fair value of financial assets and financial liabilities cannot be derived from active markets, the Credit Union uses valuation techniques that include the use of mathematical models. The inputs to these models are derived from observable market data where possible, but where observable market data are not available, judgment is required to establish fair values. The judgments include considerations of liquidity and model inputs, such as discount rates and prepayment rates. Management believes that the chosen valuation techniques and assumptions used are appropriate in determining the fair value of financial instruments. Note 33.4 provides detailed information about the key assumptions used in the determination of the fair value of financial instruments, as well as the detailed sensitivity analysis for these assumptions. Allowance for impaired loans and credit losses The Credit Union reviews its loan portfolio to assess impairment at each consolidated balance sheet date. In determining whether an impairment loss should be recorded in the consolidated statement of comprehensive income, the Credit Union makes judgments as to whether there is any objective evidence indicating an impairment trigger followed by a measurable decrease in the estimated future cash flows from a portfolio of loans before the decrease can be identified with that portfolio. The assessment takes account of historical loss experience for assets with credit risk characteristics and objective evidence of impairment similar to those in the portfolio when scheduling its future cash flows. The methodology and assumptions used for estimating both the amount and timing of future cash flows are reviewed regularly to reduce any differences between loss estimates and actual loss experience. The allowance for impaired loans and credit losses is disclosed in more detail in note 3.7, note 9, and note 10.
45 2017 ANNUAL REPORT | Consolidated Financial Statements

MERIDIAN CREDIT UNION LIMITED NOTES TO THE CONSOLIDATED FINANCIAL STATEMENTS For the year ended December 31, 2017 with comparative figures for 2016
2.2 Use of estimates and judgments (continued)
Impairment of non-financial assets
The Credit Union performs an assessment of its intangible assets and goodwill at each consolidated balance sheet date to determine whether an impairment loss should be recorded in the consolidated statement of comprehensive income. Broker and vendor relationships comprise most of the Credit Union’s intangible assets. The carrying value of broker and vendor relationships is significantly impacted by estimates about the future earnings expected to be generated from new lease originations with existing equipment vendors and brokers. Management assesses the recoverability of the carrying value on a regular basis. Management assesses the carrying amount of goodwill for impairment at least annually. Management must use significant judgment to determine if the recoverable amount is less than the carrying value. Further details on impairment of intangible assets are disclosed in note 3.11. Recognition of securitization arrangements As part of its program of liquidity, capital and interest rate risk management, the Credit Union enters into arrangements to fund growth by entering into mortgage securitization arrangements. As a result of these transactions and depending on the nature of the arrangement, the Credit Union may be subject to the recognition of the funds received as secured borrowings and the continued recognition of the securitized assets. The determination of the requirements for continued recognition requires significant judgment. Further details of securitization arrangements are disclosed in note 24. Deferred income taxes Deferred income tax assets are recognized in respect of unused tax losses or deductible temporary differences to the extent that it is probable that taxable income will be available against which the losses can be utilized. Judgment is required to determine the amount of deferred income tax assets that can be recognized, based on the likely timing and level of future taxable profits, together with future tax planning strategies.
Further details on deferred income taxes are included in note 3.15 and note 18. Retirement benefit obligations The present value of the retirement benefit obligations depends on a number of factors that are determined on an actuarial basis using a number of assumptions. The actuarial valuation involves making assumptions about discount rates, expected rates of return on assets, future salary increases, mortality rates and future pension increases. Due to the long-term nature of these plans, such estimates are subject to significant uncertainty. Any changes in these assumptions will impact the carrying value of the pension obligations. Note 25 provides detailed information about the key assumptions used in the valuation of retirement benefit obligations, as well as the detailed sensitivity analysis for these assumptions.
2.3 Regulatory compliance
Regulations to the Act specify that certain items are required to be disclosed in the consolidated financial statements that are presented at annual meetings of Members. This information has been integrated into these consolidated financial statements and notes. When necessary, reasonable estimates and interpretations have been made in presenting this information.
Note 32 contains additional information disclosed to support regulatory compliance.
3 Summary of significant accounting policies
These consolidated financial statements were prepared on a going concern basis, under the historical cost convention, as modified by the revaluation of certain financial assets and financial liabilities, including derivative financial instruments, at fair value. The principal accounting policies applied in the preparation of these consolidated financial statements are set out below. These policies have been consistently applied to all of the years presented.
462017 ANNUAL REPORT | Consolidated Financial Statements

MERIDIAN CREDIT UNION LIMITED NOTES TO THE CONSOLIDATED FINANCIAL STATEMENTS For the year ended December 31, 2017 with comparative figures for 2016
3.1 Basis of consolidation
The financial results of wholly owned subsidiaries of the Credit Union are included within these consolidated financial statements. All intercompany balances and transactions have been eliminated on consolidation. Investments in which the Credit Union exerts significant influence but not control over operating and financing decisions are accounted for using the equity method. Under equity accounting, investments are initially recorded at cost and adjusted for the Credit Union’s proportionate share of the net income or loss which is recorded in share of profits from investment in associate and share of profits from investment in joint venture in the consolidated statement of comprehensive income. Investments in which the Credit Union exercises joint control are initially recognized at cost and subsequently accounted for using the equity method. The Credit Union’s share of profits from investment in the joint venture is based on financial statements adjusted to conform to the accounting policies of the Credit Union. The joint venture in which the Credit Union participated operates an office building, which generates income from leasing of space for commercial use.
3.2 Business combinations
Business combinations are accounted for using the acquisition method. The acquisition method involves the recognition of the acquiree’s identifiable assets and liabilities, including contingent liabilities, regardless of whether they are recorded in the acquiree’s financial statements prior to acquisition. At acquisition date, the assets and liabilities of the acquired subsidiary are included in the consolidated balance sheet at their fair value, which are also used as the basis for subsequent measurement in accordance with the Credit Union’s accounting policies. Goodwill, if any, is stated after separating out identifiable intangible assets if the fair value of identifiable net assets at the date of acquisition is less than the consideration paid. Any excess of identifiable net assets over consideration paid is recognized in the consolidated statement of comprehensive income immediately after acquisition. Costs incurred in connection with the acquisition are recognized in profit or loss as incurred.
3.3 Foreign currency translation
The consolidated financial statements are presented in Canadian dollars, which is the Credit Union’s functional and presentation currency. Monetary assets and liabilities denominated in foreign currencies, primarily United States (“U.S.”) dollars, are translated into Canadian dollars at exchange rates prevailing on the consolidated balance sheet date. Income and expenses are translated at the exchange rates in effect on the date of the transaction. Exchange gains and losses arising on the translation of monetary items are included in non-interest income for the year.
3.4 Financial assets and financial liabilities
Financial assets and financial liabilities, including derivative financial instruments, are recognized on the consolidated balance sheet of the Credit Union at the time the Credit Union becomes a party to the contractual provisions of the instrument. The Credit Union recognizes financial instruments at the trade date. All financial assets and financial liabilities are measured at fair value on initial recognition.
Financial assets There are four categories of financial assets: loans and receivables; fair value through profit or loss (“FVPL”); held to maturity; and available for sale. Management classifies each financial asset to one of these categories at the time of initial recognition. The classification depends on the purpose for which the asset was acquired. The category determines how the financial asset will be subsequently measured and whether any resulting income and expense is recognized in profit or loss or in other comprehensive income (“OCI”). All financial assets are subject to review for impairment at least at each reporting date. Impairment is recognized when there is objective evidence that a financial asset or a group of financial assets is impaired. Different criteria to determine impairment are applied for each category of financial assets.
47 2017 ANNUAL REPORT | Consolidated Financial Statements

MERIDIAN CREDIT UNION LIMITED NOTES TO THE CONSOLIDATED FINANCIAL STATEMENTS For the year ended December 31, 2017 with comparative figures for 2016
3.4 Financial assets and financial liabilities (continued) The categories of financial assets are described below: (a) Loans and receivables Loans and receivables are non-derivative financial assets with fixed or determinable payments that are not quoted in an active market (other than investments where the Credit Union intends to sell in the short-term or where the Credit Union may not recover substantially all of the investment, which have been designated as available for sale). The Credit Union has designated receivables, loans to Members, finance receivables and fixed term deposits with Central 1 as loans and receivables. Financial assets classified as loans and receivables are initially measured at fair value net of loan fees and direct transaction costs and are subsequently measured at amortized cost using the effective interest method of amortization less provision for impairment.
Securities purchased under reverse repurchase agreements The Credit Union enters into short-term purchases of securities under agreements to resell (reverse repurchase agreements) as well as short term sales of securities under agreements to repurchase (repurchase agreements) at predetermined prices and dates. Given that these transactions do not meet the derecognition criteria described in note 3.4, these agreements are treated as collateralized lending and borrowing. Securities purchased under agreements to resell are not recognized as securities on the consolidated balance sheet and the consideration paid, including accrued interest, is recorded in securities purchased under reverse purchase agreements. The difference between the purchase and resale prices is recorded in net interest income and is accrued over the life of the agreement using the effective interest method. These agreements are classified as loans and receivables. (b) Financial assets at fair value through profit or loss Financial assets at FVTPL include financial assets that are either classified as held for trading or that meet certain conditions and are designated at fair value through profit or loss on initial recognition. All of the Credit Union’s derivative financial instruments fall into this category as well as cash and cash equivalents, except for short-term investments with less than 100 days maturity from the date of acquisition, which are classified as loans and receivables. Financial assets at FVTPL are initially recognized at fair value, and transaction costs are expensed in the consolidated statement of comprehensive income. They are subsequently measured at fair value with gains and losses recognized in profit or loss. Derivative financial instruments Derivative financial instruments are contracts, such as options, swaps, swaptions and forward contracts, where the value of the contract is derived from the price of an underlying variable. The most common underlying variables include stocks, bonds, commodities, currencies, interest rates and market rates. The Credit Union periodically enters into derivative contracts to manage financial risks associated with movements in interest rates and other financial indices as well as to meet the requirements to participate in the Canada Mortgage Bond Program (“CMB Program”) for securitization as discussed in note 24. The Credit Union’s policy is not to utilize derivative financial instruments for trading or speculative purposes. Assets in this category are measured at fair value. Gains or losses are recognized in profit or loss in other interest income, unless the derivative is designated as a hedging instrument. For designated hedging instruments, the recognition of the gain or loss will depend on the hedge accounting rules described below. Gains or losses on derivative financial instruments are based on changes in fair value determined by reference to active market transactions or using a valuation technique where no active market exists. Certain derivatives embedded in other financial instruments, such as the embedded option in an index-linked term deposit product, are treated as separate derivative financial instruments when their economic characteristics and risks are not closely related to those of the host contract and the host contract is not carried at fair value through profit or loss. These embedded derivatives are separately accounted for at fair value, with changes in fair value recognized in profit or loss.
Hedge accounting The Credit Union documents at the inception of the transaction the relationship between hedging instruments and hedged items, as well as the risk management objectives and strategies for undertaking various hedge transactions. The Credit Union also documents its assessment, both at hedge inception and on an ongoing basis, of whether the derivative financial instruments that are used in hedging transactions are highly effective in offsetting changes in fair values or cash flows of hedged items attributable to the hedged risk. In a cash flow hedge, the effective portion of changes in fair value of derivatives that are designated and qualify as cash flow hedges is recognized in OCI. The gain or loss relating to the ineffective portion is recognized immediately in profit or loss within net interest income. Amounts accumulated in OCI are reclassified to profit or loss in the periods when the hedged item affects profit or loss and are recorded within net interest income. The Credit Union utilizes cash flow hedges primarily to convert floating rate assets and liabilities to fixed rate.
482017 ANNUAL REPORT | Consolidated Financial Statements

MERIDIAN CREDIT UNION LIMITED NOTES TO THE CONSOLIDATED FINANCIAL STATEMENTS For the year ended December 31, 2017 with comparative figures for 2016
3.4 Financial assets and financial liabilities (continued) When a hedging instrument expires or is sold, or when a hedge no longer meets the criteria for hedge accounting, any cumulative gain or loss existing in accumulated other comprehensive income (“AOCI”) at that time remains in AOCI and is recognized in the statement of comprehensive income as the hedged item affects earnings. When a forecasted transaction is no longer expected to occur, the cumulative gain or loss that was reported in OCI is immediately transferred to the income statement within net interest income. If a forecasted transaction is no longer highly probable of occurring, but is still likely to occur, hedge accounting will be discontinued and the cumulative gain or loss existing in AOCI at that time remains in AOCI and is amortized to net interest income in the statement of comprehensive income at the same time the hedged item will affect earnings. Cash and cash equivalents Cash and cash equivalents comprise balances with less than 100 days maturity from the date of acquisition. Given the short-term nature, the carrying value of cash and cash equivalents, excluding short-term investments, is a reasonable approximation of fair value. (c) Held to maturity financial assets Held to maturity investments are non-derivative financial assets with fixed or determinable payments and fixed maturities that the Credit Union’s management has the positive intention and ability to hold to maturity. (d) Available for sale financial assets Available for sale financial assets are those intended to be held for an indefinite period of time, which may be sold in response to needs for liquidity or changes in interest rates, exchange rates or equity prices and which are not classified as loans and receivables, fair value through profit or loss or held to maturity. These would include those non-derivative financial assets that are explicitly designated as such or do not qualify for inclusion in any of the other categories of financial assets. The Credit Union has designated its equity investments not subject to significant influence as available for sale. Available for sale financial assets are initially recognized at fair value plus transaction costs. They are subsequently measured at fair value, with any resultant gain or loss recognized in OCI, except for impairment losses which are recognized in profit or loss. Investments in equity instruments that have been designated as available for sale but that do not have a quoted market price in an active market, and whose fair value cannot be reliably measured, are recorded at cost. When financial instruments are derecognized, the cumulative gains and losses previously recognized in AOCI are recognized in profit or loss. Interest income earned on available for sale debt instruments is recognized in profit or loss in other interest income. Dividends received on available for sale equity instruments are recognized in profit or loss in non-interest income in the period that they were declared. Financial liabilities There are two categories of financial liabilities: fair value through profit or loss; and other liabilities. Management classifies each financial liability to one of these categories at the time of initial recognition. The category determines how the financial liability will be subsequently measured and whether any resulting income and expense is recognized in profit or loss or in other comprehensive income.
The categories of financial liabilities are described below: (a) Financial liabilities at fair value through profit or loss The Credit Union’s derivative financial instruments fall into this category and are described above under financial assets. (b) Other liabilities The Credit Union has designated all financial liabilities other than derivative financial liabilities as other liabilities. These include Members’ deposits, borrowings, mortgage securitization liabilities, secured borrowings and trade and other payables. Other liabilities are initially recorded at fair value and subsequently measured at amortized cost using the effective interest method. Obligations related to securities sold under repurchase agreements Securities sold under agreements to repurchase at a specified future date are not derecognized from the consolidated balance sheet. The corresponding cash received is recognized in the consolidated balance sheet with a corresponding obligation to return it, including accrued interest as a liability within obligations related to securities sold under repurchase agreements, reflecting the transaction’s economic substance as a loan to the Credit Union. The difference between the sale and repurchase price is treated as interest and recognized over the life of the agreement using the effective interest method. These agreements are classified as financial liabilities at amortized cost.
49 2017 ANNUAL REPORT | Consolidated Financial Statements

MERIDIAN CREDIT UNION LIMITED NOTES TO THE CONSOLIDATED FINANCIAL STATEMENTS For the year ended December 31, 2017 with comparative figures for 2016
3.4 Financial assets and financial liabilities (continued) Derecognition of financial instruments Financial assets are derecognized when contractual rights to the cash flows from the asset have expired, or when substantially all of the risks and rewards of ownership are transferred. If the Credit Union has neither transferred nor retained substantially all the risks and rewards of ownership, it assesses whether it has retained control over the transferred asset. A financial liability is derecognized when it is extinguished, discharged, cancelled or expired.
3.5 Interest income and expense
Interest-bearing financial instruments Interest income and expense for all interest-bearing financial instruments, except those designated as FVTPL and finance receivables, are recognized within interest income or interest expense in the consolidated statement of comprehensive income as they accrue using the effective interest method. Once a financial asset has been written down as a result of an impairment loss, interest income is recognized using the rate of interest used to discount the future cash flows for the purpose of measuring the impairment loss. The effective interest rate is the rate that exactly discounts the estimated future cash payments and receipts through the expected life of the financial asset or financial liability to its fair value at inception. The effective interest rate is established on initial recognition of the financial asset or liability and incorporates any fees and transaction costs that are integral to establishing the contract. Finance receivables OneCap provides financing to customers through direct financing leases and loans. Direct financing leases, which are contracts under terms that provide for the transfer of substantially all the benefits and risks of the equipment ownership to customers, are carried at amortized cost. These leases are recorded at the aggregate minimum payments plus residual values accruing to the Company less unearned finance income. Revenue is recognized in interest income. Retail loans and dealer financing loans are recorded at amortized cost using the effective interest rate method. Interest income is allocated over the expected term of the loan by applying the effective interest rate to the carrying amount of the loan. At lease inception, the aggregate future minimum lease payments and contractual residual value of the leased asset less unearned income are recorded as finance receivables. Revenue is recognized over the lease term to approximate an equal rate of return on the outstanding net investment. Contractual residual values of finance leases represent an estimate of the values of the equipment at the end of the lease contracts. During the term of each lease, management evaluates the adequacy of its estimate of the residual value and makes allowances to the extent the fair value at lease maturity is estimated to be less than the contractual lease residual value. Initial direct costs that relate to the origination of the finance receivables are capitalized and amortized as part of effective interest. These costs are incremental to individual leases or loans and comprise certain specific activities related to processing requests for financing, such as the costs to underwrite the transaction and commission payments.
3.6 Fee and commission income
Fee and commission income not directly attributable to the acquisition of financial instruments is recognized when the related service is provided and the income is contractually due. Fee and commission income is included in non-interest income on the consolidated statement of comprehensive income. Fee and commission income that is directly attributable to acquiring or issuing a financial asset or financial liability not classified as FVTPL, is added to or deducted from the initial carrying value. Fee and commission income is then included in the calculation of the effective interest rate and amortized through profit or loss over the term of the financial asset or financial liability. For financial instruments carried at FVTPL, transaction costs are immediately recognized in profit or loss on initial recognition.
502017 ANNUAL REPORT | Consolidated Financial Statements

MERIDIAN CREDIT UNION LIMITED NOTES TO THE CONSOLIDATED FINANCIAL STATEMENTS For the year ended December 31, 2017 with comparative figures for 2016
3.7 Impairment of financial assets The Credit Union assesses at each consolidated balance sheet date whether there is objective evidence that a financial asset or group of financial assets is impaired. (a) Financial assets carried at amortized cost A financial asset or group of financial assets are impaired only if there is objective evidence of impairment as a result of one or more events that occurred after the initial recognition of the asset (a “loss event”) and that loss event or events has an impact on the estimated future cash flows of the financial asset or group of financial assets that can be reliably estimated. The criteria that the Credit Union uses to determine that there is objective evidence of an impairment include delinquency in contractual payments of principal or interest, financial difficulties experienced by the borrower, breach of loan covenants or conditions, initiation of bankruptcy proceedings or deterioration in the value of collateral. The Credit Union completes an assessment to determine whether objective evidence of impairment exists on an individual and/or collective basis. If the Credit Union determines that objective evidence of impairment does not exist for an individually assessed financial asset, it includes the asset in a group of financial assets with similar credit risk characteristics and collectively assesses the group for impairment. Assets that are individually assessed for impairment and for which an impairment is identified, are not included in the collective assessment of impairment. The specific allowance assessed on an individual financial asset is measured as the amount that is required to reduce the carrying value of the impaired asset to its estimated realizable amount, which is generally the fair value of the security underlying the asset, net of expected costs of realization. Expected costs of realization are determined by discounting at the financial asset’s original effective interest rate. The carrying value of the asset is reduced through the use of an allowance account and the amount of the loss is recognized in the consolidated statement of comprehensive income. The estimated period between when a loss occurs and its identification is determined by management to be 12 months, on average, for the purpose of collectively provisioning loans. For the purposes of the collective evaluation of impairment, financial assets are grouped on the basis of similar credit risk characteristics. Future cash flows within each group are estimated on the basis of the contractual cash flows of the assets in the group and historical loss experience for assets with credit risk characteristics similar to those in the group. Historical loss experience is adjusted on the basis of current observable data to reflect the effects of current conditions that did not affect the period on which the historical loss experience is based and to remove the effects of conditions in the historical period that do not currently exist. The methodology and assumptions used for estimating future cash flows are reviewed regularly by the Credit Union to reduce any differences between loss estimates and actual loss experience. An impairment loss on an investment carried at amortized cost is reversed if the reversal can be related objectively to an event occurring after the impairment loss was recognized. The reversal is recognized in the consolidated statement of comprehensive income. For finance receivables, an account balance is considered impaired when there is objective evidence there has been a deterioration of credit quality subsequent to initial recognition, to the extent OneCap no longer has reasonable assurance as to the timely collection of the full amount of principal and interest. If a finance receivable is determined to be impaired, a specific allowance is recorded. For finance receivables that are found not to be impaired, they are assessed collectively, in groups of assets with similar risk characteristics, to determine whether an allowance should be made due to loss events that have been incurred but whose effects are not yet evident. The collective assessment takes into account management’s judgment, data from the lease portfolio such as levels of arrears, historical loss experience and other relevant indicators. (b) Financial assets classified as available for sale When objective evidence of impairment exists, which may include a decline in fair value or recoverable amount of the future cash flows below the cost that is other than temporary, an impairment loss is recorded. All impairment losses are recognized in the consolidated statement of comprehensive income. Any decline in fair value of an available for sale financial asset recognized previously in other comprehensive income that is considered to be impaired is taken into profit or loss for the year. Impairment losses relating to an available for sale debt instrument are reversed when in a subsequent period, the fair value of the instrument increases and the increase can be objectively related to an event occurring after the loss was recognized.
51 2017 ANNUAL REPORT | Consolidated Financial Statements
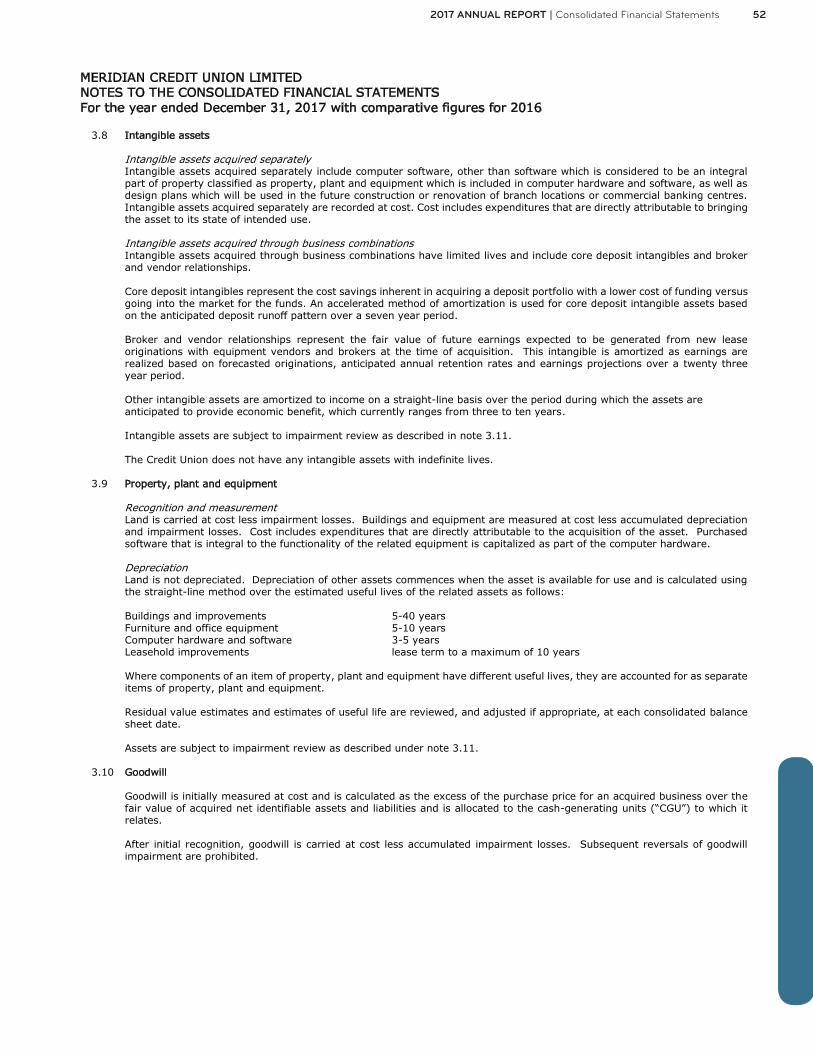
MERIDIAN CREDIT UNION LIMITED NOTES TO THE CONSOLIDATED FINANCIAL STATEMENTS For the year ended December 31, 2017 with comparative figures for 2016
3.8 Intangible assets
Intangible assets acquired separately Intangible assets acquired separately include computer software, other than software which is considered to be an integral part of property classified as property, plant and equipment which is included in computer hardware and software, as well as design plans which will be used in the future construction or renovation of branch locations or commercial banking centres. Intangible assets acquired separately are recorded at cost. Cost includes expenditures that are directly attributable to bringing the asset to its state of intended use.
Intangible assets acquired through business combinations Intangible assets acquired through business combinations have limited lives and include core deposit intangibles and broker and vendor relationships. Core deposit intangibles represent the cost savings inherent in acquiring a deposit portfolio with a lower cost of funding versus going into the market for the funds. An accelerated method of amortization is used for core deposit intangible assets based on the anticipated deposit runoff pattern over a seven year period. Broker and vendor relationships represent the fair value of future earnings expected to be generated from new lease originations with equipment vendors and brokers at the time of acquisition. This intangible is amortized as earnings are realized based on forecasted originations, anticipated annual retention rates and earnings projections over a twenty three year period. Other intangible assets are amortized to income on a straight-line basis over the period during which the assets are anticipated to provide economic benefit, which currently ranges from three to ten years. Intangible assets are subject to impairment review as described in note 3.11. The Credit Union does not have any intangible assets with indefinite lives.
3.9 Property, plant and equipment
Recognition and measurement Land is carried at cost less impairment losses. Buildings and equipment are measured at cost less accumulated depreciation and impairment losses. Cost includes expenditures that are directly attributable to the acquisition of the asset. Purchased software that is integral to the functionality of the related equipment is capitalized as part of the computer hardware.
Depreciation
Land is not depreciated. Depreciation of other assets commences when the asset is available for use and is calculated using the straight-line method over the estimated useful lives of the related assets as follows:
Buildings and improvements 5-40 years Furniture and office equipment 5-10 years Computer hardware and software 3-5 years Leasehold improvements lease term to a maximum of 10 years
Where components of an item of property, plant and equipment have different useful lives, they are accounted for as separate items of property, plant and equipment.
Residual value estimates and estimates of useful life are reviewed, and adjusted if appropriate, at each consolidated balance sheet date.
Assets are subject to impairment review as described under note 3.11.
3.10 Goodwill
Goodwill is initially measured at cost and is calculated as the excess of the purchase price for an acquired business over the fair value of acquired net identifiable assets and liabilities and is allocated to the cash-generating units (“CGU”) to which it relates.
After initial recognition, goodwill is carried at cost less accumulated impairment losses. Subsequent reversals of goodwill impairment are prohibited.
522017 ANNUAL REPORT | Consolidated Financial Statements

MERIDIAN CREDIT UNION LIMITED NOTES TO THE CONSOLIDATED FINANCIAL STATEMENTS For the year ended December 31, 2017 with comparative figures for 2016
3.11 Impairment of non-financial assets Non-financial assets that are subject to amortization or depreciation are reviewed for impairment whenever events or changes in circumstances indicate that the carrying value may not be recoverable. An impairment loss is recognized for the amount by which the asset’s carrying value exceeds its recoverable amount. For the purpose of assessing impairment, Credit Union assets are grouped at branch level, which is considered to be the lowest level or CGU for which they are separately identifiable. Meridian’s wholly owned subsidiary is considered to be the CGU for non-financial assets relating to that business. The recoverable amount of a CGU is determined based on a value in use calculation. For broker and vendor relationship intangibles, the recoverable amount is determined by applying current assumptions about lease originations, retention rates and earnings projections of the CGU. For core deposit intangibles, the recoverable amount is determined by applying current assumptions about the inherent cost savings and runoff patterns to the remaining deposit portfolio balance. For other non-financial assets the recoverable amount is the higher of an asset’s fair value less costs to sell and value in use of the CGU to which the asset relates. Non-financial assets that have suffered impairment are reviewed for possible reversal of the impairment at each reporting date. Goodwill is evaluated for impairment against the carrying amount of the CGU at least annually. The carrying amount of the CGU includes the carrying amounts of assets, liabilities and goodwill allocated to the CGU. If the recoverable amount is less than the carrying value, the impairment loss is first allocated to reduce the carrying amount of any goodwill allocated to the CGU and then to the other non-financial assets of the CGU proportionally based on the carrying amount of each asset. Any impairment loss is charged to income in the period in which the impairment is identified.
3.12 Leases
Leases where the Credit Union assumes substantially all the risks and rewards of ownership are classified as finance leases. On initial recognition the leased asset under a finance lease is measured at an amount equal to the lower of its fair value and the present value of the minimum lease payments. Subsequent to initial recognition, the asset is accounted for in accordance with the accounting policy applicable to the asset and depreciated using the straight-line method over the term of the lease. The interest element of the finance cost is charged to profit or loss over the lease period.
Other leases are operating leases and the leased assets are not recognized on the Credit Union’s consolidated balance sheet. Payments made under operating leases are charged to profit or loss on a straight-line basis over the period of the lease.
3.13 Provisions
Provisions are recognized when the Credit Union has a present legal or constructive obligation as a result of past events, it is probable that an outflow of resources will be required to settle the obligation and a reliable estimate of the amount can be made. Where the Credit Union expects a provision to be reimbursed, the reimbursement is recognized as an asset only when the reimbursement is virtually certain. At each consolidated balance sheet date, the Credit Union assesses the adequacy of its pre-existing provisions and adjusts the amounts as necessary based on actual experience and changes in future estimates.
Provisions are measured at the present value of the estimated expenditure required to settle the present obligation and are recorded within operating expenses on the consolidated statement of comprehensive income.
3.14 Employee benefits
(a) Pension obligations
The Credit Union provides post-employment benefits through defined benefit plans as well as a defined contribution plan.
A defined contribution plan is a pension plan under which the Credit Union pays fixed contributions into a separate entity. The Credit Union has no legal or constructive obligation to pay further contributions after its payment of the fixed contribution. The contributions are recognized as employee benefit expense when they are due.
A defined benefit plan is a pension plan that defines an amount of pension benefit that an employee will receive on retirement, usually dependent on one or more factors, such as age, years of service and compensation. The cost of the plan is actuarially determined using the projected unit cost method pro-rated on service and management’s best estimate of discount rates, expected plan investment performance, salary escalation, and retirement ages of employees. The plans include an annual indexation of the lesser of 4% or the increase in the previous calendar year’s Consumer Price Index.
53 2017 ANNUAL REPORT | Consolidated Financial Statements

MERIDIAN CREDIT UNION LIMITED NOTES TO THE CONSOLIDATED FINANCIAL STATEMENTS For the year ended December 31, 2017 with comparative figures for 2016
3.14 Employee benefits (continued) Service cost is the change in the present value of the defined benefit obligation resulting from employee service in either the current period or prior periods and from any gain or loss on settlement. Net interest is the change in the net defined benefit liability or asset that arises from the passage of time. Both service cost and net interest are recognized immediately in salaries and employee benefits. Re-measurements of the net defined benefit liability include actuarial gains and losses arising from experience adjustments and changes in actuarial assumptions, the return on plan assets excluding amounts included in net interest and changes in the effect of any asset ceilings. Re-measurements are recognized immediately in OCI. The net defined benefit liability or asset recognized in the consolidated balance sheet is the plans’ deficit or surplus at the balance sheet date, adjusted for any effect of limiting a net defined benefit asset to the asset ceiling. The plans’ deficit or surplus is the present value of the defined benefit obligation less the fair value of plan assets.
(b) Other post-retirement obligations Other post-retirement obligations include health and dental care benefits for eligible retired employees. The expected costs of these benefits are accrued over the period of employment using an accounting methodology similar to that for defined benefit pension plans along with management’s best estimate of expected health care costs. All employees are eligible for a retirement service award effective July 1, 2015. The expected costs of these benefits are accrued over the period of employment using an accounting methodology similar to that for defined benefit pension plans. (c) Other short-term benefits Liabilities for employee benefits for wages, salaries, termination pay and vacation pay represent the undiscounted amount which the Credit Union expects to pay as at the consolidated balance sheet date including related costs.
3.15 Income taxes
Income tax expense on the consolidated statement of comprehensive income comprises current and deferred income taxes. Income taxes are recognized in profit or loss, except to the extent that they relate to items recognized directly in OCI, in which case they are recognized in OCI.
Current income taxes are the expected taxes refundable or payable on the taxable income for the year, using tax rates enacted or substantively enacted at the consolidated balance sheet date, and any adjustment to tax payable in respect of previous years.
Deferred income taxes are recognized using the liability method, providing for temporary differences between the carrying values of assets and liabilities for financial reporting purposes and the amounts used for taxation purposes. The amount of deferred income tax provided is based on the expected manner of realization or settlement of the carrying value of assets and liabilities, using tax rates enacted or substantively enacted at the consolidated balance sheet date. A deferred income tax asset is recognized only to the extent that it is probable that future taxable profits will be available against which the asset can be utilized. Deferred income tax assets are reduced to the extent that it is no longer probable that the related tax benefit will be utilized.
3.16 Share capital
(a) Member shares Shares are classified as liabilities or Members’ equity according to their terms. Where shares are redeemable at the option of the Member, either on demand or on withdrawal from membership, the shares are classified as liabilities. Residual value in excess of the face value on Member share liabilities, if any, is classified as equity. Where shares are redeemable at the discretion of the Credit Union’s Board of Directors, the shares are classified as equity.
(b) Distributions to Members
Dividends on shares classified as liabilities are charged to profit or loss, while dividends on shares classified as equity are charged to retained earnings. Dividends declared on the Membership shares shall be paid in cash. Members may elect to receive dividends declared on Class A shares by way of cash or newly issued, fully paid equity shares of the same class. Dividends payable in cash are recorded in the period in which they are declared by the Credit Union’s Board of Directors. Dividends payable by way of newly issued shares are recorded in the period in which the shares are issued.
(c) Share issue costs Incremental costs directly attributable to the issue of new shares are shown in equity as a deduction, net of income taxes, from the proceeds.
542017 ANNUAL REPORT | Consolidated Financial Statements

MERIDIAN CREDIT UNION LIMITED NOTES TO THE CONSOLIDATED FINANCIAL STATEMENTS For the year ended December 31, 2017 with comparative figures for 2016
4 Changes in accounting policies
Standards issued but not yet effective up to the date of issuance of the Credit Union’s financial statements are listed below. This listing is of standards and interpretations issued which are expected to apply to the Credit Union at a future date. The Credit Union intends to adopt these standards when they become effective.
(a) IFRS 9, Financial Instruments, was issued in July 2014 and incorporates previously issued components of the new standard.
It replaces the existing guidance in IAS 39, Financial Instruments: Recognition and Measurement. IFRS 9 retains but simplifies the mixed measurement model and establishes three primary measurement categories for financial assets: amortised cost, fair value through OCI and FVTPL. The basis of classification depends on the entity’s business model and the contractual cash flow characteristics of the financial asset. For financial liabilities there were no changes to classification and measurement except for the recognition of changes in own credit risk in other comprehensive income, for liabilities designated at fair value through profit or loss. There are no changes to the measurement basis of its financial assets or financial liabilities as a result of these changes in accounting policy.
IFRS 9 now includes a new expected credit losses model that replaces the incurred loss impairment model used in IAS 39. The model applies to all financial assets that are not measured at FVTPL, including specified financial guarantees and loan commitments issued. The model uses a dual measurement approach under which a loss allowance is measured for each financial asset as either: 12-month expected credit losses; or lifetime expected credit losses. The measurement basis generally depends on whether there has been a significant increase in credit risk since initial recognition. The adoption of the new impairment standards under IFRS 9 is a significant initiative for the Credit Union, supported by a formal project governance framework and a robust implementation plan. It is expected that the changes will result in an increase in the allowance for impaired loans and an earlier recognition of impairment losses in profit and loss. As at January 1, 2018, the Credit Union’s current estimate of the adoption of IFRS 9, subject to refinement, is an overall reduction to Members' Equity in the range of $10 to $15 million, which is attributable to the adoption of the expected credit loss methodology. IFRS 9 also includes changes to hedge accounting guidance and aims to improve the decision usefulness of the financial statements by better aligning hedge accounting with the risk management activities of an entity. It has removed or amended some of the key prohibitions and rules within IAS 39, providing more flexibility to an entity in establishing relationships that would qualify for hedge accounting. IFRS 9 provides the ability for the entity to choose whether to adopt the hedging portion of the standard now or wait until the completion of the hedging standard for “macro” hedges. The Credit Union’s current hedging relationships will not be impacted, since the Credit Union has chosen to continue hedge accounting under IAS 39 until the completion of the new hedging standard.
Consequential amendments were also made to IFRS 7, Financial Instruments: Disclosures introducing expanded qualitative and quantitative disclosures related to IFRS 9.
IFRS 9 is effective for accounting periods beginning on or after January 1, 2018.
(b) IFRS 15, Revenue from Contracts with Customers deals with revenue recognition and establishes principles for reporting
useful information to users of financial statements about the nature, amount, timing and uncertainty of revenue and cash flows arising from an entity’s contracts with customers. The standard excludes from its scope revenue arising from items such as financial instruments, insurance contracts and leases. The standard is effective for annual periods beginning on or after January 1, 2018. IFRS 15 does not have a material impact as the amount of revenue generated through the sale of goods and services that would be impacted by this standard is minimal.
(c) IFRS 16, Leases was issued in January 2016 and sets out the principles for recognition, measurement, presentation and
disclosure of leases for both parties to a contract. The new standard replaces the previous leases standard, IAS 17, Leases. The new standard introduces a single lessee accounting model for all leases by eliminating the distinction between operating and financing leases. IFRS 16 requires lessees to recognize right-of-use assets and lease liabilities for most leases. Lessees will also recognize depreciation expense on the right-of-use asset and interest expense on the lease liability in the statement of income. Short-term leases, which are defined as those that have a lease term of 12 months or less; and leases of low-value assets are exempt. Lessor accounting remains substantially unchanged. Meridian has a significant number of operating leases, comprised mostly of property leases, which are currently accounted for ‘off-balance sheet’. The lease payments are reflected in profit or loss as incurred. The new standard is effective for annual periods beginning on or after January 1, 2019. Meridian is continuing to assess the impacts of this standard.
55 2017 ANNUAL REPORT | Consolidated Financial Statements

MERIDIAN CREDIT UNION LIMITED NOTES TO THE CONSOLIDATED FINANCIAL STATEMENTS For the year ended December 31, 2017 with comparative figures for 2016
5 Acquisitions
Meridian OneCap Credit Corp. On April 22, 2016 the Credit Union purchased all of the shares of a newly formed corporation, OneCap. Pursuant to an Asset Purchase Agreement, effective April 29, 2016, OneCap acquired assets and assumed liabilities constituting the lease financing business carried on in Canada by Roynat Inc. and The Bank of Nova Scotia under the name “Roynat Lease Finance”. Roynat Lease Finance was a supplier of customized commercial equipment leasing solutions. Consideration transferred Meridian completed the transaction for cash consideration of $1,018,815. The purchase price was substantially funded from a credit facility with National Bank of Canada which was secured by the purchased assets. There were no cash and cash equivalent balances acquired as part of the transaction. Acquisition-related costs amounting to $7,537 had been excluded from the consideration transferred and were recognized as an expense in 2016, within non-interest expenses in the consolidated statement of comprehensive income.
Assets acquired and liabilities assumed at the date of acquisition The following table summarizes the fair value assigned to the assets acquired and liabilities assumed at the prior year acquisition date based on initial business combination accounting: Fair values of assets acquired and liabilities assumed at the date of acquisition
2016
Receivables 740
Finance Receivables 906,218
Broker and vendor relationships intangible 51,300
Property, plant and equipment 91
Intangible assets 2
Goodwill 73,232
Other assets 91
Total assets acquired 1,031,674
Accounts payable and accrued liabilities 9,460
Deferred tax liability 3,399
Total liabilities assumed 12,859
Fair value of net assets acquired 1,018,815
Finance receivables and loans included $994,270 of contractual amounts receivable. The best estimate at acquisition date of the contractual cash flows not expected to be collected was $2,150.
Goodwill arising on acquisition Goodwill arose on the transaction because the purchase price included a control premium. In addition, the consideration paid for the combination effectively included amounts in relation to the benefit of expected synergies, revenue growth, future market development and the assembled workforce. These benefits are not recognized separately from goodwill because they do not meet the recognition criteria for identifiable intangible assets. The total amount of goodwill that was expected to be deductible for tax purposes was $52,375.
562017 ANNUAL REPORT | Consolidated Financial Statements

MERIDIAN CREDIT UNION LIMITED NOTES TO THE CONSOLIDATED FINANCIAL STATEMENTS For the year ended December 31, 2017 with comparative figures for 2016
5 Acquisitions (continued) Impact of acquisition on the results of the Credit Union Included in the revenue for the year of acquisition is $20,040 attributable to the additional business generated by OneCap. Revenue is comprised of net interest income and non-interest income. For the year of acquisition, total operating earnings of $1,066 excluding acquisition related costs, was attributable to the acquired company OneCap. Had this business combination been effected at January 1, 2016, the revenue of the Credit Union from continuing operations for 2016 would have been $28,817, and the operating earnings for the year of acquisition, excluding acquisition related costs, would have been $2,472. These pro forma figures represent an approximate measure of the performance of the combined Credit Union on an annualized basis and provide a reference point for comparison in future periods. The following adjustments were incorporated in the determination of the pro forma revenue and profit of the Credit Union assuming that OneCap had been acquired at the beginning of 2016:
Interest expense was adjusted to align with the Credit Union’s credit rating and cost of borrowing. Depreciation and amortization have been reflected based on using the fair values arising on the initial accounting for
the business combination rather than the carrying values recognized in the pre-acquisition financial statements. Operating expenses have been adjusted to include an estimate of the cost of administrative support that was
previously absorbed by OneCap’s parent corporation. 6 Cash and cash equivalents
Cash and cash equivalents include cash on hand, current accounts, restricted funds and short-term investments with other financial institutions.
2017 2016
Cash on hand 32,545 32,342
Deposits with other financial institutions 215,694 450,966
Short-term investments 75,380 -
Restricted funds 20,255 17,324
Total cash and cash equivalents 343,874 500,632
Included in deposits with other financial institutions is $45,957 (2016 – $34,857) held as an unscheduled prepayment cash reserve, a requirement of the Credit Union’s participation in the National Housing Act Mortgage-Backed Securities (“NHA MBS”) program. The use of these funds is restricted to those allowed as provided for by the NHA MBS program. Restricted funds represent cash reserve accounts which are held in trust as security for secured borrowings.
7 Receivables
2017 2016
Commodity tax receivables 5,286 22,649
Other receivables 1,911 4,181
Total receivables - current 7,197 26,830
57 2017 ANNUAL REPORT | Consolidated Financial Statements

MERIDIAN CREDIT UNION LIMITED NOTES TO THE CONSOLIDATED FINANCIAL STATEMENTS For the year ended December 31, 2017 with comparative figures for 2016
8 Financial investments
2017 2016
Central 1 liquidity reserve deposit 825,695 790,766
Other interest bearing financial instruments - 47,000
Investments held to maturity 11,691 4,070
Securities purchased under reverse repurchase agreements 1,281 34,302
All other loans and receivables 1,165 1,165
All other financial investments 839,832 877,303
Central 1 liquidity reserve deposit The Credit Union is a member of Central 1. As a condition of maintaining membership in Central 1 in good standing, the Credit Union is required to maintain on deposit an amount equal to 6% of its assets as at each calendar quarter-end. The deposits bear interest at varying rates, dependent on the terms of the investments. Other interest bearing financial instruments The Credit Union held no (2016 – one) interest bearing deposit with no (2016 – one) Canadian financial institution. This financial instruments is pledged in trust with CHT for CMB reinvestment purposes. Investments held to maturity The Credit Union held one (2016 – none) interest bearing deposit with one (2016 – none) Canadian financial institution and one (2016 – none) Government of Canada bond. These financial instruments are pledged in trust with Canada Housing Trust (“CHT”) for CMB reinvestment purposes. The Credit Union held no National Housing Act mortgage-backed securities, of which nil (2016 - $4,062) is pledged in trust with CHT for CMB reinvestment purposes. These securities mature more than 100 days from the date of acquisition. Under the terms of the CMB program agreement, the Credit Union is not permitted to withdraw the principal held in trust for any purpose other than the contractual settlement of the mortgage securitization liabilities as disclosed in note 24. Securities purchased under reverse repurchase agreements The Credit Union purchases securities eligible for reinvestment in the CMB Program under reverse repurchase agreements for reinvestment management purposes.
9 Loans to Members
2017 2016
Residential mortgages 7,726,486 6,601,531
Personal loans 1,220,311 1,088,218
Commercial loans 4,096,373 3,571,219
13,043,170 11,260,968
Allowance for impaired loans (19,692) (30,648)
Total net loans to Members 13,023,478 11,230,320
Current 4,276,284 3,743,709
Non-current 8,747,194 7,486,611
582017 ANNUAL REPORT | Consolidated Financial Statements

MERIDIAN CREDIT UNION LIMITED NOTES TO THE CONSOLIDATED FINANCIAL STATEMENTS For the year ended December 31, 2017 with comparative figures for 2016
9 Loans to Members (continued)
Residential mortgage loans are repayable in monthly blended principal and interest instalments over a maximum term of ten years, based on a maximum amortization period of 35 years. Open mortgages may be paid off at any time without notice or penalty and closed mortgages may be paid off at the discretion of the Credit Union, but are subject to penalty. Commercial loans and personal loans are generally repayable in monthly blended principal and interest instalments over a maximum amortization period of 30 years, except for line of credit and dealer floorplan loans, which are repayable on a revolving credit basis and require minimum monthly payments. Outstanding balances on credit card loans, included in personal and commercial loans, may be repaid with any amount equal to or exceeding the minimum required payment. The minimum required payment is based on a percentage of the outstanding balance.
Allowance for impaired loans
Residential mortgages
Personal loans
Commercial loans
Collective allowance Total
Year ended December 31, 2017
Balance as at January 1, 2017 652 470 17,923 11,603 30,648
Loans written off (28) (1,427) (10,061) - (11,516)
Recoveries on loans previously written off 39 261 30 - 330
Provision for credit losses 28 1,488 (3,725) 2,439 230
Balance as at December 31, 2017 691 792 4,167 14,042 19,692
Residential mortgages
Personal loans
Commercial loans
Collective allowance Total
Year ended December 31, 2016
Balance as at January 1, 2016 291 749 21,692 11,335 34,067
Loans written off (103) (1,485) (5,435) - (7,023)
Recoveries on loans previously written off 31 343 291 - 665
Provision for credit losses 433 863 1,375 268 2,939
Balance as at December 31, 2016 652 470 17,923 11,603 30,648
Residential mortgages
Personal loans
Commercial loans
Total
Gross impaired loans 8,539 2,438 23,700 34,677
Related security, net of expected costs (7,848) (1,646) (19,533) (29,027)
Balance as at December 31, 2017 691 792 4,167 5,650
Interest income recognized on impaired loans 2,340
Residential mortgages
Personal loans
Commercial loans
Total
Gross impaired loans 10,036 2,872 56,727 69,635
Related security, net of expected costs (9,384) (2,402) (38,804) (50,590)
Balance as at December 31, 2016 652 470 17,923 19,045
Interest income recognized on impaired loans 2,826
The allowance for impaired loans provided for in the accounts of the Credit Union is in accordance with the DICO requirements.
59 2017 ANNUAL REPORT | Consolidated Financial Statements

MERIDIAN CREDIT UNION LIMITED NOTES TO THE CONSOLIDATED FINANCIAL STATEMENTS For the year ended December 31, 2017 with comparative figures for 2016
9 Loans to Members (continued)
Loans past due but not impaired
< 30 days 30-59 days 60-89 days 90 days and
greater
Retail 189,513 23,116 3,554 19
Commercial 84,634 15,585 29 185
Total as at December 31, 2017 274,147 38,701 3,583 204
< 30 days 30-59 days 60-89 days 90 days and
greater
Retail 184,977 20,669 5,339 -
Commercial 68,410 4,893 751 274
Total as at December 31, 2016 253,387 25,562 6,090 274
The following table illustrates the credit quality of financial assets that are neither past due nor impaired.
Retail portfolio risk rating Commercial portfolio risk rating
(% of portfolio) 2017 2016 (% of portfolio) 2017 2016
Unrated 3.3% 4.5% Unrated 0.0% 0.0% A+ 45.6% 40.0% Very low 0.0% 0.0% A 29.0% 33.4% Low 0.1% 0.1% B 12.4% 12.3% Better than average 14.5% 19.5% C 6.6% 6.3% Average 63.7% 61.8% D 2.4% 2.5% Higher 19.4% 16.4% E 0.7% 1.0% Watch list 1.6% 1.7% Distressed 0.7% 0.5%
Refer to note 33.1 - Financial risk management - credit risk for a detailed explanation of the risk rating process for both portfolios. Collateral There are documented policies and procedures in place for the valuation of financial and non-financial collateral. The fair valuation of non-financial collateral is performed if there has been a significant change in the terms and conditions of the loan and/or the loan is considered impaired. For impaired loans, an assessment of the collateral is taken into consideration when estimating the net realizable amount of the loans. The amount and type of collateral and other credit enhancements required depend on the Credit Union’s assessment of counterparty credit quality and repayment capacity. Non-financial collateral is used in connection with both Commercial and Retail loan exposure. The Credit Union standards for collateral valuation, frequency of recalculation of the collateral requirement, documentation, registration and perfection procedures and monitoring are in effect. Non-financial collateral taken by the Credit Union includes vehicles, residential real estate, real estate under development, commercial real estate and business assets, such as accounts receivable, inventory and fixed assets. The main types of financial collateral taken by the Credit Union include cash and negotiable securities issued by governments and investment grade issuers, and assignment of life insurance. Guarantees are also taken to reduce credit exposure risk.
2017 2016
Fair value of collateral held on assets either past due >30 days or impaired
101,218
110,689
602017 ANNUAL REPORT | Consolidated Financial Statements

MERIDIAN CREDIT UNION LIMITED NOTES TO THE CONSOLIDATED FINANCIAL STATEMENTS For the year ended December 31, 2017 with comparative figures for 2016
10 Finance Receivables
2017 2016
Gross investment in finance leases 1,014,558 867,909
Unearned revenue (90,922) (77,443)
Unguaranteed residual values on finance leases 1,670 2,446
Net investment in finance receivables 925,306 792,912
Retail and dealer loans 136,179 137,308
Unamortized deferred costs and subsidies 7,856 6,126
Security deposits (13,303) (12,004)
Allowance for credit losses (6,977) (3,884)
Total finance receivables 1,049,061 920,458
The comparative figures included in this note have been restated to combine dealer financing loans with retail loans, which provides clarity in the specific disclosure of financing loans and leases. The contractual maturities of finance leases and retail loans and dealer financing loans are summarized as follows: Contractual maturities of finance leases and retail loans and dealer financing loans
Finance leases Retail and
dealer loans Total
0 to 12 months 52,975 15,129 68,104
1 to 3 years 343,068 39,282 382,350
3 to 5 years 468,445 71,276 539,721
Over 5 years 60,818 10,492 71,310
Balance as at December 31, 2017 925,306 136,179 1,061,485
Finance leases
Retail and dealer loans
Total
0 to 12 months 54,790 51,483 106,273
1 to 3 years 304,355 36,129 340,484
3 to 5 years 388,247 44,418 432,665
Over 5 years 45,521 5,277 50,798
Balance as at December 31, 2016 792,913 137,307 930,220
61 2017 ANNUAL REPORT | Consolidated Financial Statements

MERIDIAN CREDIT UNION LIMITED NOTES TO THE CONSOLIDATED FINANCIAL STATEMENTS For the year ended December 31, 2017 with comparative figures for 2016
10 Finance Receivables (continued)
The following table is an analysis of finance receivables that are past due as at the statement of financial position date but not impaired: Finance leases past due
Finance leases Retail and
dealer loans Total
< 30 days 700 301 1,001
30-59 days 1,263 64 1,327
60-89 days 683 - 683
90 days and greater 217 219 436
Finance receivables past due but not impaired as at December 31, 2017
2,863 584 3,447
Finance leases Retail and
dealer loans Total
< 30 days 402 190 592
30-59 days 2,178 32 2,210
60-89 days 982 159 1,141
90 days and greater 598 468 1,066
Finance receivables past due but not impaired as at December 31, 2016
4,160 849 5,009
Allowance for credit losses On December 31, 2017, impaired finance receivables amounted to $5,167 (2016 - $4,612). A portion of the finance receivables is expected to be recovered and $2,447 (2016 - $1,781) has been provided for in the allowance for credit losses. The following table represents the reconciliation of the changes in the allowance for credit losses for the years ending December 31:
Finance leases
and retail loans General
allowance 2017
Balance as at January 1, 2017 1,781 2,103 3,884
Charge-offs, net of recoveries (5,954) - (5,954)
Provision for credit losses 6,620 2,427 9,047
Balance as at December 31, 2017 2,447 4,530 6,977
Finance leases
and retail loans General
allowance 2016
Balance as at January 1, 2016 - - -
Charge-offs, net of recoveries (3,381) - (3,381)
Provision for credit losses 5,162 2,103 7,265
Balance as at December 31, 2016 1,781 2,103 3,884
622017 ANNUAL REPORT | Consolidated Financial Statements

MERIDIAN CREDIT UNION LIMITED NOTES TO THE CONSOLIDATED FINANCIAL STATEMENTS For the year ended December 31, 2017 with comparative figures for 2016
11 Derivative financial instruments
The tables below provide a summary of the Credit Union’s derivative portfolio and the notional value of the financial assets or financial liabilities to which the derivatives relate.
Maturities of derivatives
(notional amount) Fair value
Within 1
year 1 to 5 years
More than
5 years Total
Derivative instrument
assets
Derivative instrument
liabilities Year ended December 31, 2017
Foreign exchange derivatives: Forward contracts 750 325 - 1,075 57 53 Equity index-linked options: Purchased equity options 154,462 206,217 - 360,679 26,676 - Interest rate swaps: Designated cash flow hedges 461,250 925,000 893,594 2,279,844 14,416 1,961 Swaptions 10,000 - - 10,000 325 - Total derivative contracts as at December 31, 2017
626,462
1,131,542
893,594
2,651,598
41,474
2,014
Maturities of derivatives
(notional amount) Fair value
Within 1
year 1 to 5 years
More than
5 years Total
Derivative instrument
assets
Derivative instrument
liabilities Year ended December 31, 2016 Foreign exchange derivatives: Forward contracts 2,975 - - 2,975 41 44 Equity index-linked options: Purchased equity options 54,182 200,966 - 255,148 19,446 - Interest rate swaps: Designated cash flow hedges - 711,250 747,513 1,458,763 1,356 12,171 Total derivative contracts as at December 31, 2016
57,157
912,216
747,513
1,716,886
20,843
12,215
The notional amounts are used as the basis for determining payments under the contracts and are not actually exchanged between the Credit Union and its counterparties. They do not represent credit or market risk exposure.
The Credit Union has credit risk, which arises from the possibility that its counterparty to a derivative contract could default on their obligation to the Credit Union. However, credit risk associated with derivative contracts is normally a small fraction of the notional principal amount of the contract. Derivative contracts expose the Credit Union to credit loss where there is a favourable change in market rates from the Credit Union’s perspective and the counterparty fails to perform. The Credit Union only enters into derivative contracts with a counterparty that the Credit Union has determined to be creditworthy. Foreign exchange forward contracts As part of its ongoing program for managing foreign currency exposure, the Credit Union enters into foreign exchange forward contracts to purchase or sell U.S. dollars. These agreements function as an economic hedge against the Credit Union’s net U.S. dollar denominated liability position. The fair value of these contracts as at December 31, 2017 was $4 (2016 – ($3)). Of this net balance, $57 (2016 - $41) is included in derivative instrument assets and $53 (2016 - $44) is included in derivative instrument liabilities. Gains/losses on foreign exchange forward contracts are included in non-interest income. Equity index-linked deposits The Credit Union has $357,077 (2016 - $253,427) of commodity and equity index-linked term deposit products outstanding to its Members. These term deposits have maturities of up to seven years and pay interest to the depositors, at the end of the term, based on the performance of various market indices. The Credit Union has purchased index-linked options agreements with various counterparties to offset the exposure to the indices associated with these products. The Credit Union pays a fixed amount based on the notional amount at the inception of the index-linked option contract. At the end of the term the Credit Union receives from the counterparties payments equal to the amount that will be paid to the depositors based on the performance of the respective indices.
63 2017 ANNUAL REPORT | Consolidated Financial Statements

MERIDIAN CREDIT UNION LIMITED NOTES TO THE CONSOLIDATED FINANCIAL STATEMENTS For the year ended December 31, 2017 with comparative figures for 2016
11 Derivative financial instruments (continued) The purpose of the options agreements is to provide an economic hedge against market fluctuations. These options agreements have fair values that vary based on changes in equity indices. The fair value of these options agreements amounted to $26,676 as at December 31, 2017 (2016 - $19,446). The fair value of the embedded written option in the equity index-linked term deposit products amounted to $26,313 as at December 31, 2017 (2016 – $19,281) and is included as part of Members’ deposits (see note 20). Although hedge accounting is not applied, these agreements continue to be effective as economic hedges.
Interest rate swaps As part of its interest rate risk management process, the Credit Union utilizes interest rate contracts in the form of interest rate swaps, floors and caps, to maintain its interest rate exposure within the preset limits defined within the Board of Directors’ (the “Board”) approved policy. The notional amount relating to these contracts as at December 31, 2017 is $1,396,937 (2016 - $722,500). In compliance with agreements for the secured borrowing facilities, OneCap utilizes interest rate swaps to manage interest rate exposure risk in connection with financing variable rate equipment contract backed notes. The notional amount of swaps relating to secured borrowing agreements at December 31, 2017 is $882,907 (2016 – $736,263). Designated cash flow hedges are interest rate swap agreements which qualify as hedging relationships for accounting purposes under IAS 39, Financial Instruments: Recognition and Measurement. All other interest rate swaps agreements are considered economic hedges. The Credit Union has designated certain hedging relationships involving interest rate swaps that convert variable rate deposits to fixed rate deposits as cash flow hedges. The Credit Union has also designated certain hedging relationships involving interest rate swaps that convert variable rate loans to fixed rate loans. Interest rate swaps that convert variable rate notes to fixed rate notes are also designated as cash flow hedges. The amount of other accumulated comprehensive income that is expected to be reclassified to profit or loss is $15,982 (2016 – $(8,028))
Interest rate swap agreements are valued by netting the credit adjustment, discounted variable and fixed cash flows. Variable cash flows are calculated using implied interest rates as determined by current Canadian Dealer Offered Rate (“CDOR”) and swap interest rates, and term relationships. Fixed cash flows are calculated based on the rates stated in the agreements. These notional cash flows are discounted using the relevant points on the zero interest rate curve as derived from the month-end CDOR and swap rates. As at December 31, 2017, the fixed interest rates on the Credit Union’s interest rate swaps is between 0.9% and 2.2% (2016 – 1.0% and 2.1%) and the fixed interest rate on OneCap’s interest rate swap is 1.4% (2016 – 1.0%). Bond forward contracts As part of its interest rate risk management process, the Credit Union utilizes bond forwards to maintain its interest rate exposure on forecasted debt issuances associated with securitization activity. These hedging relationships are designated as cash flow hedges. Realized gains (losses) on these derivatives are deferred and amortized in accordance with the effective interest rate method along with the debt originated. The amount of other accumulated comprehensive income that is expected to be reclassified to profit or loss over the next 60 months is $(241) (2016 – $(1,319)). Swaptions As part of its interest rate risk management process, the Credit Union utilizes swaptions as an economic hedge against its interest rate exposure on loan commitments. The fair value of these contracts as at December 31, 2017 was $325 (2016 – nil) and is included in derivative instrument liabilities. Gains/losses on swaptions are included in net gain/(loss) on interest rate derivative instruments as part of other interest income (see note 27).
Results of hedge activities recorded in net interest income and OCI
For the year ended December 31, 2017
Net gains (losses)
included in Net interest
income
Before-tax unrealized
gains (losses) included
in OCI
Before-tax realized gains
(losses) included
in OCI
After-tax gains
(losses) included
in OCI
Cash Flow hedges
Ineffective portion (164) - - -
Effective portion - 18,406 5,737 18,812
Reclassified to income during the period (944) - 944 728
(1,108) 18,406 6,681 19,540
642017 ANNUAL REPORT | Consolidated Financial Statements

MERIDIAN CREDIT UNION LIMITED NOTES TO THE CONSOLIDATED FINANCIAL STATEMENTS For the year ended December 31, 2017 with comparative figures for 2016
11 Derivative financial instruments (continued)
For the year ended December 31, 2016
Net gains (losses)
included in Net interest
income
Before-tax unrealized
gains (losses) included
in OCI
Before-tax realized
gains (losses) included
in OCI
After-tax gains
(losses) included
in OCI
Cash Flow hedges
Ineffective portion 29 - - -
Effective portion - 11,161 2,332 10,763
Reclassified to income during the period (1,097) - 1,097 892
(1,068) 11,161 3,429 11,655
12 Investments available for sale
2017 2016
Central 1 Class A shares 47,830 43,649
Central 1 Class E shares 20,081 21,083
Other shares 299 179
Total investments available for sale 68,210 64,911
Shares in Central 1 As a condition of maintaining membership in Central 1, the Credit Union is required to maintain an investment in shares of Central 1, as determined by the Central 1 Board of Directors. They may be surrendered upon withdrawal from membership for proceeds equal to the paid-in value, to be received in accordance with a Central 1 by-law providing for the redemption of its share capital. Central 1 Class A shares are carried at fair value. These shares are subject to annual rebalancing and the redemption value is equal to par value. Accordingly, fair value is considered to be equivalent to par value or redemption value.
Central 1 Class E shares are carried at cost. This class of shares is not subject to annual rebalancing and the redemption value is not equal to par value. There is no active market for these shares, as they are issued only by virtue of membership in Central 1, and the fair value cannot be reliably measured. Other shares The Credit Union holds an insignificant number of shares in cooperative and other entities. The carrying value of these shares is considered to be a reasonable approximation of fair value.
13 Investment in associates
The Credit Union has an investment in CUCO Cooperative Association (“CUCO Co-op”), which is owned collectively by Ontario credit unions and is located in Toronto, ON. CUCO Co-op has a year end of December 31. CUCO Co-op was formed in 2011, through the restructuring of Credit Union Central of Ontario and ABCP (2008) Limited Partnership (the “LP”). During the year, the final third party asset-backed commercial paper (“ABCP”) investment held by CUCO Co-op matured. As at December 31, 2017, the assets of CUCO Co-op consist primarily of cash resources. At a special general meeting of the shareholders on September 27, 2017, the shareholders of CUCO Co-op voted to dissolve the company. Once a tax clearance certificate has been obtained from Canada Revenue Agency, a final distribution will be made to the shareholders.
65 2017 ANNUAL REPORT | Consolidated Financial Statements

MERIDIAN CREDIT UNION LIMITED NOTES TO THE CONSOLIDATED FINANCIAL STATEMENTS For the year ended December 31, 2017 with comparative figures for 2016
13 Investment in associates (continued) As of December 31, 2017, the Credit Union owns 22% (2016 – 22%) of the voting shares of CUCO Co-op, maintaining the largest individual shareholding and held one of five positions on the Board. Consequently, the Credit Union maintains significant influence over the activities of CUCO Co-op. The activities of CUCO Co-op are not considered strategic to the Credit Union.
The Credit Union accounts for its investment in CUCO Co-op using the equity method. The change in the investment balance during the year is as follows:
2017 2016
Balance as at January 1 11,434 12,922
Share of comprehensive income (loss) (27) 252
Distributions received (11,079) (1,740)
Balance as at December 31 328 11,434
The aggregate amounts relating to CUCO Co-op are as follows:
2017 2016
Cash and cash equivalents 1,531 517
Investment securities - 51,451
Other assets 7 18
Total assets 1,538 51,986
Accounts payable 50 74
Total liabilities 50 74
Net assets 1,488 51,912
Share of net assets 328 11,434
2017 2016
Interest income 549 415
Gains (losses) on securities (435) 1,065
Expenses (238) (336)
Comprehensive income of the associate (124) 1,144
Share of comprehensive income (loss) (27) 252
Transactions with CUCO Co-op during the period are comprised of return of capital distributions of $1,084 (2016 - $1,740) and dividend distributions of $9,995 (2016 - $0) on the Class B Shares of CUCO Co-op. They have been recorded as reductions of the investment balance. The Credit Union has not incurred any contingent liabilities or other commitments relating to its investment in the partnership.
662017 ANNUAL REPORT | Consolidated Financial Statements
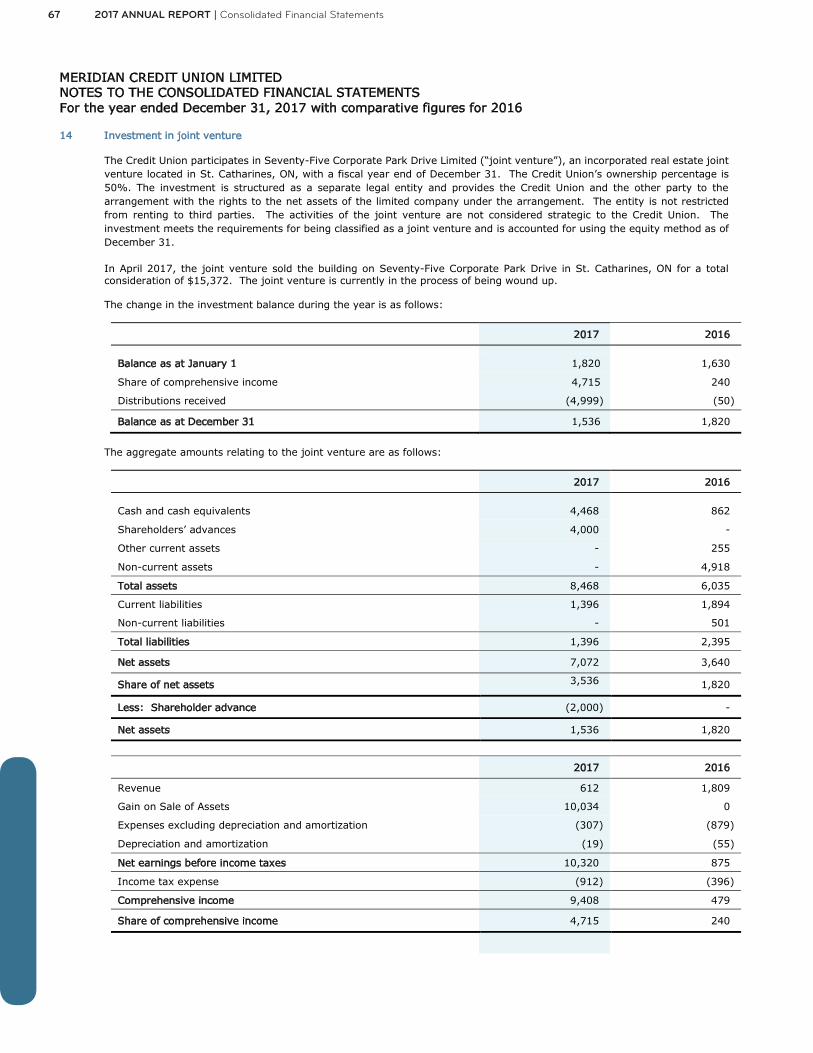
MERIDIAN CREDIT UNION LIMITED NOTES TO THE CONSOLIDATED FINANCIAL STATEMENTS For the year ended December 31, 2017 with comparative figures for 2016
14 Investment in joint venture The Credit Union participates in Seventy-Five Corporate Park Drive Limited (“joint venture”), an incorporated real estate joint venture located in St. Catharines, ON, with a fiscal year end of December 31. The Credit Union’s ownership percentage is 50%. The investment is structured as a separate legal entity and provides the Credit Union and the other party to the arrangement with the rights to the net assets of the limited company under the arrangement. The entity is not restricted from renting to third parties. The activities of the joint venture are not considered strategic to the Credit Union. The investment meets the requirements for being classified as a joint venture and is accounted for using the equity method as of December 31. In April 2017, the joint venture sold the building on Seventy-Five Corporate Park Drive in St. Catharines, ON for a total consideration of $15,372. The joint venture is currently in the process of being wound up. The change in the investment balance during the year is as follows:
2017 2016
Balance as at January 1 1,820 1,630
Share of comprehensive income 4,715 240
Distributions received (4,999) (50)
Balance as at December 31 1,536 1,820
The aggregate amounts relating to the joint venture are as follows:
2017 2016
Cash and cash equivalents 4,468 862
Shareholders’ advances 4,000 -
Other current assets - 255
Non-current assets - 4,918
Total assets 8,468 6,035
Current liabilities 1,396 1,894
Non-current liabilities - 501
Total liabilities 1,396 2,395
Net assets 7,072 3,640
Share of net assets 3,536
1,820
Less: Shareholder advance (2,000) -
Net assets 1,536 1,820
2017 2016
Revenue 612 1,809
Gain on Sale of Assets 10,034 0
Expenses excluding depreciation and amortization (307) (879)
Depreciation and amortization (19) (55)
Net earnings before income taxes 10,320 875
Income tax expense (912) (396)
Comprehensive income 9,408 479
Share of comprehensive income 4,715 240
67 2017 ANNUAL REPORT | Consolidated Financial Statements

MERIDIAN CREDIT UNION LIMITED NOTES TO THE CONSOLIDATED FINANCIAL STATEMENTS For the year ended December 31, 2017 with comparative figures for 2016
14 Investment in joint venture (continued) The Credit Union had an operating lease with the joint venture for its offices at Seventy-Five Corporate Park Drive in St. Catharines, ON. In 2016 the Credit Union entered into a lease amending agreement with the joint venture which extended the maturity date of its operating lease from 2020 to 2026. A tenant inducement of $1,327 was received as consideration. In April 2017 the operating lease was assigned to Henley Corporate Park Drive East Inc. who purchased the building from the joint venture. During 2016 the Credit Union loaned $750 to the joint venture on an interest free basis. The loan was repaid by the joint venture in 2017. The loan balance of $0 (2016 – $750) is included in receivables. Other transactions during the year with the joint venture are comprised of rent, common area maintenance and property taxes paid to the joint venture in the amount of $583 (2016 – $1,723). The Credit Union has not incurred any contingent liabilities or other commitments relating to its investment in the joint venture.
15 Intangible assets
Broker and vendor
relationships
Core deposit intangible
assets Software Other Total
Year ended December 31, 2017
As at January 1, 2017, net carrying value 48,873 677 2,077 158 51,785
Acquisition - - - - -
Additions, separately acquired - - 1,703 - 1,703
Amortization (7,729) (531) (1,469) (24) (9,753)
Disposals (net) - - (10) - (10)
Impairment write-down - - - - -
As at December 31, 2017, net carrying value 41,144 146 2,301 134 43,725
As at December 31, 2017
Cost 51,300 15,195 15,499 343 82,337
Accumulated amortization (10,156) (15,049) (13,198) (209) (38,612)
Net carrying value 41,144 146 2,301 134 43,725
Broker and vendor
relationships
Core deposit intangible
assets Software Other Total
Year ended December 31, 2016
As at January 1, 2016, net carrying value - 1,899 2,943 182 5,024
Acquisition 51,300 - 2 - 51,302
Additions, separately acquired - - 826 - 826
Amortization (2,427) (1,222) (1,694) (24) (5,367)
Impairment write-down - - - - -
As at December 31, 2016, net carrying value 48,873 677 2,077 158 51,785
As at December 31, 2016
Cost 51,300 15,195 13,815 452 80,762
Accumulated amortization (2,427) (14,518) (11,738) (294) (28,977)
Net carrying value 48,873 677 2,077 158 51,785
682017 ANNUAL REPORT | Consolidated Financial Statements

MERIDIAN CREDIT UNION LIMITED NOTES TO THE CONSOLIDATED FINANCIAL STATEMENTS For the year ended December 31, 2017 with comparative figures for 2016
15 Intangible assets (continued)
The comparative figures included in these financial statements have been restated to reflect $2,693 for bank software that has been reclassified from intangible assets to property, plant and equipment.
16 Goodwill
2017 2016
Balance at beginning of the period 73,232 -
Additions, separately acquired -
73,232
Balance at end of the period 73,232 73,232
Goodwill was tested for impairment during the years ended December 31, 2017 and 2016, and no impairment loss was recognized.
17 Property, plant and equipment
Land
Building and
improvements
Furniture and
office
equipment
Computer
hardware and
software
Leasehold
improvements Total
Year ended December 31, 2017
As at January 1, 2017, net carrying value 2,733 8,671 11,609 7,736 19,117 49,866
Acquisition - - - - - -
Additions - 1,147 3,084 4,707 3,012 11,950
Disposals (net) (396) (234) (5) (4) - (639)
Depreciation - (1,128) (3,061) (3,580) (2,871) (10,640)
As at December 31, 2017, net carrying value 2,337 8,456 11,627 8,859 19,258 50,537
As at December 31, 2017
Cost 2,337 23,071 33,022 42,275 38,730 139,435
Accumulated depreciation - (14,615) (21,395) (33,416) (19,472) (88,898)
Net carrying value 2,337 8,456 11,627 8,859 19,258 50,537
69 2017 ANNUAL REPORT | Consolidated Financial Statements

MERIDIAN CREDIT UNION LIMITED NOTES TO THE CONSOLIDATED FINANCIAL STATEMENTS For the year ended December 31, 2017 with comparative figures for 2016
17 Property, plant and equipment (continued)
Land
Building and
improvements
Furniture and
office
equipment
Computer
hardware and
software
Leasehold
improvements Total
Year ended December 31, 2016
As at January 1, 2016, net carrying value 2,733 8,869 10,153 5,452 15,131 42,338
Acquisition - - 20 71 - 91
Additions - 852 4,030 4,980 6,353 16,215
Disposals - (1) (40) (64) (17) (122)
Depreciation - (1,049) (2,554) (2,703) (2,350) (8,656)
As at December 31, 2016, net carrying value 2,733 8,671 11,609 7,736 19,117 49,866
As at December 31, 2016
Cost 2,733 22,825 30,058 37,665 35,728 129,009
Accumulated depreciation - (14,154) (18,449) (29,929) (16,611) (79,143)
Net carrying value 2,733 8,671 11,609 7,736 19,117 49,866
The comparative figures included in these financial statements have been restated to reflect $2,693 for bank software that has been reclassified from intangible assets to property, plant and equipment. The Credit Union leases equipment under non-cancellable finance lease agreements. The lease terms are between five and ten years. Computer hardware includes the following amounts where the Credit Union is a lessee under a finance lease:
2017 2016
Cost - capitalized finance lease 2,624 2,624
Accumulated depreciation (2,615) (2,340)
Net carrying value 9 284
18 Deferred income taxes
2017 2016
Deferred income tax assets
Deferred tax assets to be recovered after more than 12 months 48,483 58,372
Deferred tax assets to be recovered within 12 months 30,422 30,567
Total deferred income tax assets 78,905 88,939
Deferred income tax liabilities
Deferred tax liabilities to be paid after more than 12 months 27,082 28,470 Deferred tax liabilities to be paid within 12 months
8,662 5,568
Total deferred income tax liabilities 35,744 34,038
Net deferred income tax assets 43,161 54,901
702017 ANNUAL REPORT | Consolidated Financial Statements

MERIDIAN CREDIT UNION LIMITED NOTES TO THE CONSOLIDATED FINANCIAL STATEMENTS For the year ended December 31, 2017 with comparative figures for 2016
18 Deferred income taxes (continued) The movement in the deferred income tax account is as follows:
Recognized in
January 1,
2017 Profit or
loss
OCI Members’
equity December
31 2017 Non-capital losses available for carry-forward 13,773 (8,501) - - 5,272
Allowance for impaired loans 7,135 (2,179) - - 4,956
Finance receivables 30,710 4,678 - - 35,388
Employee future benefits 3,670 (145) 45 - 3,570
Other accrued expenses 1,556 9 - - 1,565
Property, plant and equipment 2,655 21,936 - - 24,591
Intangible assets arising from acquisition (4,069) (21,444) - - (25,513)
Deferred expenses (2,694) (1,150) - - (3,844)
Financial instruments adjustments (285) 159 - - (126)
Deferred loan fees 2,206 407 - - 2,613
Mortgage securitization fees (1,950) (700) - - (2,650)
Cash flow hedges 1,669 240 (5,547) - (3,638)
Other 525 284 - 168 977
Total 54,901 (6,406) (5,502) 168 43,161
Recognized in
January 1,
2016 Profit or
loss
OCI Acquisition December
31 2016 Non-capital losses available for carry-forward 15,979 (2,206) - - 13,773
Allowance for impaired loans 6,398 737 - - 7,135
Finance receivables - 30,710 - - 30,710
Employee future benefits 3,629 (215) 256 - 3,670
Other accrued expenses 239 1,317 - - 1,556
Property, plant and equipment 2,566 89 - - 2,655
Intangible assets arising from acquisition (534) (136) - (3,399) (4,069)
Deferred expenses (1,150) (1,544) - - (2,694)
Financial instruments adjustments (942) 657 - - (285)
Deferred loan fees 2,206 - - 2,206
Mortgage securitization fees (896) (1,054) - - (1,950)
Cash flow hedges 4,604 - (2,935) - 1,669
Other 364 161 - - 525
Total 30,257 30,722 (2,679) (3,399) 54,901
19 Other assets
2017 2016
Employee discounts 20,121 15,600
Deferred securitization fees 13,588 11,148
Prepaid assets 4,374 4,468
Other 4,818 4,710
Total other assets 42,901 35,926
Current 12,733 12,035
Non-current 30,168 23,891
71 2017 ANNUAL REPORT | Consolidated Financial Statements

MERIDIAN CREDIT UNION LIMITED NOTES TO THE CONSOLIDATED FINANCIAL STATEMENTS For the year ended December 31, 2017 with comparative figures for 2016
20 Members’ deposits
2017 2016
Demand deposits 5,760,104 4,979,213
Term deposits 3,506,625 3,086,723
Registered plans 2,357,754 2,220,412
Total Members’ deposits 11,624,483 10,286,348
Current 9,716,601 8,170,566
Non-current 1,907,882 2,115,782
Term deposits include equity index-linked deposits and the embedded derivatives as described in note 11.
21 Borrowings
2017 2016
Bank of Nova Scotia 6,306 2,807
National Bank of Canada credit facility 26,500 7,920
Finance lease liabilities 16 567
Total borrowings 32,822 11,294
Current 32,812 11,278
Non-current 10 16
Bank of Nova Scotia credit facility OneCap has established a credit facility with The Bank of Nova Scotia totaling $10,000 (2016 - $11,000) to be used for working capital purposes. The agreement is a revolver facility. The operating line of credit is secured by a standby letter of credit in the amount of $10,000 (2016 - $11,000) issued by the National Bank of Canada under the following facility. As at December 31, 2017, OneCap had access to $7,429 (2016 - $8,467) of available financing from the credit facility. National Bank of Canada credit facility OneCap has established a credit facility with National Bank of Canada totaling $80,000 (2016 - $100,000) to finance the acquisition of assets and for operations. The credit agreement has a maturity date of October 31, 2018 and is secured by eligible equipment leases and loans. As at December 31, 2017, OneCap had access to $43,500 (2016 - $81,080) of available financing from the credit facility. Other credit facilities The Credit Union has a $300,000 (2016 - $300,000) credit facility with the Canadian Imperial Bank of Commerce (“CIBC”). As at December 31, 2017, the CIBC credit facility had a nil balance (2016 - nil). The credit facility is secured by eligible mortgages insured through either Canadian Mortgage and Housing Corporation (“CMHC”) or Genworth. The Credit Union has a settlement risk line totaling $25,000 (2016 - $15,000) with the Bank of Montreal. As at December 31, 2017, the settlement line had a balance of nil (2016- nil). The Credit Union has an overdraft line totaling $240 (2016 - $240) with Caisse Centrale Desjardins (“CCD”). As at December 31, 2017, the overdraft line had a nil balance (2016 - nil). The Credit Union has established a credit facility with Central 1 which is composed of liquidity and contingency facilities. The Credit Union can borrow up to $290,000 and US $10,000 (2016 - $290,000 and US $10,000) on its liquidity facility for which the balance outstanding was nil as at December 31, 2017 (2016 – nil). A contingency credit facility has been established in the amount of $350,000 (2016 - $350,000). Assets have been pledged as security for the credit facility with Central 1 by an assignment of book debts and a general security agreement subject to adjustment for mortgage collateral pledged against bank borrowings.
722017 ANNUAL REPORT | Consolidated Financial Statements

MERIDIAN CREDIT UNION LIMITED NOTES TO THE CONSOLIDATED FINANCIAL STATEMENTS For the year ended December 31, 2017 with comparative figures for 2016
21 Borrowings (continued) Finance lease liabilities
2017 2016
Gross finance lease liabilities - minimum lease payments Within 1 year 8 658
1 to 5 years 12 21
20 679
Future finance charges on finance lease liabilities (4) (112)
Present value of finance lease liabilities 16 567
The present value of minimum lease payments is as follows: Within 1 year 6 551
1 to 5 years 10 16
Present value of finance lease liabilities 16 567
22 Payables and other liabilities
2017 2016
Accounts payable and accrued liabilities 24,233 21,684 Deferred income 3,541 3,059 Cheques and other items in transit 10,095 4,660
Total payables and other liabilities 37,869 29,403
Current 32,931 23,592
Non-current 4,938 5,811 23 Secured borrowings
2017 2016
Variable rate equipment contract backed notes 937,293 801,508
Current 320,361 284,295 Non-current 616,932 517,213
In accordance with a Note Purchase Agreement, OneCap sells variable rate equipment contract backed notes to investors. The notes are collateralized by a specific portfolio of loan and lease contracts secured by new and used small and medium ticket equipment (Portfolio of Assets) originated in Canada. The principal and interest are paid on a monthly basis from collections on the Portfolio of Assets. The Note Purchase Agreement has a commitment expiration date of October 31, 2018. The stated maturity date of the notes is 10 years following the expiration date during which time the notes will amortize and collections from the Portfolio of Assets will be allocated to the notes until they are paid in full. The carrying value of the Portfolio of Assets as at December 31, 2017 is $1,011,875 (2016 – $838,289). In addition, OneCap has cash reserves of $20,255 (2016 – $17,324) held as collateral for notes.
73 2017 ANNUAL REPORT | Consolidated Financial Statements

MERIDIAN CREDIT UNION LIMITED NOTES TO THE CONSOLIDATED FINANCIAL STATEMENTS For the year ended December 31, 2017 with comparative figures for 2016
24 Mortgage securitization liabilities
2017 2016
Mortgage securitization liabilities 1,920,761 1,910,113
Current 220,526 380,165
Non-current 1,700,235 1,529,948
As part of its program of liquidity, capital and interest rate risk management, the Credit Union enters into arrangements to fund growth by entering into mortgage securitization arrangements. These arrangements allow the Credit Union to transfer fully insured residential mortgages to unrelated third parties, generally through the transfer of these assets to multi-seller conduits which issue securities to investors. These transactions are derecognized from the consolidated balance sheet when the transaction meets the derecognition criteria described in note 3.4. In instances where the Credit Union’s mortgage securitizations do not result in a transfer of contractual cash flows of the mortgages or an assumption of an obligation to pay the cash flows of the mortgages to a transferee, the Credit Union has not derecognized the transferred asset and has instead recorded a secured borrowing with respect to any consideration received. During the year, the Credit Union had outstanding mortgage securitization liabilities pertaining to the use of a securitization vehicle to access liquidity.
Under the securitization vehicle the Credit Union packages insured mortgage loan receivables into NHA MBS and in turn sells the MBS to CHT directly through the CMB Program. CHT is financed through the issuance of government-guaranteed mortgage bonds, which are sold to third party investors. Proceeds of the issuances are used by CHT to purchase the government-guaranteed MBS from approved Issuers. The Credit Union issues MBS to CHT under two broad structures. Historically under the terms of the CMB Program, Central 1, on behalf of the Credit Union, acts as counterparty to interest rate swap agreements under which Central 1 pays CHT the interest due to investors on the government-guaranteed mortgage bonds and receives the interest on the MBS sold to CHT. The terms of the interest rate swap agreements are mirrored back exactly between Central 1 and the Credit Union, resulting in the Credit Union ultimately paying CHT the interest due to investors on the government-guaranteed mortgage bonds and receiving the interest on the MBS sold to CHT. Accordingly, because they prevent derecognition of MBS liabilities as per their amortization profiles, these interest rate swap agreements are not recognized. During the year, the Credit Union has entered into an additional securitization structure. Agreements have been entered into whereby National Bank or Central 1 acts as counterparty to interest rate swap agreements under which National Bank or Central 1 pays CHT the interest due to investors on the government-guaranteed mortgage bonds and receives the interest on the MBS sold to CHT. No swap is mirrored back between National Bank or Central 1 and the Credit Union. As such, National Bank or Central 1 assumes the associated reinvestment risk. Accordingly, on such structures, the Credit Union derecognizes MBS liabilities issued to CHT in line with their amortization profiles. As all mortgages securitized by the Credit Union are required to be fully insured prior to sale, they pose minimal to no credit risk to the Credit Union immediately before or any time after the securitization transaction. Under both schemes, the Credit Union remains exposed to interest rate and timely payment risks associated with the underlying assets. As such, the assets, liabilities, revenues and expenses have not been derecognized and the transactions are accounted for as secured financing transactions in the Credit Union’s consolidated balance sheet and consolidated statement of comprehensive income. In addition to securitizing mortgages for liquidity purposes as described above, the Credit Union also packages residential insured mortgage loan receivables into MBS and in turn utilizes them to meet the reinvestment needs of the CMB Program. As principal is received on mortgages securitized into the CMB Program through the securitization vehicle, it is required to be reinvested in accordance with CMB guidelines. These MBS are transferred to CHT as required to meet these reinvestment requirements.
Costs incurred in the establishment of a securitization issue are amortized over the life of the issue as part of mortgage securitization cost of funds included within interest expense – other. Meridian purchases interests in MBS and interest bearing investments purchased from third parties as part of its reinvestment strategy. The MBS are issued by CMHC-sponsored securitization trusts and are collateralized by the assets owned by them. As at December 31, 2017, the carrying value of the purchased MBS (excluding accrued interest) included in Financial investments in the consolidated balance sheet is nil (2016 - $4,062), of which nil (2016 - $4,062) has been designated for reinvestment purposes. The Credit Union is exposed to interest rate risk, as the return on reinvested assets must be sufficient to cover the prepayment exposure. Due to the nature of the underlying risks, Meridian’s total exposure cannot be reasonably determined.
742017 ANNUAL REPORT | Consolidated Financial Statements
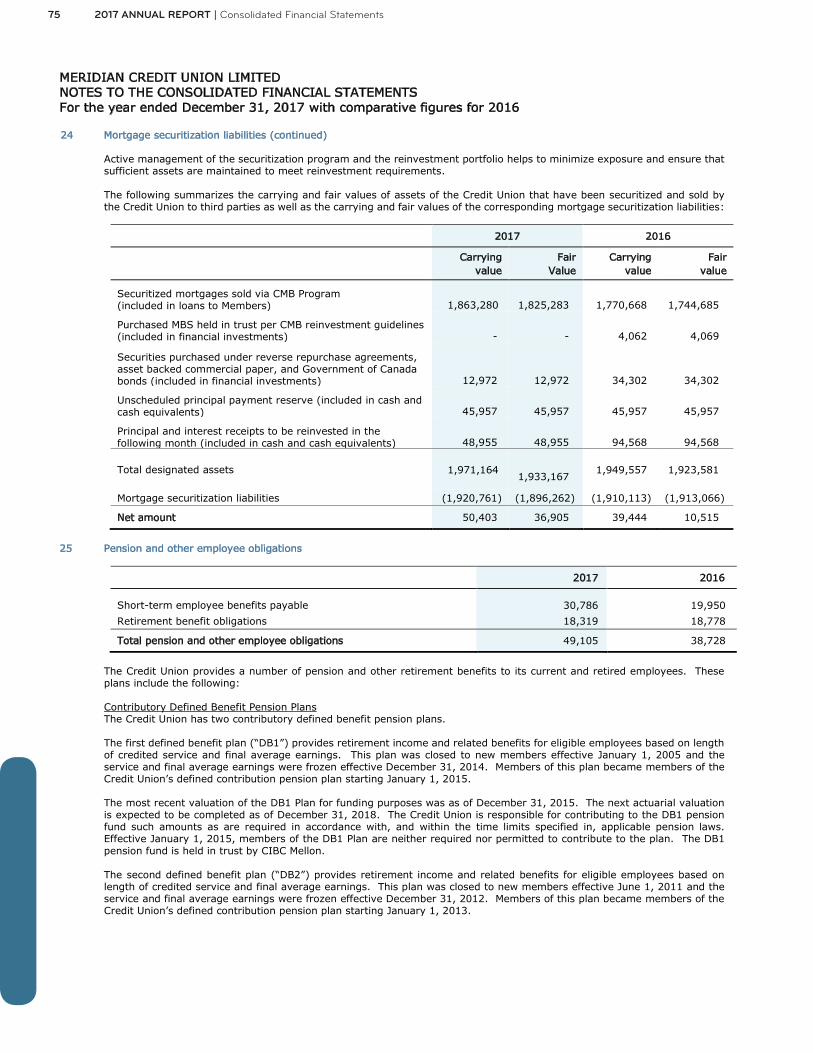
MERIDIAN CREDIT UNION LIMITED NOTES TO THE CONSOLIDATED FINANCIAL STATEMENTS For the year ended December 31, 2017 with comparative figures for 2016
24 Mortgage securitization liabilities (continued) Active management of the securitization program and the reinvestment portfolio helps to minimize exposure and ensure that sufficient assets are maintained to meet reinvestment requirements. The following summarizes the carrying and fair values of assets of the Credit Union that have been securitized and sold by the Credit Union to third parties as well as the carrying and fair values of the corresponding mortgage securitization liabilities:
2017 2016
Carrying
value Fair
Value Carrying
value Fair
value
Securitized mortgages sold via CMB Program (included in loans to Members) 1,863,280 1,825,283
1,770,668 1,744,685
Purchased MBS held in trust per CMB reinvestment guidelines (included in financial investments) - -
4,062
4,069
Securities purchased under reverse repurchase agreements, asset backed commercial paper, and Government of Canada bonds (included in financial investments) 12,972 12,972 34,302 34,302
Unscheduled principal payment reserve (included in cash and cash equivalents) 45,957
45,957 45,957 45,957
Principal and interest receipts to be reinvested in the following month (included in cash and cash equivalents) 48,955 48,955 94,568
94,568
Total designated assets 1,971,164
1,933,167
1,949,557
1,923,581
Mortgage securitization liabilities (1,920,761) (1,896,262) (1,910,113) (1,913,066)
Net amount 50,403 36,905 39,444 10,515
25 Pension and other employee obligations
2017 2016
Short-term employee benefits payable 30,786 19,950
Retirement benefit obligations 18,319 18,778
Total pension and other employee obligations 49,105 38,728
The Credit Union provides a number of pension and other retirement benefits to its current and retired employees. These plans include the following: Contributory Defined Benefit Pension Plans The Credit Union has two contributory defined benefit pension plans. The first defined benefit plan (“DB1”) provides retirement income and related benefits for eligible employees based on length of credited service and final average earnings. This plan was closed to new members effective January 1, 2005 and the service and final average earnings were frozen effective December 31, 2014. Members of this plan became members of the Credit Union’s defined contribution pension plan starting January 1, 2015. The most recent valuation of the DB1 Plan for funding purposes was as of December 31, 2015. The next actuarial valuation is expected to be completed as of December 31, 2018. The Credit Union is responsible for contributing to the DB1 pension fund such amounts as are required in accordance with, and within the time limits specified in, applicable pension laws. Effective January 1, 2015, members of the DB1 Plan are neither required nor permitted to contribute to the plan. The DB1 pension fund is held in trust by CIBC Mellon. The second defined benefit plan (“DB2”) provides retirement income and related benefits for eligible employees based on length of credited service and final average earnings. This plan was closed to new members effective June 1, 2011 and the service and final average earnings were frozen effective December 31, 2012. Members of this plan became members of the Credit Union’s defined contribution pension plan starting January 1, 2013.
75 2017 ANNUAL REPORT | Consolidated Financial Statements

MERIDIAN CREDIT UNION LIMITED NOTES TO THE CONSOLIDATED FINANCIAL STATEMENTS For the year ended December 31, 2017 with comparative figures for 2016
25 Pension and other employee obligations (continued) The most recent valuation of the DB2 Plan for funding purposes was as at December 31, 2016. The next valuation is expected to be completed as at December 31, 2019. The Credit Union is responsible for contributing to the DB2 pension fund such amounts as are required in accordance with, and within the time limits specified in, applicable pension laws. Effective January 1, 2013, members of the DB2 Plan are neither required nor permitted to contribute to the plan. The DB2 pension fund is held in trust by CIBC Mellon. Both of the defined benefit pension plans are operated under Ontario’s Pension Benefits Act. The Pension Benefits Act is administered by the Superintendent of Financial Services appointed by the Financial Services Commission of Ontario (“FSCO”). Plan valuations must be filed with both the FSCO and with the Canada Revenue Agency. The Pension Benefits Act prescribes the minimum contributions that the Credit Union must make to the plan. The Income Tax Act (Canada) places a maximum limit on the amount of employer contributions. Responsibility for governance of the plans, including investment decisions and contribution schedules lies with the Credit Union. Non-contributory Supplemental Executive Retirement Plan 1 This plan is a defined benefit pension plan which provides designated employees benefits in excess of the benefits payable to such employees under the DB1 Plan, under which benefits are restricted by the maximum permitted under the Income Tax Act (Canada). The benefits payable under the Supplemental Plan are based on the benefit formula under the DB1 Plan. The Credit Union has established a trust fund, pursuant to a trust agreement between the Credit Union and the trustee, for the purpose of providing security for the benefits accrued under the Supplemental Plan. A member of this plan will neither be required nor permitted to make any contribution to this plan. Supplemental Executive Retirement Plan 2 This plan mirrors the structure of the Defined Contribution (“DC”) Plan and contains employer pension contributions that exceed the maximum permitted under the Income Tax Act (Canada). Contributions are made on a notional basis and paid out to employees upon termination or retirement. A member of this plan will neither be required nor permitted to make any contribution to this plan. Defined Contribution Pension Plan and Group Registered Retirement Savings Plan (“RRSP”) An employee who becomes a member of the DC Plan and who accrues benefits under the DC provisions is not required or permitted to make contributions to the Plan but is required, on fulfilling certain eligibility requirements, to make contributions to a group RRSP. The Credit Union will contribute each plan year a portion thereof, in respect of a member who is accruing continuous service in Canada, a percentage of the member’s earnings based on the member’s completed years of continuous service. Post-Employment Benefits The Credit Union also provides certain health and dental care benefits for eligible retired employees of the DB1 Plan. Additionally, the Credit Union provides a retirement service award program for all employees who are not eligible for the health and dental benefits mentioned above. For financial reporting purposes, the Credit Union measures the benefit obligations and pension plan assets as at December 31 each year. Components of the net benefit plan expense are as follows: (a) Service cost is the increase in the present value of the accrued benefit obligation resulting from employee service in the
current period or prior periods and from any gain or loss on settlement. (b) Net interest cost is the change in the net defined benefit liability or asset that arises from the passage of time. (c) Remeasurements of the net defined benefit liability include actuarial gains and losses arising from experience adjustments
and changes in actuarial assumptions, the return on plan assets excluding amounts included in net interest and changes in the effect of any asset ceilings.
In 2015 the Credit Union curtailed the post-employment medical benefit plan. Affected employees will no longer be eligible for certain health and dental benefits unless they are aged 55 or older as of July 1, 2017. In 2015 the Credit Union introduced a new retirement service award program for all employees effective July 1, 2015. All employees, other than those grandfathered above, receive the new retirement service award.
762017 ANNUAL REPORT | Consolidated Financial Statements

MERIDIAN CREDIT UNION LIMITED NOTES TO THE CONSOLIDATED FINANCIAL STATEMENTS For the year ended December 31, 2017 with comparative figures for 2016
25 Pension and other employee obligations (continued)
2017 2016
Consolidated balance sheet obligations for:
Pension benefit plans 9,407 10,446
Post-employment benefits 8,912 8,332
18,319 18,778
Consolidated re-measurement loss (gain) included in other comprehensive income for:
Pension benefit plans (48) 1,364
Post-employment benefits 280 (47)
232 1,317
2017 2016
The amounts recognized in the consolidated balance sheet are determined as follows:
Present value of funded obligations
54,094 53,273 Fair value of plan assets
(45,577) (42,827)
Funded plans’ deficit 8,517 10,446 Present value of unfunded obligations
9,802 8,332
Liability recognized in the consolidated balance sheet 18,319 18,778
Defined benefit pensions Post-employment benefits
2017 2016 2017 2016
The movement in the present value of the defined benefit obligation over the year is as follows:
Defined benefit obligation, January 1 53,273 52,138 8,332 8,084
Current service cost 102 23 387 363
Interest cost 2,012 2,087 312 317
Benefits paid (2,649) (2,763) (399) (385)
Remeasurement losses (gains) due to:
Changes in demographic assumptions 548 7 - -
Changes in financial assumptions 1,779 1,835 - -
Experience losses (gains) (81) (54) 280 (47)
Defined benefit obligation, December 31 54,984 53,273 8,912 8,332
2017 2016
Consolidated statement of comprehensive income charged to salaries and employee benefits for:
Defined benefit pension plans
725 614 Defined contribution pension plan
5,911 5,166
Total pension plans 6,636 5,780 Post-employment benefits
695 671
7,331 6,451
77 2017 ANNUAL REPORT | Consolidated Financial Statements

MERIDIAN CREDIT UNION LIMITED NOTES TO THE CONSOLIDATED FINANCIAL STATEMENTS For the year ended December 31, 2017 with comparative figures for 2016
25 Pension and other employee obligations (continued)
Defined benefit pensions Post-employment benefits
2017 2016 2017 2016
The movement in the fair value of plan assets for the year is as follows:
Fair value of plan assets, January 1 42,827 41,670 - -
Interest income 1,616 1,660 - - Return on plan assets, excluding interest income 2,294 424 - - Employer contributions 1,709 1,996 399 385
Benefits paid (2,649) (2,763) (399) (385)
Administrative expenses (220) (160) - -
Fair value of plan assets, December 31 45,577 42,827 - -
Net defined benefit liability 9,407 10,446 8,912 8,332
Actuarial assumptions:
Total pension benefits Post-employment benefits
2017 2016 2017 2016
The principal actuarial assumptions used were as follows:
Discount rate 3.60% 3.90% 3.50% 3.80%
Pension growth rate 2.00% 2.00% - -
Long-term increase in health care costs - - 4.90% 5.20%
Assumptions regarding future mortality are set based on actuarial advice in accordance with published statistics and experience in Canada. These assumptions translate into an average life expectancy in years for a pensioner retiring at age 65 as follows:
2017 2016
Retiring at the end of the reporting period:
Male 86.8 86.6
Female 89.3 89.1
Retiring 20 years after the end of the reporting period:
Male 88.3 87.7
Female 90.7 90.0
The weighted average duration of the defined benefit obligation as at December 31, 2017 is 13.8 years (2016 – 13.6 years). The following shows the expected maturity analysis of undiscounted defined benefit pension and post-employment benefits:
At December 31, 2017 Within 1 year
1 to 5 years
Over 5 years Total
Defined benefit pensions 2,534 10,055 85,962 98,551
Post-employment benefits 445 2,705 14,655 17,805
Total 2,979 12,760 100,617 116,356
At December 31, 2016
Within 1 year
1 to 5 years
Over 5 years Total
Defined benefit pensions 3,234 10,246 87,812 101,292
Post-employment benefits 399 2,021 15,784 18,204
Total 3,633 12,267 103,596 119,496
782017 ANNUAL REPORT | Consolidated Financial Statements
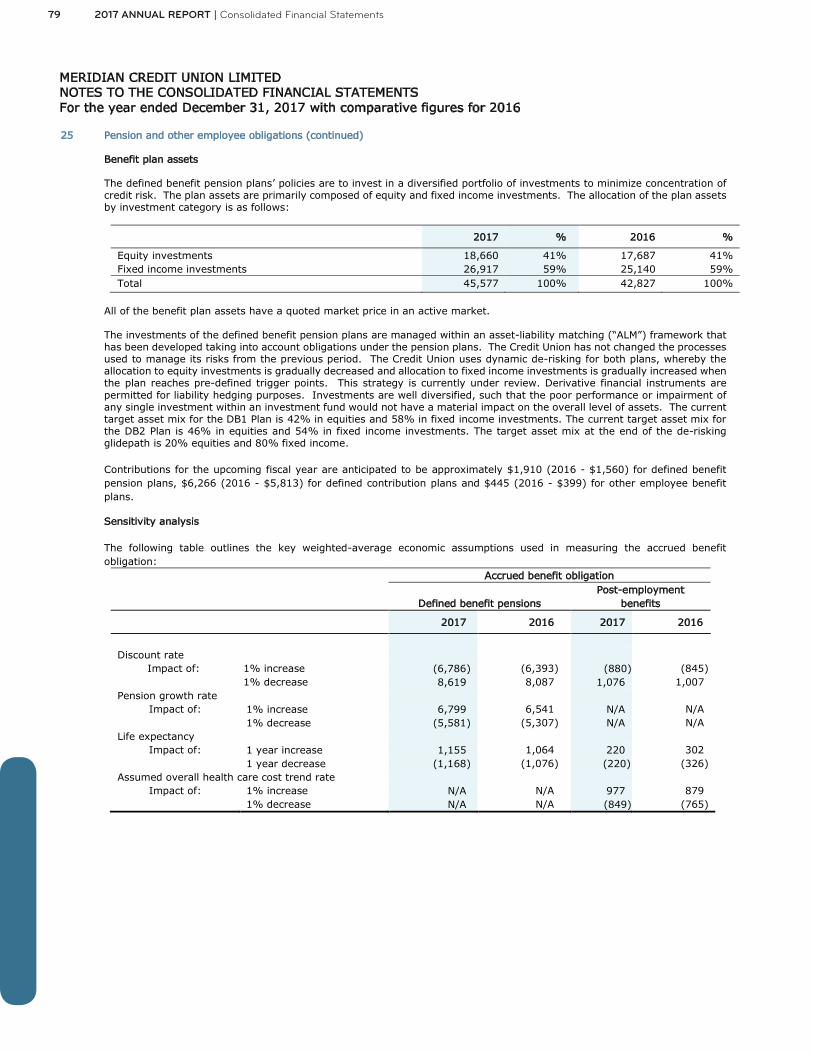
MERIDIAN CREDIT UNION LIMITED NOTES TO THE CONSOLIDATED FINANCIAL STATEMENTS For the year ended December 31, 2017 with comparative figures for 2016
25 Pension and other employee obligations (continued) Benefit plan assets The defined benefit pension plans’ policies are to invest in a diversified portfolio of investments to minimize concentration of credit risk. The plan assets are primarily composed of equity and fixed income investments. The allocation of the plan assets by investment category is as follows:
2017 % 2016 %
Equity investments 18,660 41% 17,687 41% Fixed income investments 26,917 59% 25,140 59% Total 45,577 100% 42,827 100%
All of the benefit plan assets have a quoted market price in an active market. The investments of the defined benefit pension plans are managed within an asset-liability matching (“ALM”) framework that has been developed taking into account obligations under the pension plans. The Credit Union has not changed the processes used to manage its risks from the previous period. The Credit Union uses dynamic de-risking for both plans, whereby the allocation to equity investments is gradually decreased and allocation to fixed income investments is gradually increased when the plan reaches pre-defined trigger points. This strategy is currently under review. Derivative financial instruments are permitted for liability hedging purposes. Investments are well diversified, such that the poor performance or impairment of any single investment within an investment fund would not have a material impact on the overall level of assets. The current target asset mix for the DB1 Plan is 42% in equities and 58% in fixed income investments. The current target asset mix for the DB2 Plan is 46% in equities and 54% in fixed income investments. The target asset mix at the end of the de-risking glidepath is 20% equities and 80% fixed income.
Contributions for the upcoming fiscal year are anticipated to be approximately $1,910 (2016 - $1,560) for defined benefit pension plans, $6,266 (2016 - $5,813) for defined contribution plans and $445 (2016 - $399) for other employee benefit plans.
Sensitivity analysis The following table outlines the key weighted-average economic assumptions used in measuring the accrued benefit obligation:
Accrued benefit obligation
Defined benefit pensions Post-employment
benefits
2017 2016 2017 2016
Discount rate
Impact of: 1% increase (6,786) (6,393) (880) (845) 1% decrease 8,619 8,087 1,076 1,007 Pension growth rate
Impact of: 1% increase 6,799 6,541 N/A N/A 1% decrease (5,581) (5,307) N/A N/A
Life expectancy Impact of: 1 year increase 1,155 1,064 220 302
1 year decrease (1,168) (1,076) (220) (326) Assumed overall health care cost trend rate
Impact of: 1% increase N/A N/A 977 879 1% decrease N/A N/A (849) (765)
79 2017 ANNUAL REPORT | Consolidated Financial Statements

MERIDIAN CREDIT UNION LIMITED NOTES TO THE CONSOLIDATED FINANCIAL STATEMENTS For the year ended December 31, 2017 with comparative figures for 2016
25 Pension and other employee obligations (continued)
The above sensitivity analyses are based on a change in an assumption while holding all other assumptions constant. In practice, this is unlikely to occur, and changes in some of the assumptions may be correlated. When calculating the sensitivity of the defined benefit obligation to significant actuarial assumptions the same method (present value of the defined benefit obligation calculated with the projected unit credit method at the end of the reporting period) has been applied as when calculating the pension liability recognized within the consolidated balance sheet. The methods and types of assumptions used in preparing the sensitivity analysis did not change compared to the previous period. Risks: Through its defined benefit pension plans and post-employment plans, the Credit Union is exposed to a number of risks, the most significant of which are detailed below: a) Equity Risk
The plans hold a significant proportion of equity investments, which are expected to outperform corporate bonds in the long-term while providing volatility and risk in the short-term. As the plans mature and their funded status improves, the Credit Union intends to reduce the level of investment risk by investing more in assets that better match the liabilities. However the Credit Union believes that due to the long-term nature of the plan liabilities, a level of continuing equity investment is an appropriate element of the long term strategy to manage the plans efficiently.
b) Changes in bond yields
The plan liabilities are calculated using a discount rate set with reference to corporate bond yields. A decrease in corporate bond yields will increase plan liabilities, although this will be partially offset by an increase in the value of the plans’ fixed income investments.
c) Inflation risk
The majority of the plans’ benefit obligations are linked to inflation, and higher inflation will lead to higher liabilities. Caps on the level of inflationary increases are in place to protect the plan against extreme inflation. A portion of the plans’ assets are invested in real return bonds, which are expected to provide some protection against changes in inflation. However, a significant portion of the plans’ assets are either unaffected by or loosely correlated with inflation, meaning that an increase in inflation will also increase the deficit.
d) Life expectancy The majority of the plans’ obligations are to provide benefits for the life of the member, so increases in life expectancy will result in an increase in the plans’ liabilities.
26 Share capital
Par value per share 2017 2016
Membership shares classified as liabilities Membership shares 1 321 295
As at December 31 321 295
Members’ capital accounts “50th Anniversary” Class A shares 1 67,773 67,173 Series 96 Class A shares 1 47,029 46,563 Series 98 Class A shares 1
4,106 3,995 Series 01 Class A shares 1 61,159 60,419 Series 09 Class A shares 1 78,628 78,620 Series 15 Class A shares 1 123,767 120,457
120,457
Series 17 Class A shares 1 166,232 -
120,457
As at December 31 548,694 377,227
802017 ANNUAL REPORT | Consolidated Financial Statements

MERIDIAN CREDIT UNION LIMITED NOTES TO THE CONSOLIDATED FINANCIAL STATEMENTS For the year ended December 31, 2017 with comparative figures for 2016
26 Share capital (continued)
(number of shares) Membership
Shares
“ 50th Anniversary”
Class A shares Series 96
Class A shares Series 98
Class A shares
Issued as at January 1, 2016 1,303,834 64,432,504 44,725,656 3,820,961
Shares issued to Members net of redemptions (1,006,617) - - -
Shares issued as dividends - 2,740,895 1,837,659 173,612
Issued as at December 31, 2016 297,217 67,173,399 46,563,315 3,994,573
Shares issued to Members net of redemptions 25,192 (1,828,447) (1,199,519) (40,479)
Shares issued as dividends - 2,427,675 1,665,426 151,863
Issued as at December 31, 2017 322,409 67,772,627 47,029,222 4,105,957
(number of shares) Series 01
Class A shares Series 09
Class A shares Series 15
Class A shares Series 17
Class A shares
Issued as at January 1, 2016 58,092,136 76,346,455 119,708,962 -
Shares issued to Members net of redemptions - - 291,038 -
Shares issued as dividends 2,326,623 2,490,447 747,275 -
Issued as at December 31, 2016 60,418,759 78,836,902 120,747,275 -
Shares issued to Members net of redemptions (1,329,853) (2,577,725) (779,929) 166,926,444
Shares issued as dividends 2,070,037 2,584,989 4,090,237 -
Issued as at December 31, 2017 61,158,943 78,844,166 124,057,583 166,926,444
(a) Authorized share capital The authorized share capital of the Credit Union consists of the following: (i) an unlimited number of Class A special shares, issuable in series (“Class A shares”); (ii) an unlimited number of Class B special shares, issuable in series (“Class B shares”); and (iii) an unlimited number of Membership shares. Membership shares rank junior to Class A shares and to Class B shares for priority in the payment of dividends and, in the event of the liquidation, dissolution or winding up of the Credit Union. In addition, Class B shares rank junior to Class A shares. There are no Class B shares outstanding.
(b) Class A shares “50th Anniversary” Class A shares The “50th Anniversary” Class A shares are non-cumulative, non-voting, non-participating shares with a minimum dividend rate adjusted every five years. The new dividend rate for each five-year period will be set by the Board in its absolute discretion at a rate not less than the chartered bank average five-year GIC rate published by the Bank of Canada Review. The dividend rate for the five-year period beginning on January 1, 2016 was set at 4.00%.
81 2017 ANNUAL REPORT | Consolidated Financial Statements

MERIDIAN CREDIT UNION LIMITED NOTES TO THE CONSOLIDATED FINANCIAL STATEMENTS For the year ended December 31, 2017 with comparative figures for 2016
26 Share capital (continued)
The holders of the “50th Anniversary” Class A shares are entitled to receive dividends, if and when declared by the Board, subject to availability of sufficient earnings to meet the regulatory capital requirements of the Act described in note 33.5.
Any declaration of dividends for the “50th Anniversary” Class A shares is made by the Board in the fourth quarter of the fiscal year and the dividends, if and when declared, are payable annually on January 1. These shares are redeemable at the sole and absolute discretion of the Credit Union’s Board of Directors. Based on these redemption characteristics, these shares have been recorded within Members’ equity as Members’ capital accounts. Dividends declared on the “50th Anniversary” Class A shares in 2017 for the year ended December 31, 2017 amounted to $2,712 (2016 - $2,688), of which $292 (2016 - $261) will be paid in cash and have been recorded in the current year. The remaining $2,420 (2016 - $2,427) will be paid in the form of newly issued “50th Anniversary” Class A shares and will be recorded in the following fiscal year when the shares are issued. Series 96 Class A shares The series 96 Class A shares are cumulative, non-voting, non-participating shares with a dividend rate adjusted every five years. The new dividend rate for each five-year period will be set by the Board in its absolute discretion at a rate not less than 1% above the chartered bank average five-year GIC rate published by the Bank of Canada Review. The dividend rate for the five-year period beginning September 27, 2016 was set at 4.00%. The holders of series 96 Class A shares are entitled to receive dividends, if and when declared by the Board, subject to availability of sufficient earnings to meet the regulatory capital requirements of the Act described in note 33.5. Any declaration of dividends for the series 96 Class A shares is made by the Board in the third quarter of the fiscal year and the dividends, if and when declared, are payable annually on September 26. These shares are redeemable at the sole and absolute discretion of the Credit Union’s Board of Directors. Based on these redemption characteristics, these shares have been recorded within Members’ equity as Members’ capital accounts. Dividends declared and paid on the series 96 Class A shares in 2017 amounted to $1,846 (2016 - $2,014), of which $181 was paid in cash (2016 - $176) and $1,665 (2016 - $1,838) was paid in the form of newly issued series 96 Class A shares. The full amount of the series 96 dividend was recorded in the current fiscal year. Series 98 Class A shares The series 98 Class A shares are non-cumulative, non-voting, non-participating shares with a minimum dividend rate of the average of the month-end five-year GIC rates for the period, plus 1%. The holders of series 98 Class A shares are entitled to receive dividends, if and when declared by the Board, subject to availability of sufficient earnings to meet the regulatory capital requirements of the Act described in note 33.5. Any declaration of dividends for the Series 98 Class A shares is made by the Board in the fourth quarter of the fiscal year and the dividends, if and when declared, are payable annually on January 1. These shares are redeemable at the sole and absolute discretion of the Credit Union’s Board of Directors. Based on these redemption characteristics, these shares have been recorded within Members’ equity as Members’ capital accounts. Dividends declared on the series 98 Class A shares in 2017 for the year ended December 31, 2017 amounted to $164 (2016 - $160), of which $10 (2016 - $8) will be paid in cash and have been recorded in the current year. The remaining $154 (2016 - $152) will be paid in the form of newly issued series 98 Class A shares and will be recorded in the following fiscal year when the shares are issued.
Series 01 Class A shares The series 01 Class A shares are non-cumulative, non-voting, non-participating shares with a minimum dividend rate adjusted every five years. The new dividend rate for each five-year period will be set by the Board in its absolute discretion at a rate not less than 1% above the chartered bank average five-year GIC rate published by the Bank of Canada Review. The dividend rate for the five-year period beginning on December 13, 2016 was set at 4.00%. The holders of series 01 Class A shares are entitled to receive dividends, if and when declared by the Board, subject to availability of sufficient earnings to meet the regulatory capital requirements of the Act described in note 33.5. Any declaration of dividends for the series 01 Class A shares is made by the Board in the third quarter of the fiscal year and the dividends, if and when declared, are payable annually on December 12. These shares are redeemable at the sole and absolute discretion of the Credit Union’s Board of Directors. Based on these redemption characteristics, these shares have been recorded within Members’ equity as Members’ capital accounts. Dividends declared and paid on the series 01 Class A shares in 2017 for the year ended December 31, 2017 amounted to $2,369 (2016 - $2,614), of which $299 was paid in cash (2016 - $288) and $2,070 (2016 - $2,326) was paid in the form of newly issued series 01 Class A shares. The full amount of the series 01 dividend was recorded in the current fiscal year.
822017 ANNUAL REPORT | Consolidated Financial Statements

MERIDIAN CREDIT UNION LIMITED NOTES TO THE CONSOLIDATED FINANCIAL STATEMENTS For the year ended December 31, 2017 with comparative figures for 2016
26 Share capital (continued) Series 09 Class A shares The series 09 Class A shares are non-cumulative, non-voting, non-participating shares with a minimum dividend rate adjusted every five years. The new dividend rate for each five-year period will be set by the Board in its absolute discretion at a rate not less than the chartered bank average five-year GIC rate published by the Bank of Canada Review. The dividend rate for the five-year period beginning on January 1, 2015 was set at 3.90%. The holders of series 09 Class A shares are entitled to receive dividends, if and when declared by the Board, subject to availability of sufficient earnings to meet the regulatory capital requirements of the Act described in note 33.5. Any declaration of dividends for the Series 09 Class A shares is made by the Board in the fourth quarter of the fiscal year and the dividends, if and when declared, are payable annually following each fiscal year end and prior to the annual general meeting of Members. These shares are redeemable at the sole and absolute discretion of the Credit Union’s Board of Directors. Based on these redemption characteristics, these shares have been recorded within Members’ equity as Members’ capital accounts. Dividends declared on the series 09 Class A shares in 2017 for the year ended December 31, 2017 amounted to $3,077 (2016 - $3,076), of which $509 (2016 - $491) will be paid in cash and have been recorded in the current year. The remaining $2,568 (2016 - $2,585) will be paid in the form of newly issued series 09 Class A shares and will be recorded in the following fiscal year when the shares are issued. Series 15 Class A shares Series 15 Class A shares are non-cumulative, non-voting, non-participating shares with a minimum dividend rate adjusted every five years. The new dividend rate for each five-year period will be set by the Board in its absolute discretion at a rate not less than a rate that exceeds by 125 basis points the yield on the monthly series of the Government of Canada five-year bonds as published by the Bank of Canada. The dividend rate for the five-year period ending December 31, 2019 was set at 4.00%. The holders of Series 15 Class A shares are entitled to receive dividends, if and when declared by the Board, subject to availability of sufficient earnings to meet the regulatory capital requirements of the Act described in note 33.5 and subject to Applicable Law. Any declaration of dividends for the Series 15 Class A shares is made by the Board in the fourth quarter of the fiscal year and the dividends, if and when declared, are payable annually following each fiscal year end and prior to the annual general meeting of Members. These shares are redeemable at the discretion of the Credit Union’s Board of Directors, and subject to any approval by a regulator if required pursuant to Applicable Law, not before the end of the fifth year from the date of issuance. Based on these redemption characteristics, these shares have been recorded within Members’ equity as Members’ capital accounts. Dividends declared on the Series 15 Class A shares in 2017 for the year ended December 31, 2017 amounted to $4,965 (2016 - $4,832), of which $797 (2016 - $736) will be paid in cash and have been recorded in the current year. The remaining $4,168 (2016 - $4,096) will be paid in the form of newly issued series 15 Class A shares and will be recorded in the following fiscal year when the shares are issued. Series 17 Class A shares Series 17 Class A shares are non-cumulative, non-voting, non-participating shares with a minimum dividend rate adjusted every five years. The new dividend rate for each five-year period will be set by the Board in its absolute discretion at a rate not less than a rate that exceeds by 300 basis points the yield on the monthly series of the Government of Canada five-year bonds as published by the Bank of Canada. The dividend rate for the five-year period ending December 31, 2021 was set at 4.25%. The holders of Series 17 Class A shares are entitled to receive dividends, if and when declared by the Board, subject to availability of sufficient earnings to meet the regulatory capital requirements of the Act described in note 33.5 and subject to Applicable Law. Any declaration of dividends for the Series 17 Class A shares is made by the Board in the fourth quarter of the fiscal year and the dividends, if and when declared, are payable annually following each fiscal year end and prior to the annual general meeting of Members. These shares are redeemable at the discretion of the Credit Union’s Board of Directors, and subject to any approval by a regulator if required pursuant to Applicable Law, not before the end of the fifth year from the date of issuance. Based on these redemption characteristics, these shares have been recorded within Members’ equity as Members’ capital accounts. Dividends declared on the Series 17 Class A shares in 2017 for the year ended December 31, 2017 amounted to $2,504 (2016 - nil), of which $480 (2016 - nil) will be paid in cash and have been recorded in the current year. The remaining $2,024 (2016 - nil) will be paid in the form of newly issued series 17 Class A shares and will be recorded in the following fiscal year when the shares are issued. (c) Membership shares Par value of one Membership share of the Credit Union is $1 and Members must hold one share. There were 322,409 Members at December 31, 2017 (2016 – 297,217).
83 2017 ANNUAL REPORT | Consolidated Financial Statements

MERIDIAN CREDIT UNION LIMITED NOTES TO THE CONSOLIDATED FINANCIAL STATEMENTS For the year ended December 31, 2017 with comparative figures for 2016
26 Share capital (continued) These shares are redeemable at their issue price only when the Member withdraws from Membership in the Credit Union subject to: (i) the Credit Union’s meeting capital adequacy requirements; and (ii) the discretion of the Board, who may require notice. Based on the redemption features of these shares, they have been recorded as Membership shares within the liability portion of the consolidated balance sheet, and have been designated as other liabilities. The residual equity component is nil.
(d) Dividends Dividends recognized as distributions to owners during the year are as follows:
2017 2016
“50th Anniversary” Class A shares 2,719 3,002 Series 96 Class A shares 1,846 2,014 Series 98 Class A shares 162 182 Series 01 Class A shares 2,369 2,614 Series 09 Class A shares 3,094 2,982 Series 15 Class A shares 4,893 1,483 Series 17 Class A shares 480 -
Balance, December 31 15,563 12,277
Dividends declared during the year that will be paid subsequent to December 31 and which Members have elected to receive by way of newly issued shares of the same series amount to $11,334 (2016 - $9,260). These dividends will be charged to retained earnings in the following year when the shares are issued as follows:
2017 2016
“50th Anniversary” Class A shares 2,420 2,427 Series 98 Class A shares 154 152 Series 09 Class A shares 2,568 2,585 Series 15 Class A shares 4,168 4,096 Series 17 Class A shares 2,024 -
Balance, December 31 11,334 9,260
No dividends have been declared or paid on Membership shares for the years ended December 31, 2017 or December 31, 2016.
842017 ANNUAL REPORT | Consolidated Financial Statements

MERIDIAN CREDIT UNION LIMITED NOTES TO THE CONSOLIDATED FINANCIAL STATEMENTS For the year ended December 31, 2017 with comparative figures for 2016
27 Net interest income
2017 2016
Interest income Residential mortgages 201,932 183,360 Personal loans 47,704 43,678 Commercial loans 165,736 141,734
Interest income - loans to Members 415,372 368,772 Finance receivables
51,770 33,895 Cash and cash equivalents
2,757 1,768 Financial investments
11,920 11,823 Net gain (loss) on interest rate derivative instruments
(174) 30
Total interest income 481,645 416,288
Interest expense Demand deposits 52,966 44,654 Term deposits 69,844 60,306 Registered plans 37,720 35,931
Interest expense - Members’ deposits 160,530 140,891
Interest on borrowings 20,130 14,363 Mortgage securitization cost of funds 37,942 34,668
Total interest expense 218,602 189,922
Interest income on institutional loans, agricultural loans, unincorporated association loans and syndicated loans is included within Commercial loans.
28 Non-interest income
2017 2016
Loan servicing fees 17,408 13,443
Mutual fund revenue 16,570 13,923
Service fees 15,992 14,656
Insurance commissions 7,671 7,165
Foreign exchange 4,777 4,463
Leasing revenue 3,723 3,411
Dividend income 1,961 1,479
Other revenue 4,423 5,050
Total non-interest income 72,525 63,590
85 2017 ANNUAL REPORT | Consolidated Financial Statements
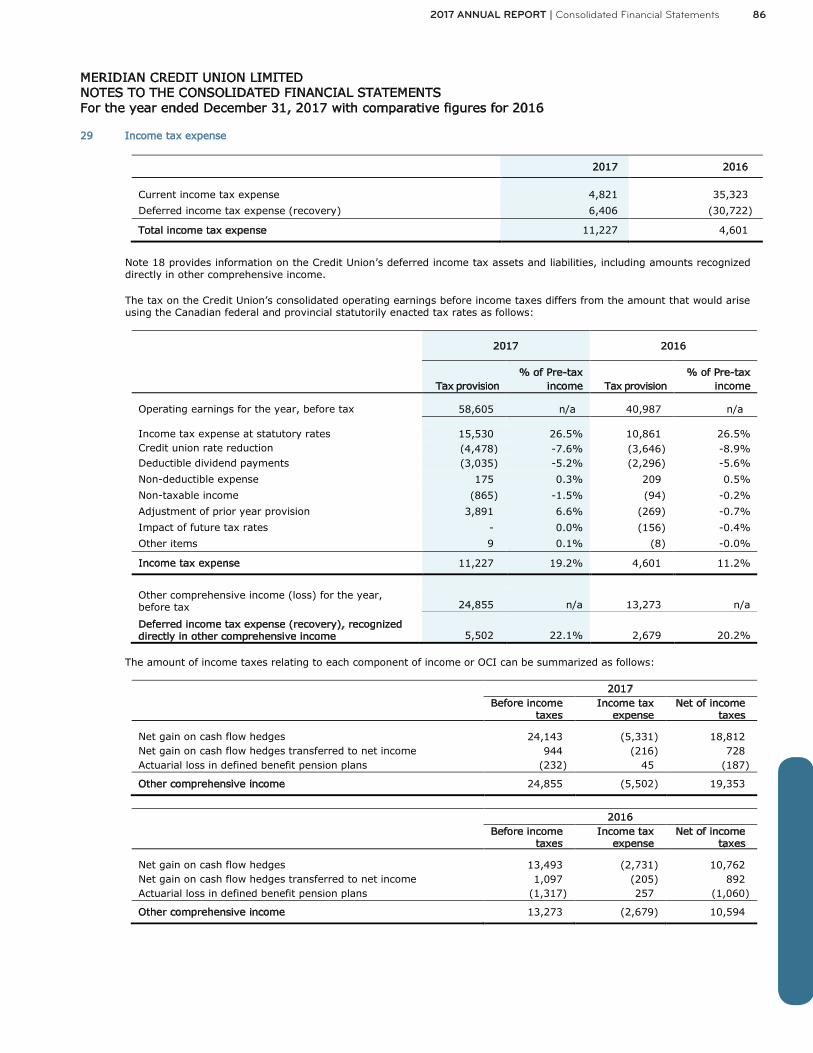
MERIDIAN CREDIT UNION LIMITED NOTES TO THE CONSOLIDATED FINANCIAL STATEMENTS For the year ended December 31, 2017 with comparative figures for 2016
29 Income tax expense
2017 2016
Current income tax expense 4,821 35,323
Deferred income tax expense (recovery) 6,406 (30,722)
Total income tax expense 11,227 4,601
Note 18 provides information on the Credit Union’s deferred income tax assets and liabilities, including amounts recognized directly in other comprehensive income.
The tax on the Credit Union’s consolidated operating earnings before income taxes differs from the amount that would arise using the Canadian federal and provincial statutorily enacted tax rates as follows:
2017 2016
Tax provision % of Pre-tax
income Tax provision % of Pre-tax
income
Operating earnings for the year, before tax 58,605 n/a 40,987 n/a
Income tax expense at statutory rates 15,530 26.5% 10,861 26.5% Credit union rate reduction
(4,478) -7.6% (3,646) -8.9% Deductible dividend payments (3,035) -5.2% (2,296) -5.6%
Non-deductible expense 175 0.3% 209 0.5%
Non-taxable income (865) -1.5% (94) -0.2%
Adjustment of prior year provision 3,891 6.6% (269) -0.7%
Impact of future tax rates - 0.0% (156) -0.4%
Other items 9 0.1% (8) -0.0%
Income tax expense 11,227 19.2% 4,601 11.2%
Other comprehensive income (loss) for the year, before tax 24,855 n/a 13,273 n/a
Deferred income tax expense (recovery), recognized directly in other comprehensive income 5,502 22.1% 2,679 20.2%
The amount of income taxes relating to each component of income or OCI can be summarized as follows:
2017
Before income
taxes Income tax
expense Net of income
taxes Net gain on cash flow hedges 24,143 (5,331) 18,812 Net gain on cash flow hedges transferred to net income 944 (216) 728 Actuarial loss in defined benefit pension plans (232) 45 (187)
Other comprehensive income 24,855 (5,502) 19,353
2016
Before income
taxes Income tax
expense Net of income
taxes Net gain on cash flow hedges 13,493 (2,731) 10,762 Net gain on cash flow hedges transferred to net income 1,097 (205) 892 Actuarial loss in defined benefit pension plans (1,317) 257 (1,060)
Other comprehensive income 13,273 (2,679) 10,594
862017 ANNUAL REPORT | Consolidated Financial Statements

MERIDIAN CREDIT UNION LIMITED NOTES TO THE CONSOLIDATED FINANCIAL STATEMENTS For the year ended December 31, 2017 with comparative figures for 2016
30 Related party transactions
The Credit Union’s related parties include its subsidiaries, associates and joint venture, key management personnel and their close family members as well as any entities that are controlled, jointly controlled or significantly influenced by them, and the post-employment benefit plans. Unless otherwise noted, transactions with related parties include no special terms and conditions and no guarantees were given to or received from the related parties. Outstanding balances are usually settled in cash.
(a) Associate CUCO Co-op, as referred to in note 13, is a related party of the Credit Union.
(b) Joint venture The joint venture referred to in note 14 is a related party of the Credit Union. (c) Post-employment benefit plans The defined benefit plans referred to in note 25 are related parties of the Credit Union. The assets in the defined benefit plans do not include shares in the Credit Union. The Credit Union’s transactions with the defined benefit plans include contributions paid to the plans, which are disclosed in note 25. The Credit Union has not entered into other transactions with the defined benefit plans, neither has it any outstanding balances at the reporting dates. (d) Key management personnel Key management personnel include all members of the Board, officers of the Credit Union and members of the Executive Leadership Team. Transactions with related parties The compensation paid or payable to key management personnel for director or employee services is shown below:
2017 2016
Salaries, retainers, per diems and other short-term employee benefits 5,602 4,742
Post-employment benefits 121 132
Total compensation 5,723 4,874
Related party balances and transactions are detailed below: Loans advanced to related parties
2017 2016
Loan balance as at January 1 3,631 3,850
Change in loan balances during the year 1,519 (219)
Less: Provision for impairment - -
Loan balance as at December 31 5,150 3,631
Total interest revenue earned on loans 126 95
Revolving credit facilities granted to related parties
2017 2016
Total value of facilities approved as at January 1 3,111 2,848
Increase (decrease) in limits granted 947 263
Total value of facilities approved at December 31 4,058 3,111
Balance outstanding (2,344) (1,116)
Net balance available on facilities as at December 31 1,714 1,995
Total interest revenue earned on revolving credit facilities 26 12
87 2017 ANNUAL REPORT | Consolidated Financial Statements
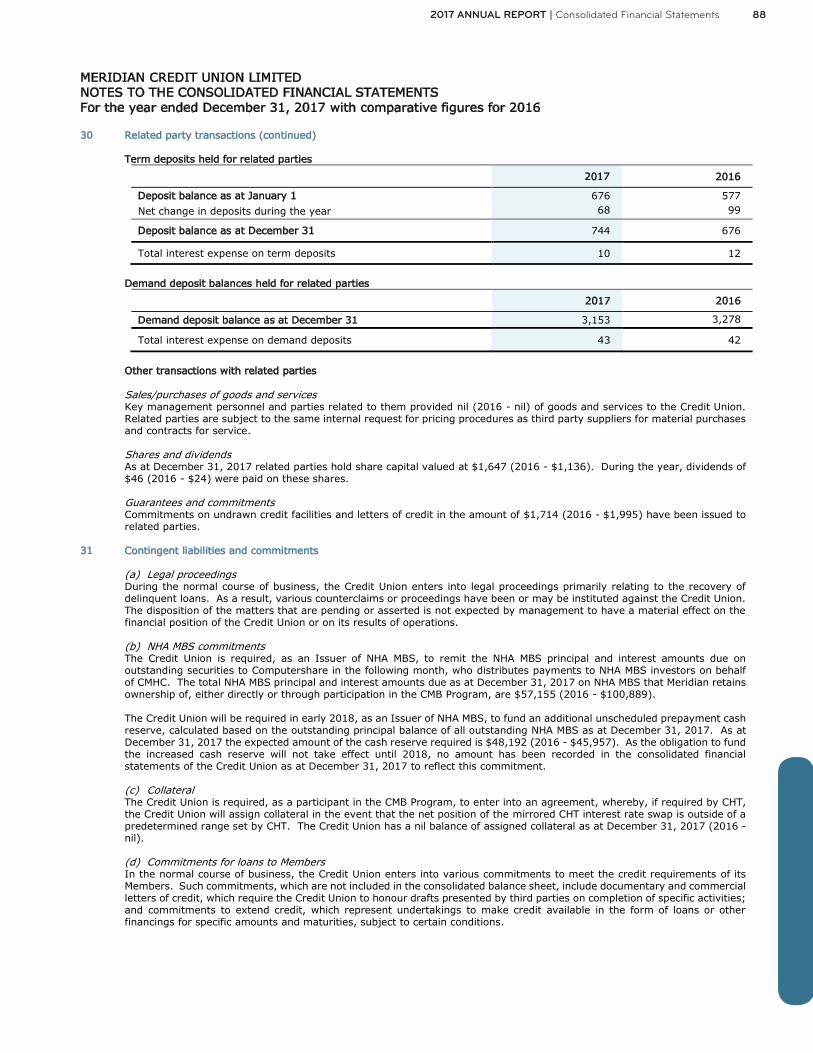
MERIDIAN CREDIT UNION LIMITED NOTES TO THE CONSOLIDATED FINANCIAL STATEMENTS For the year ended December 31, 2017 with comparative figures for 2016
30 Related party transactions (continued) Term deposits held for related parties
2017 2016
Deposit balance as at January 1 676 577
Net change in deposits during the year 68 99
Deposit balance as at December 31 744 676
Total interest expense on term deposits 10 12
Demand deposit balances held for related parties
2017 2016
Demand deposit balance as at December 31 3,153 3,278
Total interest expense on demand deposits 43 42
Other transactions with related parties Sales/purchases of goods and services Key management personnel and parties related to them provided nil (2016 - nil) of goods and services to the Credit Union. Related parties are subject to the same internal request for pricing procedures as third party suppliers for material purchases and contracts for service. Shares and dividends As at December 31, 2017 related parties hold share capital valued at $1,647 (2016 - $1,136). During the year, dividends of $46 (2016 - $24) were paid on these shares. Guarantees and commitments Commitments on undrawn credit facilities and letters of credit in the amount of $1,714 (2016 - $1,995) have been issued to related parties.
31 Contingent liabilities and commitments
(a) Legal proceedings During the normal course of business, the Credit Union enters into legal proceedings primarily relating to the recovery of delinquent loans. As a result, various counterclaims or proceedings have been or may be instituted against the Credit Union. The disposition of the matters that are pending or asserted is not expected by management to have a material effect on the financial position of the Credit Union or on its results of operations. (b) NHA MBS commitments The Credit Union is required, as an Issuer of NHA MBS, to remit the NHA MBS principal and interest amounts due on outstanding securities to Computershare in the following month, who distributes payments to NHA MBS investors on behalf of CMHC. The total NHA MBS principal and interest amounts due as at December 31, 2017 on NHA MBS that Meridian retains ownership of, either directly or through participation in the CMB Program, are $57,155 (2016 - $100,889).
The Credit Union will be required in early 2018, as an Issuer of NHA MBS, to fund an additional unscheduled prepayment cash reserve, calculated based on the outstanding principal balance of all outstanding NHA MBS as at December 31, 2017. As at December 31, 2017 the expected amount of the cash reserve required is $48,192 (2016 - $45,957). As the obligation to fund the increased cash reserve will not take effect until 2018, no amount has been recorded in the consolidated financial statements of the Credit Union as at December 31, 2017 to reflect this commitment. (c) Collateral The Credit Union is required, as a participant in the CMB Program, to enter into an agreement, whereby, if required by CHT, the Credit Union will assign collateral in the event that the net position of the mirrored CHT interest rate swap is outside of a predetermined range set by CHT. The Credit Union has a nil balance of assigned collateral as at December 31, 2017 (2016 - nil).
(d) Commitments for loans to Members In the normal course of business, the Credit Union enters into various commitments to meet the credit requirements of its Members. Such commitments, which are not included in the consolidated balance sheet, include documentary and commercial letters of credit, which require the Credit Union to honour drafts presented by third parties on completion of specific activities; and commitments to extend credit, which represent undertakings to make credit available in the form of loans or other financings for specific amounts and maturities, subject to certain conditions.
882017 ANNUAL REPORT | Consolidated Financial Statements
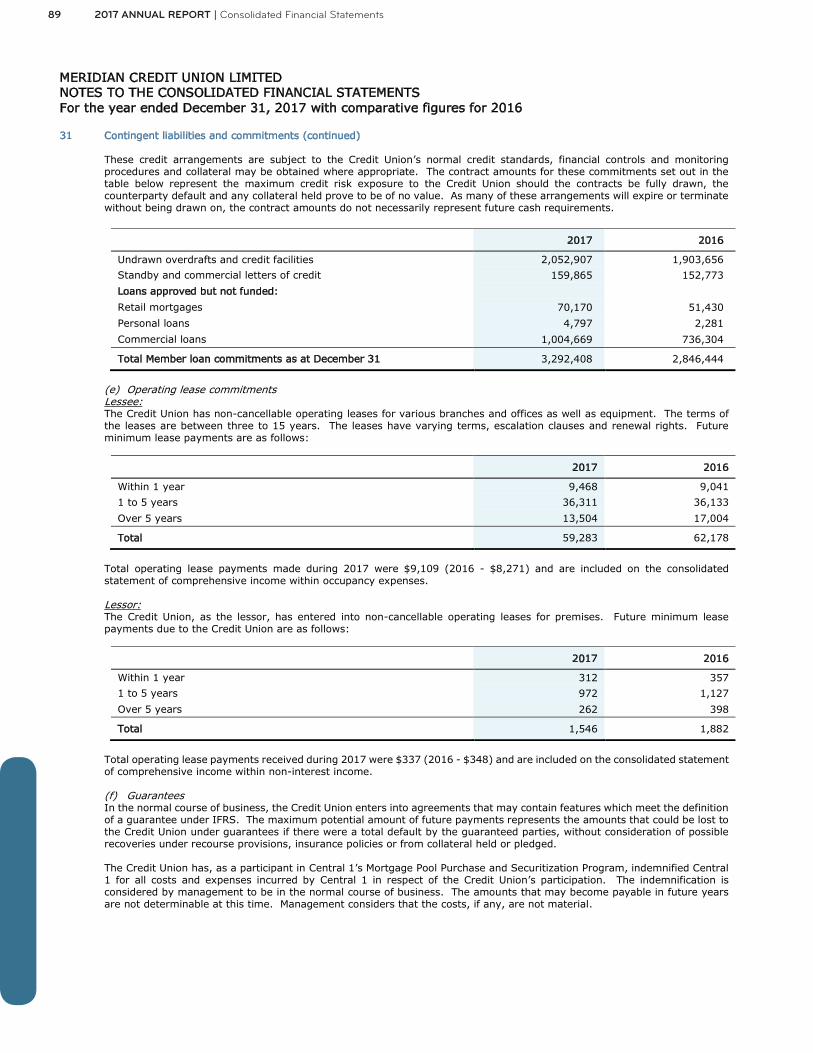
MERIDIAN CREDIT UNION LIMITED NOTES TO THE CONSOLIDATED FINANCIAL STATEMENTS For the year ended December 31, 2017 with comparative figures for 2016
31 Contingent liabilities and commitments (continued) These credit arrangements are subject to the Credit Union’s normal credit standards, financial controls and monitoring procedures and collateral may be obtained where appropriate. The contract amounts for these commitments set out in the table below represent the maximum credit risk exposure to the Credit Union should the contracts be fully drawn, the counterparty default and any collateral held prove to be of no value. As many of these arrangements will expire or terminate without being drawn on, the contract amounts do not necessarily represent future cash requirements.
2017 2016
Undrawn overdrafts and credit facilities 2,052,907 1,903,656
Standby and commercial letters of credit 159,865 152,773
Loans approved but not funded:
Retail mortgages 70,170 51,430
Personal loans 4,797 2,281
Commercial loans 1,004,669 736,304
Total Member loan commitments as at December 31 3,292,408 2,846,444
(e) Operating lease commitments Lessee: The Credit Union has non-cancellable operating leases for various branches and offices as well as equipment. The terms of the leases are between three to 15 years. The leases have varying terms, escalation clauses and renewal rights. Future minimum lease payments are as follows:
2017 2016
Within 1 year 9,468 9,041
1 to 5 years 36,311 36,133
Over 5 years 13,504 17,004
Total 59,283 62,178
Total operating lease payments made during 2017 were $9,109 (2016 - $8,271) and are included on the consolidated statement of comprehensive income within occupancy expenses. Lessor: The Credit Union, as the lessor, has entered into non-cancellable operating leases for premises. Future minimum lease payments due to the Credit Union are as follows:
2017 2016
Within 1 year 312 357
1 to 5 years 972 1,127
Over 5 years 262 398
Total 1,546 1,882
Total operating lease payments received during 2017 were $337 (2016 - $348) and are included on the consolidated statement of comprehensive income within non-interest income.
(f) Guarantees In the normal course of business, the Credit Union enters into agreements that may contain features which meet the definition of a guarantee under IFRS. The maximum potential amount of future payments represents the amounts that could be lost to the Credit Union under guarantees if there were a total default by the guaranteed parties, without consideration of possible recoveries under recourse provisions, insurance policies or from collateral held or pledged.
The Credit Union has, as a participant in Central 1’s Mortgage Pool Purchase and Securitization Program, indemnified Central 1 for all costs and expenses incurred by Central 1 in respect of the Credit Union’s participation. The indemnification is considered by management to be in the normal course of business. The amounts that may become payable in future years are not determinable at this time. Management considers that the costs, if any, are not material.
89 2017 ANNUAL REPORT | Consolidated Financial Statements

MERIDIAN CREDIT UNION LIMITED NOTES TO THE CONSOLIDATED FINANCIAL STATEMENTS For the year ended December 31, 2017 with comparative figures for 2016
31 Contingent liabilities and commitments (continued)
(g) Meridian’s Commitment to Communities As part of Meridian’s Commitment to Communities program, the Credit Union has entered into a number of contracts relating to commitments of contributions and sponsorships. Meridian Centre In 2013 the Credit Union entered into a contract with the City of St. Catharines to contribute $5,234 over 25 years to the new multi-purpose spectator facility constructed in downtown St. Catharines, which is named The Meridian Centre. In addition to being given exclusive naming rights, Meridian has been designated as the official financial services provider during the term of the contract. The contract term is from September 1, 2013 to August 31, 2039. Meridian Place In 2014 the Credit Union entered into a 25-year contract with the City of Barrie to contribute $750 over ten years toward the building of a new town square in the community of Barrie, Ontario. In exchange for the contribution, Meridian will be granted naming rights for the next 25 years. The public square is known as Meridian Place. The contract term is from July 1, 2014 to June 30, 2039. Hamilton Farmers’ Market – proudly supported by Meridian In 2017 the Credit Union entered into a 5-year contract with the City of Hamilton to contribute $750 over five years toward sponsoring the Hamilton Farmers’ Market located in Hamilton, Ontario. In exchange for the contributions, Meridian will be granted naming rights for the next five years. The facility will be known as “Hamilton Farmers’ Market – proudly supported by Meridian”. The contract term is from April 1, 2017 to March 31, 2022. Future payments for all contributions and sponsorship contracts are as follows:
2017 2016
Within 1 year 425 275
1 to 5 years 1,825 1,375
Over 5 years 3,334 3,609
Total 5,584 5,259
Total payments made during 2017 were $425 (2016 - $275) of which $343 (2016 - $230) are included on the consolidated statement of comprehensive income within administration expenses.
32 Regulatory information
Restricted party transactions The Credit Union employs the definition of restricted party contained in the Act and regulations. A restricted party includes a person who is, or has been within the preceding twelve months, a director, officer or auditor of the Credit Union, any corporation in which the person owns more than 10% of the voting shares, his or her spouse, their dependent relatives who live in the same household as the person, and any corporation controlled by such spouse or dependent relative.
As at December 31, 2017, the aggregate value of loans issued to restricted parties was $5,303 (2016 - $2,907). These loans have been advanced on the same terms and conditions as have been accorded to all Members of the Credit Union, unless the restricted party is an employee, in which case they received the standard employee discount. There was no allowance for impaired loans required in respect of these loans. Directors received $593 (2016 - $621) for annual retainer and per diem and $81 (2016 - $36) for reimbursement of travel and out-of-pocket expenses.
Remuneration of officers and employees The Act requires credit unions to disclose remuneration paid during the year to the officers and employees of the Credit Union whose total remuneration for the year exceeds $150. If there are more than five officers and employees of a Credit Union whose total remuneration for the year was over $150, the five officers and employees with the highest total remuneration for the year are disclosed. The table below provides this information for the current year:
902017 ANNUAL REPORT | Consolidated Financial Statements
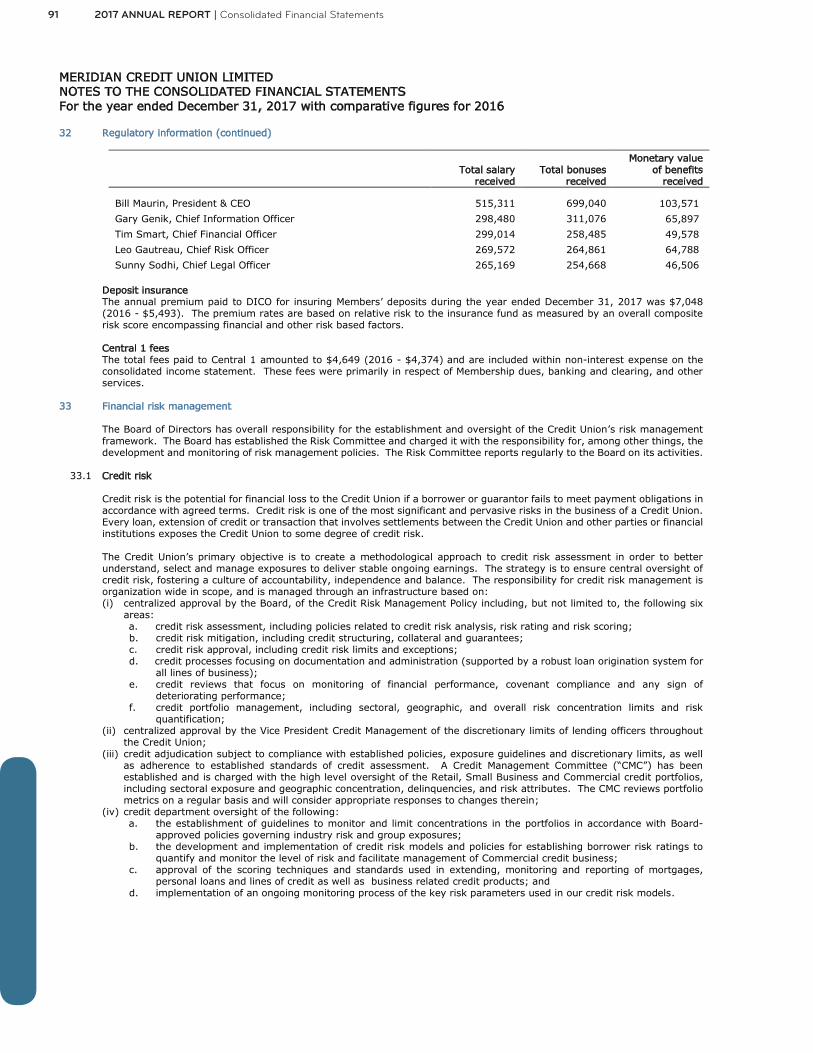
MERIDIAN CREDIT UNION LIMITED NOTES TO THE CONSOLIDATED FINANCIAL STATEMENTS For the year ended December 31, 2017 with comparative figures for 2016
32 Regulatory information (continued)
Total salary
received Total bonuses
received
Monetary value of benefits
received Bill Maurin, President & CEO 515,311 699,040 103,571
Gary Genik, Chief Information Officer 298,480 311,076 65,897
Tim Smart, Chief Financial Officer 299,014 258,485 49,578
Leo Gautreau, Chief Risk Officer 269,572 264,861 64,788
Sunny Sodhi, Chief Legal Officer 265,169 254,668 46,506 Deposit insurance The annual premium paid to DICO for insuring Members’ deposits during the year ended December 31, 2017 was $7,048 (2016 - $5,493). The premium rates are based on relative risk to the insurance fund as measured by an overall composite risk score encompassing financial and other risk based factors. Central 1 fees The total fees paid to Central 1 amounted to $4,649 (2016 - $4,374) and are included within non-interest expense on the consolidated income statement. These fees were primarily in respect of Membership dues, banking and clearing, and other services.
33 Financial risk management
The Board of Directors has overall responsibility for the establishment and oversight of the Credit Union’s risk management framework. The Board has established the Risk Committee and charged it with the responsibility for, among other things, the development and monitoring of risk management policies. The Risk Committee reports regularly to the Board on its activities.
33.1 Credit risk
Credit risk is the potential for financial loss to the Credit Union if a borrower or guarantor fails to meet payment obligations in accordance with agreed terms. Credit risk is one of the most significant and pervasive risks in the business of a Credit Union. Every loan, extension of credit or transaction that involves settlements between the Credit Union and other parties or financial institutions exposes the Credit Union to some degree of credit risk.
The Credit Union’s primary objective is to create a methodological approach to credit risk assessment in order to better understand, select and manage exposures to deliver stable ongoing earnings. The strategy is to ensure central oversight of credit risk, fostering a culture of accountability, independence and balance. The responsibility for credit risk management is organization wide in scope, and is managed through an infrastructure based on: (i) centralized approval by the Board, of the Credit Risk Management Policy including, but not limited to, the following six
areas: a. credit risk assessment, including policies related to credit risk analysis, risk rating and risk scoring; b. credit risk mitigation, including credit structuring, collateral and guarantees; c. credit risk approval, including credit risk limits and exceptions; d. credit processes focusing on documentation and administration (supported by a robust loan origination system for
all lines of business); e. credit reviews that focus on monitoring of financial performance, covenant compliance and any sign of
deteriorating performance; f. credit portfolio management, including sectoral, geographic, and overall risk concentration limits and risk
quantification; (ii) centralized approval by the Vice President Credit Management of the discretionary limits of lending officers throughout
the Credit Union; (iii) credit adjudication subject to compliance with established policies, exposure guidelines and discretionary limits, as well
as adherence to established standards of credit assessment. A Credit Management Committee (“CMC”) has been established and is charged with the high level oversight of the Retail, Small Business and Commercial credit portfolios, including sectoral exposure and geographic concentration, delinquencies, and risk attributes. The CMC reviews portfolio metrics on a regular basis and will consider appropriate responses to changes therein;
(iv) credit department oversight of the following: a. the establishment of guidelines to monitor and limit concentrations in the portfolios in accordance with Board-
approved policies governing industry risk and group exposures; b. the development and implementation of credit risk models and policies for establishing borrower risk ratings to
quantify and monitor the level of risk and facilitate management of Commercial credit business; c. approval of the scoring techniques and standards used in extending, monitoring and reporting of mortgages,
personal loans and lines of credit as well as business related credit products; and d. implementation of an ongoing monitoring process of the key risk parameters used in our credit risk models.
91 2017 ANNUAL REPORT | Consolidated Financial Statements

MERIDIAN CREDIT UNION LIMITED NOTES TO THE CONSOLIDATED FINANCIAL STATEMENTS For the year ended December 31, 2017 with comparative figures for 2016
33.1 Credit risk (continued) The Board has delegated to the CEO the authority to establish a lending hierarchy. As such, a procedure for the delegation of lending authority has been developed and is in active use. The Credit Union employs persons who are trained in managing its credit granting activities. Staff may be delegated individual authorities based on experience and background. Designated staff whose primary job accountabilities are to manage the quality and risk of the Credit Union’s portfolio are granted the authority to use judgment and discretion consistent with policy, in discharging their duties. Management has the responsibility to: (i) systematically identify, quantify, control and report on existing and potential credit risks and environmental risks in the
loan portfolio; (ii) prudently manage the exposure to default and loss arising from those risks; and (iii) employ and train, as necessary, personnel who can implement risk measurement and credit management techniques, as
required by policy. Measuring, monitoring and reporting activities on risk position and exposure are maintained and compliance and audit responsibilities are in place and adhered to. Both the Board and the Board’s Risk Committee receive regular summary performance measurements of the credit portfolio. The Credit Union’s credit risk portfolio is primarily classified as “Retail”, “Small Business”, “Commercial”, or “Finance Receivable”, and a different risk measurement process is employed for each portfolio. Credit risk rating systems are designed to assess and quantify the risk inherent in credit activities in an accurate and consistent manner. Credit exposure is assessed along these two dimensions: probability of default, which is an estimate of the probability that an obligor with a certain borrower risk rating will default within a one-year time horizon, and loss given default, which represents the portion of credit exposure at default expected to be lost when an obligor defaults. The Credit Union follows a formal loan granting process that addresses appropriate security documentation, its registration, the need and use of credit bureau reports and other searches, situations where co-signers or guarantors may be or will be required, the use of wage assignments and the use of accredited appraisers, lawyers and other professionals. The Credit Union’s credit risk portfolio is diversified with the objective of spreading risk. Diversification is assessed using different measures in each portfolio. In the Retail portfolio, diversification areas include authorized loan types, forms of security and sectoral groupings and/or such other objective criteria that the Board may set from time to time. In the Small Business and Commercial loan portfolio, diversification is achieved through the establishment of credit exposure limits for specific industry sectors, individual borrowers and borrower groups (multiple borrowers grouped together based on shared security and/or the same income source). Industry rating models and detailed industry analysis are key elements of this process. Where several industry segments are affected by common risk factors, an exposure limit may be assigned to those segments in aggregate. Management regularly reviews the above parameters to ensure that acceptable diversification is maintained. The top five industry sectors represent approximately 63% (2016 - 62%) of the total Commercial loan portfolio. Finance Receivables are diversified based on both geography (within Canada) and the asset classes being leased to obligors. Diversification within the portfolio is reviewed on a regular basis. The top five asset classes represent 63% (2016 – 61%) of the portfolio. Credit scoring is the primary risk rating system for assessing Retail exposure risk. Retail exposure is managed on a pooled basis, where each pool consists of exposures that possess similar homogeneous characteristics. The Retail credit segment is composed of a large number of Members, and includes residential mortgages, as well as secured and unsecured loans and lines of credit. Requests for Retail credit are generally processed using automated credit and behavioural decisioning tools. Standard evaluation criteria may include, but are not limited to: gross debt service ratio, total debt service ratio, and loan to value ratio. Within this framework, underwriters in branches and corporate office adjudicate within designated approval limits. Retail exposures are assessed on a pooled basis and measured against an internal benchmark of acceptable risk penetration levels within each pool. Internal benchmarks are established using “Equifax Beacon score”. Equifax Inc. is a global service provider of this credit score, which is a mathematical model used to predict how likely a person is to repay a loan. The score is based on information contained in an individual’s credit report. This information is obtained from credit lenders from which the consumers have borrowed in the past. The benchmark is measured monthly to ensure that the risk of the portfolio is managed on an ongoing basis. The risk ratings of the portfolio range from A+, which represents very low risk, to E, which represents the highest risk. The Small Business and Commercial credit risk rating model is premised on a comprehensive assessment of the borrower’s risk of default, through measurement of industry, business, management and financial risk factors along with the risk of loss given default, based on assessment of security composition and relative historical recovery experience. The model includes a standard set of questions and answers that align to an implied level of risk. Questions are given varied weightings and an overall borrower risk rating is derived from a cumulative weighting of the answers. The Commercial loan portfolio stratified by risk rating is reviewed monthly.
922017 ANNUAL REPORT | Consolidated Financial Statements

MERIDIAN CREDIT UNION LIMITED NOTES TO THE CONSOLIDATED FINANCIAL STATEMENTS For the year ended December 31, 2017 with comparative figures for 2016
33.1 Credit risk (continued) Finance Receivables credit risk is assessed using either a credit scoring system or a credit risk rating model depending on the size of the financing. Smaller financings are assessed using a credit scoring system similar to the Credit Union’s Retail assessment process. A robust credit risk rating is determined for larger financing arrangements. The Credit Union’s credit risk policies, processes and methodologies have not changed materially from the prior year. Credit risk policies, processes and methodologies governing the acquired Finance Receivables portfolio largely align to those of the Credit Union. Except as noted, the carrying value of financial assets recorded in the consolidated financial statements, which is net of impairment losses, represents the Credit Union’s maximum exposure to credit risk without taking into account the value of any collateral obtained. The Credit Union is also exposed to credit risk through transactions, which are not recognized in the consolidated balance sheet, such as granting financial guarantees and extending loan commitments. Refer to note 31 for further details. The risk of losses from loans undertaken is reduced by the nature and quality of collateral obtained. Refer to notes 9 and 10 for a description of the nature of the security held against loans as at the consolidated balance sheet date.
33.2 Market risk
(a) Interest rate risk Interest rate risk is the sensitivity of the Credit Union’s financial position to movements in interest rates. The Credit Union is exposed to interest rate risk when it enters into banking transactions with its Members, namely deposit taking and lending. When asset and liability principal and interest cash flows have different payment or maturity dates, this results in mismatched positions. An interest-sensitive asset or liability is repriced when interest rates change, when there is cash flow from final maturity, normal amortization, or when Members exercise prepayment, conversion or redemption options offered for the specific product. The Credit Union’s exposure to interest rate risk depends on the size and direction of interest rate changes, and on the size and maturity of the mismatched positions. It is also affected by new business volumes, renewals of loans or deposits, and how actively Members exercise options, such as prepaying a loan before its maturity date.
The Credit Union’s interest rate risk is subject to extensive risk management controls and is managed within the framework of policies and limits approved by the Board. These policies and limits ensure, among other things, that the Credit Union is in full adherence to the regulatory requirements prescribed in the Act as well as DICO’s standards of Sound Business and Financial Practices. Overall responsibility for asset/liability management rests with the Board. As such, the Board receives regular reports on risk exposures and performance against approved limits. The Board delegates the responsibility to manage the interest rate risk on a day-to-day basis to the Asset/Liability Committee (“ALCO”), which meets no less frequently than monthly. ALCO is chaired by the CFO and includes other senior executives. The key elements of the Credit Union’s interest rate risk management framework include:
i. guidelines and limits on the structuring of the maturities, price and mix of deposits, loans, mortgages and investments and the management of asset cash flows in relation to liability cash flows;
ii. guidelines and limits on the use of derivative financial instruments to hedge against a risk of loss from interest rate changes; and
iii. requirements for comprehensive measuring, monitoring and reporting on risk position and exposure management. Valuations of all asset and liability positions, as well as off-balance sheet exposures, are performed no less frequently than monthly. The Credit Union’s objective is to establish and maintain a balance sheet and off-balance sheet structure that will protect and enhance the Credit Union’s net interest income and the value of the Credit Union’s capital during all phases of the interest rate cycle and varying economic conditions. The carrying values of interest sensitive assets and liabilities and the notional amount of swaps and other derivative financial instruments used to manage interest rate risk are presented below in the periods in which they next reprice to market rates or mature, and are summed to show the interest rate sensitivity gap. Loans are adjusted for prepayment estimates which reflect expected repayments on other than contractual maturity dates. The prepayment rate applied to the portfolio is based on experience and current economic conditions. The average rates presented represent the weighted average effective yield based on the earlier of contractual repricing or maturity dates. Further information related to the derivative financial instruments used to manage interest rate risk is included in note 11.
93 2017 ANNUAL REPORT | Consolidated Financial Statements

MERIDIAN CREDIT UNION LIMITED NOTES TO THE CONSOLIDATED FINANCIAL STATEMENTS For the year ended December 31, 2017 with comparative figures for 2016
33.2 Market risk (continued)
December 31, 2017
Variable Less than 1
year 1 to 5 years
Over 5 years
Non- interest
sensitive Total Assets Cash and cash equivalents 268,494 75,332 - - 48 343,874 Yield 0.89% 1.17% - - - 0.95% Financial investments - 282,229 553,398 - 4,205 839,832 Yield - 1.20% 1.21% - - 1.20% Loans to Members 3,704,803 2,569,545 6,708,011 36,363 4,756 13,023,478 Yield 3.81% 3.22% 3.08% 3.44% - 3.31% Finance receivables 8,910 55,925 915,936 73,975 (5685) 1,049,061 Yield 5.54% 7.59% 6.72% 6.02% - 6.75% Derivative financial assets 41,474 - - - - 41,474 Yield - - - - - - Investments available for sale - - - - 68,210 68,210 Yield - - - - - - Other assets - - - - 262,617 262,617 Yield - - - - - -
Total assets 4,023,681 2,983,031 8,177,345 110,338 334,151 15,628,546
Liabilities and Members’ equity Members’ deposits 5,089,974
3,274,931 1,758,510 - 1,501,068 11,624,483
Yield 1.20% 2.04% 1.85% - - 1.38% Borrowings 8,797 24,000 - - 25 32,822
Yield 3.33% 2.79% - - - 2.93% Secured borrowings 935,443 - - - 1,850 937,293 Yield 2.40% - - - - 2.40% Mortgage securitization liabilities 122,114 254,175 1,543,364 - 1,108 1,920,761
Yield 1.22% 2.11% 1.62% - - 1.66% Derivative financial liabilities 2,014 - - - - 2,014
Yield - - - - - - Other liabilities and Members’ equity - - - - 1,111,173 1,111,173
Yield - - - - - -
Total liabilities and Members’ equity 6,158,342 3,553,106 3,301,874 - 2,615,224 15,628,546
Effect of Interest Rate Swaps Fixed pay swaps 2,018,547 (483,622) (1,516,423) (18,502) - - Yield 1.38% 1.52% 1.65% 1.55% - - Fixed receive swaps (261,250) 261,250 - - - - Yield 1.40% 0.96% - - - - Total derivatives 1,757,297 (222,372) (1,516,423) (18,502) - -
Interest sensitivity position 2017 (377,364) (792,447) 3,359,048 91,836 (2,281,073) -
942017 ANNUAL REPORT | Consolidated Financial Statements

MERIDIAN CREDIT UNION LIMITED NOTES TO THE CONSOLIDATED FINANCIAL STATEMENTS For the year ended December 31, 2017 with comparative figures for 2016
33.2 Market risk (continued)
December 31, 2016
Variable Less than 1
year 1 to 5 years
Over 5 years
Non- interest
sensitive Total Assets Cash and cash equivalents 500,632 - - - - 500,632 Yield 0.82% - - - - 0.82% Financial investments - 252,033 620,890 - 31,210 904,133 Yield - 1.54% 1.21% - - 1.30% Loans to Members 3,348,682 2,214,894 5,614,320 33,757 18,667 11,230,320 Yield 3.81% 3.22% 3.08% 3.44% - 3.32% Finance receivables 46,794 51,456 774,918 50,995 (3,705) 920,458 Yield 4.41% 7.97% 7.39% 6.66% - 7.26% Derivative financial assets 20,842 - - - - 20,842 Yield - - - - - - Investments available for sale - - - - 64,911 64,911 Yield - - - - - -
Other assets - - - - 278,965
278,965 Yield - - - - - -
Total assets 3,916,950 2,518,383 7,010,128 84,752 390,048 13,920,261
Liabilities and Members’ equity Members’ deposits 4,445,243 2,446,115 2,104,478 10 1,290,502 10,286,348 Yield 1.14% 2.08% 2.06% 1.93% - 1.41% Borrowings 10,718 - - - 576 11,294
Yield 3.83% - - - - 3.83% Secured borrowings 800,109 - - - 1,399 801,508 Yield 2.10% - - - - 2.10% Mortgage securitization liabilities - 501,135 1,407,759 - 1,219
1,910,113 Yield - 1.71% 1.79% - - 1.77% Derivative financial liabilities 12,215 - - - - 12,215
Yield - - - - - - Other liabilities and Members’ equity - - - - 898,783 898,783
Yield - - - - - -
Total liabilities and Members’ equity 5,268,285 2,947,250 3,512,237 10 2,192,479 13,920,261
Effect of Interest Rate Swaps Fixed pay swaps 1,447,513 (269,097) (1,165,311) (13,105) - - Yield 0.91% 1.01% 1.50% 1.54% - - Fixed receive swaps (11,250) - 11,250 - - - Yield 0.88% - 1.02% - - - Total derivatives 1,436,263 (269,097) (1,154,061) (13,105) - -
Interest sensitivity position 2016 84,928 (695,692) 2,343,830 71,637 (1,804,705) -
95 2017 ANNUAL REPORT | Consolidated Financial Statements

MERIDIAN CREDIT UNION LIMITED NOTES TO THE CONSOLIDATED FINANCIAL STATEMENTS For the year ended December 31, 2017 with comparative figures for 2016
33.2 Market risk (continued)
The management of interest rate risk against internal exposure limits is supplemented by monitoring the sensitivity of the Credit Union’s financial assets and financial liabilities to standard interest rate shock scenarios. The key metrics used to monitor this sensitivity are Earnings at Risk (“EaR”) and Economic Value of Equity at Risk (“EVaR”). EaR is defined as the change in our net interest income from a predetermined shock to interest rates measured over a 12 month period. EVaR is defined as the change in the present value of the Credit Union’s asset portfolio resulting from a predetermined shock versus the change in the present value of the Credit Union’s liability portfolio resulting from the same predetermined interest rate shock. The Credit Union completes various static and dynamic interest rate shock scenarios throughout the year, including a 100 basis point (“bps”) rate shock. The estimated impact of a 100 bps rate shock on these metrics is presented below.
2017 2016
EaR: 100 bps exposure (8,427) (12,371) EVaR: 100 bps exposure -3.75% -5.08%
(b) Foreign currency risk Foreign currency risk is the risk that the fair value of future cash flows of a financial instrument will fluctuate because of changes in foreign currency exchange rates. The Credit Union is exposed to foreign currency risk as a result of its Members’ activities in foreign currency denominated deposits and cash transactions. The Credit Union’s foreign currency risk is subject to formal risk management controls and is managed in accordance with the framework of policies and limits approved by the Board. These policies and limits are designed to ensure, among other things, that the Credit Union is in full adherence to the regulatory requirements prescribed in the Act as well as DICO’s standards of Sound Business and Financial Practices. The Board receives regular reports on risk exposures and variances from approved limits. The aforementioned activities that expose the Credit Union to foreign currency risk are measured, monitored and controlled daily to minimize the adverse impact of sudden changes in foreign currency values with respect to the Canadian dollar. U.S. dollar denominated liabilities are hedged through a combination of U.S. dollar investments and forward rate agreements to buy U.S. dollars and net exposure as measured on a daily basis is limited to 1% of prior year ending Members’ equity. The Credit Union uses forward foreign currency derivative financial instruments to neutralize its exposure to foreign exchange contracts with Members. As at December 31, 2017 and December 31, 2016, the Credit Union’s exposure to a 10% change in the foreign currency exchange rate, which is reasonably possible, is insignificant. (c) Other price risk Other price risk is the risk that the fair value on future cash flows of a financial instrument will fluctuate because of changes in market prices other than those arising from interest rate risk or foreign currency risk. The Credit Union is exposed to other price risk in its own investment portfolio. The Credit Union adheres to the principles of quality and risk diversification in its investment practices. The Credit Union’s other price risk is subject to extensive risk management controls and is managed within the framework of policies and limits approved by the Board. These policies and limits assist in ensuring, among other things, that the Credit Union is in full adherence to the regulatory requirements prescribed in the Act as well as DICO’s standards of Sound Business and Financial Practices. The Board receives regular reports on risk exposures and performance against approved limits. As at December 31, 2017 and December 31, 2016, the Credit Union has limited investments subject to other price risk and this exposure is insignificant.
33.3 Liquidity risk
Liquidity risk arises in the course of managing the Credit Union’s financial assets and financial liabilities. It is the risk that the Credit Union is unable to meet its financial obligations in a timely manner and at reasonable prices. The Credit Union’s liquidity risk management strategies seek to maintain sufficient liquid financial resources to continually fund its consolidated balance sheet under both normal and stressed market environments. The Credit Union’s liquidity risk is subject to formal risk management controls and is managed within the framework of policies and limits approved by the Board. These policies and limits assist in ensuring, among other things, that the Credit Union is in full adherence to the regulatory requirements prescribed in the Act as well as DICO’s standards of Sound Business and Financial Practices. The Board receives regular reports on risk exposures and performance against approved limits. ALCO provides management oversight of liquidity risk through its monthly meetings. The key elements of the Credit Union’s liquidity risk management framework include:
i. limits on the sources, quality and amount of liquid assets to meet normal operational requirements, regulatory requirements and contingency funding;
ii. a methodology to achieve an acceptable yield on the operating liquidity investment portfolio within prudent risk management bounds;
iii. prudence tests of quality and diversity where investments bear credit risk; iv. parameters to limit term extension risk; v. implementation of deposit concentration limits in order to assist in ensuring diversification and stability of deposit
funding; and vi. requirements for adequate measuring, monitoring and reporting on risk position and exposure management.
962017 ANNUAL REPORT | Consolidated Financial Statements

MERIDIAN CREDIT UNION LIMITED NOTES TO THE CONSOLIDATED FINANCIAL STATEMENTS For the year ended December 31, 2017 with comparative figures for 2016
33.3 Liquidity risk (continued) Under DICO regulations, the Credit Union will establish and maintain prudent levels and forms of liquidity that are sufficient to meet its cash flow needs, including depositor withdrawals and all other obligations as they come due. The liquidity ratio measures the Credit Union’s liquid assets as a percentage of Members’ deposits and specified borrowings. The Credit Union targets to maintain operating liquidity within the range of 8.25% to 15%. The low end of the range has been established in order to maintain a comfortable cushion beyond minimum operating liquidity needs, even during periods of market volatility. A cap has been placed on the range in recognition of the fact that too much excess liquidity has a negative impact on earnings. As at December 31, 2017, the Credit Union’s liquidity ratio was 10.46% (2016 – 13.00%). The table below sets out the period in which the Credit Union’s non-derivative financial assets and financial liabilities will mature and be eligible for renegotiation or withdrawal. These cash flows are not discounted and include both the contractual cash flows pertaining to the Credit Union’s consolidated balance sheet assets and liabilities and the future contractual cash flows that they will generate. In the case of loans, the table reflects adjustments to the contractual cash flows for prepayment estimates, which reflect expected repayments on other than contractual maturity dates. The prepayment rate applied to the portfolio is based on experience and current economic conditions. In addition to the cash flows detailed below, the Credit Union is exposed to potential cash outflows in the form of commitments and contingencies, as set out in note 31.
December 31, 2017
Less than 1
month 2 to 12 months
1 to 3 years
3 to 5 years
Over 5 years
Not specified Total
Financial assets Cash and cash equivalents 332,874 11,023 - - - - 343,897 Receivables 7,197 - - - - - 7,197 Financial investments 14,825 274,187 323,524 259,190 - 1,165 872,891 Loans to Members 730,238 4,299,515 5,012,454 3,819,092 49,668 - 13,910,967 Finance receivables 42,141 361,219 526,228 199,074 15,490 7,855 1,152,007 Investments available for sale - - - - - 68,210 68,210
Total financial assets 1,127,275 4,945,944 5,862,206 4,277,356 65,158 77,230 16,355,169
Financial liabilities Members’ deposits 6,957,566 2,812,541 1,537,796 441,391 - - 11,749,294 Borrowings 32,806 - - - - - 32,806 Payables and other liabilities 62,974 - - - - - 62,974 Current income tax payable 3,007 - - - - - 3,007 Secured borrowings 31,826 306,750 455,451 170,983 11,704 - 976,714
Mortgage securitization liabilities - 286,645 746,903 980,466 - - 2,014,014
Total financial liabilities 7,088,179 3,405,936 2,740,150 1,592,840 11,704 - 14,838,809
Net maturities (5,960,904) 1,540,008 3,122,056 2,684,516 53,454 77,230 1,516,360
97 2017 ANNUAL REPORT | Consolidated Financial Statements

MERIDIAN CREDIT UNION LIMITED NOTES TO THE CONSOLIDATED FINANCIAL STATEMENTS For the year ended December 31, 2017 with comparative figures for 2016
33.3 Liquidity risk (continued)
December 31, 2016
Less than 1
month 2 to 12 months
1 to 3 years
3 to 5 years
Over 5 years
Not specified Total
Financial assets Cash and cash equivalents 500,632 - - - - - 500,632 Receivables 26,830 - - - - - 26,830 Financial investments 53,255 206,356 317,433 319,023 - 1,165 897,232 Loans to Members 803,191 3,363,563 4,096,958 3,566,608 48,962 - 11,879,282 Finance receivables 78,270 316,619 448,739 148,940 9,556 6,126 1,008,250 Investments available for sale - - - - - 64,911 64,911
Total financial assets 1,462,178 3,886,538 4,863,130 4,034,571 58,518 72,202 14,377,137
Financial liabilities Members’ deposits 5,874,609 2,276,987 1,875,587 306,685 10 - 10,333,878 Borrowings 10,727 - - - - - 10,727 Payables and other liabilities 44,199 - - - - - 44,199 Current income tax payable 32,121 - - - - - 32,121 Secured borrowings 27,180 269,808 393,404 134,832 6,492 - 831,716
Mortgage securitization liabilities 1,027 408,871 503,860 1,095,856 - - 2,009,614
Total financial liabilities 5,989,863 2,955,666 2,772,851 1,537,373 6,502 - 13,262,255
Net maturities (4,527,685) 930,872 2,090,279 2,497,198 52,016 72,202 1,114,882
The table below sets out the undiscounted contractual cash flows of the Credit Union’s derivative financial assets and liabilities:
December 31, 2017
Less than 1 month
+-h
2 to 12 months
1 to 3 years
3 to 5 years
Over 5 years Total
Equity index-linked options - 11,315 13,730 1,733 - 26,778 Gross-settled forward exchange contracts: Outflow - (788) (340) - - (1,128) Inflow - 791 341 - - 1,132 Interest rate swaps Outflow (340) (5,770) (4,944) (1,602) - (12,656) Inflow - 281 426 265 106 1,078
Total (340) 5,829 9,213 396 106 15,204
December 31, 2016
Less than 1 month
+-h
2 to 12 months
1 to 3 Years
3 to 5 years
Over 5 years Total
Equity index-linked options 222 4,096 11,036 4,327 - 19,681 Gross-settled forward exchange contracts: Outflow (150) (2,410)
) (460) - - (3,020)
Inflow 150 2,405 461 - - 3,016 Interest rate swaps Outflow (1,240) (5,854) (6,496) (27) - (13,617) Inflow - - 1,017 500 28 1,545
Total (1,018) (1,763) 5,558 4,800 28 7,605
982017 ANNUAL REPORT | Consolidated Financial Statements

MERIDIAN CREDIT UNION LIMITED NOTES TO THE CONSOLIDATED FINANCIAL STATEMENTS For the year ended December 31, 2017 with comparative figures for 2016
33.3 Liquidity risk (continued) Derivative financial assets and liabilities reflect interest rate swaps that will be settled on a net basis and forward exchange contracts and index-linked equity options that will be settled on a gross basis (see note 11). The gross inflows/(outflows) disclosed in the previous table represent the contractual undiscounted cash flows relating to derivative financial assets and liabilities held for risk management purposes and which are usually not closed out before contractual maturity. The future cash flows on derivative instruments may differ from the amount in the above table as interest rates, exchange rate and equity market indices change. Cash outflows relating to the embedded written option in equity index-linked deposits are included with Members’ deposits in the previous table for non-derivative financial assets and liabilities.
33.4 Fair value of financial assets and financial liabilities
The following table represents the fair values of the Credit Union’s financial assets and financial liabilities for each classification of financial instruments. The fair values for short-term financial assets and financial liabilities approximate carrying value. These include accrued interest receivable, accounts payable, accrued liabilities and accrued interest payable. The fair values disclosed do not include the value of assets that are not considered financial instruments. While the fair value amounts are intended to represent estimates of the amounts at which these instruments could be exchanged in a current transaction between willing parties, many of the Credit Union’s financial instruments lack an available trading market. Consequently, the fair values presented are estimates derived using present value and other valuation techniques and may not be indicative of the net realizable values. Due to the judgment used in applying a wide range of acceptable valuation techniques and estimates in calculating fair value amounts, fair values are not necessarily comparable among financial institutions. The calculation of estimated fair values is based on market conditions at a specific point in time and may not be reflective of future fair values.
99 2017 ANNUAL REPORT | Consolidated Financial Statements

MERIDIAN CREDIT UNION LIMITED NOTES TO THE CONSOLIDATED FINANCIAL STATEMENTS For the year ended December 31, 2017 with comparative figures for 2016
33.4 Fair value of financial assets and financial liabilities (continued)
December 31, 2017 December 31, 2016
Carrying
value Fair value Fair value difference
Carrying value Fair value
Fair value difference
Financial assets at FVTPL:
Cash and cash equivalents 267,184 267,184 - 500,783 500,783 -
Derivative financial assets
Equity index-linked options 26,676 26,676 - 19,446 19,446 -
Interest rate swaps 14,416 14,416 - 1,355 1,355 -
Foreign exchange contracts 57 57 - 42 42 -
Swaptions 325 325 - - - -
Available for sale:
Investments 68,210 68,210 - 64,911 64,911 -
Loans and receivables:
Cash and cash equivalents 75,380 75,372 (8) - - -
Receivables 7,197 7,197 - 26,830 26,830 -
Financial investments 839,832 825,380 (14,452) 877,303 865,409 (11,894)
Loans to Members 13,023,478 12,829,603 (193,875) 11,230,320 11,096,176 (134,144)
Finance receivables 1,049,061 1,054,358 5,297 920,458 920,634 176
Total financial assets 15,371,816 15,168,778 (203,038) 13,641,448 13,495,586 (145,862)
Financial liabilities at FVTPL:
Derivative financial liabilities
Interest rate swaps 1,961 1,961 - 12,170 12,170 -
Foreign exchange contracts 53 53 - 44 44 -
Other liabilities:
Members’ deposits 11,624,483 11,646,873 22,390 10,286,348 10,312,536 26,188
Borrowings 32,806 32,806 - 10,727 10,727 -
Payables and other liabilities 23,379 23,379 - 21,685 21,685 -
Secured borrowings 937,293 937,293 - 801,508 801,508 -
Mortgage securitization liabilities 1,920,761 1,896,262 (24,499) 1,910,113 1,913,066 2,953
Employee obligations 30,827 30,827 - 19,950 19,950 -
Membership shares 321 321 - 295 295 -
Total financial liabilities 14,571,884 14,569,775 (2,109) 13,062,840 13,091,981 29,141
Interest rate sensitivity is the main cause of changes in the fair values of the Credit Union’s financial instruments. With the exception of financial assets and financial liabilities recorded at fair value through profit or loss, the carrying values of the above financial instruments are not adjusted to reflect the fair value. The following methods and assumptions were used to estimate the fair value of financial instruments:
i. The fair value of cash and cash equivalents, excluding short-term deposits with original maturities of 100 days or less, are assumed to approximate their carrying values, due to their short-term nature. The fair value of short-term deposits with original maturities of 100 days or less are based on fair market values, which are derived from valuation models and a credit valuation adjustment is applied to account for counterparty risk.
ii. With the exception of investments reported using the equity method of accounting, the fair value of investments is determined by discounting the expected future cash flows of these investments at current market rates and a credit valuation adjustment is applied to account for counterparty risk.
1002017 ANNUAL REPORT | Consolidated Financial Statements
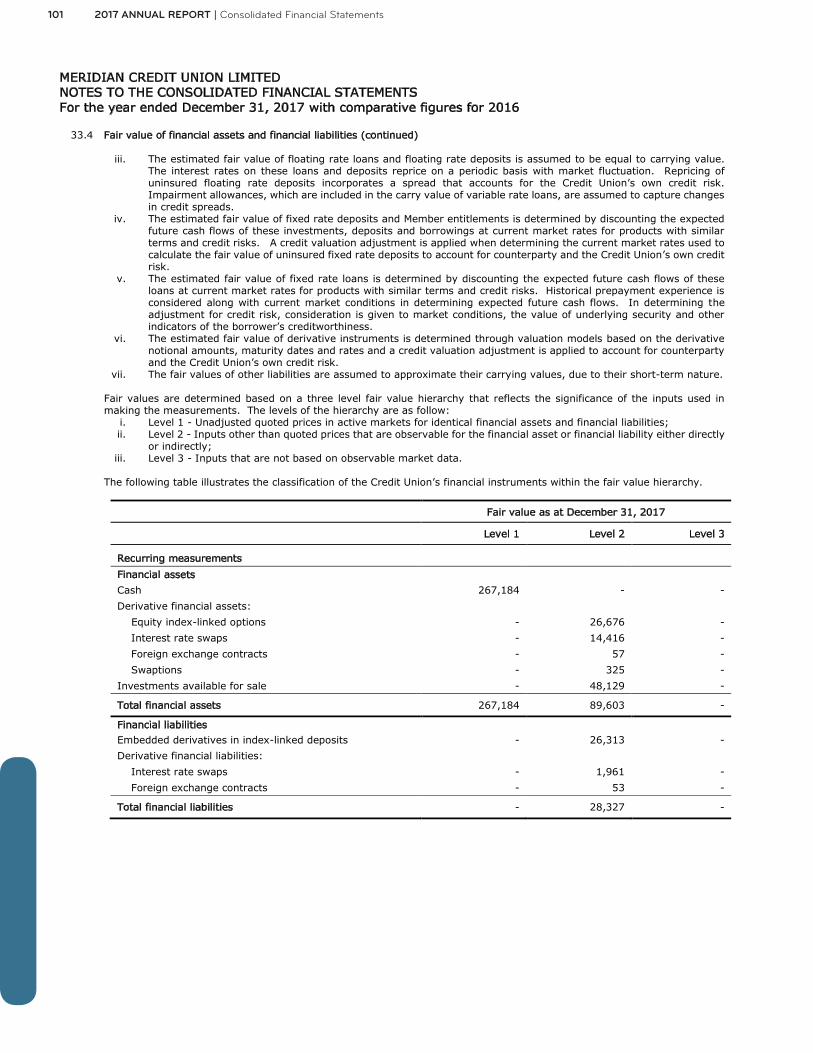
MERIDIAN CREDIT UNION LIMITED NOTES TO THE CONSOLIDATED FINANCIAL STATEMENTS For the year ended December 31, 2017 with comparative figures for 2016
33.4 Fair value of financial assets and financial liabilities (continued)
iii. The estimated fair value of floating rate loans and floating rate deposits is assumed to be equal to carrying value. The interest rates on these loans and deposits reprice on a periodic basis with market fluctuation. Repricing of uninsured floating rate deposits incorporates a spread that accounts for the Credit Union’s own credit risk. Impairment allowances, which are included in the carry value of variable rate loans, are assumed to capture changes in credit spreads.
iv. The estimated fair value of fixed rate deposits and Member entitlements is determined by discounting the expected future cash flows of these investments, deposits and borrowings at current market rates for products with similar terms and credit risks. A credit valuation adjustment is applied when determining the current market rates used to calculate the fair value of uninsured fixed rate deposits to account for counterparty and the Credit Union’s own credit risk.
v. The estimated fair value of fixed rate loans is determined by discounting the expected future cash flows of these loans at current market rates for products with similar terms and credit risks. Historical prepayment experience is considered along with current market conditions in determining expected future cash flows. In determining the adjustment for credit risk, consideration is given to market conditions, the value of underlying security and other indicators of the borrower’s creditworthiness.
vi. The estimated fair value of derivative instruments is determined through valuation models based on the derivative notional amounts, maturity dates and rates and a credit valuation adjustment is applied to account for counterparty and the Credit Union’s own credit risk.
vii. The fair values of other liabilities are assumed to approximate their carrying values, due to their short-term nature. Fair values are determined based on a three level fair value hierarchy that reflects the significance of the inputs used in making the measurements. The levels of the hierarchy are as follow:
i. Level 1 - Unadjusted quoted prices in active markets for identical financial assets and financial liabilities; ii. Level 2 - Inputs other than quoted prices that are observable for the financial asset or financial liability either directly
or indirectly; iii. Level 3 - Inputs that are not based on observable market data.
The following table illustrates the classification of the Credit Union’s financial instruments within the fair value hierarchy.
Fair value as at December 31, 2017
Level 1 Level 2 Level 3
Recurring measurements
Financial assets
Cash 267,184 - -
Derivative financial assets:
Equity index-linked options - 26,676 -
Interest rate swaps - 14,416 -
Foreign exchange contracts - 57 -
Swaptions - 325 -
Investments available for sale - 48,129 -
Total financial assets 267,184 89,603 -
Financial liabilities Embedded derivatives in index-linked deposits - 26,313 -
Derivative financial liabilities:
Interest rate swaps - 1,961 -
Foreign exchange contracts - 53 -
Total financial liabilities - 28,327 -
101 2017 ANNUAL REPORT | Consolidated Financial Statements
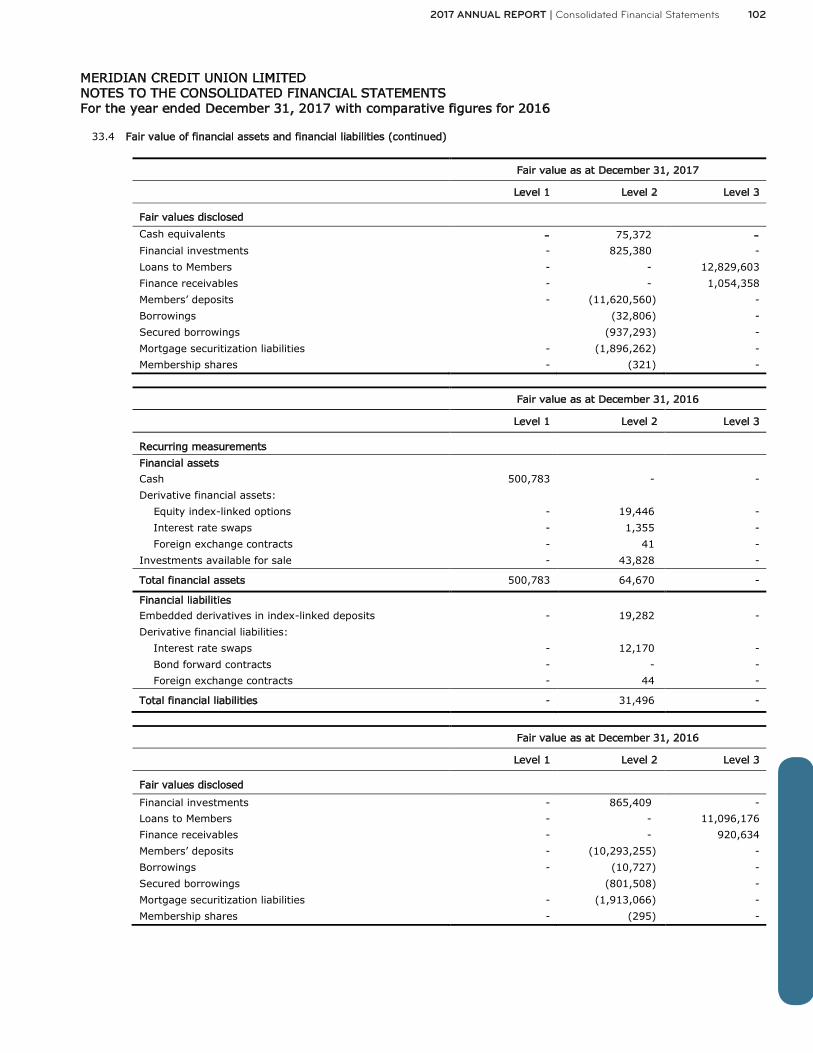
MERIDIAN CREDIT UNION LIMITED NOTES TO THE CONSOLIDATED FINANCIAL STATEMENTS For the year ended December 31, 2017 with comparative figures for 2016
33.4 Fair value of financial assets and financial liabilities (continued)
Fair value as at December 31, 2017
Level 1 Level 2 Level 3
Fair values disclosed Cash equivalents - 75,372 - Financial investments - 825,380 -
Loans to Members - - 12,829,603
Finance receivables - - 1,054,358
Members’ deposits - (11,620,560) -
Borrowings (32,806) -
Secured borrowings (937,293) -
Mortgage securitization liabilities - (1,896,262) -
Membership shares - (321) -
Fair value as at December 31, 2016
Level 1 Level 2 Level 3
Recurring measurements
Financial assets
Cash 500,783 - -
Derivative financial assets:
Equity index-linked options - 19,446 -
Interest rate swaps - 1,355 -
Foreign exchange contracts - 41 -
Investments available for sale - 43,828 -
Total financial assets 500,783 64,670 -
Financial liabilities Embedded derivatives in index-linked deposits - 19,282 -
Derivative financial liabilities:
Interest rate swaps - 12,170 -
Bond forward contracts - - -
Foreign exchange contracts - 44 -
Total financial liabilities - 31,496 -
Fair value as at December 31, 2016
Level 1 Level 2 Level 3
Fair values disclosed Financial investments - 865,409 -
Loans to Members - - 11,096,176
Finance receivables - - 920,634
Members’ deposits - (10,293,255) -
Borrowings - (10,727) -
Secured borrowings (801,508) -
Mortgage securitization liabilities - (1,913,066) -
Membership shares - (295) -
1022017 ANNUAL REPORT | Consolidated Financial Statements

MERIDIAN CREDIT UNION LIMITED NOTES TO THE CONSOLIDATED FINANCIAL STATEMENTS For the year ended December 31, 2017 with comparative figures for 2016
33.4 Fair value of financial assets and financial liabilities (continued)
The fair values of cash and cash equivalents, receivables, payables and other liabilities and employee obligations approximate their carrying values due to their short-term nature.
The fair value of Central 1 Class E shares, which are classified as investments available for sale and measured at cost, has been excluded from the above table as they are not quoted in an active market and their fair value cannot be reliably determined. There have been no transfers between level 1 and level 2 of the fair value hierarchy during the year.
33.5 Capital management
The Credit Union maintains policies and procedures relative to capital management so as to ensure the capital levels are sufficient to cover risks inherent in the business. The Credit Union’s objectives when managing capital are: (i) to ensure that the quantity, quality and composition of capital needed reflects the inherent risks of the entity and to
support the current and planned operations and portfolio growth; (ii) to provide a safety net for the variety of risks to which the entity is exposed in the conduct of its business and to
overcome the losses from unexpected difficulties either in earnings or in asset values; (iii) to provide a basis for confidence among Members, depositors, creditors and Regulatory agencies; (iv) to form a solid foundation for business expansion and ongoing reinvestment in business capabilities, including technology
and process automation and enhancement; and (v) to establish a capital management policy for the entity appropriate for current legal and economic conditions, including
compliance with regulatory requirements and with DICO’s standards of Sound Business and Financial Practices.
The Act requires credit unions to maintain minimum regulatory capital, as defined by the Act. Regulatory capital is calculated as a percentage of total assets and of risk weighted assets. Risk weighted assets are calculated by applying risk weighted percentages, as prescribed by the Act, to various asset categories, operational and interest rate risk criteria. The prescribed risk weights are dependent on the degree of risk inherent in the asset. Tier 1 capital, otherwise known as core capital, is the highest quality. It is comprised of retained earnings, contributed surplus, Members’ capital accounts, and Member entitlements with the exception of the series 96 Class A shares. Of the “50th Anniversary”, series 98, series 01, and series 09 Class A shares that have been included within Members’ capital accounts, only 90% are allowable as Tier 1 capital due to specific features of these shares. Series 15 and series 17 Class A shares are included at 100% due to a redemption restriction for 5 years from date of issuance. Tier 1 capital as at December 31, 2017 was $941,132 (2016 - $738,623). Tier 2 capital, otherwise known as supplementary capital, contributes to the overall strength of a financial institution as a going concern, but is of a lesser quality than Tier 1 capital relative to both permanence and freedom from charges. It is comprised of the series 96 Class A shares and the 10% portion of the “50th Anniversary”, series 98, series 01, and series 09 Class A shares that are not admissible as Tier 1 capital. It also includes the eligible portion of the total collective allowance for credit losses. Tier 2 capital as at December 31, 2017 was $82,237 (2016 - $79,187). The Act requires credit unions to maintain a minimum capital ratio of 4% and a risk weighted capital ratio of 8%. The Credit Union has a stated policy that it will maintain at all times capital equal to the minimum required by the Act plus a prudent cushion. The current minimum ratios per Board policy are a capital ratio of 5.5% and a risk weighted capital ratio of 11%. The Credit Union’s internal policy also dictates that the ratio of Tier 1 capital to total capital will be a minimum of 60%. These internal limits are increased by the Board in tandem with significant increasing risk detected in the economic environment of the Credit Union. The Credit Union is in compliance with the Act as indicated by the table below:
Regulatory capital Capital leverage ratio Risk weighted capital
Minimum Actual Minimum Actual 2017 1,023,370 4.00% 6.99% 8.00% 13.56% 2016
817,810 4.00% 6.26% 8.00% 12.00%
103 2017 ANNUAL REPORT | Consolidated Financial Statements

MERIDIAN CREDIT UNION LIMITED NOTES TO THE CONSOLIDATED FINANCIAL STATEMENTS For the year ended December 31, 2017 with comparative figures for 2016
34 Reconciliation of liabilities arising from financing activities
Financing Activities
2017
Proceeds from securitization of mortgages 392,650
Net change in mortgage securitization liabilities (382,861)
Net change in borrowings 21,528
Net issuance of secured notes 135,333
Net cash from changes in Membership shares 26
Net cash from changes in liabilities 166,676
Dividends paid on Members’ capital accounts (1,983)
Net change in Member capital accounts 158,478
Cash provided by financing activities 323,171
January 1
2017
Cash Flows Non-Cash Changes December 31
2017
Change in Accrued Interest
Amortization of Deferred
Amounts Borrowings 11,294 21,528 - - 32,822
Secured borrowings 801,508 135,333 452 - 937,293
Mortgage securitization liabilities 1,910,113 9,789 112 747 1,920,761
Membership shares 295 26 - - 321
Total 2,723,210 166,676 564 747 2,891,197
35 Authorization of consolidated financial statements
The consolidated financial statements for the year ended December 31, 2017 were approved by the Board of Directors on March 9, 2018. Amendments to the consolidated financial statements subsequent to issuance are not permitted without Board approval.
___________________________________ ___________________________________ John Murphy Ken Bolton Chair, Board of Directors Chair, Audit & Finance Committee
1042017 ANNUAL REPORT | Consolidated Financial Statements

Meridian Locations
Corporate Head OfficeSt. Catharines75 Corporate Park Dr.St. Catharines, ON L2S 3W3905-988-1000
Corporate OfficesCorporate Office Toronto3280 Bloor St. W.Centre Tower, 7th floorToronto, ON M8X 2X3416-597-4400
531 Lake St.St. Catharines, ON L2N 4H61-866-592-2226
Contact Centre
Commercial Business CentresGreater Toronto Area50 Ronson Dr., Unit 155Etobicoke, ON M9W 1B3
Grey Bruce255 10th St.Hanover, ON N4N 1P1
Guelph - Speedvale200 Speedvale Ave. W.Guelph, ON N1H 1C3
Ottawa - Kanata473 Hazeldean Rd.Ottawa, ON K2L 1V1
Niagara-on-the-Lake1567 Niagara Stone Rd.Virgil, ON L0S 1TO
Simcoe/Muskoka592 Yonge St.Barrie, ON L4N 4E4
St. Catharines75 Corporate Park Dr.St. Catharines, ON L2S 3W3
Cambridge - Hespeler101 Holiday Inn Dr., Unit B4Cambridge, ON N3C 1Z3
Hamilton - Jackson Square2 King St. W.Hamilton, ON L8P 1A1
MississaugaErin Mills & Folkway4099 Erin Mills Parkway, Unit 7Mississauga, ON L5L 3P9
Owen Sound1594 16th Ave. E.Owen Sound, ON N4K 5N3
Meridian Credit Union Branch and Satellite Locations
105 2017 ANNUAL REPORT | Meridian Locations
Ancaster1100 Wilson St. W.Ancaster, ON L9G 3K9
AuroraMillwood Heights Plaza297 Wellington St. E.Aurora, ON L4G 6K9
Aylmer34-36 Talbot St. W.Aylmer, ON N5H 1J7
Barrie - Bayfield85 Bayfield St., 1st Floor, Suite 102Barrie, ON L4M 3A7*Relocated October 2017
Barrie - Big Bay Point592 Yonge St.Barrie, ON L4N 4E4
Barrie - Collier Street18 Collier St.Barrie, ON L4M 1G6*Closed October 2017
Barrie - Essa Road410 Essa Rd., Unit A1-ABarrie, ON L4N 9J7
Beamsville4520 Ontario St.Beamsville, ON L0R 1B5
Binbrook Marketplace2537 Regional Rd. 56Binbrook, ON L0R 1C0
BowmanvilleDarlington Satellite Holt Rd. S.Main Security Building LobbyBowmanville, ON L1C 3Z8(Bank at work branch- no public access)
BramptonBramelea & Sandalwood10545 Bramelea Rd.,Building H, Unit 8Brampton, ON L6R 3P4
BramptonChinguacousy South65 Dusk Dr., Unit 2Brampton, ON L6Y 5Z6
Brantford300 King George Rd., Unit J3Brantford, ON N3R 5L8
BurlingtonWalkers & Dundas3051 Walkers Line, Units 3 & 4Burlington, ON L7M 0W3
Cambridge - Galt125 Dundas St. N., Unit 1Cambridge, ON N1R 5N6
Cambridge - Hespeler101 Holiday Inn Dr., Unit B4Cambridge, ON N3C 1Z3
Collingwood171 St. Marie St.Collingwood, ON L9Y 3K3
Courtice1416 King St. E.Courtice, ON L1E 3B4
Fergus120 McQueen Blvd.Fergus, ON N1M 3T8
Fonthill1401 Pelham St., PO Box 860Fonthill, ON L0S 1E0
Fort Erie450 Garrison Rd., Unit 14Fort Erie, ON L2A 1N0
GrimsbyOrchardview Plaza155 Main St. E.Grimsby, ON L3M 1P2
Guelph - Clair & Gordon2 Clair Rd. E.Guelph, ON N1L 0G6
Guelph - Speedvale200 Speedvale Ave. W.Guelph, ON N1H 1C3
Guelph - Stone Square370 Stone Rd. W.Guelph, ON N1G 4V9
Guelph - Wyndham Street153 Wyndham St. N.Guelph, ON N1H 4E9
Hamilton - Centre on Barton1187 Barton St. E.Hamilton, ON L8H 2V4
Hamilton - Jackson Square2 King St. W.Hamilton, ON L8P 1A1
Hamilton - Rymal Road2176 Rymal Rd. E., Unit 102Hamilton, ON L0R 1P0
Hanover255 10th St.Hanover, ON N4N 1P1
Kincardine818 Durham St.Kincardine, ON N2Z 3B9
London - West551 Oxford St. W., #102London, ON N6H 0H9
MarkhamCastlemore & Markham Rd.1210 Castlemore Ave.Markham, ON L6E 0H7
MarkhamSteeles & Birchmount4080 Steeles Ave. E., Units 1 & 2Markham, ON L3R 4C3
Mississauga - ClarksonClarkson Crossing Plaza970 Southdown Rd.Mississauga, ON L5J 2Y4
MississaugaErin Mills & Folkway4099 Erin Mills Parkway, Unit 7Mississauga, ON L5L 3P9
Newmarket70 Davis Dr., Unit 23Newmarket, ON L3Y 2M7
Niagara Falls - Kalar & McLeod7107 Kalar Rd.Niagara Falls, ON L2H 3J6
Niagara Falls - Portage4780 Portage Rd.Niagara Falls, ON L2E 6A8
Niagara-on-the-Lake1567 Niagara Stone Rd.Virgil, ONS L0S 1T0
Orangeville190 Broadway, Suite 1Orangeville, ON L9W 1K3

1062017 ANNUAL REPORT | Meridian Locations
Orillia73 Mississaga St. E.Orillia, ON L3V 1V4
Ottawa - Bank Street99 Bank St., Suite G001Ottawa, ON K1P 6B9
Ottawa - Clyde1331 Clyde Ave., Unit 104Ottawa, ON K2C 3G4
Ottawa - Kanata473 Hazeldean Rd.Ottawa, ON K2L 1V1
Owen Sound1594 16th Ave. E.Owen Sound, ON N4K 5N3
Owen Sound - Downtown825 2nd Ave. E., Box 182Owen Sound, ON N4K 5P3*Closed September 2017
Pembroke40 Pembroke St. W., Box 216Pembroke, ON K8A 6X3
Penetanguishene7 Poyntz St.Penetanguishene, ON L9M 1M3
Pickering1550 Kingston Rd., Unite 25Pickering, ON L1V 1C3
Pickering SatelliteMain Security Building #P191675 Montgomery Park Rd.,Pickering, ON L1V 2R5(Bank at work branch- no public access)
Port Colborne43 Clarence St. W.Port Colborne, ON L3K 3G1
Port Elgin626 Goderich St., PO Box 730Port Elgin, ON N0H 2C0
Richmond HillYonge & Edgar9050 Yonge St.Richmond Hill, ON L4C 9S6
Richmond Hill - Oak Ridges106 - 12276 Yonge St.Richmond Hill, ON L4E 0B8
ScarboroughKennedy Commons1 - 37 William Kitchen Rd.Scarborough, ON M1P 5B7
Scarborough - Morningside797 Milner Ave., Unit 100Toronto, ON M1B 3C3
Seaforth49 Main St. S.Seaforth, ON N0K 1W0
Simcoe95 Queensway Dr. W., Unit 9Simcoe, ON N3Y 2M8
St. CatharinesGrantham Plaza400 Scott St.St. Catharines, ON L2M 3W4
St. Catharines - King Street106 King St.St. Catharines, ON L2R 3H8
St Catharines - Lake Street531 Lake St.St. Catharines, ON L2N 4H6
St. CatharinesPendale Plaza210 Glendale Ave.St. Catharines, ON L2T 3Y6
St. CatharinesRidley Square111 Fourth Ave.St. Catharines, ON L2S 3P5
St. Marys134 Queen St.St. Marys, ON N4X 1A9
Stevensville2763 Stevensville Rd.Stevensville, ON L0S 1S0
Stoney Creek259 Hwy 8, Unit 1Stoney Creek, ON L8G 1E4
Toronto - Bloor & Islington3300 Bloor St. W., Suite 120Toronto, ON M8X 2W8
Toronto - Bloor West Village2238 Bloor St. W.Toronto, ON M6S 1N6
Toronto - Cabbagetown486 Parliament St.Toronto, ON M4X 1P2
Toronto - College & Bathurst464 College St.Toronto, ON M6G 1A1
Toronto - Danforth & Logan477 Danforth StreetToronto, ON M4K 1P1
Toronto - Davisville690 Mt Pleasant Rd, Unit 2Toronto, ON M4S 2N3
Toronto - Hydro Place700 Universty Ave.,Shopping ConcourseToronto, ON M5G 1Z5
Toronto - King & Shaw1029 King St. W.Toronto, ON M6K 3M9
Toronto - Kipling800 Kipling Ave., Unit 6Toronto, ON M8Z 5S4
Toronto - Leaside45 Wicksteed Ave., Unit 25Toronto, ON M4G 4H9
Toronto - Roncesvalles429 Roncesvalles Ave.Toronto, ON M6R 2N3
TorontoSt. Clair Avenue East26 St. Clair Ave. E.Toronto, ON M4T 1L7
Toronto - SunnybrookSunnybrook Health Sciences Centre2075 Bayview Ave.,Room CB02Toronto, ON M4N 3M5 (Bank at work branch - no public access)
Toronto - The Beach2084 Queen St. E.Toronto, ON M4E 1E1
Toronto - Wellesley56 Wellesley St. W., Suite 103Toronto, ON M5S 2S3
Toronto - Wellington West101 - 145 Wellington St. W.Toronto, ON M5J 1H8
Vaughan - Maple1860 Major Mackenzie Dr. W.Vaughan, ON L6A 4R9
Vineland3370 King St.Vineland, ON L0R 2C0
Wainfleet31885 Hwy #3, PO Box 165Wainfleet, ON L0S 1V0
Walkerton244 Durham St., Box 308Walkerton, ON N0G 2V0
Waterloo - Beechwood440 Erb St. W.Waterloo, ON N2T 1H4
Welland610 Niagara St. N.Welland, ON L3C 1L8
Whitby4061 Thickson Rd. N.Whitby, ON L1R 2X3
WindsorRoundhouse Centre, Unit 13056 Howard AvenueWindsor, ON N8X 3Y9
Woodstock396 Dundas St. W.Woodstock, ON N4S 1B7
