contents data and information to solve existing ... are listed in table 9-1. ... the goshute indian...
TRANSCRIPT
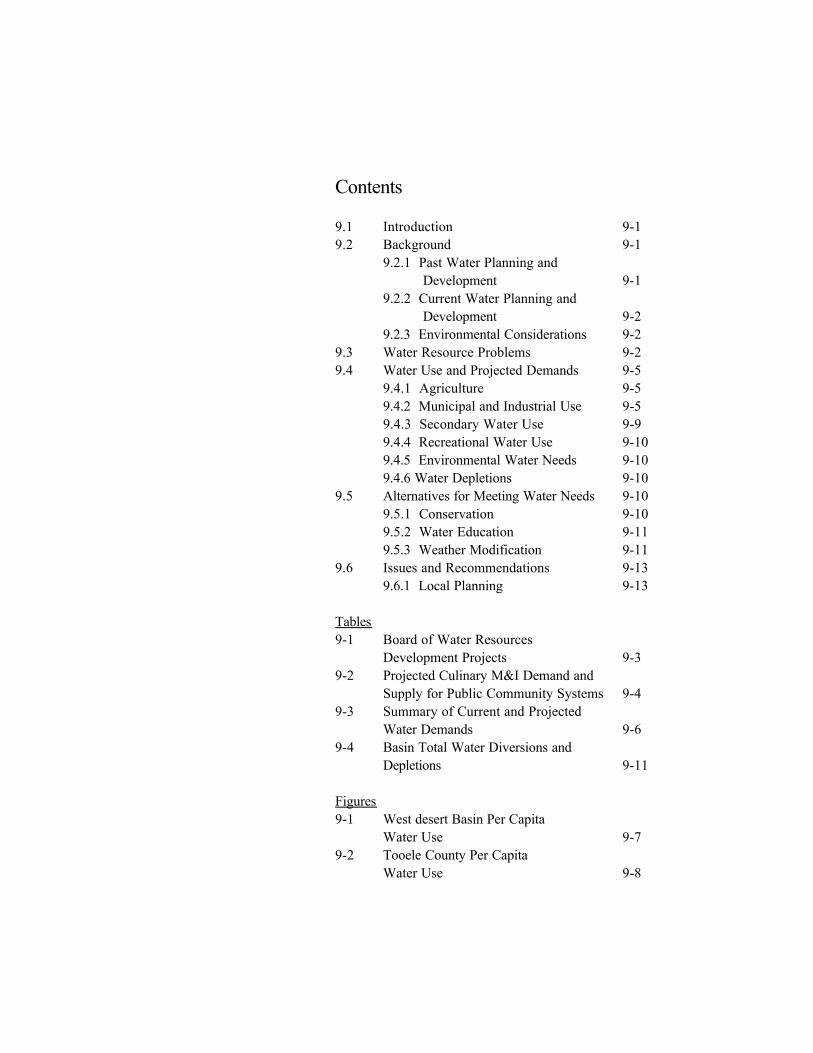
Contents
9.1 9-19.2 Background 9-1
9.2.1 Past Water Planning and Development 9-19.2.2 Current Water Planning and Development 9-29.2.3 Environmental Considerations 9-2
9.3 Water Resource Problems 9-29.4 Water Use and Projected Demands 9-5
9.4.1 Agriculture 9-59.4.2 Municipal and Industrial Use 9-59.4.3 Secondary Water Use 9-99.4.4 Recreational Water Use 9-109.4.5 Environmental Water Needs 9-109.4.6 Water Depletions 9-10
9.5 Alternatives for Meeting Water Needs 9-109.5.1 Conservation 9-109.5.2 Water Education 9-119.5.3 Weather Modification 9-11
9.6 Issues and Recommendations 9-139.6.1 Local Planning 9-13
Tables9-1 Board of Water Resources
Development Projects 9-39-2 Projected Culinary M&I Demand and
Supply for Public Community Systems 9-49-3 Summary of Current and Projected
Water Demands 9-69-4 Basin Total Water Diversions and
Depletions 9-11
Figures9-1 West desert Basin Per Capita
Water Use 9-79-2 Tooele County Per Capita
Water Use 9-8
Introduction

9-1
Water Planning isessential to ensurewater management,development andconservation willmeet all of the futureneeds within thebasin.
Rustic old cabin in Tooele Valley
Section 9
West Desert BasinUtah State Water Plan
Water Planning and Development
9.1 INTRODUCTION This section describes existing and potentialalternatives for meeting the future water needsin the West Desert Basin. Present water usesand supplies are discussed along with futurewater needs, and alternatives for meeting needs,environmental, financial and economicconsiderations, and water quality issues. Existing water supplies are essential to the localagricultural industry and the local communities. They also provide aesthetic and environmentalvalues and provide recreational values for thelocal residents The goal of the Division of Water Resourcesis to assist local entities and coordinate withother state and federal agencies in effectivewater-related activities. The decision-makingprocess is still the responsibility of the localpeople. This plan provides local decision-makerswith data and information to solve existingproblems and to plan for future implementationof the most viable alternatives.
9.2 BACKGROUND Water development was an essential elementof early settlements. The availability of waterresources was critical as the basin’s first settlersrealized successful settlement would occur onlywhere water resources were available. EarlyMormon church leaders stressed communitydevelopment over individual ownership,especially with regards to natural resources. The early pioneers’ approach was to developcooperative water distribution systems. Thoseearly ideals laid the foundation for many of theprinciples embodied in today’s Utah Water Law,
and the methodsnow employed toadminister andmanage thestate’s waterresources. Community rightsled to a standardof “beneficialuse” as the basisfor theestablishment ofan individual water right. The overridingprinciple of Utah’s water law is that all waterbelongs to the citizens of the state. Throughoutthe years, water planning and development havebeen founded upon this principle.
9.2.1 Past Water Planning andDevelopment
Water development began with the firstsettlements of pioneers in the late 1840s. In1847 and 1848, prior to any settlement, Tooele
9-2
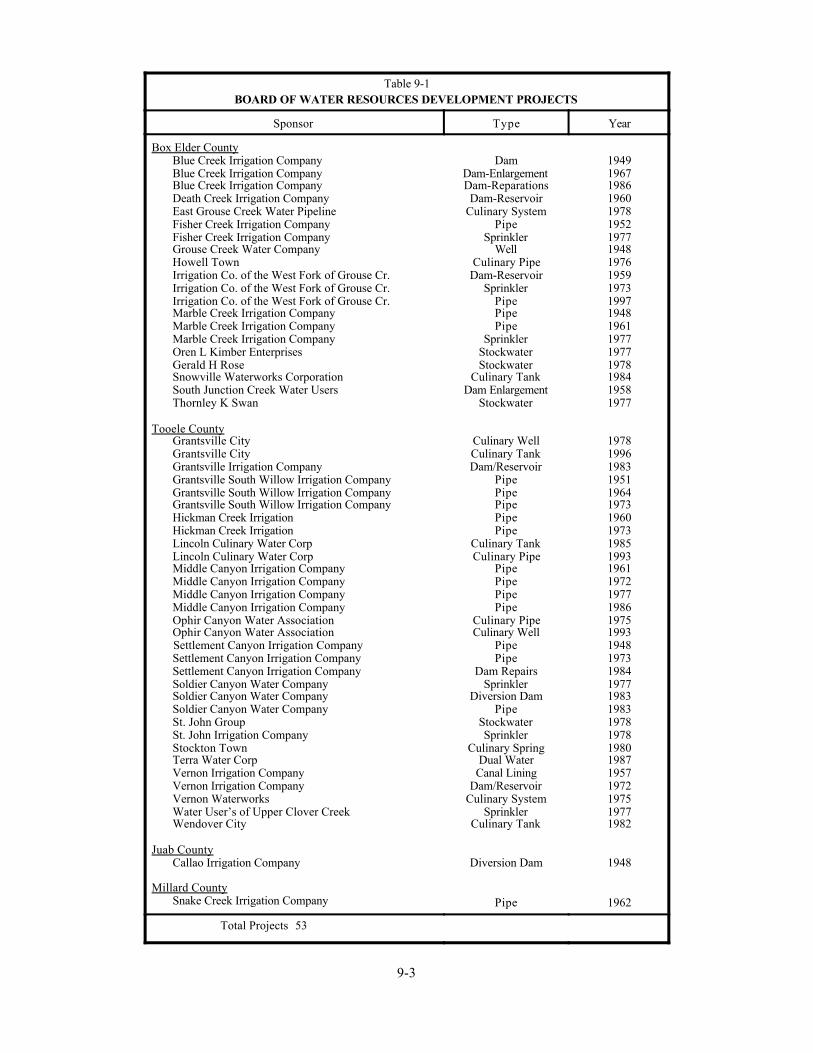
and Rush Valleys were used as a herd groundfor cattle. In September of 1849, the first whitesettlers came into Tooele Valley and settledsouth of the present site of Tooele. Settlementin the Grantsville area started the following year. Over the course of the next few decades,settlements were established throughout theTooele and Rush Valleys as well as other areasof the basin: Snowville, Park Valley, and GrouseCreek to the north, Callao to the south and laterWendover to the west. Except for Wendover,these communities were located in valleyswhere mountain streams could be developed forirrigation use. During the same period of time,wells were dug to provide culinary water for thesettlements. Since the turn of the century, a few smallreservoirs have been constructed within thebasin to facilitate the development of waterresources (Table 6-1 lists existing reservoirs). Other past water development projects includedthe construction of canals, canal lining, culinarywater systems, culinary water storage tanks andponds, and wastewater treatment facilities. Over the years, the Board of WaterResources has provided technical assistance andfunding for 53 projects in the West Desert Basintotaling just over $13.2 million. These projectsare listed in Table 9-1. For a breakdown of theloaned amounts by fund see Table 8-1
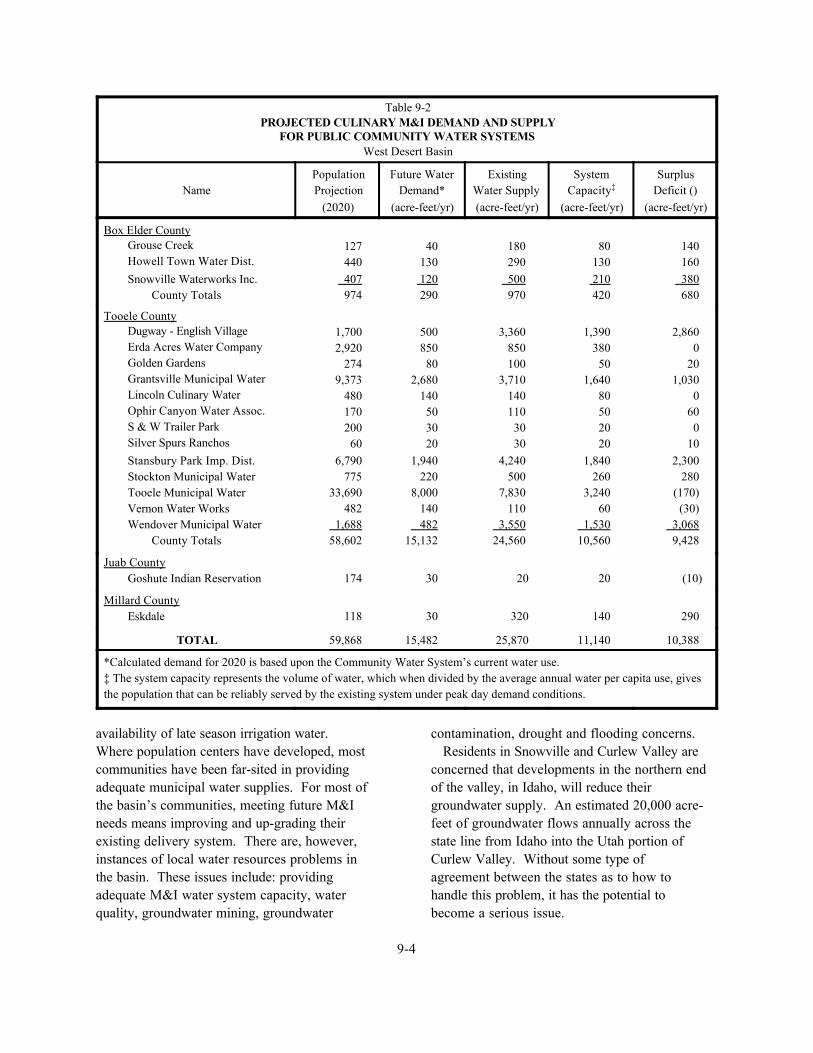
9.2.2 Current Water Planning and Development Throughout the basin, current water planningand development means infrastructuralimprovements. As shown in Table 9-2, most ofthe basin’s major water suppliers have adequatewater supplies to take them through the year2020. Three towns, Tooele, Vernon, andGoshute, have projected water shortages for2020, but the shortages are not significant. Three more water providers, Erda Acres WaterCompany, Lincoln Culinary Water, and S & WTrailer Park have existing water supplies equalto their 2020 water demand. For each of thesemunicipalities an adequate supply of water is
available either through development of newsources or the purchase and transfer of existingrights. However, when existing systemcapacities are compared with the future demand(see Table 9-2), it is apparent that many of thebasin’s community water systems will beinadequate to meet the futures needs. Exceptfor Dugway, Stockton and Wendover, all of theTooele County community water systems haveinsufficient system capacity to meet the 2020demand. The Goshute Indian Reservation alsohas inadequate system capacity to meet the2020 demand. The community water systems inBox Elder County (Grouse Creek, Howell, andSnowville) and the Eskdale Community WaterSystem in Millard County all have sufficientcapacity for their 2020 demand. The system capacities shown in Table 9-2represents the volume of water, which whendivided by the average annual water per capitause, gives the population that can be reliablyserved by the existing system under peak daydemand conditions. The factors limiting deliverydiffer from system to system. For somecommunities, correcting the problem could be assimple as increasing well capacity. Othercommunities may need to increase storagecapacity, and/or enlarge their delivery system. Each community needs to take a look at its ownwater systems and determine the best solution.
9.2.3 Environmental Considerations Instream flows and water quality issues are asessential to good planning and development asany other issue, and should be considered earlyand often in the planning process. Althoughthere are no established instream flowrequirements within the West Desert Basin,there are established water rights for public birdand wildlife refuge areas.
9.3 WATER RESOURCE PROBLEMS Throughout the West Desert Basin, thescarcity of water has generated a few waterissues and problems for the local residents. Thebiggest water supply problem in the basin is the
9-3
Table 9-1BOARD OF WATER RESOURCES DEVELOPMENT PROJECTS
Sponsor Type Year
Box Elder County Blue Creek Irrigation Company Blue Creek Irrigation Company Blue Creek Irrigation Company Death Creek Irrigation Company East Grouse Creek Water Pipeline Fisher Creek Irrigation Company Fisher Creek Irrigation Company Grouse Creek Water Company Howell Town Irrigation Co. of the West Fork of Grouse Cr. Irrigation Co. of the West Fork of Grouse Cr. Irrigation Co. of the West Fork of Grouse Cr. Marble Creek Irrigation Company Marble Creek Irrigation Company Marble Creek Irrigation Company Oren L Kimber Enterprises Gerald H Rose Snowville Waterworks Corporation South Junction Creek Water Users Thornley K Swan
Tooele County Grantsville City Grantsville City Grantsville Irrigation Company Grantsville South Willow Irrigation Company Grantsville South Willow Irrigation Company Grantsville South Willow Irrigation Company Hickman Creek Irrigation Hickman Creek Irrigation Lincoln Culinary Water Corp Lincoln Culinary Water Corp Middle Canyon Irrigation Company Middle Canyon Irrigation Company Middle Canyon Irrigation Company Middle Canyon Irrigation Company Ophir Canyon Water Association Ophir Canyon Water Association Settlement Canyon Irrigation Company Settlement Canyon Irrigation Company Settlement Canyon Irrigation Company Soldier Canyon Water Company Soldier Canyon Water Company Soldier Canyon Water Company St. John Group St. John Irrigation Company Stockton Town Terra Water Corp Vernon Irrigation Company Vernon Irrigation Company Vernon Waterworks Water User’s of Upper Clover Creek Wendover City
Juab County Callao Irrigation Company
Millard County Snake Creek Irrigation Company
DamDam-EnlargementDam-ReparationsDam-Reservoir
Culinary SystemPipe
SprinklerWell
Culinary PipeDam-Reservoir
SprinklerPipePipePipe
SprinklerStockwaterStockwater
Culinary TankDam Enlargement
Stockwater
Culinary WellCulinary TankDam/Reservoir
PipePipePipePipePipe
Culinary TankCulinary Pipe
PipePipePipePipe
Culinary PipeCulinary Well
PipePipe
Dam RepairsSprinkler
Diversion DamPipe
StockwaterSprinkler
Culinary SpringDual WaterCanal Lining
Dam/ReservoirCulinary System
SprinklerCulinary Tank
Diversion Dam
Pipe
19491967198619601978195219771948197619591973199719481961197719771978198419581977
1978199619831951196419731960197319851993196119721977198619751993194819731984197719831983197819781980198719571972197519771982
1948
1962
Total Projects 53
9-4
Table 9-2PROJECTED CULINARY M&I DEMAND AND SUPPLY
FOR PUBLIC COMMUNITY WATER SYSTEMSWest Desert Basin
NamePopulationProjection
(2020)
Future WaterDemand*
(acre-feet/yr)
ExistingWater Supply(acre-feet/yr)
SystemCapacity‡
(acre-feet/yr)
SurplusDeficit ()
(acre-feet/yr)
Box Elder CountyGrouse CreekHowell Town Water Dist.Snowville Waterworks Inc.
County Totals
127 440
407 974
40 130 120 290
180 290
500 970
80 130 210 420
140 160
380 680
Tooele CountyDugway - English VillageErda Acres Water CompanyGolden GardensGrantsville Municipal Water Lincoln Culinary WaterOphir Canyon Water Assoc.S & W Trailer ParkSilver Spurs RanchosStansbury Park Imp. Dist.Stockton Municipal WaterTooele Municipal WaterVernon Water WorksWendover Municipal Water
County Totals
1,700 2,920
274 9,373
480 170 200 60
6,790 775
33,690 482
1,688 58,602
500 850 80
2,680 140 50 30 20
1,940 220
8,000 140
482 15,132
3,360
850 100
3,710 140 110 30 30
4,240 500
7,830 110
3,550 24,560
1,390 380 50
1,640 80 50 20 20
1,840 260
3,240 60
1,530 10,560
2,860 0
20 1,030
0 60 0
10 2,300
280 (170) (30)
3,068 9,428
Juab CountyGoshute Indian Reservation 174 30 20 20 (10)
Millard CountyEskdale 118 30 320 140 290
TOTAL 59,868 15,482 25,870 11,140 10,388
*Calculated demand for 2020 is based upon the Community Water System’s current water use. ‡ The system capacity represents the volume of water, which when divided by the average annual water per capita use, givesthe population that can be reliably served by the existing system under peak day demand conditions.
availability of late season irrigation water. Where population centers have developed, mostcommunities have been far-sited in providingadequate municipal water supplies. For most ofthe basin’s communities, meeting future M&Ineeds means improving and up-grading theirexisting delivery system. There are, however, instances of local water resources problems inthe basin. These issues include: providingadequate M&I water system capacity, waterquality, groundwater mining, groundwater
contamination, drought and flooding concerns. Residents in Snowville and Curlew Valley areconcerned that developments in the northern endof the valley, in Idaho, will reduce theirgroundwater supply. An estimated 20,000 acre-feet of groundwater flows annually across thestate line from Idaho into the Utah portion ofCurlew Valley. Without some type ofagreement between the states as to how tohandle this problem, it has the potential tobecome a serious issue.
9-5
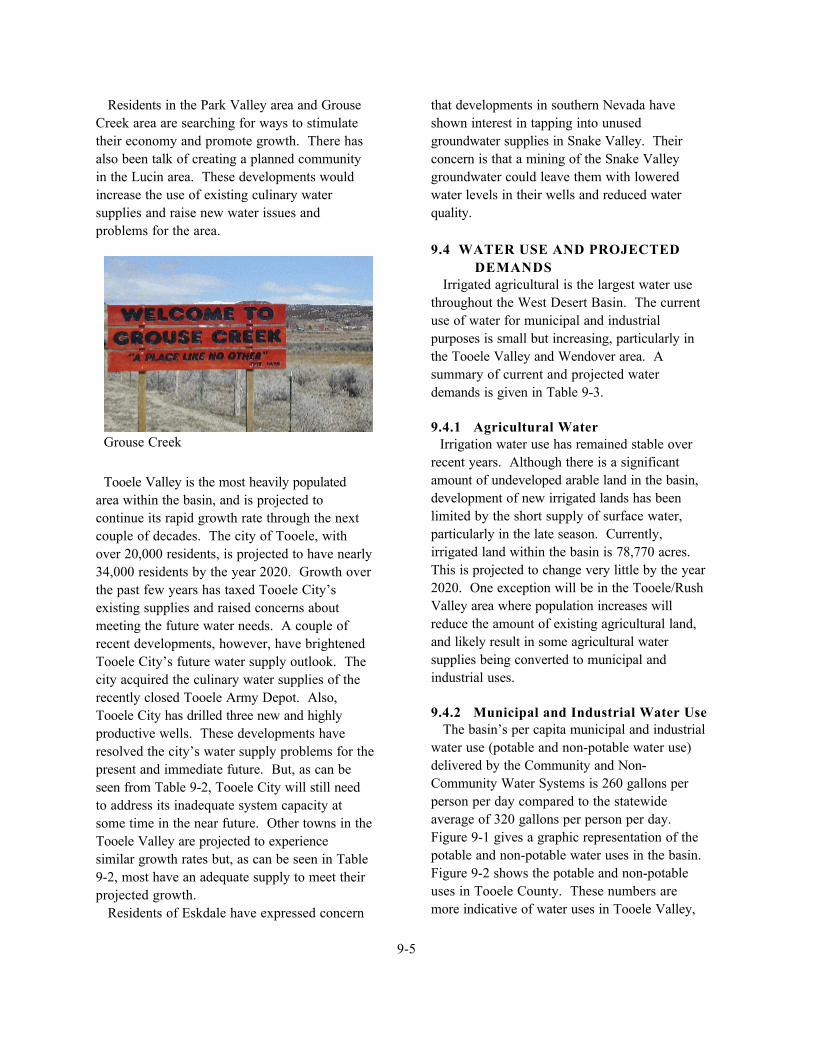
Grouse Creek
Residents in the Park Valley area and GrouseCreek area are searching for ways to stimulatetheir economy and promote growth. There hasalso been talk of creating a planned communityin the Lucin area. These developments wouldincrease the use of existing culinary watersupplies and raise new water issues andproblems for the area.
Tooele Valley is the most heavily populatedarea within the basin, and is projected tocontinue its rapid growth rate through the nextcouple of decades. The city of Tooele, withover 20,000 residents, is projected to have nearly34,000 residents by the year 2020. Growth overthe past few years has taxed Tooele City’sexisting supplies and raised concerns aboutmeeting the future water needs. A couple ofrecent developments, however, have brightenedTooele City’s future water supply outlook. Thecity acquired the culinary water supplies of therecently closed Tooele Army Depot. Also,Tooele City has drilled three new and highlyproductive wells. These developments haveresolved the city’s water supply problems for thepresent and immediate future. But, as can beseen from Table 9-2, Tooele City will still needto address its inadequate system capacity atsome time in the near future. Other towns in theTooele Valley are projected to experiencesimilar growth rates but, as can be seen in Table9-2, most have an adequate supply to meet theirprojected growth. Residents of Eskdale have expressed concern
that developments in southern Nevada haveshown interest in tapping into unusedgroundwater supplies in Snake Valley. Theirconcern is that a mining of the Snake Valleygroundwater could leave them with loweredwater levels in their wells and reduced waterquality.
9.4 WATER USE AND PROJECTED DEMANDS Irrigated agricultural is the largest water usethroughout the West Desert Basin. The currentuse of water for municipal and industrialpurposes is small but increasing, particularly inthe Tooele Valley and Wendover area. Asummary of current and projected waterdemands is given in Table 9-3.
9.4.1 Agricultural Water Irrigation water use has remained stable overrecent years. Although there is a significantamount of undeveloped arable land in the basin,development of new irrigated lands has beenlimited by the short supply of surface water,particularly in the late season. Currently,irrigated land within the basin is 78,770 acres. This is projected to change very little by the year2020. One exception will be in the Tooele/RushValley area where population increases willreduce the amount of existing agricultural land,and likely result in some agricultural watersupplies being converted to municipal andindustrial uses.
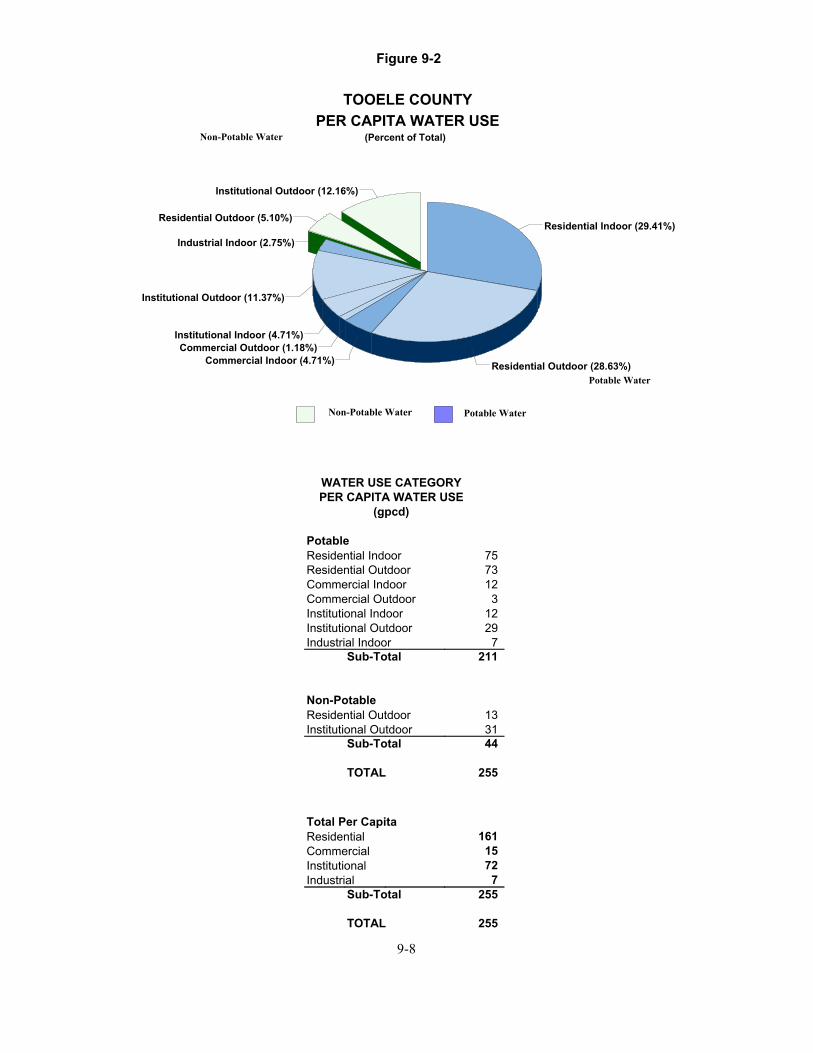
9.4.2 Municipal and Industrial Water Use The basin’s per capita municipal and industrialwater use (potable and non-potable water use)delivered by the Community and Non-Community Water Systems is 260 gallons perperson per day compared to the statewideaverage of 320 gallons per person per day. Figure 9-1 gives a graphic representation of thepotable and non-potable water uses in the basin. Figure 9-2 shows the potable and non-potableuses in Tooele County. These numbers aremore indicative of water uses in Tooele Valley,

Tabl
e 9-
3SU
MM
AR
Y O
F C
UR
RE
NT
AN
D P
RO
JEC
TE
D W
AT
ER
DE
MA
ND
SW
est D
eser
t Bas
in(a
cre-
feet
/yea
r)
Use
Cat
egor
yBo
x El
der
Tooe
leJu
abM
illar
dTo
tal
1996
2020
1996
2020
1996
2020
1996
2020
1996
2020
Mun
icip
al &
Indu
stria
l:Po
tabl
eRe
siden
tial1
Com
mer
cial
/Insti
tutio
nal
Indu
stria
l(s
ub-s
ubto
tal)
198 75
11
284
281
106
15
402
5,09
2 1,
922
27
0 7,
284
11,1
37
4,20
4
590
15
,931
47
18
3
68
73
27
4
10
4
28
11
2
41
41
15
2
58
5,36
5 2,
026
28
6 7,
677
11,5
32
4,35
2
611
16
,495
Se
lf-Su
pplie
d In
dustr
ial
(sub
-sub
tota
l)70
0 98
4
890
1,29
2 3
,060
10
,344
6
,000
21
,931
0
68
0
104
0
41
0
58
3
,760
11
,437
6
,890
23
,385
N
on-P
otab
leRe
siden
tial/I
nstit
utio
nal
Indu
stria
l(s
ub-s
ubto
tal)
58 0 58
82 0 82
1,48
3 02
1,48
3
3,24
5 02
3,24
5
14
0
14
21 0
21
8 0 8
12 0 12
1,56
3 0 1,
563
3,36
0 0 3,
360
Tot
al1,
042
1,37
4 11
,827
25
,176
82
12
5
49
70
13,0
00
26,7
45
Irri
gate
d A
gric
ultu
ral
96,6
00
96,6
00
59,2
00
59,2
00
7,50
0
7,50
0
23,6
00
23,6
00
186,
900
186,
900
Bas
in T
otal
97,6
42
97,9
74
71,0
27
84,3
76
7,58
2
7,62
5
23,6
49
23,6
70
199,
900
213,
645
1: I
nclu
des
Com
mun
ity W
ater
Sys
tem
s, N
on-C
omm
unity
Wat
er S
yste
ms,
and
Priv
ate
Dom
estic
2: D
oes
not i
nclu
de 1
0,00
0 ac
re-f
eet o
f exp
ort t
o K
enne
cott
or 1
70,9
60 a
cre-
feet
of d
iver
sion
of G
reat
Sal
t Lak
e w
ater
for m
iner
al e
xtra
ctio
n.
9-6

WATER USE CATEGORYPER CAPITA WATER USE
(gpcd)
Potable75Residential Indoor76Residential Outdoor13Commercial Indoor3Commercial Outdoor
12Institutional Indoor29Institutional Outdoor8Industrial Indoor
216Sub-Total
Non-Potable13Residential Outdoor31Institutional Outdoor44Sub-Total
260TOTAL
Total Per Capita164Residential16Commercial72Institutional8Industrial
260Sub-Total
260TOTAL
Residential Indoor (28.85%)Industrial Indoor (3.08%)
Residential Outdoor (5.00%)
Institutional Outdoor (11.92%)
Residential Outdoor (29.23%)
Institutional Outdoor (11.15%)
Institutional Indoor (4.62%)Commercial Outdoor (1.15%)
Commercial Indoor (5.00%)
WEST DESERT BASINPER CAPITA WATER USE
(Percent of Total)
Non-Potable Water Potable Water
Non-Potable Water
Potable Water
Figure 9-1
9-7
WATER USE CATEGORYPER CAPITA WATER USE
(gpcd)
Potable75Residential Indoor73Residential Outdoor12Commercial Indoor3Commercial Outdoor
12Institutional Indoor29Institutional Outdoor7Industrial Indoor
211Sub-Total
Non-Potable13Residential Outdoor31Institutional Outdoor44Sub-Total
255TOTAL
Total Per Capita161Residential15Commercial72Institutional7Industrial
255Sub-Total
255TOTAL
Residential Indoor (29.41%)Industrial Indoor (2.75%)
Residential Outdoor (5.10%)
Institutional Outdoor (12.16%)
Residential Outdoor (28.63%)
Institutional Outdoor (11.37%)
Institutional Indoor (4.71%)Commercial Outdoor (1.18%)
Commercial Indoor (4.71%)
TOOELE COUNTYPER CAPITA WATER USE
(Percent of Total)
Non-Potable Water Potable Water
Non-Potable Water
Potable Water
9-8
Figure 9-2
9-9
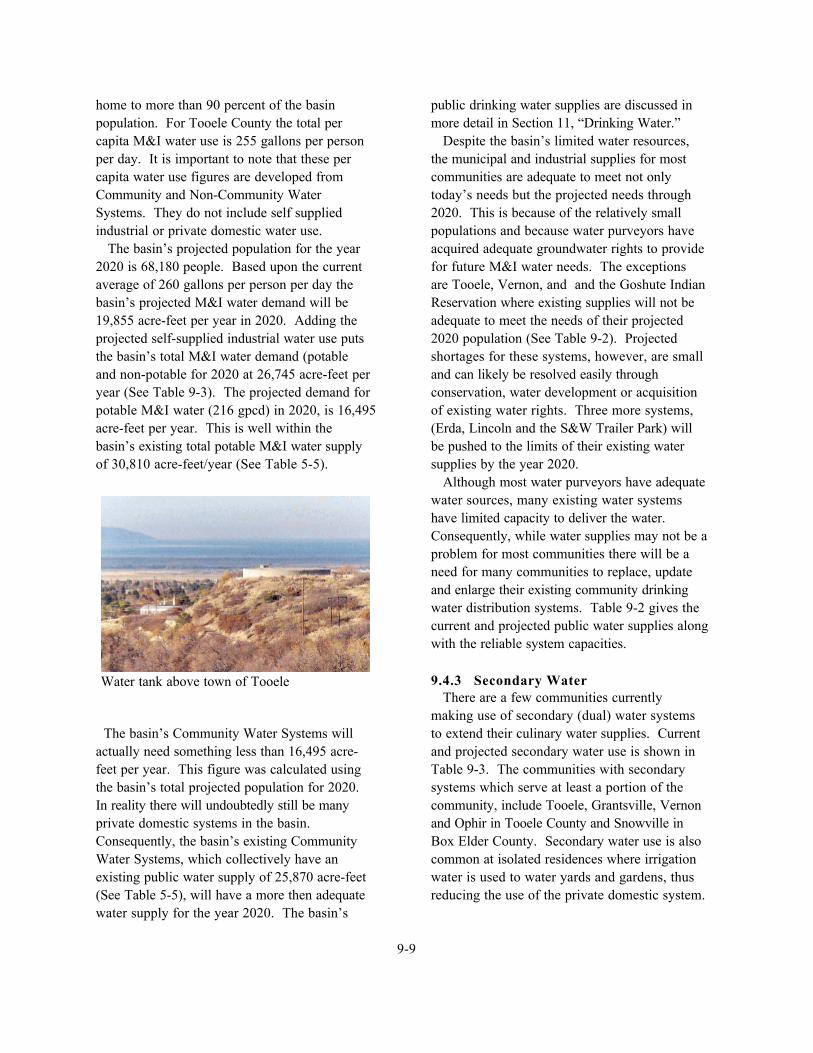
Water tank above town of Tooele
home to more than 90 percent of the basinpopulation. For Tooele County the total percapita M&I water use is 255 gallons per personper day. It is important to note that these percapita water use figures are developed fromCommunity and Non-Community WaterSystems. They do not include self suppliedindustrial or private domestic water use. The basin’s projected population for the year2020 is 68,180 people. Based upon the currentaverage of 260 gallons per person per day thebasin’s projected M&I water demand will be19,855 acre-feet per year in 2020. Adding theprojected self-supplied industrial water use putsthe basin’s total M&I water demand (potableand non-potable for 2020 at 26,745 acre-feet peryear (See Table 9-3). The projected demand forpotable M&I water (216 gpcd) in 2020, is 16,495acre-feet per year. This is well within thebasin’s existing total potable M&I water supplyof 30,810 acre-feet/year (See Table 5-5).
The basin’s Community Water Systems willactually need something less than 16,495 acre-feet per year. This figure was calculated usingthe basin’s total projected population for 2020. In reality there will undoubtedly still be manyprivate domestic systems in the basin. Consequently, the basin’s existing CommunityWater Systems, which collectively have anexisting public water supply of 25,870 acre-feet(See Table 5-5), will have a more then adequatewater supply for the year 2020. The basin’s
public drinking water supplies are discussed inmore detail in Section 11, “Drinking Water.” Despite the basin’s limited water resources,the municipal and industrial supplies for mostcommunities are adequate to meet not onlytoday’s needs but the projected needs through2020. This is because of the relatively smallpopulations and because water purveyors haveacquired adequate groundwater rights to providefor future M&I water needs. The exceptionsare Tooele, Vernon, and and the Goshute IndianReservation where existing supplies will not beadequate to meet the needs of their projected2020 population (See Table 9-2). Projectedshortages for these systems, however, are smalland can likely be resolved easily throughconservation, water development or acquisitionof existing water rights. Three more systems,(Erda, Lincoln and the S&W Trailer Park) willbe pushed to the limits of their existing watersupplies by the year 2020. Although most water purveyors have adequatewater sources, many existing water systemshave limited capacity to deliver the water. Consequently, while water supplies may not be aproblem for most communities there will be aneed for many communities to replace, updateand enlarge their existing community drinkingwater distribution systems. Table 9-2 gives thecurrent and projected public water supplies alongwith the reliable system capacities.
9.4.3 Secondary Water There are a few communities currentlymaking use of secondary (dual) water systemsto extend their culinary water supplies. Currentand projected secondary water use is shown inTable 9-3. The communities with secondarysystems which serve at least a portion of thecommunity, include Tooele, Grantsville, Vernonand Ophir in Tooele County and Snowville inBox Elder County. Secondary water use is alsocommon at isolated residences where irrigationwater is used to water yards and gardens, thusreducing the use of the private domestic system.
9-10
9.4.4 Recreational Water Use All of the basin’s reservoirs are quite smalland provide little opportunity for boating or otherwater activity. Some do provide fishingopportunities and destination sites for camping,picnicking and other recreational activities. TheGreat Salt Lake is used for boating and sailingbut access is primarily from the Great Salt LakeState Park and marina located in Salt LakeCounty. (See Section 15, Water-RelatedRecreation for more information.)
9.4.5 Environmental Water Needs Water is used for riparian vegetation, wetlandsmaintenance and instream flows for fish andwildlife. Phreatophytes are also needed toprovide cover and food for wildlife. Land useinventories have mapped 39,720 acres ofwetlands in the West Desert basin and 24,810acres of riparian habitat. There are also 685,940acres of pickleweed barrens located primarilyalong the west and north shores of the GreatSalt Lake and around the periphery of the GreatSalt Lake Desert. These areas act as a naturalfilter removing some nutrients and otherpollutants from the waters flowing through them. These areas also deplete a significant portion ofthe desert basins annual precipitation throughevapo-transporation.
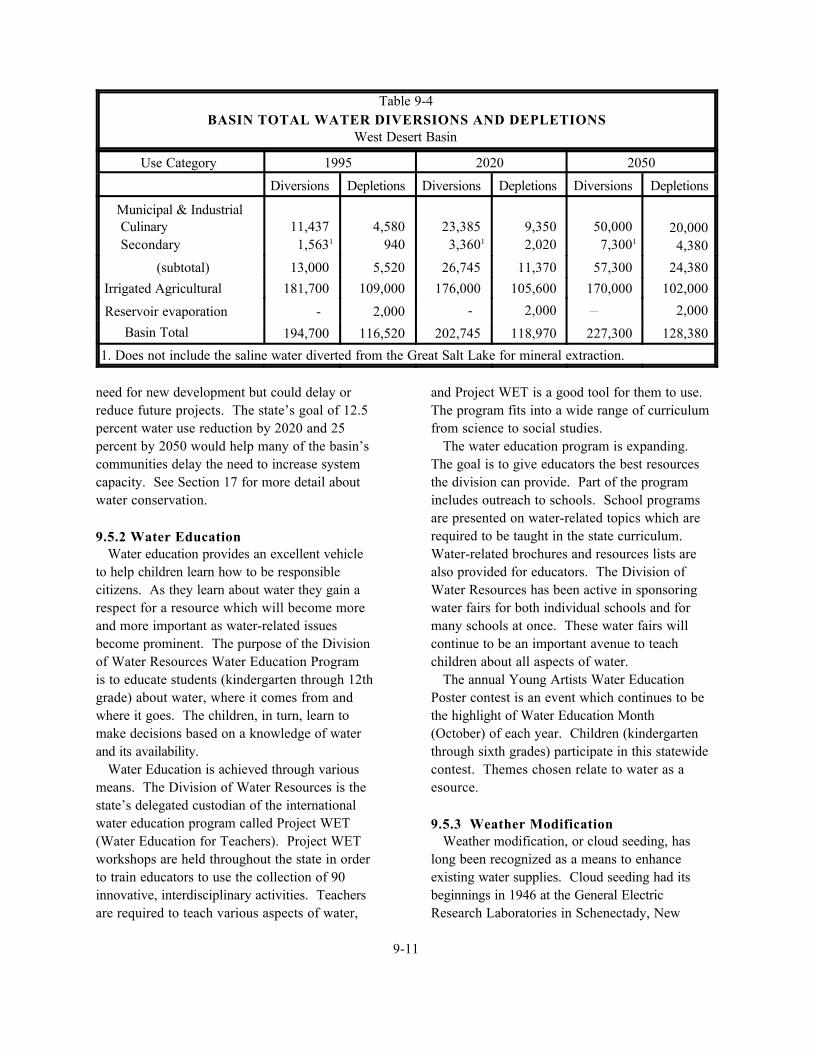
9.4.6 Water Depletions The basin’s total water depletions aresummarized in Table 9-4. Culinary waterdepletions are typically forty percent of theculinary water use. Irrigated agricultural waterand secondary water depletions typically runabout sixty percent of the water diverted foruse. As the basin’s total water diversionsincreases from 194,700 to 202,745 acre-feetbetween 1995 and 2020, the total waterdepletions for the basin are projected to increaseonly about 2,500 acre-feet. This is primarilybecause the use of agricultural water in thebasin is projected to decline somewhat over thenext few decades as agricultural lands in theTooele Valley are converted to municipal uses.
9.5 ALTERNATIVES FOR MEETING WATER NEEDS Although water is scarce in the West DesertBasin there are still developable groundwaterand surface water sources throughout much ofthe basin. The exceptions are Tooele Valleyand the Snowville area which have been closed to the further appropriation of surface andgroundwater. Any development of new surfacewater will likely mean the construction of a smallreservoir to store springtime runoffAlthough the basin does not have any largepotential reservoir sites there are likely manylocations where, if economically feasible, severalhundred acre-feet of water could be capturedand stored. At the present time it is estimated that at least12,000 acre-feet of water is exported from theTooele county to Kennecott Corporation in SaltLake County for industrial use. Kennecott’sexported water comes from both surface andgroundwater sources. Much of it is exportedfrom the Lake Point area and is not of aparticularly favorable quality. An estimated2,000 acre-feet is diverted from the White Pinearea of Middle Canyon, in the upper watershedof the Oquirrh Mountains which would make anexcellent culinary water source. It is possiblethat with its recent modernization andimprovements the Kennecott Corporation maynot need all of the water it currently has rights toexport from Tooele County. Perhaps throughexchange, or the direct purchase of water rights,Tooele County or some other Tooele Valleywater supplier could acquire some of this wateras a culinary water source.
9.5.1 Conservation There is potential to stretch existing watersupplies through a number of conservationpractices. Water users may be able to bettermanage their supplies thereby increasingefficiencies which in turn can reduce costs. This applies to all water uses includingresidential, commercial, industrial andagricultural. Conservation will not eliminate the
9-11
Table 9-4BASIN TOTAL WATER DIVERSIONS AND DEPLETIONS
West Desert Basin
Use Category 1995 2020 2050
Diversions Depletions Diversions Depletions Diversions Depletions
Municipal & Industrial CulinarySecondary
11,437 1,5631
4,580 940
23,385 3,3601
9,350 2,020
50,000 7,3001
20,000 4,380
(subtotal) 13,000 5,520 26,745 11,370 57,300 24,380 Irrigated Agricultural 181,700 109,000 176,000 105,600 170,000 102,000
Reservoir evaporation - 2,000 - 2,000 - 2,000 Basin Total 194,700 116,520 202,745 118,970 227,300 128,380
1. Does not include the saline water diverted from the Great Salt Lake for mineral extraction.
need for new development but could delay orreduce future projects. The state’s goal of 12.5percent water use reduction by 2020 and 25percent by 2050 would help many of the basin’scommunities delay the need to increase systemcapacity. See Section 17 for more detail aboutwater conservation. 9.5.2 Water Education Water education provides an excellent vehicleto help children learn how to be responsiblecitizens. As they learn about water they gain arespect for a resource which will become moreand more important as water-related issuesbecome prominent. The purpose of the Divisionof Water Resources Water Education Programis to educate students (kindergarten through 12thgrade) about water, where it comes from andwhere it goes. The children, in turn, learn tomake decisions based on a knowledge of waterand its availability. Water Education is achieved through variousmeans. The Division of Water Resources is thestate’s delegated custodian of the internationalwater education program called Project WET(Water Education for Teachers). Project WETworkshops are held throughout the state in orderto train educators to use the collection of 90innovative, interdisciplinary activities. Teachersare required to teach various aspects of water,
and Project WET is a good tool for them to use.The program fits into a wide range of curriculumfrom science to social studies. The water education program is expanding. The goal is to give educators the best resourcesthe division can provide. Part of the programincludes outreach to schools. School programsare presented on water-related topics which arerequired to be taught in the state curriculum. Water-related brochures and resources lists are also provided for educators. The Division ofWater Resources has been active in sponsoringwater fairs for both individual schools and formany schools at once. These water fairs willcontinue to be an important avenue to teachchildren about all aspects of water. The annual Young Artists Water Education Poster contest is an event which continues to bethe highlight of Water Education Month(October) of each year. Children (kindergartenthrough sixth grades) participate in this statewidecontest. Themes chosen relate to water as aesource.
9.5.3 Weather Modification Weather modification, or cloud seeding, haslong been recognized as a means to enhanceexisting water supplies. Cloud seeding had itsbeginnings in 1946 at the General ElectricResearch Laboratories in Schenectady, New

9-12
Clouds over the Oquirrhs
York. Cloud seeding can assist nature in theformation of precipitation, with appropriate typesand numbers of nuclei at the proper times andplaces. Cloud seeding projects have beencarried out in over 20 countries. Projects aregenerally conducted either during the winter orsummer months. While wintertime projectstarget the enhancement of mountain snow-packwithin a watershed, summertime projects areaimed at enhancing precipitation and/or reducingdamage from hail. “Seeding” winter storm clouds over mountainsis well established and understood. Clouds formas moist air is lifted and cooled during itspassage across mountain ranges. Left to nature,many clouds are highly inefficient precipitators,retaining more than 90 percent of their moisture. By cloud seeding, the precipitation efficiencycan be greatly improved. Generally, silver iodideis used in ground generators to produce artificialice nuclei that form ice crystals. Spreading thenuclei via aircraft is also possible. Thesecrystals attract moisture from the surrounding airforming droplets that grow large enough to fall tothe ground as snow. Some projects usingground-based silver iodide generators to seedwinter storms over mountain areas in thewestern United States have operatedcontinuously since 1950. Precipitation data from numerous cloudseeding projects have been examined in detailfor evidence of downwind effects. Results fromthese analyses show a slight increase inprecipitation in areas up to 90 miles downwindfrom the project area. No decrease inprecipitation has been detected fartherdownwind from any long-term cloud seedingproject. The first cloud seeding project in Utah beganin the early 1950s in the central portion of thestate. Cloud seeding started again in 1973 andhas continued to the present. In 1973 the UtahLegislature passed the Utah Cloud Seeding Act. This law provided for licensing cloud seedingoperators and permitting cloud seeding projectsby the Utah Division of Water Resources. The
act states that for water right purposes all waterderived from cloud seeding will be treated asthough it fell naturally. The act also allowed forthe division to sponsor and/or cost share in cloudseeding projects. Since 1976, the state throughthe Division and Board of Water Resources hascost shared with local entities for cloud seedingprojects. Recent cost sharing by the board hasbeen approximately 50 percent.
There are two winter time cloud seedingprojects using silver iodide in the West DesertBasin. The West Box Elder project targets thewatersheds of the Raft River Mountains and hasoperated for 9 years from 1989 to 1997. Theproject was started again in 2000. A project inEast Tooele County targeting the watersheds ofthe Stansbury and Oquirrh Mountains hasoperated for 16 years. The project operatedfrom 1976 to 1983, 1989 to 1992 and 1996 to thepresent. A long term project has been operating inCentral and Southern Utah. Statistical analysesof the Central and Southern Utah Project withover 20 years of operation and data indicate aDecember through March precipitation increaseof about 15 percent and an April 1 snow watercontent increase of about 10 percent. Runoffanalysis in Utah indicates a 10 percent increasein April 1 snow water content will result in a 10to 20 percent increase in the April-July runoffdepending on individual watersheds. Cloud seeding is most effective when it iscontinued over several years, providing

9-13
increased soil moisture, increased groundwaterfor springs and keeping up base flows. Seedingonly in dry years may not be as effectivebecause of a lack of seedable storm systems.
9.6 ISSUES AND RECOMMENDATIONS
9.6.1 Local Planning
Issue - Some communities are not adequatelyplanning for future growth.
Discussion - Water purveyors need to plan fortheir community’s future growth. Althoughthere is not a lot of water in the West DesertBasin, most communities have secured a supplyof drinking water that is more than adequate tomeet their current needs and into the nearfuture. There is however, a need throughout thebasin for communities to address theinadequacies of their existing infrastructure. Many of the basin’s community drinking watersystems are currently operating at or near theircapacities. While these communities may haveadequate supplies and could improve systemcapacity to deliver more water, it may beadvantageous for them to consider conservationmeasures that could reduce the demand anddelay the need for improvements. Sooner orlater water conservation will need to be anintegral part of each community’s watermanagement plan. Not only is it prudent forcommunities to consider water conservationmeasures, it is now a requirement for watersuppliers with more than 500 connections to
submit a water conservation plan to the state. The present advice from water plannersthroughout the United States is to estimatecommunity growth for the next 50 years. Community leaders should then plan for acombination of water supply, water quality andconservation strategies that will provide anintegrated structural and non-structural programto meet their projected needs. Various scenarios can be explored to considerall the options available to the communities. Least-cost analysis may be used, with waterconservation and environmental impacts givenfull consideration . Groundwater sources will beconsidered along with conversion of agriculturalwater and water conservation through betterefficiencies within and outside timely action forthe future quality of life. Recommendation - All communities and waterutilities should prepare a long-term watermanagement plan which includes new watersupply sources, upgrading infrastructure andwater conservation programs. To encourage thecommunity’s homes. The plan should be reappraised periodically. By updating population projections, reevaluatingnew conservation methods as they becomeavailable, those responsible for water deliverywill be alerted to problems that are beyond theirterm of office and yet requiremanagement and conservation planning,communities and water utilities shouldincreasingly be expected to prepare thesemanagement plans before federal or state fundsare awarded.