contents dare to dream - sharedata · on this journey and dare to dream with us ... complied with...
TRANSCRIPT
001
DR
EA
MD
AR
E TO
“It is our dream to growARM into a low-cost,globally competitive,diversified miningcompany: please join uson this journey and DARETO DREAM with us….”
Patrice MotsepeExecutive chairmanDecember 2004
> contents
002 Group financial summary and statistics
003 Five year review
004 Salient features
005 Asset locations
006 Year in review by Executive chairman
016 Year in review by Chief executive officer
017 ARMferrous
020 ARMplatinum
025 Harmony
026 Mineral resources and reserves
034 Group risk management policy
036 Corporate governance
048 Sustainable development
057 Annual financial statements
115 Convenience translation into US$
120 Investor relations
125 Notice of annual general meeting
IBC Administration
002
DR
EA
M>GROUP FINANCIAL SUMMARY
AND STATISTICS
GR
OW
TH ANNUALREVIEWGrowth strategy formulated
Group restructured
to reflect new focus
Headline earnings for the
year: R47 million
(Financial year ended 30 June
2003: R197 million)
Basic earnings for
the year: R1,1 billion
(Financial year ended 30 June
2003: R0,2 billion – loss)
Strong second half
performances from nickel
and ferrous operations
• Profit from operations
Second half 2003/2004:
R404 million (First half
2003/2004: R124 million)
Substantially stronger
balance sheet
Good progress with
in-house projects
Combining best practice
of companies following
the Avmin Transaction
>>
>
>
>
>
>
>
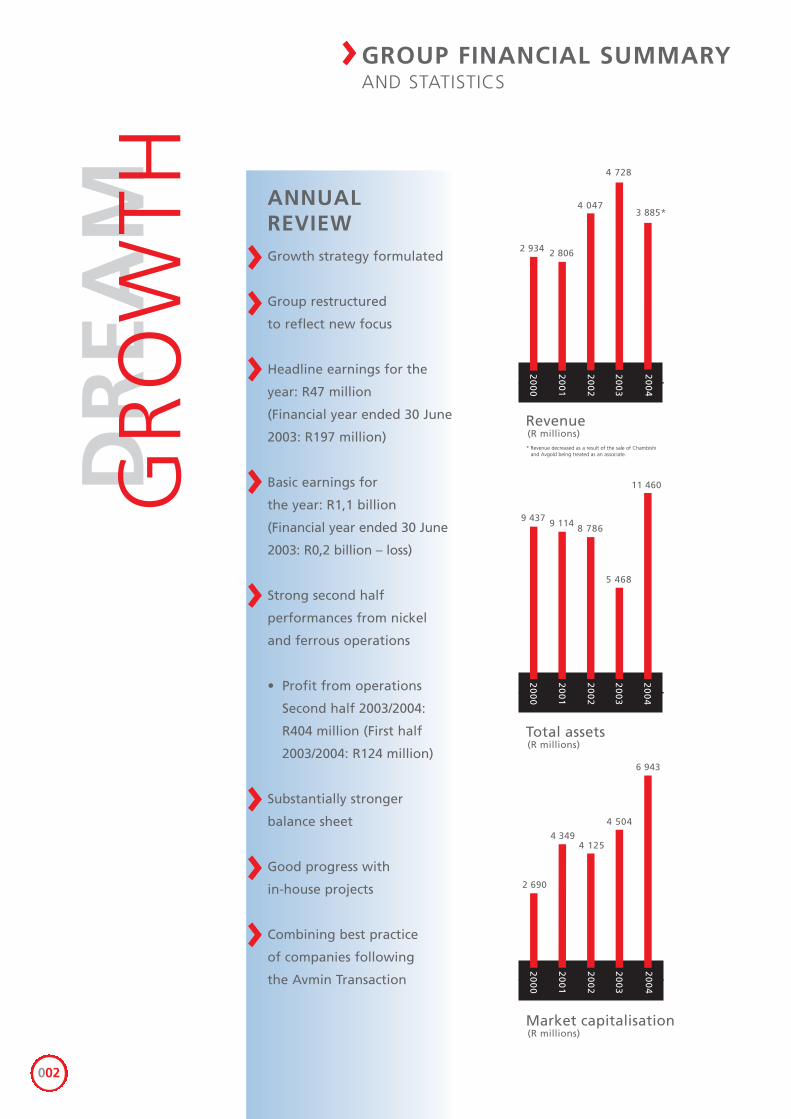
Revenue
20
04
20
03
20
02
20
01
20
00
(R millions)
2 806
4 047
4 728
3 885
2 934
*
Total assets
20
04
20
03
20
02
20
01
20
00
(R millions)
9 114 8 786
5 468
11 460
9 437
Market capitalisation
20
04
20
03
20
02
20
01
20
00
(R millions)
4 3494 125
4 504
6 943
2 690
* Revenue decreased as a result of the sale of Chambishiand Avgold being treated as an associate.
003
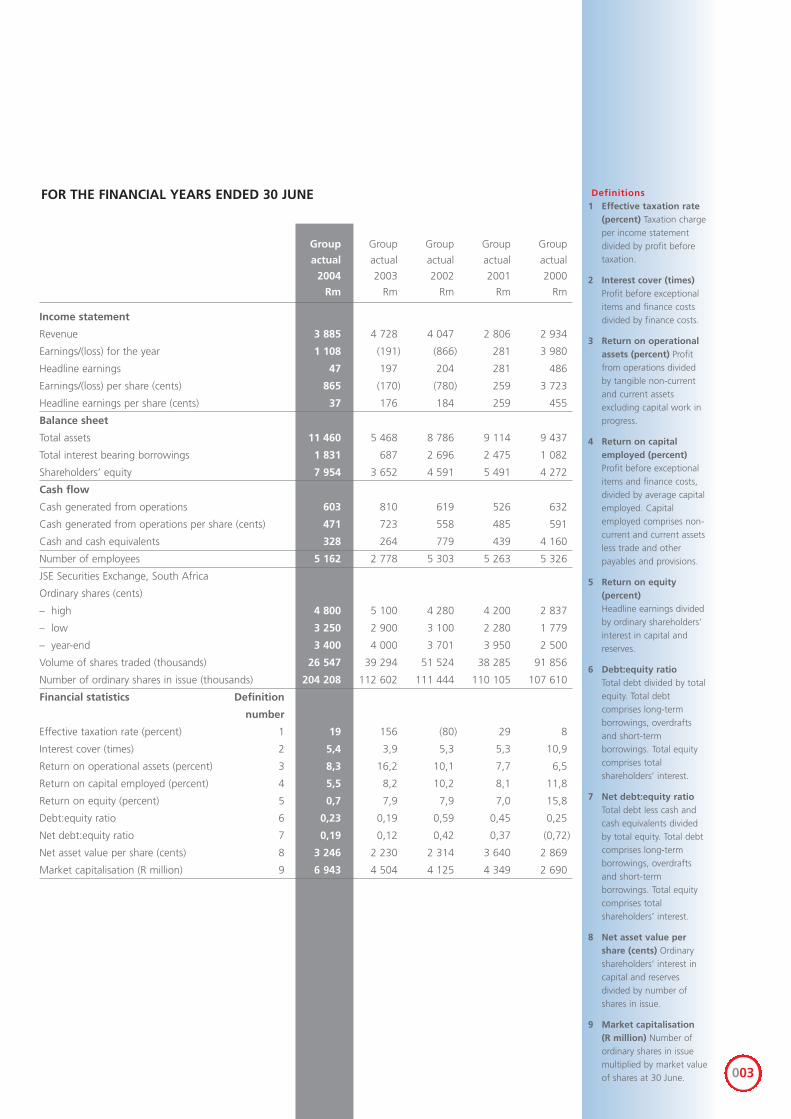
Group Group Group Group Group
actual actual actual actual actual
2004 2003 2002 2001 2000
Rm Rm Rm Rm Rm
Income statement
Revenue 3 885 4 728 4 047 2 806 2 934
Earnings/(loss) for the year 1 108 (191) (866) 281 3 980
Headline earnings 47 197 204 281 486
Earnings/(loss) per share (cents) 865 (170) (780) 259 3 723
Headline earnings per share (cents) 37 176 184 259 455
Balance sheet
Total assets 11 460 5 468 8 786 9 114 9 437
Total interest bearing borrowings 1 831 687 2 696 2 475 1 082
Shareholders’ equity 7 954 3 652 4 591 5 491 4 272
Cash flow
Cash generated from operations 603 810 619 526 632
Cash generated from operations per share (cents) 471 723 558 485 591
Cash and cash equivalents 328 264 779 439 4 160
Number of employees 5 162 2 778 5 303 5 263 5 326
JSE Securities Exchange, South Africa
Ordinary shares (cents)
– high 4 800 5 100 4 280 4 200 2 837
– low 3 250 2 900 3 100 2 280 1 779
– year-end 3 400 4 000 3 701 3 950 2 500
Volume of shares traded (thousands) 26 547 39 294 51 524 38 285 91 856
Number of ordinary shares in issue (thousands) 204 208 112 602 111 444 110 105 107 610
Financial statistics Definition
number
Effective taxation rate (percent) 1 19 156 (80) 29 8
Interest cover (times) 2 5,4 3,9 5,3 5,3 10,9
Return on operational assets (percent) 3 8,3 16,2 10,1 7,7 6,5
Return on capital employed (percent) 4 5,5 8,2 10,2 8,1 11,8
Return on equity (percent) 5 0,7 7,9 7,9 7,0 15,8
Debt:equity ratio 6 0,23 0,19 0,59 0,45 0,25
Net debt:equity ratio 7 0,19 0,12 0,42 0,37 (0,72)
Net asset value per share (cents) 8 3 246 2 230 2 314 3 640 2 869
Market capitalisation (R million) 9 6 943 4 504 4 125 4 349 2 690
FOR THE FINANCIAL YEARS ENDED 30 JUNE Definitions1 Effective taxation rate
(percent) Taxation chargeper income statementdivided by profit beforetaxation.
2 Interest cover (times)Profit before exceptionalitems and finance costsdivided by finance costs.
3 Return on operationalassets (percent) Profitfrom operations dividedby tangible non-currentand current assetsexcluding capital work inprogress.
4 Return on capitalemployed (percent)Profit before exceptionalitems and finance costs,divided by average capitalemployed. Capitalemployed comprises non-current and current assetsless trade and otherpayables and provisions.
5 Return on equity(percent)Headline earnings dividedby ordinary shareholders’interest in capital andreserves.
6 Debt:equity ratioTotal debt divided by totalequity. Total debtcomprises long-termborrowings, overdraftsand short-termborrowings. Total equitycomprises totalshareholders’ interest.
7 Net debt:equity ratioTotal debt less cash andcash equivalents dividedby total equity. Total debtcomprises long-termborrowings, overdraftsand short-termborrowings. Total equitycomprises totalshareholders’ interest.
8 Net asset value pershare (cents) Ordinaryshareholders’ interest incapital and reservesdivided by number ofshares in issue.
9 Market capitalisation(R million) Number ofordinary shares in issuemultiplied by market valueof shares at 30 June.
004
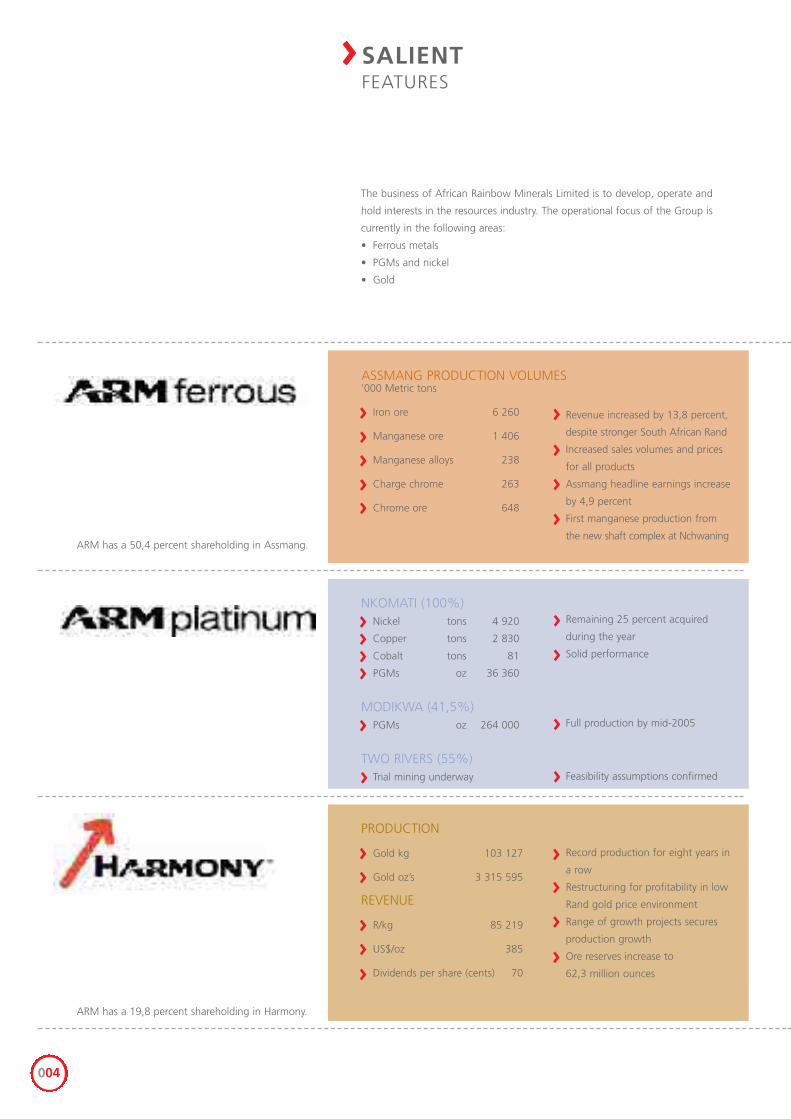
>SALIENTFEATURES
The business of African Rainbow Minerals Limited is to develop, operate and
hold interests in the resources industry. The operational focus of the Group is
currently in the following areas:
• Ferrous metals
• PGMs and nickel
• Gold
PRODUCTION
Gold kg 103 127
Gold oz’s 3 315 595
REVENUE
R/kg 85 219
US$/oz 385
Dividends per share (cents) 70
Record production for eight years in
a row
Restructuring for profitability in low
Rand gold price environment
Range of growth projects secures
production growth
Ore reserves increase to
62,3 million ounces
NKOMATI (100%)Nickel tons 4 920
Copper tons 2 830
Cobalt tons 81
PGMs oz 36 360
MODIKWA (41,5%)PGMs oz 264 000
TWO RIVERS (55%)Trial mining underway
Remaining 25 percent acquired
during the year
Solid performance
Full production by mid-2005
Feasibility assumptions confirmed
’000 Metric tons
Iron ore 6 260
Manganese ore 1 406
Manganese alloys 238
Charge chrome 263
Chrome ore 648
Revenue increased by 13,8 percent,
despite stronger South African Rand
Increased sales volumes and prices
for all products
Assmang headline earnings increase
by 4,9 percent
First manganese production from
the new shaft complex at Nchwaning
>>>
>>>
>
>
>
>>>>>
>
>
>
>
>
>>>>>>
>
>
>ARM has a 50,4 percent shareholding in Assmang.
ARM has a 19,8 percent shareholding in Harmony.
ASSMANG PRODUCTION VOLUMES
005
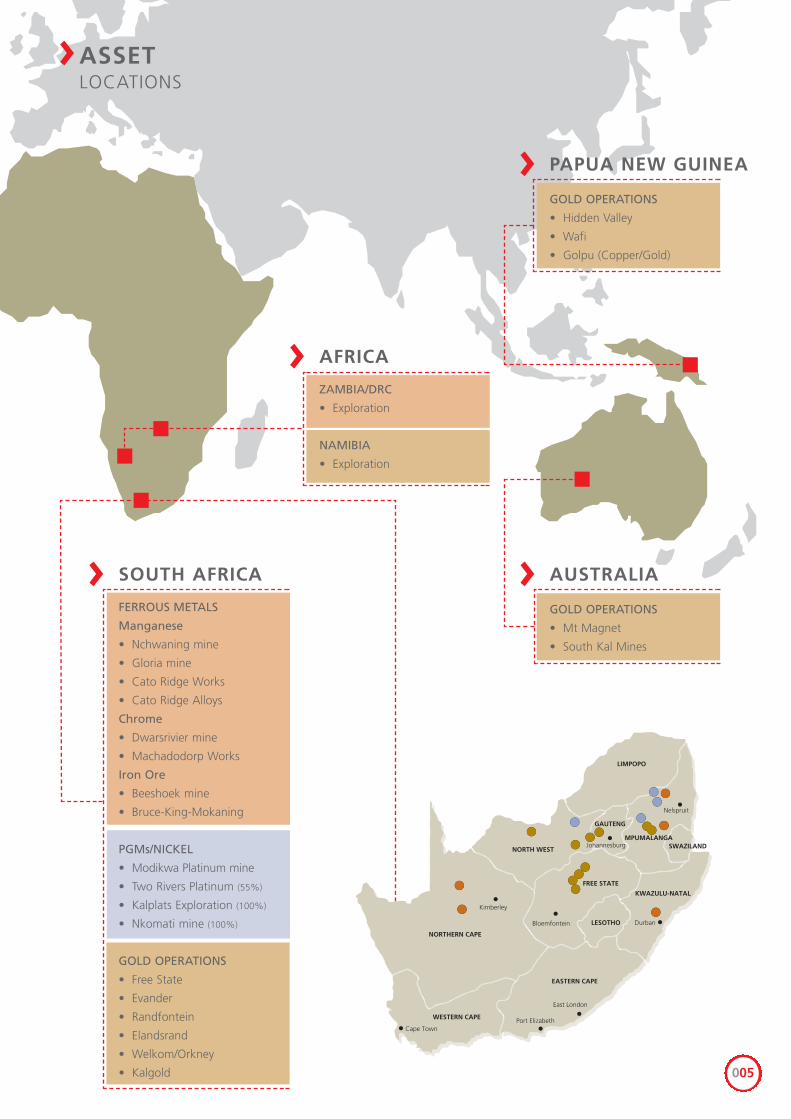
>ASSETLOCATIONS
AFRICA
ZAMBIA/DRC
• Exploration
NAMIBIA
• Exploration
>
SOUTH AFRICA
FERROUS METALS
Manganese
• Nchwaning mine
• Gloria mine
• Cato Ridge Works
• Cato Ridge Alloys
Chrome
• Dwarsrivier mine
• Machadodorp Works
Iron Ore
• Beeshoek mine
• Bruce-King-Mokaning
PGMs/NICKEL
• Modikwa Platinum mine
• Two Rivers Platinum (55%)
• Kalplats Exploration (100%)
• Nkomati mine (100%)
GOLD OPERATIONS
• Free State
• Evander
• Randfontein
• Elandsrand
• Welkom/Orkney
• Kalgold
>
PAPUA NEW GUINEA
GOLD OPERATIONS
• Hidden Valley
• Wafi
• Golpu (Copper/Gold)
>
AUSTRALIA
GOLD OPERATIONS
• Mt Magnet
• South Kal Mines
>
NORTHERN CAPE
Kimberley
Cape TownPort Elizabeth
East London
Bloemfontein Durban
Johannesburg
WESTERN CAPE
EASTERN CAPE
LESOTHO
FREE STATE
GAUTENG
SWAZILAND
KWAZULU-NATAL
NORTH WEST
LIMPOPO
MPUMALANGA
Nelspruit
016
An important aspect of our activities during the past year has been
incorporating Avmin’s best practices into ARM’s “We Do It Better”
management style. Our critical success factors form the basis of allocating
resources to ensure our goals and objectives are achieved. These factors
include: operational excellence; Brownfield expansions; new project (or
Greenfield) expansions; investor attractiveness; and acquisitive growth.
Operationally, this has been a good year for ARM, with Assmang’s mines and
beneficiation plants, and Nkomati mine, producing record production, details
of which are contained in this review. Certain initiatives that are being
implemented will deliver improved results over the coming year, these include:
cost reduction programmes; productivity enhancements; an increase in
manganese production; better utilisation of the iron ore assets; and at least one
project release during the year.
Our overriding commitment to health, safety, environmental responsibility and
community development remains as strong as ever. We also believe that it is a
leading indicator of company performance and we are proud of the progress
that we have made in this area. Our safety record has improved with lost day
injury frequency rates being better than 2003, and most operations have
complied with the stringent ISO accreditation process. It is, however, sad to
report that two fatalities occurred during the year. We extend our condolences
to the bereaved family and friends. More detail on our activities within this
important sector of our business are contained in the Sustainable Development
section of this report.
We would like to take this opportunity to thank our dedicated team: together
we will continue to deliver value to shareholders and realise our vision to
become one of the world's leading diversified mining companies.
More detail with respect to our operating assets follows:
>YEAR IN REVIEWBY CHIEF EXECUTIVE OFFICER
TOGETHER WE
WILL CONTINUE
TO DELIVER
VALUE TO
SHAREHOLDERS
AND REALISE OUR
VISION TO
BECOME ONE OF
THE WORLD'S
LEADING
DIVERSIFIED
MINING
COMPANIES.
017
DR
EA
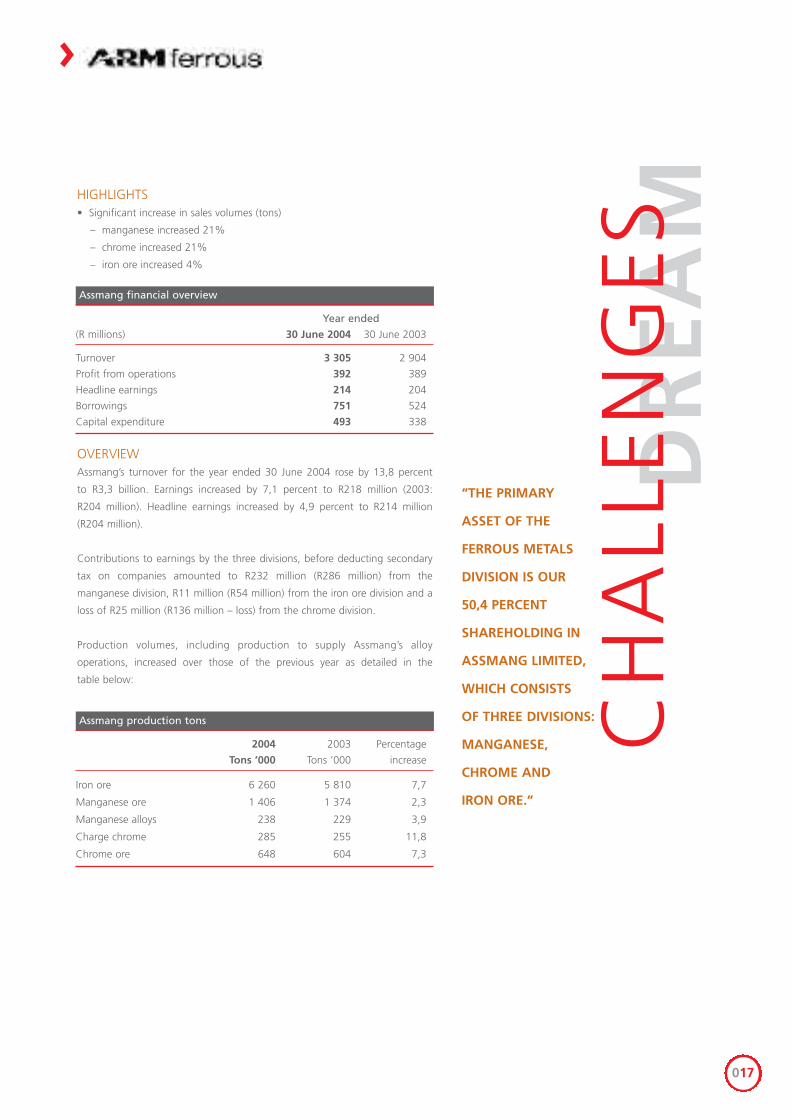
MAssmang production tons
2004 2003 Percentage
Tons ’000 Tons ’000 increase
Iron ore 6 260 5 810 7,7
Manganese ore 1 406 1 374 2,3
Manganese alloys 238 229 3,9
Charge chrome 285 255 11,8
Chrome ore 648 604 7,3
>
HIGHLIGHTS• Significant increase in sales volumes (tons)
– manganese increased 21%
– chrome increased 21%
– iron ore increased 4%
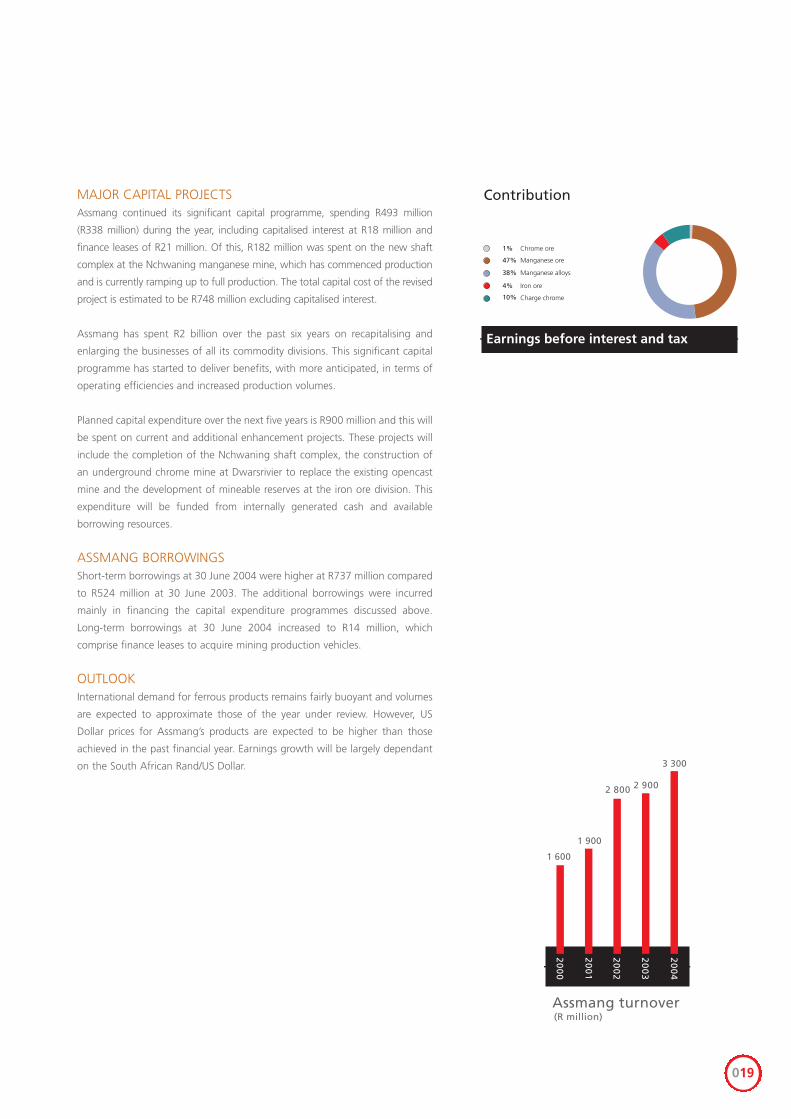
OVERVIEWAssmang’s turnover for the year ended 30 June 2004 rose by 13,8 percent
to R3,3 billion. Earnings increased by 7,1 percent to R218 million (2003:
R204 million). Headline earnings increased by 4,9 percent to R214 million
(R204 million).
Contributions to earnings by the three divisions, before deducting secondary
tax on companies amounted to R232 million (R286 million) from the
manganese division, R11 million (R54 million) from the iron ore division and a
loss of R25 million (R136 million – loss) from the chrome division.
Production volumes, including production to supply Assmang’s alloy
operations, increased over those of the previous year as detailed in the
table below:
Assmang financial overview
Year ended
(R millions) 30 June 2004 30 June 2003
Turnover 3 305 2 904
Profit from operations 392 389
Headline earnings 214 204
Borrowings 751 524
Capital expenditure 493 338
CH
ALL
ENG
ES
“THE PRIMARY
ASSET OF THE
FERROUS METALS
DIVISION IS OUR
50,4 PERCENT
SHAREHOLDING IN
ASSMANG LIMITED,
WHICH CONSISTS
OF THREE DIVISIONS:
MANGANESE,
CHROME AND
IRON ORE.”
018
The South African Rand/US Dollar exchange rate continued to be the key
determinant of Assmang’s performance during the year. The South African Rand
equivalent of total US Dollar revenue showed substantial decreases from that of
the previous year, mainly as a result of the appreciation of the South African
Rand against the US Dollar. An average exchange rate of R6,77 to the US Dollar
was realised on export proceeds, compared with R8,97 for the previous year, but
solid operational performances somewhat countered the adverse effects of the
stronger average South African Rand/US Dollar exchange rate.
SALESWorld crude steel production for the first half of calendar 2004 increased by
7,8 percent to 502,3 million tons and it is estimated that production should
exceed one billion tons by the end of calendar 2004. China continues to be the
main contributor to the record production levels and is producing at a level of
21 percent above the first half of calendar 2003. Consequently, sales volumes
of iron ore for the year under review increased to a record 5,5 million tons
(5,3 million tons). Further increases in sales volumes will be constrained by
limited railage and shipping capacity through the port of Saldanha Bay.
As a result of buoyant markets, US Dollar prices for both iron ore lumpy and
fines have increased on average by 19 percent for the period April 2004 to
March 2005. Despite the increase in global steel production, sales volumes of
manganese ore were higher than last year’s levels at 1,4 million tons
(1,2 million tons). In Japan, US Dollar prices for manganese ore for the period
April 2004 to March 2005 have increased on average by 16 percent.
Assmang is working with Spoornet (the State rail authority) and the
South African Port Operations to increase both iron and manganese ore
logistical capacity.
Sales of manganese alloys increased to 218 000 tons (197 000 tons), in line
with both higher production and a reduction in stock levels at the Cato Ridge
Works. High carbon ferromanganese sales increased to 143 000 tons
(127 000 tons) and sales of refined ferromanganese were slightly higher at
47 000 tons (45 000 tons). Silico-manganese sales also improved to 28 000
tons (25 000 tons) as a result of increased production volumes. Manganese
alloy prices have recently reached unprecedentedly high levels due to strong
demand, the closure of a major French high-carbon ferromanganese producer
and production cutbacks in China, mainly as a result of a shortage of electric
power. It is anticipated that demand will remain robust, but that prices could
ease. However, pressure from high costs of coke, electricity and ocean freight
should ensure that prices do not fall back to previous levels.
Global stainless steel production continued to show positive growth over
the year and total production for calendar 2004 is likely to reach almost
24,0 million tons (22,5 million tons). The stronger South African Rand together
with low ferrochrome stocks worldwide and the same cost factors as
manganese alloys, resulted in US Dollar prices for charge chrome rising by
75 percent over the past year. Sales volumes of charge chrome increased by
over 20 percent to a record 295 000 tons (244 000 tons).
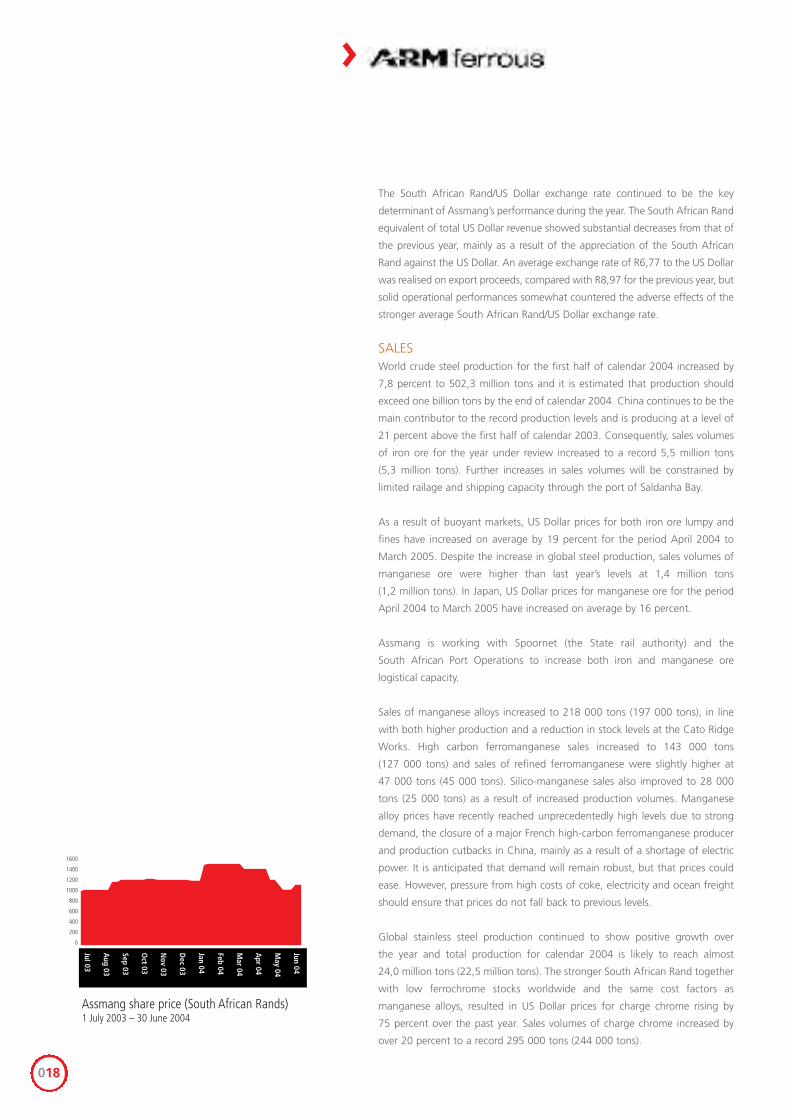
Assmang share price (South African Rands)1 July 2003 – 30 June 2004
0
200
400
600
800
1000
1200
1400
1600
Jul 03
Aug 03
Sep 03
Oct 03
Nov 03
Dec 03
Jan 04
Feb 04
Mar 04
Apr 04
May 04
Jun 04
>
019
Assmang turnover
20
04
20
03
20
02
20
01
20
00
(R million)
1 900
2 800 2 900
3 300
1 600
10% Charge chrome
4% Iron ore
1% Chrome ore
47% Manganese ore
38% Manganese alloys
Earnings before interest and tax
MAJOR CAPITAL PROJECTSAssmang continued its significant capital programme, spending R493 million
(R338 million) during the year, including capitalised interest at R18 million and
finance leases of R21 million. Of this, R182 million was spent on the new shaft
complex at the Nchwaning manganese mine, which has commenced production
and is currently ramping up to full production. The total capital cost of the revised
project is estimated to be R748 million excluding capitalised interest.
Assmang has spent R2 billion over the past six years on recapitalising and
enlarging the businesses of all its commodity divisions. This significant capital
programme has started to deliver benefits, with more anticipated, in terms of
operating efficiencies and increased production volumes.
Planned capital expenditure over the next five years is R900 million and this will
be spent on current and additional enhancement projects. These projects will
include the completion of the Nchwaning shaft complex, the construction of
an underground chrome mine at Dwarsrivier to replace the existing opencast
mine and the development of mineable reserves at the iron ore division. This
expenditure will be funded from internally generated cash and available
borrowing resources.
ASSMANG BORROWINGSShort-term borrowings at 30 June 2004 were higher at R737 million compared
to R524 million at 30 June 2003. The additional borrowings were incurred
mainly in financing the capital expenditure programmes discussed above.
Long-term borrowings at 30 June 2004 increased to R14 million, which
comprise finance leases to acquire mining production vehicles.
OUTLOOKInternational demand for ferrous products remains fairly buoyant and volumes
are expected to approximate those of the year under review. However, US
Dollar prices for Assmang’s products are expected to be higher than those
achieved in the past financial year. Earnings growth will be largely dependant
on the South African Rand/US Dollar.
Contribution
020
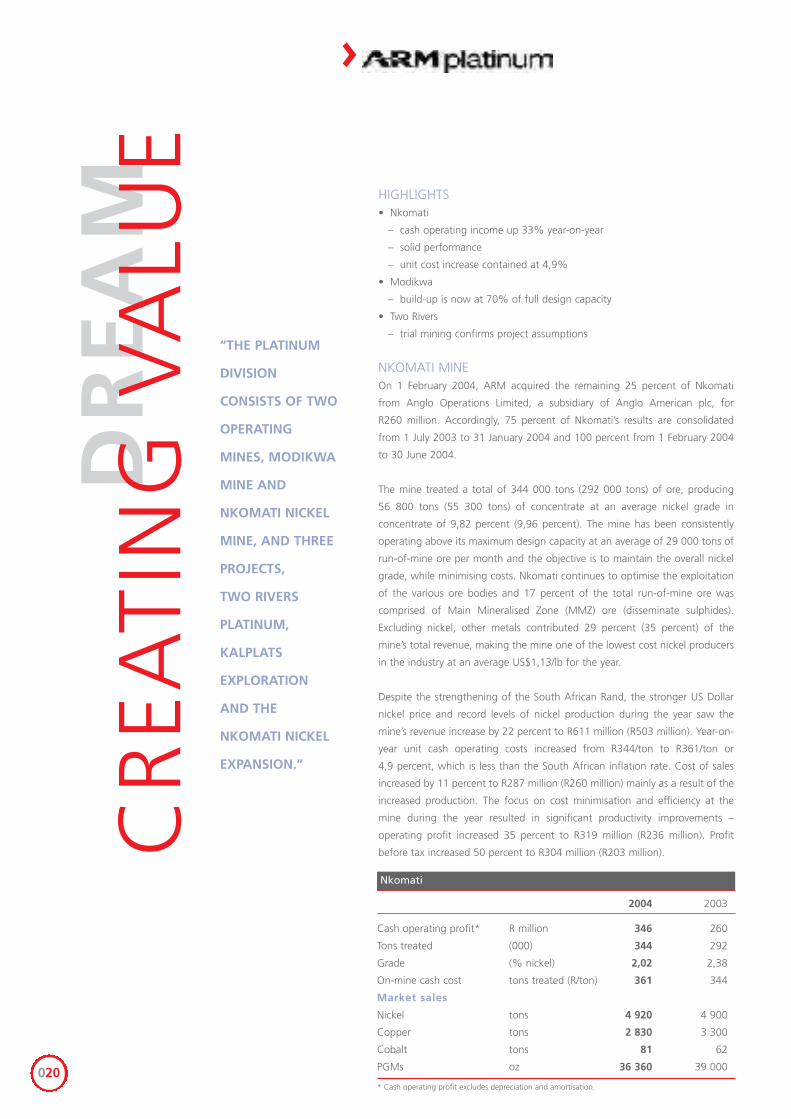
HIGHLIGHTS• Nkomati
– cash operating income up 33% year-on-year
– solid performance
– unit cost increase contained at 4,9%
• Modikwa
– build-up is now at 70% of full design capacity
• Two Rivers
– trial mining confirms project assumptions
NKOMATI MINEOn 1 February 2004, ARM acquired the remaining 25 percent of Nkomati
from Anglo Operations Limited, a subsidiary of Anglo American plc, for
R260 million. Accordingly, 75 percent of Nkomati’s results are consolidated
from 1 July 2003 to 31 January 2004 and 100 percent from 1 February 2004
to 30 June 2004.
The mine treated a total of 344 000 tons (292 000 tons) of ore, producing
56 800 tons (55 300 tons) of concentrate at an average nickel grade in
concentrate of 9,82 percent (9,96 percent). The mine has been consistently
operating above its maximum design capacity at an average of 29 000 tons of
run-of-mine ore per month and the objective is to maintain the overall nickel
grade, while minimising costs. Nkomati continues to optimise the exploitation
of the various ore bodies and 17 percent of the total run-of-mine ore was
comprised of Main Mineralised Zone (MMZ) ore (disseminate sulphides).
Excluding nickel, other metals contributed 29 percent (35 percent) of the
mine’s total revenue, making the mine one of the lowest cost nickel producers
in the industry at an average US$1,13/lb for the year.
Despite the strengthening of the South African Rand, the stronger US Dollar
nickel price and record levels of nickel production during the year saw the
mine’s revenue increase by 22 percent to R611 million (R503 million). Year-on-
year unit cash operating costs increased from R344/ton to R361/ton or
4,9 percent, which is less than the South African inflation rate. Cost of sales
increased by 11 percent to R287 million (R260 million) mainly as a result of the
increased production. The focus on cost minimisation and efficiency at the
mine during the year resulted in significant productivity improvements –
operating profit increased 35 percent to R319 million (R236 million). Profit
before tax increased 50 percent to R304 million (R203 million).
Nkomati
2004 2003
Cash operating profit* R million 346 260
Tons treated (000) 344 292
Grade (% nickel) 2,02 2,38
On-mine cash cost tons treated (R/ton) 361 344
Market sales
Nickel tons 4 920 4 900
Copper tons 2 830 3 300
Cobalt tons 81 62
PGMs oz 36 360 39 000
* Cash operating profit excludes depreciation and amortisation.
>
DR
EA
MC
REA
TIN
G V
ALU
E
“THE PLATINUM
DIVISION
CONSISTS OF TWO
OPERATING
MINES, MODIKWA
MINE AND
NKOMATI NICKEL
MINE, AND THREE
PROJECTS,
TWO RIVERS
PLATINUM,
KALPLATS
EXPLORATION
AND THE
NKOMATI NICKEL
EXPANSION.”
021
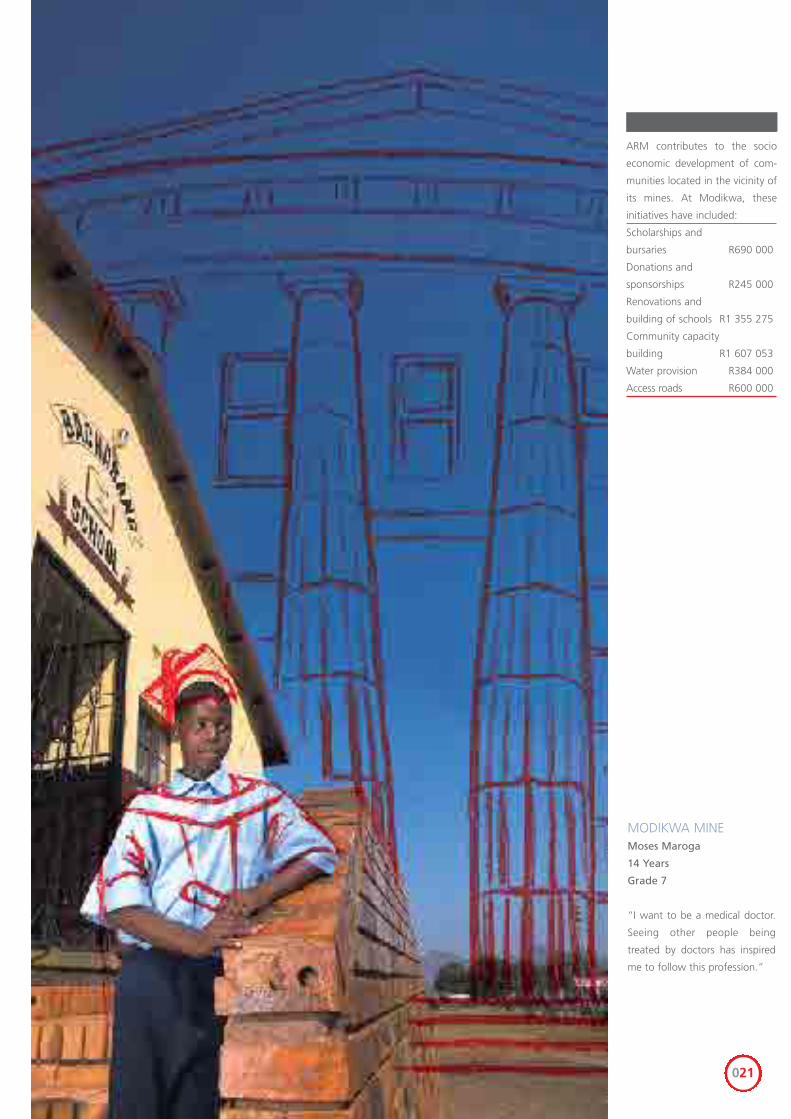
MODIKWA MINEMoses Maroga
14 Years
Grade 7
“I want to be a medical doctor.
Seeing other people being
treated by doctors has inspired
me to follow this profession.”
ARM contributes to the socio
economic development of com-
munities located in the vicinity of
its mines. At Modikwa, these
initiatives have included:
Scholarships and
bursaries R690 000
Donations and
sponsorships R245 000
Renovations and
building of schools R1 355 275
Community capacity
building R1 607 053
Water provision R384 000
Access roads R600 000
022
>
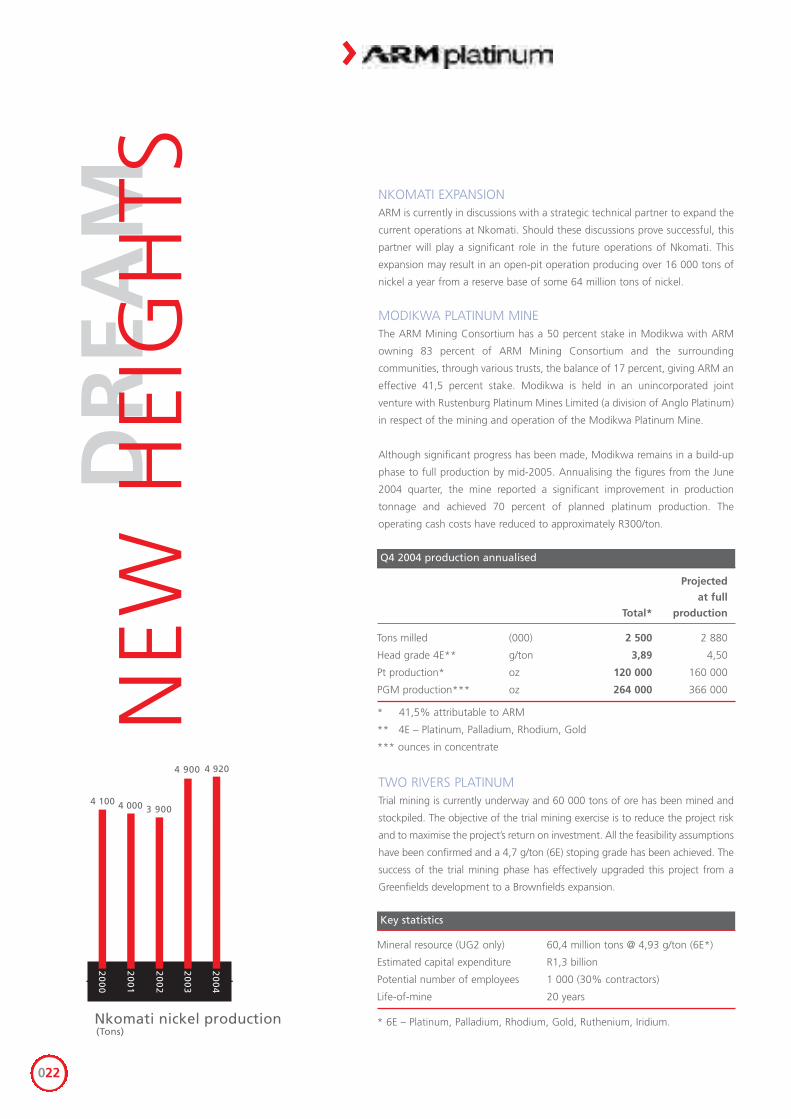
NKOMATI EXPANSIONARM is currently in discussions with a strategic technical partner to expand the
current operations at Nkomati. Should these discussions prove successful, this
partner will play a significant role in the future operations of Nkomati. This
expansion may result in an open-pit operation producing over 16 000 tons of
nickel a year from a reserve base of some 64 million tons of nickel.
MODIKWA PLATINUM MINEThe ARM Mining Consortium has a 50 percent stake in Modikwa with ARM
owning 83 percent of ARM Mining Consortium and the surrounding
communities, through various trusts, the balance of 17 percent, giving ARM an
effective 41,5 percent stake. Modikwa is held in an unincorporated joint
venture with Rustenburg Platinum Mines Limited (a division of Anglo Platinum)
in respect of the mining and operation of the Modikwa Platinum Mine.
Although significant progress has been made, Modikwa remains in a build-up
phase to full production by mid-2005. Annualising the figures from the June
2004 quarter, the mine reported a significant improvement in production
tonnage and achieved 70 percent of planned platinum production. The
operating cash costs have reduced to approximately R300/ton.
TWO RIVERS PLATINUMTrial mining is currently underway and 60 000 tons of ore has been mined and
stockpiled. The objective of the trial mining exercise is to reduce the project risk
and to maximise the project’s return on investment. All the feasibility assumptions
have been confirmed and a 4,7 g/ton (6E) stoping grade has been achieved. The
success of the trial mining phase has effectively upgraded this project from a
Greenfields development to a Brownfields expansion.
Q4 2004 production annualised
Projected
at full
Total* production
Tons milled (000) 2 500 2 880
Head grade 4E** g/ton 3,89 4,50
Pt production* oz 120 000 160 000
PGM production*** oz 264 000 366 000
* 41,5% attributable to ARM
** 4E – Platinum, Palladium, Rhodium, Gold
*** ounces in concentrate
Key statistics
Mineral resource (UG2 only) 60,4 million tons @ 4,93 g/ton (6E*)
Estimated capital expenditure R1,3 billion
Potential number of employees 1 000 (30% contractors)
Life-of-mine 20 years
* 6E – Platinum, Palladium, Rhodium, Gold, Ruthenium, Iridium.
DR
EA
MN
EW H
EIG
HTS
Nkomati nickel production
20
04
20
03
20
02
20
01
20
00
(Tons)
4 000 3 900
4 900 4 920
4 100
023
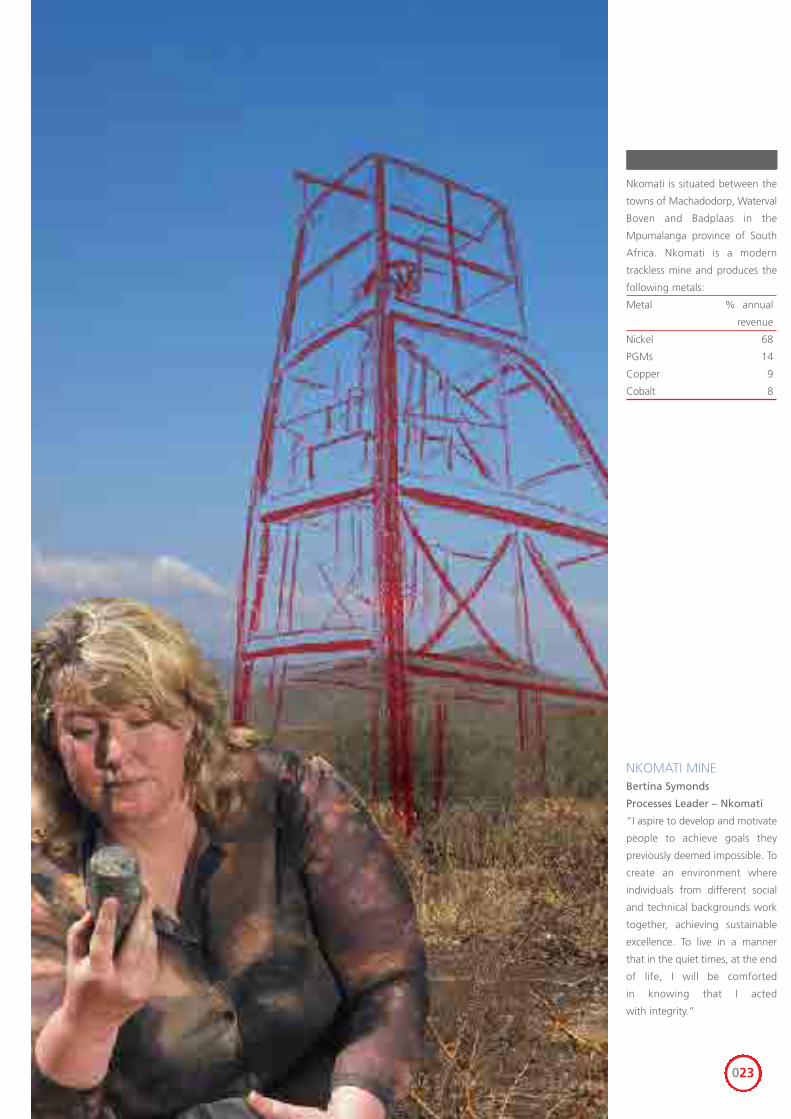
NKOMATI MINEBertina Symonds
Processes Leader – Nkomati
“I aspire to develop and motivate
people to achieve goals they
previously deemed impossible. To
create an environment where
individuals from different social
and technical backgrounds work
together, achieving sustainable
excellence. To live in a manner
that in the quiet times, at the end
of life, I will be comforted
in knowing that I acted
with integrity.”
Nkomati is situated between the
towns of Machadodorp, Waterval
Boven and Badplaas in the
Mpumalanga province of South
Africa. Nkomati is a modern
trackless mine and produces the
following metals:
Metal % annual
revenue
Nickel 68
PGMs 14
Copper 9
Cobalt 8
KALPLATS PGM PROJECTARM and Platinum Australia Limited have signed a Memorandum of
Understanding to participate as joint venture partners to determine through
further exploration and feasibility studies whether or not the application of the
Panton Process, a patented PGM recovery process, can enhance the recovery
of PGMs at the Kalplats PGM Project.
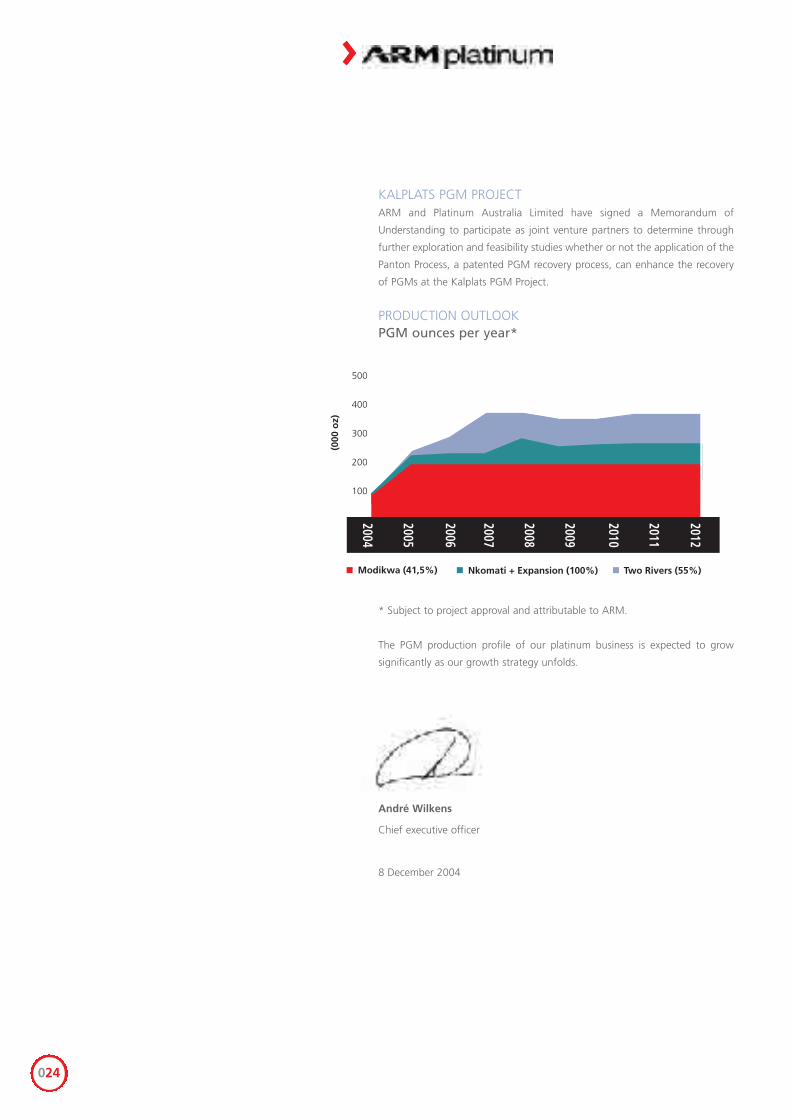
PRODUCTION OUTLOOKPGM ounces per year*
* Subject to project approval and attributable to ARM.
The PGM production profile of our platinum business is expected to grow
significantly as our growth strategy unfolds.
André Wilkens
Chief executive officer
8 December 2004
100
200
300
400
500
Modikwa (41,5%) Nkomati + Expansion (100%) Two Rivers (55%)
2004
2005
2006
2007
2008
2009
2010
2011
2012
(000
oz)
024
>
025
“ARM’S
GOLD ASSET
COMPRISES A
19,8 PERCENT STAKE
IN HARMONY GOLD
MINING COMPANY
LIMITED.”
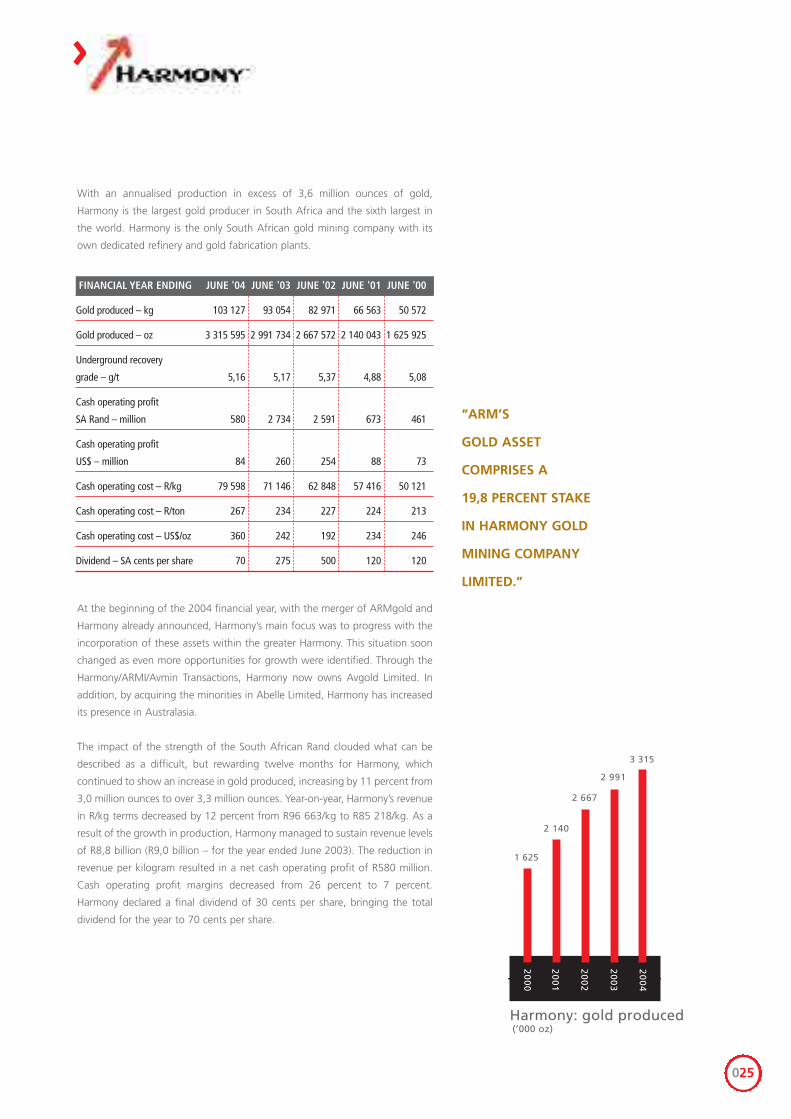
With an annualised production in excess of 3,6 million ounces of gold,
Harmony is the largest gold producer in South Africa and the sixth largest in
the world. Harmony is the only South African gold mining company with its
own dedicated refinery and gold fabrication plants.
At the beginning of the 2004 financial year, with the merger of ARMgold and
Harmony already announced, Harmony’s main focus was to progress with the
incorporation of these assets within the greater Harmony. This situation soon
changed as even more opportunities for growth were identified. Through the
Harmony/ARMI/Avmin Transactions, Harmony now owns Avgold Limited. In
addition, by acquiring the minorities in Abelle Limited, Harmony has increased
its presence in Australasia.
The impact of the strength of the South African Rand clouded what can be
described as a difficult, but rewarding twelve months for Harmony, which
continued to show an increase in gold produced, increasing by 11 percent from
3,0 million ounces to over 3,3 million ounces. Year-on-year, Harmony’s revenue
in R/kg terms decreased by 12 percent from R96 663/kg to R85 218/kg. As a
result of the growth in production, Harmony managed to sustain revenue levels
of R8,8 billion (R9,0 billion – for the year ended June 2003). The reduction in
revenue per kilogram resulted in a net cash operating profit of R580 million.
Cash operating profit margins decreased from 26 percent to 7 percent.
Harmony declared a final dividend of 30 cents per share, bringing the total
dividend for the year to 70 cents per share.
>
Harmony: gold produced
1 625
2 140
3 315
20
03
20
02
20
01
20
00
20
04
2 991
2 667
(’000 oz)
FINANCIAL YEAR ENDING JUNE '04 JUNE '03 JUNE '02 JUNE '01 JUNE '00
Gold produced – kg 103 127 93 054 82 971 66 563 50 572
Gold produced – oz 3 315 595 2 991 734 2 667 572 2 140 043 1 625 925
Underground recovery
grade – g/t 5,16 5,17 5,37 4,88 5,08
Cash operating profit
SA Rand – million 580 2 734 2 591 673 461
Cash operating profit
US$ – million 84 260 254 88 73
Cash operating cost – R/kg 79 598 71 146 62 848 57 416 50 121
Cash operating cost – R/ton 267 234 227 224 213
Cash operating cost – US$/oz 360 242 192 234 246
Dividend – SA cents per share 70 275 500 120 120
026
>MINERAL RESOURCES AND RESERVES
COMPETENT PERSON REPORT ON MINERAL RESOURCES ANDMINERAL RESERVES General statement
ARM’s method in reporting of mineral resources and mineral reserves conforms
to the South African Code for Reporting Mineral Resources and Mineral
Reserves (SAMREC Code) and the Australian Institute of Mining and Metallurgy
Joint Ore Reserves Committee Code (JORC Code).
The convention adopted in this report is that mineral resources are reported
inclusive of that portion of the total mineral resource converted to a mineral
reserve. Previously the mineral resources were reported exclusive of the
resources converted to mineral reserves. The changed reporting style has been
adopted for convenience in order to be in line with ARM reporting
requirements for other foreign stock exchanges. This change contributes to
increasing the mineral resource tonnage of some deposits listed in this report.
Underground resources are in-situ tonnages at the postulated mining width,
after deductions for geological losses. Resources from dumps are estimated as
in-situ tonnages.
Underground mineral reserves reflect milled tonnages, while surface (dumps)
mineral reserves are in-situ tonnages without dilution. Both are quoted at the
grade reporting to the mill.
The evaluation method is generally ordinary kriging with mining block sizes
ranging from 10*10 m2 to 100*100 m2 to 250*250 m2 in the 2-D plain. The
blocks vary in thickness from 2,5 m to 50 m. Inverse distance is used in a few
instances and with similar block sizes. The Sichel-t and log-mean estimation
methods are occasionally used for global estimation of resources, so is the
weighted polygonal method. The evaluation process is fully computerised and
generally decentralised. The software package utilised is mostly Datamine with
the resource/reserve volumes being wireframed.
The mineral resources and mineral reserves are reported on a total basis
regardless of the attributable beneficial interest that ARM has on the individual
projects or mines. When the attributable beneficial interest on a mine
or project is less than 100 percent the actual percentage of the attributable
interest is specified.
The attributable beneficial interest of ARM in Assmang is 50,4 percent.
The mineral reserves of the iron ore assets (Beeshoek/Bruce-King-
Mokaning) decreased during 2004 by 4,7 Mt or 1 percent to 482,3 Mt
(487 Mt) and the mineral resources increased by 726,6 Mt or 149 percent
to 1 214,7 Mt (488,1 Mt). These variations result from depletion due to
production, adjustments of ore body definitions in the Beeshoek-Olynfontein
property and on the Bruce-King-Mokaning deposit which were brought about
by extensive drilling, geological reinterpretation and the changed reporting
DR
EA
MQ
UA
LITY
027
style whereby the resources now include those resources converted to reserves,
as mentioned above. Mineralisation at 60 percent iron ore and below is
considered contaminated ore and is discarded from the resource/reserve base.
The entire measured mineral resource has been converted to proven mineral
reserve, while about 40 percent of the indicated mineral resources have been
converted to probable mineral reserves.
Manganese operations (Nchwaning and Gloria). The mineral reserves
increased by 119,4 Mt to 131 Mt (11,6 Mt). The reasons for this are:
the re-evaluation of the mineral reserves undertaken in 2004; the conversion
to reserves of all the measured and indicated mineral resources of the No 1 ore
bodies (last year only the measured resources of these ore bodies were
converted to reserves); and the conversion of the graben area resources into
reserves for the first time this year. The mineral resources increased by 475,8 Mt
or 300 percent to 631,3 Mt (155,5 Mt). The latter is due primarily to the re-
evaluation of resources undertaken during 2004; the geological
reinterpretation in both Nchwaning and Gloria; and the changed reporting
style. All the measured and indicated mineral resources of the No 1 ore body
in both Nchwaning and Gloria were converted to proven mineral reserves and
probable mineral reserves, respectively. The mineral resources of the No 2 ore
body were not converted to mineral reserves and account for approximately
40 percent of the total mineral resources of Nchwaning and Gloria shown in
this report. The mineral resources and reserves are reported at current contract
grades or at guaranteed minimum grades, whichever is relevant.
Chromite operations (Dwarsrivier). When compared to last year, the mineral
reserves increased by 1,2 Mt or 4,6 percent to 27,1 Mt (25,9 Mt) and the
mineral resources increased by 16,8 Mt or 24 percent to 86,6Mt (69,8 Mt). The
reason for the change in mineral reserves is the routine conversion of certain
measured and indicated mineral resources to mineral reserves to compensate
for the loss of production. The changed reporting style is the main cause for
the increase in mineral resources.
The mineral reserves of the Nkomati Mine increased by 50 000 tons or 4,5 percent
during the year to 1,15 Mt (1,1 Mt) due to the allocation of 293 000 tons of
probable reserves to the mine reserves from the adjoining Expansion Project. The
mineral resources of the mine now total 1,9 Mt compared with nil last year.
In the Nkomati Expansion Project, the indicated mineral resources in the
planned open pit area and in the planned main phase of underground mining
were converted to probable mineral reserves (last year no probable mineral
reserves were reported). The increase of 21,3 Mt or 17,5 percent to 143 Mt
(121,7 Mt) in total mineral resources is due to the changed reporting style and
the mining blocks of MMZ having been remodelled on a grade cut-off of
0,30% nickel as against 0,35% nickel last year.
The Two Rivers Platinum Project (Two Rivers) is located within the southern
sector of the eastern limb of the Bushveld complex, on the farm Dwarsrivier
372KT. The UG2 and Merensky Reefs are present on the property.
028
The mineral reserves increased by 4,5 Mt or 11,2 percent to 44,8 Mt (40,3 Mt),
when compared to last year. Over the same period the mineral resources
increased by 4,8 Mt or 4,3 percent to 116,8 Mt (112 Mt). The reasons for the
changes are further exploratory drilling, geological reinterpretation and new
ore body definition in places. All the measured resources were converted to
mineral reserves. Of the indicated mineral resources, 59 Mt have been
converted to reserves, while 46,3 Mt grading 3,94 g/t (3PGE+Au) have not
been converted.
The mineral resources and reserves of the UG2 are based on 218 surface
diamond holes drilled at an average grid spacing of 500 m over the whole
property and 250 m grid spacing over the area planned for the first five years
of mining. The drill-hole spacing in the area of the open pit is 50 m on dip and
100 m on strike. The mineral resource of the Merensky Reef is based on a total
of 81 surface diamond drill holes. A discount factor of 30 percent to the
underground resource tonnage and 10 percent to the open pit resource
tonnage has been applied to both the UG2 and Merensky Reefs in order to
account for losses due to potholes, faults, dykes and replacement pegmatoids.
The resource to reserve conversion was done using the Mine 2-4D optimisation
software package to select the optimum economic cut subject to the
geotechnical and trackless mining constraints. Unplanned and off-reef dilution,
followed by a 95 percent mine call factor, has been applied to the output
from the optimiser to provide the fully diluted mill head grade of the reserves.
The attributable beneficial interest of ARM in Two Rivers Platinum is
55 percent.
The Modikwa Platinum Mine exploits the UG2 Reef, which has an average
width of 60 cm and occurs as a chromitite layer. Although the Merensky Reef
is developed, all mineral resources delineated to date comprise the UG2 only.
The UG2 mining cut is divided into three units comprising the UG2 chromitite
layer, the hanging wall and the footwall. Estimation of the three sub-units in
the mining cut is carried out separately and independently. Discount factors are
applied to tonnages ranging from 10 percent (for measured mineral resources)
up to 30 percent to account for loss of ore due to pegmatoid intrusions, faults,
dykes and potholes.
All the measured mineral resources have been converted into mineral reserves.
Of the indicated mineral resources, 13,7 Mt grading 5,42 g/t (3PGE+Au) have
been converted to mineral reserves, while the remaining 80,4 Mt grading
5,36g/t (3PGE+Au) have not been converted.
The attributable beneficial interest of ARM in Modikwa is 41,5 percent.
The Kalplats Project is located in the Kraaipan greenstone belt with the PGE
mineralisation hosted within the Stella layered intrusion. Three sub-parallel reef
packages have been recognised and evaluated. They are the Main Reef (the
highest grade reef), Mid Reef and LG Reef. A 15 percent metal discount was
applied to all resource blocks to account for barren dykes, which are modelled
within the ore blocks and would have to be mined as ore, but contain no grade.
>MINERAL RESOURCES AND RESERVES
029
EXPLORATIONThe Otjikoto Project is a gold exploration property situated in Namibia and
occurs within the northern zone of the Damara Orogen. It is hosted within a
package of marbles, albitites and biotite schists of the Karibib Formation. The
resource is based on RC drill holes and diamond drill holes totalling in excess
of 100. A cut-off grade of 0,5g/Aut was applied in defining the resource. A
feasibility study is currently underway.
The Konkola North Project is situated on the Zambian Copperbelt with the
economic mineralisation being confined to the dark-grey siltstone within the
Ore Shale 1 Member of the Nchanga Formation. A total of 125 diamond holes
were drilled in a number of exploration phases. The ore body was divided into
two zones for estimation purposes: East Limb and South Limb. The 3-D
wireframes were defined by using a 1 percent total copper cut-off.
The Mwambashi Project lies on the Zambian Copperbelt on the western
edge of the Chambishi Basin. A total of 32 RC and seven diamond holes were
drilled in the property. The resource is quoted at a 1 percent total copper cut-
off on a block by block basis.
Competence
The competent person with overall responsibility for the compilation of
the mineral reserves and resources is Mr PJ van der Merwe, Pr.Sci.Nat.
Maps, plans and reports supporting resources and reserves are available for
inspection at ARM’s registered office and at the relevant mines.
030
DEFINITIONSThe definitions of resources and reserves, quoted from the
SAMREC CODE, are as follows:
A ’mineral resource’ is a concentration [or occurrence] of material of economic
interest in or on the Earth’s crust in such form, quality or quantity that there are
reasonable prospects for eventual economic extraction. The location, quantity,
grade, continuity and other geological characteristics of a mineral resource are
known, estimated from specific geological evidence and knowledge, or
interpreted from a well constrained and portrayed geological model. Mineral
resources are sub-divided, in order of increasing confidence in respect of
geoscientific evidence, into inferred, indicated and measured categories.
An ’inferred mineral resource’ is that part of a mineral resource for which
tonnage, grade and mineral content can be estimated with a low level of
confidence. It is inferred from geological evidence and assumed but not verified
geological and/or grade continuity. It is based on information gathered through
appropriate techniques from locations such as outcrops, trenches, pits,
workings and drill holes that may be limited or of uncertain quality and reliability.
An ’indicated mineral resource’ is that part of a mineral resource for which
tonnage, densities, shape, physical characteristics, grade and mineral content
can be estimated with a reasonable level of confidence. It is based on
exploration, sampling and testing information gathered through appropriate
techniques from locations such as outcrops, trenches, pits, workings and drill
holes. The locations are too widely or inappropriately spaced to confirm
geological and/or grade continuity but are spaced closely enough for continuity
to be assumed.
A ’measured mineral resource’ is that part of a mineral resource for which
tonnage, densities, shape, physical characteristics, grade and mineral content
can be estimated with a high level of confidence. It is based on detailed and
reliable exploration, sampling and testing information gathered through
appropriate techniques from locations such as outcrops, trenches, pits,
workings and drill holes. The locations are spaced closely enough to confirm
geological and grade continuity.
A ’mineral reserve’ is the economically mineable material derived from a
measured and/or indicated mineral resource. It is inclusive of diluting materials and
allows for losses that may occur when the material is mined. Appropriate
assessments, which may include feasibility studies, have been carried out,
including consideration of, and modification by, realistically assumed mining,
metallurgical, economic, marketing, legal, environmental, social and govern-
mental factors. These assessments demonstrate at the time of reporting that
extraction is reasonably justified. Mineral reserves are sub-divided in order of
increasing confidence into probable mineral reserves and proved mineral reserves.
>MINERAL RESOURCES AND RESERVES
A ’probable mineral reserve’ is the economically mineable material derived
from a measured and/or indicated mineral resource. It is estimated with a lower
level of confidence than a proved mineral resource. It is inclusive of diluting
materials and allows for losses that may occur when the material is mined.
Appropriate assessments, which may include feasibility studies, have been
carried out, including consideration of, and modification by, realistically
assumed mining, metallurgical, economic, marketing, legal, environmental,
social and governmental factors. These assessments demonstrate at the time
of reporting that extraction is reasonably justified.
A ’proved mineral reserve’ is the economically mineable material derived from
a measured mineral resource. It is estimated with a high level of confidence. It is
inclusive of diluting materials and allows for losses that may occur when the
material is mined. Appropriate assessments, which may include feasibility studies,
have been carried out, including consideration of, and modification by,
realistically assumed mining, metallurgical, economic, marketing, legal,
environmental, social and governmental factors. These assessments demonstrate
at the time of reporting that extraction is reasonably justified.
August 2004
031
032
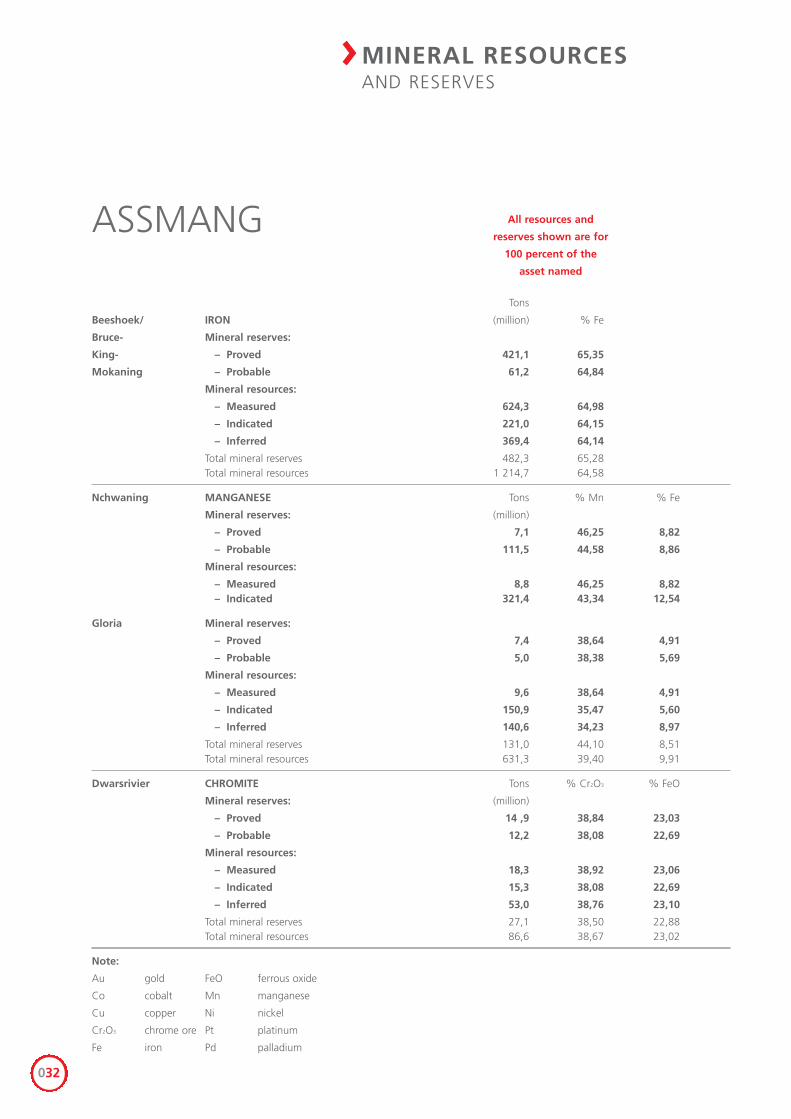
Tons
Beeshoek/ IRON (million) % Fe
Bruce- Mineral reserves:
King- – Proved 421,1 65,35
Mokaning – Probable 61,2 64,84
Mineral resources:
– Measured 624,3 64,98
– Indicated 221,0 64,15
– Inferred 369,4 64,14
Total mineral reserves 482,3 65,28Total mineral resources 1 214,7 64,58
Nchwaning MANGANESE Tons % Mn % Fe
Mineral reserves: (million)
– Proved 7,1 46,25 8,82
– Probable 111,5 44,58 8,86
Mineral resources:
– Measured 8,8 46,25 8,82– Indicated 321,4 43,34 12,54
Gloria Mineral reserves:
– Proved 7,4 38,64 4,91
– Probable 5,0 38,38 5,69
Mineral resources:
– Measured 9,6 38,64 4,91
– Indicated 150,9 35,47 5,60
– Inferred 140,6 34,23 8,97
Total mineral reserves 131,0 44,10 8,51Total mineral resources 631,3 39,40 9,91
Dwarsrivier CHROMITE Tons % Cr2O3 % FeO
Mineral reserves: (million)
– Proved 14 ,9 38,84 23,03
– Probable 12,2 38,08 22,69
Mineral resources:
– Measured 18,3 38,92 23,06
– Indicated 15,3 38,08 22,69
– Inferred 53,0 38,76 23,10
Total mineral reserves 27,1 38,50 22,88Total mineral resources 86,6 38,67 23,02
Note:
Au gold FeO ferrous oxide
Co cobalt Mn manganese
Cu copper Ni nickel
Cr2O3 chrome ore Pt platinum
Fe iron Pd palladium
ASSMANG All resources and
reserves shown are for
100 percent of the
asset named
MINERAL RESOURCES AND RESERVES
>
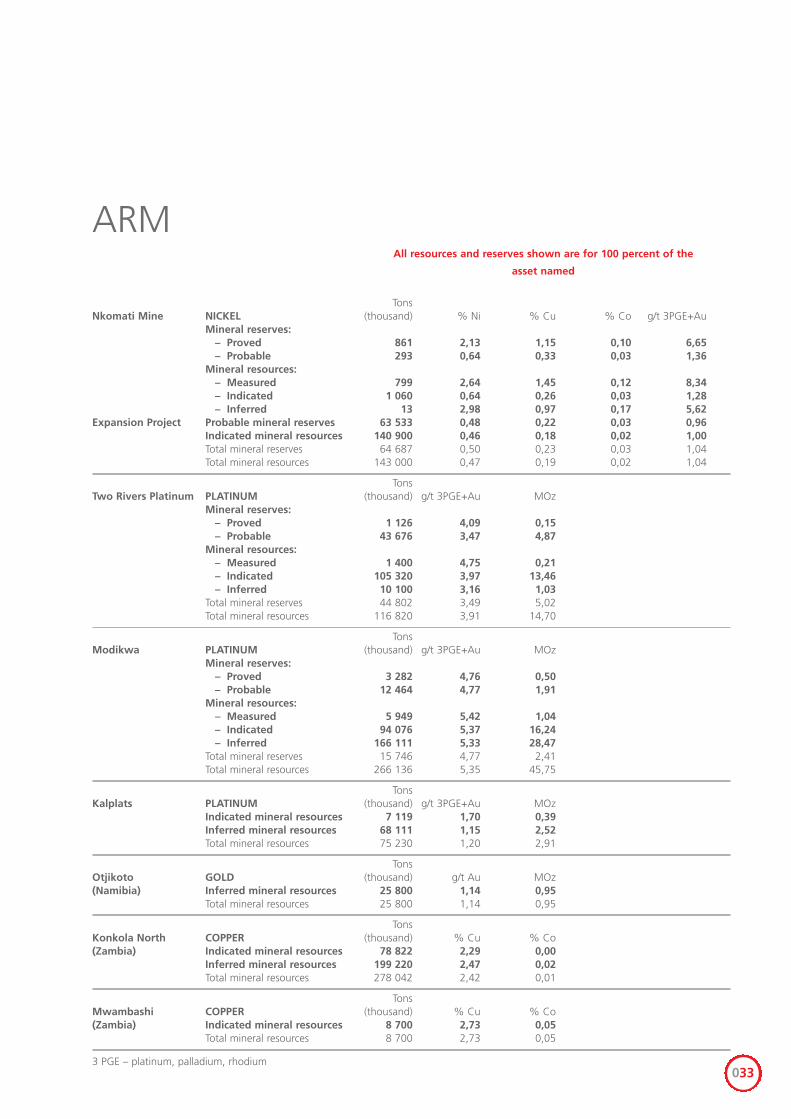
TonsNkomati Mine NICKEL (thousand) % Ni % Cu % Co g/t 3PGE+Au
Mineral reserves:– Proved 861 2,13 1,15 0,10 6,65– Probable 293 0,64 0,33 0,03 1,36
Mineral resources:– Measured 799 2,64 1,45 0,12 8,34– Indicated 1 060 0,64 0,26 0,03 1,28– Inferred 13 2,98 0,97 0,17 5,62
Expansion Project Probable mineral reserves 63 533 0,48 0,22 0,03 0,96Indicated mineral resources 140 900 0,46 0,18 0,02 1,00Total mineral reserves 64 687 0,50 0,23 0,03 1,04Total mineral resources 143 000 0,47 0,19 0,02 1,04
TonsTwo Rivers Platinum PLATINUM (thousand) g/t 3PGE+Au MOz
Mineral reserves:– Proved 1 126 4,09 0,15– Probable 43 676 3,47 4,87
Mineral resources:– Measured 1 400 4,75 0,21– Indicated 105 320 3,97 13,46– Inferred 10 100 3,16 1,03
Total mineral reserves 44 802 3,49 5,02Total mineral resources 116 820 3,91 14,70
TonsModikwa PLATINUM (thousand) g/t 3PGE+Au MOz
Mineral reserves:– Proved 3 282 4,76 0,50– Probable 12 464 4,77 1,91
Mineral resources:– Measured 5 949 5,42 1,04– Indicated 94 076 5,37 16,24– Inferred 166 111 5,33 28,47
Total mineral reserves 15 746 4,77 2,41Total mineral resources 266 136 5,35 45,75
TonsKalplats PLATINUM (thousand) g/t 3PGE+Au MOz
Indicated mineral resources 7 119 1,70 0,39Inferred mineral resources 68 111 1,15 2,52Total mineral resources 75 230 1,20 2,91
TonsOtjikoto GOLD (thousand) g/t Au MOz(Namibia) Inferred mineral resources 25 800 1,14 0,95
Total mineral resources 25 800 1,14 0,95
TonsKonkola North COPPER (thousand) % Cu % Co(Zambia) Indicated mineral resources 78 822 2,29 0,00
Inferred mineral resources 199 220 2,47 0,02Total mineral resources 278 042 2,42 0,01
TonsMwambashi COPPER (thousand) % Cu % Co(Zambia) Indicated mineral resources 8 700 2,73 0,05
Total mineral resources 8 700 2,73 0,05
3 PGE – platinum, palladium, rhodium033
ARMAll resources and reserves shown are for 100 percent of the
asset named
035
CORPORATE GOVERNANCE ARM, through the activities of its audit committee and the Group’s overall risk
management initiatives, endeavours to identify and manage risks and meet the
criteria of the King Report on Corporate Governance for South Africa 2002. For
further details refer to the corporate governance report on page 36.
CURRENCY AND COMMODITY PRICE RISKS ARM’s revenues are sensitive to currency fluctuations and commodity prices
because all of ARM’s revenues are generated using metal prices denominated
in US Dollars, while most of the costs are incurred in South African Rands.
Depreciation of the South African Rand against the US Dollar increases ARM’s
revenue when translated into South African Rand, thereby increasing the
operating margin. Conversely, appreciation of the South African Rand against
the US Dollar decreases revenues when translated into South African Rand.
Accordingly, the effect on profitability of any change in the value of the South
African Rand against the US Dollar can be substantial.
ARM has not actively hedged future exchange rates and commodity prices for
the products that it produces against price fluctuations.
HIV/AIDS RISK The prevalence of HIV/AIDS among our employees poses risks to ARM by
potentially reducing productivity and increasing medical and other costs.
ENVIRONMENTAL REGULATIONS The Mine Health and Safety Act 1996 imposes various duties on mines and
grants the authorities broad power to, among other things, close unsafe mines
and order corrective action relating to health and safety matters. ARM is well
placed to manage proactively the risks in this regard through its sustainable
development policy.
DR
EA
M
036
CORPORATEGOVERNANCE
>
GOVERNANCE
The directors of African Rainbow Minerals Limited are ultimately
accountable to shareholders and have a responsibility, both collectively and
individually, to ensure that a high standard of corporate governance is
maintained.
The Group has strong commitments to a wide range of corporate
governance practices including the maintenance of standards of integrity,
accountability and openness advocated in the King Report on Corporate
Governance for South Africa 2002 (King II Report) as a minimum. The
board of directors believes that in all material matters they have complied
with the stipulated requirements of King II. A number of minor exceptions
are recorded under the relevant committees.
Board of directors
The Company has a unitary board of 14 directors. The board has four
executive members, which includes the chairman, the chief executive
officer and financial director plus two non-executive directors and eight
independent non-executive directors. The name, experience and expertise
of each director are detailed on pages 38 to 39.
Seven board meetings were held during the year ended 30 June 2004, plus
one briefing. The board has adopted a charter and a code of ethics. The
board charter governs the conduct of the board in relation to strategic
planning and performance, capital funding and financial matters,
operational matters, legislation compliance, appointment and removal of
directors and matters pertaining to board committees, and succession
planning. Further, the board has expressly included in its charter and for its
various committees regular reviews thus ensuring their continued
relevance. Corporate governance is consistently applied and promoted
throughout the Group by these means.
The Company’s articles of association stipulate that the maximum term of
office for directors is three years. One-third of directors retire by rotation
annually and, if eligible for re-election, their names are submitted for re-
election at the annual general meeting. All directors who were appointed
EXC
ELLE
NC
E
037
subsequent to the last annual general meeting can seek election at the
following annual general meeting. All directors have completed, signed and
have submitted to the JSE Securities Exchange, South Africa the section 21
declaration as to qualifications, experience and integrity.
Mr DN Murray’s consulting contract with the Company was terminated
subsequent to his resignation as a director on 30 April 2004. There are no other
consulting contracts with board members.
All directors are entitled to seek independent professional advice about the
affairs of the Company and at its expense. Members have access to the advice
of the Group company secretary.
The directors’ fees and meeting attendance fees payable to the chairman and
directors were increased at the annual general meeting held on 11 November
2003. It is proposed that these fees be increased at the forthcoming
annual general meeting. The proposals equate to an average increase of
ten percent. The objective is to pay directors competitive fees thereby attracting
and retaining persons of the appropriate calibre to the board. Full details are to
be found in the notice of annual general meeting insert.
Details relating to the board’s various committees are reflected below.
BOARD COMMITTEES
The board appoints executive and non-executive directors as members to the
various committees. The delegation of authority to committees does not
mitigate the board’s responsibility for the discharge of its and the directors’
duties to the Company’s stakeholders. Other than the nomination committee
all committees are chaired by a non-executive director, the majority of whom
are independent non-executive directors. Independent non-executive directors
form the backbone of the committee system.
Following the approval of the Avmin Transaction (refer to Directors’ Report on
page 60) it was decided to review the membership and purpose of the various
board committees as well as their respective charters. The latter process has not
yet been completed. The outcome of this process resulted in the dissolution of
the risk committee, the redefinition of the role of the sustainable development
committee and the establishment of two new committees for empowerment
and investment.
038
>CORPORATEGOVERNANCE
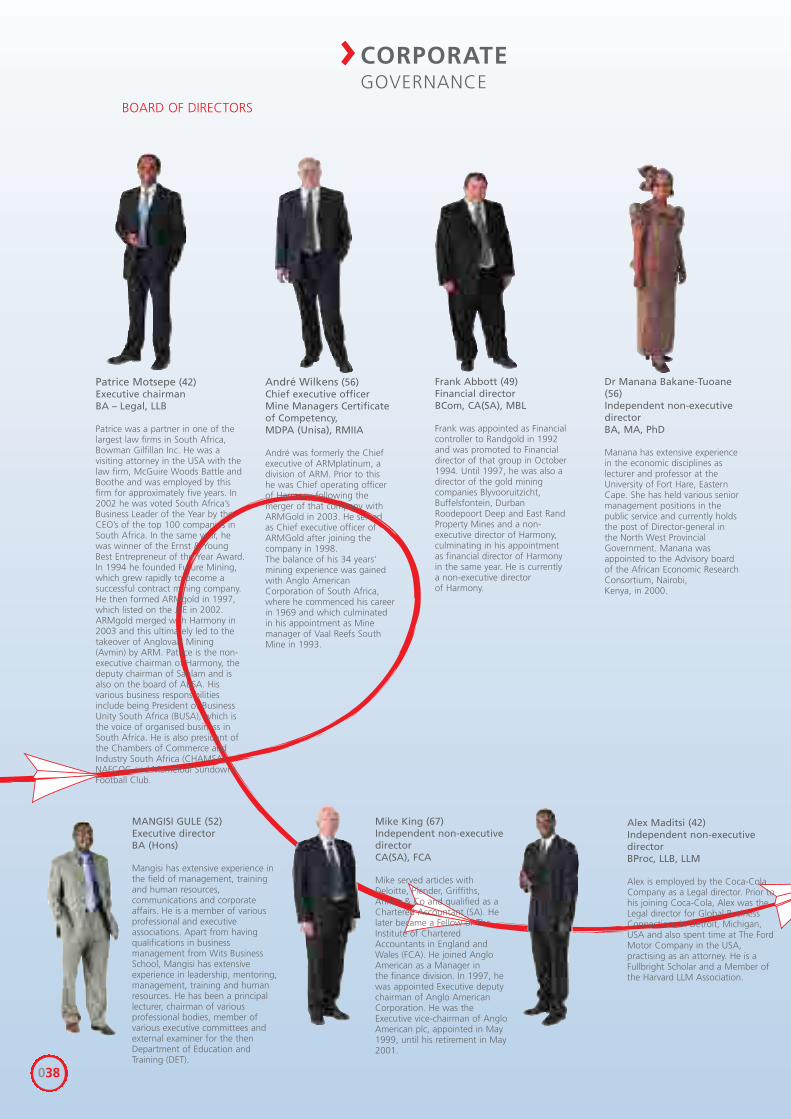
Patrice Motsepe (42)Executive chairmanBA – Legal, LLB
Patrice was a partner in one of thelargest law firms in South Africa,Bowman Gilfillan Inc. He was avisiting attorney in the USA with thelaw firm, McGuire Woods Battle andBoothe and was employed by thisfirm for approximately five years. In2002 he was voted South Africa’sBusiness Leader of the Year by theCEO’s of the top 100 companies inSouth Africa. In the same year, hewas winner of the Ernst & YoungBest Entrepreneur of the Year Award.In 1994 he founded Future Mining,which grew rapidly to become asuccessful contract mining company.He then formed ARMgold in 1997,which listed on the JSE in 2002.ARMgold merged with Harmony in2003 and this ultimately led to thetakeover of Anglovaal Mining(Avmin) by ARM. Patrice is the non-executive chairman of Harmony, thedeputy chairman of Sanlam and isalso on the board of ABSA. Hisvarious business responsibilitiesinclude being President of BusinessUnity South Africa (BUSA), which isthe voice of organised business inSouth Africa. He is also president ofthe Chambers of Commerce andIndustry South Africa (CHAMSA),NAFCOC and Mamelodi SundownsFootball Club.
Dr Manana Bakane-Tuoane(56)Independent non-executivedirectorBA, MA, PhD
Manana has extensive experiencein the economic disciplines aslecturer and professor at theUniversity of Fort Hare, EasternCape. She has held various seniormanagement positions in thepublic service and currently holdsthe post of Director-general inthe North West ProvincialGovernment. Manana wasappointed to the Advisory boardof the African Economic ResearchConsortium, Nairobi, Kenya, in 2000.
MANGISI GULE (52)Executive directorBA (Hons)
Mangisi has extensive experience inthe field of management, trainingand human resources,communications and corporateaffairs. He is a member of variousprofessional and executiveassociations. Apart from havingqualifications in businessmanagement from Wits BusinessSchool, Mangisi has extensiveexperience in leadership, mentoring,management, training and humanresources. He has been a principallecturer, chairman of variousprofessional bodies, member ofvarious executive committees andexternal examiner for the thenDepartment of Education andTraining (DET).
Frank Abbott (49)Financial directorBCom, CA(SA), MBL
Frank was appointed as Financialcontroller to Randgold in 1992and was promoted to Financialdirector of that group in October1994. Until 1997, he was also adirector of the gold miningcompanies Blyvooruitzicht,Buffelsfontein, DurbanRoodepoort Deep and East RandProperty Mines and a non-executive director of Harmony,culminating in his appointmentas financial director of Harmonyin the same year. He is currently a non-executive director of Harmony.
BOARD OF DIRECTORS
André Wilkens (56)Chief executive officerMine Managers Certificateof Competency,MDPA (Unisa), RMIIA
André was formerly the Chiefexecutive of ARMplatinum, adivision of ARM. Prior to thishe was Chief operating officerof Harmony following themerger of that company withARMGold in 2003. He servedas Chief executive officer ofARMGold after joining thecompany in 1998. The balance of his 34 years’mining experience was gainedwith Anglo AmericanCorporation of South Africa,where he commenced his careerin 1969 and which culminatedin his appointment as Minemanager of Vaal Reefs SouthMine in 1993.
Mike King (67)Independent non-executivedirectorCA(SA), FCA
Mike served articles withDeloitte, Plender, Griffiths,Annan & Co and qualified as aChartered Accountant (SA). Helater became a Fellow of TheInstitute of CharteredAccountants in England andWales (FCA). He joined AngloAmerican as a Manager inthe finance division. In 1997, hewas appointed Executive deputychairman of Anglo AmericanCorporation. He was theExecutive vice-chairman of AngloAmerican plc, appointed in May1999, until his retirement in May2001.
Alex Maditsi (42)Independent non-executivedirectorBProc, LLB, LLM
Alex is employed by the Coca-ColaCompany as a Legal director. Prior tohis joining Coca-Cola, Alex was theLegal director for Global BusinessConnections in Detroit, Michigan,USA and also spent time at The FordMotor Company in the USA,practising as an attorney. He is aFullbright Scholar and a Member ofthe Harvard LLM Association.
039
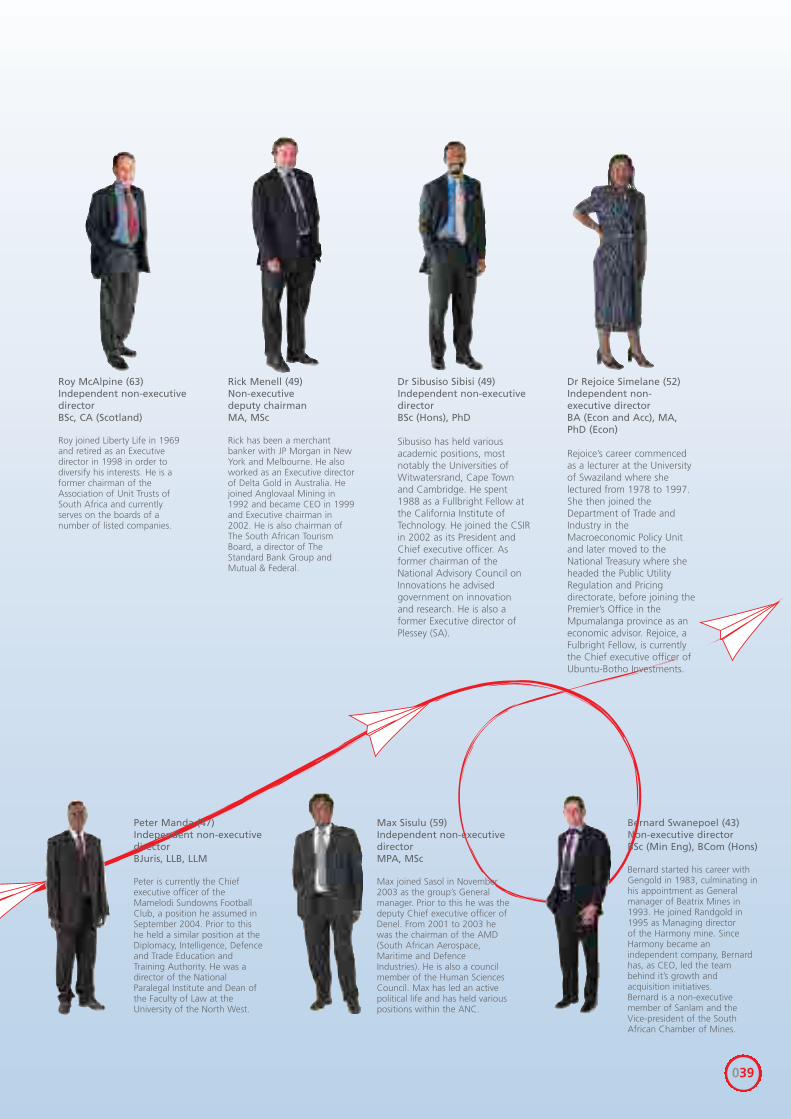
Rick Menell (49)Non-executive deputy chairmanMA, MSc
Rick has been a merchantbanker with JP Morgan in NewYork and Melbourne. He alsoworked as an Executive directorof Delta Gold in Australia. Hejoined Anglovaal Mining in1992 and became CEO in 1999and Executive chairman in2002. He is also chairman ofThe South African TourismBoard, a director of TheStandard Bank Group andMutual & Federal.
Dr Sibusiso Sibisi (49)Independent non-executivedirectorBSc (Hons), PhD
Sibusiso has held variousacademic positions, mostnotably the Universities ofWitwatersrand, Cape Townand Cambridge. He spent1988 as a Fullbright Fellow atthe California Institute ofTechnology. He joined the CSIRin 2002 as its President andChief executive officer. Asformer chairman of theNational Advisory Council onInnovations he advisedgovernment on innovationand research. He is also aformer Executive director ofPlessey (SA).
Roy McAlpine (63)Independent non-executivedirectorBSc, CA (Scotland)
Roy joined Liberty Life in 1969and retired as an Executivedirector in 1998 in order todiversify his interests. He is aformer chairman of theAssociation of Unit Trusts ofSouth Africa and currentlyserves on the boards of anumber of listed companies.
Max Sisulu (59)Independent non-executivedirectorMPA, MSc
Max joined Sasol in November2003 as the group’s Generalmanager. Prior to this he was thedeputy Chief executive officer ofDenel. From 2001 to 2003 hewas the chairman of the AMD(South African Aerospace,Maritime and DefenceIndustries). He is also a councilmember of the Human SciencesCouncil. Max has led an activepolitical life and has held variouspositions within the ANC.
Bernard Swanepoel (43)Non-executive directorBSc (Min Eng), BCom (Hons)
Bernard started his career withGengold in 1983, culminating inhis appointment as Generalmanager of Beatrix Mines in1993. He joined Randgold in1995 as Managing directorof the Harmony mine. SinceHarmony became anindependent company, Bernardhas, as CEO, led the teambehind it’s growth andacquisition initiatives. Bernard is a non-executivemember of Sanlam and theVice-president of the SouthAfrican Chamber of Mines.
Peter Manda (47)Independent non-executivedirectorBJuris, LLB, LLM
Peter is currently the Chiefexecutive officer of theMamelodi Sundowns FootballClub, a position he assumed inSeptember 2004. Prior to thishe held a similar position at theDiplomacy, Intelligence, Defenceand Trade Education andTraining Authority. He was adirector of the NationalParalegal Institute and Dean ofthe Faculty of Law at theUniversity of the North West.
Dr Rejoice Simelane (52)Independent non-executive directorBA (Econ and Acc), MA,PhD (Econ)
Rejoice’s career commencedas a lecturer at the Universityof Swaziland where shelectured from 1978 to 1997.She then joined theDepartment of Trade andIndustry in theMacroeconomic Policy Unitand later moved to theNational Treasury where sheheaded the Public UtilityRegulation and Pricingdirectorate, before joining thePremier’s Office in theMpumalanga province as aneconomic advisor. Rejoice, aFulbright Fellow, is currentlythe Chief executive officer ofUbuntu-Botho Investments.

040
>CORPORATEGOVERNANCE
Director MotlalaPieter Rörich
SENIOR MANAGEMENT
Frank AbbottPatrice Motsepe
John Kilani Teboho MahumaJan Steenkamp
Mangisi Gule
Bongani Khunene
André Wilkens
Pieter Rörich
041
The information provided to the board is derived from external sources and
internally from minutes, plans and reports of the activities of the respective
committees; no restrictions are placed upon accessing sources within ARM.
The audit, empowerment and sustainable development committees meet at
predetermined times each year, whereas meetings of the investment,
nominations and remuneration committees are held as needed.
The board committee system provides the directorate with an effective
communication forum. Attendance by members of these committees is
reflected in the table “meeting attendance” on page 46.
Audit committee
All four members of this committee are independent non-executive directors.
The chief executive officer, financial director and general manager: risk attend
these meetings by invitation, as do the external and internal auditors.
The Company’s ‘The Role of the Audit Committee’ is to be replaced with terms of
reference incorporating the requirements of the King II Report. Membership of the
committee is restricted to independent non-executive directors.
Whilst four meetings are required to be held annually in accordance with the
committee’s terms of reference, the restructuring of the Company precluded
the holding of the requisite number of meetings. Two meetings were held
during the year under review. Subsequent to 30 June 2004 two meetings have
been held.
The main responsibilities of the audit committee include the safeguarding of
the Company’s assets, the operation of adequate systems and internal controls,
control processes, the preparation of accurate financial reports and statements
in compliance with all applicable legal requirements, corporate governance and
accounting standards and the overseeing of financial and similar risks in
conjunction with the sustainable development committee.
The provision of a “whistle blowing” facility has recently been introduced.
Following the implementation of the Avmin Transaction it was decided that the
internal audit function be outsourced. KPMG has been appointed to undertake
this task until 31 December 2004. The role of the internal auditors remains the
examination and evaluation of the effectiveness of key operating systems of the
Group’s business. Through this audit process, operating and business risks are
highlighted and the systems of operating and financial controls are monitored. All
issues are brought to the attention of the audit and sustainable development
BOARD COMMITTEESAudit Committee
(Appointments with effect from 12 July 2004)Mike King (Chairman),Alex Maditsi,Roy McAlpine, Dr Rejoice Simelane
Empowerment CommitteePeter Manda (Chairman), Max Sisulu, Bernard Swanepoel
Investment CommitteeDr Sibusiso Sibisi (Chairman), Mike King, Rick Menell, Bernard Swanepoel
Nomination CommitteePatrice Motsepe (Chairman), Alex Maditsi, Dr Rejoice Simelane
Remuneration CommitteeDr Manana Bakane-Tuoane (Chairman), Roy McAlpine, Bernard Swanepoel
Sustainable Development CommitteeRick Menell (Chairman), Dr Manana Bakane-Tuoane, Peter Manda, Max Sisulu
The Chief executive officer attends all committee
meetings by invitation and senior managers as
required.
042
committees, as well as to the directors, senior management and external auditors.
Issues that require corrective action are discussed by senior management and
acted upon with urgency under the auspices of the audit committee.
The external auditors remain Ernst & Young who, as with the internal auditors,
have unrestricted access to the audit committee.
Messrs KW Maxwell, DE Jowell, and MZ Nkosi resigned as members of the
committee on 30 April and Mr PC Pienaar on 4 February 2004, and were
succeeded on 12 July 2004 by the members as indicated on page 41, and Dr
PS Sibisi. Dr Sibisi resigned as a member on 2 September 2004.
Empowerment committee
This committee was formed on 12 July 2004. Dr Bakane-Tuoane resigned as a
member on 10 November 2004. Mr Manda was appointed chairman as of the
latter date. The members are all independent non-executive directors except
Mr Swanepoel who is a non-executive director.
The committee’s purpose is to identify areas of business opportunities to enable
historically disadvantaged South Africans to enter into the mining industry in
compliance with the requirements of the Minerals and Petroleum Resources
Development Act. The committee is scheduled to meet quarterly with the
inaugural meeting being held on 10 November 2004.
Terms of reference have been prepared and will be considered by the committee
at its next meeting, and thereafter submitted to the board for consideration. The
board approved a preferential procurement policy during the year under review
and its provisions are being applied.
Investment committee
The board considered it opportune to form this committee to consider projects,
acquisitions and disposal of assets. In addition, the committee’s function is to
develop and recommend criteria for the selection of investments.
This committee was also formed on 12 July 2004. The committee held its first
meeting on 15 September 2004 and a further two since. Meetings are
convened as appropriate.
The chairman is an independent non-executive director with the balance of the
committee comprising two non-executive directors and one independent non-
executive director.
CORPORATEGOVERNANCE
>
043
Nomination committee
The Company’s chairman leads this reconstituted committee and is assisted by
two independent non-executive directors. The appointment of the chairman of
the Company as chairman of the committee was considered and ratified by the
board on 12 July 2004.
The existing charter is being reviewed. The proposed new terms of reference
comprise the identification and evaluation of prospective directors, considering
the suitability of directors for election/re-election by shareholders, and the
determination of the membership of board committees. The selection process
of directors will be both formal and transparent.
Apart from Mr PT Motsepe who remains a member of the new committee, all
members of the previous committee (Messrs RP Menell, DE Jowell and
MZ Nkozi) resigned on 30 April 2004. The new members were appointed
on 12 July 2004.
No committee meetings were held during the year under review.
Remuneration committee
The committee’s chairman is an independent non-executive director and the
other two members are, respectively, independent non-executive and non-
executive directors. Messrs KW Maxwell and RP Menell, former members of this
committee, resigned on 30 April 2004 and Dr Bakane-Tuoane was appointed as
of 12 July 2004 as a member and chairman on 10 November 2004.
This committee is tasked in terms of its present charter to ensure appropriate
levels of remuneration are paid to directors and senior management of the
Company. The committee determines broad policy for individual remuneration
and benefits thereby maintaining a compensation policy that is both
competitive and equitable. The committee authorises the granting of scheme
shares or share options to incentive scheme participants in accordance with the
current scheme’s trust deed.
Two committee meetings were held during the twelve months to 30 June 2004.
Executive directors and the manager: human resources attended these meetings
by invitation. Post year-end a meeting of the committee has been held.
044
The committee at the latter meeting considered the changed circumstances of
executive directors arising from the Avmin Transaction and approved the
remuneration packages paid to those affected. The incentivising of the
Company’s senior executive was considered. A summary of the proposed
Founders’ Incentive Scheme, is reflected in the notice of annual general meeting
insert. The Scheme is recommended by the board for shareholder consideration
at the annual general meeting.
Sustainable development committee
Membership of the current committee was approved by the board on 12 July
2004 and comprises the deputy chairman and three independent non-
executive directors. All the previous members, other than Mr Menell, namely
Dr MZ Nkosi (chairman), Messrs KW Maxwell, PC Pienaar, and JC Steenkamp
resigned during the year under review.
Two committee meetings were held during the year under review. The new
committee has held two meetings after the Company’s financial year-end. The
general manager: risk and executive: sustainable development attend all
committee meetings by invitation.
Safety and health matters are considered at every board meeting. The Group
safety, health and environmental committee has been disbanded and these
functions are now handled by the sustainable development committee.
The committee’s charter is presently being reviewed with the objective of
embracing a full sustainable development definition inclusive of community
development, HIV/AIDS, skills development and risk management following the
discontinuance of the risk committee. The audit committee has assumed the
responsibility for financial risk management. The proposed new terms of
reference provides for meetings to be held quarterly. The Group’s sustainable
development policy is also being reviewed in parallel with the committee’s new
terms of reference. The policy is to embrace the requirements of the Mining
Charter and its evolvement.
SAFETY
The evaluation of Group statistics and performance incorporates the
comparison of Group results against benchmarks provided by other
international mining companies and operations, and the meeting of statutory
and regulatory compliance requirements. Group safety objectives take
cognisance of these benchmarks.
The fundamental approach towards safety within the Group involves the active
participation of all employees and contractors in the attainment of “target
CORPORATEGOVERNANCE
>
045
zero, zero tolerance”. A structured approach together with training
programmes have been devised and implemented at the operations. This
approach encompasses full accountability and empowerment of appropriately
appointed persons; embraces risk assessment and risk management; reviews
safety performance, and evaluates and analyses accident statistics as
prominent features. Safety forums have been established at the operations.
OCCUPATIONAL HEALTH
The evaluation of information provided by the operations against set objectives
required by statutory and regulatory compliance. Areas of specific interest to ARM
include mangaruom, occupational lung diseases, and noise induced hearing loss.
There is an ongoing process embracing medical examinations on appointment
and cessation of employment, and thorough regular testing. Occupational
disease prevention programmes are undertaken at all operations.
ENVIRONMENT
The evaluation of reports from operations against statutory and regulatory
requirements is undertaken. The approval of funding to meet legislated
requirements is considered by the committee annually.
ARM actively addresses its environmental management responsibilities by
having its operations audited against International Standards Organisation (ISO)
benchmarks. The Group will continue to involve external consultants with the bi-
annual environmental and safety audits at all its operations.
HIV/AIDS
A comprehensive strategy has been devised to inhibit the spread of this disease
at ARM’s operations. Monitoring and evaluation against this strategy continues
to receive urgent attention. Those persons affected are being counselled
and assisted.
The corporate sustainable development review is to be found on page 48.
046
>CORPORATEGOVERNANCE
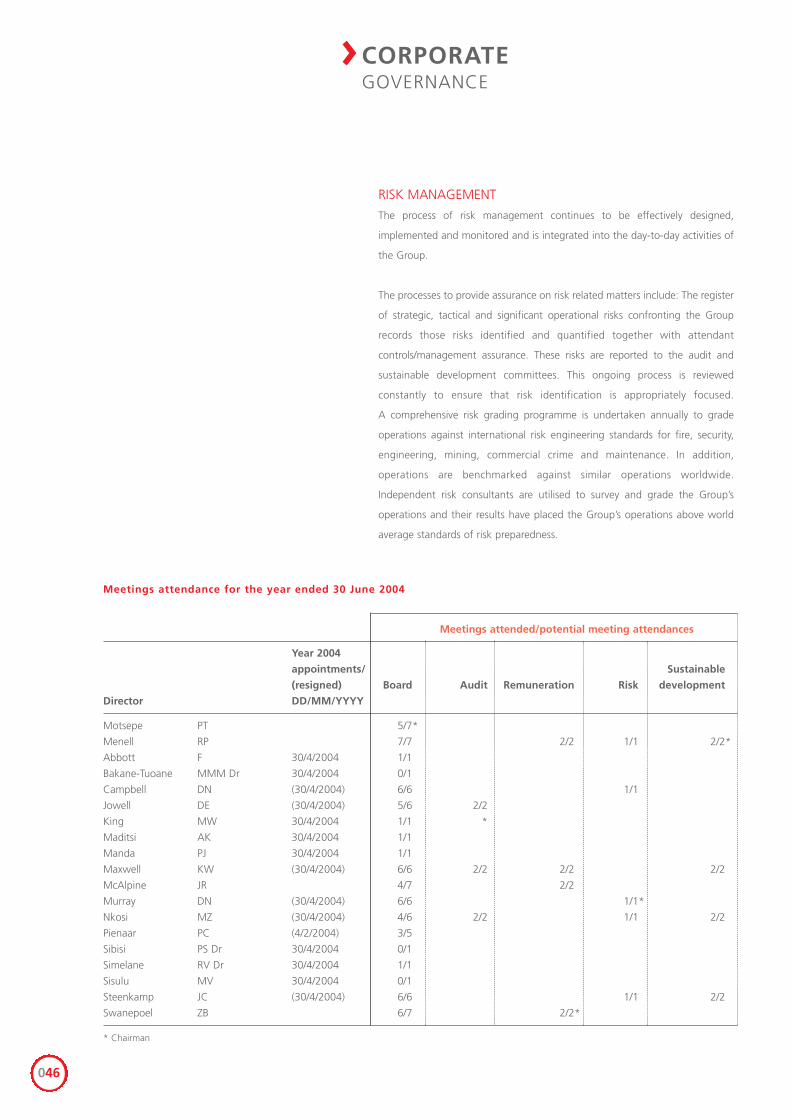
Meetings attendance for the year ended 30 June 2004
Meetings attended/potential meeting attendances
Year 2004
appointments/ Sustainable
(resigned) Board Audit Remuneration Risk development
Director DD/MM/YYYY
Motsepe PT 5/7*
Menell RP 7/7 2/2 1/1 2/2*
Abbott F 30/4/2004 1/1
Bakane-Tuoane MMM Dr 30/4/2004 0/1
Campbell DN (30/4/2004) 6/6 1/1
Jowell DE (30/4/2004) 5/6 2/2
King MW 30/4/2004 1/1 *
Maditsi AK 30/4/2004 1/1
Manda PJ 30/4/2004 1/1
Maxwell KW (30/4/2004) 6/6 2/2 2/2 2/2
McAlpine JR 4/7 2/2
Murray DN (30/4/2004) 6/6 1/1*
Nkosi MZ (30/4/2004) 4/6 2/2 1/1 2/2
Pienaar PC (4/2/2004) 3/5
Sibisi PS Dr 30/4/2004 0/1
Simelane RV Dr 30/4/2004 1/1
Sisulu MV 30/4/2004 0/1
Steenkamp JC (30/4/2004) 6/6 1/1 2/2
Swanepoel ZB 6/7 2/2*
* Chairman
RISK MANAGEMENT
The process of risk management continues to be effectively designed,
implemented and monitored and is integrated into the day-to-day activities of
the Group.
The processes to provide assurance on risk related matters include: The register
of strategic, tactical and significant operational risks confronting the Group
records those risks identified and quantified together with attendant
controls/management assurance. These risks are reported to the audit and
sustainable development committees. This ongoing process is reviewed
constantly to ensure that risk identification is appropriately focused.
A comprehensive risk grading programme is undertaken annually to grade
operations against international risk engineering standards for fire, security,
engineering, mining, commercial crime and maintenance. In addition,
operations are benchmarked against similar operations worldwide.
Independent risk consultants are utilised to survey and grade the Group’s
operations and their results have placed the Group’s operations above world
average standards of risk preparedness.
047
EXECUTIVE AND STEERING COMMITTEES
Executive committee
The committee is chaired by the Executive chairman and includes the executive
directors and senior management within ARM. This committee, working in
conjunction with the board, formulates the strategy of ARM.
Steering committee
The committee is chaired by the Chief executive officer and includes other senior
management of the Company. This committee implements the strategy and
considers operational matters.
TREASURY COMMITTEE
The committee, under the chairmanship of the financial director, meets
monthly (and more often as necessary) with Andisa Treasury Services
(Proprietary) Limited (“Andisa”) to discuss market conditions, treasury
operations and existing and future hedging strategies. The primary focus of the
committee is the reduction of risk in commodities and currencies. Andisa
implements decisions taken. Andisa does not perform an executive or decision-
making role. Advice is also sought from other advisors on a continuous basis.
The committee operates within clearly defined parameters set by the board.
CODE OF ETHICS
The Company is committed to high standards of integrity, behaviour and ethics
in dealing with all its stakeholders. All directors and employees are required to
maintain high ethical standards to ensure that the Company’s business
practices are conducted in a reasonable manner and to act in good faith and
in the interests of the Company.
The Company enforces closed periods prior to the publication of its and its
subsidiary and associate companies’ quarterly, interim and provisional results.
During this time directors, officers and designated persons who may have
access to price sensitive information, are precluded from dealing in the
Company’s and its subsidiary and associate companies’ securities. A closed
period extends from the fifteenth of the month before the end of a reporting
period or the financial year until the day of publication of the results in the
press. Where appropriate, dealing is also restricted during sensitive periods
where major transactions are being negotiated and a public announcement
is imminent.
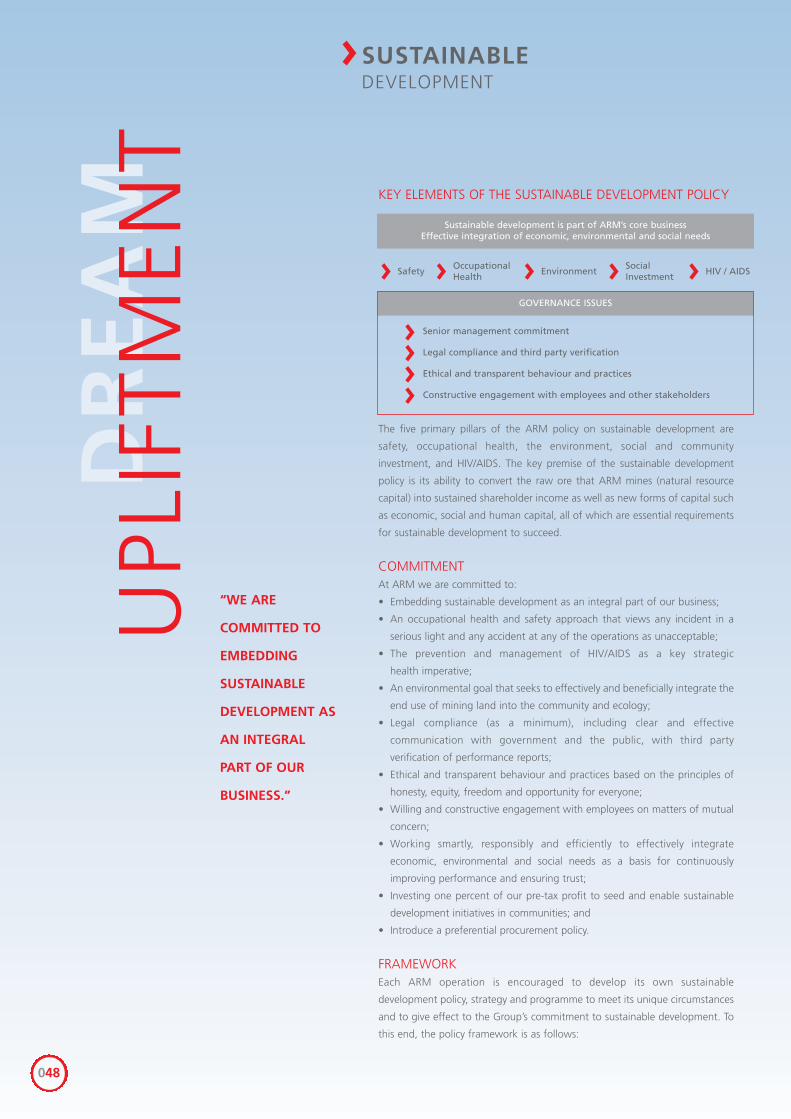
048
SUSTAINABLEDEVELOPMENT
>
“WE ARE
COMMITTED TO
EMBEDDING
SUSTAINABLE
DEVELOPMENT AS
AN INTEGRAL
PART OF OUR
BUSINESS.”
DR
EA
MU
PLIF
TMEN
TKEY ELEMENTS OF THE SUSTAINABLE DEVELOPMENT POLICY
Sustainable development is part of ARM’s core businessEffective integration of economic, environmental and social needs
GOVERNANCE ISSUES
Safety> Environment>OccupationalHealth> HIV / AIDS>Social
Investment>
Senior management commitment
Legal compliance and third party verification
Ethical and transparent behaviour and practices
Constructive engagement with employees and other stakeholders
The five primary pillars of the ARM policy on sustainable development are
safety, occupational health, the environment, social and community
investment, and HIV/AIDS. The key premise of the sustainable development
policy is its ability to convert the raw ore that ARM mines (natural resource
capital) into sustained shareholder income as well as new forms of capital such
as economic, social and human capital, all of which are essential requirements
for sustainable development to succeed.
COMMITMENTAt ARM we are committed to:
• Embedding sustainable development as an integral part of our business;
• An occupational health and safety approach that views any incident in a
serious light and any accident at any of the operations as unacceptable;
• The prevention and management of HIV/AIDS as a key strategic
health imperative;
• An environmental goal that seeks to effectively and beneficially integrate the
end use of mining land into the community and ecology;
• Legal compliance (as a minimum), including clear and effective
communication with government and the public, with third party
verification of performance reports;
• Ethical and transparent behaviour and practices based on the principles of
honesty, equity, freedom and opportunity for everyone;
• Willing and constructive engagement with employees on matters of mutual
concern;
• Working smartly, responsibly and efficiently to effectively integrate
economic, environmental and social needs as a basis for continuously
improving performance and ensuring trust;
• Investing one percent of our pre-tax profit to seed and enable sustainable
development initiatives in communities; and
• Introduce a preferential procurement policy.
FRAMEWORKEach ARM operation is encouraged to develop its own sustainable
development policy, strategy and programme to meet its unique circumstances
and to give effect to the Group’s commitment to sustainable development. To
this end, the policy framework is as follows:
>>>>
049
• Business case for sustainable development: A policy, strategy and
programme at each operation reflecting the premise that sustainable
development makes good sense, and that ultimately, it is the core of what
will sustain business itself;
• Community development: The involvement of local communities and
other role players in decisions impacting upon our respective needs
and concerns;
• Communication: Effective communication with all role players in the process
of achieving “buy-in” and ownership;
• Partnership approach: Implementing sustainable development programmes
in a manner complementary to state planning and in partnership with
government and other role players where appropriate; and
• Roles and responsibilities: Clear definition of the identity and responsibility
of the various role players.
It is the duty of all businesses in South Africa to contribute to the development
of a sustainable future. To achieve this we must fight against the HIV/AIDS
pandemic, continuously improve our safety standards, uplift local communities
and preserve the environment. ARM’s philosophy is to create wealth for our
stakeholders and jobs for the long term, whilst at the same time contributing
to the overall well-being of our employees, their families and the communities
within which we operate. We are committed to building infrastructure and
developing mines in a manner that minimises the impact on the environment.
ARM’s operations are located in the developing regions of southern Africa
where the local communities are faced with the barriers of desperate poverty,
the HIV/AIDS pandemic and a distressing lack of access to water and other
basic resources. It is ARM’s mission to contribute towards uplifting the local
communities around our operations, assisting them along the road to
economic independence. At the same time, the detrimental effects of mining
activities on the environment are minimised, and where possible the land
restored to its original state after mining activities have ceased.
The provision of a safe and healthy workplace for our employees is of
paramount importance and is supported by safety training and HIV/AIDS
prevention. A golden thread throughout our entire strategy is the involvement
of local communities and other stakeholders in all decisions impacting upon
their needs and concerns.
The ARM Group Sustainability Strategy provides the framework within which all
operations are expected to perform. In addition, each operation is allowed a
large measure of flexibility, enabling it to refine its own safety, health,
environment and community strategies to meet local conditions or to take into
consideration special requirements imposed by particular processes or conditions.
“IT IS ARM’S
MISSION TO
CONTRIBUTE
TOWARDS
UPLIFTING THE
LOCAL
COMMUNITIES
AROUND OUR
OPERATIONS,
ASSISTING THEM
ALONG THE ROAD
TO ECONOMIC
INDEPENDENCE.”
050
AT BEESHOEK WE HAVE MADE
TREMENDOUS PROGRESS SINCE
2003, ACHIEVING RECOGNITION
AND CERTIFICATION FOR THE
MOST SUCCESSFUL HIV/AIDS
PROGRAMME WITHIN ARM.
WE DON’T JUST COMPLY WITH
OCCUPATIONAL HEALTH
LEGISLATION, WE SEE IT AS A
WAY OF ACTIVELY CARING FOR
OUR PEOPLE.
SUSTAINABLE DEVELOPMENT SNAPSHOTS
Beeshoek – iron ore mine
At Beeshoek we have made tremendous progress since 2003, achieving
certification for the most successful HIV/AIDS programme within ARM. During
the year, some of our HIV/AIDS initiatives were: the presence of a traditional
healer at our governance committee meeting, an HIV positive individual
addressing our quarterly meeting and general workforce access to an
employee assistance programme practitioner and HIV/AIDS training.
We also currently hold the Department of Minerals and Energy’s safety
achievement flag as part of an awards scheme run by the Mine Health and
Safety Council in Pretoria. The flag was awarded to us in 2003 for our
Excellence in Safety between 1999 and 2003.
A major focus at Beeshoek this year has been certification for the integration
of ISO 9000, ISO 14000 and OHSA 18000. We were accredited with ISO 9000
in December 2003 and attained ISO 14000 accreditation prior to that. We are
yet to acquire OHSA 18000 accreditation. These accreditations will be
integrated into a Safety, Health, Environmental, Risk and Quality system later
this year.
Black Rock – manganese mine
One of the biggest achievements at Black Rock has been the approval of our
Environmental Management Programmes. The implementation of these
programmes continues.
We are pleased with the progress of one of our community development
projects, which involves the cultivation, harvesting and protection of the Devil’s
Claw plant. We have identified a local family, for whom housing has been built,
and they have already cultivated 5 000 plants. This unusual and highly
important project will provide the family with income over a sustained period.
SUSTAINABLEDEVELOPMENT
>
051
IN TERMS OF THE
ENVIRONMENT, WATER IS SUCH
AN IMPORTANT RESOURCE. WE
RECYCLE RAINWATER BY
PUMPING IT FROM THE PITS TO
A DAM IN ORDER TO KEEP IT IN
THE MINE WATER CIRCUIT AND
REDUCE THE AMOUNT OF
WATER WE EXTRACT FROM
THE RIVER.
THIS PROGRAMME WILL LEAD
TO THE ENTIRE METAL WASTE
PLANT BEING DEGRADED OVER
THE NEXT FIVE YEARS,
REDUCING THE COMPANY’S
CLOSURE COSTS. THIS WILL
ALSO POSITIVELY AFFECT THE
ENVIRONMENT AND
POTENTIALLY BENEFIT THE
COMMUNITY THROUGH JOB
CREATION.
Dwarsrivier – Chrome mine
There is a strong focus throughout the mine on safety and health. Specific
programmes have been put into place to deal with HIV/AIDS, these include
counselling and education on the prevention of HIV/AIDS.
Water is an important resource, and therefore measures have been put into
place to recycle water. Rainwater is recycled to reduce the amount of water the
mine extracts from the river, its primary source of water.
With respect to community development, the mine holds quarterly meetings
with representatives from the local community to discuss issues of mutual
interest. Projects invested in include: The Kopano Agricultural project; and an
educational project at the Marambane Primary School in Lydenburg.
Cato Ridge – manganese alloys
In January 2003 a safety competition was established to improve Lost Time
Injury Frequency Rates. This competition has motivated employees and
produced some positive results.
With the appointment in the past year of an Environmental Officer our focus
on the environment has increased. A water permit and contract to treat the
material from a large slag dump at a Metal Recovery Plant have been approved.
Manganese metal will be recovered and sold as will the resulting slag, which
will be used as road aggregates and for concrete blocks. This programme will
lead to the entire metal waste plant being degraded over the next five years,
reducing the company’s closure costs. This will also positively affect the
environment and potentially benefit the community through job creation.
With respect to the health of our employees, we have an on-site primary
occupational health clinic, and with the assistance of the University of Natal
finalised an HIV/AIDS policy with the employee unions. The policy was signed in
May 2004 and includes the implementation of a wellness programme as well as
an Anti-Retroviral Treatment.
A major achievement this year has been a significant reduction in disabling
injuries and the subsequent increase in our National Occupational Safety
Association rating.
052
WE HAVE UNDERTAKEN TO
REHABILITATE THE OLD SLIMES
DUMPS… BY RE-MINING
THEM… WE GENERATE A
PROFIT, WHICH IS PLOUGHED
BACK INTO THE COMMUNITY
INTO SCHOOLING, ROADS AND
OTHER PROJECTS.
Machadodorp – chrome alloys
The Lost Day Injury Frequency Rate for the year was 4.8, less than half the
target set for the year, which demonstrates the significant improvement in
safety during the year.
In May 2004 the mine successfully passed the combined South African Bureau
of Standards Surveillance Audit conducted on all three ISO systems (ISO 9000,
ISO 14000 and OHSA 18000).
Community development projects include a child and senior citizen’s feeding
scheme at both the Emthonjeni Crèche and at the informal settlement, a
twelve month/twelve module HIV/AIDS awareness training scheme, and a
Winter school. The projects are aimed at uplifting the communities and
developing their life skills in a sustainable way.
MODIKWA – PGMSModikwa is a new mine and therefore employs the latest technology to
produce cutting edge safety programmes.
At Modikwa the aim is to make behavioural safety part of each person’s day-
to-day life, thus making the person a ‘safe’ individual in the broader sense.
In our first ten months of the year, half a million shifts were completed without
any fatalities. On two occasions, the mine achieved a million Lost Time Injury
Free man shifts, which means two months of continuous production without
having a Lost Time Injury.
The mine is involved in six projects assisting the local communities to better the
environment. The rehabilitation of an old slimes dump, which belonged to a
chrome mine that has now ceased to operate, generates a profit. The benefits
from this project are ploughed back into the community, specifically into
schooling and roads projects.
SUSTAINABLEDEVELOPMENT
>
053
Nkomati – Nickel, PGMs
At Nkomati the implementation of a behaviour based safety system has had a
positive influence on injury frequency rates.
Some significant changes have been made in the way we manage the health
of our employees. An on-site medical practitioner and team of healthcare
professionals, who visit Nkomati every six weeks with a radiology truck and
clinic, are now assisting staff with their health requirements. This new medical
team has a vested interest in keeping people healthy and preventing minor
ailments from becoming major problems for them. The clinic is also a useful
tool in the HIV/AIDS programme, making voluntary HIV/AIDS and STD
counselling and testing accessible.
Nkomati is involved with several community development projects including:
the JM Dlamini Disability Centre, the Kya-Lami Old Age Centre, the Amanzi
Primary School, the Cross Roads Programme, the Education Project, the
Heartbeat project and the Grass Cutters Co-operative, all of which focus on
different aspects of community life and on meeting the needs of individuals.
Two Rivers – PGMs
Two Rivers’ Water Use and Mining licences have been approved, as has its
Environmental Management Plan.
As part of Two Rivers’ Environmental Management Plan, animals as well as six
and a half thousand sensitive plant species have been relocated. Permanent
earthworks have been established around the box cuts, which have been
planted with aloes and seeded with indigenous grass, and sensitive species are
nurtured in the on-site nursery. The long term focus is to establish the De Berg
Conservancy Programme, which is dedicated to environmental conservation.
The programme will establish an area where land owners’ rights are
guaranteed if sustainable.
Two Rivers also takes an active interest in heritage development, as it is home
to several sites of specific interest.
OUR NEW MEDICAL TEAM HAS
A VESTED INTEREST IN KEEPING
PEOPLE HEALTHY AND
PREVENTING MINOR AILMENTS
FROM BECOMING MAJOR
PROBLEMS FOR THEM.
AS PART OF TWO RIVERS’
ENVIRONMENTAL
MANAGEMENT PLAN, ANIMALS
AS WELL AS SIX AND A HALF
THOUSAND SENSITIVE PLANT
SPECIES HAVE BEEN
RELOCATED.
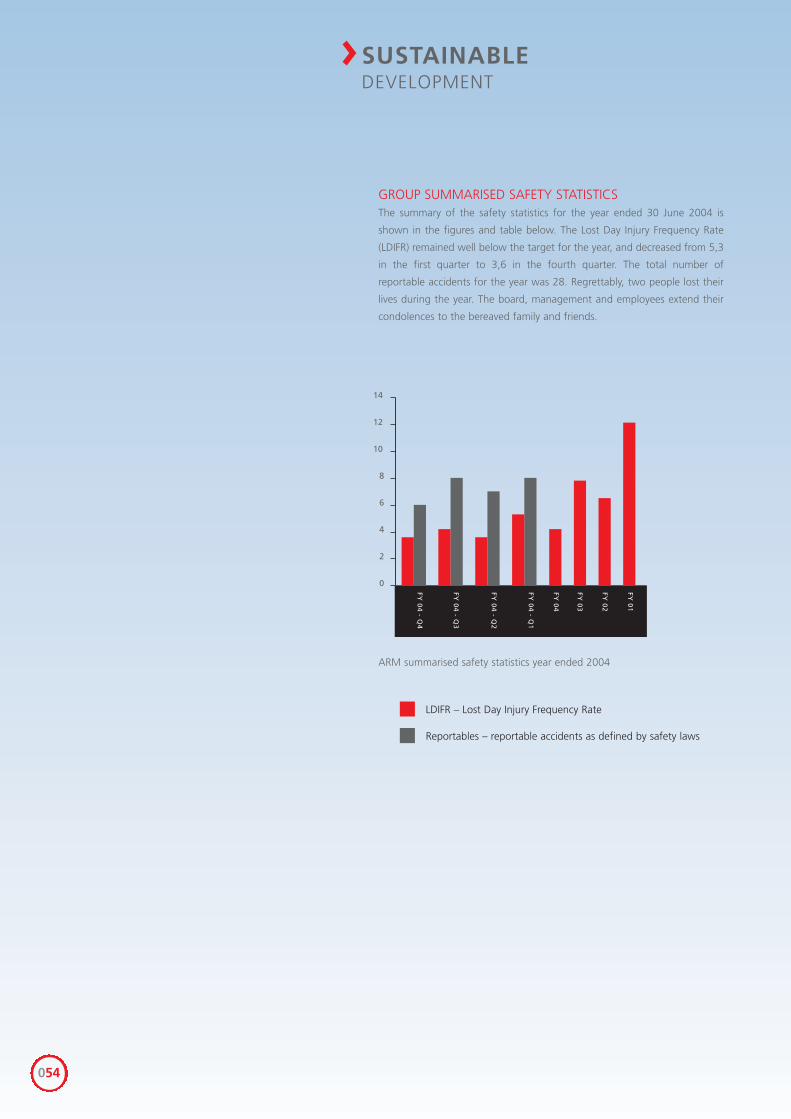
054
>SUSTAINABLEDEVELOPMENT
GROUP SUMMARISED SAFETY STATISTICSThe summary of the safety statistics for the year ended 30 June 2004 is
shown in the figures and table below. The Lost Day Injury Frequency Rate
(LDIFR) remained well below the target for the year, and decreased from 5,3
in the first quarter to 3,6 in the fourth quarter. The total number of
reportable accidents for the year was 28. Regrettably, two people lost their
lives during the year. The board, management and employees extend their
condolences to the bereaved family and friends.
ARM summarised safety statistics year ended 2004
0
2
4
6
8
10
12
14
FY 0
4 - Q
4
FY 0
4 - Q
3
FY 0
4 - Q
2
FY 0
4 - Q
1
FY 0
4
FY 0
3
FY 0
2
FY 0
1
LDIFR – Lost Day Injury Frequency Rate
Reportables – reportable accidents as defined by safety laws
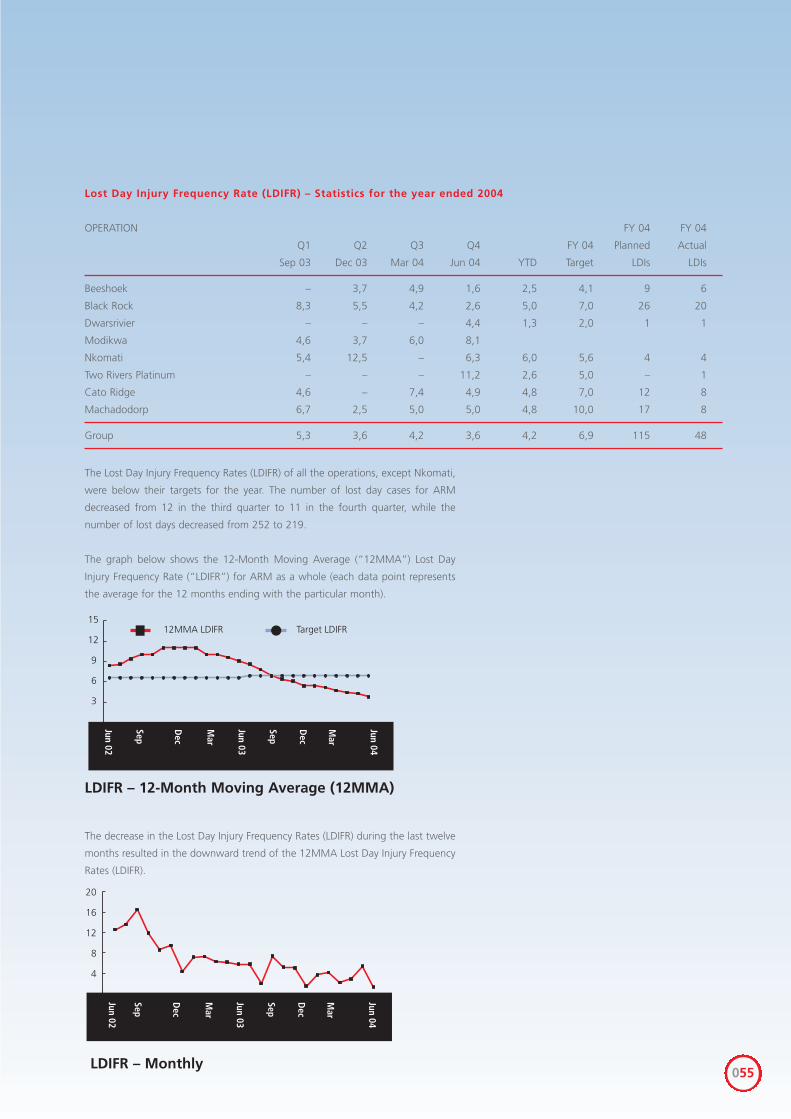
055
Lost Day Injury Frequency Rate (LDIFR) – Statistics for the year ended 2004
OPERATION FY 04 FY 04
Q1 Q2 Q3 Q4 FY 04 Planned Actual
Sep 03 Dec 03 Mar 04 Jun 04 YTD Target LDIs LDIs
Beeshoek – 3,7 4,9 1,6 2,5 4,1 9 6
Black Rock 8,3 5,5 4,2 2,6 5,0 7,0 26 20
Dwarsrivier – – – 4,4 1,3 2,0 1 1
Modikwa 4,6 3,7 6,0 8,1
Nkomati 5,4 12,5 – 6,3 6,0 5,6 4 4
Two Rivers Platinum – – – 11,2 2,6 5,0 – 1
Cato Ridge 4,6 – 7,4 4,9 4,8 7,0 12 8
Machadodorp 6,7 2,5 5,0 5,0 4,8 10,0 17 8
Group 5,3 3,6 4,2 3,6 4,2 6,9 115 48
LDIFR – 12-Month Moving Average (12MMA)
3
6
9
12
1512MMA LDIFR Target LDIFR
Jun 02
Sep
Dec
Mar
Jun 03
Sep
Dec
Mar
Jun 04
LDIFR – Monthly
4
8
12
16
20
Jun 02
Sep
Dec
Mar
Jun 03
Sep
Dec
Mar
Jun 04
The Lost Day Injury Frequency Rates (LDIFR) of all the operations, except Nkomati,
were below their targets for the year. The number of lost day cases for ARM
decreased from 12 in the third quarter to 11 in the fourth quarter, while the
number of lost days decreased from 252 to 219.
The graph below shows the 12-Month Moving Average (“12MMA”) Lost Day
Injury Frequency Rate (“LDIFR”) for ARM as a whole (each data point represents
the average for the 12 months ending with the particular month).
The decrease in the Lost Day Injury Frequency Rates (LDIFR) during the last twelve
months resulted in the downward trend of the 12MMA Lost Day Injury Frequency
Rates (LDIFR).
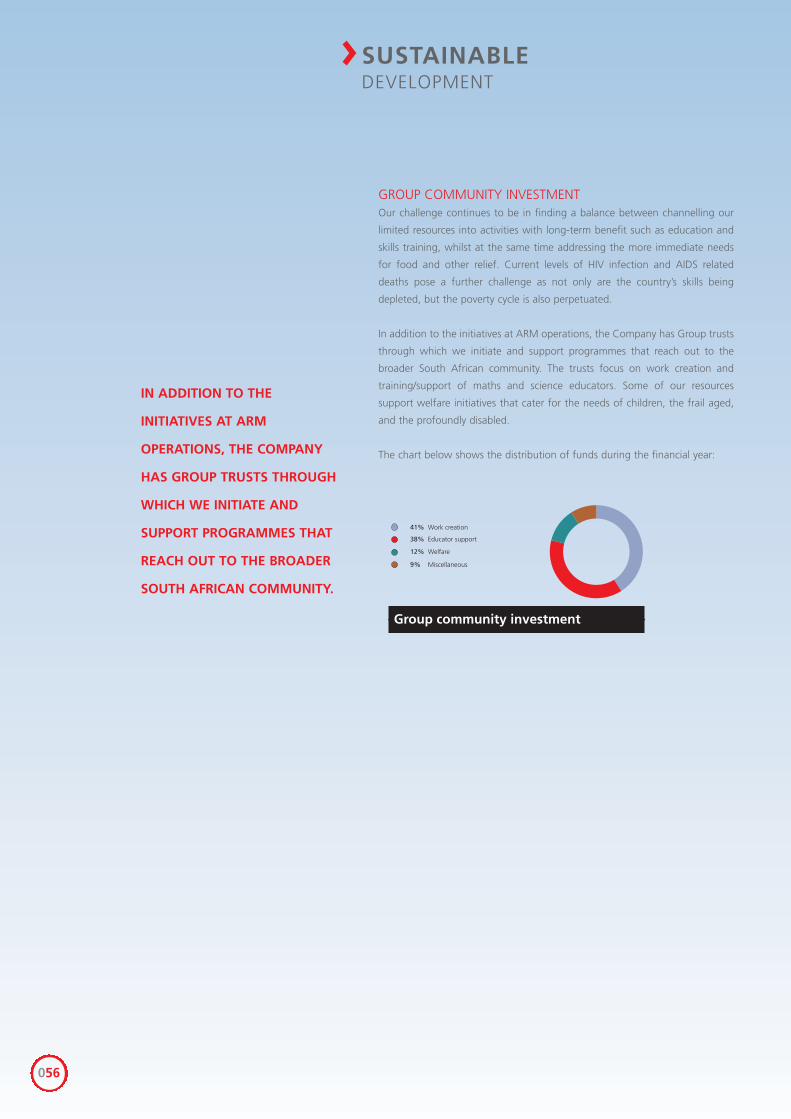
056
>SUSTAINABLEDEVELOPMENT
GROUP COMMUNITY INVESTMENTOur challenge continues to be in finding a balance between channelling our
limited resources into activities with long-term benefit such as education and
skills training, whilst at the same time addressing the more immediate needs
for food and other relief. Current levels of HIV infection and AIDS related
deaths pose a further challenge as not only are the country’s skills being
depleted, but the poverty cycle is also perpetuated.
In addition to the initiatives at ARM operations, the Company has Group trusts
through which we initiate and support programmes that reach out to the
broader South African community. The trusts focus on work creation and
training/support of maths and science educators. Some of our resources
support welfare initiatives that cater for the needs of children, the frail aged,
and the profoundly disabled.
The chart below shows the distribution of funds during the financial year:
Group community investment
9% Miscellaneous
41% Work creation
38% Educator support
12% Welfare
IN ADDITION TO THE
INITIATIVES AT ARM
OPERATIONS, THE COMPANY
HAS GROUP TRUSTS THROUGH
WHICH WE INITIATE AND
SUPPORT PROGRAMMES THAT
REACH OUT TO THE BROADER
SOUTH AFRICAN COMMUNITY.
I certify that the requirements as stated in section 268G(d) of the Companies
Act have been met and that all returns, as are required of a public company in
terms of the aforementioned Act, have been lodged with the Registrar of
Companies and that such returns are true, correct and up to date.
RH Phillips
Group Company Secretary
Johannesburg
8 December 2004
CERTIFICATE BY COMPANY SECRETARY
058
DIRECTORS’ RESPONSIBILITY RELATINGTO ANNUAL FINANCIAL STATEMENTSIt is the directors’ responsibility to prepare annual financial
statements that fairly present the state of affairs and the results of
African Rainbow Minerals Limited, formerly Anglovaal Mining
Limited, and of its Group of companies. The external auditors are
responsible for independently auditing and reporting on these annual
financial statements.
The annual financial statements set out in this report have been
prepared in accordance with South African Statements of Generally
Accepted Accounting Practice and International Financial Reporting
Standards. They are based on appropriate accounting policies which
have been consistently applied, and which are supported by
reasonable and prudent judgements and estimates. The annual
financial statements have been prepared on a going-concern basis
and the directors have no reason to believe that the business of the
Company will not be a going concern in the year ahead.
To fulfil its responsibilities, management maintains adequate
accounting records and has developed and continues to maintain
systems of internal controls. The Company and its subsidiaries’ and
associated companies’ internal controls and systems are designed to
provide reasonable but not absolute assurance as to the integrity and
reliability of the annual financial statements and to adequately
safeguard, verify and maintain their assets. These controls are
monitored throughout the Group and nothing has come to the
directors’ attention to indicate that any material breakdown in the
functioning of these controls, procedures and systems has occurred
during the year under review.
The annual financial statements and Group annual financial
statements which appear on pages 59 to 114 were approved by the
directors and are signed on their behalf on 8 December 2004 by:
Patrice Motsepe
Executive Chairman
André Wilkens
Chief Executive Officer
Johannesburg
8 December 2004
TO THE MEMBERS OF AFRICAN RAINBOW MINERALS LIMITED
We have audited the annual financial statements and Group annual financial
statements of African Rainbow Minerals Limited, formerly Anglovaal Mining
Limited, set out on pages 60 to 114 for the year ended 30 June 2004. These
financial statements are the responsibility of the Company's directors. Our
responsibility is to express an opinion on these financial statements based on
our audit.
SCOPE We conducted our audit in accordance with statements of South African
Auditing Standards. Those standards require that we plan and perform the
audit to obtain reasonable assurance that the financial statements are free
from material misstatement.
An audit includes:
• examining, on a test basis, evidence supporting the amounts and disclosures
in the financial statements;
• assessing the accounting principles used and significant estimates made by
management; and
• evaluating the overall financial statement presentation.
We believe that our audit provides a reasonable basis for our opinion.
AUDIT OPINION In our opinion, the financial statements fairly present, in all material respects,
the financial position of the Company and the Group at 30 June 2004 and the
results of their operations and cash flows for the year then ended in
accordance with South African Statements of Generally Accepted Accounting
Practice, International Financial Reporting Standards and in the manner
required by the Companies Act in South Africa.
Ernst & Young
Chartered Accountants (SA)
Registered Accountants and Auditors
Johannesburg
8 December 2004
059
AUDITORS’ REPORT
The Avmin Transaction
An announcement was made on 13 November 2003 relating to the
in principle agreement to a range of indivisible transactions involving
certain of the interests of Anglovaal Mining Limited (Avmin), African
Rainbow Minerals & Exploration Investments (Proprietary) Limited
(ARMI) and Harmony Gold Mining Company Limited (Harmony). The
shareholders on 15 April 2004 approved the “Avmin Transaction”
and Avmin’s name was changed to African Rainbow Minerals Limited
(ARM). The Avmin Transaction became unconditional on 3 May 2004
on the meeting of the remaining suspensive conditions.
These actions resulted in the creation of the largest black-controlled
mineral resources company in South Africa with ARMI controlling
62,9 percent of the Company’s issued share capital by way of a
voting agreement with Harmony. The Company’s portfolio of assets,
as a result, has significantly changed as our 42,2 percent interest in
Avgold Limited (Avgold) has been sold to Harmony in exchange for
shares in that company. Simultaneously, in another exchange of
shares, ARMI’s 13,6 percent indirect interest in Harmony was
acquired in exchange for new ARM shares resulting in ARM holding
22,0 percent of Harmony at 3 May 2004. This shareholding was
reduced to the current 19,8 percent following Harmony’s successful
offer to Avgold minorities.
ARM’s PGM interests were significantly enhanced by the acquisition
of the following:
• The entire issued share capital of African Rainbow Minerals
Platinum (Proprietary) Limited (ARM Platinum (Proprietary) Limited),
which owns 83 percent of ARM Mining Consortium Limited that in
turn has a 50 percent interest in the Modikwa Joint Venture, which
was acquired from ARMI;
• The shareholders’ loans of R549,2 million made by ARMI to
ARM Mining Consortium; and
• The Kalplats Exploration Project and associated mineral rights from
Kalahari Goldridge Mining Company Limited (Kalgold).
The individual share components of this transaction are reflected
under acquisitions and disposals on the following page.
Holding company
The Company’s largest shareholder is ARMI and in conjunction with
Harmony, the second largest stakeholder, ARMI exercises control by
way of a voting agreement with a three year term effective from 1
May 2004. These companies respectively hold 42,97 per cent and
19,00 percent of the issued ordinary share capital of the Company.
Control of these shares vest in ARMI.
Business of the Company
The business of the Company and its subsidiaries and associates is to
explore, develop, operate and hold interests in the mining and
minerals industry. The current operational focus is for precious, base
and ferrous metals.
The Company’s shares are listed through a primary listing on the JSE
Securities Exchange, South Africa and a secondary listing on the
London Stock Exchange. An American Depository Receipt Level One
Program is effective in the United States.
Review of operations
The reader is referred to the Year in Review by the Executive chairman
and Chief executive officer and the reports that incorporate the
activities and results of operations of the Group for the year ended
30 June 2004; pages 6 to 24.
The most significant events that occurred during the year ended
30 June 2004 were:
• The Avmin Transaction already mentioned.
• The remaining 25 percent of the Nkomati nickel mine was
acquired from Anglo Operations Limited on 1 February 2004. From
this date all income, assets and liabilities from this mine have
accrued to ARM.
060
DIRECTORS’ REPORT
Acquisitions and disposalsThe following significant transactions occurred during the year ended 30 June 2004:
Acquisitions and disposals by ARM Effective date Settled by Ordinary shares To other partyThe Avmin TransactionHarmony: 28 630 526 shares 3 May 2004 Transfer of 286 305 263 Avgold Harmony
Harmony: 35 002 396 shares 3 May 2004 Allotment of 70 753 843 ARM ARMI
ARM Platinum: 100% 3 May 2004 Allotment of 6 812 206 ARM ARMI
ARM Consortium: Loans 3 May 2004 Allotment of 10 184 368 ARM ARMIof R549,2 million
Kalplats Exploration Project 3 May 2004 Allotment of 2 000 000 ARM Kalgoldand associated mineral rights
Furtheracquisition by ARMNkomati Joint Venture: 1 February 2004 Cash: Nil Anglo OperationsRemaining 25% R260,0 million Limited
Disposal by ARMAssore Limited 4 May 2004 Cash: 2 610 600 Assore The Standard Bank of
R164,5 million South Africa Limited
Changes in accounting policiesNo changes were made to the accounting policies during the yearended 30 June 2004. The policies stated in the annual financialstatements are the same as for the year ended 30 June 2003.
FinancialThe financial position of the Company and the Group and the resultsof their operations and cash flows for the year under review arereflected in the annual financial statements. Group borrowings at30 June 2004 totalled R1 831 million (2003: R687 million) and at thedate of this report are R1 745 million. The increase in borrowings canmainly be attributable to the assumption by the Company in terms ofthe Avmin Transaction of ARM Mining Consortium Limited’s externaldebt totalling R777 million. Further borrowings were utilised to fundcapital expenditure at Assmang Limited’s (Assmang) mines – R227million, the AvAlloys project – R20 million and R260 million paid forthe acquisition of Anglo Operations Limited’s 25 per cent interest inthe Nkomati mine. Chambishi and other loan repayments were madeduring the year under review. The Company’s borrowing powers are,in accordance with its articles of association, unlimited subject to anyregulation that may be made by the Company in general meeting.There are at present no such regulations.
On 30 April 2004 the Company’s investment in Avgold was sold toHarmony with the purchase consideration being paid by theallotment of shares in Harmony. There are five ARM directors on theHarmony board. As a consequence ARM has had the power toexercise significant influence over Harmony’s affairs and accordinglythis investment is equity accounted as an associate.
Comparative figuresIn April 2003 Avmin sold down a portion of its investment in Avgoldfrom 55,9 percent to 42,2 percent. Avgold’s results continued to beconsolidated after that date as eight of the ten directors on the Avgoldboard were appointed by Avmin and this situation remained after thedilution in interest. International Accounting Standard IAS 27paragraph 13(d) which refers inter-alia to the “power to cast themajority of votes at meetings of the board of directors” was interpretedby the board to mean that the group still controlled Avgold.
During the current year there was globally new thinking andinterpretation on the issue of “effective control“, and it wasconcluded that the power to appoint the majority of directors mustbe by legal or contractual right and that effective control is not thetype of control that the statement intended. Therefore althoughAvmin did actually have control of the Avgold board this does notconstitute control as intended by IAS 27. This has the result thatAvgold is considered to be an associated company that is equityaccounted and not a subsidiary to be consolidated.
This revised accounting treatment has been applied in the 2004annual financial statements and as a result the 30 June 2003comparative financial statements and notes thereto for the ARMGroup have been restated to equity account the results of Avgold asan associate from 1 May 2003.
Previously reported headline and basic earnings and attributable net asset value for June 2003 are unchanged. 061
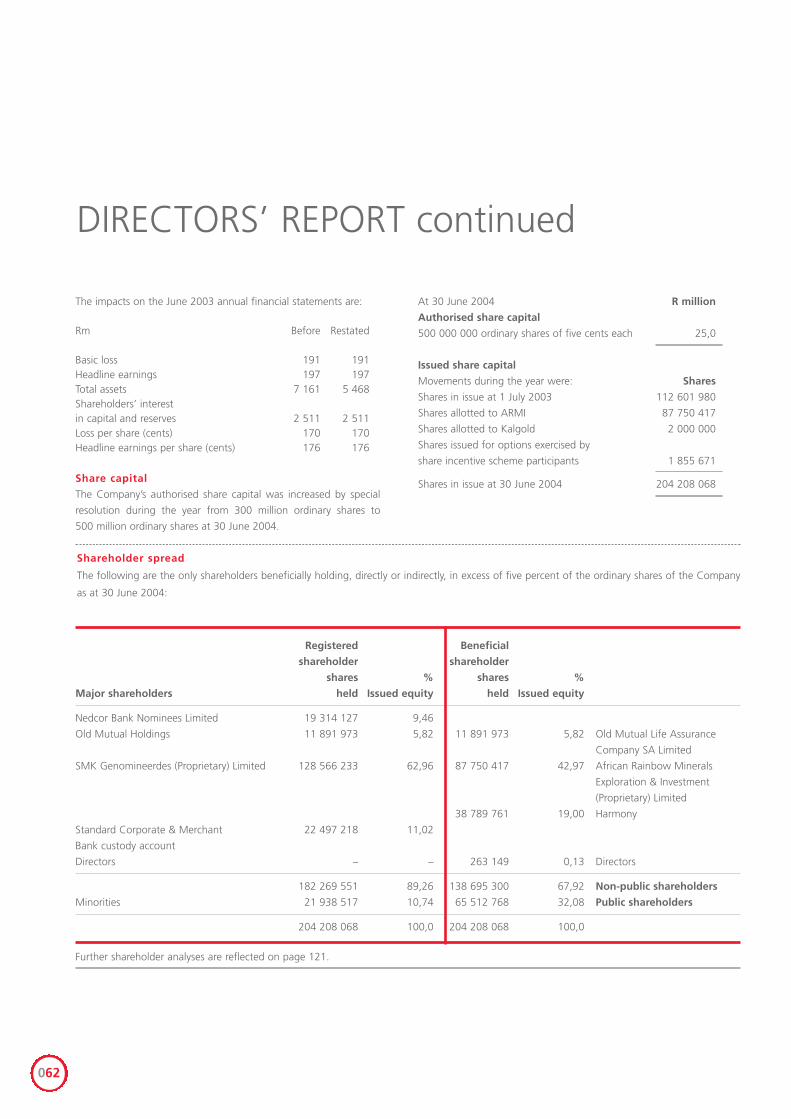
062
DIRECTORS’ REPORT continued
Shareholder spread
The following are the only shareholders beneficially holding, directly or indirectly, in excess of five percent of the ordinary shares of the Company
as at 30 June 2004:
Registered Beneficial
shareholder shareholder
shares % shares %
Major shareholders held Issued equity held Issued equity
Nedcor Bank Nominees Limited 19 314 127 9,46
Old Mutual Holdings 11 891 973 5,82 11 891 973 5,82 Old Mutual Life Assurance
Company SA Limited
SMK Genomineerdes (Proprietary) Limited 128 566 233 62,96 87 750 417 42,97 African Rainbow Minerals
Exploration & Investment
(Proprietary) Limited
38 789 761 19,00 Harmony
Standard Corporate & Merchant 22 497 218 11,02
Bank custody account
Directors – – 263 149 0,13 Directors
182 269 551 89,26 138 695 300 67,92 Non-public shareholders
Minorities 21 938 517 10,74 65 512 768 32,08 Public shareholders
204 208 068 100,0 204 208 068 100,0
Further shareholder analyses are reflected on page 121.
The impacts on the June 2003 annual financial statements are:
Rm Before Restated
Basic loss 191 191Headline earnings 197 197Total assets 7 161 5 468Shareholders’ interestin capital and reserves 2 511 2 511Loss per share (cents) 170 170Headline earnings per share (cents) 176 176
Share capital
The Company’s authorised share capital was increased by special
resolution during the year from 300 million ordinary shares to
500 million ordinary shares at 30 June 2004.
At 30 June 2004 R million
Authorised share capital
500 000 000 ordinary shares of five cents each 25,0
Issued share capital
Movements during the year were: Shares
Shares in issue at 1 July 2003 112 601 980
Shares allotted to ARMI 87 750 417
Shares allotted to Kalgold 2 000 000
Shares issued for options exercised by
share incentive scheme participants 1 855 671
Shares in issue at 30 June 2004 204 208 068
063
Taxation
An appeal has been lodged against the Company’s 1998 return of
income assessment issued by the South African Revenue Services
(SARS). If our appeal is unsuccessful the Company’s assessment will
be R107 million plus interest.
Returns of income for financial years 2001, 2002 and 2003 have
been submitted to the SARS. Assessments have been received from
the SARS for the 1999 and 2000 returns of income, and objections
and appeals thereto, have been made.
Dividend
No dividends were declared during the year given the need to
conserve cash arising from high levels of capital expenditure.
No final dividend is proposed for the year ended 30 June 2004.
Loans for purchase of mineral rights and mine
development costs
The Company has advanced loans to certain subsidiary prospecting
companies to finance the purchase of mineral rights and costs related
to mine development.
The Company’s direct and indirect interests in its principal
subsidiaries, associates and investments are reflected in separate
reports; refer pages 112 to 114.
Support of the democratic process
The board considered that the Company should promote the culture
of democratic politics in South Africa. The amount to be donated to
political parties was to be determined by the board prior to national
parliamentary elections and distributed in proportion to the tangible
support parties received at the previous election as verified by the
Independent Electoral Commission. The aggregate donation made to
political parties for the 2004 election was R2,0 million.
Post-balance sheet eventsSubsequent to the balance sheet date no significant events havetaken place.
Directorate
The names and details of the directors of the Company are reflected
on pages 38 and 39.
The directors on 4 May 2004 elected Messrs Motsepe and Menell
as the Company’s Executive chairman and deputy chairman,
respectively. These offices are subject to annual election in terms of
the articles of association. Mr JC Steenkamp was appointed as the
Chief executive officer of the Company on 1 July 2003 and on 1 May
2004 became the Chief executive: ferrous metals, relinquishing the
former position. Mr Abbott assumed the role of financial director
with effect from the date of his appointment.
Subsequent to the financial year end on 26 October 2004,
Mr AJ Wilkens was appointed Chief executive officer and elected to
the board. On 1 December 2004, Mr WM Gule was appointed an
Executive director. Mr Motsepe remains the Executive chairman.
The following appointments and resignations occurred during
the year under review:
Director Appointed Resigned
F Abbott 30/4/2004
MMM Bakane-
Tuoane Dr 30/4/2004
DN Campbell 30/4/2004
DE Jowell 30/4/2004
MW King 30/4/2004
AK Maditsi 30/4/2004
PJ Manda 30/4/2004
KW Maxwell 30/4/2004
DN Murray 30/4/2004
MZ Nkosi Dr 30/4/2004
PC Pienaar 04/2/2004
PS Sibisi Dr 30/4/2004
RV Simelane Dr 30/4/2004
MV Sisulu 30/4/2004
JC Steenkamp 30/4/2004
The consultancy agreement with Mr DN Murray was cancelled on
30 April 2004 on his resignation as a director. There are no other service
or consultancy contracts between the Company and its directors.
All the appointments made to and resignations from the board on
30 April 2004 arose from the acquisition of a controlling interest in the
Company by ARMI (refer, Holding company, on page 60) resulting in
a restructuring of the board of directors. Those directors appointed at
this date and subsequent to 30 June 2004 hold office until the
forthcoming annual general meeting. The directors so appointed are
eligible to seek election. The names and brief curricula vitae of the
directors seeking election may be found in the notice of annual
general meeting.
Every year at least one third of the directors retire by rotation in terms
of the Company’s articles of association and are required to seek re-
election at the annual general meeting. Messrs RP Menell and
JR McAlpine are so affected. Their curricula vitae are in the notice to
annual general meeting.
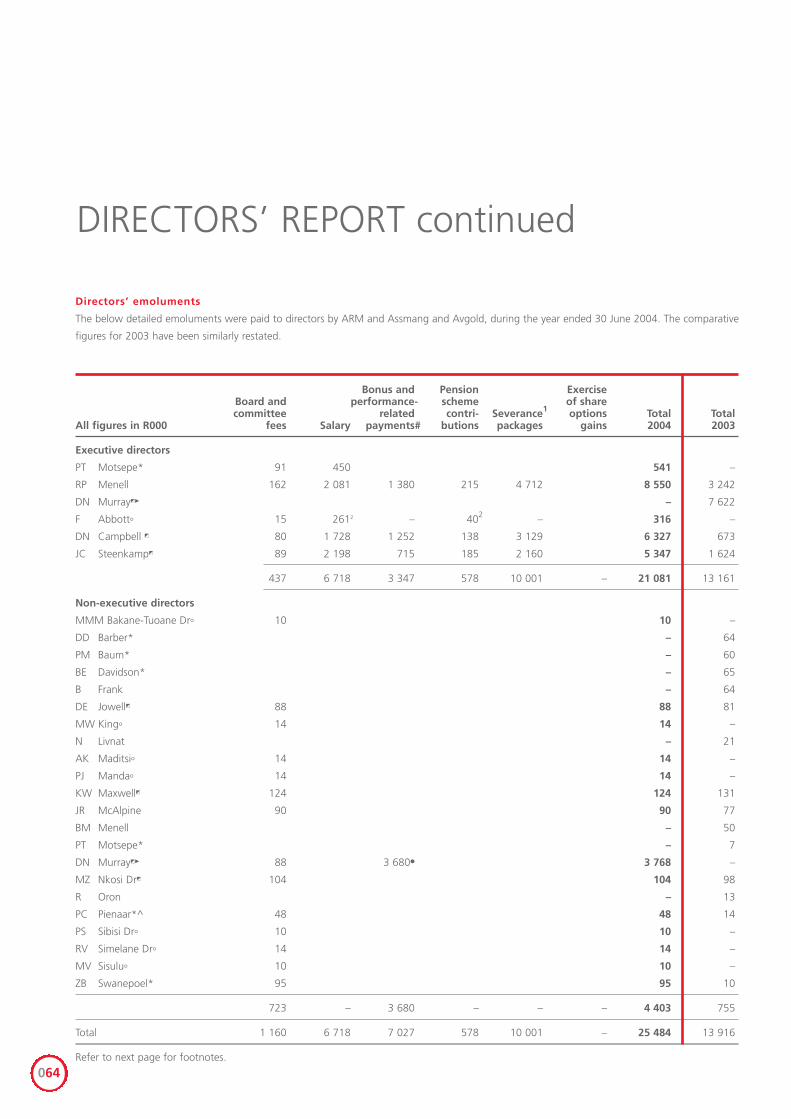
Bonus and Pension ExerciseBoard and performance- scheme of sharecommittee related contri- Severance1 options Total Total
All figures in R000 fees Salary payments# butions packages gains 2004 2003
Executive directors
PT Motsepe* 91 450 541 –
RP Menell 162 2 081 1 380 215 4 712 8 550 3 242
DN Murray�� – 7 622
F Abbott� 15 2612 – 402 – 316 –
DN Campbell � 80 1 728 1 252 138 3 129 6 327 673
JC Steenkamp� 89 2 198 715 185 2 160 5 347 1 624
437 6 718 3 347 578 10 001 – 21 081 13 161
Non-executive directors
MMM Bakane-Tuoane Dr� 10 10 –
DD Barber* – 64
PM Baum* – 60
BE Davidson* – 65
B Frank – 64
DE Jowell� 88 88 81
MW King� 14 14 –
N Livnat – 21
AK Maditsi� 14 14 –
PJ Manda� 14 14 –
KW Maxwell� 124 124 131
JR McAlpine 90 90 77
BM Menell – 50
PT Motsepe* – 7
DN Murray�� 88 3 680� 3 768 –
MZ Nkosi Dr� 104 104 98
R Oron – 13
PC Pienaar*^ 48 48 14
PS Sibisi Dr� 10 10 –
RV Simelane Dr� 14 14 –
MV Sisulu� 10 10 –
ZB Swanepoel* 95 95 10
723 – 3 680 – – – 4 403 755
Total 1 160 6 718 7 027 578 10 001 – 25 484 13 916
Refer to next page for footnotes.
Directors’ emoluments
The below detailed emoluments were paid to directors by ARM and Assmang and Avgold, during the year ended 30 June 2004. The comparative
figures for 2003 have been similarly restated.
064
DIRECTORS’ REPORT continued
065
Directors’ emoluments continued
# Bonuses and performance-related payments made to directors. These payments are considered individually for each affected director by the
remuneration committee and are weighted as to performance.1 Severance packages. Arising from the successful conclusion of the Avmin Transaction a number of managerial changes occurred within the
ranks of the executive directors resulting in severance packages being paid to the persons affected. Mr RP Menell relinquished the role of
Executive chairman for that of Non-executive deputy chairman. Mr DN Campbell, the Chief financial officer, was succeeded by
Mr F Abbott and Mr JC Steenkamp’s position as Chief executive officer was terminated and he was appointed as Chief executive:
ferrous metals.
Mr PT Motsepe assumed the role of Executive chairman of the Company.2 Emoluments pro-rated from commencement of term of office on 30 April 2004.
* Acted in represented capacity; fees paid to the shareholder represented.� Exercised share appreciation rights awarded while employed as Chief executive officer.
^ Resigned 4 February 2004� Retired 1 July 2003 Mr DN Murray during the year ended 30 June 2004 exercised the following share
appreciation rights: 29 670, 9 662, 59 650 and 34 497 with the respective issue strike
prices of R18,50. R27,60, R35,55, and R36,00 with an average exercise strike price of
R43,00 per right. The remuneration from the abovementioned transactions have been
combined in the table on the previous page. The exercise strike price is the closing price
on the JSE Securities Exchange, South Africa on the day on which the right is exercised.
At 30 June 2004 Mr Murray held rights against 4 831, 29 827 and 68 995 rights with
the issue strike prices of R27,60, R35,55 and R36,00 per right. These remaining rights
are exercisable until 30 June 2005 and thereafter lapse.
The above detailed rights accrued to Mr Murray during his term of office as Chief
executive officer of the Company.
� Appointed 30 April 2004� Resigned 30 April 2004
Mr ZB Swanepoel, a non-executive director of ARM is employed by our associate company, Harmony, and received emoluments during the year
ended 30 June 2004 from the latter: Retained bonus from the previous year R3,0 million, salaries and benefits R1,7 million, and retirement
contribution R0,3 million.
Mr PT Motsepe, in his capacity of non-executive chairman of Harmony, received directors fees of R65 000 for the year ended 30 June 2004.
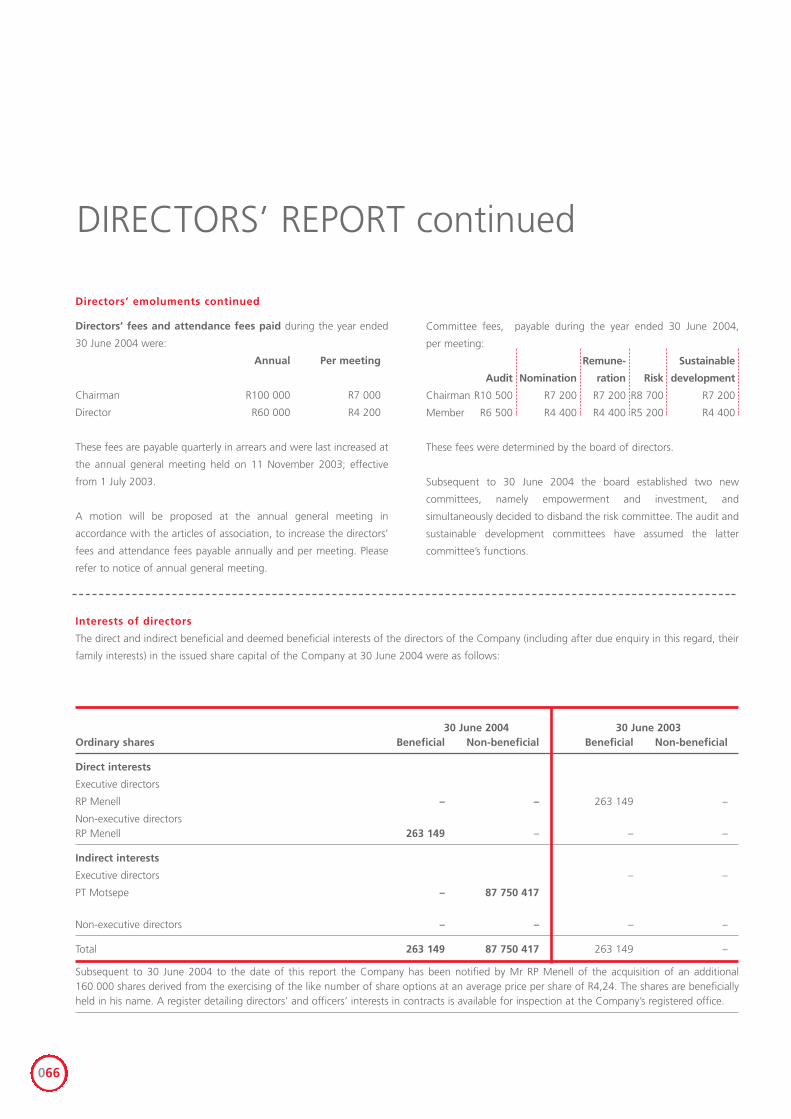
066
DIRECTORS’ REPORT continued
30 June 2004 30 June 2003Ordinary shares Beneficial Non-beneficial Beneficial Non-beneficial
Direct interests
Executive directors
RP Menell – – 263 149 –
Non-executive directorsRP Menell 263 149 – – –
Indirect interests
Executive directors – –
PT Motsepe – 87 750 417
Non-executive directors – – – –
Total 263 149 87 750 417 263 149 –
Subsequent to 30 June 2004 to the date of this report the Company has been notified by Mr RP Menell of the acquisition of an additional160 000 shares derived from the exercising of the like number of share options at an average price per share of R4,24. The shares are beneficiallyheld in his name. A register detailing directors’ and officers’ interests in contracts is available for inspection at the Company’s registered office.
Directors’ emoluments continued
Directors’ fees and attendance fees paid during the year ended
30 June 2004 were:
Annual Per meeting
Chairman R100 000 R7 000
Director R60 000 R4 200
These fees are payable quarterly in arrears and were last increased at
the annual general meeting held on 11 November 2003; effective
from 1 July 2003.
A motion will be proposed at the annual general meeting in
accordance with the articles of association, to increase the directors’
fees and attendance fees payable annually and per meeting. Please
refer to notice of annual general meeting.
Committee fees, payable during the year ended 30 June 2004,
per meeting:
Remune- Sustainable
Audit Nomination ration Risk development
Chairman R10 500 R7 200 R7 200 R8 700 R7 200
Member R6 500 R4 400 R4 400 R5 200 R4 400
These fees were determined by the board of directors.
Subsequent to 30 June 2004 the board established two new
committees, namely empowerment and investment, and
simultaneously decided to disband the risk committee. The audit and
sustainable development committees have assumed the latter
committee’s functions.
Interests of directors
The direct and indirect beneficial and deemed beneficial interests of the directors of the Company (including after due enquiry in this regard, their
family interests) in the issued share capital of the Company at 30 June 2004 were as follows:
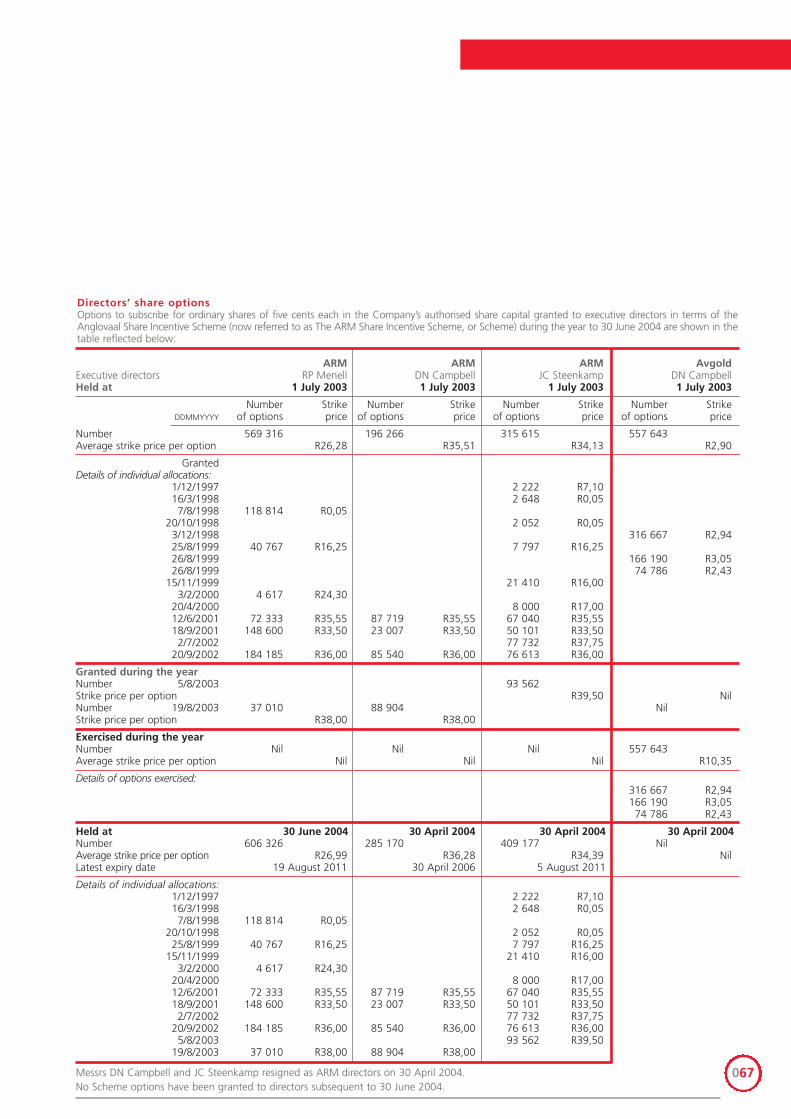
ARM ARM ARM AvgoldExecutive directors RP Menell DN Campbell JC Steenkamp DN CampbellHeld at 1 July 2003 1 July 2003 1 July 2003 1 July 2003
Number Strike Number Strike Number Strike Number StrikeDDMMYYYY of options price of options price of options price of options price
Number 569 316 196 266 315 615 557 643Average strike price per option R26,28 R35,51 R34,13 R2,90
GrantedDetails of individual allocations:
1/12/1997 2 222 R7,1016/3/1998 2 648 R0,057/8/1998 118 814 R0,05
20/10/1998 2 052 R0,053/12/1998 316 667 R2,9425/8/1999 40 767 R16,25 7 797 R16,2526/8/1999 166 190 R3,0526/8/1999 74 786 R2,43
15/11/1999 21 410 R16,003/2/2000 4 617 R24,30
20/4/2000 8 000 R17,0012/6/2001 72 333 R35,55 87 719 R35,55 67 040 R35,5518/9/2001 148 600 R33,50 23 007 R33,50 50 101 R33,502/7/2002 77 732 R37,75
20/9/2002 184 185 R36,00 85 540 R36,00 76 613 R36,00
Granted during the yearNumber 5/8/2003 93 562Strike price per option R39,50 NilNumber 19/8/2003 37 010 88 904 NilStrike price per option R38,00 R38,00
Exercised during the yearNumber Nil Nil Nil 557 643Average strike price per option Nil Nil Nil R10,35
Details of options exercised:316 667 R2,94166 190 R3,0574 786 R2,43
Held at 30 June 2004 30 April 2004 30 April 2004 30 April 2004Number 606 326 285 170 409 177 NilAverage strike price per option R26,99 R36,28 R34,39 NilLatest expiry date 19 August 2011 30 April 2006 5 August 2011
Details of individual allocations:1/12/1997 2 222 R7,1016/3/1998 2 648 R0,057/8/1998 118 814 R0,05
20/10/1998 2 052 R0,0525/8/1999 40 767 R16,25 7 797 R16,25
15/11/1999 21 410 R16,003/2/2000 4 617 R24,30
20/4/2000 8 000 R17,0012/6/2001 72 333 R35,55 87 719 R35,55 67 040 R35,5518/9/2001 148 600 R33,50 23 007 R33,50 50 101 R33,502/7/2002 77 732 R37,75
20/9/2002 184 185 R36,00 85 540 R36,00 76 613 R36,005/8/2003 93 562 R39,50
19/8/2003 37 010 R38,00 88 904 R38,00
067
Directors’ share optionsOptions to subscribe for ordinary shares of five cents each in the Company’s authorised share capital granted to executive directors in terms of theAnglovaal Share Incentive Scheme (now referred to as The ARM Share Incentive Scheme, or Scheme) during the year to 30 June 2004 are shown in thetable reflected below:
Messrs DN Campbell and JC Steenkamp resigned as ARM directors on 30 April 2004.No Scheme options have been granted to directors subsequent to 30 June 2004.
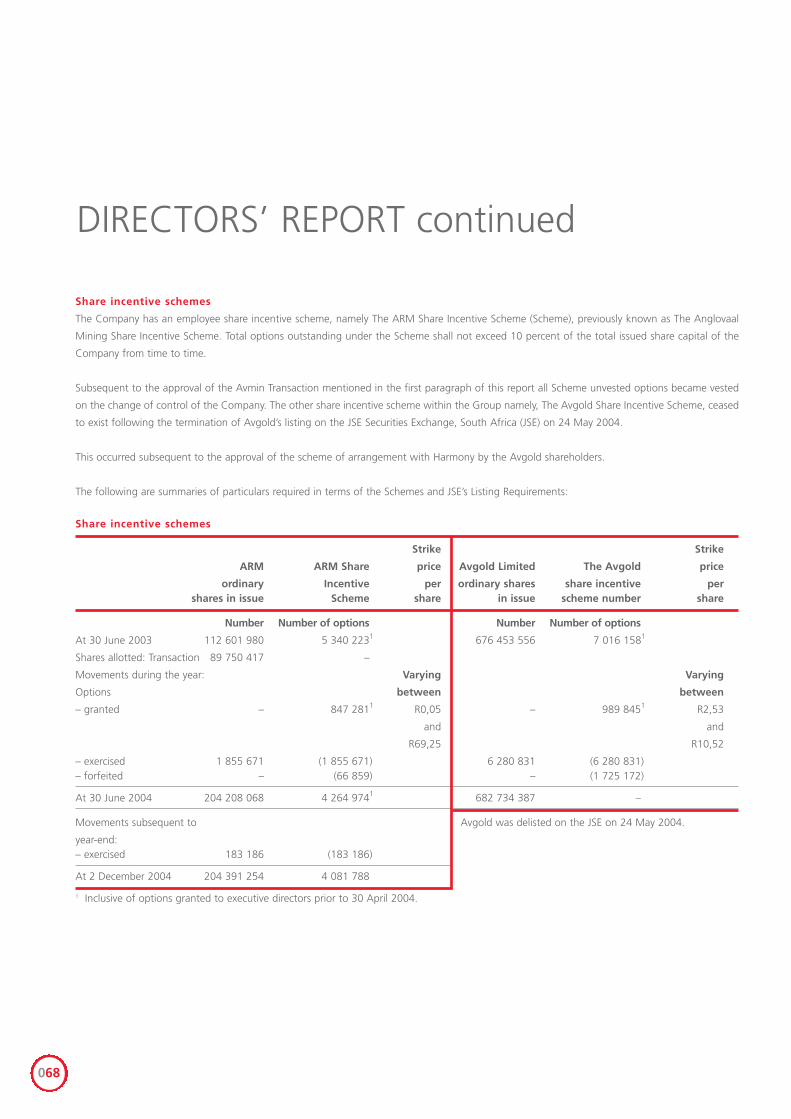
068
DIRECTORS’ REPORT continued
Share incentive schemes
Strike Strike
ARM ARM Share price Avgold Limited The Avgold price
ordinary Incentive per ordinary shares share incentive pershares in issue Scheme share in issue scheme number share
Number Number of options Number Number of options
At 30 June 2003 112 601 980 5 340 2231 676 453 556 7 016 1581
Shares allotted: Transaction 89 750 417 –
Movements during the year: Varying Varying
Options between between
– granted – 847 2811 R0,05 – 989 8451 R2,53
and and
R69,25 R10,52
– exercised 1 855 671 (1 855 671) 6 280 831 (6 280 831)– forfeited – (66 859) – (1 725 172)
At 30 June 2004 204 208 068 4 264 9741 682 734 387 –
Movements subsequent to Avgold was delisted on the JSE on 24 May 2004.
year-end:– exercised 183 186 (183 186)
At 2 December 2004 204 391 254 4 081 788
1 Inclusive of options granted to executive directors prior to 30 April 2004.
Share incentive schemes
The Company has an employee share incentive scheme, namely The ARM Share Incentive Scheme (Scheme), previously known as The Anglovaal
Mining Share Incentive Scheme. Total options outstanding under the Scheme shall not exceed 10 percent of the total issued share capital of the
Company from time to time.
Subsequent to the approval of the Avmin Transaction mentioned in the first paragraph of this report all Scheme unvested options became vested
on the change of control of the Company. The other share incentive scheme within the Group namely, The Avgold Share Incentive Scheme, ceased
to exist following the termination of Avgold’s listing on the JSE Securities Exchange, South Africa (JSE) on 24 May 2004.
This occurred subsequent to the approval of the scheme of arrangement with Harmony by the Avgold shareholders.
The following are summaries of particulars required in terms of the Schemes and JSE’s Listing Requirements:
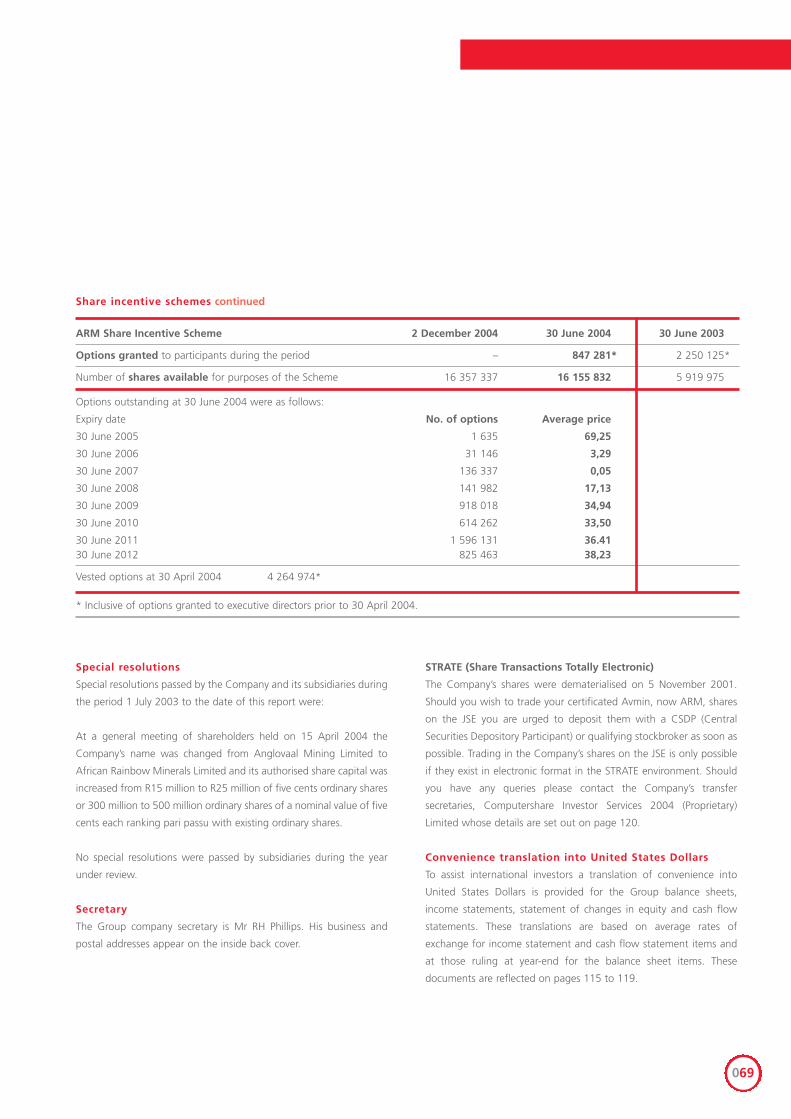
069
Share incentive schemes continued
ARM Share Incentive Scheme 2 December 2004 30 June 2004 30 June 2003
Options granted to participants during the period – 847 281* 2 250 125*
Number of shares available for purposes of the Scheme 16 357 337 16 155 832 5 919 975
Options outstanding at 30 June 2004 were as follows:
Expiry date No. of options Average price
30 June 2005 1 635 69,25
30 June 2006 31 146 3,29
30 June 2007 136 337 0,05
30 June 2008 141 982 17,13
30 June 2009 918 018 34,94
30 June 2010 614 262 33,50
30 June 2011 1 596 131 36.4130 June 2012 825 463 38,23
Vested options at 30 April 2004 4 264 974*
* Inclusive of options granted to executive directors prior to 30 April 2004.
Special resolutions
Special resolutions passed by the Company and its subsidiaries during
the period 1 July 2003 to the date of this report were:
At a general meeting of shareholders held on 15 April 2004 the
Company’s name was changed from Anglovaal Mining Limited to
African Rainbow Minerals Limited and its authorised share capital was
increased from R15 million to R25 million of five cents ordinary shares
or 300 million to 500 million ordinary shares of a nominal value of five
cents each ranking pari passu with existing ordinary shares.
No special resolutions were passed by subsidiaries during the year
under review.
Secretary
The Group company secretary is Mr RH Phillips. His business and
postal addresses appear on the inside back cover.
STRATE (Share Transactions Totally Electronic)
The Company’s shares were dematerialised on 5 November 2001.
Should you wish to trade your certificated Avmin, now ARM, shares
on the JSE you are urged to deposit them with a CSDP (Central
Securities Depository Participant) or qualifying stockbroker as soon as
possible. Trading in the Company’s shares on the JSE is only possible
if they exist in electronic format in the STRATE environment. Should
you have any queries please contact the Company’s transfer
secretaries, Computershare Investor Services 2004 (Proprietary)
Limited whose details are set out on page 120.
Convenience translation into United States Dollars
To assist international investors a translation of convenience into
United States Dollars is provided for the Group balance sheets,
income statements, statement of changes in equity and cash flow
statements. These translations are based on average rates of
exchange for income statement and cash flow statement items and
at those ruling at year-end for the balance sheet items. These
documents are reflected on pages 115 to 119.
The consolidated annual financial statements are prepared in
accordance with and comply with South African Statements of
Generally Accepted Accounting Practice and International Financial
Reporting Standards. The consolidated financial statements have
been prepared on an historical cost basis, except for the
measurement at fair value of certain investments and certain
fixed assets and loans receivable and payable.
The principal accounting policies as set out below have been
consistently applied.
BASIS OF CONSOLIDATIONAND GOODWILL Joint ventures
Joint ventures are contractual agreements whereby the Group has
joint control over the financial and operating policy decisions of the
enterprise. The Group’s attributable share of the assets, liabilities,
income and expenses of such jointly controlled entities is
proportionately consolidated on a line-by-line basis in the Group
financial statements.
Subsidiary companies
Investments in subsidiaries are accounted for at cost less impairment.
The results of subsidiaries are consolidated from the date of effective
control up to the date effective control ceases.
Investment in associate
Investments in associate are accounted for at cost less impairment.
The Group’s investment in its associate is accounted for using the
equity method of accounting. This is an entity in which the Group has
significant influence and which is neither a subsidiary nor a joint
venture of the Group. The investment in the associate is carried in the
balance sheet at cost plus post-acquisition changes in the Group’s
share of net assets of the associate, less any impairment in value. The
income statement reflects the Group’s share of the results of
operations of the associate.
Goodwill
Goodwill represents the excess of the cost of the acquisition over the
fair value attributable to the net assets acquired. Goodwill is included
in the total amount of intangible assets and is carried at cost less
accumulated depreciation and any impairment in value. Goodwill is
amortised on the straight-line basis over estimated useful life to a
maximum of 20 years.
Any excess of the value attributable to the net assets acquired over
the cost of the investment acquired is treated as negative goodwill.
Where negative goodwill is considered to represent future losses and
expenses it is amortised to the income statement as the losses and
expenses are incurred. To the extent that negative goodwill does not
relate to future expected losses and expenses, the amount of
negative goodwill, not exceeding the fair values of acquired
identifiable non-monetary assets, is recognised systematically over
the estimated useful life of the depreciable non-monetary assets and
any excess over fair value is recognised in income immediately.
Inter-Company transactions and balances
Consolidation principles relating to the elimination of inter-Company
transactions and balances and adjustments for unrealised inter-
Company profits are applied in all intra-Group dealings, whether it be
transactions with subsidiaries, associated companies or joint ventures.
BORROWING COSTS Borrowing costs that are directly attributable to the acquisition,
construction or development of a qualifying asset that requires a
substantial period of time to be prepared for its intended use
are capitalised.
Capitalisation of borrowing costs as part of the cost of a qualifying
asset commence when:
• expenditures for the asset are being incurred;
• borrowing costs are being incurred; and
• activities that are necessary to prepare the asset for its intended
use or sale are in process.
Capitalisation is suspended when the active development is
interrupted and ceases when the activities necessary to prepare
the asset for its use are complete.
DEFERRED TAXATION Deferred tax liabilities and assets are recognised in respect of
temporary differences between the book value and tax base of
balance sheet items, including items with a tax base but no book
value. The resulting net deferred tax assets or net deferred tax
liabilities are recognised on the balance sheet.
Deferred tax is not recognised when the transaction involves the
initial recognition of an asset or liability that is not subject to a
business combination, and at the time of the transaction affects
neither accounting nor taxable profit. Deferred tax assets are not
recognised on negative goodwill and no deferred tax liability is
recognised on goodwill for which amortisation is not deductible for
tax purposes. Deferred tax assets are recognised to the extent that it
is probable that taxable profit will be available against which the
deductible temporary difference can be utilised.
ACCOUNTING POLICIES
070
071
Deferred tax is calculated at the applicable rate for mining and non-
mining taxes. In the case of mining taxes for gold mines, deferred tax
is calculated at the mining cost formula rate that is expected to apply
to the period when the asset is realised or the liability is settled.
SECONDARY TAXATION ONCOMPANIES Secondary tax on companies (STC) is recognised on the declaration
date of all dividends and is included in the taxation expense in the
income statement.
ENVIRONMENTAL REHABILITATIONOBLIGATION The estimated cost of final rehabilitation, comprising liabilities for
decommissioning and restoration, is based on current legal
requirements and existing technology and is reassessed annually.
Cost estimates are not reduced by the potential proceeds from the
sale of assets.
Decommissioning
The discounted present value of estimated future decommissioning
obligations at the end of the operating life of an operation is included
in long-term provisions. The unwinding of the obligation is included
in the income statement under cost of sales. The related
decommissioning asset is recognised in fixed assets.
Restoration
The present value of the estimated cost of restoration is included in
long-term provisions. This estimate is revised annually and any
movement is charged against income.
Expenditure on ongoing rehabilitation is charged to the income
statement as incurred.
Environmental rehabilitation trust funds
Annual payments are made to rehabilitation trust funds in
accordance with statutory requirements. The trust funds are carried
at fair value and recognised separately from the related liability on
the balance sheet.
EXPLORATION EXPENDITURE Exploration expenditure comprises expenditure incurred and advances
made in respect of exploratory ventures for mining activities.
The costs of exploration programmes are expensed in the year in
which they are incurred, except for expenditure on specific properties
which have indicated the presence of a mineral resource with the
potential of being developed into a mine, in which case the
expenditures are treated as mine development cost.
IMPAIRMENTThe carrying value of assets is reviewed at each balance sheet date to
assess whether there is any indication of impairment. If any such
indication exists, the recoverable amount of the asset is estimated.
Where the carrying value exceeds the estimated recoverable amount
such assets are written down to their recoverable amount. If the
circumstances leading to the impairment no longer exist, the
appropriate portion of the impairment loss previously recognised is
written back.
FINANCIAL INSTRUMENTS Financial instruments recognised on the balance sheet include cash
and cash equivalents, investments, trade and other receivables, trade
and other payables, non-hedge derivatives and long- and short-term
borrowings. Initial recognition is at cost when the Group becomes
party to their contractual arrangements. Subsequent recognition is at
fair value or at amortised cost. The recognition methods adopted are
disclosed in the individual policy statements associated with each
item. At each balance sheet date an assessment is made whether any
financial assets are impaired. In the case of any impairment the asset
is written down to the income statement.
Derecognition of a financial asset occurs when the Group loses
control of the contractual rights that comprise the financial asset.
Derecognition of a financial liability occurs when it is extinguished,
that is, when the obligation specified in the contract is discharged,
cancelled or expires.
Derivative instruments
Gains and losses on derivative instruments that effectively establish
the prices for future production are accounted for as “normal
purchase/normal sales transactions” and recognised in revenue when
the related production is delivered. In the event of early settlement of
contracts, gains and losses are brought into revenue at the date of
settlement. Any potential loss on positions below the current cost of
production is recognised in the period in which it arises.
Forward exchange contracts are valued at the balance sheet date
using the forward rate available at the balance sheet date for the
remaining maturity period of the forward contract. Any gain or loss
from valuing the contract against the contracted rate is recognised in
the income statement unless the contract qualifies for special hedge
accounting. A corresponding forward exchange asset or liability is
recognised. On settlement of a forward exchange contract, any gain
or loss is recognised in the income statement.
Where the Group enters into cash flow hedges that qualify for special
hedge accounting the effective portion of fair value gains and
losses is recognised in equity. The ineffective portion is expensed in
the income statement. When the underlying transaction occurs the
gains and losses are recognised in earnings.
Investments
Investments other than investments in subsidiaries, associates and
joint ventures, are considered to be available for sale financial assets
and are subsequently carried at fair value. Increases and decreases in
fair values of available for sale investments are reflected in the
revaluation reserve. On disposal of an investment, the balance in the
revaluation reserve is recognised in the income statement. Where
regulated markets exist, fair values are determined with reference to
the stock exchange quoted selling prices at the close of business on
the balance sheet date. Where a reliable fair value cannot be
determined, investments are carried at cost. All regular way
purchases and sales of financial assets are recognised on the trade
date, ie the date the Group commits to purchase the asset.
Receivables
Trade receivables, which generally have 30-90 day terms, are
recognised and carried at original invoice amount less an allowance
for any uncollectible amounts. An estimate for doubtful debts is
made when collection of the full amount is no longer probable. Bad
debts are written off when identified.
Interest bearing loans and borrowings
All loans and borrowings are initially recognised at cost, being the fair
value of the consideration received net of issue costs associated with
the borrowing.
After initial recognition, interest-bearing loans and borrowings are
subsequently measured at amortised cost using the effective interest
method. Amortised cost is calculated by taking into account any
issued cost, and any discount or premium on settlement.
Gains and losses are recognised in net profit or loss when the
liabilities are derecognised or impaired, as well as through the
amortisation process.
Set-off
If a legally enforceable right exists to set-off recognised amounts
of financial assets and liabilities and the Group intends to settle on a
net basis or to realise the asset and settle the liability simultaneously,
all related financial effects are netted.
FIXED ASSETS Intangible assets
Intangible assets are reflected at cost and are amortised on a straight-
line basis over the anticipated useful lives of the assets to a maximum
of 20 years.
Research and development
Expenditure on research projects (or on the research phase of an
internal project) is recognised as an expense when it is incurred.
When the development phase of a project demonstrates that it is
probable that future economic benefits will be generated, the related
expenditure is recognised as an asset if:
• The technical feasibility of completing the asset demonstrates that
it will be available for use or sale;
• There is an intention to complete the asset, and use or sell it;
• There is an ability to use or sell the asset;
• There are adequate technical, financial and other resources
available to complete the development, and to use or sell the
asset; and
• The expenditure attributable to the asset can be measured reliably.
Tangible assets
Tangible assets, other than land and buildings, are stated at cost less
accumulated depreciation and any impairment in value.
Land and buildings
Land and buildings, other than mine properties, are valued at market
value. Buildings are depreciated on a straight-line basis over their
estimated useful lives to an estimated residual value, if such value is
significant. The annual depreciation rates used vary between two and
five percent.
External valuers value land and buildings at periodic intervals of not
more than five years. Surpluses on revaluation are recognised in
equity in a revaluation reserve. Any subsequent impairment is
adjusted against the revaluation surplus to the extent of the available
surplus and thereafter charged against operating profit. New
acquisitions and additions to existing land and buildings are reflected
at cost until the next periodic revaluation.
Mine development and decommissioning
Costs to develop new ore bodies, to define further mineralisation in
existing ore bodies and to expand the capacity of a mine, or its
current production, as well as the decommissioning thereof, are
capitalised. Development costs to maintain production are expensed
as incurred.
Mine development and decommissioning assets are amortised using
the units-of-production method based on estimated proven and
probable ore reserves. Proven and probable ore reserves reflect
estimated quantities of economically recoverable reserves which can
be recovered in future from known mineral deposits. These reserves
are reassessed annually. The maximum period of amortisation using
this method is 25 years. Where the reserves are not determinable due
to their scattered nature, the straight-line method of depreciation is072
ACCOUNTING POLICIES continued
073
applied based on the estimated life of the mine to a maximum of
25 years.
Mineral rights
Mineral rights that are being depleted are amortised over their
estimated useful lives using the units-of-production method based on
proven and probable ore reserves. Where the reserves are not
determinable, due to their scattered nature, the straight-line method
is applied. The maximum rate of depletion of any mineral right is 25
years. Mineral rights that are not being depleted are not amortised.
Mineral rights that have no commercial value are written off in full.
The excess purchase price over the fair value paid for mineral rights
is recognised as being an amount paid for the acquisition of ore
reserves. This amount is capitalised and amortised over the period
during which future economic benefits are expected to be obtained
from these mineral rights, to a maximum of 25 years.
Plant and machinery
Mining plant and machinery is amortised using the lesser of its
estimated useful life or the units-of-production method based on
estimated proved and probable ore reserves. Where ore reserves are
not determinable, because of their scattered nature, the straight-line
method of depreciation is applied. Non-mining plant and machinery
is depreciated over its useful life. The maximum life of any single item
is 25 years.
Other
Mine properties (including houses, schools and administration
blocks), motor vehicles and furniture and equipment are depreciated
on the straight-line basis over their expected useful lives, to estimated
residual values. The residual value is the amount expected to be
obtained for the asset at the end of its useful life, after deducting
expected costs of disposal.
The annual depreciation rates generally used in the Group are:
• Furniture and equipment 10 to 33 percent;
• Mine properties 4 to 7 percent;
• Motor vehicles 20 percent; and
• Mine development plant and machinery, and mineral rights
4 to 25 percent.
FOREIGN CURRENCYTRANSLATIONS Foreign entities
Financial statements of foreign subsidiaries that are classified as
foreign entities are translated into South African Rand using the
exchange rates applicable at the reporting date, as follows:
• Assets and liabilities at rates of exchange ruling at the balance
sheet date;
• Income and expenditure at the weighted average rate of exchange
for the year, except where the date of income or expense for
significant transactions can be identified, in which case the income
or expense are translated at the rate of exchange ruling at the date
of the flow;
• Cash flow items at the weighted average rate of exchange for the
year, except where the date of cash flow for significant transactions
can be identified, in which case the cash flows are translated at the
rate of exchange ruling at the date of the cash flow;
• Fair value adjustments of the foreign entity are translated at the
closing rate;
• Goodwill is considered to relate to the reporting entity and is
translated at the rate at the date of acquisition; and
• Differences arising on translation are classified as equity until
the investment is disposed of.
Foreign currency transactions and balances
Transactions in foreign currencies are converted to South African
Rand at the rate of exchange ruling at the date that the transaction
is recorded.
Foreign denominated monetary assets and liabilities (including
those linked to a forward exchange contract) are stated in South
African Rand using the exchange rate ruling at the balance sheet
date, with the resulting exchange differences being recognised in the
income statement.
INVENTORIES Inventories are valued at the lower of cost and estimated net
realisable value with due allowances being made for obsolete and
slow-moving items. Net realisable value is the estimated selling price
in the ordinary course of business, less estimated costs of completion
and the estimated costs necessary to make the sale. Cost is
determined using the following basis:
• Consumables and maintenance spares are valued at average cost;
• Finished products are valued at weighted average cost including
an appropriate portion of direct overhead costs;
• Work-in-process is valued at weighted average cost including an
appropriate portion of direct overhead costs;
• Raw materials are valued at weighted average cost; and
• By-products are valued at the estimated variable cost associated
with their production.
LEASES Finance leases, which transfer to the Group substantially all the risks
and benefits incidental to ownership of the leased item, are
capitalised at the inception of the lease at the fair value of the leased
property or, if lower, at the present value of the minimum lease
payments. Lease payments are apportioned between the finance
charges and reduction of the lease liability so as to achieve a constant
rate of interest on the remaining balance of the liability. Finance
charges are charged directly against income.
Capitalised lease assets are depreciated over the shorter of the
estimated useful life of the asset or the lease term.
Leases where the lessor retains substantially all the risks and benefits
of ownership of the asset are classified as operating leases. Operating
lease payments are recognised as an expense in the income
statement on a straight-line basis over the lease term.
EMPLOYEE BENEFITS The Group operates two defined contribution benefit pension
schemes, both of which require contributions to be made to
separately administered funds. The Group has also agreed to provide
certain additional post-employment healthcare benefits to senior
employees. These benefits are unfunded. The cost of providing
benefits under the plans is determined separately for each plan using
the projected unit credit actuarial valuation method. Actuarial gains
and losses are recognised as income or expense when incurred.
SHARE OPTIONS Share options are accounted for at the strike price when the option
is exercised and the shares in terms of this option are issued.
PROVISIONS Provisions are recognised when the following conditions have
been met:
• A present legal or constructive obligation, to transfer economic
benefits as a result of past events exists; and
• A reasonable estimate of the obligation can be made.
A present obligation is considered to exist when there is no realistic
alternative but to make the transfer of economic benefits. The
amount recognised as a provision is the best estimate at the balance
sheet date of the expenditure required to settle the obligation. Only
expenditure related to the purpose for which the provision is raised is
charged against the provision. If the effect of the time value of
money is material, provisions are determined by discounting the
expected future cash flows at a pre-tax rate that reflects current
market assessments of the time value of money and, where
appropriate, the risks specific to the liability.
ESTIMATESThe preparation of the financial statements requires management to
make certain estimates. The principles used is the same as in previous
years. When estimates are compared to actual and variances occur
the estimates are adjusted accordingly.
REVENUE RECOGNITION Revenue which includes by-products, is recognised when the risks and
rewards of ownership have been transferred and when it is probable
that the economic benefits associated with a transaction flow to the
Group and the amount of revenue can be measured reliably.
Dividends
Dividends are accounted for on the last day of registration for listed
investments and when declared in respect of unlisted investments.
Mining products
Revenue from the sale of mining and related products is recognised
when the significant risks and rewards of ownership of the goods
have passed to the buyer.
Interest
Interest is recognised on a time proportion basis that takes account
of the effective yield on the asset and an appropriate accrual is made
at each accounting reference date.
Toll treatment
Revenue from toll treatment contracts is recognised following the
treatment of mining concentrates belonging to third parties. The
revenue is based on the final metal recoveries from concentrates at
the agreed contract rates.
DEFINITIONS Cash and cash equivalents
Cash and cash equivalents include cash on hand and call deposits as
well as short-term, highly liquid investments that are readily
convertible to known amounts of cash and are subject to an
insignificant risk of changes in value. Overdrafts are excluded from
cash and cash equivalents.
Basic earnings per share
Earnings divided by the weighted average number of shares in issue.
074
ACCOUNTING POLICIES continued
075
Headline earnings per share
Headline earnings comprise earnings for the year, adjusted for
profits, losses and capital items in accordance with the requirements
of Circular 7 of 2002 issued by the South African Institute of
Chartered Accountants. Adjustments against earnings take account
of attributable taxation and minority interests. The adjusted earnings
figure is divided by the weighted average number of shares in issue
to arrive at headline earnings per share.
Fully diluted earnings per share
Fully diluted earnings comprise earnings as used in calculating basic
earnings per share. The earnings figure is divided by the weighted
average number of ordinary shares, adjusted for any financial
instruments or other contracts that may entitle the holder thereof to
ordinary shares, to arrive at fully diluted earnings per share. Fully
diluted headline earnings per share is calculated on the same basis as
fully diluted earnings per share.
Cash generated from operations per share
Cash generated from operations divided by the weighted average
number of shares in issue during the year.
COMPARATIVE FIGURESIn April 2003 Avmin sold down a portion of its investment in Avgold
from 55.9 percent to 42.2 percent. Avgold’s results continued to be
consolidated after that date as eight of the ten directors on the
Avgold board were appointed by Avmin and this situation remained
after the dilution in interest. International Accounting Standard IAS
27 paragraph 13(d) which refers inter-alia to the “power to cast the
majority of votes at meetings of the board of directors” was
interpreted by the board to mean that the group still controlled
Avgold.
During the current year there was globally new thinking and
interpretation on the issue of “effective control“, and it was
concluded that the power to appoint the majority of directors must
be by legal or contractual right and that effective control is not the
type of control that the statement intended. Therefore although
Avmin did actually have control of the Avgold board this does not
constitute control as intended by IAS 27. This has the result that
Avgold is considered to be an associated company that is equity
accounted and not a subsidiary to be consolidated.
This revised accounting treatment has been applied in the 2004
annual financial statements and as a result the 30 June 2003
comparative financial statements and notes thereto for the ARM
group have been restated to equity account the results of Avgold as
an associate from 1 May 2003.
Previously reported headline and basic earnings and attributable net
asset value for June 2003 are unchanged.
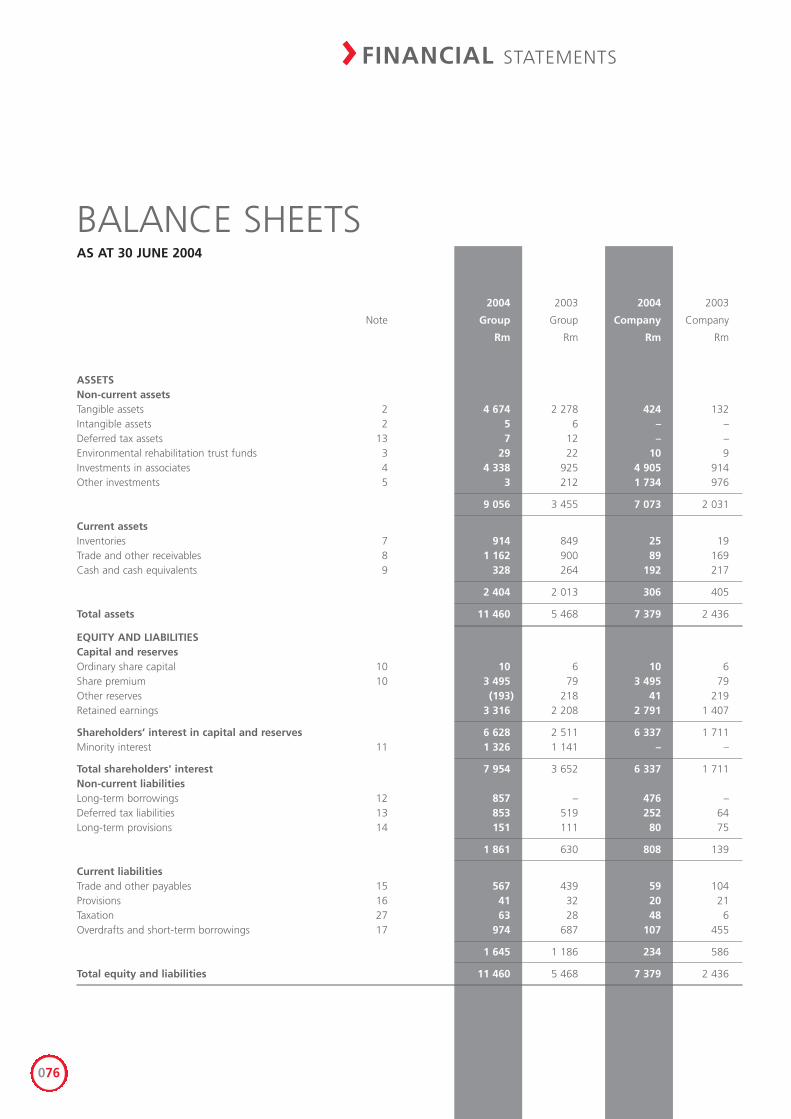
2004 2003 2004 2003
Note Group Group Company Company
Rm Rm Rm Rm
ASSETSNon-current assets Tangible assets 2 4 674 2 278 424 132Intangible assets 2 5 6 – –Deferred tax assets 13 7 12 – –Environmental rehabilitation trust funds 3 29 22 10 9 Investments in associates 4 4 338 925 4 905 914Other investments 5 3 212 1 734 976
9 056 3 455 7 073 2 031
Current assets Inventories 7 914 849 25 19 Trade and other receivables 8 1 162 900 89 169 Cash and cash equivalents 9 328 264 192 217
2 404 2 013 306 405
Total assets 11 460 5 468 7 379 2 436
EQUITY AND LIABILITIESCapital and reservesOrdinary share capital 10 10 6 10 6 Share premium 10 3 495 79 3 495 79 Other reserves (193) 218 41 219 Retained earnings 3 316 2 208 2 791 1 407
Shareholders’ interest in capital and reserves 6 628 2 511 6 337 1 711 Minority interest 11 1 326 1 141 – –
Total shareholders' interest 7 954 3 652 6 337 1 711 Non-current liabilities Long-term borrowings 12 857 – 476 – Deferred tax liabilities 13 853 519 252 64 Long-term provisions 14 151 111 80 75
1 861 630 808 139
Current liabilities Trade and other payables 15 567 439 59 104 Provisions 16 41 32 20 21 Taxation 27 63 28 48 6 Overdrafts and short-term borrowings 17 974 687 107 455
1 645 1 186 234 586
Total equity and liabilities 11 460 5 468 7 379 2 436
BALANCE SHEETSAS AT 30 JUNE 2004
> FINANCIAL STATEMENTS
076
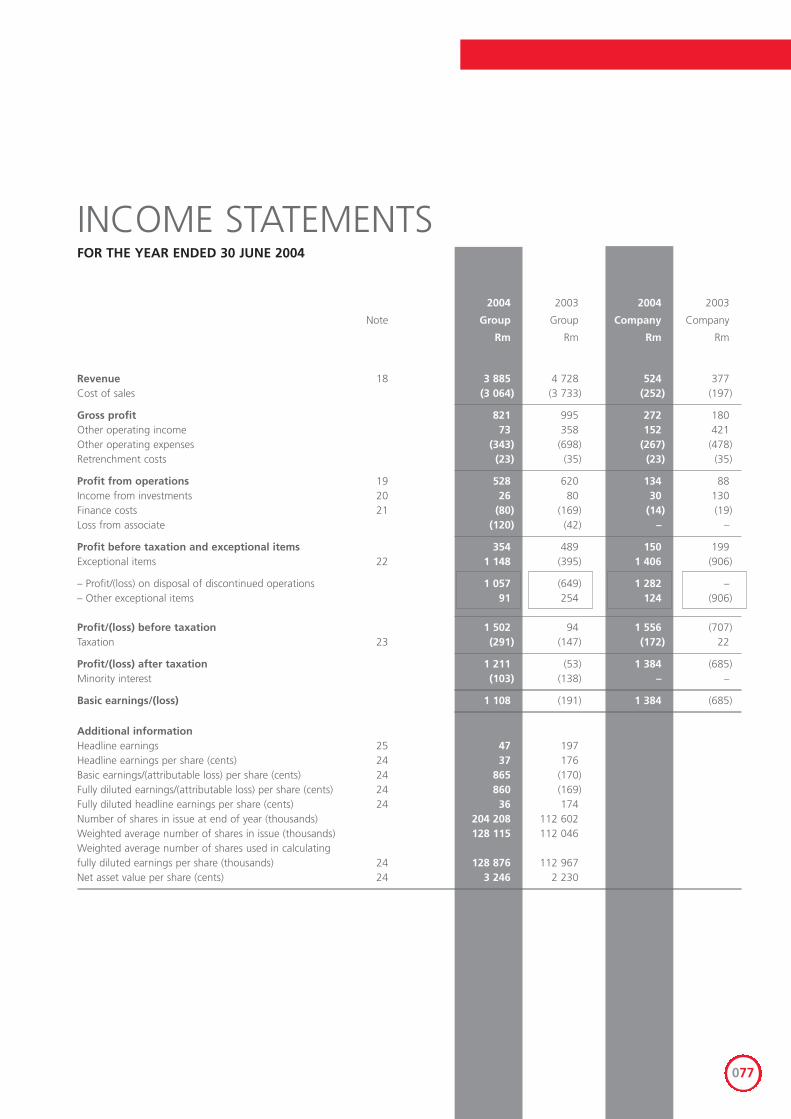
2004 2003 2004 2003
Note Group Group Company Company
Rm Rm Rm Rm
Revenue 18 3 885 4 728 524 377 Cost of sales (3 064) (3 733) (252) (197)
Gross profit 821 995 272 180 Other operating income 73 358 152 421Other operating expenses (343) (698) (267) (478)Retrenchment costs (23) (35) (23) (35)
Profit from operations 19 528 620 134 88 Income from investments 20 26 80 30 130 Finance costs 21 (80) (169) (14) (19)Loss from associate (120) (42) – –
Profit before taxation and exceptional items 354 489 150 199 Exceptional items 22 1 148 (395) 1 406 (906)
– Profit/(loss) on disposal of discontinued operations 1 057 (649) 1 282 – – Other exceptional items 91 254 124 (906)
Profit/(loss) before taxation 1 502 94 1 556 (707) Taxation 23 (291) (147) (172) 22
Profit/(loss) after taxation 1 211 (53) 1 384 (685)Minority interest (103) (138) – –
Basic earnings/(loss) 1 108 (191) 1 384 (685)
Additional information Headline earnings 25 47 197 Headline earnings per share (cents) 24 37 176 Basic earnings/(attributable loss) per share (cents) 24 865 (170)Fully diluted earnings/(attributable loss) per share (cents) 24 860 (169)Fully diluted headline earnings per share (cents) 24 36 174Number of shares in issue at end of year (thousands) 204 208 112 602 Weighted average number of shares in issue (thousands) 128 115 112 046 Weighted average number of shares used in calculating fully diluted earnings per share (thousands) 24 128 876 112 967 Net asset value per share (cents) 24 3 246 2 230
INCOME STATEMENTSFOR THE YEAR ENDED 30 JUNE 2004
077
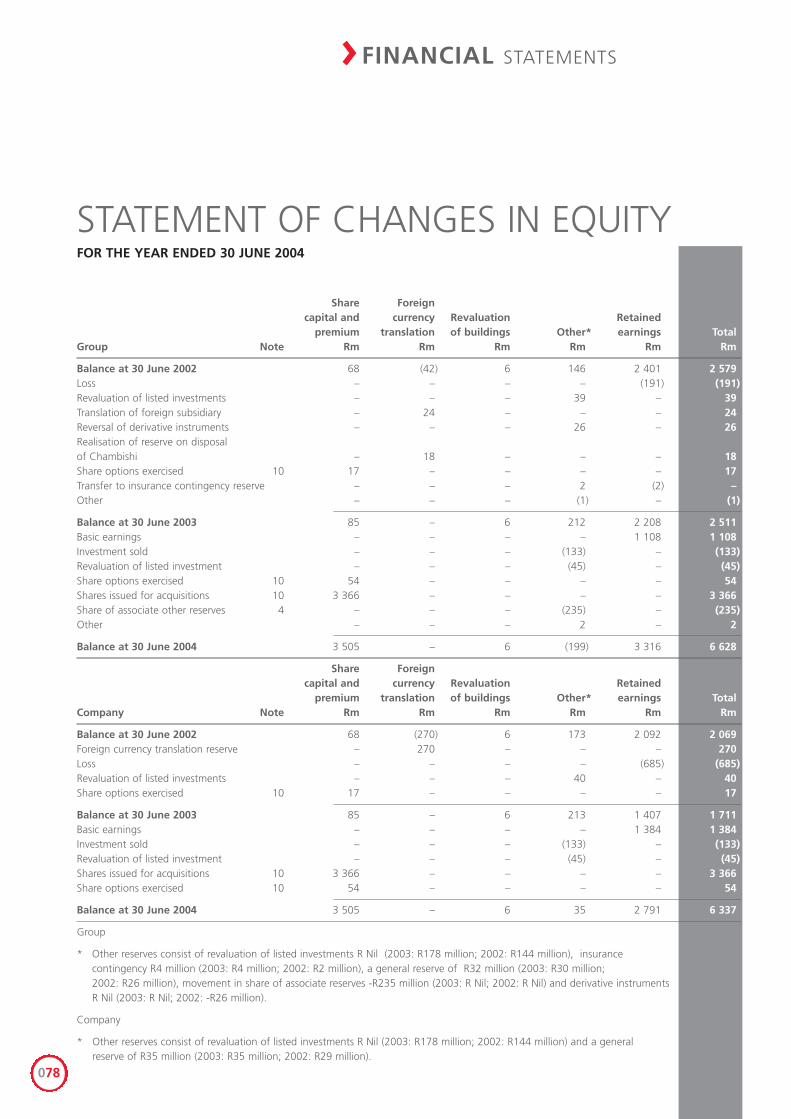
Share Foreign capital and currency Revaluation Retained
premium translation of buildings Other* earnings TotalGroup Note Rm Rm Rm Rm Rm Rm
Balance at 30 June 2002 68 (42) 6 146 2 401 2 579 Loss – – – – (191) (191)Revaluation of listed investments – – – 39 – 39 Translation of foreign subsidiary – 24 – – – 24 Reversal of derivative instruments – – – 26 – 26 Realisation of reserve on disposal of Chambishi – 18 – – – 18 Share options exercised 10 17 – – – – 17 Transfer to insurance contingency reserve – – – 2 (2) – Other – – – (1) – (1)
Balance at 30 June 2003 85 – 6 212 2 208 2 511 Basic earnings – – – – 1 108 1 108 Investment sold – – – (133) – (133)Revaluation of listed investment – – – (45) – (45)Share options exercised 10 54 – – – – 54 Shares issued for acquisitions 10 3 366 – – – – 3 366 Share of associate other reserves 4 – – – (235) – (235) Other – – – 2 – 2
Balance at 30 June 2004 3 505 – 6 (199) 3 316 6 628
Share Foreign capital and currency Revaluation Retained
premium translation of buildings Other* earnings TotalCompany Note Rm Rm Rm Rm Rm Rm
Balance at 30 June 2002 68 (270) 6 173 2 092 2 069 Foreign currency translation reserve – 270 – – – 270 Loss – – – – (685) (685)Revaluation of listed investments – – – 40 – 40 Share options exercised 10 17 – – – – 17
Balance at 30 June 2003 85 – 6 213 1 407 1 711 Basic earnings – – – – 1 384 1 384 Investment sold – – – (133) – (133)Revaluation of listed investment – – – (45) – (45)Shares issued for acquisitions 10 3 366 – – – – 3 366 Share options exercised 10 54 – – – – 54
Balance at 30 June 2004 3 505 – 6 35 2 791 6 337
Group
* Other reserves consist of revaluation of listed investments R Nil (2003: R178 million; 2002: R144 million), insurancecontingency R4 million (2003: R4 million; 2002: R2 million), a general reserve of R32 million (2003: R30 million; 2002: R26 million), movement in share of associate reserves -R235 million (2003: R Nil; 2002: R Nil) and derivative instruments R Nil (2003: R Nil; 2002: -R26 million).
Company
* Other reserves consist of revaluation of listed investments R Nil (2003: R178 million; 2002: R144 million) and a generalreserve of R35 million (2003: R35 million; 2002: R29 million).
STATEMENT OF CHANGES IN EQUITYFOR THE YEAR ENDED 30 JUNE 2004
> FINANCIAL STATEMENTS
078
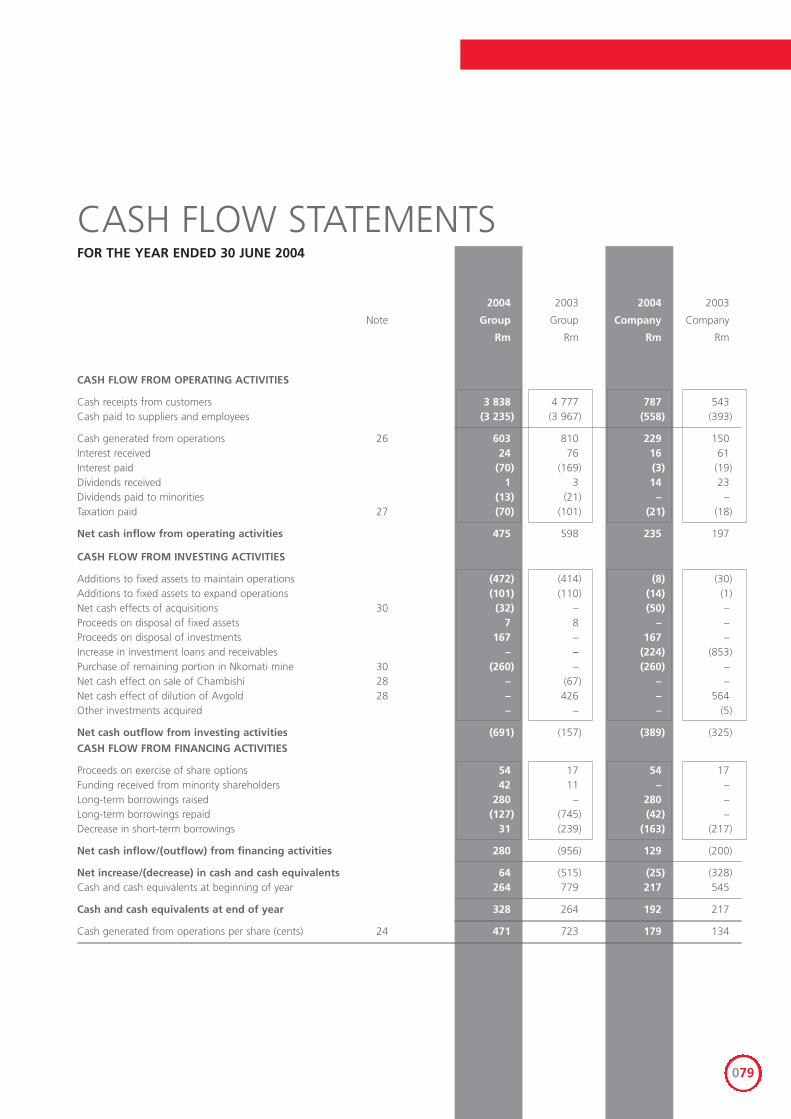
CASH FLOW STATEMENTS
2004 20042003 2004 2003
Note Group Group Company Company
Rm Rm Rm Rm
CASH FLOW FROM OPERATING ACTIVITIES
Cash receipts from customers 3 838 4 777 787 543 Cash paid to suppliers and employees (3 235) (3 967) (558) (393)
Cash generated from operations 26 603 810 229 150 Interest received 24 76 16 61 Interest paid (70) (169) (3) (19)Dividends received 1 3 14 23 Dividends paid to minorities (13) (21) – – Taxation paid 27 (70) (101) (21) (18)
Net cash inflow from operating activities 475 598 235 197
CASH FLOW FROM INVESTING ACTIVITIES
Additions to fixed assets to maintain operations (472) (414) (8) (30)Additions to fixed assets to expand operations (101) (110) (14) (1)Net cash effects of acquisitions 30 (32) – (50) – Proceeds on disposal of fixed assets 7 8 – – Proceeds on disposal of investments 167 – 167 – Increase in investment loans and receivables – – (224) (853)Purchase of remaining portion in Nkomati mine 30 (260) – (260) –Net cash effect on sale of Chambishi 28 – (67) – – Net cash effect of dilution of Avgold 28 – 426 – 564 Other investments acquired – – – (5)
Net cash outflow from investing activities (691) (157) (389) (325)
CASH FLOW FROM FINANCING ACTIVITIES
Proceeds on exercise of share options 54 17 54 17 Funding received from minority shareholders 42 11 – – Long-term borrowings raised 280 – 280 – Long-term borrowings repaid (127) (745) (42) – Decrease in short-term borrowings 31 (239) (163) (217)
Net cash inflow/(outflow) from financing activities 280 (956) 129 (200)
Net increase/(decrease) in cash and cash equivalents 64 (515) (25) (328)Cash and cash equivalents at beginning of year 264 779 217 545
Cash and cash equivalents at end of year 328 264 192 217
Cash generated from operations per share (cents) 24 471 723 179 134
FOR THE YEAR ENDED 30 JUNE 2004
079
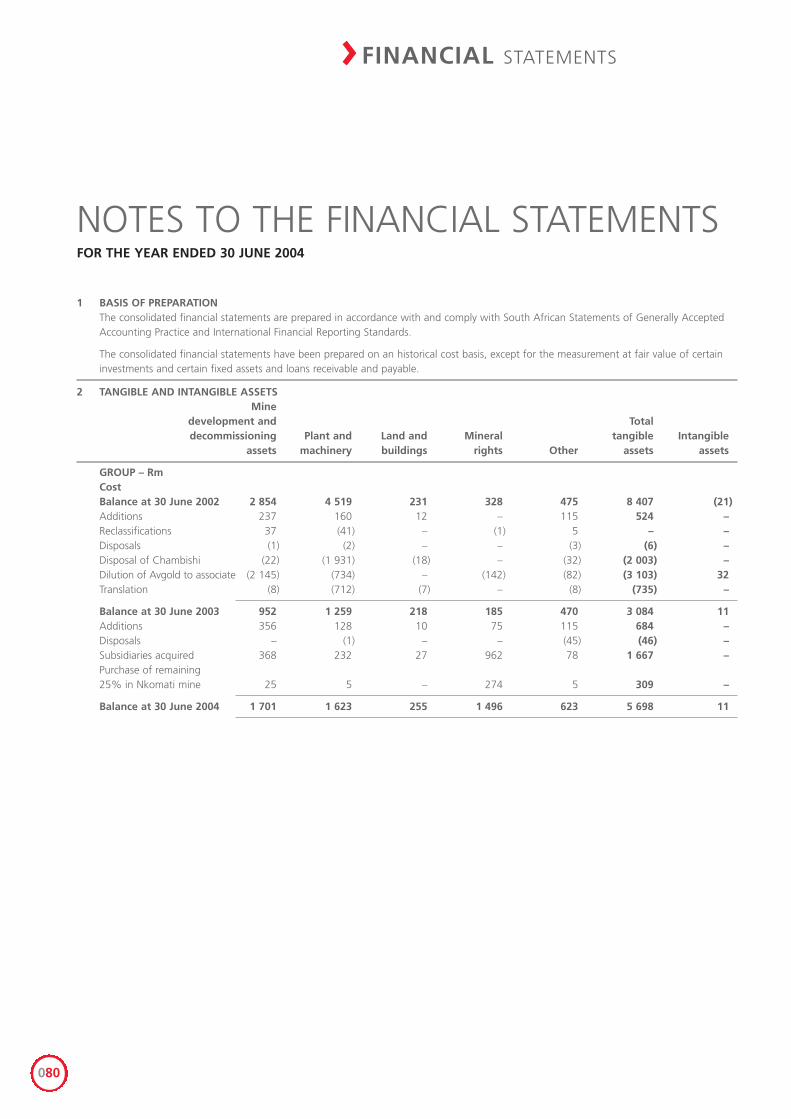
1 BASIS OF PREPARATIONThe consolidated financial statements are prepared in accordance with and comply with South African Statements of Generally AcceptedAccounting Practice and International Financial Reporting Standards.
The consolidated financial statements have been prepared on an historical cost basis, except for the measurement at fair value of certaininvestments and certain fixed assets and loans receivable and payable.
2 TANGIBLE AND INTANGIBLE ASSETS Mine
development and Total decommissioning Plant and Land and Mineral tangible Intangible
assets machinery buildings rights Other assets assets
GROUP – RmCostBalance at 30 June 2002 2 854 4 519 231 328 475 8 407 (21)Additions 237 160 12 – 115 524 – Reclassifications 37 (41) – (1) 5 – – Disposals (1) (2) – – (3) (6) – Disposal of Chambishi (22) (1 931) (18) – (32) (2 003) – Dilution of Avgold to associate (2 145) (734) – (142) (82) (3 103) 32 Translation (8) (712) (7) – (8) (735) –
Balance at 30 June 2003 952 1 259 218 185 470 3 084 11Additions 356 128 10 75 115 684 – Disposals – (1) – – (45) (46) – Subsidiaries acquired 368 232 27 962 78 1 667 – Purchase of remaining 25% in Nkomati mine 25 5 – 274 5 309 –
Balance at 30 June 2004 1 701 1 623 255 1 496 623 5 698 11
NOTES TO THE FINANCIAL STATEMENTSFOR THE YEAR ENDED 30 JUNE 2004
> FINANCIAL STATEMENTS
080
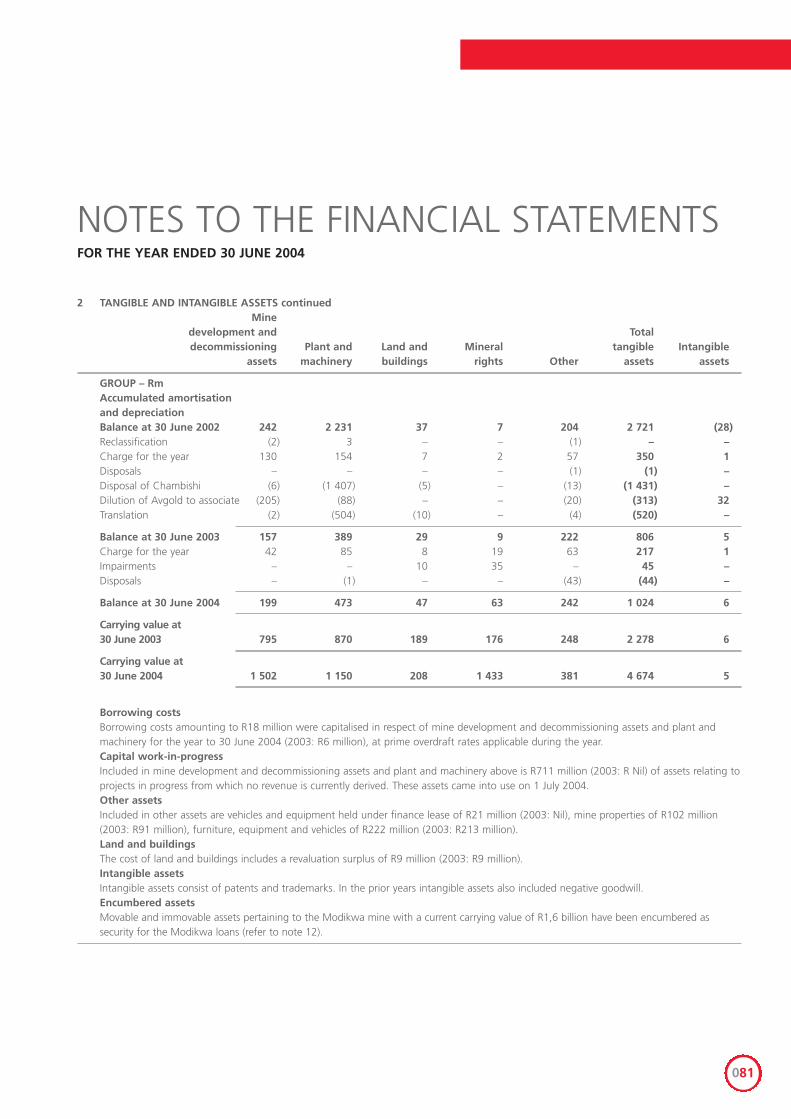
2 TANGIBLE AND INTANGIBLE ASSETS continued Mine
development and Total decommissioning Plant and Land and Mineral tangible Intangible
assets machinery buildings rights Other assets assets
GROUP – RmAccumulated amortisation and depreciationBalance at 30 June 2002 242 2 231 37 7 204 2 721 (28)Reclassification (2) 3 – – (1) – – Charge for the year 130 154 7 2 57 350 1 Disposals – – – – (1) (1) – Disposal of Chambishi (6) (1 407) (5) – (13) (1 431) – Dilution of Avgold to associate (205) (88) – – (20) (313) 32 Translation (2) (504) (10) – (4) (520) –
Balance at 30 June 2003 157 389 29 9 222 806 5Charge for the year 42 85 8 19 63 217 1 Impairments – – 10 35 – 45 – Disposals – (1) – – (43) (44) –
Balance at 30 June 2004 199 473 47 63 242 1 024 6
Carrying value at 30 June 2003 795 870 189 176 248 2 278 6
Carrying value at 30 June 2004 1 502 1 150 208 1 433 381 4 674 5
Borrowing costs Borrowing costs amounting to R18 million were capitalised in respect of mine development and decommissioning assets and plant andmachinery for the year to 30 June 2004 (2003: R6 million), at prime overdraft rates applicable during the year.Capital work-in-progress Included in mine development and decommissioning assets and plant and machinery above is R711 million (2003: R Nil) of assets relating toprojects in progress from which no revenue is currently derived. These assets came into use on 1 July 2004.Other assets Included in other assets are vehicles and equipment held under finance lease of R21 million (2003: Nil), mine properties of R102 million(2003: R91 million), furniture, equipment and vehicles of R222 million (2003: R213 million).Land and buildingsThe cost of land and buildings includes a revaluation surplus of R9 million (2003: R9 million).Intangible assetsIntangible assets consist of patents and trademarks. In the prior years intangible assets also included negative goodwill. Encumbered assetsMovable and immovable assets pertaining to the Modikwa mine with a current carrying value of R1,6 billion have been encumbered assecurity for the Modikwa loans (refer to note 12).
NOTES TO THE FINANCIAL STATEMENTSFOR THE YEAR ENDED 30 JUNE 2004
081
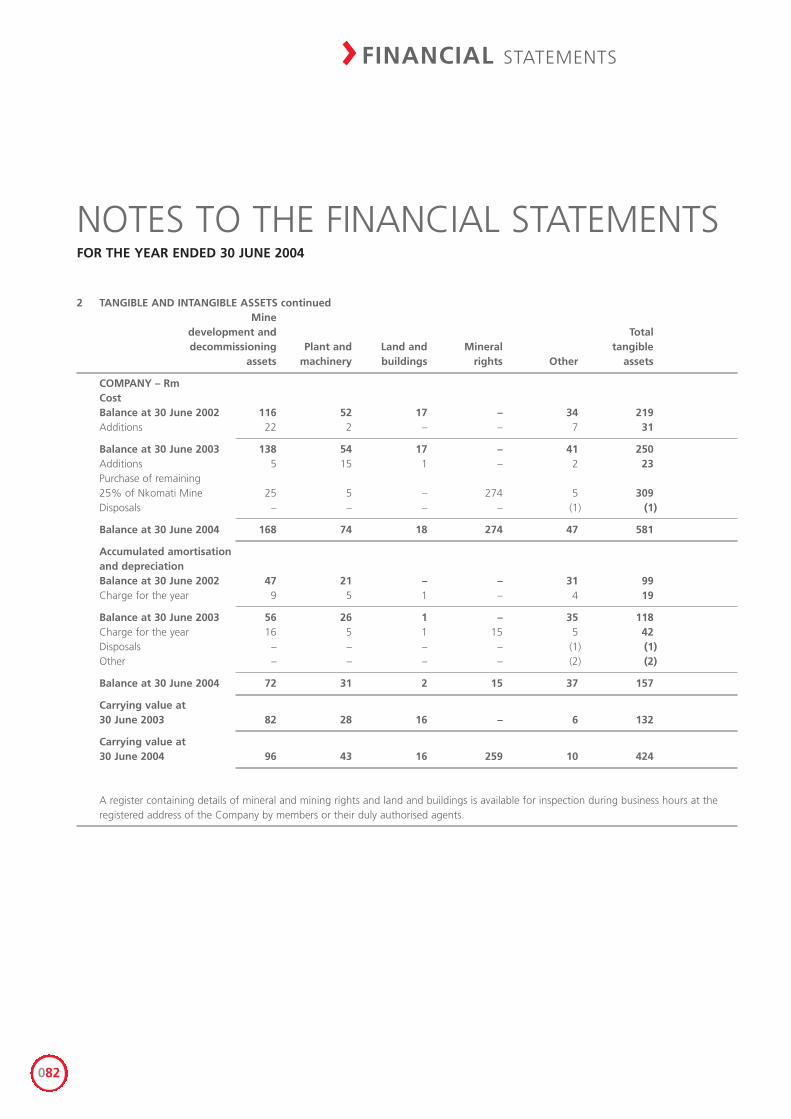
2 TANGIBLE AND INTANGIBLE ASSETS continuedMine
development and Total decommissioning Plant and Land and Mineral tangible
assets machinery buildings rights Other assets
COMPANY – Rm CostBalance at 30 June 2002 116 52 17 – 34 219 Additions 22 2 – – 7 31
Balance at 30 June 2003 138 54 17 – 41 250Additions 5 15 1 – 2 23 Purchase of remaining 25% of Nkomati Mine 25 5 – 274 5 309Disposals – – – – (1) (1)
Balance at 30 June 2004 168 74 18 274 47 581
Accumulated amortisation and depreciationBalance at 30 June 2002 47 21 – – 31 99 Charge for the year 9 5 1 – 4 19
Balance at 30 June 2003 56 26 1 – 35 118 Charge for the year 16 5 1 15 5 42 Disposals – – – – (1) (1)Other – – – – (2) (2)
Balance at 30 June 2004 72 31 2 15 37 157
Carrying value at 30 June 2003 82 28 16 – 6 132
Carrying value at 30 June 2004 96 43 16 259 10 424
A register containing details of mineral and mining rights and land and buildings is available for inspection during business hours at theregistered address of the Company by members or their duly authorised agents.
NOTES TO THE FINANCIAL STATEMENTSFOR THE YEAR ENDED 30 JUNE 2004
> FINANCIAL STATEMENTS
082
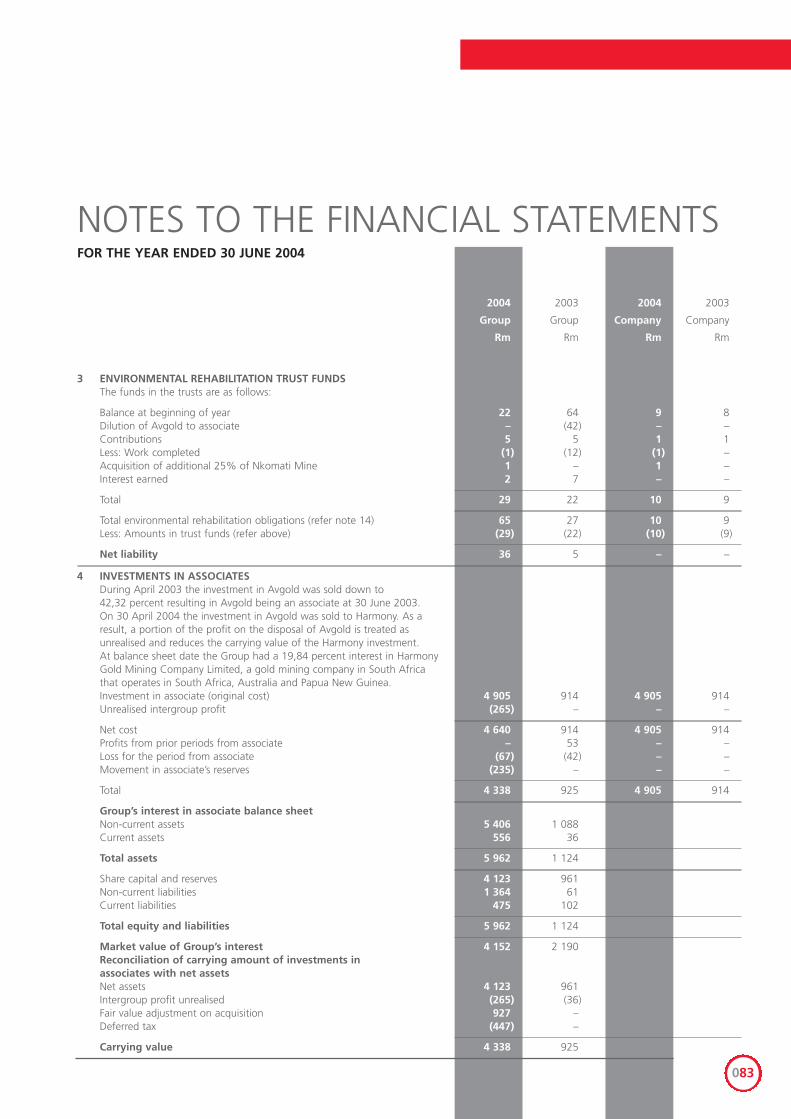
2004 2003 2004 2003
Group Group Company Company
Rm Rm Rm Rm
3 ENVIRONMENTAL REHABILITATION TRUST FUNDSThe funds in the trusts are as follows:
Balance at beginning of year 22 64 9 8 Dilution of Avgold to associate – (42) – –Contributions 5 5 1 1 Less: Work completed (1) (12) (1) – Acquisition of additional 25% of Nkomati Mine 1 – 1 – Interest earned 2 7 – –
Total 29 22 10 9
Total environmental rehabilitation obligations (refer note 14) 65 65 27 10 9 Less: Amounts in trust funds (refer above) (29) (22) (10) (9)
Net liability 36 5 – –
4 INVESTMENTS IN ASSOCIATES During April 2003 the investment in Avgold was sold down to 42,32 percent resulting in Avgold being an associate at 30 June 2003. On 30 April 2004 the investment in Avgold was sold to Harmony. As aresult, a portion of the profit on the disposal of Avgold is treated as unrealised and reduces the carrying value of the Harmony investment.At balance sheet date the Group had a 19,84 percent interest in Harmony Gold Mining Company Limited, a gold mining company in South Africathat operates in South Africa, Australia and Papua New Guinea.Investment in associate (original cost) 4 905 914 4 905 914Unrealised intergroup profit (265) – – –
Net cost 4 640 914 4 905 914Profits from prior periods from associate – 53 – –Loss for the period from associate (67) (42) – –Movement in associate’s reserves (235) – – –
Total 4 338 925 4 905 914
Group’s interest in associate balance sheet Non-current assets 5 406 1 088 Current assets 556 36
Total assets 5 962 1 124
Share capital and reserves 4 123 961 Non-current liabilities 1 364 61 Current liabilities 475 102
Total equity and liabilities 5 962 1 124
Market value of Group’s interest 4 152 2 190 Reconciliation of carrying amount of investments in associates with net assetsNet assets 4 123 961 Intergroup profit unrealised (265) (36)Fair value adjustment on acquisition 927 – Deferred tax (447) –
Carrying value 4 338 925
NOTES TO THE FINANCIAL STATEMENTSFOR THE YEAR ENDED 30 JUNE 2004
083
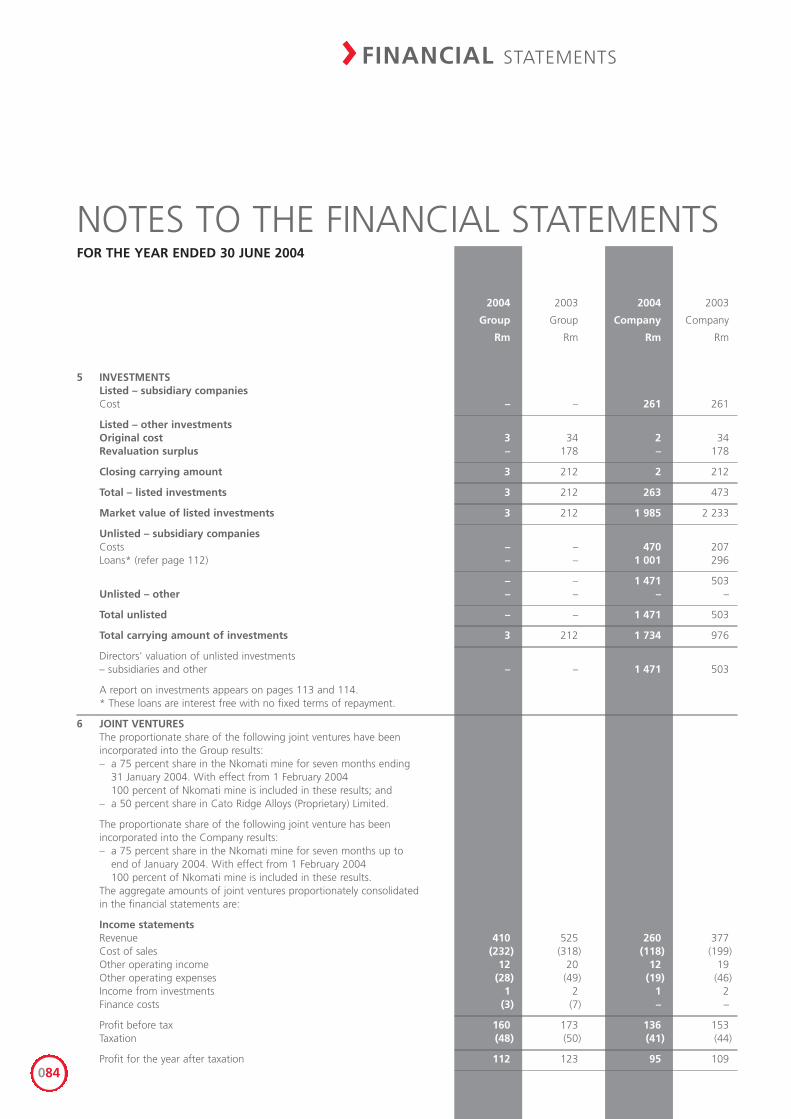
2004 2003 2004 2003
Group Group Company Company
Rm Rm Rm Rm
5 INVESTMENTS Listed – subsidiary companiesCost – – 261 261
Listed – other investments Original cost 3 34 2 34Revaluation surplus – 178 – 178
Closing carrying amount 3 212 2 212
Total – listed investments 3 212 263 473
Market value of listed investments 3 212 1 985 2 233
Unlisted – subsidiary companiesCosts – – 470 207 Loans* (refer page 112) – – 1 001 296
– – 1 471 503 Unlisted – other – – – –
Total unlisted – – 1 471 503
Total carrying amount of investments 3 212 1 734 976
Directors' valuation of unlisted investments– subsidiaries and other – – 1 471 503
A report on investments appears on pages 113 and 114. * These loans are interest free with no fixed terms of repayment.
6 JOINT VENTURESThe proportionate share of the following joint ventures have been incorporated into the Group results:– a 75 percent share in the Nkomati mine for seven months ending
31 January 2004. With effect from 1 February 2004100 percent of Nkomati mine is included in these results; and
– a 50 percent share in Cato Ridge Alloys (Proprietary) Limited.
The proportionate share of the following joint venture has been incorporated into the Company results: – a 75 percent share in the Nkomati mine for seven months up to
end of January 2004. With effect from 1 February 2004 100 percent of Nkomati mine is included in these results.
The aggregate amounts of joint ventures proportionately consolidated in the financial statements are:
Income statements Revenue 410 525 260 377 Cost of sales (232) (318) (118) (199)Other operating income 12 20 12 19 Other operating expenses (28) (49) (19) (46) Income from investments 1 2 1 2 Finance costs (3) (7) – –
Profit before tax 160 173 136 153 Taxation (48) (50) (41) (44)
Profit for the year after taxation 112 123 95 109
NOTES TO THE FINANCIAL STATEMENTSFOR THE YEAR ENDED 30 JUNE 2004
> FINANCIAL STATEMENTS
084

2004 2003 2004 2003
Group Group Company Company
Rm Rm Rm Rm
6 JOINT VENTURES continuedBalance sheets Non-current assets 27 145 – 116 Current assets 86 185 – 111 Non-current liabilities (non-interest bearing) – 28 – 28 Current liabilities 48 86 – 26
Cash flow statements Net cash inflow from operating activities 26 230 9 209 Net cash outflow from investing activities (3) (31) (5) (30)Net cash outflow from financing activities (19) (21) – –
Commitments and contingent liabilities Commitments – 3 – 2 Contingent liabilities – 7 – 7
7 INVENTORIESConsumable stores 65 62 2 1 Raw material 526 425 – – Work-in-progress 23 18 23 18 Finished goods 300 344 – –
914 849 25 19
8 TRADE AND OTHER RECEIVABLESTrade 993 777 79 92Other 169 123 10 77
1 162 900 89 169
9 CASH AND CASH EQUIVALENTSCash at bank and on deposit 320 264 192 217Restricted cash* 8 – – –
328 264 192 217
Cash at bank and on deposit earns interest at floating rates based on daily bank deposit rates.* The cash and cash equivalents have been pledged as security for
loans granted to the ARM Mining Consortium Limited.
NOTES TO THE FINANCIAL STATEMENTSFOR THE YEAR ENDED 30 JUNE 2004
085
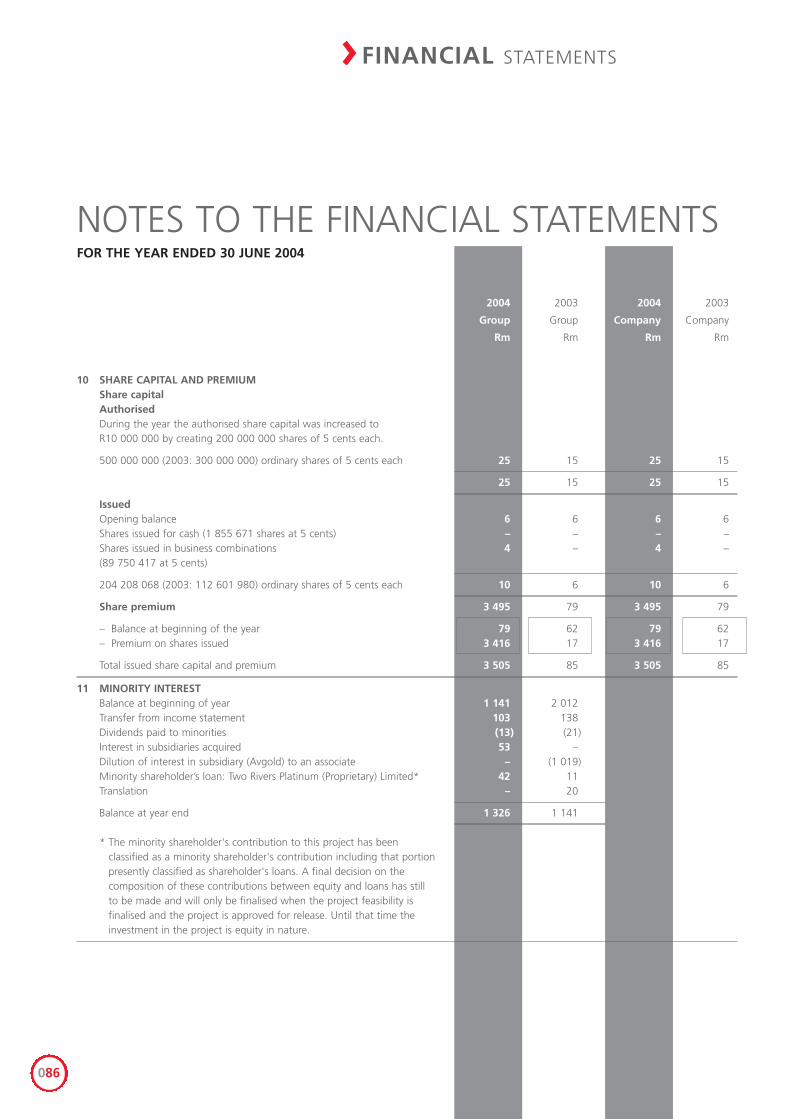
2004 2003 2004 2003
Group Group Company Company
Rm Rm Rm Rm
10 SHARE CAPITAL AND PREMIUMShare capitalAuthorisedDuring the year the authorised share capital was increased to R10 000 000 by creating 200 000 000 shares of 5 cents each.
500 000 000 (2003: 300 000 000) ordinary shares of 5 cents each 25 15 25 15
25 15 25 15
Issued Opening balance 6 6 6 6 Shares issued for cash (1 855 671 shares at 5 cents) – – – –Shares issued in business combinations 4 – 4 –(89 750 417 at 5 cents)
204 208 068 (2003: 112 601 980) ordinary shares of 5 cents each 10 6 10 6
Share premium 3 495 79 3 495 79
– Balance at beginning of the year 79 62 79 62 – Premium on shares issued 3 416 17 3 416 17
Total issued share capital and premium 3 505 85 3 505 85
11 MINORITY INTEREST Balance at beginning of year 1 141 2 012 Transfer from income statement 103 138 Dividends paid to minorities (13) (21)Interest in subsidiaries acquired 53 – Dilution of interest in subsidiary (Avgold) to an associate – (1 019)Minority shareholder’s loan: Two Rivers Platinum (Proprietary) Limited* 42 11 Translation – 20
Balance at year end 1 326 1 141
* The minority shareholder's contribution to this project has been classified as a minority shareholder's contribution including that portionpresently classified as shareholder's loans. A final decision on the composition of these contributions between equity and loans has still to be made and will only be finalised when the project feasibility is finalised and the project is approved for release. Until that time the investment in the project is equity in nature.
NOTES TO THE FINANCIAL STATEMENTSFOR THE YEAR ENDED 30 JUNE 2004
> FINANCIAL STATEMENTS
086

2004 2003 2004 2003
Group Group Company Company
Rm Rm Rm Rm
12 LONG-TERM BORROWINGS SA Rand long-term borrowingsSecured loans Loan facility 1 (Modikwa mine) 495 – – – This loan bears interest at a fixed rate of 15,99 percent compoundedon a monthly basis. Repayments are made in bi-annual instalments, commencing on 30 June 2003 and ending 30 June 2010.
Loan facility 2 (Modikwa mine) 137 – – – This loan bears interest at a fixed rate of 16,99 percent, plus a profit share of 0,3 percent of the net operating cash flow after capital expenditure. This interest is compounded on a monthly basis. Repayments are made in bi-annual instalments,commencing on 30 June 2003 and ending 30 June 2010.
Loan facility 3 (Modikwa mine) 53 – – – This loan bears interest at variable rates, plus a profit share of 0,75 percent of the net operating cash flow after capital expenditure. R15,3 million bears interest at a 16,74 percent nominal annual rate compounded on a monthly basis and the remaining R37,7 million bears interest at a 14,24 percent nominal annual rate compounded on a monthly basis. Interest payments are made in bi-annual instalments commencing on 30 June 2003 and ending on 30 June 2010. Capital repayments are envisaged to commence on 31 December 2004 in twelve equal bi-annual instalments.
As security for the Modikwa loans bonds, pledges and charges over mineralrights, mining titles and movable and immovable assets have been registeredin favour of the lenders. The 50 percent stake in the Modikwa Platinum mine Joint Venture is also included in the security given.
ARM, for so long as the ARM Mining Consortium is indebted to the lenders(a) will not accept payment of their claims from the Consortium (except forclaims arising under their consultancy agreement), (b) subordinates all itsloans and claims against the Consortium and (c) will not dispose of, cede,or encumber its claims against the Consortium without the prior writtenconsent of the lenders.
Preference shares 50 – – – On 10 July 2002, ARM Mining Consortium Limited (“Consortium”) issued 50 000 000 cumulative, redeemable, convertible preference shares with a par value of R0,01 per share, at R1,00 per share. The preference shares are redeemable after a period of ten years from the date of issue. The preference shares can be redeemed at the option of the Consortium at any time after one year from the date of issue. The preference shares will become redeemable earlier than ten years if the Group is in breach of certain obligations in terms of its other borrowings. The preference shares are convertible into ordinary shares at any time after a period of three years from the date of issue, at the option of the preference shareholder. The existing shareholders of the Consortium have the option to take up the converted shares at an agreed price within 90 days fromconversion. The first dividend is payable for the period from date of issue to 30 June 2004 and is subject to the contractual arrangements of the subordination agreement. Thereafter, the dividend is payable six-monthly in arrears.
NOTES TO THE FINANCIAL STATEMENTSFOR THE YEAR ENDED 30 JUNE 2004
087
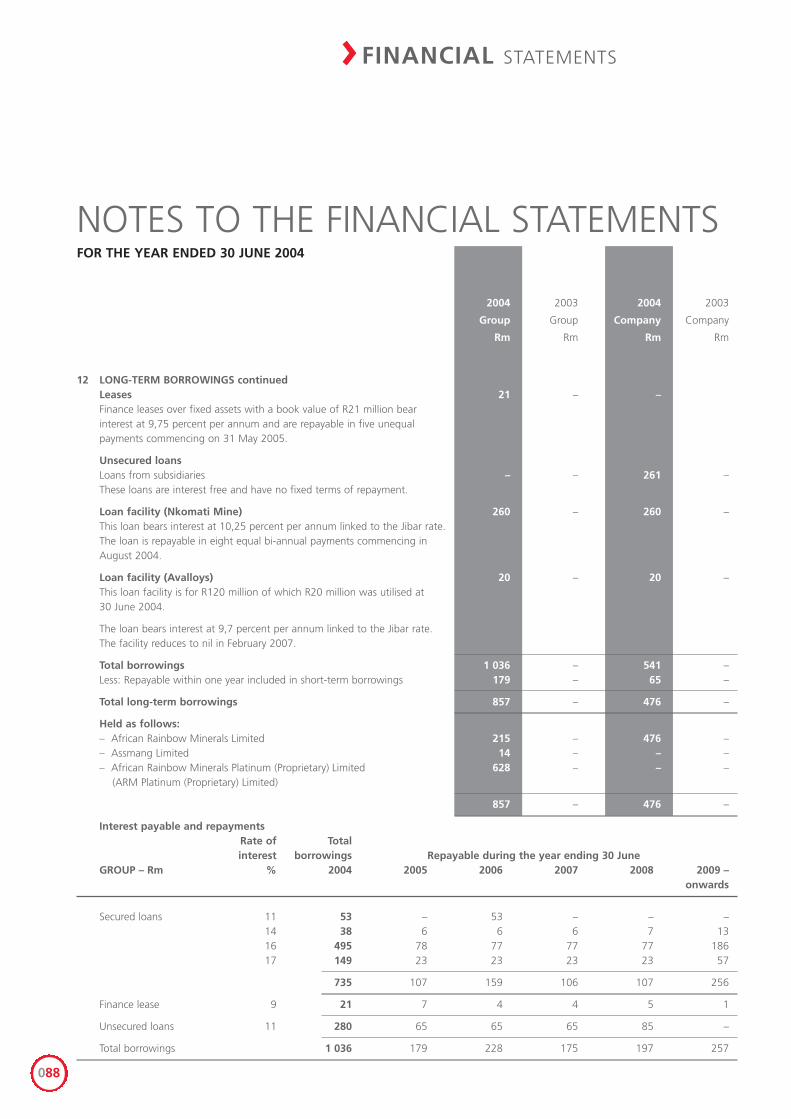
2004 2003 2004 2003
Group Group Company Company
Rm Rm Rm Rm
12 LONG-TERM BORROWINGS continuedLeases 21 – – Finance leases over fixed assets with a book value of R21 million bearinterest at 9,75 percent per annum and are repayable in five unequal payments commencing on 31 May 2005.
Unsecured loansLoans from subsidiaries – – 261 – These loans are interest free and have no fixed terms of repayment.
Loan facility (Nkomati Mine) 260 – 260 –This loan bears interest at 10,25 percent per annum linked to the Jibar rate. The loan is repayable in eight equal bi-annual payments commencing in August 2004.
Loan facility (Avalloys) 20 20 – 20 –This loan facility is for R120 million of which R20 million was utilised at 30 June 2004.
The loan bears interest at 9,7 percent per annum linked to the Jibar rate.The facility reduces to nil in February 2007.
Total borrowings 1 036 – 541 – Less: Repayable within one year included in short-term borrowings 179 – 65 –
Total long-term borrowings 857 – 476 –
Held as follows: – African Rainbow Minerals Limited 215 – 476 – – Assmang Limited 14 – – – – African Rainbow Minerals Platinum (Proprietary) Limited 628 – – –
(ARM Platinum (Proprietary) Limited)
857 – 476 –
Interest payable and repayments Rate of Total interest borrowings Repayable during the year ending 30 June
GROUP – Rm % 2004 2005 2006 2007 2008 2009 – onwards
Secured loans 11 53 – 53 – – –14 38 6 6 6 7 13 16 495 78 77 77 77 18617 149 23 23 23 23 57
735 107 159 106 107 256
Finance lease 9 21 7 4 4 5 1
Unsecured loans 11 280 65 65 65 85 –
Total borrowings 1 036 179 228 175 197 257
NOTES TO THE FINANCIAL STATEMENTSFOR THE YEAR ENDED 30 JUNE 2004
> FINANCIAL STATEMENTS
088

2004 2003 2004 2003
Group Group Company Company
Rm Rm Rm Rm
13 DEFERRED TAXATION Deferred tax asset Valuation of inventories – 3 – – Provisions raised 7 4 – – Assessed loss – 5 – –
Net deferred tax asset 7 12 – –
Deferred tax liability Tangible assets 864 485 167 29 Provisions (10) (10) (1) (3)Investments 107 – 107 –Fair value adjustment – Modikwa assessed loss (74) – – – Liabilities for healthcare benefits (26) (21) (21) (20)Other (8) 65 – 58
Deferred tax liability 853 519 252 64
Reconciliation of opening and closing balance Opening deferred tax liability 519 493 64 106 Opening deferred tax asset (12) (38) – –
Net deferred tax liability – opening balance 507 455 64 106 Temporary differences from: 339 52 188 (42)
– Tangible assets 379 59 138 (2)– Assessed loss (69) 9 – – – Provisions (3) (1) 2 (1)– Investments 94 – 107 –– Healthcare benefits (5) (1) (1) (1)– Inventories 3 – – –– Write-off of deferred tax asset – 24 – – – Foreign exchange profit – (48) – (48)– Other (60) 10 (58) 10
– Deferred tax liability 853 519 252 64 – Deferred tax asset (7) (12) – –
Net deferred tax liability – closing balance 846 507 252 64
Deferred tax balances are shown net of deferred tax assets and deferred tax liabilities where a legal right of offset exists at settlement.
NOTES TO THE FINANCIAL STATEMENTSFOR THE YEAR ENDED 30 JUNE 2004
089
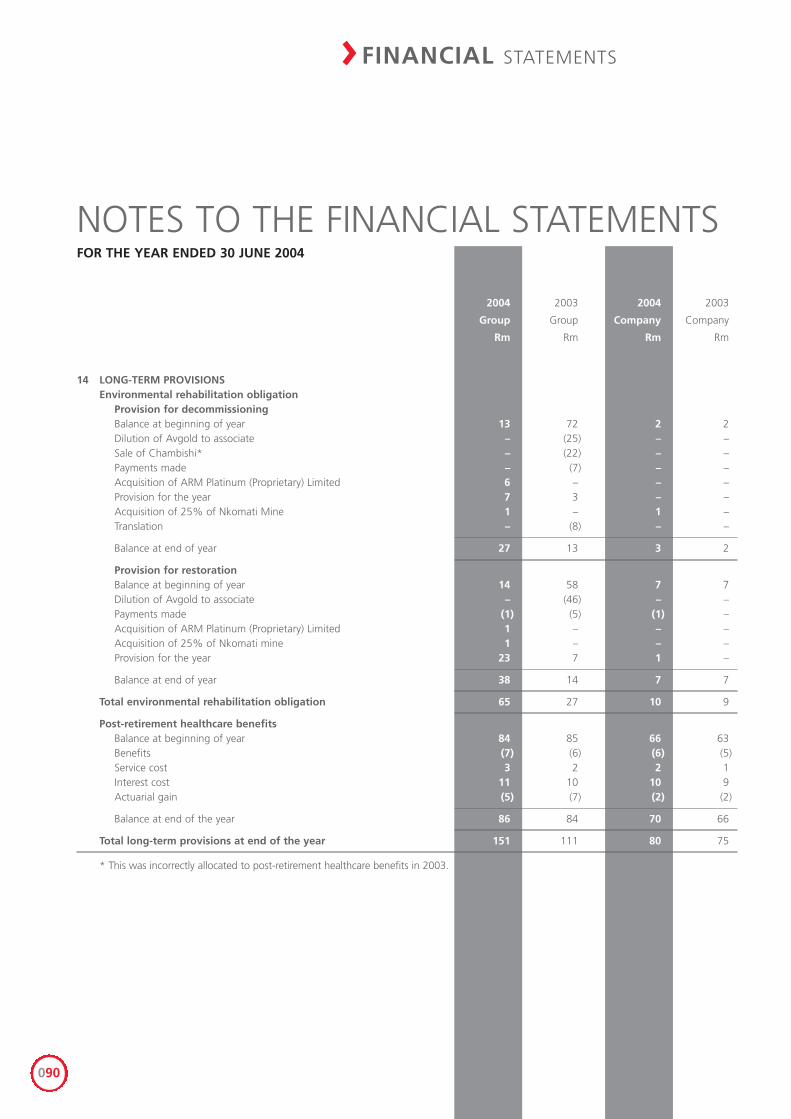
2004 2003 2004 2003
Group Group Company Company
Rm Rm Rm Rm
14 LONG-TERM PROVISIONS Environmental rehabilitation obligation
Provision for decommissioningBalance at beginning of year 13 72 2 2 Dilution of Avgold to associate – (25) – – Sale of Chambishi* – (22) – – Payments made – (7) – – Acquisition of ARM Platinum (Proprietary) Limited 6 – – – Provision for the year 7 3 – – Acquisition of 25% of Nkomati Mine 1 – 1 – Translation – (8) – –
Balance at end of year 27 13 3 2
Provision for restorationBalance at beginning of year 14 58 7 7 Dilution of Avgold to associate – (46) – – Payments made (1) (5) (1) – Acquisition of ARM Platinum (Proprietary) Limited 1 – – – Acquisition of 25% of Nkomati mine 1 – – – Provision for the year 23 7 1 –
Balance at end of year 38 14 7 7
Total environmental rehabilitation obligation 65 27 10 9
Post-retirement healthcare benefitsBalance at beginning of year 84 85 66 63 Benefits (7) (6) (6) (5)Service cost 3 2 2 1Interest cost 11 10 10 9Actuarial gain (5) (7) (2) (2)
Balance at end of the year 86 84 70 66
Total long-term provisions at end of the year 151 111 80 75
* This was incorrectly allocated to post-retirement healthcare benefits in 2003.
NOTES TO THE FINANCIAL STATEMENTSFOR THE YEAR ENDED 30 JUNE 2004
> FINANCIAL STATEMENTS
090
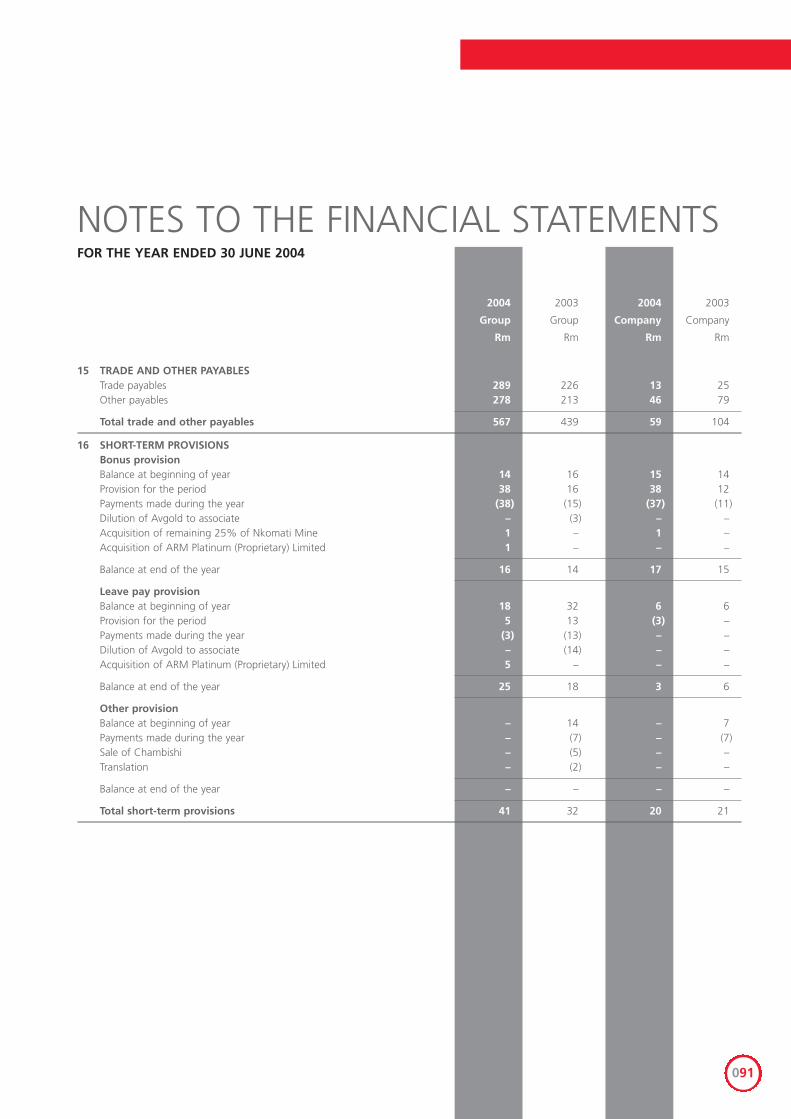
2004 2003 2004 2003
Group Group Company Company
Rm Rm Rm Rm
15 TRADE AND OTHER PAYABLESTrade payables 289 226 13 25 Other payables 278 213 46 79
Total trade and other payables 567 439 59 104
16 SHORT-TERM PROVISIONSBonus provisionBalance at beginning of year 14 16 15 14 Provision for the period 38 16 38 12 Payments made during the year (38) (15) (37) (11)Dilution of Avgold to associate – (3) – – Acquisition of remaining 25% of Nkomati Mine 1 – 1 – Acquisition of ARM Platinum (Proprietary) Limited 1 – – –
Balance at end of the year 16 14 17 15
Leave pay provisionBalance at beginning of year 18 32 6 6 Provision for the period 5 13 (3) –Payments made during the year (3) (13) – – Dilution of Avgold to associate – (14) – – Acquisition of ARM Platinum (Proprietary) Limited 5 – – –
Balance at end of the year 25 18 3 6
Other provisionBalance at beginning of year – 14 – 7 Payments made during the year – (7) – (7)Sale of Chambishi – (5) – – Translation – (2) – –
Balance at end of the year – – – –
Total short-term provisions 41 32 20 21
NOTES TO THE FINANCIAL STATEMENTSFOR THE YEAR ENDED 30 JUNE 2004
091
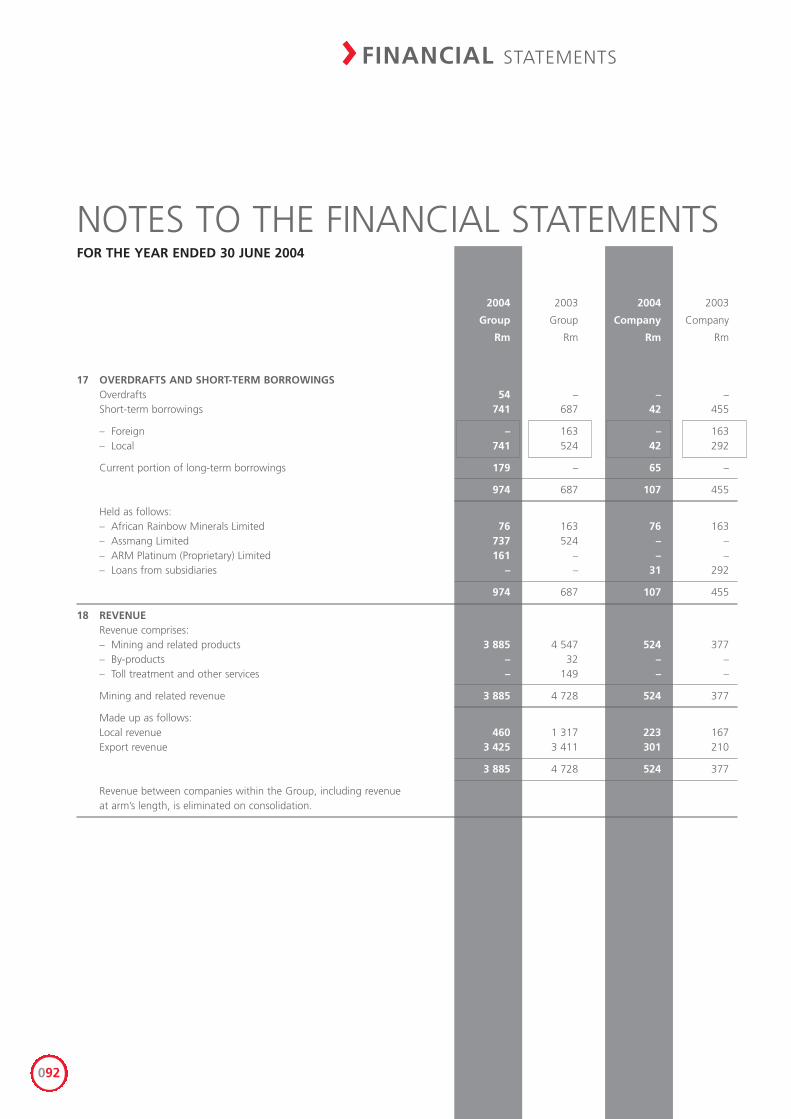
2004 2003 2004 2003
Group Group Company Company
Rm Rm Rm Rm
17 OVERDRAFTS AND SHORT-TERM BORROWINGSOverdrafts 54 – – – Short-term borrowings 741 687 42 455
– Foreign – 163 – 163 – Local 741 524 42 292
Current portion of long-term borrowings 179 – 65 –
974 687 107 455
Held as follows:– African Rainbow Minerals Limited 76 163 76 163 – Assmang Limited 737 524 – – – ARM Platinum (Proprietary) Limited 161 – – – – Loans from subsidiaries – – 31 292
974 687 107 455
18 REVENUERevenue comprises:– Mining and related products 3 885 4 547 524 377 – By-products – 32 – – – Toll treatment and other services – 149 – –
Mining and related revenue 3 885 4 728 524 377
Made up as follows:Local revenue 460 1 317 223 167 Export revenue 3 425 3 411 301 210
3 885 4 728 524 377
Revenue between companies within the Group, including revenueat arm’s length, is eliminated on consolidation.
NOTES TO THE FINANCIAL STATEMENTSFOR THE YEAR ENDED 30 JUNE 2004
> FINANCIAL STATEMENTS
092
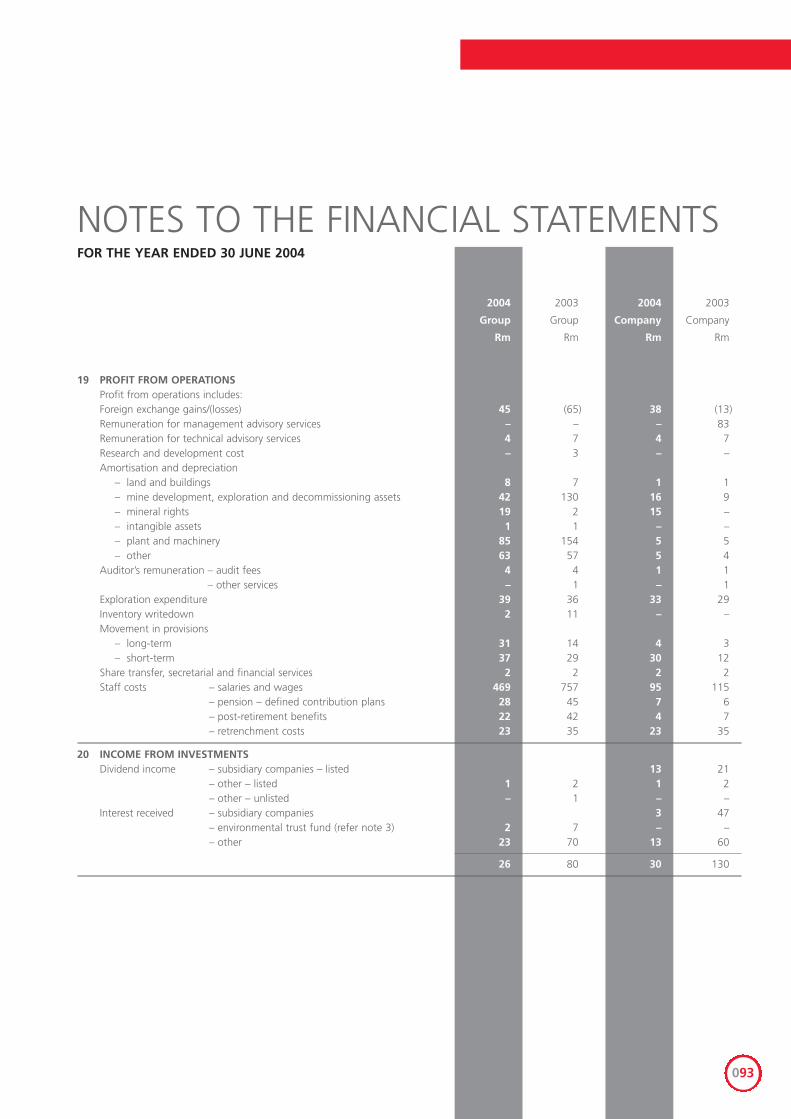
2004 2003 2004 2003
Group Group Company Company
Rm Rm Rm Rm
19 PROFIT FROM OPERATIONSProfit from operations includes:Foreign exchange gains/(losses) 45 (65) 38 (13) Remuneration for management advisory services – – – 83 Remuneration for technical advisory services 4 7 4 7 Research and development cost – 3 – –Amortisation and depreciation
– land and buildings 8 7 1 1 – mine development, exploration and decommissioning assets 42 130 16 9 – mineral rights 19 2 15 – – intangible assets 1 1 – – – plant and machinery 85 154 5 5 – other 63 57 5 4
Auditor’s remuneration – audit fees 4 4 1 1– other services – 1 – 1
Exploration expenditure 39 36 33 29 Inventory writedown 2 11 – – Movement in provisions
– long-term 31 14 4 3 – short-term 37 29 30 12
Share transfer, secretarial and financial services 2 2 2 2 Staff costs – salaries and wages 469 757 95 115
– pension – defined contribution plans 28 45 7 6 – post-retirement benefits 22 42 4 7 – retrenchment costs 23 35 23 35
20 INCOME FROM INVESTMENTSDividend income – subsidiary companies – listed – 13 21
– other – listed 1 2 1 2 – other – unlisted – 1 – –
Interest received – subsidiary companies 3 47 – environmental trust fund (refer note 3) 2 7 – –– other 23 70 13 60
26 80 30 130
NOTES TO THE FINANCIAL STATEMENTSFOR THE YEAR ENDED 30 JUNE 2004
093
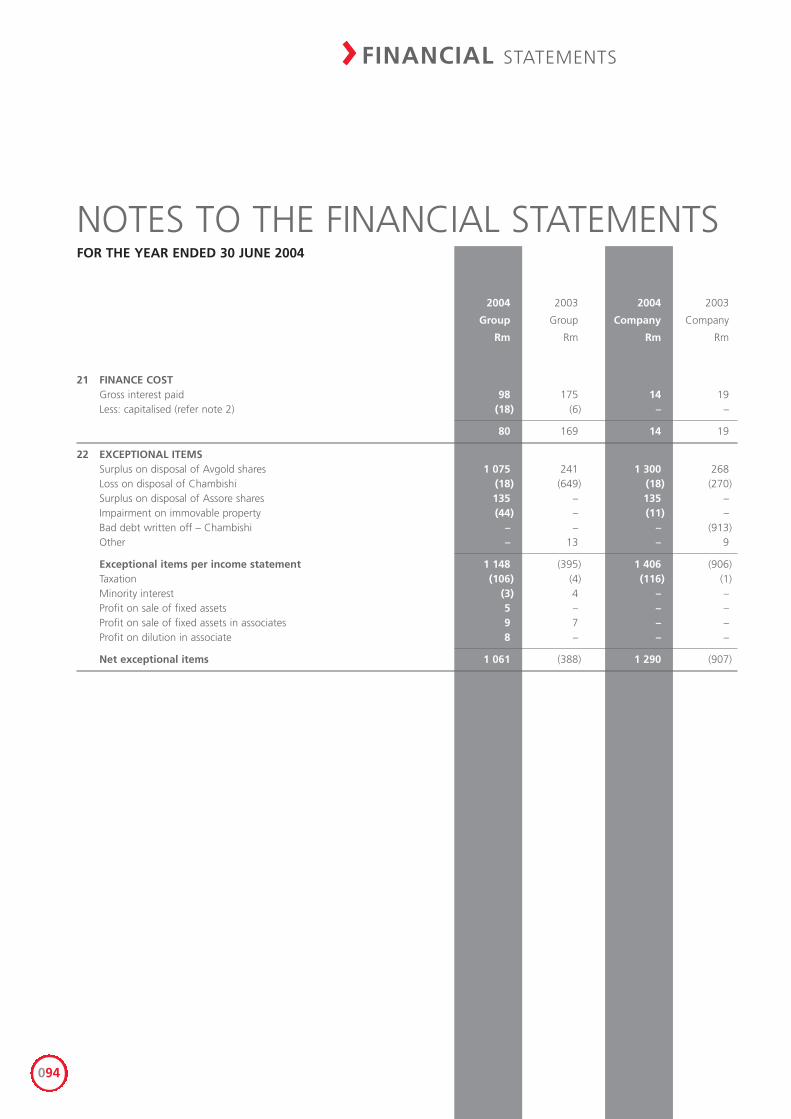
2004 2003 2004 2003
Group Group Company Company
Rm Rm Rm Rm
21 FINANCE COST Gross interest paid 98 175 14 19Less: capitalised (refer note 2) (18) (6) – –
80 169 14 19
22 EXCEPTIONAL ITEMSSurplus on disposal of Avgold shares 1 075 241 1 300 268 Loss on disposal of Chambishi (18) (649) (18) (270)Surplus on disposal of Assore shares 135 – 135 – Impairment on immovable property (44) – (11) – Bad debt written off – Chambishi – – – (913)Other – 13 – 9
Exceptional items per income statement 1 148 (395) 1 406 (906)Taxation (106) (4) (116) (1)Minority interest (3) 4 – – Profit on sale of fixed assets 5 – – –Profit on sale of fixed assets in associates 9 7 – –Profit on dilution in associate 8 – – –
Net exceptional items 1 061 (388) 1 290 (907)
NOTES TO THE FINANCIAL STATEMENTSFOR THE YEAR ENDED 30 JUNE 2004
> FINANCIAL STATEMENTS
094
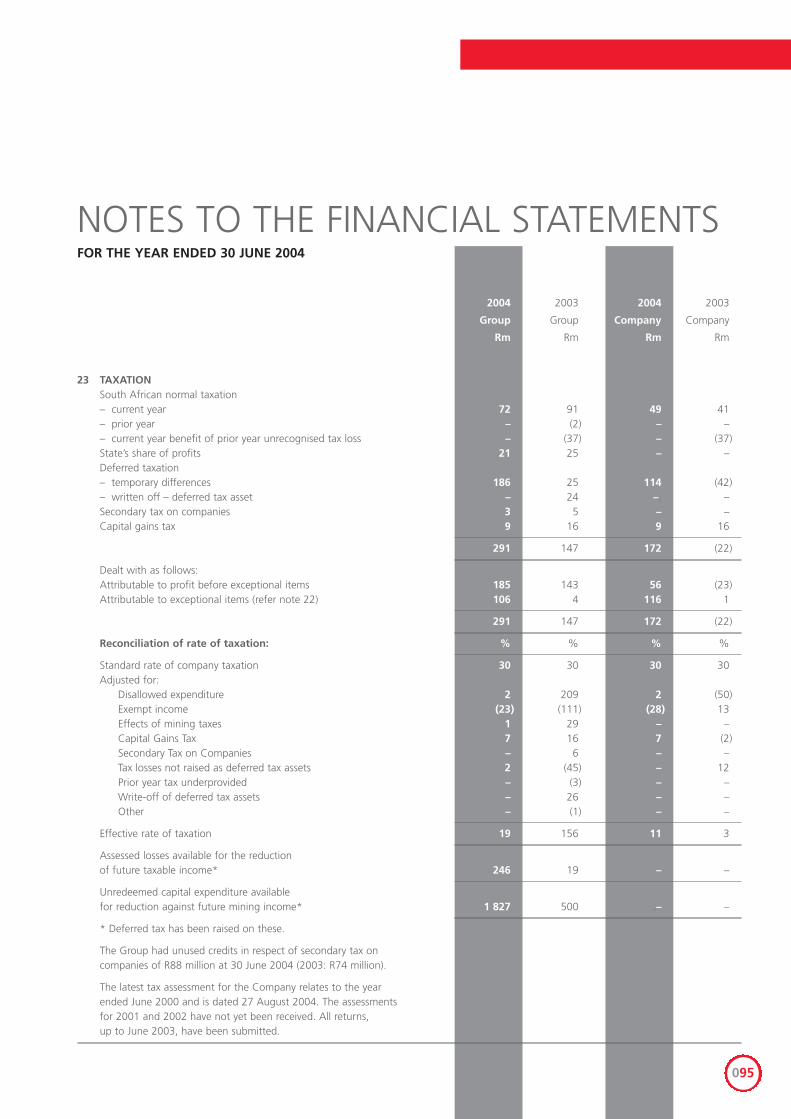
NOTES TO THE FINANCIAL STATEMENTS
2004 2003 2004 2003
Group Group Company Company
Rm Rm Rm Rm
23 TAXATIONSouth African normal taxation – current year 72 91 49 41 – prior year – (2) – – – current year benefit of prior year unrecognised tax loss – (37) – (37)State’s share of profits 21 25 – – Deferred taxation – temporary differences 186 25 114 (42)– written off – deferred tax asset – 24 –. – Secondary tax on companies 3 5 – – Capital gains tax 9 16 9 16
291 147 172 (22)
Dealt with as follows:Attributable to profit before exceptional items 185 143 56 (23)Attributable to exceptional items (refer note 22) 106 4 116 1
291 147 172 (22)
Reconciliation of rate of taxation: % % % %
Standard rate of company taxation 30 30 30 30 Adjusted for:
Disallowed expenditure 2 209 2 (50)Exempt income (23) (111) (28) 13 Effects of mining taxes 1 29 – – Capital Gains Tax 7 16 7 (2)Secondary Tax on Companies – 6 – – Tax losses not raised as deferred tax assets 2 (45) – 12 Prior year tax underprovided – (3) – – Write-off of deferred tax assets – 26 – – Other – (1) – –
Effective rate of taxation 19 156 11 3
Assessed losses available for the reductionof future taxable income* 246 19 – –
Unredeemed capital expenditure availablefor reduction against future mining income* 1 827 500 .– –
* Deferred tax has been raised on these.
The Group had unused credits in respect of secondary tax on companies of R88 million at 30 June 2004 (2003: R74 million).
The latest tax assessment for the Company relates to the year ended June 2000 and is dated 27 August 2004. The assessmentsfor 2001 and 2002 have not yet been received. All returns, up to June 2003, have been submitted.
FOR THE YEAR ENDED 30 JUNE 2004
095
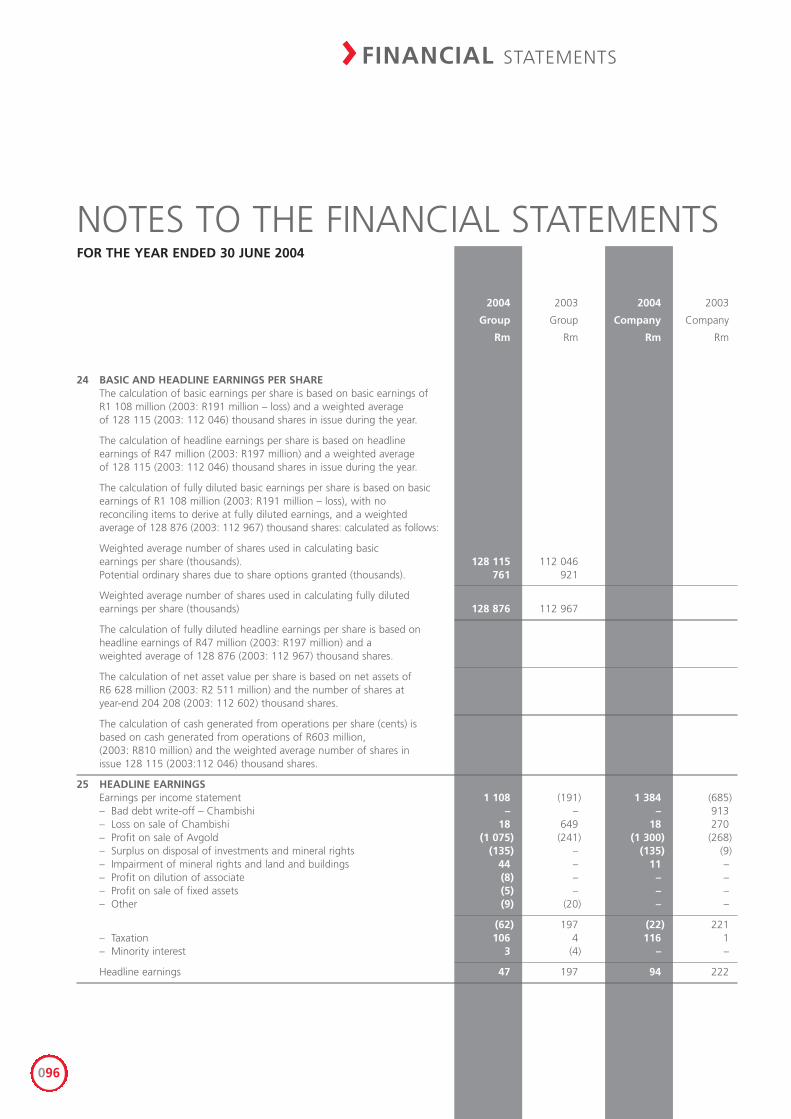
2004 2003 2004 2003
Group Group Company Company
Rm Rm Rm Rm
24 BASIC AND HEADLINE EARNINGS PER SHAREThe calculation of basic earnings per share is based on basic earnings of R1 108 million (2003: R191 million – loss) and a weighted average of 128 115 (2003: 112 046) thousand shares in issue during the year.
The calculation of headline earnings per share is based on headline earnings of R47 million (2003: R197 million) and a weighted average of 128 115 (2003: 112 046) thousand shares in issue during the year.
The calculation of fully diluted basic earnings per share is based on basic earnings of R1 108 million (2003: R191 million – loss), with no reconciling items to derive at fully diluted earnings, and a weighted average of 128 876 (2003: 112 967) thousand shares: calculated as follows:
Weighted average number of shares used in calculating basicearnings per share (thousands). 128 115 112 046 Potential ordinary shares due to share options granted (thousands). 761 921
Weighted average number of shares used in calculating fully diluted earnings per share (thousands) 128 876 112 967
The calculation of fully diluted headline earnings per share is based on headline earnings of R47 million (2003: R197 million) and a weighted average of 128 876 (2003: 112 967) thousand shares.
The calculation of net asset value per share is based on net assets ofR6 628 million (2003: R2 511 million) and the number of shares at year-end 204 208 (2003: 112 602) thousand shares.
The calculation of cash generated from operations per share (cents) is based on cash generated from operations of R603 million, (2003: R810 million) and the weighted average number of shares in issue 128 115 (2003:112 046) thousand shares.
25 HEADLINE EARNINGS Earnings per income statement 1 108 (191) 1 384 (685)– Bad debt write-off – Chambishi – – – 913 – Loss on sale of Chambishi 18 649 18 270 – Profit on sale of Avgold (1 075) (241) (1 300) (268) – Surplus on disposal of investments and mineral rights (135) – (135) (9)– Impairment of mineral rights and land and buildings 44 – 11 – – Profit on dilution of associate (8) – – –– Profit on sale of fixed assets (5) – – –– Other (9) (20) – –
(62) 197 (22) 221 – Taxation 106 4 116 1 – Minority interest 3 (4) – –
Headline earnings 47 197 94 222
NOTES TO THE FINANCIAL STATEMENTSFOR THE YEAR ENDED 30 JUNE 2004
> FINANCIAL STATEMENTS
096
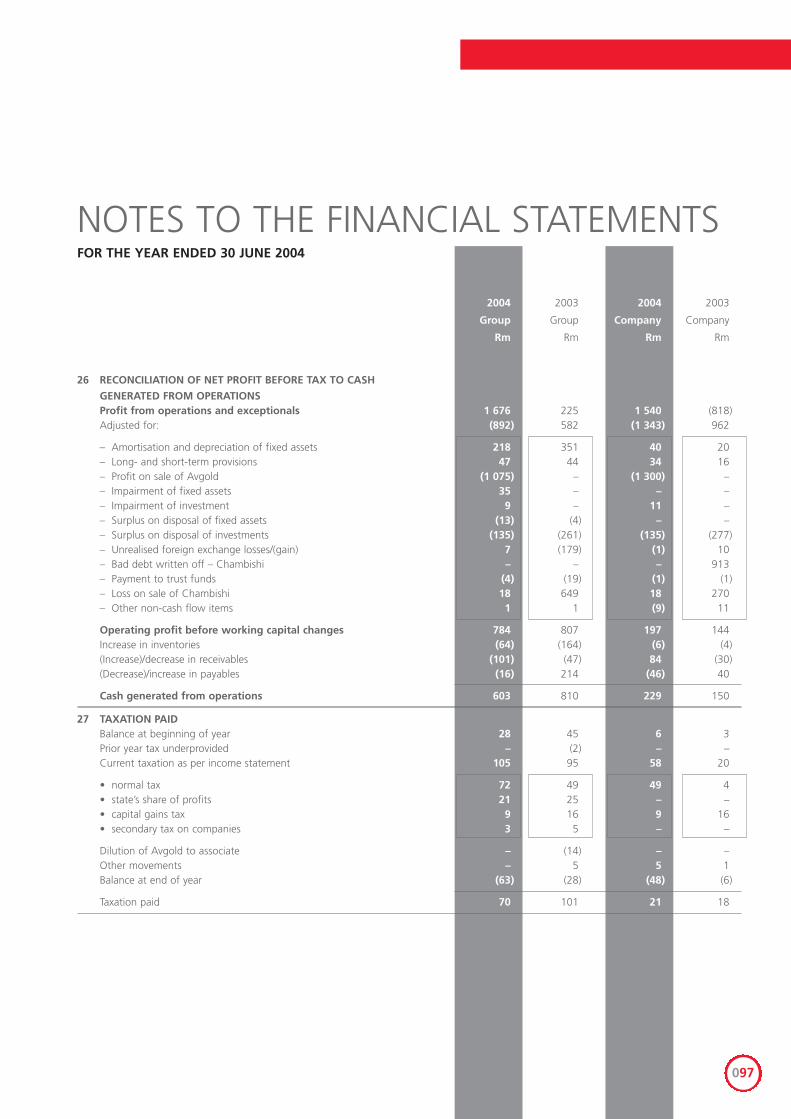
NOTES TO THE FINANCIAL STATEMENTS
2004 2003 2004 2003
Group Group Company Company
Rm Rm Rm Rm
26 RECONCILIATION OF NET PROFIT BEFORE TAX TO CASH
GENERATED FROM OPERATIONSProfit from operations and exceptionals 1 1 676 225 1 540 (818)Adjusted for: (892) 582 (1 343) 962
– Amortisation and depreciation of fixed assets 218 351 40 20 – Long- and short-term provisions 47 44 34 16 – Profit on sale of Avgold (1 075) – (1 300) – – Impairment of fixed assets 35 – – – – Impairment of investment 9 – 11 –– Surplus on disposal of fixed assets (13) (4) – – – Surplus on disposal of investments (135) (261) (135) (277)– Unrealised foreign exchange losses/(gain) 7 (179) (1) 10 – Bad debt written off – Chambishi – – – 913 – Payment to trust funds (4) (19) (1) (1)– Loss on sale of Chambishi 18 649 18 270 – Other non-cash flow items 1 1 (9) 11
Operating profit before working capital changes 784 807 197 144 Increase in inventories (64) (164) (6) (4)(Increase)/decrease in receivables (101) (47) 84 (30)(Decrease)/increase in payables (16) 214 (46) 40
Cash generated from operations 603 810 229 150
27 TAXATION PAID Balance at beginning of year 28 45 6 3 Prior year tax underprovided – (2) – – Current taxation as per income statement 105 95 58 20
• normal tax 72 49 49 4• state’s share of profits 21 25 – –• capital gains tax 9 16 9 16 • secondary tax on companies 3 5 – –
Dilution of Avgold to associate – (14) – –Other movements – 5 5 1 Balance at end of year (63) (28) (48) (6)
Taxation paid 70 101 21 18
FOR THE YEAR ENDED 30 JUNE 2004
097
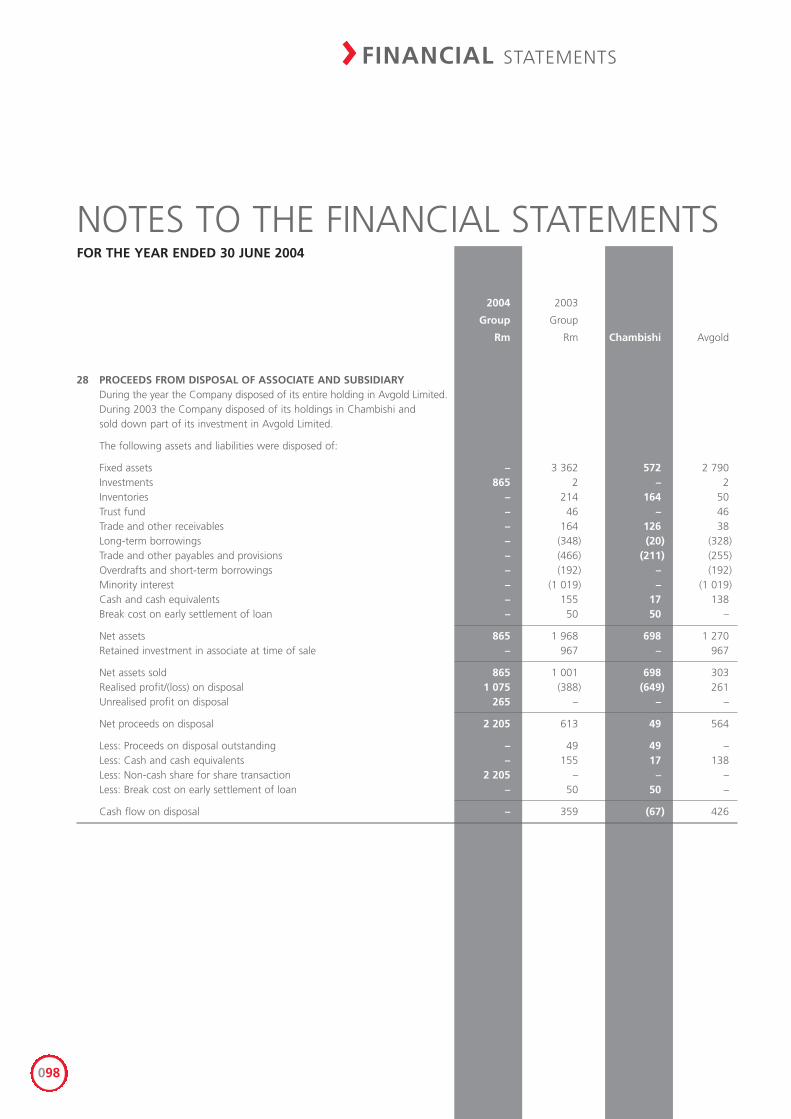
2004 2003
Group Group
Rm Rm Chambishi Avgold
28 PROCEEDS FROM DISPOSAL OF ASSOCIATE AND SUBSIDIARYDuring the year the Company disposed of its entire holding in Avgold Limited.During 2003 the Company disposed of its holdings in Chambishi andsold down part of its investment in Avgold Limited.
The following assets and liabilities were disposed of:
Fixed assets – 3 362 572 2 790Investments 865 2 – 2Inventories – 214 164 50Trust fund – 46 – 46Trade and other receivables – 164 126 38Long-term borrowings – (348) (20) (328)Trade and other payables and provisions – (466) (211) (255)Overdrafts and short-term borrowings – (192) – (192)Minority interest – (1 019) – (1 019)Cash and cash equivalents – 155 17 138Break cost on early settlement of loan – 50 50 –
Net assets 865 1 968 698 1 270Retained investment in associate at time of sale – 967 – 967
Net assets sold 865 1 001 698 303Realised profit/(loss) on disposal 1 075 (388) (649) 261Unrealised profit on disposal 265 – – –
Net proceeds on disposal 2 205 613 49 564
Less: Proceeds on disposal outstanding – 49 49 –Less: Cash and cash equivalents – 155 17 138Less: Non-cash share for share transaction 2 205 – – –Less: Break cost on early settlement of loan – 50 50 –
Cash flow on disposal – 359 (67) 426
NOTES TO THE FINANCIAL STATEMENTSFOR THE YEAR ENDED 30 JUNE 2004
> FINANCIAL STATEMENTS
098
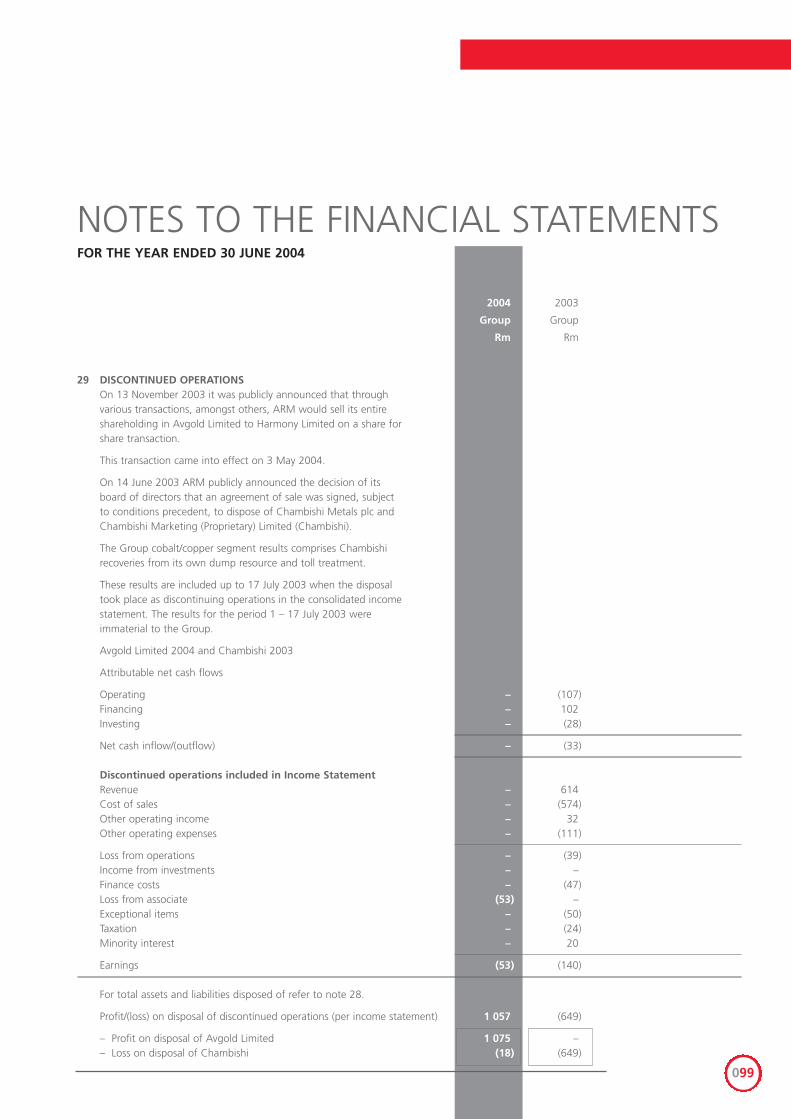
NOTES TO THE FINANCIAL STATEMENTS
2004 2003
Group Group
Rm Rm
29 DISCONTINUED OPERATIONS On 13 November 2003 it was publicly announced that through various transactions, amongst others, ARM would sell its entire shareholding in Avgold Limited to Harmony Limited on a share for share transaction.
This transaction came into effect on 3 May 2004.
On 14 June 2003 ARM publicly announced the decision of its board of directors that an agreement of sale was signed, subject to conditions precedent, to dispose of Chambishi Metals plc and Chambishi Marketing (Proprietary) Limited (Chambishi).
The Group cobalt/copper segment results comprises Chambishi recoveries from its own dump resource and toll treatment.
These results are included up to 17 July 2003 when the disposal took place as discontinuing operations in the consolidated income statement. The results for the period 1 – 17 July 2003 were immaterial to the Group.
Avgold Limited 2004 and Chambishi 2003
Attributable net cash flows
Operating – (107)Financing – 102 Investing – (28)
Net cash inflow/(outflow) – (33)
Discontinued operations included in Income Statement Revenue – 614 Cost of sales – (574)Other operating income – 32 Other operating expenses – (111)
Loss from operations – (39)Income from investments – – Finance costs – (47)Loss from associate (53) –Exceptional items – (50)Taxation – (24)Minority interest – 20
Earnings (53) (140)
For total assets and liabilities disposed of refer to note 28.
Profit/(loss) on disposal of discontinued operations (per income statement) 1 057 (649)
– Profit on disposal of Avgold Limited 1 075 –– Loss on disposal of Chambishi (18) (649)
FOR THE YEAR ENDED 30 JUNE 2004
099
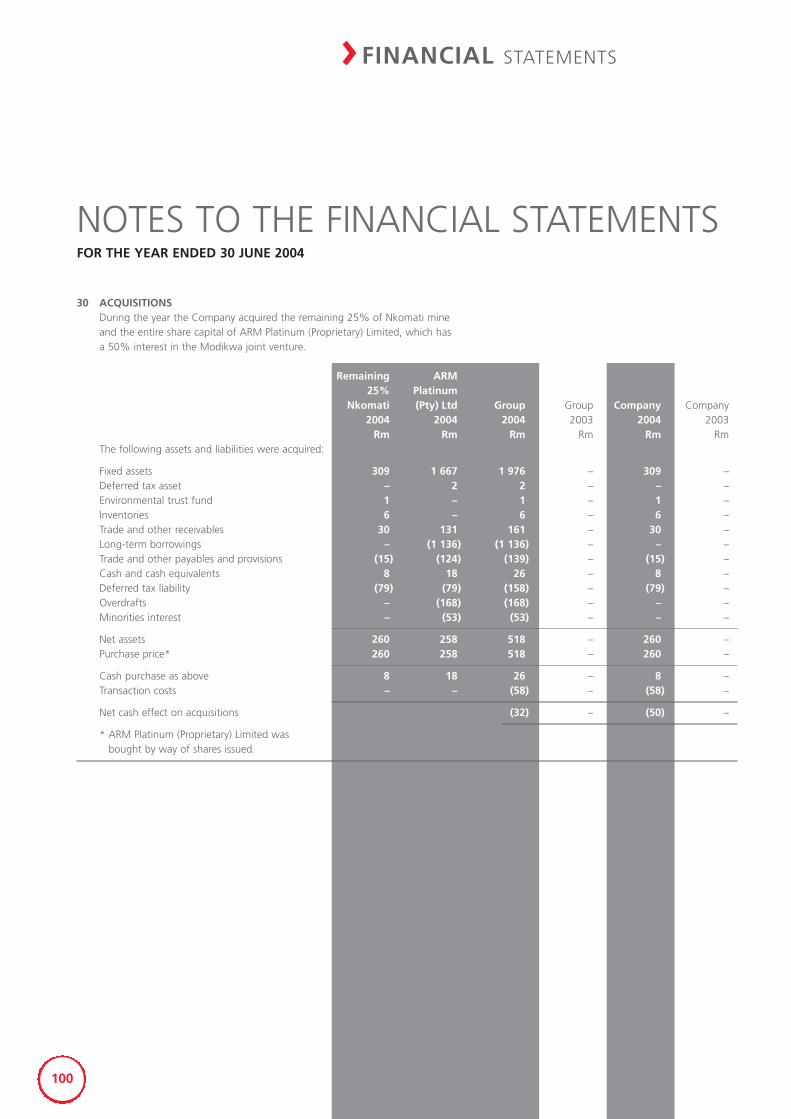
30 ACQUISITIONSDuring the year the Company acquired the remaining 25% of Nkomati mineand the entire share capital of ARM Platinum (Proprietary) Limited, which has a 50% interest in the Modikwa joint venture.
Remaining ARM25% Platinum
Nkomati (Pty) Ltd Group Group Company Company2004 2004 2004 2003 2004 2003
Rm Rm Rm Rm Rm RmThe following assets and liabilities were acquired:
Fixed assets 309 1 667 1 976 – 309 –Deferred tax asset – 2 2 – – –Environmental trust fund 1 – 1 – 1 –Inventories 6 – 6 – 6 –Trade and other receivables 30 131 161 – 30 –Long-term borrowings – (1 136) (1 136) – – –Trade and other payables and provisions (15) (124) (139) – (15) –Cash and cash equivalents 8 18 26 – 8 –Deferred tax liability (79) (79) (158) – (79) –Overdrafts – (168) (168) – – –Minorities interest – (53) (53) – – –
Net assets 260 258 518 – 260 –Purchase price* 260 258 518 – 260 –
Cash purchase as above 8 18 26 – 8 –Transaction costs – – (58) – (58) –
Net cash effect on acquisitions (32) – (50) –
* ARM Platinum (Proprietary) Limited was bought by way of shares issued.
NOTES TO THE FINANCIAL STATEMENTSFOR THE YEAR ENDED 30 JUNE 2004
> FINANCIAL STATEMENTS
100
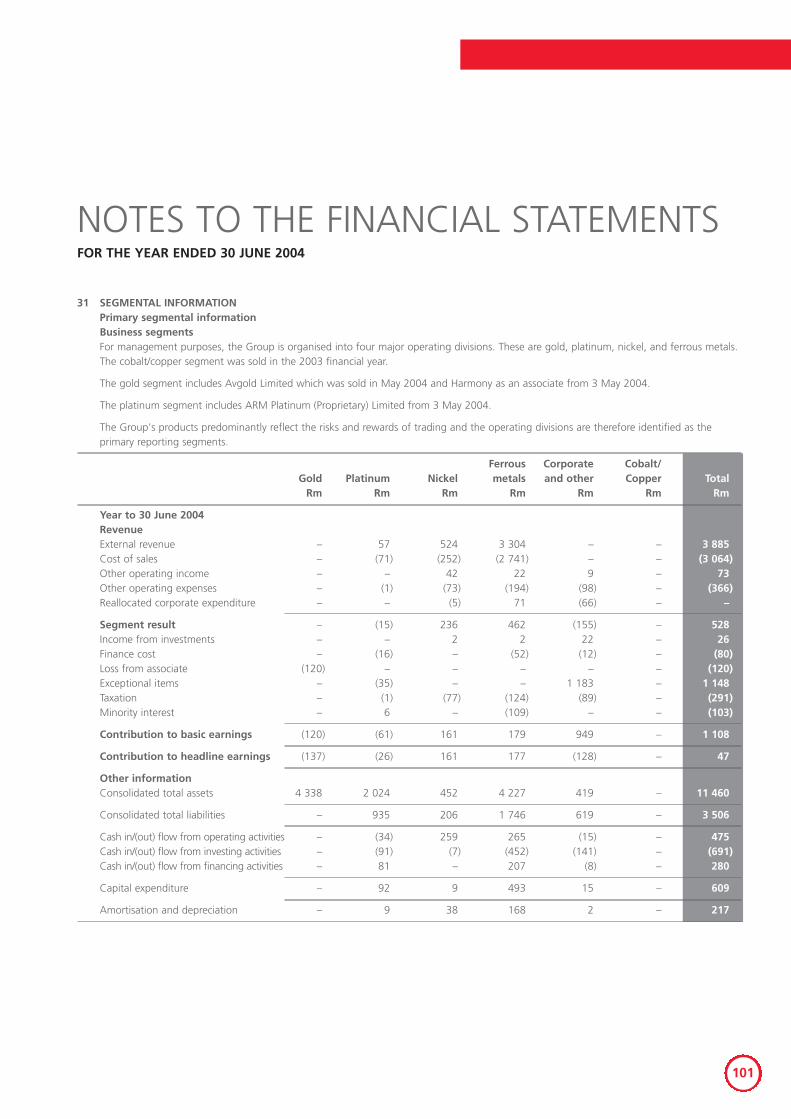
31 SEGMENTAL INFORMATIONPrimary segmental informationBusiness segmentsFor management purposes, the Group is organised into four major operating divisions. These are gold, platinum, nickel, and ferrous metals.The cobalt/copper segment was sold in the 2003 financial year.
The gold segment includes Avgold Limited which was sold in May 2004 and Harmony as an associate from 3 May 2004.
The platinum segment includes ARM Platinum (Proprietary) Limited from 3 May 2004.
The Group's products predominantly reflect the risks and rewards of trading and the operating divisions are therefore identified as theprimary reporting segments.
Ferrous Corporate Cobalt/ Gold Platinum Nickel metals and other Copper Total
Rm Rm Rm Rm Rm Rm Rm
Year to 30 June 2004RevenueExternal revenue – 57 524 3 304 – – 3 885 Cost of sales – (71) (252) (2 741) – – (3 064)Other operating income – – 42 22 9 – 73 Other operating expenses – (1) (73) (194) (98) – (366)Reallocated corporate expenditure – – (5) 71 (66) – –
Segment result – (15) 236 462 (155) – 528 Income from investments – – 2 2 22 – 26 Finance cost – (16) – (52) (12) – (80)Loss from associate (120) – – – – – (120)Exceptional items – (35) – – 1 183 – 1 148 Taxation – (1) (77) (124) (89) – (291)Minority interest – 6 – (109) – – (103)
Contribution to basic earnings (120) (61) 161 179 949 – 1 108
Contribution to headline earnings (137) (26) 161 177 (128) – 47
Other information Consolidated total assets 4 338 2 024 452 4 227 419 – 11 460
Consolidated total liabilities – 935 206 1 746 619 – 3 506
Cash in/(out) flow from operating activities – (34) 259 265 (15) – 475Cash in/(out) flow from investing activities – (91) (7) (452) (141) – (691)Cash in/(out) flow from financing activities – 81 – 207 (8) – 280
Capital expenditure – 92 9 493 15 – 609
Amortisation and depreciation – 9 38 168 2 – 217
NOTES TO THE FINANCIAL STATEMENTSFOR THE YEAR ENDED 30 JUNE 2004
101
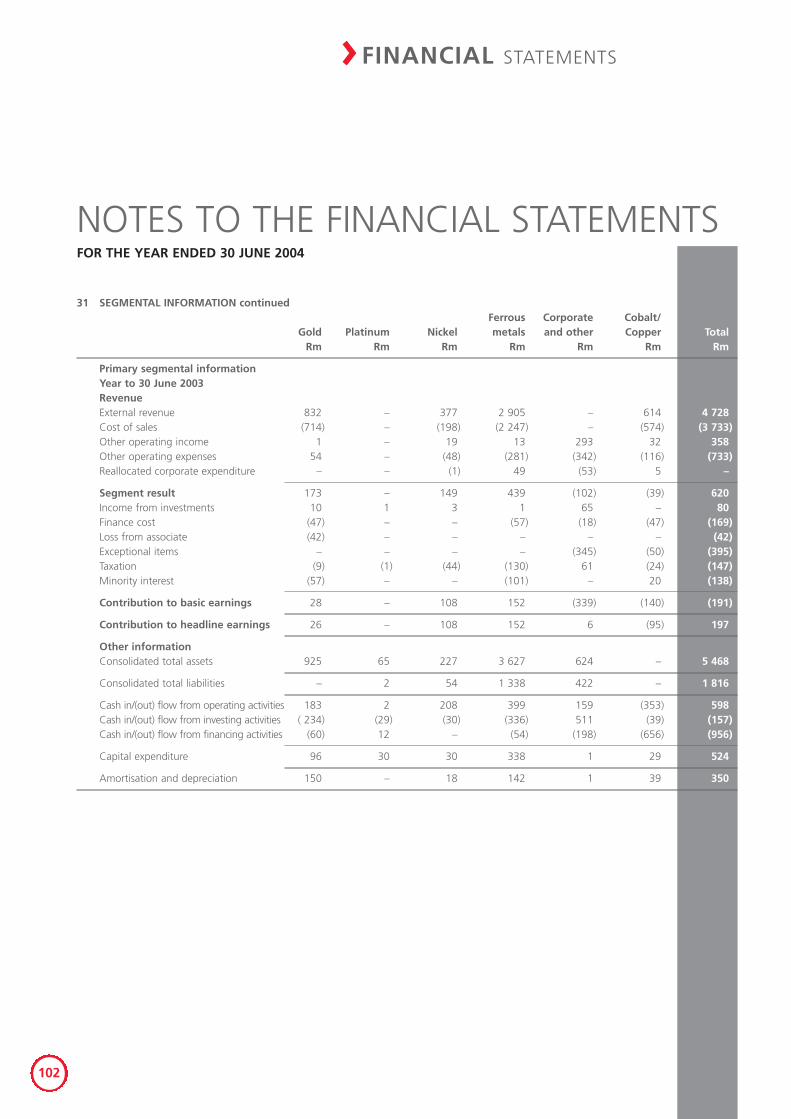
31 SEGMENTAL INFORMATION continuedFerrous Corporate Cobalt/
Gold Platinum Nickel metals and other Copper Total Rm Rm Rm Rm Rm Rm Rm
Primary segmental informationYear to 30 June 2003 Revenue External revenue 832 – 377 2 905 – 614 4 728 Cost of sales (714) – (198) (2 247) – (574) (3 733)Other operating income 1 – 19 13 293 42 32 358Other operating expenses 54 – (48) (281) (342) (116) (733)Reallocated corporate expenditure – – (1) 49 (53) 5 –
Segment result 173 – 149 439 (102) (39) 620 Income from investments 10 1 3 1 65 – 80 Finance cost (47) – – (57) (18) (47) (169)Loss from associate (42) – – – – – (42)Exceptional items – – – – (345) (50) (395)Taxation (9) (1) (44) (130) 61 (24) (147)Minority interest (57) – – (101) – 20 (138)
Contribution to basic earnings 28 – 108 152 (339) (140) (191)
Contribution to headline earnings 26 – 108 152 6 (95) 197
Other informationConsolidated total assets 925 65 227 3 627 624 – 5 468
Consolidated total liabilities – 2 54 1 338 422 – 1 816
Cash in/(out) flow from operating activities 183 2 208 399 159 (353) 598Cash in/(out) flow from investing activities ( 234) (29) (30) (336) 511 (39) (157)Cash in/(out) flow from financing activities (60) 12 – (54) (198) (656) (956)
Capital expenditure 96 30 30 338 1 29 524
Amortisation and depreciation 150 – 18 142 1 39 350
NOTES TO THE FINANCIAL STATEMENTSFOR THE YEAR ENDED 30 JUNE 2004
> FINANCIAL STATEMENTS
102
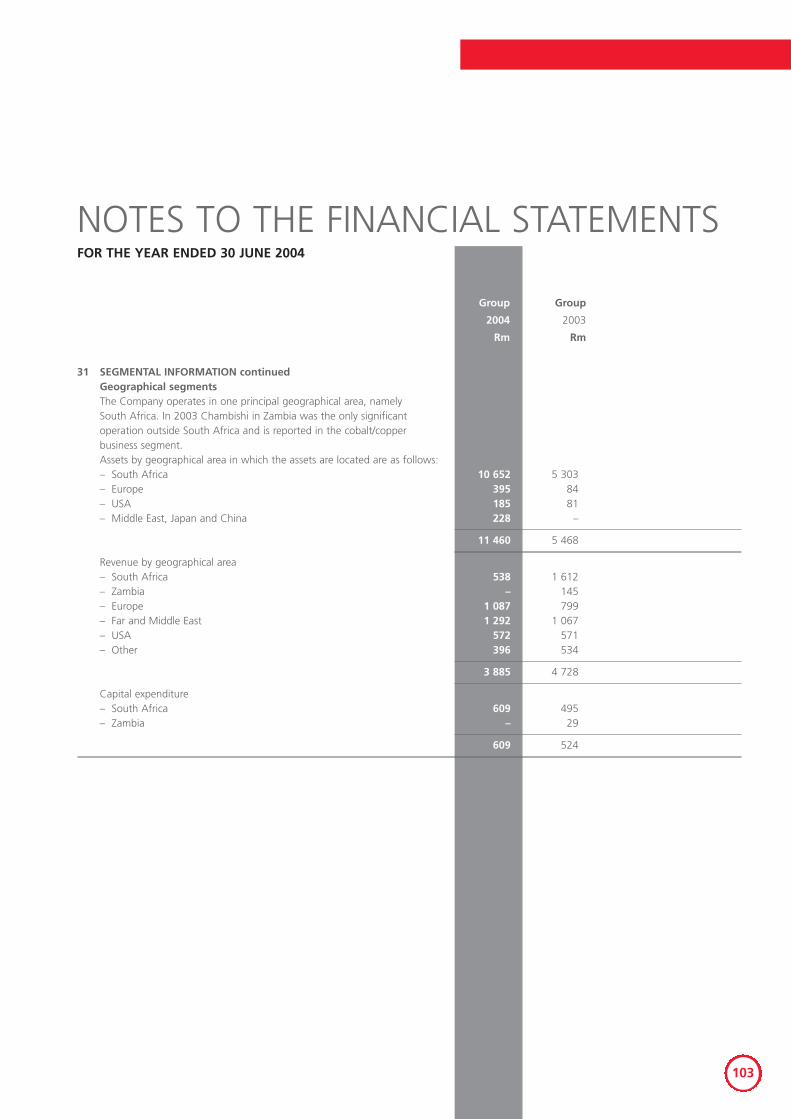
NOTES TO THE FINANCIAL STATEMENTS
Group Group
2004 2003
Rm Rm
31 SEGMENTAL INFORMATION continuedGeographical segmentsThe Company operates in one principal geographical area, namely South Africa. In 2003 Chambishi in Zambia was the only significant operation outside South Africa and is reported in the cobalt/copper business segment.Assets by geographical area in which the assets are located are as follows:– South Africa 10 652 5 303 – Europe 395 84 – USA 185 81 – Middle East, Japan and China 228 –
11 460 5 468
Revenue by geographical area– South Africa 538 1 612 – Zambia – 145 – Europe 1 087 799 – Far and Middle East 1 292 1 067 – USA 572 571 – Other 396 534
3 885 4 728
Capital expenditure – South Africa 609 495– Zambia – 29
609 524
FOR THE YEAR ENDED 30 JUNE 2004
103
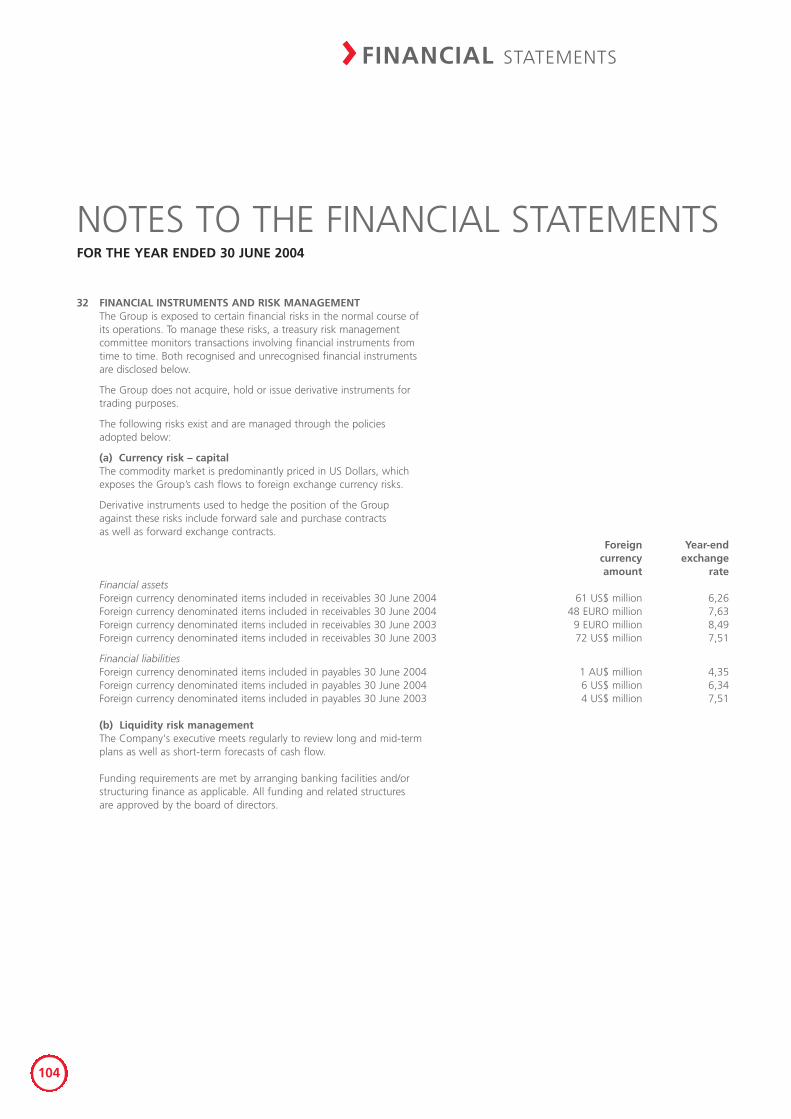
32 FINANCIAL INSTRUMENTS AND RISK MANAGEMENTThe Group is exposed to certain financial risks in the normal course of its operations. To manage these risks, a treasury risk management committee monitors transactions involving financial instruments from time to time. Both recognised and unrecognised financial instruments are disclosed below.
The Group does not acquire, hold or issue derivative instruments for trading purposes.
The following risks exist and are managed through the policies adopted below:
(a) Currency risk – capitalThe commodity market is predominantly priced in US Dollars, which exposes the Group’s cash flows to foreign exchange currency risks.
Derivative instruments used to hedge the position of the Group against these risks include forward sale and purchase contracts as well as forward exchange contracts.
Foreign Year-end currency exchange amount rate
Financial assets Foreign currency denominated items included in receivables 30 June 2004 61 US$ million 6,26 Foreign currency denominated items included in receivables 30 June 2004 48 EURO million 7,63 Foreign currency denominated items included in receivables 30 June 2003 9 EURO million 8,49Foreign currency denominated items included in receivables 30 June 2003 72 US$ million 7,51
Financial liabilities Foreign currency denominated items included in payables 30 June 2004 1 AU$ million 4,35Foreign currency denominated items included in payables 30 June 2004 6 US$ million 6,34Foreign currency denominated items included in payables 30 June 2003 4 US$ million 7,51
(b) Liquidity risk management The Company's executive meets regularly to review long and mid-term plans as well as short-term forecasts of cash flow.
Funding requirements are met by arranging banking facilities and/or structuring finance as applicable. All funding and related structures are approved by the board of directors.
NOTES TO THE FINANCIAL STATEMENTSFOR THE YEAR ENDED 30 JUNE 2004
> FINANCIAL STATEMENTS
104
32 FINANCIAL INSTRUMENTS AND RISK MANAGEMENT continued(c) Credit risk Credit risk arises from possible defaults on payments by business partners or bank counterparties. The Group minimises credit risk by evaluatingcounterparties before concluding transactions in order to ensure the credit worthiness of such counterparties. Cash is only deposited withinstitutions which have exceptional credit rankings with the amounts distributed appropriately among these institutions to minimise credit riskthrough diversification.
(d) Treasury risk management The treasury function is outsourced to Andisa Treasury Solutions (Proprietary) Limited (Andisa), specialist in the management of third partytreasury operations.
Together with ARM executives, Andisa coordinate the short-term cash requirements in the South African domestic money market. This treasuryoperation makes available to all Group companies its bulk finance benefits at, or better than market-related prices.
A treasury committee, consisting of senior managers in the Company and representatives from Andisa, meet on a regular basis to analysecurrency and interest rate exposures as well as future funding requirements within the Group. The committee reviews the treasury operation'sdealings to ensure compliance with Group policies and exposure limits as directed by the board of directors and audit committee.
(e) Equity instruments Equity instruments include equity and preference shares. The preference shares in ARM Mining Consortium has the characteristics of debtwithout an equity component.
(f) Commodity price risk Commodity price risk arises from the possible adverse effect of fluctuations in commodity prices on current and future earnings. Most of theseprices are US$ and EURO based and are internationally determined in the open market. From these base prices contracts are negotiated.
ARM does not actively hedge future commodity revenues for the commodities that it produces against price fluctuations.
(g) Interest rate risk The Group's exposure to market risk for changes in interest rates relates primarily to the Group's long-term debt obligations.
The Group manages its interest cost using a mix of fixed and variable rates.
Fluctuations in interest rates give rise to interest rate risks through the impact these fluctuations have on the value of short-term cashinvestments and financing activities.
Hedging of interest rates may be undertaken to ensure that fluctuations in interest rates do not have an unexpected impact on the cash flowsor value of assets and liabilities.
Cash is managed to ensure that surplus funds are invested in a manner to achieve maximum returns while minimising risks. This is achievedthrough the activities of Andisa assisting the Group in managing cash flow needs. Significant exposures to interest rate risk were as follows:
NOTES TO THE FINANCIAL STATEMENTSFOR THE YEAR ENDED 30 JUNE 2004
105
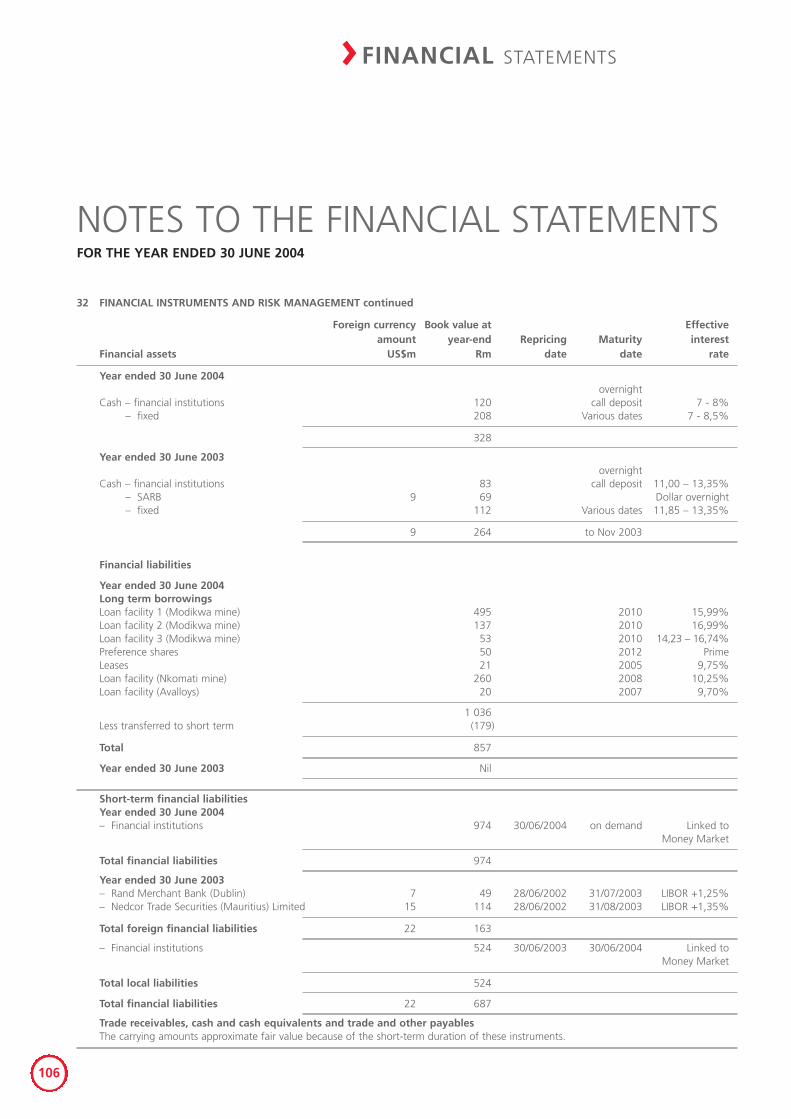
32 FINANCIAL INSTRUMENTS AND RISK MANAGEMENT continued
Foreign currency Book value at Effective amount year-end Repricing Maturity interest
Financial assets US$m Rm date date rate
Year ended 30 June 2004overnight
Cash – financial institutions 120 call deposit 7 - 8%– fixed 208 Various dates 7 - 8,5%
328
Year ended 30 June 2003 overnight
Cash – financial institutions 83 call deposit 11,00 – 13,35%– SARB 9 69 Dollar overnight – fixed 112 Various dates 11,85 – 13,35%
9 264 to Nov 2003
Financial liabilities
Year ended 30 June 2004 Long term borrowings Loan facility 1 (Modikwa mine) 495 2010 15,99%Loan facility 2 (Modikwa mine) 137 2010 16,99%Loan facility 3 (Modikwa mine) 53 2010 14,23 – 16,74% Preference shares 50 2012 PrimeLeases 21 2005 9,75%Loan facility (Nkomati mine) 260 2008 10,25%Loan facility (Avalloys) 20 2007 9,70%
1 036Less transferred to short term (179)
Total 857
Year ended 30 June 2003 Nil
Short-term financial liabilities Year ended 30 June 2004– Financial institutions 974 30/06/2004 on demand Linked to
Money Market
Total financial liabilities 974
Year ended 30 June 2003 – Rand Merchant Bank (Dublin) 7 49 28/06/2002 31/07/2003 LIBOR +1,25%– Nedcor Trade Securities (Mauritius) Limited 15 114 28/06/2002 31/08/2003 LIBOR +1,35%
Total foreign financial liabilities 22 163
– Financial institutions 524 30/06/2003 30/06/2004 Linked to Money Market
Total local liabilities 524
Total financial liabilities 22 687
Trade receivables, cash and cash equivalents and trade and other payables The carrying amounts approximate fair value because of the short-term duration of these instruments.
NOTES TO THE FINANCIAL STATEMENTSFOR THE YEAR ENDED 30 JUNE 2004
> FINANCIAL STATEMENTS
106
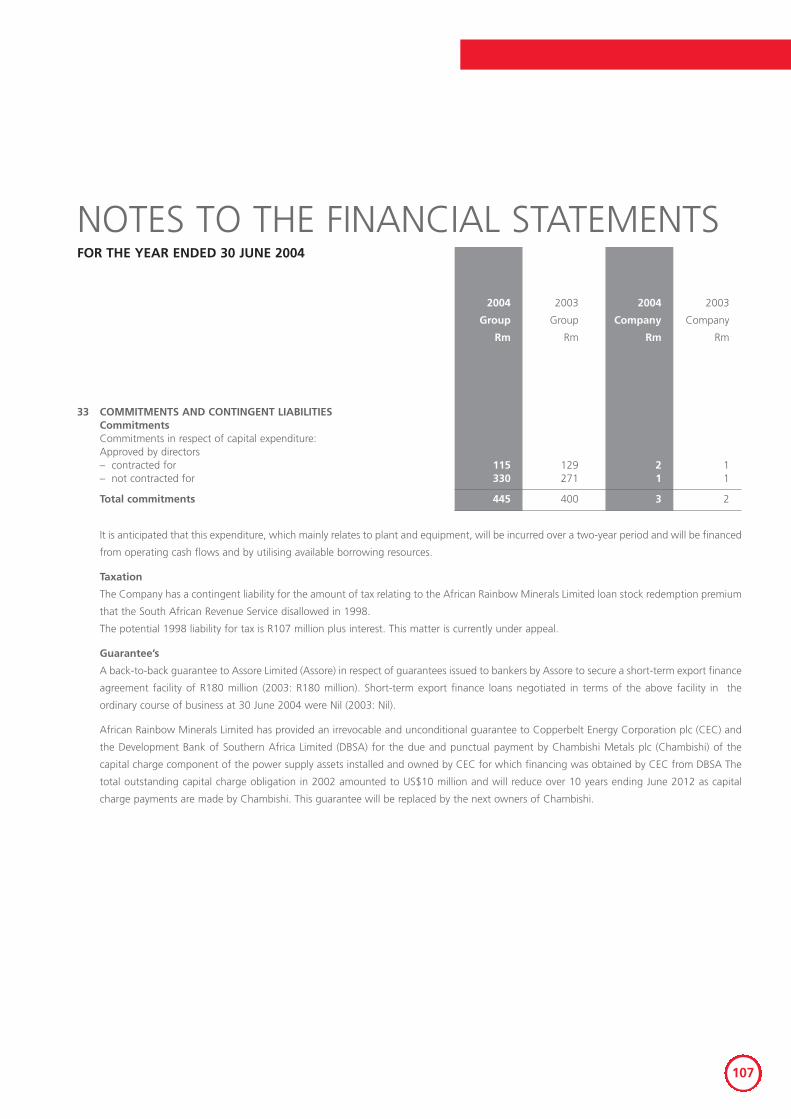
NOTES TO THE FINANCIAL STATEMENTS
2004 2003 2004 2003
Group Group Company Company
Rm Rm Rm Rm
33 COMMITMENTS AND CONTINGENT LIABILITIES Commitments Commitments in respect of capital expenditure:Approved by directors – contracted for 115 129 2 1 – not contracted for 330 271 1 1
Total commitments 445 400 3 2
It is anticipated that this expenditure, which mainly relates to plant and equipment, will be incurred over a two-year period and will be financed
from operating cash flows and by utilising available borrowing resources.
Taxation
The Company has a contingent liability for the amount of tax relating to the African Rainbow Minerals Limited loan stock redemption premium
that the South African Revenue Service disallowed in 1998.
The potential 1998 liability for tax is R107 million plus interest. This matter is currently under appeal.
Guarantee’s
A back-to-back guarantee to Assore Limited (Assore) in respect of guarantees issued to bankers by Assore to secure a short-term export finance
agreement facility of R180 million (2003: R180 million). Short-term export finance loans negotiated in terms of the above facility in the
ordinary course of business at 30 June 2004 were Nil (2003: Nil).
African Rainbow Minerals Limited has provided an irrevocable and unconditional guarantee to Copperbelt Energy Corporation plc (CEC) and
the Development Bank of Southern Africa Limited (DBSA) for the due and punctual payment by Chambishi Metals plc (Chambishi) of the
capital charge component of the power supply assets installed and owned by CEC for which financing was obtained by CEC from DBSA The
total outstanding capital charge obligation in 2002 amounted to US$10 million and will reduce over 10 years ending June 2012 as capital
charge payments are made by Chambishi. This guarantee will be replaced by the next owners of Chambishi.
FOR THE YEAR ENDED 30 JUNE 2004
107
33 COMMITMENTS AND CONTINGENT LIABILITIES continued
Chambishi liabilities and royalties
ARM has a potential future cash flow stream following the disposal of Chambishi. In terms of the accounting requirements of AC 133 this
unrealised, unearned potential future cash flow stream has been valued. Owing to the inherent uncertainties of such an exercise, conservative
parameters have been used (cobalt price: US$10/lb; discount rate: 20 percent).
The net present value of this potential future cash stream is estimated at US$7,3 million.
In addition to the above and similarly linked to the Chambishi disposal, ARM also has potential future liabilities. Management estimates at
balance sheet date indicate that these liabilities could amount to US$7,4 million.
In terms of the agreement of sale of Chambishi, the right of set-off exists in respect of the abovementioned assets and liabilities.
Due to the many variables and assumptions used in the calculation of both the liability number and the future potential cash stream and the
further uncertainties regarding the earning and timing of actual recovery or payment of these linked amounts, no transactions have been
processed in the accounting records of ARM in respect of these amounts.
Litigations
Claims by community (ARM Platinum (Proprietary) Limited)
The current litigation commenced in 2003 when correspondence was forwarded to Modikwa by Ntuli Noble and Spoor Inc, purporting to act
on behalf of the Banareng Tribal Authority. Various allegations were made regarding the Bapedi Shaft (Maandagshoek Winze), and it its
alleged impact on the residents of the Sehlako Village.
Meetings and correspondence followed and on 20 May 2004 an application was made in the High Court of South Africa for the claim to be
heard. The application was brought by the community and the respondents are cited as Rustenburg Platinum Mine Limited (RPM), ARM
Mining Consortium (ARMMC), the Minister of Minerals and Energy, the Minister of Land Affairs and the Government of the Republic of South
Africa. RPM and ARMMC have submitted an answering affidavit to the High Court and a ruling is awaited. An internal task team has also
been appointed to resolve these allegations in an amicable manner.
NOTES TO THE FINANCIAL STATEMENTSFOR THE YEAR ENDED 30 JUNE 2004
> FINANCIAL STATEMENTS
108
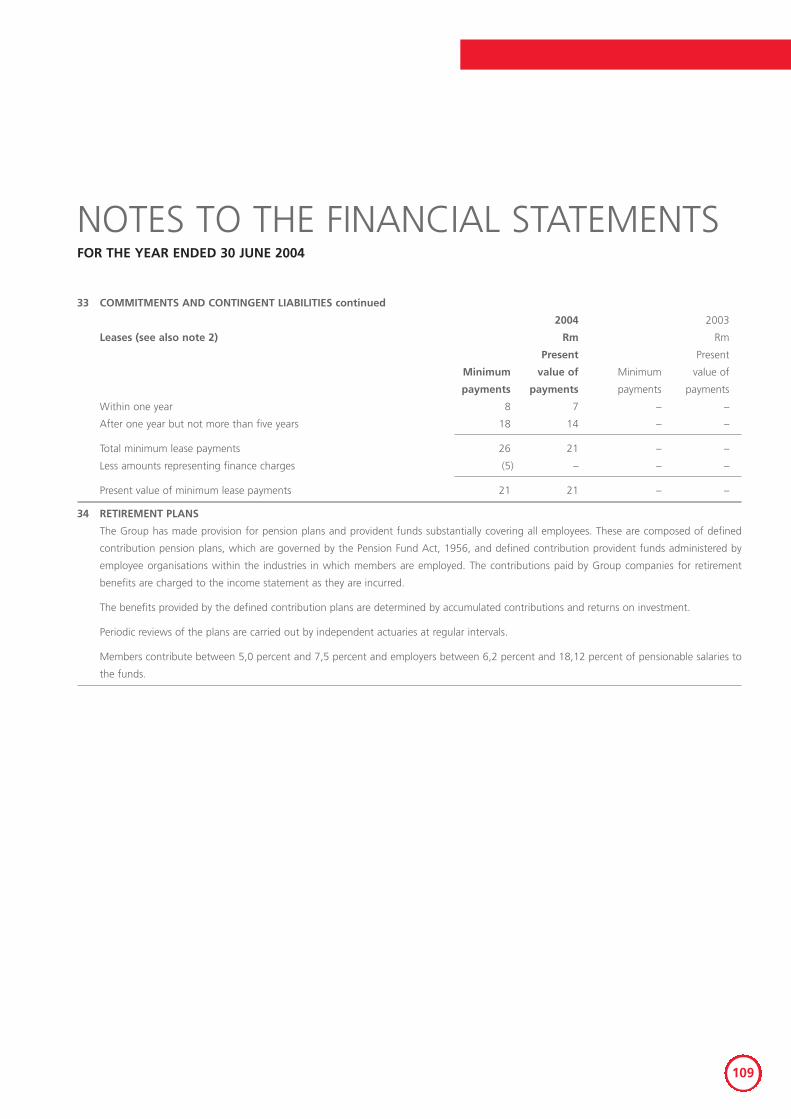
33 COMMITMENTS AND CONTINGENT LIABILITIES continued
2004 2003
Leases (see also note 2) Rm Rm
Present Present
Minimum value of Minimum value of
payments payments payments payments
Within one year 8 7 – –
After one year but not more than five years 18 14 – –
Total minimum lease payments 26 21 – –
Less amounts representing finance charges (5) – – –
Present value of minimum lease payments 21 21 – –
34 RETIREMENT PLANS
The Group has made provision for pension plans and provident funds substantially covering all employees. These are composed of defined
contribution pension plans, which are governed by the Pension Fund Act, 1956, and defined contribution provident funds administered by
employee organisations within the industries in which members are employed. The contributions paid by Group companies for retirement
benefits are charged to the income statement as they are incurred.
The benefits provided by the defined contribution plans are determined by accumulated contributions and returns on investment.
Periodic reviews of the plans are carried out by independent actuaries at regular intervals.
Members contribute between 5,0 percent and 7,5 percent and employers between 6,2 percent and 18,12 percent of pensionable salaries to
the funds.
NOTES TO THE FINANCIAL STATEMENTSFOR THE YEAR ENDED 30 JUNE 2004
109
35 POST-RETIREMENT HEALTHCARE BENEFITS
The Group has obligations to fund a portion of certain pensioners' and retiring employees' medical aid contributions based on the cost of
benefits. The anticipated liabilities arising from these obligations have been actuarially determined using the project unit credit method, and
a corresponding liability has been raised.
The liability is assessed periodically by an independent actuarial survey. This survey uses the following principal actuarial assumptions:
– a discount rate of 12 percent, based on high quality corporate bonds; and
– an increase in healthcare costs at a rate of 8,74 percent.
The provisions raised in respect of post-retirement healthcare benefits amounted to R86 million (2003: R88 million) at the end of the year. Of
this amount, R2 million (2003: R5 million) was charged against income in the current year (refer to note 14).
The liabilities raised based on present values of the post-retirement benefit, have been recognised in full. An actuarial valuation is carried out
in respect of this liability at three yearly intervals. No new employees get this benefit and the liability is relatively stable. The last actuarial
valuation was conducted in 2004 and was accordingly adjusted. The liability for post-retirement healthcare benefits is not funded.
NOTES TO THE FINANCIAL STATEMENTSFOR THE YEAR ENDED 30 JUNE 2004
> FINANCIAL STATEMENTS
110
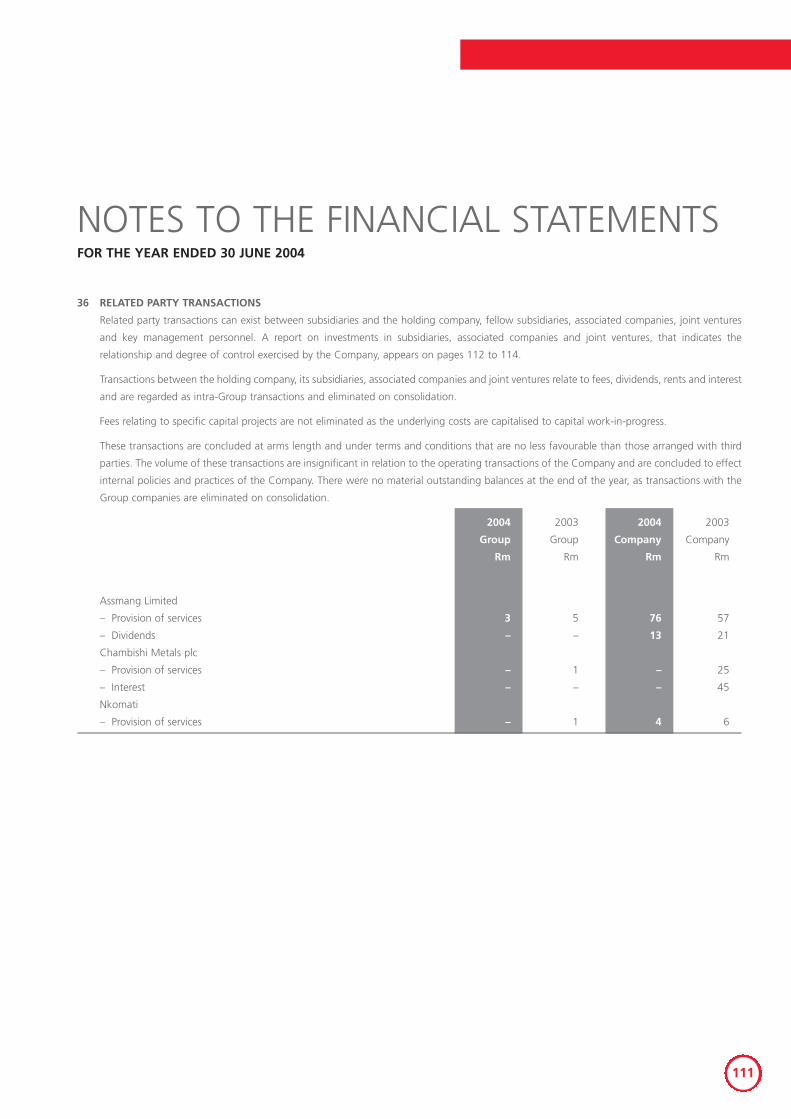
36 RELATED PARTY TRANSACTIONS
Related party transactions can exist between subsidiaries and the holding company, fellow subsidiaries, associated companies, joint ventures
and key management personnel. A report on investments in subsidiaries, associated companies and joint ventures, that indicates the
relationship and degree of control exercised by the Company, appears on pages 112 to 114.
Transactions between the holding company, its subsidiaries, associated companies and joint ventures relate to fees, dividends, rents and interest
and are regarded as intra-Group transactions and eliminated on consolidation.
Fees relating to specific capital projects are not eliminated as the underlying costs are capitalised to capital work-in-progress.
These transactions are concluded at arms length and under terms and conditions that are no less favourable than those arranged with third
parties. The volume of these transactions are insignificant in relation to the operating transactions of the Company and are concluded to effect
internal policies and practices of the Company. There were no material outstanding balances at the end of the year, as transactions with the
Group companies are eliminated on consolidation.
2004 2003 2004 2003
Group Group Company Company
Rm Rm Rm Rm
Assmang Limited
– Provision of services 3 5 76 57
– Dividends – – 13 21
Chambishi Metals plc
– Provision of services – 1 – 25
– Interest – – – 45
Nkomati
– Provision of services – 1 4 6
NOTES TO THE FINANCIAL STATEMENTSFOR THE YEAR ENDED 30 JUNE 2004
111
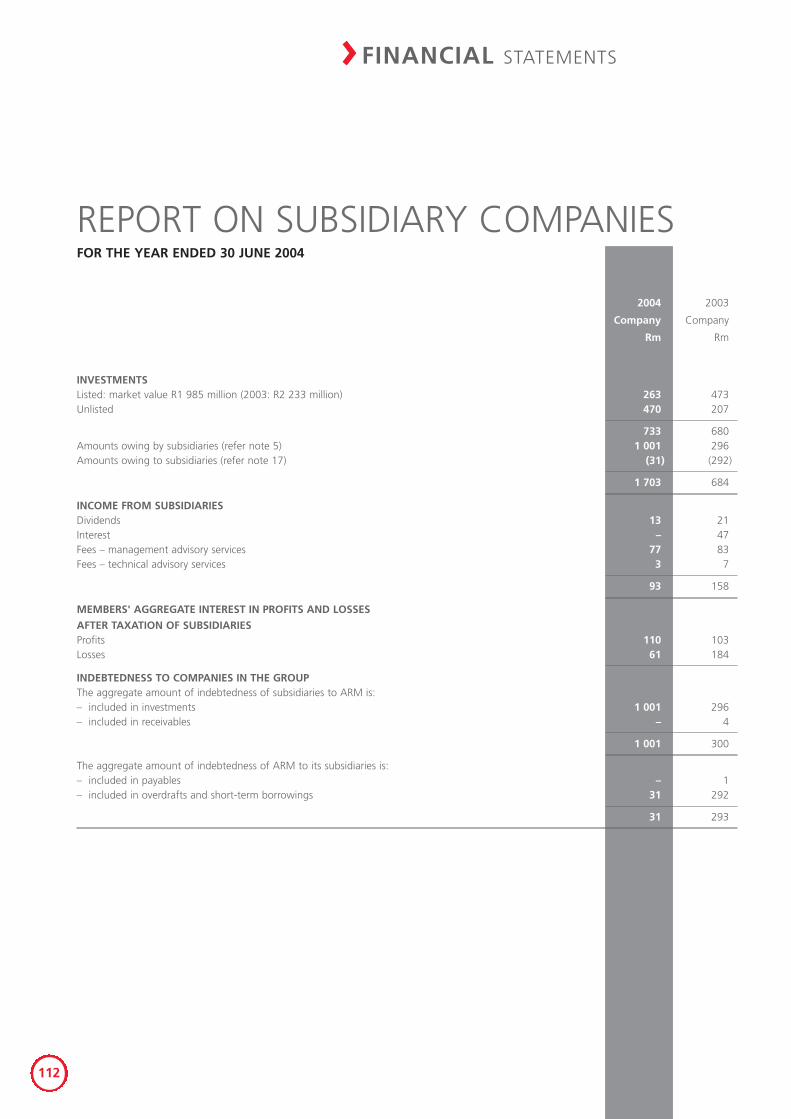
2004 2003
Company Company
Rm Rm
INVESTMENTSListed: market value R1 985 million (2003: R2 233 million) 263 473 Unlisted 470 207
733 680 Amounts owing by subsidiaries (refer note 5) 1 001 296 Amounts owing to subsidiaries (refer note 17) (31) (292)
1 703 684
INCOME FROM SUBSIDIARIES Dividends 13 21 Interest – 47 Fees – management advisory services 77 83 Fees – technical advisory services 3 7
93 158
MEMBERS' AGGREGATE INTEREST IN PROFITS AND LOSSES
AFTER TAXATION OF SUBSIDIARIES Profits 110 103 Losses 61 184
INDEBTEDNESS TO COMPANIES IN THE GROUP The aggregate amount of indebtedness of subsidiaries to ARM is: – included in investments 1 001 296 – included in receivables – 4
1 001 300
The aggregate amount of indebtedness of ARM to its subsidiaries is: – included in payables – 1 – included in overdrafts and short-term borrowings 31 292
31 293
REPORT ON SUBSIDIARY COMPANIESFOR THE YEAR ENDED 30 JUNE 2004
> FINANCIAL STATEMENTS
112
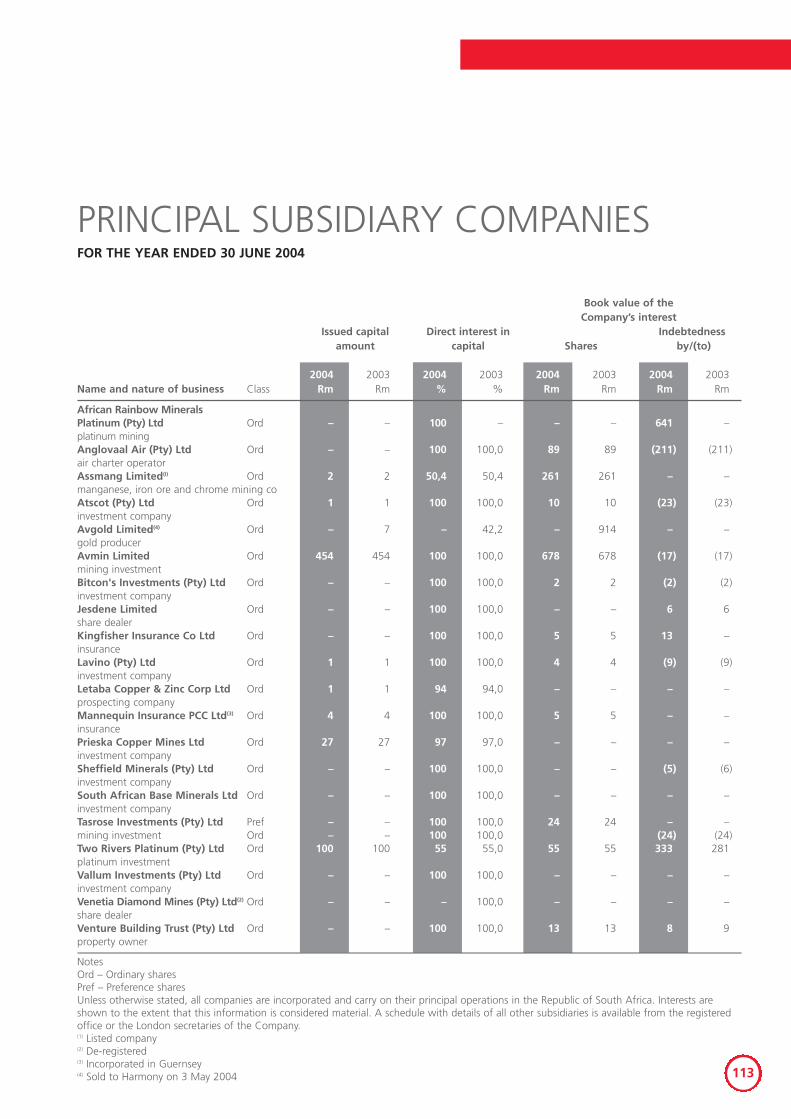
Book value of theCompany’s interest
Issued capital Direct interest in Indebtednessamount capital Shares by/(to)
2004 2003 2004 2003 2004 2003 2004 2003Name and nature of business Class Rm Rm % % Rm Rm Rm Rm
African Rainbow Minerals Platinum (Pty) Ltd Ord – – 100 – – – 641 –platinum miningAnglovaal Air (Pty) Ltd Ord – – 100 100,0 89 89 (211) (211)air charter operatorAssmang Limited(I) Ord 2 2 50,4 50,4 261 261 – –manganese, iron ore and chrome mining coAtscot (Pty) Ltd Ord 1 1 100 100,0 10 10 (23) (23)investment companyAvgold Limited(4) Ord – 7 – 42,2 – 914 – –gold producerAvmin Limited Ord 454 454 100 100,0 678 678 (17) (17)mining investmentBitcon's Investments (Pty) Ltd Ord – – 100 100,0 2 2 (2) (2)investment companyJesdene Limited Ord – – 100 100,0 – – 6 6share dealerKingfisher Insurance Co Ltd Ord – – 100 100,0 5 5 13 –insuranceLavino (Pty) Ltd Ord 1 1 100 100,0 4 4 (9) (9)investment companyLetaba Copper & Zinc Corp Ltd Ord 1 1 94 94,0 – – – –prospecting companyMannequin Insurance PCC Ltd(3) Ord 4 4 100 100,0 5 5 – –insurancePrieska Copper Mines Ltd Ord 27 27 97 97,0 – – – –investment companySheffield Minerals (Pty) Ltd Ord – – 100 100,0 – – (5) (6)investment companySouth African Base Minerals Ltd Ord – – 100 100,0 – – – –investment companyTasrose Investments (Pty) Ltd Pref – – 100 100,0 24 24 – –mining investment Ord – – 100 100,0 (24) (24)Two Rivers Platinum (Pty) Ltd Ord 100 100 55 55,0 55 55 333 281platinum investmentVallum Investments (Pty) Ltd Ord – – 100 100,0 – – – –investment companyVenetia Diamond Mines (Pty) Ltd(2) Ord – – – 100,0 – – – –share dealerVenture Building Trust (Pty) Ltd Ord – – 100 100,0 13 13 8 9property owner
NotesOrd – Ordinary sharesPref – Preference sharesUnless otherwise stated, all companies are incorporated and carry on their principal operations in the Republic of South Africa. Interests areshown to the extent that this information is considered material. A schedule with details of all other subsidiaries is available from the registeredoffice or the London secretaries of the Company.(1) Listed company(2) De-registered(3) Incorporated in Guernsey(4) Sold to Harmony on 3 May 2004
PRINCIPAL SUBSIDIARY COMPANIESFOR THE YEAR ENDED 30 JUNE 2004
113
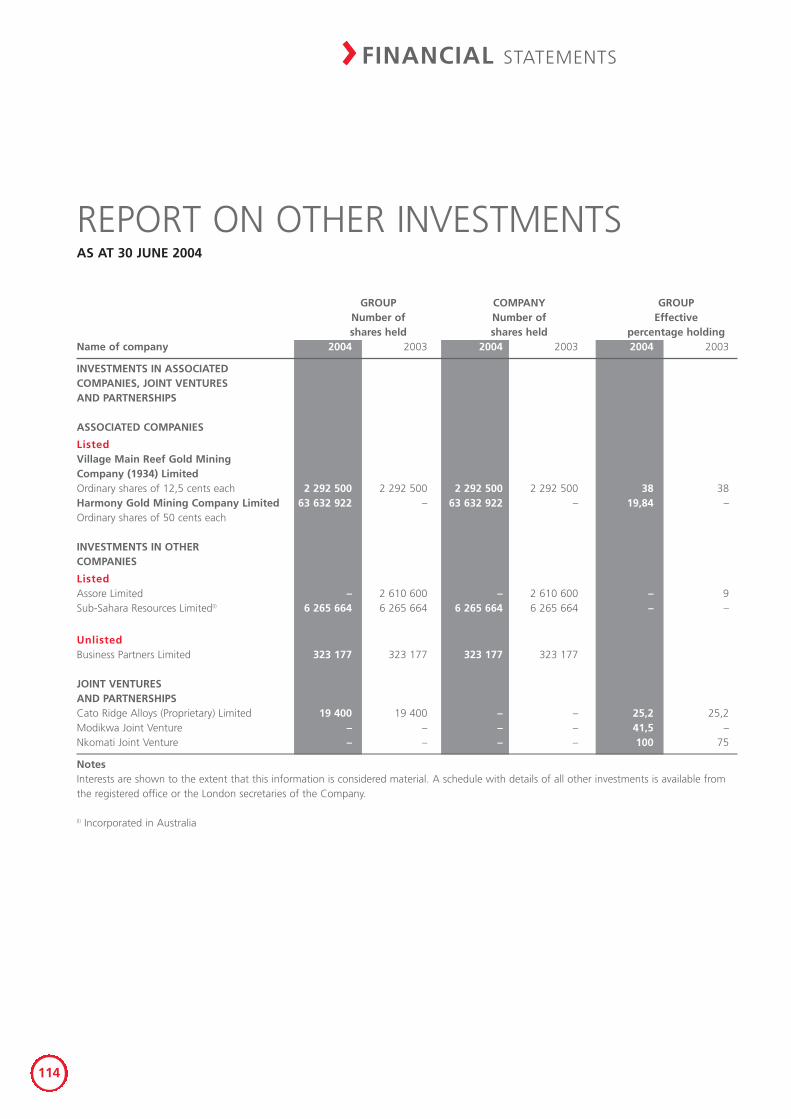
GROUP COMPANY GROUPNumber of Number of Effectiveshares held shares held percentage holding
Name of company 2004 2003 2004 2003 2004 2003
INVESTMENTS IN ASSOCIATEDCOMPANIES, JOINT VENTURES AND PARTNERSHIPS
ASSOCIATED COMPANIES
ListedVillage Main Reef Gold MiningCompany (1934) LimitedOrdinary shares of 12,5 cents each 2 292 500 2 292 500 2 292 500 2 292 500 38 38Harmony Gold Mining Company Limited 63 632 922 – 63 632 922 – 19,84 –Ordinary shares of 50 cents each
INVESTMENTS IN OTHER COMPANIES
ListedAssore Limited – 2 610 600 – 2 610 600 – 9Sub-Sahara Resources Limited(I) 6 265 664 6 265 664 6 265 664 6 265 664 – –
UnlistedBusiness Partners Limited 323 177 323 177 323 177 323 177
JOINT VENTURES AND PARTNERSHIPSCato Ridge Alloys (Proprietary) Limited 19 400 19 400 – – 25,2 25,2Modikwa Joint Venture – – – – 41,5 –Nkomati Joint Venture – – – – 100 75
NotesInterests are shown to the extent that this information is considered material. A schedule with details of all other investments is available fromthe registered office or the London secretaries of the Company.
(I) Incorporated in Australia
REPORT ON OTHER INVESTMENTSAS AT 30 JUNE 2004
> FINANCIAL STATEMENTS
114
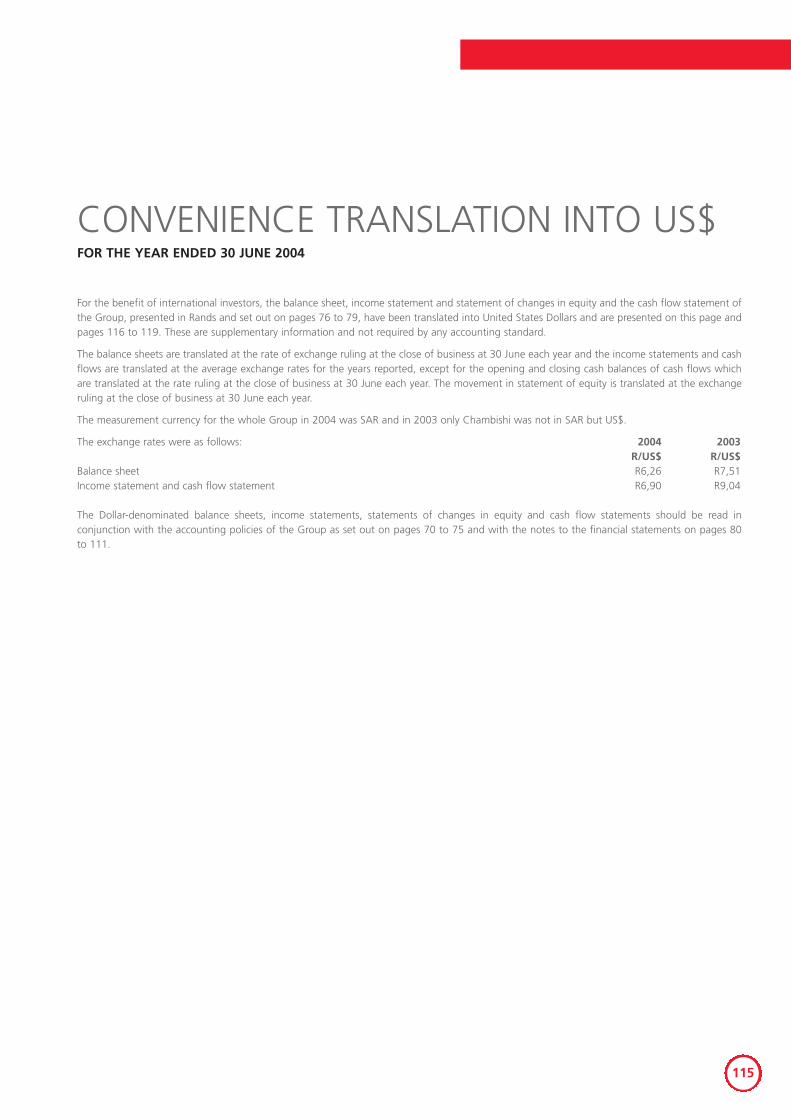
For the benefit of international investors, the balance sheet, income statement and statement of changes in equity and the cash flow statement ofthe Group, presented in Rands and set out on pages 76 to 79, have been translated into United States Dollars and are presented on this page andpages 116 to 119. These are supplementary information and not required by any accounting standard.
The balance sheets are translated at the rate of exchange ruling at the close of business at 30 June each year and the income statements and cashflows are translated at the average exchange rates for the years reported, except for the opening and closing cash balances of cash flows whichare translated at the rate ruling at the close of business at 30 June each year. The movement in statement of equity is translated at the exchangeruling at the close of business at 30 June each year.
The measurement currency for the whole Group in 2004 was SAR and in 2003 only Chambishi was not in SAR but US$.
The exchange rates were as follows: 2004 2003 R/US$ R/US$
Balance sheet R6,26 R7,51 Income statement and cash flow statement R6,90 R9,04
The Dollar-denominated balance sheets, income statements, statements of changes in equity and cash flow statements should be read inconjunction with the accounting policies of the Group as set out on pages 70 to 75 and with the notes to the financial statements on pages 80to 111.
CONVENIENCE TRANSLATION INTO US$FOR THE YEAR ENDED 30 JUNE 2004
115
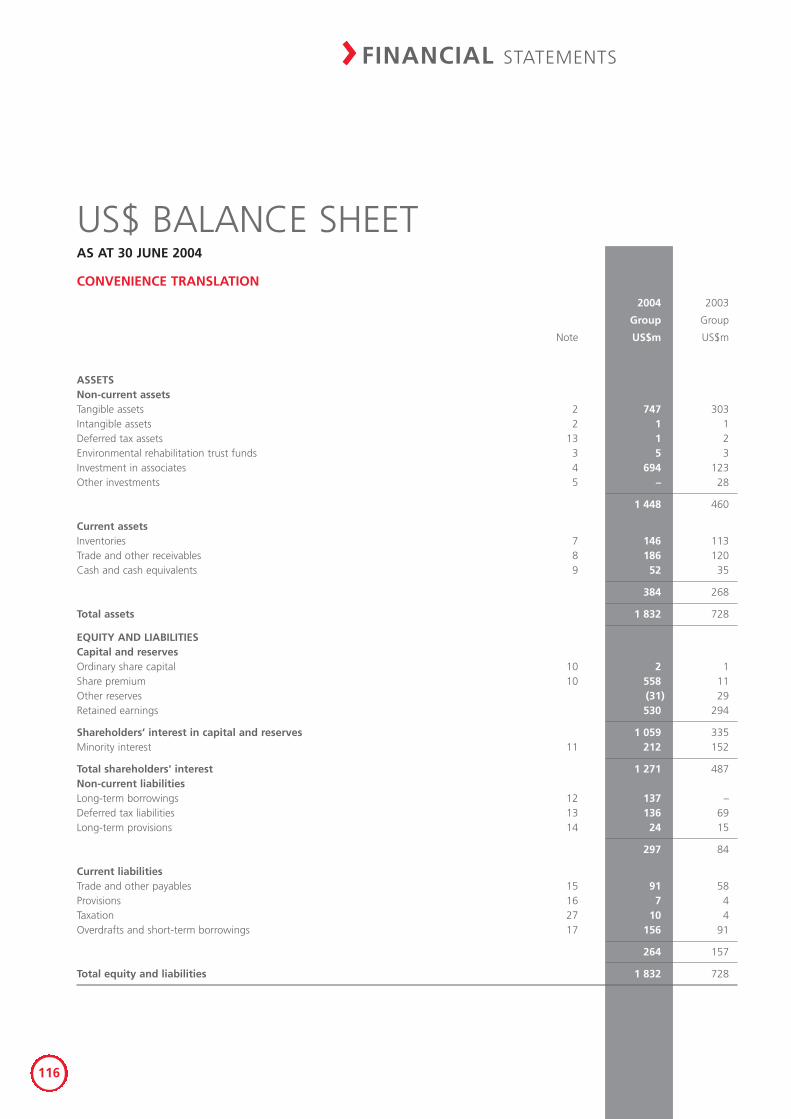
2004 2003
Group Group
Note US$m US$m
ASSETSNon-current assets Tangible assets 2 747 303 Intangible assets 2 1 1 Deferred tax assets 13 1 2 Environmental rehabilitation trust funds 3 5 3 Investment in associates 4 694 123Other investments 5 – 28
1 448 460
Current assets Inventories 7 146 113 Trade and other receivables 8 186 120 Cash and cash equivalents 9 52 35
384 268
Total assets 1 832 728
EQUITY AND LIABILITIES Capital and reserves Ordinary share capital 10 2 1 Share premium 10 558 11 Other reserves (31) 29 Retained earnings 530 294
Shareholders’ interest in capital and reserves 1 059 335 Minority interest 11 212 152
Total shareholders' interest 1 271 487 Non-current liabilitiesLong-term borrowings 12 137 –Deferred tax liabilities 13 136 69 Long-term provisions 14 24 15
297 84
Current liabilitiesTrade and other payables 15 91 58 Provisions 16 7 4 Taxation 27 10 4 Overdrafts and short-term borrowings 17 156 91
264 157
Total equity and liabilities 1 832 728
US$ BALANCE SHEETAS AT 30 JUNE 2004
CONVENIENCE TRANSLATION
> FINANCIAL STATEMENTS
116
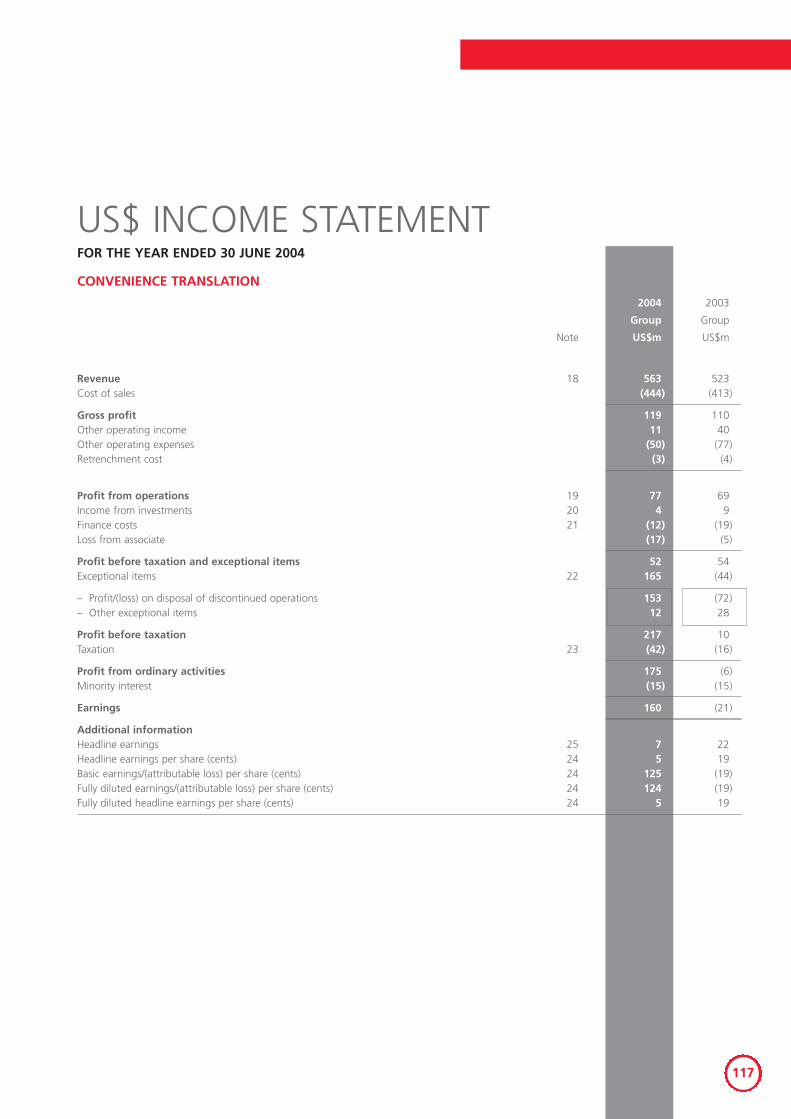
US$ INCOME STATEMENT
2004 2003
Group Group
Note US$m US$m
Revenue 18 563 523 Cost of sales (444) (413)
Gross profit 119 110Other operating income 11 40 Other operating expenses (50) (77)Retrenchment cost (3) (4)
Profit from operations 19 77 69 Income from investments 20 4 9 Finance costs 21 (12) (19)Loss from associate (17) (5)
Profit before taxation and exceptional items 52 54 Exceptional items 22 165 (44)
– Profit/(loss) on disposal of discontinued operations 153 (72)– Other exceptional items 12 28
Profit before taxation 217 10 Taxation 23 (42) (16)
Profit from ordinary activities 175 (6)Minority interest (15) (15)
Earnings 160 (21)
Additional informationHeadline earnings 25 7 22 Headline earnings per share (cents) 24 5 19 Basic earnings/(attributable loss) per share (cents) 24 125 (19)Fully diluted earnings/(attributable loss) per share (cents) 24 124 (19)Fully diluted headline earnings per share (cents) 24 5 19
FOR THE YEAR ENDED 30 JUNE 2004
117
CONVENIENCE TRANSLATION
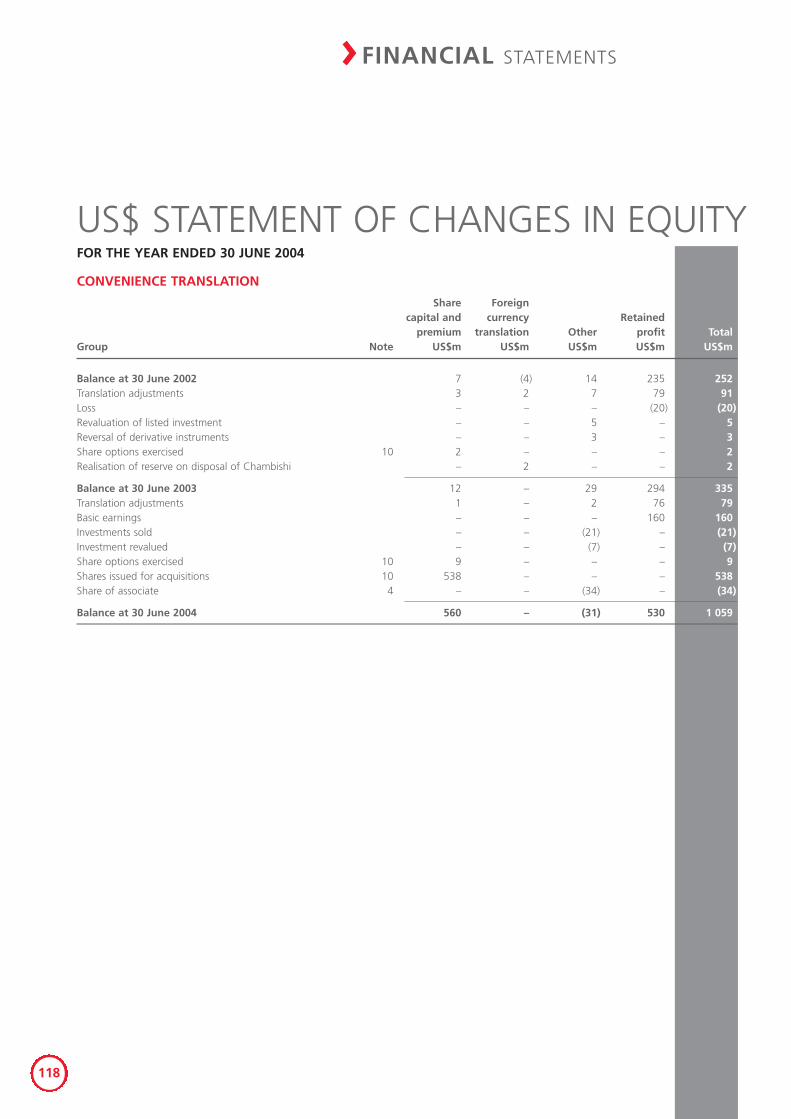
Share Foreigncapital and currency Retained
premium translation Other profit TotalGroup Note US$m US$m US$m US$m US$m
Balance at 30 June 2002 7 (4) 14 235 252 Translation adjustments 3 2 7 79 91Loss – – – (20) (20)Revaluation of listed investment – – 5 – 5 Reversal of derivative instruments – – 3 – 3 Share options exercised 10 2 – – – 2 Realisation of reserve on disposal of Chambishi – 2 – – 2
Balance at 30 June 2003 12 – 29 294 335Translation adjustments 1 – 2 76 79Basic earnings – – – 160 160Investments sold – – (21) – (21)Investment revalued – – (7) – (7)Share options exercised 10 9 – – – 9 Shares issued for acquisitions 10 538 – – – 538 Share of associate 4 – – (34) – (34)
Balance at 30 June 2004 560 – (31) 530 1 059
US$ STATEMENT OF CHANGES IN EQUITYFOR THE YEAR ENDED 30 JUNE 2004
> FINANCIAL STATEMENTS
118
CONVENIENCE TRANSLATION
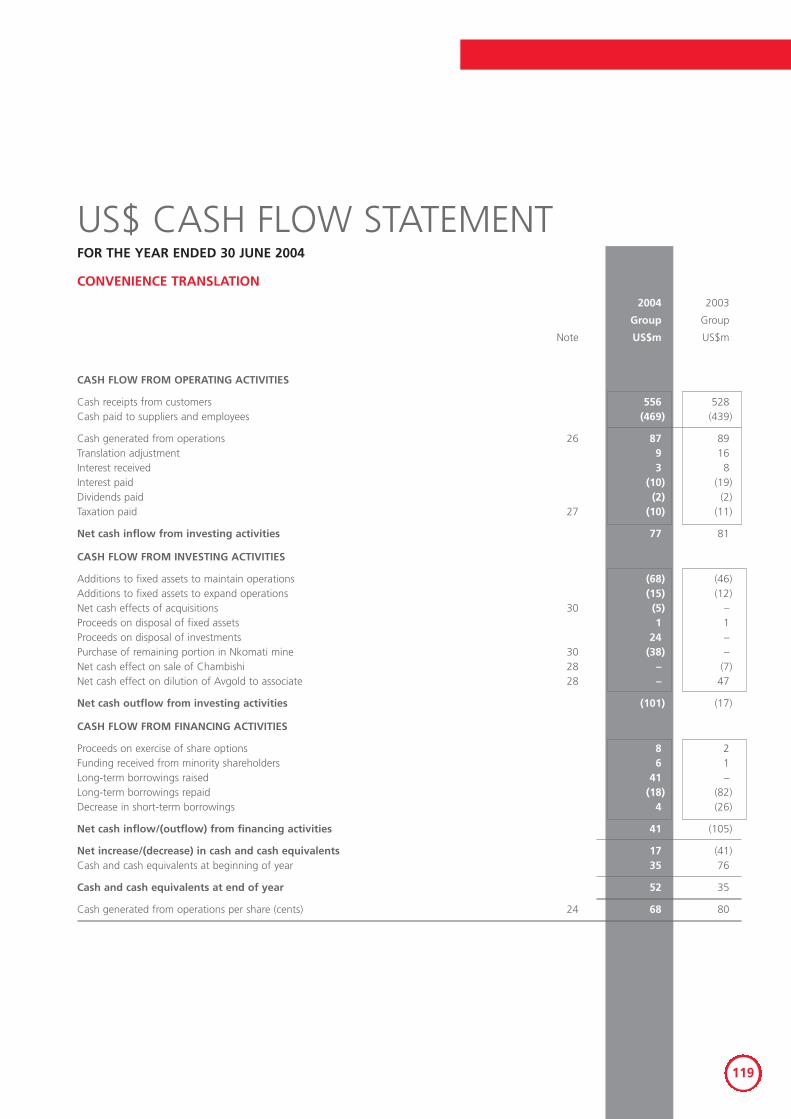
2004 2003
Group Group
Note US$m US$m
CASH FLOW FROM OPERATING ACTIVITIES
Cash receipts from customers 556 528 Cash paid to suppliers and employees (469) (439)
Cash generated from operations 26 87 89 Translation adjustment 9 16 Interest received 3 8 Interest paid (10) (19)Dividends paid (2) (2)Taxation paid 27 (10) (11)
Net cash inflow from investing activities 77 81
CASH FLOW FROM INVESTING ACTIVITIES
Additions to fixed assets to maintain operations (68) (46)Additions to fixed assets to expand operations (15) (12)Net cash effects of acquisitions 30 (5) – Proceeds on disposal of fixed assets 1 1 Proceeds on disposal of investments 24 – Purchase of remaining portion in Nkomati mine 30 (38) – Net cash effect on sale of Chambishi 28 – (7)Net cash effect on dilution of Avgold to associate 28 – 47
Net cash outflow from investing activities (101) (17)
CASH FLOW FROM FINANCING ACTIVITIES
Proceeds on exercise of share options 8 2 Funding received from minority shareholders 6 1 Long-term borrowings raised 41 – Long-term borrowings repaid (18) (82)Decrease in short-term borrowings 4 (26)
Net cash inflow/(outflow) from financing activities 41 (105)
Net increase/(decrease) in cash and cash equivalents 17 (41)Cash and cash equivalents at beginning of year 35 76
Cash and cash equivalents at end of year 52 35
Cash generated from operations per share (cents) 24 68 80
US$ CASH FLOW STATEMENTFOR THE YEAR ENDED 30 JUNE 2004
119
CONVENIENCE TRANSLATION
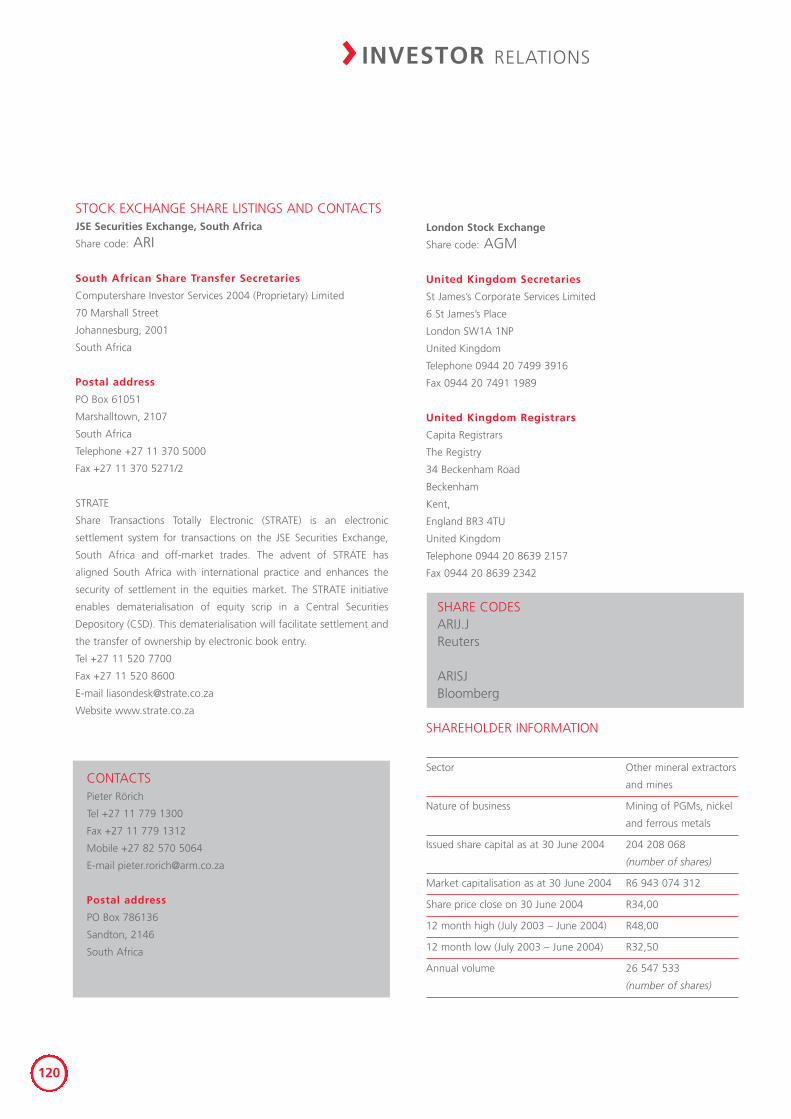
> INVESTOR RELATIONS
120
STOCK EXCHANGE SHARE LISTINGS AND CONTACTSJSE Securities Exchange, South Africa
Share code: ARI
South African Share Transfer Secretaries
Computershare Investor Services 2004 (Proprietary) Limited
70 Marshall Street
Johannesburg, 2001
South Africa
Postal address
PO Box 61051
Marshalltown, 2107
South Africa
Telephone +27 11 370 5000
Fax +27 11 370 5271/2
STRATE
Share Transactions Totally Electronic (STRATE) is an electronic
settlement system for transactions on the JSE Securities Exchange,
South Africa and off-market trades. The advent of STRATE has
aligned South Africa with international practice and enhances the
security of settlement in the equities market. The STRATE initiative
enables dematerialisation of equity scrip in a Central Securities
Depository (CSD). This dematerialisation will facilitate settlement and
the transfer of ownership by electronic book entry.
Tel +27 11 520 7700
Fax +27 11 520 8600
E-mail [email protected]
Website www.strate.co.za
London Stock Exchange
Share code: AGM
United Kingdom Secretaries
St James’s Corporate Services Limited
6 St James’s Place
London SW1A 1NP
United Kingdom
Telephone 0944 20 7499 3916
Fax 0944 20 7491 1989
United Kingdom Registrars
Capita Registrars
The Registry
34 Beckenham Road
Beckenham
Kent,
England BR3 4TU
United Kingdom
Telephone 0944 20 8639 2157
Fax 0944 20 8639 2342
SHARE CODESARIJ.JReuters
ARISJBloomberg
SHAREHOLDER INFORMATION
Sector Other mineral extractors
and mines
Nature of business Mining of PGMs, nickel
and ferrous metals
Issued share capital as at 30 June 2004 204 208 068
(number of shares)
Market capitalisation as at 30 June 2004 R6 943 074 312
Share price close on 30 June 2004 R34,00
12 month high (July 2003 – June 2004) R48,00
12 month low (July 2003 – June 2004) R32,50
Annual volume 26 547 533
(number of shares)
CONTACTSPieter Rörich
Tel +27 11 779 1300
Fax +27 11 779 1312
Mobile +27 82 570 5064
E-mail [email protected]
Postal address
PO Box 786136
Sandton, 2146
South Africa
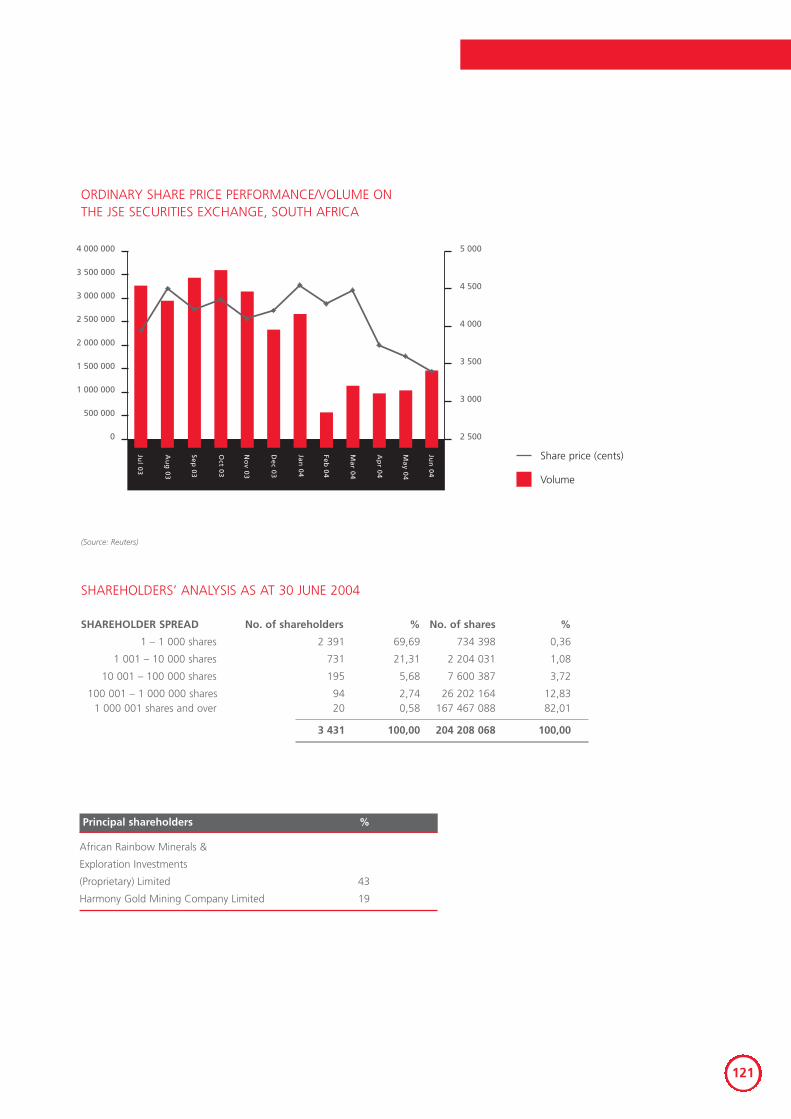
121
ORDINARY SHARE PRICE PERFORMANCE/VOLUME ONTHE JSE SECURITIES EXCHANGE, SOUTH AFRICA
(Source: Reuters)
SHAREHOLDERS’ ANALYSIS AS AT 30 JUNE 2004
SHAREHOLDER SPREAD No. of shareholders % No. of shares %
1 – 1 000 shares 2 391 69,69 734 398 0,36
1 001 – 10 000 shares 731 21,31 2 204 031 1,08
10 001 – 100 000 shares 195 5,68 7 600 387 3,72
100 001 – 1 000 000 shares 94 2,74 26 202 164 12,831 000 001 shares and over 20 0,58 167 467 088 82,01
3 431 100,00 204 208 068 100,00
0
500 000
1 000 000
1 500 000
2 000 000
2 500 000
3 000 000
3 500 000
4 000 000
2 500
3 000
3 500
4 000
4 500
5 000
Jul 0
3
Au
g 0
3
Sep
03
Oct 0
3
No
v 03
De
c 03
Jan
04
Feb
04
Ma
r 04
Ap
r 04
Ma
y 04
Jun
04
Volume
Share price (cents)
Principal shareholders %
African Rainbow Minerals &
Exploration Investments
(Proprietary) Limited 43
Harmony Gold Mining Company Limited 19
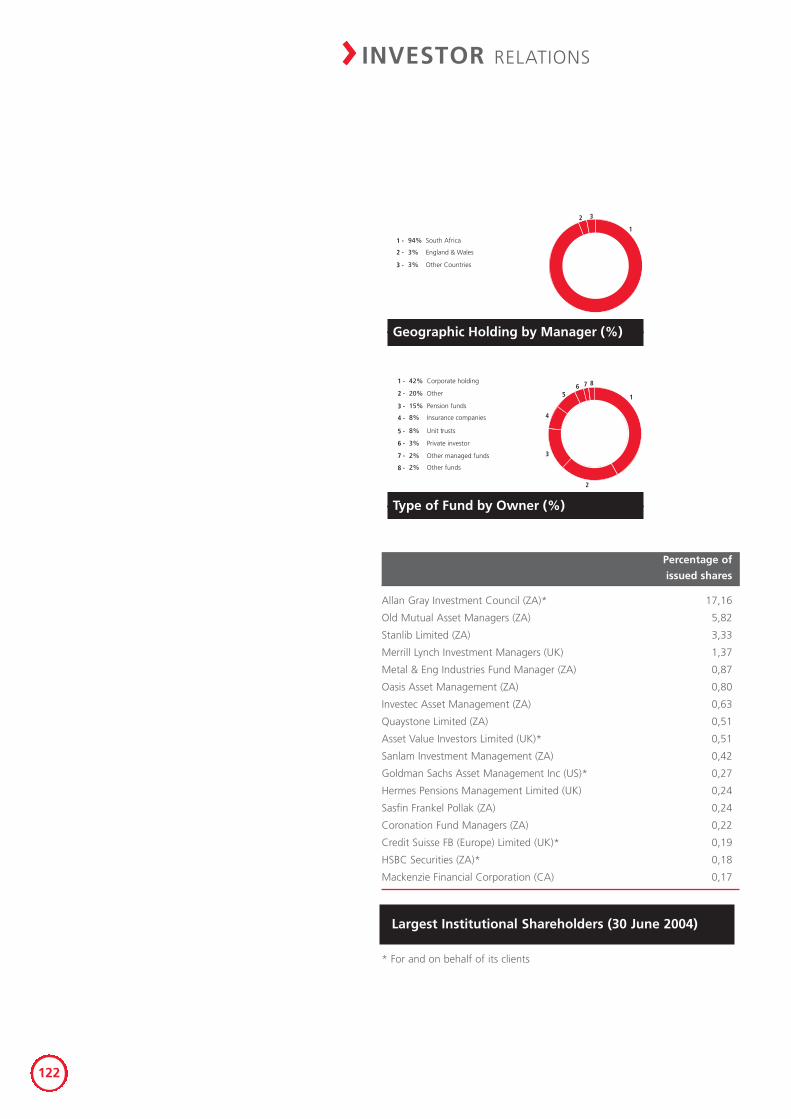
> INVESTOR RELATIONS
122
* For and on behalf of its clients
Percentage of
issued shares
Allan Gray Investment Council (ZA)* 17,16
Old Mutual Asset Managers (ZA) 5,82
Stanlib Limited (ZA) 3,33
Merrill Lynch Investment Managers (UK) 1,37
Metal & Eng Industries Fund Manager (ZA) 0,87
Oasis Asset Management (ZA) 0,80
Investec Asset Management (ZA) 0,63
Quaystone Limited (ZA) 0,51
Asset Value Investors Limited (UK)* 0,51
Sanlam Investment Management (ZA) 0,42
Goldman Sachs Asset Management Inc (US)* 0,27
Hermes Pensions Management Limited (UK) 0,24
Sasfin Frankel Pollak (ZA) 0,24
Coronation Fund Managers (ZA) 0,22
Credit Suisse FB (Europe) Limited (UK)* 0,19
HSBC Securities (ZA)* 0,18
Mackenzie Financial Corporation (CA) 0,17
Type of Fund by Owner (%)
42% Corporate holding
20% Other
15% Pension funds
8% Insurance companies
8% Unit trusts
3% Private investor
2% Other managed funds
2% Other funds
1 -
2 -
3 -
4 -
5 -
6 -
7 -
8 -
1
2
3
4
56 7 8
Geographic Holding by Manager (%)
94% South Africa
3% England & Wales
3% Other Countries
1
2 3
1 -
2 -
3 -
Largest Institutional Shareholders (30 June 2004)
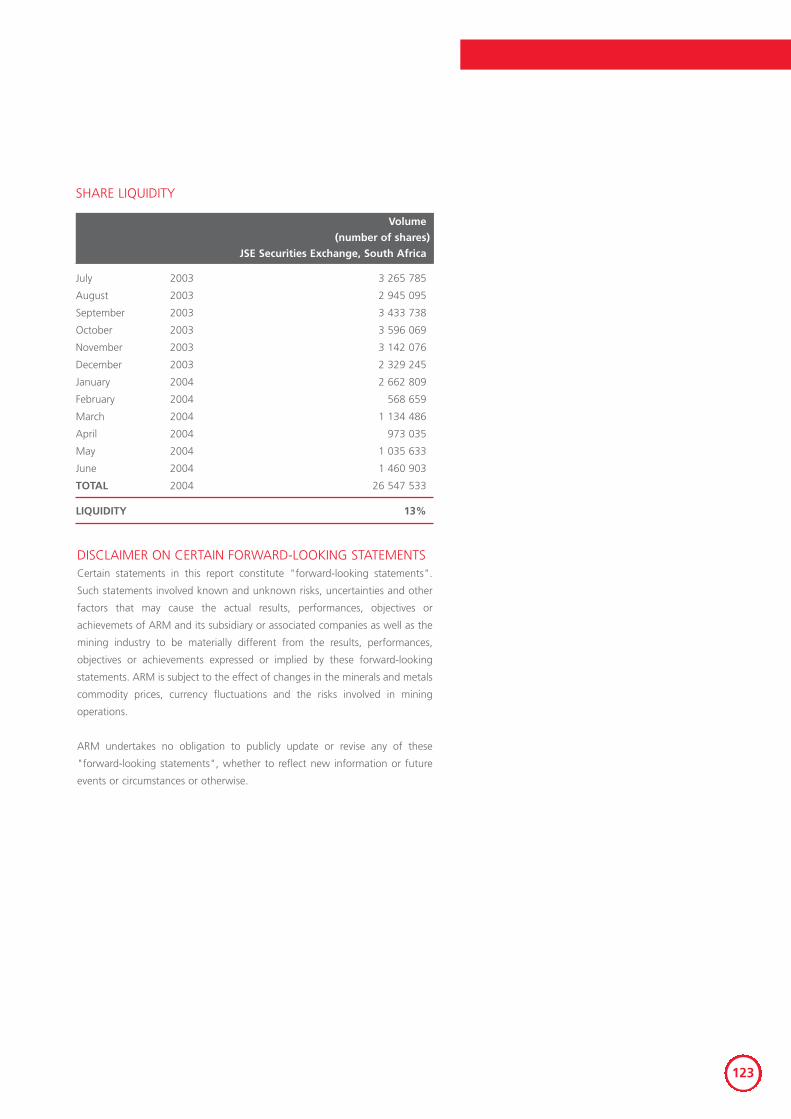
123
DISCLAIMER ON CERTAIN FORWARD-LOOKING STATEMENTSCertain statements in this report constitute "forward-looking statements".
Such statements involved known and unknown risks, uncertainties and other
factors that may cause the actual results, performances, objectives or
achievemets of ARM and its subsidiary or associated companies as well as the
mining industry to be materially different from the results, performances,
objectives or achievements expressed or implied by these forward-looking
statements. ARM is subject to the effect of changes in the minerals and metals
commodity prices, currency fluctuations and the risks involved in mining
operations.
ARM undertakes no obligation to publicly update or revise any of these
"forward-looking statements", whether to reflect new information or future
events or circumstances or otherwise.
Volume
(number of shares)
JSE Securities Exchange, South Africa
July 2003 3 265 785
August 2003 2 945 095
September 2003 3 433 738
October 2003 3 596 069
November 2003 3 142 076
December 2003 2 329 245
January 2004 2 662 809
February 2004 568 659
March 2004 1 134 486
April 2004 973 035
May 2004 1 035 633
June 2004 1 460 903
TOTAL 2004 26 547 533
LIQUIDITY 13%
SHARE LIQUIDITY
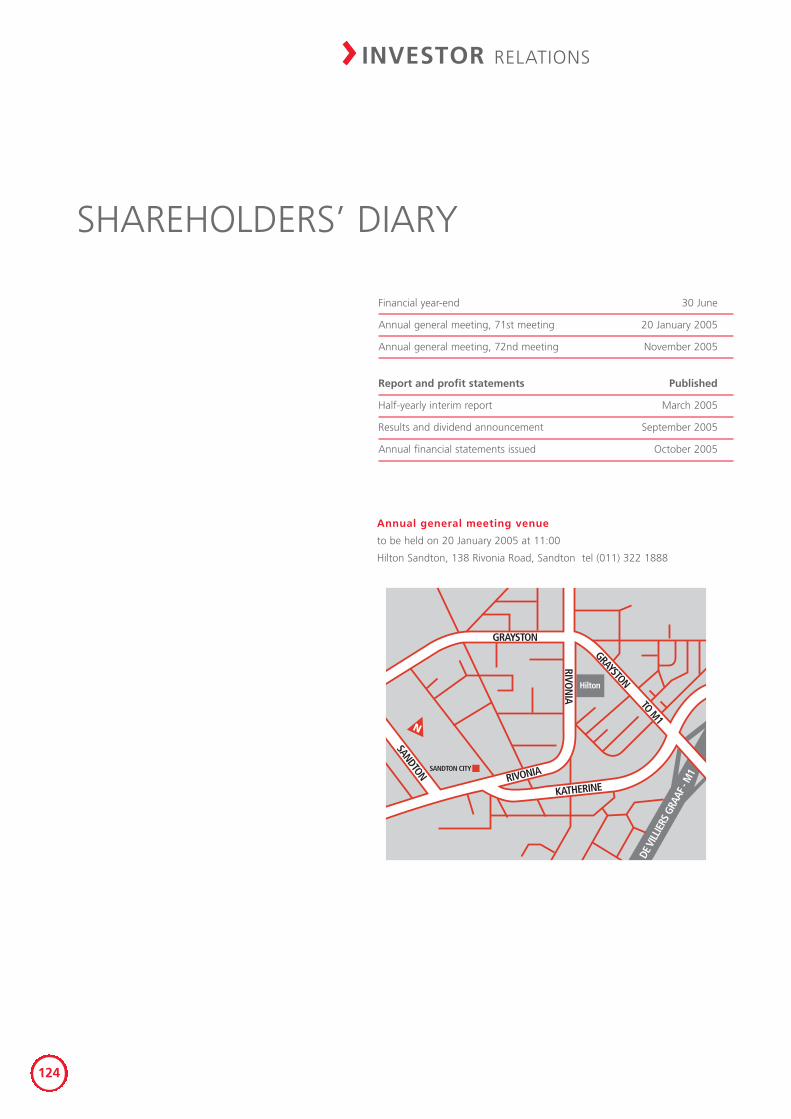
Financial year-end 30 June
Annual general meeting, 71st meeting 20 January 2005
Annual general meeting, 72nd meeting November 2005
Report and profit statements Published
Half-yearly interim report March 2005
Results and dividend announcement September 2005
Annual financial statements issued October 2005
SHAREHOLDERS’ DIARY
> INVESTOR RELATIONS
124
SANDTON CITY
GRAYSTON
RIVON
IA
GRAYSTON
TO M1
SANDTON RIVONIA
KATHERINE
DE V
ILLIE
RS G
RAAF
- M
1Hilton
N
Annual general meeting venue
to be held on 20 January 2005 at 11:00
Hilton Sandton, 138 Rivonia Road, Sandton tel (011) 322 1888
NOTICE OF ANNUAL GENERAL MEETING
125
African Rainbow Minerals Limited
(Formerly Anglovaal Mining Limited)
(Registration number 1933/004580/06)
Share codes: South Africa ARI
London Stock Exchange AGM
ISIN ZAE000017141
The “Company”
Notice is hereby given that the seventy-first annual general meeting of
members of African Rainbow Minerals Limited will be held at Hilton Sandton,
138 Rivonia Road, Sandton, on Thursday, 20 January 2005 at 11:00, for the
following purposes:
1 To receive and consider the annual financial statements for the year ended
30 June 2004.
2 To elect the following directors in accordance with the provisions of the
Company’s articles of association, and who, being eligible, offer themselves
for re-election, namely, Messrs RP Menell and JR McAlpine.
Refer footnotes for directors’ curricula vitae
3 To elect the following directors who were appointed, as such, since the last
annual general meeting and who, being eligible, offer themselves for
election namely; Mesdames MMM Bakane-Tuoane (Dr) and RV Simelane
(Dr) and Messrs F Abbott, WM Gule, MW King, AK Maditsi, PJ Manda,
PS Sibisi (Dr), MV Sisulu and AJ Wilkens.
Refer footnotes for directors’ curricula vitae
To consider and, if deemed fit, to pass, with or without modification, the
following ordinary resolution:
Ordinary resolution number 1
“Resolved that the remuneration to be paid to the directors shall be paid out
of the funds of the Company as fees and is hereby increased from R100 000
to R110 000 per annum for the chairman and from R60 000 to R66 000 per
annum for each of the other directors, and directors’ meeting attendance fees
be increased from R7 000 to R7 700 per meeting for the chairman and from
R4 200 to R4 700 per meeting for each of the other directors, payable quarterly
in arrears, with effect from 1 July 2004 until otherwise determined by the
Company in general meeting.”
4 To transact such other business as may be transacted at an annual
general meeting.
VOTING AND PROXIESEach shareholder of the Company who is registered as such and who, being an
individual, is present in person or by proxy or which, being a company, is
represented, at the annual general meeting is entitled to one vote on a show
of hands.
On a poll, each shareholder present in person or by proxy or represented shall
have one vote for every share held by such shareholder.
FOOTNOTESDirectors retiring by rotation and are seeking re-election
Richard Peter Menell, (49), MA, MSc. A director of companies. Deputy
chairman and formerly the executive chairman of the board of directors. He
relinquished the latter position on 4 May 2004. A director of the Company
since 1994. Chairman of the sustainable development committee and a
member of the investment committee.
James Roy McAlpine, (63), BSc, CA (Scotland). Director of companies. An
independent non-executive director. Appointed to the board during 1998. He
serves as a member of the audit and remuneration committees.
Confirmations of appointments of directors appointed since the
last annual general meeting
Frank Abbott, (49), BCom, CA(SA), MBL. Executive financial director of the
Company, appointed to the board during 2004.
Mmapusetso Manana Maria Bakane-Tuoane Dr, (56), BA, MA, PhD. Public
administrator – director general. Appointed to the board in 2004. Chairman of
the remuneration and a member of the sustainable development committees.
An independent non-executive director.
Wilson Mangisi Gule, (52), BA(Hons). Executive director appointed to the board
on 1 December 2004.
Michael Wallis King, (67), CA(SA), FCA. Director of companies. An
independent non-executive director. Chairman of the audit committee and
member of the investment committee. First appointed to the board in 2004.
Alexander Komape Maditsi, (42), BProc, LLB, LLM. International corporate
lawyer. Appointed to the board in 2004 and serves on the audit and
nomination committees. An independent non-executive board member.
NOTICE OF ANNUAL GENERAL MEETING
> FINANCIAL STATEMENTS
126
Peter Johannes Manda, (47), BJuris, LLB, LLM. Chief executive officer of a
premier league football club. An independent non-executive director;
Chairman of the empowerment and a member of the sustainable development
committees. Appointed 2004.
Patrick Sibusiso Sibisi Dr, (49), BSc (Hons), PhD. Chief executive officer of
the CSIR. An independent non-executive director appointed in 2004. Appointed
to the board in 2004 and serves as chairman of the investment committee.
Rejoice Vakashile Simelane Dr, (52), BA, MA, PhD (Economics). Economist. An
independent non-executive director appointed in 2004. Serves on the audit
and nomination committees.
Max Vuyisile Sisulu (59), MPA, MSc. General manager of a leading energy and
chemical company. An independent non-executive director appointed during
2004 as a director and is a member of the empowerment and sustainable
development committees.
Andries Jacobus Wilkens (56), Mine Managers Certificate of Competency,
MDPA (Unisa), RMIIA. Mining engineer. Chief executive officer of the Company
appointed on 26 October 2004.
Certificated shareholders/dematerialised shareholders with
own name registrations
Shareholders who have not yet dematerialised their shares or who have
dematerialised their shares with own name registration (“Entitled
Shareholders”) may appoint one or more proxies to attend, speak and vote or
abstain from voting in such shareholders’ stead. The person so appointed need
not be a member of the Company. A form of proxy is attached for the use of
those Entitled Shareholders who wish to be so represented. Such Entitled
Shareholders should complete the attached form of proxy in accordance with
the instructions contained therein and deposit it at the registered office of
the Company, namely ARM House, 29 Impala Road, Chislehurston, Sandton,
South Africa, (PO Box 786136, Sandton, 2146) or the transfer secretaries,
Computershare Investor Services 2004 (Proprietary) Limited, 7th Floor,
70 Marshall Street, Johannesburg 2001, South Africa (PO Box 61051,
Marshalltown 2107, South Africa) or the United Kingdom share registrars,
Capita Registrars, The Registry, 34 Beckenham Road, Beckenham, Kent,
England BR3 4TU to be received by 11:00 on Tuesday, 18 January 2005.
127
Dematerialised shareholders
Shareholders who have dematerialised their shares (other than those with own
name registrations) should provide their Central Securities Depository
Participant (“CSDP”) or broker with their voting instructions in terms of the
custody agreement entered into with the relevant CSDP or broker. Should such
shareholders wish to attend the annual general meeting or send a proxy to
represent them at the annual general meeting, they should inform their CSDP
or broker timeously and request their CSDP or broker to issue them with the
necessary authorisation to attend.
By order of the board
RH Phillips
Group company secretary
Sandton
8 December 2004
NOTICE OF ANNUAL GENERAL MEETING
> FINANCIAL STATEMENTS
128
DESIGN Visual Ignition 1550
African Rainbow Minerals Limited
(formerly Anglovaal Mining Limited)
Incorporated in the Republic of South Africa
Registration number 1933/004580/06
Company secretary
RH Phillips
Registered office and company secretary’s address
Physical address
ARM House
29 Impala Road
Chislehurston
Sandton
2146
Postal address
PO Box 786136
Sandton
2146
Telephone +27 11 779 1300
Telefax +27 11 779 1312
E-mail [email protected]
Website
http://www.arm.co.za
Auditors
Ernst & Young
Bankers
Absa Bank Limited
FirstRand Bank Limited
Nedbank Limited
The Standard Bank of South Africa Limited
Sponsors
Deutsche Securities SA (Proprietary) Limited
ADMINISTRATION