contents · contents profile 2 year at a glance 3 ... divisions offer merchant banking, asset-based...
TRANSCRIPT

C O N T E N T S
PROFILE 2
YEAR AT A GLANCE 3
CHAIRMAN’S STATEMENT 6
NON-EXECUTIVE DIRECTORS 9
MANAGEMENT STRUCTURE 12
GROUP STRUCTURE 13
TEN YEAR SUMMARY 14
POSITIONING STATEMENT 21
CHIEF EXECUTIVE’S REPORT 22
REVIEW OF OPERATIONS 28
GROUP VALUE ADDED STATEMENT 47
SEGMENTAL ANALYSIS BY MARKET FOCUS 48
SEGMENTAL ANALYSIS – CORPORATE BANKING 50
SEGMENTAL ANALYSIS – INVESTMENT MANAGEMENT 52
SEGMENTAL ANALYSIS – RETAIL BANKING 54
SEGMENTAL ANALYSIS BY BUSINESS ACTIVITY 56
CORPORATE GOVERNANCE 58
RISK MANAGEMENT 69
DEFINITIONS 88
GLOSSARY OF TERMS 91
CORPORATE INFORMATION 92

2
P R O F I L E
BoE is a specialist provider of innovative financial solutions to
businesses, and through businesses to individuals. Originally
established as a trust company in Cape Town, South Africa, in
1838, BoE (formerly The Board of Executors) has been in
operation for more than 163 years. BoE was listed on the JSE
Securities Exchange in 1987. In 1998 BoE merged with NBS
and Boland PKS to establish the core of the current Group.
NBS was established as a building society in 1882 and Boland
as a regional general bank in 1900.
As a South African group, BoE operates in both first world and
emerging markets. The Group focuses on selected market
segments in which we have developed expertise. BoE’s major
thrust is serving business, and through business to deliver
service to individuals, whether they be the owners, managers,
employees or customers of these businesses.
BoE comprises three main business groupings. Business-facing
divisions offer merchant banking, asset-based lending to
corporates, full-service commercial banking and e-commerce
facilities. Investment management divisions offer private
banking, asset management, employee benefits, insurance and
fund administration services. The retail divisions offer
consumer credit, secured and unsecured lending products and
savings accounts to individuals.
Through a combination of high levels of client service and
innovative products and ways in which products are delivered
to customers, BoE seeks to differentiate itself from
its competitors.
■ MISSION STATEMENT
BoE’s mission is to be one of the most highly rated and
respected specialist banking and financial services groups,
providing innovative financial solutions to businesses, and
through businesses to individuals. BoE seeks to add value by
developing and maintaining strong long-term relationships
with its clients in order to appreciate and understand their
financial needs.
■ PHILOSOPHY
BoE’s philosophy is to conduct its affairs with
uncompromising honesty, integrity, diligence and
professionalism and to be known for this by its stakeholders.
In particular, all staff shall:
■ Demonstrate a commitment to improve productivity,
efficiency and quality.
■ Carry out their duties with skill and care.
■ Do business in a professional manner and according to the
highest standards of conduct and ethics.
■ Exhibit loyalty and dedication in all matters pertaining to the
affairs of BoE.
■ Not place themselves in a position where their personal
interests could conflict with their duties to their clients and
to BoE.
■ Be prudent in the use of information acquired in the course
of their duties and respect the confidentiality of corporate
and client information.
■ Not discriminate on the basis of race, religion or gender.
The detailed Code of Ethics adopted by the Group
encompasses not only all staff and directors of BoE, but also
recognises the ethical obligations of each stakeholder and the
importance of a relationship of honesty,openness and fairness.

3
Y E A R A T A G L A N C E
After the 2000 financial year, when BoE focused to a large
extend on restructuring its complex structure, the 2001 year
has been a busy one refining the Group’s strategy for its
coreoperations,enhancing capital management and improving
operating efficiences. The Group is a specialist provider of
innovative financial solutions to businesses, and through
businesses to individuals. These banking, asset management
and insurance solutions cater for the corporates themselves,
their owners and other high net worth individuals, their
employees and their customers.
■ CAPITAL MANAGEMENT
The Group continues to have excess capital. Steps taken to
improve the return on capital for shareholders are:
■ Continuation of the share buy-back programme.
■ Return on equity improved to 18% whilst maintaining a
return on assets of 1.8%.
■ Improved allocation of capital between divisions.
■ Excess capital in insurance companies moved to the
centre at year end.
■ Acquisitions of additional businesses in line with the
strategy:
– Credcor,
– Cashbank,
– Edge Investments, and
– Stenham Gestinor.
■ All divisions measured on an economic value-added basis
and capital managed centrally.
■ FUNDING PROFILE
With liquidity being key to any bank’s success, funding will
always remain a focus area. To ensure diversity of and to
lengthen funding, the Group has:
■ raised a US$130m offshore syndicated loan;
■ issued a R1 750m local unsubordinated bond; and
■ broadened its base of corporate depositors.
■ OPERATIONS
The key focus for the year was on operations.This mainly
concerned driving business in the core corporate
businesses, resolving issues in under-performing divisions,
the integration of new acquisitions, and increased cross-sell
and co-operation between divisions.
Operational
■ Fair topline revenue growth, with particularly good
growth in non-funded income.
■ Tight expense control.
■ Provisions in NBS have been set at adequate levels.
■ Local asset management has started to get good business
inflows.
■ Cheque processing outsourced to ABSA, with good cost
savings being achieved.
■ Continued growth in BoE Corporate advances.
■ BoE Merchant Bank had a strong profit growth in most of
its divisions, with particularly strong performance from
Private Equity.
■ With its focused strategy of providing banking to small
and medium-sized corporates, BoE Bank Business
Division delivered strong earnings.
■ BoE Life Assurance increased its new business premium
flows by targeting the broker market. Now more than
50% of new business comes through brokers.
■ Strong performance from Credcor, a new acquisition to
the Group.
■ NBS successfully launched a personal loan product,
utilising RCS systems infrastructure. Loans at year end
amounted to R71m.
■ Businesses have been grouped by market focus area to
effect synergies and increased cross-selling.
■ Continued roll out of PEP Bank branches (presently
61 open).
■ Corporate Social Investment refocused to align with the
business strategy.

4
Y E A R A T A G L A N C E
Under-performing divisions
■ Within NBS, problems with PiP’s and other non-
performing advances were experienced, mainly within
the residential development loans and NBS commercial
property loans divisions. New lending has been
discontinued in both these areas and provisions
raised accordingly. With increased focus, PiP levels are
now improving.
■ NBS retail mortgage loan growth was impaired by the
intermediary market. The retail mortgage division has
now been separated from the rest of NBS. New
management has been put in place whose objectives will
be to enhance growth and reduce costs.
■ With Nsureline’s small share of the direct short-term
insurance market not allowing for sufficient economies
of scale, it was decided to exit the market. This division
was sold in January 2001.
■ The cost infrastructure in the local Asset Management
division was re-aligned to fit its current size. This
included outsourcing several back office functions and
retrenchment of certain staff. With the division’s current
consistent investment performance, profitability in 2002
should be restored to acceptable levels.
■ Costs within BoE Private Bank were restructured to
improve profitability, which should reflect in the
2002 numbers.
■ The Kempton Park fraud case was concluded with an
after tax loss arising of R30m.
Integration of new businesses
■ The acquisition of Credcor (April 2001) went smoothly.It
now forms part of the Retail Banking Division within
BoE. Several areas have been integrated into other
divisions within the Group and cross-sell opportunities
have been identified and are currently being explored.
■ The acquisition of Edge (May 2001) has enabled BoE to
complete a comprehensive Employee Benefit offering.
Edge is being fully integrated into the Investment
Management Business within BoE and cross-sell to BoE
clients has commenced.
■ The acquisition of Stenham Gestinor was approved on
14 September 2001 and it will be integrated with BoE’s
offshore operations to provide a more complete product
offering to South African clients. It now forms part of the
Investment Management Business.
■ Cashbank – Approval for the deal was received on
31 October 2001. Integration of the business can
now proceed.
■ NON-CORE INVESTMENTS
The Group has largely dealt with its non-core investments.
Unfortunately, the sale of Century City did not go through,
but various steps have been taken to restructure these
remaining investments:
■ The Canal Walk shopping centre at Century City is
operating as planned, and the return on investment is
expected to improve in the medium term.
■ To re-finance Monex Ltd, a successful rights offer was
conducted, allowing BoE to reduce its debt exposure,
whilst Monex’s gearing position improved. Subsequent
to year end, an offer to minority shareholders of Monex
was made by BoE Bank Limited,and it has been proposed
that the company be delisted.
■ The investment in African Bank Investments Ltd was
disposed of.
■ DISCLOSURE
BoE continues to maintain a position of open disclosure:
■ Increased communication with the press.
■ Continued pro-active interaction with the market.
■ New website launched with increased information.
■ Corporate Citizenship report produced, moving towards
triple bottom line disclosure.

5
■ TARGETS FOR THE YEAR AHEAD■ ROE of 20% at current interest rate levels.
■ Continued earnings growth.
■ Margins to be maintained at greater than 4.3%.
■ Cost to income ratio to be held at around 50%.
■ Integration of Retail Banking division to be completed.
■ Integration of Investment Management divisions to
be completed.
■ NBS Mortgage Loan division to be restored
to profitability.
■ Further integration of back office processing to
be explored.
■ Transparency to be maintained.
■ BoE’s good record of Corporate Social Investment to
be continued.
■ Plans for compliance with King II to be implemented.
Best practice Standards of Corporate Governance to
be maintained.
Y E A R A T A G L A N C E
■ INCOME DRIVERS
6
C H A I R M A N ’ S S T A T E M E N T
■ BACKGROUND
The year under review was characterised by a high level of
volatility and uncertainty in financial markets. Furthermore,
both the global and South African banking environments
remained intensely competitive. Against this challenging
macro-economic environment, the Group continues to
develop its core businesses by building on a strategy of
combining organic growth with selective strategic
acquisitions.The Group continues to groom itself to generate
consistent growth in profitability.
The results reflect mixed fortunes for the Group. Earnings per
share increased by 15% to 52.1 cents and return on equity
increased from 15.8% to 18.1%. Excellent results were
achieved by our Merchant, Corporate and Business Banking
divisions, which now contribute 58% to the Group’s profits.
Together these divisions achieved a return on equity of 30.2%.
The Investment Management divisions, including private bank,
asset management and international businesses, performed
below expectations. Group expenses were tightly controlled.
The results were adversely affected by a significant increase in
provisions against our non-performing loans and properties in
possession in the NBS division. Overall provisions for the
Group increased by R344 million, from R1 046 million to
R1 390 million, mainly as a result of an abnormally large
provision relating to residential property development and
commercial property loans in the NBS division. Arising from an
aggressive drive to reduce properties in possession, it became
apparent that the valuations placed on our book were not
realistic relative to the market, which called for a detailed
investigation into all non-performing advances.The results of
this review confirmed that further provisions were required
mainly in the NBS residential property development loans and
NBS commercial loans in smaller metropolitan rural areas.
The bulk of these loans were made in the period between 1995
and 1997.The Group has ceased to operate in these markets.
All necessary action has been taken and the Group can now
accelerate the reduction of properties in possession at these
realistic values.
Were it not for these additional once-off provisions, earnings
per share would have been significantly higher in the year
under review. The Group continues to refine its strategy and
we are applying sharper focus on the main areas of Corporate
Banking (including merchant banking, corporate and business
banking), Investment Banking, Retail Banking and Investment
Management.
During the year we disposed of our stake of 17.4% in African
Bank Investments Limited (ABIL). The resultant non-headline
loss was R716 million. However, since our entry into micro-
lending some four years ago, the Group has made a R609
million cash surplus on this investment,which originated from
the sale of the Boland PKS start-up micro-loan book to ABIL.
Key strategic acquisitions of Credcor, Cashbank, Edge
Investments and Stenham Gestinor were made during the year
and are being successfully integrated into the Group.
I am pleased to report that the Executive team has stabilised
under the able leadership of Tom Boardman, who continues to
drive the Group along its carefully chosen strategic route.
I refer to the Chief Executive’s report, which deals in greater
detail with the individual divisions of the Group.
■ LOCAL ENVIRONMENT IS CHALLENGING
Economic growth remained relatively firm despite current
global conditions, due partly to the more accommodating
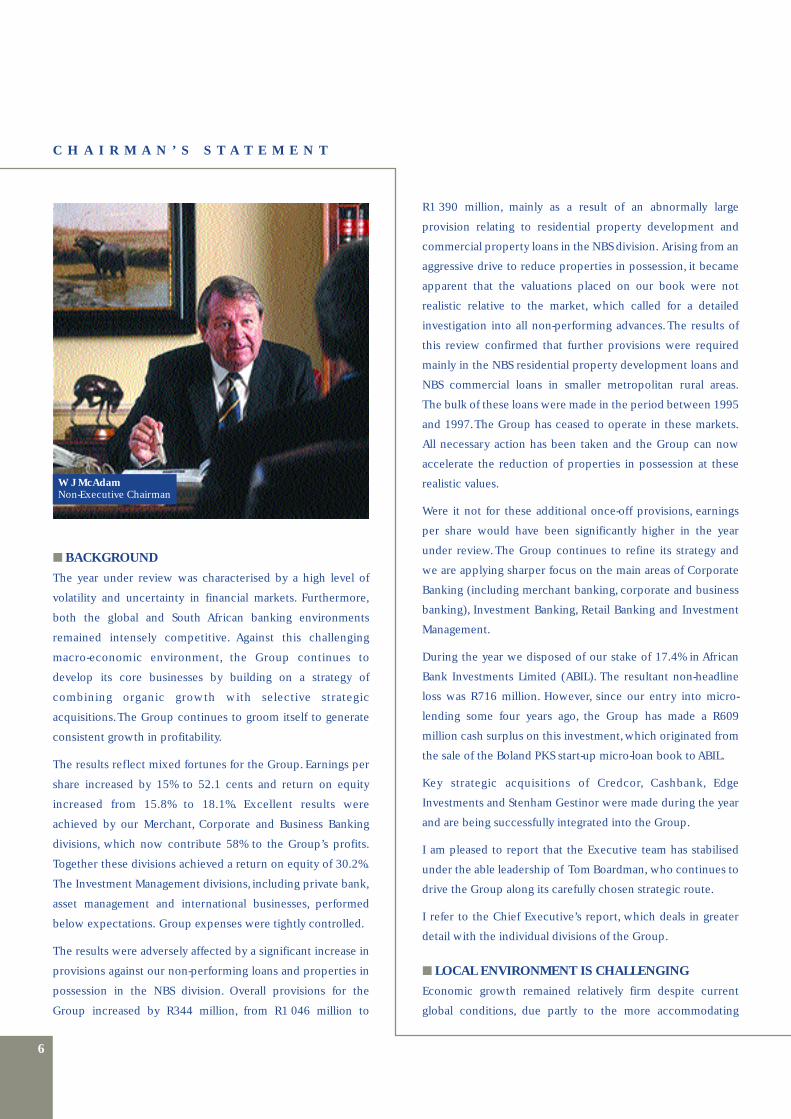
W J McAdamNon-Executive Chairman

7
monetary stance of the South African Reserve Bank and the
benefits of a lower inflationary environment. Gross domestic
product (GDP) rose at a yearly rate of 2.8% in the second
quarter of 2001.
The local currency has become a shock absorber for global and
Southern African influences, with a 17% depreciation on a
trade weighted basis, this helping to support export prices in
an environment of falling global demand.
The South African business cycle is expected to outperform
the global business cycle in 2002, given our expectation of
approximately 1.5% global growth during next year and
approximately 2.8% growth in South Africa.
The Reserve Bank believes the 2002 inflation targets remain
attainable, but express concern over the impact of rising
import prices. Tighter retail margins are likely to curtail the
transmission of the higher imported prices through into the
headline consumer price index. High growth rates in money
supply, administered prices and general wage increases remain
a concern.
Given these circumstances, we believe that further reductions
in interest rates from current levels will only take place after
evidence that inflation is not being affected by international
events. Further weakness in our currency will also play a
significant role in determining the future course of
interest rates.
South Africa’s environment is challenging and the negative
impacts of developments in Zimbabwe are certainly felt. It is
essential that leaders in the region apply pressure to resolve
these issues and to restore the rule of law in that country.
The contagion effects on the region are extremely serious.
On a more general note, crime continues to erode confidence
in South Africa. AIDS too remains a significant problem for
South Africa. The pandemic, if left unchecked, may have
disastrous effects on the economy. These issues, together
with attracting foreign and local direct investment, improving
education and job creation, remain vitally important for all
South Africans.
The key to long-term success for our country is to successfully
forge partnerships between government, business and labour.
Investor confidence is a crucial element for boosting
investment and economic growth in the country. Government
and labour will need to find a formula to create a consistently
favourable environment for investors, entrepreneurs and risk
takers.Long-term confidence requires a set of consistent short-
term actions which deal with the necessary disciplines in
order for South Africa and its neighbouring countries to be
regarded as an attractive investment haven. It is our belief that
South Africa remains an exciting and exhilarating area in which
to conduct business but it calls for our political leaders to
recognise this by dealing with the negatives expeditiously and
constantly re-enforcing the positives.

8
C H A I R M A N ’ S S T A T E M E N T
■ ADOPTING A CORPORATE CITIZENSHIP ROLE
We have also made an important mindshift in the area of
corporate social responsibility, in line with international
trends. Throughout our long history we have always been
aware of our responsibility as a good corporate citizen, but
whereas in the past corporate social responsibility may have
been viewed as chequebook philanthropy, today it is regarded
as a key value driver to our business.
In accordance with the new provisions of the revised King
Code, we will be striving to adopt triple bottom line, or non-
financial accounting, to measure our performance across a
wider business model, taking account of stakeholder value.
Accordingly, BoE will adopt a corporate citizenship model
which recognises responsibilities in four distinct areas:
■ the marketplace, and the impact of our products and
services on consumers’ lives;
■ the workplace, including our employees and issues that
affect their wellbeing;
■ the community in which BoE operates, and which gives us
our license to operate; and
■ the environment.
BoE has already made considerable progress, be this in
matching social responsibility initiatives with our core
business, considering the social effects of our corporate
operations and the impact of our products, or building strong
relationships with our customers, suppliers and communities.
We acknowledge, however, that we still have much work to do.
In building our business and safeguarding our reputation we
will continue to focus on attracting and retaining talented staff,
improving our communication with our stakeholders, and
managing risk.
■ OUR PEOPLE
BoE’s success depends on the commitment and dedication of
all our employees. Sadly, the re-organisation of the operations
has resulted in some retrenchments in certain areas of the
Group. My appreciation goes to all our staff for their
enthusiasm, hard work, loyalty and support during these
challenging times. I also value and appreciate the work done
and role played by the Chief Executive,Tom Boardman,and his
executive team.
I extend my gratitude to all my fellow directors for their loyalty
and commitment to the Group’s efforts, and to our clients and
shareholders for their valued support that is so important to
BoE’s success.
■ CHALLENGES REMAIN
The Group has much to accomplish in 2002. The economic
environment remains subdued,and all banking groups will find
it difficult achieving the growth levels of recent years. We are
confident that solid foundations are being established which
will allow us to continue the progress made over the last year.
The Group tax rate remains low and is likely to increase in
the year ahead, whilst the Group continues to operate with
excess capital. Both these issues will impede our annual rate
of growth.
Notwithstanding the difficult market conditions, the Group is
more focused and will keep a tight rein on expenses. Budgets
reflect modest real growth in earnings per share and improved
return on equity, which could be enhanced by further
corporate activity.
W J McAdam

9
N O N - E X E C U T I V E D I R E C T O R S
W J McAdam (57) 2,3 & 4
Non-executive ChairmanBA Cape TownAppointed to the board:1981Formerly a stockbroker,he joinedthe Group in 1977. Appointed asmanaging director in 1981, andbecame executive chairman in 1996,and non-executive chairman in 1999.Chairman of the Western CapeNature Conservation Board, adirector of Commercial FinanceCompany Ltd and CongellaFederation Ltd, chairman ofThe Laser Group Ltd, and trusteeof the Premier’s Relief Fund.
C J W Ball (62) 1,2 , 3 & 4
Independent Deputy ChairmanDip IURIS WitwatersrandMA CantabAppointed to the board:1995A director of PG Bison Ltd andPG Bison Holdings Ltd. FormerPresident of the Clearing BankersAssociation of SA and ChiefExecutive of First National BankGroup.
P Gorvalla (71) 3
Independent DirectorBCom (Honoris Causa)Advanced Teachers CertificateAppointed to the board:1998A director of Brimstone InvestmentCorporation Ltd,Business Partnersand the Gorvalla Group ofCompanies.
J R McAlpine (60) 3 & 4
Independent DirectorBSc CA GlasgowAppointed to the board:1990A non-executive director of ImperialHoldings, Anglovaal Mining,MetroCash and Carry, and Grintek.A former chairman of the Associationof Unit Trusts of SA. Former head ofinvestment activities and executivedirector of the Liberty Life Group.

10
N O N - E X E C U T I V E D I R E C T O R S
J G Modibane (43) 3
Independent DirectorBCom University of the NorthMBA Rutgers University (USA)Appointed to the board:1998Chief Executive Officer ofMr Prepaid (Pty) Ltd, and a directorof Foskor Ltd (an IDC subsidiary)and Onelogix Ltd.
E Osrin (69) 2 & 3
Independent DirectorRegistered attorneyAppointed to the board:1992Chairman of Foschini Ltd, a directorof New Clicks Holdings Ltd and adirector of various other companies.
J A C McGregor (56) 1,3 & 6
Non-executive DirectorBCom (Hons) Cape Town, CA (SA)Appointed to the board:1991Joined the Group in 1977, andretired as Group Financial Directorin 2000. Continues to serve as atrustee of the Group’s variousretirement funds and charitabletrusts.
L A Meyerowitz (69) 3
Independent DirectorBCom WitwatersrandAppointed to the board:1998A director of NIB Property FundManagers Ltd and various privatecompanies.

11
1 = Audit,Risk and Compliance Committee2 = Remuneration Committee3 = Governance and Directors’Affairs Committee4 = Nominations Committee5 = Group Asset and Liability Committee6 = Group Credit Committee
C M L Savage (62) 2 & 3
Independent DirectorBSc (Eng),MBA ISMP HarvardAppointed to the board:1998Executive Chairman of The Tongaat-Hulett Group Ltd, and a director ofAECI Ltd and Delta Motor Corp.
W J Swain (61) 1 3 & 5
Independent DirectorCA (SA)Appointed to the board:1987Managing Director of CommercialFinance Company Ltd,Chairman ofCongella Federation Ltd and adirector of various other companies,including Mr Price Group Ltd andThe Laser Group Ltd.
J R Sanders (58) British 3
Independent DirectorBA (Hons) Oxford, MBA StanfordAppointed to the board:1995Deputy chairman of Austin ReedGroup plc, and a non-executivedirector of Amlin plc,Gulf IndonesiaResources Ltd, Sabanic Bank plc, andSanwa International plc. Formerexecutive director and head ofInternational Division atS.G.Warburg and RBC DominionSecurities,Chairman of Royal Bankof Canada Europe,Royal Bank ofCanada Suisse and Royal Bank ofCanada Channel Islands, andManaging Director of NatWestMarkets.

12
M A N A G E M E N T S T R U C T U R E
12

13
G R O U P S T R U C T U R E
13

14
T E N Y E A R S U M M A R Y
CONSOLIDATED BALANCE SHEET
Pro forma Pro forma
R’m 1992 1993 1994 1995 1996 1997 1998 1999 2000 2001
Property and equipment, cash
and other assets 41 51 15 99 145 367 5 251 4 008 4 224 5 864
Investments 92 120 130 89 474 3 321 10 610 11 528 10 903 10 221
Advances 1 442 1 151 1 340 1 742 1 461 2 436 35 247 40 923 43 366 47 458
Liquid and trading assets 685 1 089 1 181 672 1 578 2 980 2 535 3 969 3 693
Total assets 1 575 2 007 2 574 3 111 2 752 7 702 54 088 58 994 62 462 67 236
Ordinary shareholders’ funds 87 97 132 175 234 2 088 7 059 6 812 6 798 6 402
Convertible preference shares – – – 144 144 144 144 144 – –
Convertible loan stock 4 4 3 1 – – – – – –
Capital and reserves 91 101 135 320 378 2 232 7 203 6 956 6 798 6 402
Life funds – – – – 231 1 425 4 674 7 031 6 653 7 420
Deposits and other accounts 1 451 1 857 2 385 2 694 2 001 3 725 38 429 41 470 46 253 49 847
Loans and other liabilities 33 49 54 97 142 320 3 782 3 537 2 758 3 567
Total equity and liabilities 1 575 2 007 2 574 3 111 2 752 7 702 54 088 58 994 62 462 67 236

15
T E N Y E A R S U M M A R Y
CONSOLIDATED INCOME STATEMENT
Pro forma Pro forma Pro forma
R’m 1992 1993 1994 1995 1996 1997 1998 1999 2000 2001
Net interest margin not available 23 26 44 58 57 1 490 1 959 1 826 1 956
Non-interest revenue not available 52 58 69 126 289 1 704 1 498 1 678 2 077
Income from normal
operations not available 75 84 113 184 346 3 194 3 457 3 504 4 033
Bad and doubtful debts not available 5 2 3 7 11 445 525 412 671
Operating expenses not available 53 57 69 111 195 1 586 1 807 1 893 2 018
Profit from normal operations 12 17 25 41 66 140 1 163 1 125 1 199 1 344
Exceptional items – – – 12 20 8 – (10) (40) (860)
Profit from operations 12 17 25 53 86 148 1 163 1 115 1 159 484
Financing costs 1 1 1 – – – 40 80 103 102
Share of earnings of
associated companies 2 3 4 8 8 101 37 126 73 61
Profit before taxation 13 19 28 61 94 249 1 160 1 161 1 129 443
Taxation – 2 4 8 12 31 200 170 159 160
Profit after taxation 13 17 24 53 82 218 960 991 970 283
Minority interest – – – – – – 615 – – –
Net profit for the year 14 17 24 53 82 218 345 991 970 283
Exclusions – – – (15) (20) (58) (1) 13 114 909
Headline earnings 14 17 24 38 62 160 344 1 004 1 084 1 192
Growth in headline earnings 2 3 7 14 24 98 184 660 80 108
Preference dividends paid – – – 5 14 14 15 15 – –
Ordinary dividends paid 5 7 9 13 16 46 256 382 369 430

16
T E N Y E A R S U M M A R Y
ASSETS UNDER MANAGEMENT (market value)
Pro forma Pro forma
R’m 1992 1993 1994 1995 1996 1997 1998 1999 2000 2001
Off balance sheet assets
South Africa
Asset management 1 608 2 412 4 012 4 863 9 868 12 548 11 209 12 294 12 774 16 308
Unit trusts 41 79 280 689 1 939 6 394 4 794 3 643 2 874 2 342
Private banking 2 518 3 218 4 738 2 486 3 114 4 074 3 661 5 078 6 250 5 834
Stock broker – – – – 123 224 958 880 1 148 869
Linked products – – – – – 54 366 603 1 659 7 425
Properties 286 282 355 – – – – – – –
Offshore
Asset management – – – – – – 60 14 190 17 765 20 575
Unit trusts – – – – – 220 1 325 2 837 1 815 3 616
Fund services – – – – – – – 7 189 8 021 9 390
Total off balance sheet assets 4 453 5 991 9 385 8 038 15 044 23 514 22 373 46 714 52 306 66 359
On balance sheet assets
Long-term investments 70 96 145 116 309 2 700 5 740 4 355 4 077 2 801
Life investments – – – – 231 1 425 4 731 7 031 6 653 7 420
Short-term insurance investments – – – – – – 139 142 173 –
Total on balance sheet investments 70 96 145 116 540 4 125 10 610 11 528 10 903 10 221
Advances 1 442 1 151 1 340 1 742 1 461 2 436 35 247 40 923 43 366 47 458
Other assets 41 736 1 104 1 280 817 1 945 8 231 6 543 8 193 9 557
Total on balance sheet assets 1 553 1 983 2 589 3 138 2 818 8 506 54 088 58 994 62 462 67 236
Total assets under management 6 006 7 974 11 974 11 176 17 862 32 020 76 461 105 708 114 768 133 595
17
T E N Y E A R S U M M A R Y
MARKET STATISTICS
1992 1993 1994 1995 1996 1997 1998 1999 2000 2001
Ordinary share price: high (c) 73 76 125 230 335 702 1 026 504 581 500Ordinary share price: low (c) 40 40 63 116 215 162 193 192 345 318Ordinary share price: closing (c) 41 63 124 225 335 607 283 283 409 382Number of ordinary shares traded (’m) 6 11 12 20 15 34 274 744 1 037 1 130
Ordinary shares traded as a percentage of shares in issue (%) 3 4 4 6 5 5 10 27 45 49
Value of ordinary shares traded (R’m) 4 7 12 38 44 218 1 329 2 725 4 005 4 831
Price earnings ratio at year end 9 10 15 21 23 29 10 9 9 8Price earnings ratio at year end for bank sector 12 14 19 16 16 15 11 14 12 10
Market capitalisation at year end (R’m) 119 181 395 967 1 410 6 177 12 288 12 258 9 423 8 652
Market price premium to net asset value (investments at market value) (%) 11 24 38 70 105 104 6 7 62 33
Earnings yield (%) 11.8 9.6 6.6 4.8 4.4 3.4 10.5 11.5 11.1 13.6Dividend yield (%) 4.8 4.0 2.5 1.8 1.5 1.0 2.9 3.2 3.9 5.0
Note: 1991-1997 figures where applicable have been adjusted for the 20:1 share split that was effective on 11 May 1998.Ordinary share prices have been adjusted to reflect the pro forma adjustments of the capital distribution during May 2000.

1818
T E N Y E A R S U M M A R Y
SHARE STATISTICS
Pro forma Pro forma Pro forma
1992 1993 1994 1995 1996 1997 1998 1999 2000 2001
Number in issueOrdinary shares (’m) 255 260 298 317 327 708 2 770 2 780 2 304 2 265Preference shares (’m) – – – 96 96 96 96 96 – –
Loan stock units (’m) 35 30 22 6 2 1 1 – – –
(’m) 290 290 320 419 425 805 2 867 2 876 2 304 2 265Shares bought back not yet cancelled (’m) – – – – – – – – – 4
Cross holding (’m) – – – – – – 264 379 6 4
Net shares in issue (’m) 290 290 320 419 425 805 2 603 2 497 2 298 2 257
Weighted average no.of shares (’m) 290 290 305 357 422 608 1 076 2 514 2 392 2 286Earnings per share (c) 5 6 8 15 20 36 89 39 41 12Headline earnings per share (c) 5 6 8 11 15 26 32 40 45 52Dividends per ordinary share (c) 2 3 3 4 5 8 11 13 16 19% increase in dividends per ordinary share (%) – 33 – 25 20 38 27 16 19 19
Net asset value per share(investments at market value) (c) 37 51 90 132 164 377 257 263 253 287
Total ordinary shareholders’return per share (no pro forma adjustment)Dividends per ordinary share (c) 2 3 3 4 5 8 13 16 16 19Capital distribution (c) 163
Growth in share price (c) (30) 22 61 101 110 272 (341) 12 (32) (27)
(28) 25 64 105 115 280 (328) 28 147 (8)

19
T E N Y E A R S U M M A R Y
RATIOS
Pro forma Pro forma Pro forma
1992 1993 1994 1995 1996 1997 1998 1999 2000 2001
Interest margin (%) not available 1.8 2.1 2.9 3.6 2.9 7.9 5.1 4.3 4.3
Non-interest revenue to total
income (%) not available 70 69 61 68 84 53 43 48 52
Cost to total income (%) not available 66 65 58 58 55 50 52 54 50
Bad debts as a % of advances (%) not available 0.4 0.2 0.2 0.4 0.6 2.4 1.4 1.0 1.4
Effective tax rate, excluding
associate income and
exceptional items (%) 18 25 25 26 24 25 17 15 15 13
Dividend cover 2.8 2.7 2.8 3.0 2.7 3.6 2.9 3.1 2.8 2.7
Headline return on equity (%) 16 18 21 17 18 15 11 15 16 18
Return on total assets (%) 1.3 0.9 1.0 1.3 2.1 3.1 1.1 1.7 1.8 1.8
Capital adequacy ratio of
BoE Bank Ltd (%) n/a n/a n/a n/a n/a n/a 16.7 14.5 13.0 11.2

2020
T E N Y E A R S U M M A R Y
OTHER INFORMATION
1992 1993 1994 1995 1996 1997 1998 1999 2000 2001
Exchange rate to ZAR
US ($) 3.0510 3.3972 3.5442 3.6460 4.6790 4.6625 5.8650 6.0100 7.2638 9.0138
Pound (£) 4.6253 5.0312 5.5355 5.6586 8.0221 7.5278 9.9731 9.8873 10.6695 13.2798
Euro (C= ) n/a n/a n/a n/a n/a n/a n/a 6.3846 6.3929 8.2073
Interest rates
Prime overdraft rate (%) 17.25 15.25 16.25 18.50 20.25 19.25 23.00 16.50 14.50 13.50
R150 (%) 13.76 13.14 16.70 15.09 15.20 13.94 17.30 14.34 12.80 9.96
JSE All Share Index high 3 749.0 4 896.0 6 054.0 6 283.3 7 099.4 7 616.4 8 373.6 7 341.6 9 335.5 9 639.5
low 2 924.0 3 245.0 4 691.0 5 046.2 6 224.4 5 874.3 4 676.1 4 865.0 5 378.8 7 171.1
closing 3 259.0 4 893.0 5 867.9 6 228.4 6 657.5 6 202.3 5 098.6 6 855.5 8 274.2 8 126.1
JSE Banks Index high 3 310.0 4 143.0 5 448.6 8 120.9 8 805.9 13 002.9 18 126.4 13 829.7 15 646.8 15 642.5
low 2 630.0 2 986.0 3 827.0 4 745.0 7 318.0 8 432.8 7 216.4 9 341.6 10 273.9 11 545.3
closing 3 012.0 4 143.0 5 396.6 8 022.3 8 522.1 12 180.7 10 642.3 10 595.8 12 946.8 13 083.7

21
P O S I T I O N I N G S T A T E M E N T
21
“BoE is a specialist provider of innovative financial
solutions to businesses, and through businesses,
to individuals”.
The Group’s market positioning as stated above captures key
elements of BoE’s mission statement, and seeks to differentiate
BoE clearly in the financial services sector. The major drive of
the Group is to use its established relationships with
corporates to provide services not only for the corporates
themselves, but also for their owners, other high net worth
individuals, their employees and their clients.
BoE’s mission is to be one of the most highly rated and
respected specialist banking and financial services groups,
providing innovative financial solutions to businesses and,
through businesses, to individuals. BoE seeks to add value by
developing and maintaining strong long-term relationships
with its clients in order to appreciate and understand their
financial needs.
The key elements of BoE’s positioning statement and mission
are explained as follows:
■ In striving to be highly rated and respected by all
stakeholders, the Group’s focus is on achieving the highest
levels of client service and integrity, consistent delivery of
strong results, and open and full disclosure of events
occurring within the Group. BoE measures its performance
in this area by assessing its relative share performance with
its peers,client response and frequent feedback from clients,
and external independent surveys where applicable.
■ BoE is a specialist in that it is not a generalist bank that tries
to deliver a full product range to the market at large. The
Group selects specific markets,understands the dynamics of
those markets, and tailors specific products to meet their
needs.
■ By listening to client needs and understanding its markets,
BoE provides innovative financial solutions and develops
products that deliver alternative solutions to clients. The
emphasis is placed on convenience and value for clients.
■ Relationships are key to delivering high levels of service.BoE
develops products to meet the needs of clients through good
client relationships and a full appreciation of the markets in
which the Group operates.

22
C H I E F E X E C U T I V E ’ S R E P O R T
“A year of refining strategy, capital management and
operating efficiencies.”
Following the restructuring implemented by the Group
during 2000, the focus in the year under review has been on
three key areas:
■ Refining strategy and structuring the business to align with
this strategy;
T A Boardman (51)
Chief Executive
BCom CTAWitwatersrand, CA (SA)
Joined:1986. Appointed to the board:1989
A director of the Banking Council, SA
Career history:
2000 to present Chief Executive
1999 MD,BoE Bank Ltd
1994-1998 MD,BoE Merchant Bank
1989-1994 Executive Director,BoE Ltd
1986-1989 SGM,BoE Investment Management
1982-1986 MD,Boardmans
1978-1982 MD,Sam Newman Ltd
1977-1978 FD,Sam Newman Ltd
1973-1977 FM, Anglo American Properties
■ Enhancing capital management and improving the return on
capital for shareholders; and
■ Improving operating efficiencies within the parameters of
the Group’s strategy.
■ REFINED STRATEGY
In a low-growth economy and a fiercely competitive financial
services sector,BoE’s strategy is to position the Group as one of
South Africa’s leading specialist banking and investment
management groups. The core of the strategy is to be a
specialist provider of financial solutions to businesses, and
through businesses to individuals.
The Group seeks to focus on market segments:
■ which have the potential to grow faster than the economy as
a whole;
■ in which BoE can achieve a meaningful market share;
■ where the risk/return ratio is satisfactory; and
■ in which the Group has the necessary competence to
compete successfully.
In implementing this strategy,BoE has:
■ Focused on three main business areas:
• Merchant,Corporate and Business Banking;
• Investment Management; and
• Retail Banking, primarily focused on the low-income to
middle-income market.
■ Disposed of its stake in African Bank Investments Limited
(ABIL).
• The 17.4% investment in ABIL was disposed of during the
year by way of a specific share buy-back by ABIL.
• Whilst BoE believes ABIL may have been a good addition
to complement and expand its Retail Banking operation,
both groups agreed after discussion that ABIL would
pursue its own strategy and not form part of an integral
BoE Retail Banking operation.

23
The Group is now well positioned to deliver consistent earningsgrowth, and continued return on equity enhancement.
• Given that the Group could not acquire a controlling
stake in that company, it sold its holding. In doing so, BoE
recorded a non-headline write down of R716 million,
reversing part of previously disclosed revaluation gains.
■ Acquired four new businesses to complement existing
businesses. Through disposing of ABIL, a company that
the Group did not control and manage, BoE freed up funds
to invest in businesses that it does control and manage,
and that fit the strategic vision.
• The acquisitions of Credcor, a leading provider of credit
to consumers through retailers mainly in the emerging
market, and Cashbank, a specialised provider of housing
finance to the emerging market, enable BoE to:
– Expand its product offering in this market;
– Enhance the Group’s credit and behavioural scoring
ability;
– Broaden the customer base; and
– Obtain added management skills and a further
understanding of the market.
• The acquisition of Edge Investments, a multi-manager and
insurance broker, which provides investment solutions in
the individual and employee benefit markets,has:
– Complemented the Group’s employee benefit
offering;
– Increased BoE’s distribution capability; and
– Increased the depth of management in the investment
management area.
• The acquisition of Stenham Gestinor, an international
private client asset management and trust company based
in the UK and Europe, allows BoE to:
– Improve its offshore product offering for South African
private banking clients;
– Increase the customer base;
– Broaden the distribution network offshore;
– Enhance its management skills offshore; and
– Provide the Group with a better platform for cross-
border trade and corporate finance activities.
■ Stabilised the management team:
• Last year BoE announced several management changes.
Small refinements have been made to the team this year.
• The Group now has a Group Executive team with
experience both of the Group and the industry as a
whole. This team has a blend of youth and experience.
• The business units have the depth of management to
ensure succession.
• The one area of focus in which BoE has not yet
progressed to its satisfaction remains its commitment to
transforming its management team to be more
representative of South Africa’s demographics. A key
part of this long-term transformation process is
development plans for black staff members to ensure
that they reach management positions in due course.
■ ENHANCED CAPITAL MANAGEMENT
Last year BoE acknowledged that it had capital in excess of its
current needs,and indicated that the Group would address this
issue over time,while under no circumstances jeopardising the
liquidity position. Steps taken this year to restructure and
deploy some of this capital include the continuation of the
share buy-back programme and strategic acquisitions.
■ During the year BoE bought back 74 million shares with a
value of R 317 million.
■ The strategic acquisitions of Credcor, Cashbank, Edge
Investments, and Stenham Gestinor helped to deploy some
of the excess capital.

24
C H I E F E X E C U T I V E ’ S R E P O R T
■ The Group’s return on equity has improved to 18%. BoE
acknowledges that further improvement is necessary and
this will remain a focus for the year ahead.The Group aims to
drive the return on equity up to a more acceptable level.
Proper management of capital within a bank is crucial because
of regulatory minima and risk considerations.BoE has:
■ Improved the allocation of capital among divisions;
■ Identified excess capital in the insurance companies in the
Group, previously subject to the volatility of equity markets,
and moved this to the centre;
■ Continued with internal evaluations of divisional
performance on an economic value-added basis; and
■ Managed capital centrally with a view to obtaining a
consistent return with minimum volatility, and allowing
divisions to earn a value-added contribution from their
operations.
■ IMPROVED OPERATIONAL EFFICIENCIES
The Group headline earnings for the year were R1 192 million
and headline earnings per share was up 15% from 45.3 cents to
52.1 cents. The NBS retail mortgage division had a poor year
as a result of increased provisions for doubtful advances.
However, this has been offset by strong performance in the
Group’s Corporate Banking businesses.
■ The Group’s income from operations increased by 15% in
the period under review. This comprised an increased of
23% in other operating income with net interest income
(margin) increasing by 7%. Margin has been affected largely
by the reduction of cash used for share buy-backs and lower
interest earned on free flow capital due to falling interest
rates.Excluding these impacts,the increase would have been
13%. The buy-backs, however, have a positive impact on
the Group’s return on equity and earnings per share.
Growth
R’m %
Total income
2001 4 033
2000 3 504
Growth 529
This was achieved from:
■ Organic revenue growth 430 12
■ Net growth in revenue through
acquisitions 134 4
■ Foreign exchange gain on translation
of integrated foreign operations 80 2
■ Growth in revenue from the cash
generated by the disposal of ABIL 34 1
■ Impact of interest rate drop on capital (86) (2)
■ A reduction in revenue from share
buy-backs (46) (1)
■ Cost of funding acquisitions (17) (1)
529 15
■ Stringent expense control has meant that overheads
increased by only 2% after adjusting for overheads relating to
new businesses acquired during the year. BoE’s cost to
income ratio for the year was 50%, an improvement from
54% last year.
■ Good asset growth was achieved by the core Corporate and
Business Banking divisions, and the Investment Management
business started to see a positive turnaround in asset growth:
• Corporate and commercial advances grew by 16%.
• Investment Management assets under management grew
by 27%. This growth arose through a combination of
organic growth, acquisitions and foreign exchange
fluctuations.

25
■ The Group has increased its provisions aggressively for
properties in possession (PiP’s) and non-performing loans.
Further to BoE’s stated strategy of only operating in areas
where it believes it can compete successfully, NBS ceased
lending in the residential development and predominantly
smaller metropolitan and rural commercial property market.
■ The bad debt expense represents a charge of 1.4% of
advances against 1.0% in the prior year. Of the total change
of R671 million, R418 million relates to NBS. Since March,
PiP’s in NBS have reduced by R91 million and in addition,
R286 million of remaining PiP’s have been sold, awaiting
transfer. This leaves R698 million PiP’s to be sold, down
from R884 million at September 2000.
■ The Group concentrated on improving its liquidity and
ended the year in a strong position. Banks in South Africa
generally rely heavily on funding from corporate deposits
within the domestic market. These deposits are typically
of a short-term nature, often funding longer-term advances.
The Group strengthened its position and lengthened the
term and diversity of its funding through a currency hedged
one-year US$130 million offshore syndicated loan and the
issuing of a R1 750 million three-year unsubordinated bond.
Active marketing by Group Treasury has increased the
number of corporates providing deposits to the Group.
■ Retail deposits grew by 13%, and now represent 37% of total
deposits. Significant contributions were made by NBS as a
result of a concerted marketing campaign for the “Golden
Rate” fixed deposit and strong growth from the Corporate
Saver product.
■ OPERATING PERFORMANCE
The Merchant, Corporate and Commercial Banking divisions
have produced excellent performances during the past year,
increasing headline earnings from these divisions by 46%.
BoE Merchant Bank had strong earnings growth in most of its
business units, with a particularly pleasing performance from
its private equity business. A team approach utilising a
typical investment-banking model, together with the ability to
provide funding in addition to deal structuring, has helped the
merchant bank achieve this success. The competition in this
market remains fierce, with foreign banks taking the lion’s
share, but BoE believes it is well placed to continue with
strong results.
BoE Corporate and BoE Bank Business Division both delivered
good growth and returns on equity. Corporate lending has
been generally subdued in the banking sector as a whole.
Nonetheless, high levels of customer service have enabled
these divisions to compete in this area.The concept of ‘taking
the bank to the customer’has worked well and quick decision-
making has helped the Group compete. In addition, the Group
has to date been relatively unscathed by the many recent
corporate collapses in South Africa.The contribution from the
Corporate Banking divisions, which constitutes 58% of our
total income, is key to our strategy of utilising this base to
cross-sell products for the Retail Banking and Investment
Management businesses.
BoE’s new Retail Banking initiatives are marketed
predominantly through corporates and merchants. The
product offering is based on the premise that banking in the
lower-income to middle-income markets is driven by five basic
needs,which a bank will have to offer to be competitive in the
long run. These needs are:
■ An accessible, low-cost physical distribution network;
■ Affordable transaction costs;
■ A simple, single savings account, earning interest on any
positive balance,with full transactional capability;
■ Competitive personal loan products; and
■ A secured, low-interest home loan product.

26
C H I E F E X E C U T I V E ’ S R E P O R T
In growing the Retail Banking business, over the past year BoE
acquired Credcor and Cashbank.These divisions,together with
PEP Bank, NBS Savings and Investments, Personal Loans and
Direct, form the Retail Banking business. With 1.3 million
customers, 200 outlets and 300 ATM’s, the Group has a strong
base in order to penetrate the fast-growing lower-income to
middle-income market. The product offering comprises not
only loans but also transactional accounts that offer some of
the highest rates in this market and the lowest charges. South
Africans generally do not have a culture of saving, and BoE
strongly believes and agrees with government that banks
should encourage savings wherever they can.
The Group has integrated the Investment Management
Business in line with BoE’s stated strategy. Consistent
investment performance by most units within this business has
translated into asset growth which, along with steps to reduce
the cost base, has laid the foundation for earnings growth in
the new year. The acquisition of Edge Investments allows the
Group to approach the employee benefits market aggressively,
through a more comprehensive product offering. The
acquisition of Stenham Gestinor strengthens BoE’s offshore
platform,bringing additional products and a wider distribution
base. The offshore businesses have been integrated into the
Investment Management Business and BoE has therefore
included foreign exchange gains of R80 million in income, in
accordance with Generally Accepted Accounting Practice and
the Group’s accounting policies.
■ ADDRESSING THE MIDDLE-INCOME
MORTGAGE LOAN CHALLENGE
The mortgage loans market in South Africa has changed
fundamentally as margins continue to decline with the
introduction and growth of intermediaries, and increased
competition in a market of modest growth. In this challenging
environment, the NBS mortgage loans division has
implemented several steps to address non-performing loans,
bad debt, and properties in possession. NBS has accelerated
the disposal of properties in possession, resulting in a
reduction in the number of properties. The Group is
maintaining its focus on this area until it reaches satisfactory
levels. As mentioned above, NBS has ceased new lending to
residential property developers and on commercial properties
in predominantly rural and small metropolitan areas not
serviced by BoE Corporate or BoE Bank Business Division.
The mortgage division focuses on the upper end of the middle-
income market, above the key focus of BoE’s other Retail
Banking businesses. Accordingly, BoE has structured this
business as a separate division with its own dedicated
management team.This will allow the division to operate as a
single-product specialist provider of retail mortgage loans.
■ CROSS-SELL
A major focus over the past year has been to increase cross-sell
within the Group. In addition to traditional areas, such as
insurance where strong cross-sell exists, some notable
successes have been achieved. Some examples are:
■ The merchant client base in Credcor is being targeted by
BoE Bank Business Division to introduce card-acquiring
technology to these businesses. Card products will shortly
be available for Credcor customers to utilise at these
merchants;
■ Edge and BoE Investment Administrators now provide
investment management and fund management services to a
number of BoE Corporate clients;
■ NBS Personal Loans, in conjunction with Credcor, recently
launched a personal loans product to the broker market;
■ BoE Bank Business Division continues to refer more
complex structured loan and corporate finance business to
BoE Corporate and BoE Merchant Bank;
■ NBS personal loans, introduced this year, have successfully
been marketed to the existing client base with strong
demand to date;
■ Credit cards are being marketed to clients that qualify with
certain credit criteria throughout the Group;

27
■ More than 70% of the clients opening accounts at PEP Bank
are sourced from relationships the Group has with
corporates; and
■ A campaign was launched to sell BoE Unit Trusts to the NBS
client base through their Financial Planners.
Through the grouping of like business,BoE believes the Group
can achieve more synergies,and in the process further increase
cross-sell opportunities within the Group.
■ NON-CORE INVESTMENTS
Good progress has been
made in disposing non-core
investments and returning
the Group to its core business
in banking and investment
management. In the 2000
financial year, BoE wrote
down its holding costs of
Monex and Century City, the
only two large non-core
investments left. The steps
taken to recapitalise Monex will allow BoE the time to deal
with this investment at the appropriate moment. An offer has
been made to purchase the minority shareholders in Monex.
Century City continues to trade in line with initial expectations
and to provide a positive return to the Group.
■ THE FUTURE
Managing the transition of the Group over the last eighteen
months has been challenging. South African businesses do not
operate in isolation, and the rapidly changing global
environment and recent events in America have added to
uncertainty.
Against this backdrop, BoE has emerged somewhat
strengthened. It has returned to its core focus as a specialist
banking and investment management group.
The plan for the year ahead is to continue the work
commenced. The Group will:
■ Grow the Investment Management and Retail Banking
businesses off the foundation of its strong Corporate and
Business Banking units;
■ Actively manage its capital to ensure that the return on
equity is increased to satisfactory levels; and
■ Maintain the drive for further operating efficiencies. The
Group will continue to pursue synergies and cost alignment
within the Group and to exploit cross-selling opportunities.
Under current economic conditions, BoE is targeting to
continue to achieve earnings growth.
■ APPRECIATION
I wish to thank Bill McAdam, Chairman of BoE, and his fellow
non-executive directors for their support and input to the
Group through these often difficult times. I extend a special
word of thanks to my fellow executive directors for their
commitment to grappling with the issues that have confronted
us, as well as for the personal support they have given to me.
I further extend my thanks to our shareholders, who give
valuable ongoing input in guiding us and helping us to shape
our strategy.
In conclusion, I would especially like to thank the staff of BoE,
who have displayed substantial skill, commitment and
resilience. Many departments have unfortunately had to say
farewell to a number of people, but they have handled the
changes with stoicism. I believe that together we have the
ingredients to take the Group forward to make it one of South
Africa’s most respected financial services companies.
T A Boardman
Anton PillayGroup Investments

28
R E V I E W O F O P E R A T I O N S
■ BoE BANK BUSINESS DIVISION
What we do
The Business Division of BoE Bank focuses mainly on small and
medium-sized businesses. The Bank’s e-business division is a
leading supplier of card and e-business products to corporate
and individual clients.
Review
BoE Bank Business Division had strong headline earnings
growth of 37% and currently represents 15% of the Group’s
earnings.
The division is in its second year of trading under the BoE Bank
name, and has in the past year successfully completed the
integration of operations of the former Boland PKS into a
division of BoE Bank Limited.
The division provides banking solutions to businesses based on
the following key elements:
■ A commercial banker that visits clients;
■ An electronic banking solution through which clients can do
their banking from their own premises;
■ A pick-up and delivery service; and
■ A range of BoE Group products available to clients for their
staff, their clients and the owners/managers themselves.
This concept is unique, as it takes the bank to the customer.
Philip Wessels (43)
Executive Director
BCom UCT, Diploma in Advanced Banking Law RAU,
CA (SA), SA Institute of Stockbrokers
Joined: 1995. Appointed to the board: 2001
Career history:
2000 to present MD,BoE Bank Business Division
1998-2000 MD,BoE International (UK)
1995-1998 MD, BoE Securities
1981-1995 Deloitte & Touche (partner at date
of leaving)
Financial highlights 2001 2000
Headline earnings R’m 175 128
Total advances R’m 8 288 7 916
Bad debts as % of net advances % 1.1 1.5
Cost to income ratio % 59.4 65.0
Return on equity % 26.6 24.5
Number of employees 2 331 2 500

29
Following restructuring and changes to the location and
number of commercial centres, efforts were focused on
consolidating the division and implementing strategies to
expand and grow the business. A process of upgrading client
facilities at commercial centres which require refurbishment
was started at Malmesbury, Knysna and Bloemfontein. These
centres will be able to offer a high standard of client service
and improved facilities, which support the BoE Group’s image
and identity.
Cross-selling initiatives were launched with other divisions in
the BoE Group, in particular BoE Bank Business Division can
now offer banking services to approved Credcor merchants,
and full transactional banking facilities to clients of BoE Private
Bank and BoE Corporate.
Prospects and strategy
The division’s strategy of providing banking services to small
and medium businesses is sound, and whilst growing its
lending book, increasingly the focus will include further
developing systems and procedures. The concept of “taking
the bank to the customer” has proved to be successful, and
positions the division competitively in the current corporate
and commercial banking markets, which provide services to
small and medium sized businesses.
The e-business division concentrates mainly on its card
products and the expansion of the card acquiring business is
expected to continue.
The process of upgrading commercial centres will continue
when refurbishment of the East London and Pretoria centres
commence. Improvements to BoE Bank Business Division’s
head office in Paarl will be completed. A process of upgrading
and expanding certain of the distribution centres will allow
the division to offer its full product range to clients within a
wider area than currently being offered.
Alwyn RossouwFinance
Schalk RouxCommercial Operations
Andre van der BurghCredit Risk
Gerhard LaubscherTechnology
Eugene de Villierse-Business
The concept isunique, as it takes the Bank tothe customer.
“
”

30
R E V I E W O F O P E R A T I O N S
■ BoE CORPORATE
What we do
BoE Corporate specialises in the provision of secured finance
to corporate clients in the middle corporate market. This
includes finance for commercial, retail and industrial property;
movable assets; invoice discounting; and the financing of short-
term insurance premiums. In addition, the division offers
private equity solutions for growing businesses, and invests in
selected properties and property portfolios together with
clients.
Financial highlights 2001 2000
Headline earnings R’m 247 198
Total advances R’m 14 994 13 070
Bad debts as % of net advances % 0.7 1.1
Cost to income ratio % 37.8 33.4
Return on equity % 20.4 21.5
Number of employees 602 606
Mike Brown (35)Executive DirectorBCom PGDA Natal, CA (SA)Joined:1993. Appointed to the board:2001A director of various other companies, including RichwayRetail Properties Ltd,Paragon Business Forms Ltd, FasicLtd and Kimberley-Clark SA Holdings (Pty) LtdCareer history:1999 to present MD,BoE Corporate1998 Deputy MD,BoE Corporate1993-1998 Structured Finance,NBS Bank Ltd1988-1992 Deloitte & Touche (SA & USA)
Review
BoE Corporate remained a major contributor to the BoE
Group’s earnings with growth in headline earnings of 25%.
In a market characterised by sluggish economic growth, total
advances grew by 15% with the division achieving real growth
across a number of different business units.
The specialist commercial and industrial property division
once again contributed significantly to earnings and to the
growth in assets, and has become a leading force in lending to
this market.
Significant improvement in growth was achieved in the asset-
based finance division, where specialisation in certain

31
industries, notably medical, agricultural and aviation, has
produced good results. This, together with very active
management of existing exposures, has seen a much improved
return from this area of the business.
Banking margins were under pressure for most of the year, and
non-margin business was again a significant contributor to the
division’s results,with excellent performance in the structured
finance arena, and solid returns from property investment, and
the life and short-term insurance activities.
The division has actively managed its problem accounts during
the year and succeeded in maintaining arrears at very
acceptable levels.The income statement charge for bad debts
showed a pleasing decline over the prior year, and was
reflective of the stable interest rate environment, improved
lending quality and a focus on recoveries.
A number of high profile liquidation matters continue without
final resolution,but the policy of BoE Corporate of undertaking
generally only secured lending has limited any potential impact
on financial results.
BoE Corporate is exposed to the Macmed Health Care group,
which has been liquidated. The exposure of R127 million
(R115m plus interest) is secured by certain assets. Although
BoE Corporate has received an advance dividend from the sale
of these assets in an amount sufficient to extinguish its claim in
full, the security has been disputed by the liquidator. In the
Patrick CaleyBusiness Finance
David CoryCommercial
Clive HowellInvestment Partners
Greg HeronStructured Finance
Riaan van EckBusiness Solutions
Rob Lockhart-RossNBS Home Loans
Richard HarmanProperty Investment Partners
David GorvenProperty Finance
Brian FindlayCorporate Services
David GriffithsCorporate Saver
Craig EvansPremium Finance
Specialists in theprovision ofsecured financeto corporateclients.
“
”

32
R E V I E W O F O P E R A T I O N S
event that the liquidator’s claim succeeds, the advance
dividend will be refunded and BoE Corporate’s claim would
become concurrent. Opinion from Senior Counsel is that BoE
Corporate’s claim is secure, and accordingly, no provisions
have been raised, and this amount is shown as a contingent
liability in the financial statements. It is likely this matter will
be heard in court in June 2002.
During the course of the year BoE Corporate took over the
management of the R2.8 billion commercial and industrial
mortgage book that was housed in NBS. The financial results of
this book will be consolidated into BoE Corporate in 2002.
This has resulted in the consolidation of property finance skills
in one division of BoE.
The residential development property loans division within
NBS will be managed by BoE Developments, a subsidiary of
BoE Corporate, who have expertise in this area. No new
lending will be made,as this is not a key area for the Group,but
the book will be managed down.
As part of the broader BoE Group strategy of clustering
together businesses that deal with similar customers, NBS
Corporate Saver has been rebranded as BoE Corporate Saver,
and has become a division of BoE Corporate with effect from
1 October 2001.This is anticipated to increase cross-selling of
banking products to the professional market.
Prospects and strategy
BoE Corporate continues to sharpen its focus in its selected
markets and invests extensively in understanding and
penetrating these markets through a high level of
specialisation.This focus, together with a heavy emphasis on
superior client service and extensive investment in people
development, has positioned the division to anticipate good
growth prospects in the new year.This has been underpinned
by a significant investment in new technology, with the
successful implementation of the SAP system in October 2001,
providing a world class foundation for continued growth
in the business.
Brian Kennedy (41)
Executive Director
MSc Eng, MBA Witwatersrand
Joined:1996. Appointed to the board:2001
Career history:
1998 to present MD,BoE Merchant Bank
1996-1998 Head of Structured & Project
Finance,BoE Merchant Bank
1988-1996 Head of Structured & Project
Finance,FirstCorp Merchant Bank
1984-1988 Senior Systems Engineer,Denel Ltd
■ BoE MERCHANT BANK
What we do
BoE Merchant Bank offers a wide spectrum of investment
banking products and advisory services to large corporate
clients, parastatals, institutions and government. The product
areas include corporate finance, private equity, specialised
finance, financial engineering and securitisation. BoE
Securities, the full service institutional broker, and BoE
Personal Stockbrokers, the retail brokerage, both report into
the Merchant Bank.

33
Financial highlights 2001 2000
Headline earnings R’m 206 87
Total advances R’m 3 191 2 140
Cost to income ratio % 46.4 69.4
Return on equity % 78.2 51.6
Number of employees 322 380
Mark WestonChief Operating Officer
Anton TaljaardSpecialised Finance
Mark LearmonthCorporate Finance
Dave StadlerPrivate Equity
Jean du PlessisBoE Securities
Pierre BrinkGilts
Louis GeldenhuysPersonal Stockbrokers
Patrick JacksonFinancial Engineering
Wynand van ZylEquity Research
Dave EliotPersonal Stockbrokers
Review
BoE Merchant Bank performed extremely well during the year,
with earnings growth of 137% and asset growth of 49% in a
difficult and highly competitive environment. Several high
profile mandates were secured, such as: advising Harmony in
the R1 billion acquisition of the Deelkraal and Elandsrand
mines, as well as structuring and funding R500 million of this
acquisition; underwriting R220 million of cross border
acquisition finance for Harmony’s New Hampton mine in
Australia;participating in the underwriting and financing of up
to R190 million in the Messina Platinum Mine project together
with other participants; R750 million interim funding of the
Maandagshoek Platinum project pending the finalisation of the
project finance facility; and $37.5 million Export Credit
Insurance Corporation (formerly CGIC) backed term project
finance for stage II of the Mozal aluminium smelter in
Mozambique. The division’s success in securing these large
BoE Merchant Bank leverages off its
research capabilities, the Group balance
sheet and a number of products and
channels available in the wider Group.
“
”

34
R E V I E W O F O P E R A T I O N S
transactions is clearly assisted by BoE Bank’s balance sheet
capacity, strong credit skills and a thorough knowledge and
understanding of the sectors in which it focuses.
In its second year of operation, Financial Engineering
continued to realise synergies between Specialised Finance,
Treasury expertise and derivative equity products to deliver
structured investment solutions to the wholesale and retail
markets. This division made a strong contribution to earnings.
The Investment Banking division continues to build on its
success by bringing the breadth of BoE’s product range to bear
on the entire client base. This has resulted in a robust pipeline
of deal flow.
Merchant Bank’s balance sheet is utilised to make private
equity investments. A strong contribution to earnings was
made through the realisation of the private equity investment
in Protea Chemicals.
In the face of strong competition from global investment
banks, BoE Securities was again ranked 7th (unweighted)
amongst all equities research firms.
The separation of the Personal Stockbroking business in the
previous financial year has brought focus to this retail business.
BoE Personal Stockbrokers offers internet trading capability,
portfolio management, as well as execution and delivery
service to private clients. It also offers innovative structured
investment products to its client base.
Prospects and Strategy
BoE Merchant Bank is able to leverage off its research
capabilities, the Group balance sheet and a range of products
and channels available within the wider BoE Group. This is
particularly the case with the Specialised Finance and Financial
Engineering businesses, both of which have carried over good
deal flow into the new financial year. It should be noted,
however, that should adverse global equity conditions prevail
for an extended period, it could affect certain business units
within the Merchant Bank adversely in the year ahead.
David Woollam (37)
Executive Director
BCom Natal, BCompt (Hons) UNISA,CA (SA)
Joined 1999. Appointed to the board: 2001
Career history:
2001 to present Group FD & MD Group Treasury
2000 Group CFO
1999 SGM: Finance – BoE Bank Ltd
1995-1999 Risk & Financial Management –
Greenwich NatWest (London)
1992-1995 Risk Management – Credit Suisse FP
(London)
1991 Financial Management – Mortgage
Services,Citibank (London)
1982-1990 Deloitte & Touche
■ TREASURY
What we do
BoE Group Treasury is focused primarily on four activities:
■ Money Market Funding - managing the wholesale deposit
base of the bank (approximately 63% of deposits);
■ Hedging – providing hedging products to the banking

35
divisions as well as managing the interest rate risk for the
ALCO process;
■ Client facilitation – covers the entire foreign exchange
product range from travel to wholesale; and
■ Proprietary trading – focus on capital markets, interest rate
derivatives and foreign exchange.
Review
The trading operations within Treasury fared well in markets
which, during the course of the year, varied from being range
bound to incredibly volatile. The past year saw continued
growth in the corporate foreign exchange area, which was in
line with the division’s core objective to increase annuity-
based income. Key contributions were again made by the
interest rate derivatives and foreign exchange areas, however
capital market activities fell short of original expectations due
to a continuing lack of liquidity in the options market.
The division had acceptable growth in fee and trading income,
cost growth was well contained and an increase in credit
provisions of R14.9 million being the difference between a
good rather than a truly memorable year.
Treasury management has over the past year expended
significant time on the management of problematic advances.
The division’s involvement in consortium arrangements on
McCarthy Retail and RAG saw both companies recapitalised
during the period. The McRetail recapitalisation of
R870 million and the RAG recapitalisation of R410 million
have effectively created sound financial platforms for
both companies.
Financial highlights 2001 2000
Headline earnings R’m 65 61
Cost to income ratio % 28.4 28.9
Return on equity % 40.2 51.9
Number of employees 117 108
Hannes van der WesthuyzenGroup Treasurer
Gordon Little Neil McCarthy
Willy Ford Gunter Joachim
The establisedfranchises offoreign exchangeand interest rateswaps businesseshave created thebase off which toexpand.
“
”

36
R E V I E W O F O P E R A T I O N S
Siltek and Masterfridge were placed into liquidation during the
period under review and substantial provisions are being held
against both.
At year end, R39.4 million of specific provisions were held
against the four exposures outlined above. The exposures
that led to these provisions were legacy loans inherited out of
the merger with BoE and NBS. BoE Group Treasury no longer
carries out lending activities of this nature.
The past year brought a number of notable achievements:
■ Negotiation of a $130 million syndicated loan;
■ Issuance of a R1.75 billion, three year BoE senior
unsubordinated bond;
■ Continued expansion in the funding book and wholesale
depositor base;
■ Joint-lead arranger of the African Bank bond listing (ABL1);
■ Expansion of corporate foreign exchange profit base; and
■ Excellent profit contribution from the interest rate and
foreign exchange desks.
Prospects and strategy
The established franchises of foreign exchange and interest
rate swaps businesses have created the base off which to
expand. The division invested a great deal of resources into
building strong risk systems and a sound control environment.
A number of plans and strategies have been developed to
expand and diversify the product ranges and customer reach.
The division is committed to delivering on a number of these
during the course of the year. Examples are:
■ Bond origination;
■ Commodities trading;
■ Capital market trading; and
■ Securitisation and credit derivatives.
All this will, however, be done within a tight risk management
framework and a thorough understanding of the risks involved.
Funding the Bank remains a high priority, and the division will
continue to explore ways to diversify and improve the liquidity
profile in order to maintain a sound platform for growth.
■ INVESTMENT MANAGEMENT DIVISION (IMD)
What we do
The Investment Management Division of BoE focuses on
providing solutions to meet a diverse range of clients’ financial
needs. Clients range from intermediaries and institutions to
high net worth individuals at the upper end of the market.
Potential and current clients look to BoE to provide tailor made
Paul Leaf-Wright (39)
Executive Director
BCompt (Hons) UNISA, CA (SA)
Joined:1986. Appointed to the board:1999
A director of various other companies, including Monex
Ltd, Luna Corporation Ltd and Southern African
Investments Ltd
Career history:
2001 to present MD, Investment Management
Business
1999-2000 Executive Director: Finance &
Treasury
1994-1999 MD,BoE Corporate
1986-1994 NBS Bank Ltd: Group Finance &
Treasury
1979-1986 Deloitte & Touche

37
solutions that will deliver investment solutions in line with
their stated objectives and expectations. Through the
integration and alignment of distribution platforms the division
is able to facilitate delivery of investment and banking
products to varied client segments. The product mix for each
segment differs, and through ownership of the client
relationship, BoE is able to deliver a client-centred solution.
Although there is currently a strong South African presence, it
is complemented by the ability to actively leverage this
presence into the Group’s expanding offshore businesses.
Businesses dealing with Private Clients
(BoE Private Bank, Edge Investments, Stenham Gestinor)
The Private Clients segment of the business focuses on
Andrew AitkenPrivate Clients
Brian BéchetInternational Private Clients
Michael FienbergBoE International – Offshore
Vernon BoulleBoE International – SA based
individuals whose net worth or current earnings results in
financial expectations that must be met in a more
individualised and structured way. BoE has delivered
personalised service to high net worth clients and their
families since its inception in 1838. An enviable reputation for
providing clients with both the highest quality of service and
consistent growth,via in-house rigorous investment processes,
has been nurtured. A focus on employing and developing
the highest calibre of staff is maintained. Strengths in this
market have been the core Private Banking values of
professionalism,prudence and personal needs attentiveness.
Providing suitable investments for clients has continued to be a
very important business, and has produced good results
despite the challenges that are facing this market. Armed with
a strong brand and track record, the division continues to
increase its market share. To enhance its offshore offering to
South African based clients and to add bulk to the international
private client and asset management business, BoE acquired
Stenham Gestinor, an international private client asset
management and trust company. Together with BoE Trust
Company Limited, the international offering includes
Financial highlights 2001 2000
Headline earnings R’m 167 191
Assets under management R’m 66 359 52 306
Life fund investments R’m 7 420 6 653
Life companies embedded value R’m 713 844
Cost to income ratio % 62.2 61.0
Return on equity % 21.4 19.7
Number of employees 760 602

38
R E V I E W O F O P E R A T I O N S
confidential onshore and offshore services, including advice on
tax and estate planning, Trustee Services (consulting and
administration), asset management and property investments.
Stenham Gestinor will be used as a distribution platform for
other existing products, in particular from the Life Company.
The process of integrating the South African and offshore
businesses is well under way, and 2002 is an exciting year for
growth in this area.
Edge Investments, acquired in May 2001,has taken the offering
to high net worth individuals one step further, by
supplementing more traditional products with innovative
investment solutions. Through life products, they provide a
structured after tax income stream based on individual client
needs. Edge has performed above the Group’s original
forecasts in its first five months.
Prospects
The banking product range is being supplemented and
transactional capabilities increased to enable the provision of
tailored banking solutions to individuals with a high earnings
capacity. Functionality that currently exists within the Group
will be used to expedite implementation on a cost
efficient basis.
The division has spent time on internal systems and
procedures over the past year to provide a sound platform to
grow the business confidently into the future.
With a concerted marketing drive, extra people resources and
complemented with new products, the Group’s efforts in
aggressively growing the Private Bank in 2002 will be
made possible.
BoE Personal Stockbrokers offers domestic Internet
stockbroking and trading service as well as execution and
delivery service to private clients. BoE Personal Stockbrokers
has a substantial client base, and through the alignment and
co-operation of the Private Bank and Personal Stockbrokers,
these two businesses will enhance the product range to a
significantly enlarged client base.
Businesses distributing through intermediaries
(BoE Life Assurance, BoE Investment Administrators, Edge
Investments and BoE Unit Trust Management Company)
To satisfy individual clients needs, intermediaries require
access to a broad and integrated product offering which
enables them to deliver on client expectations. These needs
include integrated administration platforms, investment,
individual and group life products. A strategy of providing
products to targeted clients through a common integrated
distribution platform is in line with this market’s needs.
Andrew CulbertBroker Clients
Jacqui BennettStrategy & Implementation
Mark SmithHuman Resources
Schalk PieterseSupport Services
BoE Unit Trust Management Company Limited has re-organised
itself after two disappointing years, and has implemented an
aggressive business development plan, including outsourcing
its administration. The product range has been expanded,
resulting in an increased profile. Profitability has improved as
outflows of funds have largely been stemmed.

39
The investment performance on the unit trust funds across the
board has improved in line with expectations, placing two of
our funds, BoE Value Fund and BoE GARP Fund, first in their
respective categories.
BoE Investment Administrators provides products and
administration of retirement and investment needs of
individuals and employers. In association with Edge Multi-
Management, the product offering has been overlaid with an
optional investment advisory service. This approach in
conjunction with Edge offers a more complete solution,which
has attracted a significant flow of new business. Entry into the
Employee Benefits market and subsequent acquisition of
administration contracts on a number of private pension funds
has been enhanced. ‘White labelling’ arrangements for other
leading asset managers have also been secured. The positive
impact of this acquisition on existing business units has been
pleasing. Asset growth to R7.4bn (2000: R1.7bn) is
encouraging and with over 38 000 clients under
administration, this business is favourably positioned for
enhanced growth into the future.
BoE Life Assurance specialises in quality risk and investment
solutions distributed through selected Independent Financial
Advisors,Corporate Brokerages and various Group companies.
The current year has shown substantial growth in the
distribution network and visible advances from the operational
side of the business.
BoE Life Gateway,an interactive point of sale system,continues
to attract business through its ease of use and speed of
decision making. In addition, BoE Life Assurance has launched
its on-line services web initiative and an e-mail policy tracking
communication system. These enhancements have brought
the division one step closer to delivering a buying and
selling assurance service that is easier and a more client-
centric process. It has positioned BoE Life Assurance
at the technological forefront of new business
application processing.
There has been significant growth on the distribution side,
particularly from independent and financial institution broker
markets. This distribution growth has been supported by a
250% increase in the sales team and the opening of sales
offices in Pretoria and Port Elizabeth, as well as the formation
of three supporting micro sales offices. The introduction
of these offices increased market spread and intensified
service levels.
This financial year has seen the development of a Retirement
Annuity product, the sharpening of disability rates and the
enhancement of Adaptability, BoE Life Assurance’s flagship
risk product offering. There has been significant growth in
structured tranche products and the provision of additional
investment choice.
BoE International Portfolio Services (BoEIPS), based in the Isle
of Man, provides multi-manager portfolio services – both
managed and execution only – for private and institutional
clients. Most recently, BoEIPS has successfully launched a
unitised version of its series of multi-manager Select Portfolios.
These new BoE International Multifunds have been developed
in response to the changing domestic capital gains tax
environment. BoEIPS’ range of services supplement our local
offerings and the synergies achieved bode well for the future.
BoE Life International Limited offers a range of flexible and
transparent products that are aimed primarily at investors in
the UK and, in conjunction with BoE International Portfolio
Services, has recently launched products that are specially
designed for the UK trustee and high net worth individual
markets. International businesses, whilst supporting local
businesses, are expanding into niche markets either based on
our current infrastructure and resources, or with our now
expanded offshore operations. Expansion into the UK and

40
R E V I E W O F O P E R A T I O N S
Europe is still in its infancy but we are confident that we will
show good growth in the new year.
Prospects
Integration of the Broker Distribution teams from the Unit
Trust Management Company, Investment Administrators and
Life Companies, which target the broker community, have
taken place where appropriate. This move will enable
communication of one message to the market, strengthen
distribution capability and facilitate becoming more client-
centric whilst offering a much wider product range.
The Employee Benefit business is enhanced via its inclusion
into this group of businesses and exciting growth
opportunities are currently presenting themselves in this
market segment.
Businesses dealing with Institutional clients:
(BoE Asset Management, Kwezi Asset Management, Chiswell
Associates, BoE International Fund Services)
Institutional clients are wholesale investors, encompassing
retirement funds, universities, government and parastatal
schemes, medical aids and corporations. These clients have
unique needs and require delivery on constantly evolving
investment objectives.
drawing on this insight to deliver superior products and levels
of client service.
Clever stock picking, backed by proprietary research, is the
hallmark of our investment style. Consistently superior
investment returns within acceptable levels of risk during this
financial year were achieved. Substantial new assets were
gained during the second half of the financial year based on
continued competitive performance. Back-end administration
processes have been outsourced to right-size the cost base.
Asset Management achieved third position in the overall peer
ranking for the one-year,two-year and three-year periods to end
September 2001 across various recognised industry
performance surveys. Behind this performance lies a team of
entrepreneurial professionals,operating within a structure that
balances the creativity necessary to generate investment ideas
with the appropriate degree of process and discipline. This
performance is now leading to greater inflows of funds, and in
turn, a higher profitability.
Offshore asset manager, BoE International Asset Management
(IOM) Limited,manages a suite of international unit trusts from
the Isle of Man for both institutional and private clients.
BoE Asset Management’s empowerment venture with the
Kwezi Group has enhanced the investment team, further
strengthened empowerment credentials and secured a place
amongst the rated empowerment asset management firms in
South Africa. Many presentations have been made and this
company attracted assets into its new passive product range
mainly in the latter half of the financial year and is well
positioned to secure new mandates in the new year.
Helped by new client wins, London-based Chiswell Associates
Limited raised profits despite the hostile global stock market
environment and also maintained its top quartile investment
performance record. Chiswell is an asset manager with a broad
UK and international investment capability. The firm has now
Anet AhernAsset Management
Robert BrownChiswell
BoE Asset Management is one of South Africa’s top rated asset
managers, managing assets in excess of R16bn (2000: R13bn).
The success of this business lies in leveraging individual
clients’ needs off a proprietary investment process, and

41
been part of the BoE Group for three years and has a growing
reputation in the UK where it manages stock market
investments for pension funds, charities and unusually wealthy
private clients. Chiswell also manages the international
investments of clients of BoE Group companies.
Highlights of the year included continuing success at the
annual Private Asset Manager’s Awards and an excellent
reception for the firm’s growing programme of promotional
events around the UK. Market conditions remain difficult and
highly competitive, but long-term prospects remain excellent
as Chiswell continues to establish itself as an emerging force in
its chosen markets.
BoE acquired 100% of Edge Multi-Management in May 2001.
Whilst Edge services a similar client base as the local asset
management company, it offers this market a multi-manager
solution. Edge has steadily grown its asset base to in excess of
R3 billion and anticipates further good growth in 2002. The
launch of BoE retail multi-manager products with Edge as the
manager will enable Edge to penetrate the lucrative unit trust
market. This is another example of expanding our range of
services to this market so that differing needs of clients
are met.
In keeping with an international strategy to enter niche
markets, BoE International Fund Services Limited provides
third party fund administration services to institutional clients,
including the BoE International range of international pooled
funds. Through the combined flexibility of its in-house
developed systems and its experienced personnel, it offers a
professional and cost effective service to a wide spectrum of
International Investment Advisers and Fund Managers. The
company currently administers funds domiciled in the Isle of
Man, Cayman Islands, British Virgin Islands and the State of
Delaware in the USA, which invest in a wide range of global
investment instruments.
Prospects
BoE Asset Management will continue to develop its business
and investment model to secure a steady growth in revenue,
while still focusing on retaining and enhancing the offering to
the existing base of highly valued clients. Multi-manager
acceptance is strong, which also bodes well for the future.
Locally,the shift from defined benefit to defined contribution is
gaining momentum, and the division is well positioned to
service clients in this change.
The International businesses offer exciting prospects and solid
building blocks are being put in place to fulfil local clients’
needs offshore as exchange controls are relaxed.The offshore
business will add real value as growth is being generated off a
relatively low historic earnings base.

42
R E V I E W O F O P E R A T I O N S
■ RETAIL BANKING
What we do
BoE’s Retail Banking businesses provide banking services to
the lower and middle-income markets.These services include
consumer credit, personal loans, savings and deposit accounts,
transaction accounts and home loans secured by mortgage
bonds or retirement fund assets.
Financial highlights 2001 2000
Headline earnings R’m 23 147
NBS R’m (39) 142
PEP Bank R’m (7) –
Credcor R’m 41 –
Short-term Insurance R’m 28 5
Total advances R’m 17 703 17 085
Bad debts as % of net advances % 2.5 1.1
Cost to income ratio % 58.3 58.6
Return on equity % 2.0 15.7
Number of employees 3 007 2 520
Review
The 2001 financial results for NBS include the following
divisions:
■ The Mortgage Loans division, which provides retail
mortgage loan products to the middle-income market;
■ the Savings and Investment division, which provides retail
savings, investment and transaction products to the lower-
and middle-income markets through a number of specialised
channels such as the branch network, automatic teller
machines (ATM’s), telephone banking, internet banking and
financial planners;
J G Maxwell (40)
Executive Director
BCom,PGDA Natal, CA (SA)
Joined:1990. Appointed to the board:1999
A director of various other companies
Career history:
2001 to present MD,Retail Banking Division
2000 Chief Operating Officer,BoE Ltd
2000 MD,BoE Bank Ltd
1999 Deputy MD,BoE Bank Ltd
1997-1999 MD,NBS Division
1990-1996 Various positions in NBS Bank Ltd
1988-1989 Receiver of Revenue
1985-1987 Deloitte & Touche

43
■ the Personal Loans division, which provides personal loans;
and
■ the icanonline internet joint venture with M-Web.
NBS experienced a very challenging year as a result of poor
performance in certain components of the mortgage loans
business, in particular the residential development and the
commercial and industrial portfolios. Following extensive
reviews of the mortgage book and properties in possession,
additional provisions of R130 million were raised in the
current year to position the division going forward. Margin
income also came under pressure as a result of the
introduction and rapid growth of mortgage originators, as well
as the effect of an unadjusted 25 basis point increase in the
repo rate,which further squeezed margins.
Properties in possession (PiPs), whilst decreasing from
R1 058 million to R984 million during the year, reduced more
slowly than anticipated. Renewed focus on the PiPs problem
has resulted in additional provisions referred to above and an
acceleration in sales of these properties. Of the closing
balance, properties awaiting transfer amounted to
R286 million.
As a result of these challenges, no further lending is taking
place in the Commercial and Industrial development
categories. The Commercial and Industrial book has been
transferred to BoE Corporate, the residential development
book is being wound down and a new head has
been appointed for the Mortgage Loans business, which has
been restructured as a separate specialist division from
October 2001. The remainder of NBS’ businesses performed
according to expectations.
During the course of the year, NBS Corporate Saver was
rebranded and moved to BoE Corporate, where synergies exist
with the division’s focus and client base.
Credcor has a long history of providing finance to the
consumer through a network of 11 000 retail merchants across
most sectors of the retail market, including clothing,hardware,
furniture, auto fitment, and secondhand cars. This network
allows the consumer to shop across all retail sectors and only
have one account and one instalment. Using well-established
scoring and administrative systems, Credcor is able to assess
credit risk rapidly and reliably, using the latest scorecard
developments and behavioural scoring for repeated risk
assessment. Customers have access to credit which has
traditionally not been available through banks. BoE acquired
Credcor Limited in April 2001.
John BriscoeBusiness Development
Hassim AkoobNBS Savings
Herman EngelbrechtPEP Bank
Andre SchoemanCredcor
Christine GloverCashbank
Clive van HorenFinance, Risk & Compliance

44
R E V I E W O F O P E R A T I O N S
R5 122. The quality of the advances book has been preserved
and this is reflected in a low ratio of bad debts to advances of
2.3%. Current efforts are focused on more rapid advances
growth whilst maintaining existing credit quality.
BoE announced in June 2001 that it was in the process of
acquiring the business of Cashbank.Cashbank has its origins in
the Group Credit Company, established in 1989, and was
registered as a mutual bank in 1995 and a commercial bank in
1999. Cashbank is a specialist provider of housing finance to
the low income market through products such as mortgage
loans and housing loans secured by borrowers’ pension and
provident fund benefits. Cashbank focuses primarily on
corporate and institutional clients rather than operating an
extensive retail branch network.
The acquisition received regulatory approval from
competition and banking regulators in October 2001 and the
financial results of Cashbank will be included from the
effective date of the transaction in 2002.
Prospects and strategy
BoE’s aim is to become the preferred retail bank in the low to
middle income market. The strategy and priorities for BoE’s
Retail Banking businesses in the year ahead include the
following:
The past year saw many changes for Credcor. With its
expansion into the used car market in May 2000, there was an
unanticipated acceleration in business which resulted in a
funding problem.This led to Credcor temporarily withdrawing
from the used car market. The announcement by BoE to
acquire Credcor stimulated confidence levels and resulted in
turnover increasing to earlier levels.
The financial results include 6 months of Credcor’s operations.
Advances growth during the period was very strong,increasing
from R284 million to R392 million. Provision levels at
acquisition were carefully reviewed and brought in line with
Group and regulatory levels. The integration of Credcor into
the BoE Group proceeded smoothly and quickly, and Credcor
will form an important component of BoE’s Retail Banking
business going forward.
Following the successful completion of a pilot phase in 2000,
the number of PEP Bank branches has increased from 8 to 61 at
the date of this report. PEP Bank products include personal
loans, savings accounts, ATMs and transaction accounts. The
distribution model is based on two main components: a low-
cost branch network and the use of corporate customers as a
channel for distributing products. Pricing is competitive for
both loans and savings accounts, and PEP Bank is well
positioned as a responsible and affordable banking partner for
previously unbanked consumers.
The number of PEP Bank customers has grown rapidly during
the year with a total of 189 596 by year end. The savings
account, which offers attractive interest rates for depositors,
grew to R44 million (2000:R7 million) and continues to attract
considerable interest from customers. Advances grew to
R61 million (2000: R17 million) with an average loan size of

45
■ operating through multiple distribution channels to achieve
maximum revenue growth and, in particular, focusing on
merchant and corporate channels, together with a low-cost
branch model;
■ achieving cost savings through sharing of infrastructure
and resources, and the elimination of duplicate
product factories;
■ effecting the restructuring and repositioning of the business,
including the refocusing of the Mortgage Loans business and
the continued reduction of PiPs; and
■ rationalising the existing set of brands.
The results of the restructuring and acquisitions made during
the past year are expected to be positive.Credcor will continue
to be the Retail Banking division’s main profit contributor in
the year ahead. Credcor has secured merchant agreements
with several leading hardware retailers, as well as independent
merchants. Further growth areas are the provision of finance
for used cars between the ages of five and ten years, and
products which provide credit facilities for medical
expenditure.
The repositioning of NBS Mortgage Loans is expected to
improve focus on profitability of the business.The remaining
NBS businesses, particularly Savings and Investments and
Personal Loans, will be increasingly focused on the low to
middle income market which offers attractive growth
prospects. PEP Bank will continue to roll-out new branches,
although at a slower rate, and is expected to break even in the
year ahead. The focus in Cashbank will be on turning the
business to profitability on the basis of its improved access to
funding, the BoE corporate client base and additional cross-
selling opportunities.
■ GROUP SERVICES
Group Information Technology
What we do
The prime objective of
the Group Information
Technology unit is, in
conjunction with all users, to
formulate and implement an
information technology
strategy to enable BoE to
leverage its information
technology platform to best advantage.
The unit is responsible for all infrastructure activities
throughout the Group, including:
■ telecommunications;
■ groupware services;
■ internet and intranet infrastructure;
■ data centres;
■ assessment of information technology risk;
■ security and access;
■ local and wide area networks; and
■ disaster recovery.
It is also responsible for ensuring that best use is made of
information technology throughout the Group and that
duplication of like systems is eliminated where possible.
Review
Looking at information technology through the years, it started
off in the 1970’s that information technology drove the
business.
Throughout the 1980’s, information technology was the
support to the businesses. In the 1990’s, information
technology operated like a business,whereas today it is seen as
an integral part of the business.
BoE has accordingly set up information technology as a value
centre that must be positioned to continually manage the
Barry FronemanGroup IT

46
R E V I E W O F O P E R A T I O N S
Don BowdenGroup Services
returns from technology, and to ensure that the correct risk
return ratio is achieved from all the systems throughout
the Group.
Centres of excellence have been set up in the major
geographical regions throughout BoE’s operations. These
centres ensure that best use is made of technology, and to date
substantial savings have already been made in terms of
telecommunications. The Group already shares substantial
systems and platforms, including areas such as disaster
recovery units, and is looking for ways to save further costs
into the future.
Prospects and strategy
The Group inherited a number of platforms through the
merger of the three different banking groups. The unit is
currently investigating a common transactional platform that
will be used throughout the banking business units of the
Group. This will entail a process that defines an enterprise
architecture. An enterprise architecture is the holistic
expression of BoE’s key business information application and
technology strategy, and their impact on business functions
and processes.This process is driven through the participation
of all decision makers, including business, operational and
technology members of the various business units.
The enterprise architecture will accommodate the BoE
business model whereby business units are accountable for
their bottomline. Group Information Technology does not
attempt to drive the business but rather focuses on
participating in clearly articulated business decisions to enable
the business units and the Group as a whole to integrate
information technology where possible. Further integration
will help set the platform for effective customer relationship
management and increased cross-sell between the
business units.
We believe that in the short-term, some substantial savings can
be made through these various projects.The long-term goal is
to continue to build information technology in a manner that
fosters innovation, agility, high performance and dynamic
alignment with the business.
Group Risk
The activities of the Group Risk department are clearly set out
within the Risk Management section of this Annual Report.
Other Group Services
Group Marketing, Group Communications, Group Human
Resources, Investor Relations and the Company Secretarial
department are all co-ordinating units that carry out these
functions for the Group as a whole, and ensure consistency in
application of relevant policy
throughout the Group.
Further detail is included in
the Corporate Citizenship
booklet. Mahala ManleyGroup HR

47
Actual Pro forma
2001 2000
Notes R'm % R'm %
VALUE ADDED
Net margin (net of preference share gross up) 1 895 1 722
Fee income and commission income 25 1 053 940
Investment income 26 492 363
Insurance underwriting surplus 27.1 90 36
Other operating income 28 442 339
Exceptional items 32 (860) (40)
Share of retained earnings of associate companies 33 61 73
Operating expenses (excluding staff costs, directors'
remuneration and depreciation) (789) (701)
WEALTH CREATED FROM OPERATIONS 2 384 100 2 732 100
VALUE ALLOCATED
EMPLOYEES 1 073 45 1 005 37
Staff remuneration 1 054 987
Staff training and development cost 30 19 18
DIRECTORS
Directors' remuneration 31.1 16 1 40 1
TAXATION 132 5 92 3
Income tax 34.1 56 20
Other taxes 34.3 76 72
SHAREHOLDERS
Dividends – ordinary 37 430 18 369 14
GROWTH AND EXPANSION 733 31 1 226 45
Depreciation 30 166 178
Provisions 29 671 412
Reserves (147) 601
Deferred taxation 34.1 43 35
2 384 100 2 732 100
The notes refer to the Annual Financial Statements booklet.
■ GROUP VALUE ADDED STATEMENT
Value added measures the performance of the Group in terms of wealth created through the collective efforts of management and
employees by providing clients with a quality, value added service.

48
S E G M E N T A L A N A L Y S I S B Y M A R K E T F O C U S –C O N S O L I D A T E D B A L A N C E S H E E T
Total Consolidation Capital and Corporate Investment Retail
entries Investments Banking Management Banking
R’m 2001 2000 2001 2000 2001 2000 2001 2000 2001 2000 2001 2000
ASSETS
Property and equipment 812 735 – – 325 249 319 305 33 38 135 143
Goodwill 976 124 – – 976 124 – – – – – –
Investments
Associate companies 31 1 634 – – 26 1 630 5 4 – – – –
Other investments 2 770 2 443 – – 2 053 1 676 553 446 164 321 – –
Life funds 7 420 6 653 – – – – – – 7 420 6 653 – –
Short-term insurance fund – 173 – – – – – – – – – 173
Advances 47 458 43 366 – – 1 442 1 938 26 995 23 212 1 318 1 131 17 703 17 085
Deferred taxation assets 96 83 – – 16 73 16 43 (3) (10) 67 (23)
Liquid and trading assets 3 693 3 969 – – 3 130 3 695 474 242 89 32 – –
Receivables 1 937 1 725 (124) (244) 763 897 862 741 298 202 138 129
Short-term deposits and cash 2 043 1 557 (169) (114) 1 044 911 518 320 483 314 167 126
Total assets 67 236 62 462 (293) (358) 9 775 11 193 29 742 25 313 9 802 8 681 18 210 17 633
EQUITY AND LIABILITIES
Capital and reserves 6 402 6 798 – – 1 738 2 972 2 621 1 967 777 785 1 266 1 074
Interest-bearing borrowings 849 851 – – 849 851 – – – – – –
Life funds 7 420 6 653 – – – – – – 7 420 6 653 – –
Short-term insurance fund 11 12 – – – – – – – – 11 12
Deferred taxation liabilities 84 87 – – – 17 28 19 56 51 – –
Deposits and other accounts 49 847 46 253 (65) 131 6 521 6 621 25 482 22 233 1 222 1 062 16 687 16 206
Payables and other provisions 2 623 1 808 (228) (489) 667 732 1 611 1 094 327 130 246 341
Total equity and liabilities 67 236 62 462 (293) (358) 9 775 11 193 29 742 25 313 9 802 8 681 18 210 17 633

49
S E G M E N T A L A N A L Y S I S B Y M A R K E T F O C U S – C O N S O L I D A T E D I N C O M E S T A T E M E N T
Total Consolidation Capital and Corporate Investment Retail
entries Investments Banking Management Banking
Actual Pro forma Actual Pro forma Actual Pro forma Actual Pro forma Actual Pro forma Actual Pro forma
R’m 2001 2000 2001 2000 2001 2000 2001 2000 2001 2000 2001 2000
Income from advances 7 012 6 440 – – 838 562 3 608 3 450 226 224 2 340 2 204
Interest on deposits 5 056 4 614 – (16) 852 594 2 476 2 418 170 175 1 558 1 443
Net margin 1 956 1 826 – 16 (14) (32) 1 132 1 032 56 49 782 761
Fee and commission income 1 053 940 (70) (91) 7 – 552 555 328 322 236 154
Investment income 492 363 – – 211 165 191 84 54 89 36 25
Insurance underwriting surplus 90 36 – – – – – – 97 58 (7) (22)
Other operating income 442 339 – – 189 100 210 192 36 28 7 19
Income from normal
operations 4 033 3 504 (70) (75) 393 233 2 085 1 863 571 546 1 054 937
Bad and doubtful debts 671 412 – – 20 (39) 198 261 13 5 440 185
Operating expenses 2 018 1 893 (70) (75) 129 98 990 988 355 333 614 549
Profit from normal
operations 1 344 1 199 – – 244 174 897 614 203 208 – 203
Exceptional items (860) (40) – – (793) (35) (41) 3 (11) (8) (15) –
Profit from operations 484 1 159 – – (549) 139 856 617 192 200 (15) 203
Financing costs 102 103 – – 68 96 29 7 5 – – –
Share of earnings of associate
companies 61 73 – – 61 73 – – – – – –
Profit before taxation 443 1 129 – – (556) 116 827 610 187 200 (15) 203
Taxation 160 159 – – (23) (47) 175 133 31 17 (23) 56
Net profit for the year 283 970 – – (533) 163 652 477 156 183 8 147
Exclusions 909 114 – – 842 109 41 (3) 11 8 15 –
Headline earnings 1 192 1 084 – – 309 272 693 474 167 191 23 147
Geographical split of headline
earnings
South Africa 1 126 1 024 – – 309 272 669 474 125 131 23 147
International 66 60 – – – – 24 – 42 60 – –
1 192 1 084 – – 309 272 693 474 167 191 23 147
Return on Equity (%) 18.1 15.8 13.1 8.4 30.2 27.4 21.4 19.7 2.0 15.7
Cost to Income Ratio (%) 50.0 54.0 32.8 42.1 47.5 53.0 62.2 61.0 58.3 58.6
Staff numbers 7 334 6 832 195 116 3 372 3 594 760 602 3 007 2 520

50
C O R P O R A T E B A N K I N G – S U M M A R Y B A L A N C E S H E E T
Total Corporate BoE Bank BoE Merchant BoE Treasury
Banking Business Division BoE Corporate Bank Trading
R’m 2001 2000 2001 2000 2001 2000 2001 2000 2001 2000
ASSETS
Investments 557 450 3 53 325 262 229 135 – –
Advances 26 995 23 212 8 288 7 916 14 994 13 070 3 191 2 140 522 86
Liquid and trading assets 475 242 – – 140 119 52 23 283 100
Other assets 1 715 1 409 538 528 226 236 869 487 82 158
Total assets 29 742 25 313 8 829 8 497 15 685 13 687 4 341 2 785 887 344
EQUITY AND LIABILITIES
Capital and reserves 2 620 1 967 730 587 1 400 1 020 315 212 175 148
Deposits and other accounts 25 482 22 233 7 856 7 653 14 169 12 453 2 771 2 018 686 109
Other liabilities 1 640 1 113 243 257 116 214 1 255 555 26 87
Total equity and liabilities 29 742 25 313 8 829 8 497 15 685 13 687 4 341 2 785 887 344

51
C O R P O R A T E B A N K I N G – S U M M A R Y I N C O M E S T A T E M E N T
Total Corporate BoE Bank BoE Merchant BoE Treasury
Banking Business Division BoE Corporate Bank Trading
R’m 2001 2000 2001 2000 2001 2000 2001 2000 2001 2000
Net margin 1 132 1 032 465 497 525 466 114 42 28 27Non-margin income 953 831 355 343 137 135 341 252 120 101
Income from normal operations 2 085 1 863 820 840 662 601 455 294 148 128
Bad and doubtful debts 198 261 90 113 93 140 – 2 15 6Operating expenses 990 988 487 546 250 201 211 204 42 37
Profit from normal operations 897 614 243 181 319 260 244 88 91 85
Exceptional items (41) 3 (39) 3 (3) – 1 – – –Financing costs 29 7 6 6 1 1 22 – – –
Profit before taxation 827 610 198 178 315 259 223 88 91 85Taxation 175 133 62 47 71 61 16 1 26 24
Net profit for the year 652 477 136 131 244 198 207 87 65 61Exclusions 41 (3) 39 (3) 3 – (1) – – –
Headline earnings 693 474 175 128 247 198 206 87 65 61
Return on equity (%) 30.2 27.4 26.6 24.5 20.4 21.5 78.2 51.6 40.2 51.9Cost to income ratio (%) 47.5 53.0 59.4 65.0 37.8 33.4 46.4 69.4 28.4 28.9Return on total assets (%) 2.5 1.9 2.0 1.5 1.7 1.5 5.8 3.1 10.6 3.9Interest margin (%) 4.5 4.5 5.7 6.5 3.7 3.8 4.3 2.0 9.2 2.9Bad debts as a % of advances 0.8 1.1 1.1 1.5 0.7 1.1 – 0.1 4.9 0.6Non-performing advances
as a % of advances 2.9 3.3 3.7 4.2 3.1 3.3 – – 0.9 5.4Provisions as a % of advances 1.9 2.1 2.3 2.6 1.9 2.2 0.7 – 7.1 6.5Staff numbers 3 372 3 594 2 331 2 500 602 606 322 380 117 108

52
I N V E S T M E N T M A N A G E M E N T – S U M M A R Y B A L A N C E S H E E T
Total Investment Asset Management Investment Administration
Management and Unit Trusts Private Banking and Multi-Manager Life Insurance
R’m 2001 2000 2001 2000 2001 2000 2001 2000 2001 2000
ASSETSInvestments 7 584 6 974 10 10 – – – – 7 574 6 964Advances 1 318 1 131 – – 1 318 1 131 – – – –Liquid and trading assets 89 32 89 32 – – – – – –Other assets 811 544 494 330 38 33 35 – 244 181
Total assets 9 802 8 681 593 372 1 356 1 164 35 – 7 818 7 145
EQUITY AND LIABILITIESCapital and reserves 777 785 284 224 125 83 6 – 362 478Deposits and other accounts 1 222 1 062 27 – 1 201 1 062 – – (6) –Other liabilities 7 803 6 834 282 148 30 1 164 29 – 7 462 6 667
Total equity and liabilities 9 802 8 681 593 372 1 356 13 687 35 – 7 818 7 145
ASSETS UNDER MANAGEMENT 65 491 51 158 52 232 44 908 5 834 6 250 7 425 – – –

53
I N V E S T M E N T M A N A G E M E N T – S U M M A R Y I N C O M E S T A T E M E N T
Total Investment Asset Management Investment Administration
Management and Unit Trusts Private Banking and Multi-Manager Life Insurance
R’m 2001 2000 2001 2000 2001 2000 2001 2000 2001 2000
Net margin 56 49 – – 56 49 – – – –Non-margin income 515 497 257 284 59 51 38 – 161 162
Income from normal operations 571 546 257 284 115 100 38 – 161 162
Bad and doubtful debts 13 5 (1) – 14 5 – – – –Operating expenses 355 333 207 233 78 71 31 – 39 29
Profit from normal operations 203 208 51 51 23 24 7 – 122 133
Exceptional items (11) (8) (12) (8) 1 – – – – –Financing costs 5 – 5 – – – – – – –
Profit before taxation 187 200 34 43 24 24 7 – 122 133Taxation 31 17 9 10 5 5 2 – 15 2
Net profit for the year 156 183 25 33 19 19 5 – 107 131Exclusions 11 8 12 8 (1) – – – – –
Headline earnings 167 191 37 41 18 19 5 – 107 131
Return on equity (%) 21.4 19.7 14.6 12.5 17.3 25.9 166.7 – 25.5 23.1Cost to income ratio (%) 62.2 61 80.5 82 67.8 71 81.6 – 24.2 17.9Return on total assets (%) 1.8 2.2 7.7 9.8 1.4 1.7 28.6 – 1.4 1.8Interest margin (%) 4.6 5.0 4.6 5.0Bad debts as a % of advances 1.1 0.5 1.1 0.5Non-performing advances
as a % of advances 2.8 2.7 2.8 2.7Provisions as a % of advances 2.0 1.3 2.0 1.3Staff numbers 760 602 414 288 179 182 79 58 88 74

54
R E T A I L B A N K I N G – S U M M A R Y B A L A N C E S H E E T
Total Retail Short-term
Banking NBS PEP Bank Credcor Insurance
R’m 2001 2000 2001 2000 2001 2000 2001 2000 2001 2000
ASSETS
Investments – 173 – – – – – – – 173
Advances 17 703 17 085 17 254 17 085 57 – 392 – – –
Liquid and trading assets – – – – – – – – – –
Other assets 507 375 277 313 71 – 61 – 98 62
Total assets 18 210 17 633 17 531 17 398 128 – 453 – 98 235
EQUITY AND LIABILITIES
Capital and reserves 1 265 1 074 900 898 25 – 292 – 48 176
Deposits and other accounts 16 686 16 206 16 476 16 206 95 – 109 – 6 –
Other liabilities 259 353 155 294 8 – 52 – 44 59
Total equity and liabilities 18 210 17 633 17 531 17 398 128 – 453 – 98 235
55
R E T A I L B A N K I N G – S U M M A R Y I N C O M E S T A T E M E N T
Total Retail Short-term
Banking NBS PEP Bank Credcor Insurance
R’m 2001 2000 2001 2000 2001 2000 2001 2000 2001 2000
Net margin 782 761 712 761 6 – 64 – – –Non-margin income 272 176 173 173 12 – 58 – 29 3
Income from normal operations 1 054 937 885 934 18 – 122 – 29 3
Bad and doubtful debts 440 185 418 185 5 – 17 – – –Operating expenses 614 549 539 549 24 – 51 – – –
Profit from normal operations – 203 (72) 200 (11) – 54 – 29 3
Exceptional items (15) – (5) – – – – – (10) –Financing costs – – – – – – – – – –
Profit before taxation (15) 203 (77) 200 (11) – 54 _ 19 3Taxation (23) 56 (33) 58 (4) – 13 – 1 (2)
Net profit for the year 8 147 (44) 142 (7) – 41 – 18 5Exclusions 15 – 5 – – – – – 10 –
Headline earnings 23 147 (39) 142 (7) – 41 – 28 5
Return on equity (%) 2.0 15.7Cost to income ratio (%) 58.3 58.6Return on total assets (%) 0.1 0.9Interest margin (%) 4.5 4.7Bad debts as a % of advances 2.5 1.1Non-performing advances
as a % of advances 9.7 9.9Provisions as a % of advances 4.1 2.2Staff numbers 3 007 2 520

56
S E G M E N T A L A N A L Y S I S B Y B U S I N E S S A C T I V I T Y – C O N S O L I D A T E D B A L A N C E S H E E T
Consolidation Banking Related
Total entries Activities Asset Management Insurance
R’m 2001 2000 2001 2000 2001 2000 2001 2000 2001 2000
ASSETS
Property and equipment 812 735 – – 779 692 30 31 3 12
Goodwill 976 124 – – 976 124 – – – –
Investments
Associate companies 31 1 634 – – 31 1 634 – – – –
Other investments 2 770 2 443 – – 2 606 2 122 10 10 154 311
Life funds 7 420 6 653 – – – – – – 7 420 6 653
Short-term insurance fund – 173 – – – – – – – 173
Advances 47 458 43 366 – – 47 458 43 366 – – – –
Deferred taxation assets 96 83 – – 96 80 – – – 3
Liquid and trading assets 3 693 3 969 – – 3 604 3 937 89 32 – –
Receivables 1 937 1 725 (124) (244) 1 740 1 776 204 152 117 41
Short-term deposits and cash 2 043 1 557 (169) (114) 1 695 1 337 295 147 222 187
Total assets 67 236 62 462 (293) (358) 58 985 55 068 628 372 7 916 7 380
EQUITY AND LIABILITIES
Capital and reserves 6 402 6 798 – – 5 702 5 920 290 224 410 654
Interest-bearing borrowings 849 851 – – 849 851 – – – –
Life funds 7 420 6 653 – – – – – – 7 420 6 653
Short-term insurance fund 11 12 – – – – – – 11 12
Deferred taxation liabilities 84 87 – – 36 36 48 51 – –
Deposits and other accounts 49 847 46 253 (65) 131 49 885 46 122 27 – – –
Payables and other provisions 2 623 1 808 (228) (489) 2 513 2 139 263 97 75 61
Total equity and liabilities 67 236 62 462 (293) (358) 58 985 55 068 628 372 7 916 7 380

57
S E G M E N T A L A N A L Y S I S B Y B U S I N E S S A C T I V I T Y – C O N S O L I D A T E D I N C O M E S T A T E M E N T
Consolidation Banking Related
Total entries Activities Asset Management Insurance
Actual Pro forma Actual Pro forma Actual Pro forma Actual Pro forma Actual Pro forma
R’m 2001 2000 2001 2000 2001 2000 2001 2000 2001 2000
Income from advances 7 012 6 440 – – 7 012 6 440 – – – –
Interest on deposits 5 056 4 614 – (16) 5 056 4 630 – – – –
Net margin 1 956 1 826 – 16 1 956 1 810 – – – –
Fee and commission income 1 053 940 (70) (91) 854 760 265 263 4 8
Investment income 492 363 – – 402 249 2 1 88 113
Insurance underwriting surplus 90 36 – – – – – – 90 36
Other operating income 442 339 – – 406 311 29 20 7 8
Income from normal
operations 4 033 3 504 (70) (75) 3 618 3 130 296 284 189 165
Bad and doubtful debts 671 412 – – 672 412 (1) – – –
Operating expenses 2 018 1 893 (70) (75) 1 811 1 706 238 233 39 29
Profit from normal
operations 1 344 1 199 – – 1 135 1 012 59 51 150 136
Exceptional items (860) (40) – – (838) (32) (12) (8) (10) –
Profit from operations 484 1 159 – – 297 980 47 43 140 136
Financing costs 102 103 – – 97 103 5 – – –
Share of earnings of associate
companies 61 73 – – 61 73 – – – –
Profit before taxation 443 1 129 – – 261 950 42 43 140 136
Taxation 160 159 – – 133 149 11 10 16 –
Net profit for the year 283 970 – – 128 801 31 33 124 136
Exclusions 909 114 – – 887 106 12 8 10 –
Headline earnings 1 192 1 084 – – 1 015 907 43 41 134 136
Geographical split of headline
earnings
South Africa 1 126 1 024 – – 991 907 35 12 100 105
International 66 60 – – 24 – 8 29 34 31
1 192 1 084 – – 1 015 907 43 41 134 136
Return on equity (%) 18.1 15.8 17.5 15.2 16.7 12.5 25.2 23.1
Cost to income ratio (%) 50.0 54.0 50.1 54.5 80.4 82.0 20.6 17.6

58
C O R P O R A T E G O V E R N A N C E
58
The Board of Directors is committed to business integrity,
transparency and professionalism in all its activities. As part of
this commitment, the Board supports the highest standards of
corporate governance and the development of best practice.
The Group has strongly demonstrated this over the past year.
In July 2001 a draft of the King Report on Corporate
Governance for South Africa 2001 was released for public
comment.The report, better known as “King II”, represents a
substantial update from the original version issued in 1994.
BoE confirms and acknowledges its responsibility to total
compliance with the Code of Corporate Practices and Conduct
(“The Code”) laid out in King II. The Board of Directors is in
the process of finalising an action plan in this respect. This will
be monitored, within the Group’s Corporate Governance
Framework,on an ongoing basis.
On 1 January 2001 the new regulations to the Banks Act (Act
No. 94 of 1990) came into operation. Those regulations
prescribe certain corporate governance provisions and
minimum requirements for the management of risk. These
provisions and requirements are substantially embodied in
the Code.
The salient features of BoE’s adoption of the Code and
compliance with the Banks Act regulations are outlined below.
■ BOARD OF DIRECTORS
The Board:
■ retains full control over the company, its plans and strategy;
■ acknowledges its responsibilities as to strategy, compliance
with internal policies, external laws and regulations,
effective risk management and performance measurement,
transparency and effective communication both internally
and externally by the Group;
■ sub-committees are supplied with full and timely
information to enable them to discharge their
responsibilities;
■ members have access to the advice of the Company
Secretary and independent professional advice is available to
directors in appropriate circumstances at the company’s
expense;
■ is of a unitary structure comprising:
• 11 non-executive directors, a majority of 9 of whom are
independent directors as defined in the Code, and
• 7 executive directors, 4 of whom were appointed on
1 October 2001;
■ follows a formal, transparent process in respect of director
appointments, assisted by the Nominations Committee; and
■ has established a Board directorship continuity programme.
■ CHAIRMAN, DEPUTY CHAIRMAN
AND CHIEF EXECUTIVE
Both the Chairman and his deputy are non-executive directors.
The Chairman does not yet qualify as an independent director
(as defined by the Code) by virtue of the fact that it has only
been 2 years since he ceased employment from the company
in an executive capacity. The deputy chairman is an
independent director.
The roles of Chairman and Chief Executive are separate, with
responsibilities divided between them, so that no individual
has unfettered powers of decision.
The independent deputy chairman is chairman of the
Governance and Directors’Affairs Committee.This Committee
comprises the non-executive directors of the company who,
amongst other matters, annually appraise the performance of
both the Chairman and the Chief Executive.
■ REMUNERATION
A Remuneration Committee, consisting of non-executive
directors only, is in place. In addition, the Chairman and two of
the other three members are independent directors. The Chief
Executive is invited to attend meetings of the Committee but
plays no part in decisions regarding his own remuneration.
Executives’ total remuneration packages are designed so that a
substantial portion is performance related.
Executive directors are on a notice period of thirty days.

59
C O R P O R A T E G O V E R N A N C E
59
Directors’ emoluments
For directors in office during the year ended 30 September 2001 (in R’000)
Payments for services during the year:
Gain on
exercise
Pension of share
Executive Directors Salary Bonus contribution incentives TOTAL
TA Boardman 1 640 2 200 160 234 4 234
PS Leaf-Wright 1 191 1 750 134 – 3 075
JG Maxwell 1 248 750 252 – 2 250
JAC McGregor * 377 – 27 – 404
TOTAL 4 456 4 700 573 234 9 963
Gain on
Board exercise
meeting Committee Trustee of share
Non-executive Directors fees fees fees incentives TOTAL
CJW Ball 152 115 – – 267
P Gorvalla 112 – – – 112
WJ McAdam 960 – – 667 1 627
JR McAlpine 112 – – – 112
JAC McGregor * 92 82 15 734 923
LA Meyerowitz 112 – – – 112
JG Modibane 112 – – – 112
E Osrin 112 28 – – 140
JR Sanders 387 – – – 387
CML Savage 112 28 – – 140
WJ Swain 112 161 60 – 333
2 375 414 75 1 401 4 265
Payment in respect of prior year:
Payment made to WJ McAdam in respect of his services in the 2000 financial year. The final approval and payment
was made during the 2001 financial year. 2 000
TOTAL 6 265
GRAND TOTAL 16 228
* JAC McGregor retired on 31 December 2000 but remained on the Board as a non-executive director.

60
C O R P O R A T E G O V E R N A N C E
60
Directors’ shareholdings
For directors in office during the year ended 30 September 2001
There have been no changes to these holdings since year end.
Share incentives
For directors in office during the year ended 30 September 2001
Direct Indirect TOTAL
Beneficial Non-beneficial Beneficial Non-beneficial
TA Boardman 304 207 – 2 328 281 – 2 632 488
PS Leaf-Wright 977 434 – – – 977 434
JG Maxwell 457 728 – – – 457 728
WJ McAdam – – 2 861 730 – 2 861 730
JR McAlpine – – 511 015 – 511 015
JAC McGregor 1 400 000 – 5 876 715 – 7 276 715
LA Meyerowitz 44 000 – – 126 000 170 000
E Osrin 36 000 – – 21 798 57 798
CML Savage 177 784 – – – 177 784
WJ Swain 41 620 – – – 41 620
TOTAL 3 438 773 – 11 577 741 147 798 15 164 312
Convertible debentures allocated in 2001
Number of Total options/
convertible debentures at
debentures Issue date Issue price Expiry date year end
TA Boardman 200 000 01/04/2001 R4.10 01/04/2011 2 363 699
PS Leaf-Wright 1 650 000 01/01/2001 R3.67 01/01/2011350 000 01/04/2001 R4.10 01/04/2011 2 000 000
JG Maxwell 100 000 01/04/2001 R4.10 01/04/2011 2 150 000
WJ McAdam – – – – 3 866 592
JAC McGregor – – – – 854 000
TOTAL 11 234 291

61
C O R P O R A T E G O V E R N A N C E
61
Gain on exercise of share incentives
For directors in office during the year ended 30 September 2001
Number of Exercise/
options/ conversion
debentures Issue date Issue price date Market price Gain (R’000)
TA Boardman 122 508 01/10/1995 R3.13 05/12/2000 R3.65 64
48 699 01/10/1966 R3.50 05/12/2000 R3.65 7
133 000 01/03/1997 R3.12 12/06/2001 R4.35 163
234
WJ McAdam 220 000 01/05/1996 R1.32 12/06/2001 R4.35 667
JAC McGregor 400 000 01/03/1997 R3.12 12/06/2001 R4.35 492
80 000 01/05/1996 R1.32 12/06/2001 R4.35 242
734
TOTAL 1 635
■ STATEMENT OF REMUNERATION POLICY
The Group Remuneration Policy is currently being updated by
the Remuneration Committee. It is an umbrella policy that sets
out the guidelines for the business units. The main principle
of this policy is to align the remuneration structures with the
interests of shareholders. Each business unit will be required
to develop its own remuneration policy for its particular
needs and requirements. These policies must, however, be
in line with the principles and guidelines set out in the
Group 75 policy.
■ DETAILS OF REMUNERATION POLICY AND
INCENTIVES STRUCTURES
All reward schemes within the Group will reflect a balancing
of the interest of the shareholders with the objectives of
management. Reward schemes for each business unit will
differ according to business unit and market needs, but there
should be equity across the Group with comparable units,
levels and job functions. Rewards will be determined with
respect to performance measures on three levels, namely
Group, Business Unit and Individual. Performance measures
will be reviewed, revised and agreed annually.
62
C O R P O R A T E G O V E R N A N C E
62
Non-Executive Directors
WJ McAdam
CJW Ball – – –
P Gorvalla
JR McAlpine –
JAC McGregor –
LA Meyerowitz –
JG Modibane
E Osrin –
JR Sanders – –
CML Savage – – –
WJ Swain –
* Unscheduled meetings
Non-executive directors have access to all members of management of the Group.
The Board, through the Audit, Risk and Compliance Committee, regularly reviews the systems of internal control to ensure the standard
and integrity of information and financial results.
Relevant non-financial information is incorporated in the Board’s agenda for meetings.
2000 2001
14 Nov 29 Jan * 8 Feb 10 April * 7 May * 17 May 2 August 20 Sep
Executive Directors
TA Boardman
JG Maxwell
PS Leaf-Wright
■ BOARD MEETINGS
The Board has met on eight separate occasions during the financial year. The Board schedules to meet at least six times per annum.
Attendance of directors at Board meetings for the year were as follows:

63
C O R P O R A T E G O V E R N A N C E

64
C O R P O R A T E G O V E R N A N C E
■ BOARD COMMITTEES
Board committees are formally established through written
terms of reference (charters) that include roles, duties,
reporting and authorities. A report to the full Board at the
next meeting,or sooner if considered necessary, is made by the
chairperson of each board committee.
BoE’s board committees form an integral part of the Group’s
governance framework. In addition,at least one member of the
Audit, Risk and Compliance Committee attends the key
specialist executive risk management committees of the Group
(refer adjacent previous page).
All the board sub-committees have reported to the Board that
they complied with their responsibilities in accordance with
their terms of reference.
Board committees are free to take independent professional
advice as and when necessary.
The Nominations Committee is responsible for evaluations of
the Board, board committees and directors. This is formally
addressed annually.
The Group Company Secretary is responsible for monitoring
adherence to Board procedures and applicable legislation.
The Group Company Secretary, in addition to his extensive
statutory duties, plays a vital role in providing guidance on
directors’ responsibilities and sound governance. All directors
of the company have access to the Group Company Secretary.
The Group Company Secretary is also subjected annually to a
“fit and proper”test by the Nominations Committee.
■ DIRECTORS’ AND EMPLOYEES’
PERSONAL SHARE DEALINGS
BoE has adopted a formal policy and set of rules for “Personal
Account Dealing” which is based on current legislation and
international best practice.
These rules prohibit directors and employees from dealing in
BoE shares during defined closed periods prior to the
announcement of interim and final results, or in any other
period considered sensitive.
All personal account dealings have to be transacted through
the Group’s stockbroker and are subject to the authorisation of
its Compliance Officer. Such dealings also require the prior
approval of an individual’s manager.
Any non-compliance with policy is reported to the Audit, Risk
and Compliance Committee by the Group Compliance Officer,
and disciplinary action is taken.
All dealings by directors in BoE shares are advised to the
Listings Division of the JSE as is required in terms of the JSE
Listing Requirements and such information is published
through SENS. These dealings are also reported at the quarterly
Board meetings.
■ INTERNAL AUDIT
Internal Audit in BoE is an effective independent appraisal
function which examines and evaluates the Group’s activities.
The purpose, authority and responsibility of the function is
formally defined in line with the Institute of Internal Auditors’
definition of internal auditing in a charter approved by the
Board.
Internal Audit reports at Audit, Risk and Compliance
Committee meetings and has unrestricted access to the
chairman of that Committee and the Group. On a day to day
basis, Internal Audit reports to the Chief Risk Officer, who in
turn reports directly to the Chief Executive.
A major thrust of Internal Audit is to co-ordinate throughout
the Group the Business Risk Management and Control Self
Assessment processes.
These processes greatly assist with the risk assessment based
audit approach adopted by Internal Audit.
The scope of the internal audit function is to review the
reliability and integrity of financial and operating information,

65
C O R P O R A T E G O V E R N A N C E
the systems of internal control, the means of safeguarding
assets, the efficient management of the Group’s resources and
the effective conduct of its operations.
Extensive interaction occurs between the internal and external
auditors to ensure completeness and proper audit coverage
while minimising duplication of effort.
A comprehensive, Board approved, Group Risk Management
Framework is in place which formalises the management of
risk throughout the Group.
This, and the application and reporting on risk management, is
detailed in the separate Risk Management section of this
Annual Report.
The Audit, Risk and Compliance Committee is responsible for
assisting the Board in reviewing the risk management process
and the significant risks facing the Group.
A formal risk assessment of the Group is undertaken annually,
including a Risk Profile and Risk Appetite Analysis. This is in
addition to the ongoing Business Risk Management and
Control Self Assessment processes which are firmly
entrenched throughout the Group and enforced by the Audit,
Risk and Compliance Committee on behalf of the Board.
■ INTERNAL CONTROL AND GOING CONCERN
The directors have responsibility for maintaining a system of
internal control which provides reasonable assurance of
effective and efficient operations, internal financial control and
compliance with laws and regulations. In this context, the
directors have regard to what, in their judgement, is
appropriate to the Group’s business, to the materiality of the
financial risks inherent in the business and to the relative costs
and benefits of implementing specific controls.
The Group’s business involves the acceptance
and management of a range of risks and the nature of these
risks means that events may occur which give rise to
unanticipated losses.
The Group’s system of internal control is designed to provide
reasonable, but not absolute, assurance against the risk of
material errors, fraud or losses occurring. It is possible that
internal controls can be circumvented or overridden. Further,
because of changes in conditions, the effectiveness of an
internal control system may vary over time.
Graham Smith
■ RISK MANAGEMENT
The BoE Board acknowledges its responsibility for the entire
process of risk management, as well as forming an opinion on
the effectiveness of the process. Management is accountable
to the Board for designing, implementing and monitoring the
process of risk management and integrating it with the day to
day activities of the Group.
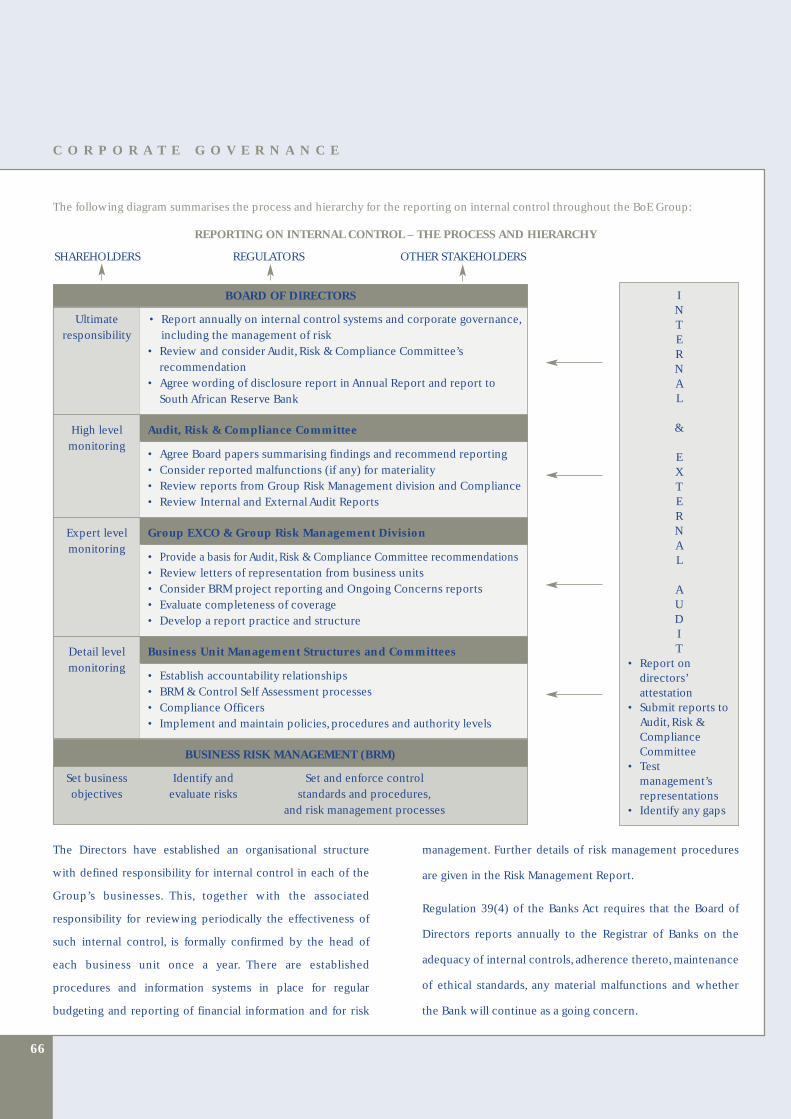
66
C O R P O R A T E G O V E R N A N C E
SHAREHOLDERS REGULATORS OTHER STAKEHOLDERS
INTERNAL
&
EXTERNAL
AUDIT
• Report ondirectors’attestation
• Submit reports toAudit,Risk &ComplianceCommittee
• Testmanagement’srepresentations
• Identify any gaps
The following diagram summarises the process and hierarchy for the reporting on internal control throughout the BoE Group:
REPORTING ON INTERNAL CONTROL – THE PROCESS AND HIERARCHY
The Directors have established an organisational structure
with defined responsibility for internal control in each of the
Group’s businesses. This, together with the associated
responsibility for reviewing periodically the effectiveness of
such internal control, is formally confirmed by the head of
each business unit once a year. There are established
procedures and information systems in place for regular
budgeting and reporting of financial information and for risk
management. Further details of risk management procedures
are given in the Risk Management Report.
Regulation 39(4) of the Banks Act requires that the Board of
Directors reports annually to the Registrar of Banks on the
adequacy of internal controls, adherence thereto, maintenance
of ethical standards, any material malfunctions and whether
the Bank will continue as a going concern.
BOARD OF DIRECTORS
Ultimate • Report annually on internal control systems and corporate governance,responsibility including the management of risk
• Review and consider Audit,Risk & Compliance Committee’srecommendation
• Agree wording of disclosure report in Annual Report and report to South African Reserve Bank
High level Audit, Risk & Compliance Committeemonitoring
• Agree Board papers summarising findings and recommend reporting• Consider reported malfunctions (if any) for materiality• Review reports from Group Risk Management division and Compliance• Review Internal and External Audit Reports
Expert level Group EXCO & Group Risk Management Divisionmonitoring
• Provide a basis for Audit,Risk & Compliance Committee recommendations• Review letters of representation from business units• Consider BRM project reporting and Ongoing Concerns reports• Evaluate completeness of coverage• Develop a report practice and structure
Detail level Business Unit Management Structures and Committeesmonitoring
• Establish accountability relationships• BRM & Control Self Assessment processes• Compliance Officers• Implement and maintain policies,procedures and authority levels
BUSINESS RISK MANAGEMENT (BRM)
Set business Identify and Set and enforce controlobjectives evaluate risks standards and procedures,
and risk management processes

67
C O R P O R A T E G O V E R N A N C E
The heads of each business unit throughout the Group
(including the non-bank operations) are required to sign a
representation letter based on Regulation 39(4). These are
presented to the Audit,Risk & Compliance Committee together
with consolidated BoE Bank Limited and BoE Limited
representation letters. They are in turn presented to the Board
for review and endorsement. Internal and External Audit are
required to formally comment on these letters as to whether
they concur, based on their audit procedures and
investigations, on the representations made by senior
management.
The Business Risk Management and Control Self Assessment
processes in the Group acts as a sound basis for the
representations made by senior management.
The Board reports that:
■ No material malfunction in the Group’s internal control
system has occurred during the period under review;
■ It is satisfied with the effectiveness of the Group’s internal
controls and risk management;
■ It has no reason to believe that the Group will not operate as
a going concern for the year ahead;
■ It has no reason to believe that the Group’s Code of Ethics
has been transgressed in any material respect;
■ It has no reason to believe that the Group’s Policies and
Authority Levels have not been enforced and adhered to in
any material respect; and
■ No material breaches have occurred during the period
under review of compliance with any laws and regulations
applicable to the Group.
■ COMPLIANCE
Compliance is a fully established independent function within
the BoE Group.It is an essential part of the structure of internal
control needed to manage regulatory and reputational risk.
BoE operates within a framework created by legislation and
the regulatory authorities. This is far reaching and complex,
and thus requires the specific attention and skills of the
Group’s Compliance Officers. It is their role to assess, monitor
and report on the following:
■ Material breaches of the regulatory and internal control
environment;
■ Any breach of a fiduciary duty, an act adversely impacting
the reputation of the Group or an act contravening the code
of conduct by senior management;
■ All ongoing legislation covering the Group’s operations;
■ The impact of new legislation/regulation and the
implementation of appropriate policies and procedures;
■ The requirements of the regulatory authorities, both
statutory and voluntary;
■ The terms set out in all mandates signed by clients;
■ The Group’s personal account dealing rules;
■ The Group’s Code of Ethics and its enforcement;
■ Complaints;
■ Material business errors;
■ The compliance culture;
■ Relationships and communication with regulators; and
■ Policies and procedures established to protect the Group
against:
• Financial fraud,
• Insider trading,
• Market abuse, and
• Money laundering.
An effective compliance framework is a necessary pre-
requisite for ensuring BoE’s financial success.
■ CODE OF ETHICS
A Code of Ethics is well entrenched throughout the Group,
driven strongly by the Chief Executive. Details of this and
disclosure on key non-financial matters are contained in the
Corporate Citizenship booklet.

68
C O R P O R A T E G O V E R N A N C E
■ INVESTOR RELATIONS AND COMMUNICATIONS
The Group strives to maximise its relationships with all
stakeholders and manages these through its Investor Relations
and Communications Programme.
This comprises an integral component of the Group’s
commitment to enhancing public disclosure and transparency
of the Group’s activities and financial position.
The Investor Relations department has a program of regular
contact with current and potential investors and sell-side
analysts,both locally and overseas, is available for any enquiries
by private shareholders, and works together with the Group
Finance and Company Secretarial functions in providing
information to shareholders. The Communications team
liaises with the media to ensure that the public is fully
informed,reports back to the operations and to employees;and
manages the Corporate Social Responsibility function to
ensure that it is aligned to the strategic initiatives within the
Group.
Listening to the market forms a key element in the Investor
Relations program. Information and comments gleaned from
discussions with stakeholders are fed back to the operating
divisions, the Group Executive Committee and the Board of
Directors.
The Group endeavours to follow the recommendations of King
II regarding reporting to stakeholders, by presenting a
balanced and understandable assessment of the Group’s
position, addressing material matters of significant interest and
concern, and showing a balance between the positive and
negative aspects of the activities of the Group, in order to
achieve a full, fair and honest account of its performance.

69
R I S K M A N A G E M E N T
■ RISK CULTURE AND PHILOSOPHY
Risk is an inherent part of our business. BoE does not seek to
avoid risk, but to manage it in a controlled manner and in the
context of the reward that is being earned.
The emphasis is on producing high quality earnings which can
ultimately attract a premium rating for the BoE Group.This is
achievable through excellent relationships and innovation, but
only within a sound risk management framework.
BoE recognises that successful risk management lies in
recognising all three elements of risk, namely opportunity,
threat and uncertainty, and then developing an integrated
framework to address each.
BoE enforces a relatively conservative culture with respect to
its overall appetite for risk,and fully endorses and supports the
efforts within the organisation to attain international best
practice in risk management.
The Group’s risk management strategy and philosophies are
implemented and communicated through a dynamic and
comprehensive Group Risk Management Framework,
approved by the Board of Directors. This includes a
comprehensive set of policies and authority levels.
On 1 January 2001 the new regulations to the Banks Act (Act
No. 94 of 1990) came into operation. These regulations
prescribe certain minimum requirements for the management
of risk and compliance. BoE has, since the regulations were
introduced in Bill form some years ago, been proactive in the
implementation of the corporate governance and risk
management regulations. BoE regards the statutory and
regulatory provisions as critically important in the
administration of risk management but also seeks to perform
over and above those requirements within its risk management
framework.
The Board of Directors and Group Risk Management division
have ensured that all risks, processes and procedures referred
to in the regulations have been taken into account and
comprehensively built into the Group Risk Management
Framework. This is to ensure that there is always full
compliance with the minimum standards required by the
regulations.
■ GROUP RISK MANAGEMENT FRAMEWORK
The Board of Directors is ultimately responsible for any
financial loss or reduction in shareholder value suffered by the
Group. It is therefore responsible for the total process of risk
management, recognising all the risks to which the Group is
exposed and ensuring that the proper mandates, policies,
authority levels, risk frameworks, internal controls and systems
are put in place by management, and are functioning
effectively.
John SmaleGroup Risk
Lionel Burger Trevor Adams

70
R I S K M A N A G E M E N T
The Board delegates the responsibility and authority for the
day to day risk management of the Group to senior
management and various specialist committees.
In line with international best practice, where boards of
directors have established a specialist risk management
committee, the role and scope of the Audit,Risk & Compliance
(“ARC”) Committee includes risk management.
Specific risk management responsibilities of the ARC
Committee are:
■ To oversee senior management’s activities in managing
credit, interest rate, market, capital, liquidity, operational,
legal, reputational and other risks of the Group;
■ To approve the Group Risk Management Framework, and
policies and authority levels, including any changes thereto;
■ To ensure that there are effective processes and structures in
place in order that risk is properly identified, managed and
monitored throughout the Group;
■ To formally review and assess risk management on an
ongoing basis; and
■ To monitor the compliance of the organisation with legal
and regulatory requirements, and BoE’s Code of Ethics.

71
R I S K M A N A G E M E N T

72
R I S K M A N A G E M E N T
The ARC Committee and senior management continue to
enforce the Business Risk Management (“BRM”) initiative.
The BRM process is the leading process in the Group focusing
on the identification and measurement of risk. The BRM
risks are regularly updated and the control processes reviewed
to ensure that they are in place and operating as intended.Core
to the BRM process is the philosophy that risk management
does not equate to risk avoidance, but that to create and
enhance shareholder value, risk must be taken in a well
controlled manner.
The BRM process ensures the risks in the organisation are
clearly understood, enabling a successful translation of the
management of risk into profitable long-term business on a
sustainable basis. Results are reviewed by the ARC Committee
on a quarterly basis.
This process has been extended to include the process of
Control Self Assessment (“CSA”).This is a natural development
from the BRM initiative, which enables business unit managers
throughout the Group to monitor their control environment
with independent review by Group Internal Audit. This also
greatly improves the risk awareness of staff and their
understanding of control and risk concepts.
The Group Executive Committee (“Group Exco”) is the
highest management decision-making and policy formulation
body in the Group.
Group Exco has executive responsibility for implementing risk
management, and this involves:
■ identifying the risks to which capital is exposed;
■ proposing the total financial amount the Group is prepared
to place at risk of loss over a specified time;
■ developing and maintaining a strong control and risk
management environment;
■ developing the risk strategy for the Group by clearly
articulating the acceptable levels of exposure to specific risk
types, counterparties and business activities;
■ ensuring that the key policies and procedures for
conducting business activities on both a long-term and day
to day basis are adequate and up to date;
■ ensuring appropriate internal controls are in place;
■ ensuring that the risk implications of all new significant
business initiatives and strategies are properly assessed in
order that no business unit of the Group ever operates
outside the limits of tolerable risk;
■ ensuring that risk is taken into account on long-term plans
and investments;
■ reporting of risk management issues to the Board of
Directors on a regular basis;
■ defining and recommending the risk profile and appetite of
the Group for Board review and approval;
■ monitoring the successful implementation and ongoing
enforcement throughout the Group of the Business Risk
Management and Control Self Assessment processes; and
■ raising risk related concerns and recommending risk
policies, strategies, controls and limits to the Board.
In respect of its risk management responsibilities, Group
Exco is assisted by the Group Risk Management Division
(“Group Risk”).
Group Risk is fully independent of the operational business
units, which have primary responsibility for the management
of risk arising from their business activities and services.
The key roles of Group Risk are to proactively assist and
promote the identification, evaluation and management of
business risks throughout the Group, development of an
integrated risk management framework, promote risk
awareness across the Group and provide consolidated
portfolio risk management analysis and strategy.

73
R I S K M A N A G E M E N T
■ CREDIT RISK MANAGEMENT
Credit Risk Definition
Credit risk is the risk that an asset, in the form of a monetary
claim against a counterparty, may not result in a cash receipt
(or equivalent) in accordance with the terms of the contract.
Source of Credit Risk
Although typically it arises primarily from the Bank’s advances
portfolio, credit risk also exists in the investment and trading
portfolios and in other banking activities such as interbank
lending and overnight deposits.
Credit risk is one of the most significant risk exposures of the
Group and predominantly arises out of the operating business
units in the Bank.
The Group adopts a decentralised business model, in
recognition of the different financial services offered and
market segments served. Varying risk exposures and profiles
are therefore accepted by each operating business unit.
The risks of the Group are aggregated, analysed and monitored
centrally (refer Layers 1 and 2 of the Group Risk Management
Framework), within established policy and authority levels.
The operating business units are fully accountable for the
management of their own risks and have their own risk
management frameworks in place (refer Layer 3 of the Group
Risk Management Framework). It is the responsibility of
Group Risk to ensure that these frameworks are appropriate
and functioning as intended by the Board of Directors.
Group Internal Audit,aside from its corporate governance audit
assurance responsibilities, includes a Forensics Department to
assist proactively with the management and containment of
the high levels of white collar crime in South Africa and the
effective application of the pending Money Laundering
regulations. It also includes an Information Security
Department specialising in the independent audit and risk
management of the significant technological risks to which any
major financial institution is exposed.
Group Compliance is managed across the Group with
compliance officers in each of the major business units
reporting into the Group Compliance Officer at the centre.
Details on the role of compliance are provided in the
Corporate Governance report.
Dave HammondTax
Craig DavidsonFinance
Lance BlumerisFinance
Murray DonkinFinance

74
R I S K M A N A G E M E N T
Credit Risk Management Framework
A Credit Risk Management Framework, approved by the Board of Directors, sets out on a macro basis how the Bank manages its credit
risk. This is outlined below.
Credit Risk Monitoring Process
Board of Directors
The Board of Directors is ultimately responsible for credit risk and is specifically responsible for an appropriate mandate structure, the
Credit Risk Management Framework,composition of the Group Credit Committee and final approval of new or revised credit policies as
well as the annual review of the Group’s overall credit policy document.
The Board of Directors delegates the responsibility and authority for credit risk management to the Group Credit Committee but not the
accountability thereof.
Group Credit Committee
The primary roles of the Group Credit Committee are to establish credit policies and philosophy,set credit limits and guidelines,confirm
that procedures are in place to manage and control credit risk, approve the adequacy of interim and year end provisions and ensure the
quality of the Bank’s credit portfolio is in accordance with these requirements by analysing and monitoring various credit risk
information (e.g.portfolio concentration) and disclosures.
Group Risk Management Division
Group Risk’s credit function primarily includes:
■ the review of business units’ credit policies,methodologies and philosophies;
■ credit risk measurement and the business units’ reporting processes;
■ the management and monitoring of large exposures,portfolio concentrations and other credit risk management information;
■ the establishment of an appropriate credit authority structure;
■ the co-ordination of credit where interdivisional conflicts arise;
■ the standardisation of credit risk management across business units where appropriate;
■ co-ordination of the Group Credit Committee meetings and ongoing enhancement of credit risk reporting of the Bank; and
■ reporting on credit risk to the Board of Directors.
Business Units’ Credit Committees
[Group Treasury • NBS • BoE Merchant Bank • BoE Corporate • BoE Bank • BoE Private Bank • Credcor • BoE Asset Management]
The Business Units’ Credit Committees comprise the Head of Credit Risk (Chair) and Managing Director of the business unit, other
selected executives and at least one member of the Group Credit Committee.
The role of the Business Unit Credit Committees is to set credit limits and guidelines within their mandates, ensure that policies and
procedures are in place to manage and control credit risk within the business unit, ensure that the quality of the business unit credit
portfolio is in accordance with the credit policies and philosophies of the Group and to monitor and review monthly credit information
and disclosures.
Business units are responsible for proposing and maintaining a credit mandate structure for the approval of facilities up to the divisional
mandate as proposed by the Group Credit Committee and approved by the Board of Directors.
Credit Exposure Management
The Bank has an integrated Group Exposures System (“GES”) which enables business units throughout the Bank to determine any
existing exposure to a prospective client.This system is also being used to monitor large exposures and for reporting thereon to the
Group Credit Committee and the Board of Directors.

75
R I S K M A N A G E M E N T
Credit Approval Process
Mandate Structure:
Board of Directors
Applications above R500 million (Tier 5)
The Board of Directors approves the credit facilities greater than R500 million in addition to the Executive Credit Panel.
Board’s Credit Panel
Applications between R250 million and R500 million (Tier 4)
Any 3 members of the Board’s Credit Panel, 2 of which must be non-executive directors, in addition to the Executive Credit Panel.
Applications between R150 million and R250 million (Tier 3)
Any 2 members of the Board’s Credit Panel in addition to the Executive Credit Panel.
Executive Credit Panel
Applications between the divisional mandate level and R150 million (Tier 2)
Any 3 members of the Executive Credit Panel (excluding the divisional executive from whose division the application was made),at least
one of which must be member of the Group Credit Committee.
All applications in excess of the divisional mandates must be signed by the business unit’s Managing Director or his duly appointed
alternate in his absence, in addition to the normal divisional mandate structure and approval process.
Applications exceed a division mandate where the Group’s aggregate exposure to a client or group of related parties will go, or further
increase,beyond the limits specified, assuming the application is approved.
All mandate structures apply to both lending and equity transactions, individually and in the aggregate.
Business Units
Applications up to business unit mandate levels (Tier 1)
Business unit credit mandates below R100 million apply at varying levels.
Centralisation of credit risk expertise applies at business unit and Group levels.
Separation of lending officers’ and credit risk management officers’ roles are enforced in the operations.
Key Credit Risk Policies and Philosophies of the Group
■ No speculative loans allowed.
■ Strong emphasis placed on client’s loan serviceability and
cash flow.
■ Strong preference for tangible security.
■ Integrity of the borrower is paramount.
■ Avoidance of undue portfolio concentrations.
■ Provide full disclosure and reporting to the directors,
regulators and other shareholders.
■ No cross border lending unless following a local client’s
international expansion.
■ Each operating business unit in the Bank is required to
maintain a credit control policy document suitable for its
sphere of lending and approved strategy, and which takes
due cognisance of the Group’s overall credit policy and
other directives which may be issued from time to time.
These documents are required to be ratified by the Group
Credit Committee and are subject to an annual review.
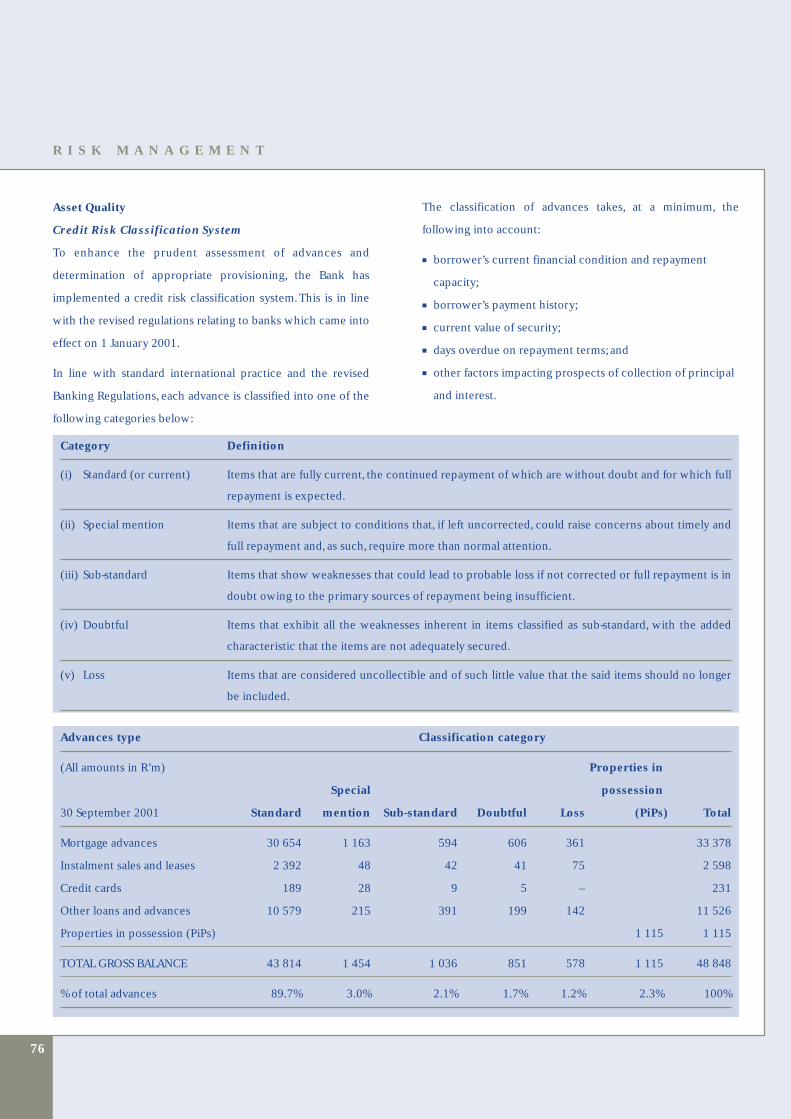
76
R I S K M A N A G E M E N T
Advances type Classification category
(All amounts in R’m) Properties in
Special possession
30 September 2001 Standard mention Sub-standard Doubtful Loss (PiPs) Total
Mortgage advances 30 654 1 163 594 606 361 33 378
Instalment sales and leases 2 392 48 42 41 75 2 598
Credit cards 189 28 9 5 – 231
Other loans and advances 10 579 215 391 199 142 11 526
Properties in possession (PiPs) 1 115 1 115
TOTAL GROSS BALANCE 43 814 1 454 1 036 851 578 1 115 48 848
% of total advances 89.7% 3.0% 2.1% 1.7% 1.2% 2.3% 100%
Asset Quality
Credit Risk Classification System
To enhance the prudent assessment of advances and
determination of appropriate provisioning, the Bank has
implemented a credit risk classification system.This is in line
with the revised regulations relating to banks which came into
effect on 1 January 2001.
In line with standard international practice and the revised
Banking Regulations, each advance is classified into one of the
following categories below:
Category Definition
(i) Standard (or current) Items that are fully current, the continued repayment of which are without doubt and for which full
repayment is expected.
(ii) Special mention Items that are subject to conditions that, if left uncorrected, could raise concerns about timely and
full repayment and, as such, require more than normal attention.
(iii) Sub-standard Items that show weaknesses that could lead to probable loss if not corrected or full repayment is in
doubt owing to the primary sources of repayment being insufficient.
(iv) Doubtful Items that exhibit all the weaknesses inherent in items classified as sub-standard, with the added
characteristic that the items are not adequately secured.
(v) Loss Items that are considered uncollectible and of such little value that the said items should no longer
be included.
The classification of advances takes, at a minimum, the
following into account:
■ borrower’s current financial condition and repayment
capacity;
■ borrower’s payment history;
■ current value of security;
■ days overdue on repayment terms; and
■ other factors impacting prospects of collection of principal
and interest.
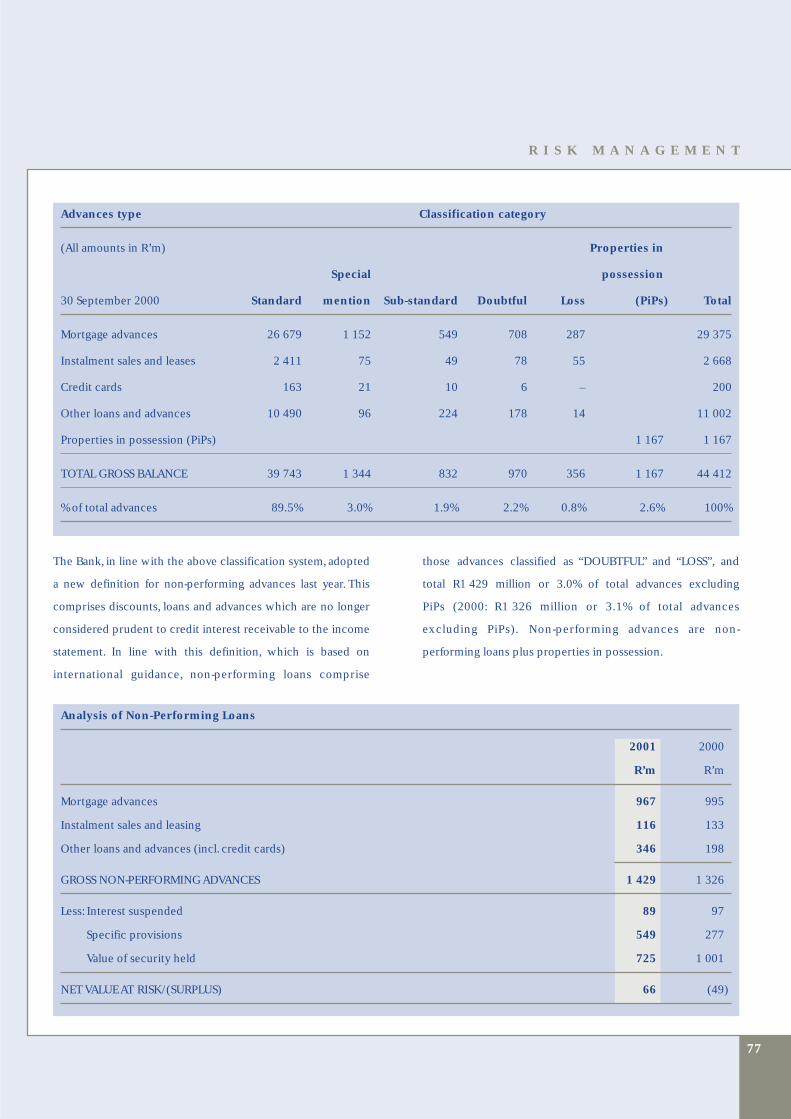
77
R I S K M A N A G E M E N T
Advances type Classification category
(All amounts in R’m) Properties in
Special possession
30 September 2000 Standard mention Sub-standard Doubtful Loss (PiPs) Total
Mortgage advances 26 679 1 152 549 708 287 29 375
Instalment sales and leases 2 411 75 49 78 55 2 668
Credit cards 163 21 10 6 – 200
Other loans and advances 10 490 96 224 178 14 11 002
Properties in possession (PiPs) 1 167 1 167
TOTAL GROSS BALANCE 39 743 1 344 832 970 356 1 167 44 412
% of total advances 89.5% 3.0% 1.9% 2.2% 0.8% 2.6% 100%
The Bank, in line with the above classification system, adopted
a new definition for non-performing advances last year. This
comprises discounts, loans and advances which are no longer
considered prudent to credit interest receivable to the income
statement. In line with this definition, which is based on
international guidance, non-performing loans comprise
those advances classified as “DOUBTFUL” and “LOSS”, and
total R1 429 million or 3.0% of total advances excluding
PiPs (2000: R1 326 million or 3.1% of total advances
excluding PiPs). Non-performing advances are non-
performing loans plus properties in possession.
Analysis of Non-Performing Loans
2001 2000
R’m R’m
Mortgage advances 967 995
Instalment sales and leasing 116 133
Other loans and advances (incl. credit cards) 346 198
GROSS NON-PERFORMING ADVANCES 1 429 1 326
Less: Interest suspended 89 97
Specific provisions 549 277
Value of security held 725 1 001
NET VALUE AT RISK/(SURPLUS) 66 (49)
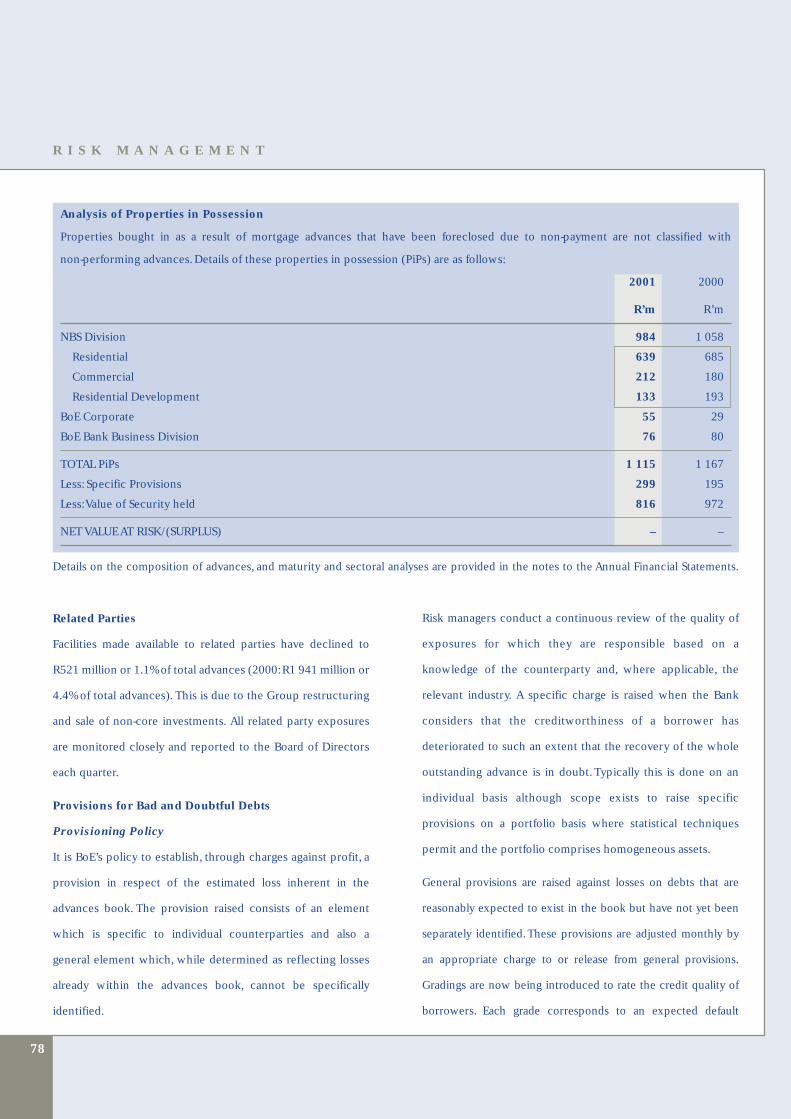
78
R I S K M A N A G E M E N T
Related Parties
Facilities made available to related parties have declined to
R521 million or 1.1% of total advances (2000:R1 941 million or
4.4% of total advances). This is due to the Group restructuring
and sale of non-core investments. All related party exposures
are monitored closely and reported to the Board of Directors
each quarter.
Provisions for Bad and Doubtful Debts
Provisioning Policy
It is BoE’s policy to establish, through charges against profit, a
provision in respect of the estimated loss inherent in the
advances book. The provision raised consists of an element
which is specific to individual counterparties and also a
general element which, while determined as reflecting losses
already within the advances book, cannot be specifically
identified.
Risk managers conduct a continuous review of the quality of
exposures for which they are responsible based on a
knowledge of the counterparty and, where applicable, the
relevant industry. A specific charge is raised when the Bank
considers that the creditworthiness of a borrower has
deteriorated to such an extent that the recovery of the whole
outstanding advance is in doubt.Typically this is done on an
individual basis although scope exists to raise specific
provisions on a portfolio basis where statistical techniques
permit and the portfolio comprises homogeneous assets.
General provisions are raised against losses on debts that are
reasonably expected to exist in the book but have not yet been
separately identified.These provisions are adjusted monthly by
an appropriate charge to or release from general provisions.
Gradings are now being introduced to rate the credit quality of
borrowers. Each grade corresponds to an expected default
Analysis of Properties in Possession
Properties bought in as a result of mortgage advances that have been foreclosed due to non-payment are not classified with
non-performing advances.Details of these properties in possession (PiPs) are as follows:
2001 2000
R’m R’m
NBS Division 984 1 058
Residential 639 685
Commercial 212 180
Residential Development 133 193
BoE Corporate 55 29
BoE Bank Business Division 76 80
TOTAL PiPs 1 115 1 167
Less: Specific Provisions 299 195
Less:Value of Security held 816 972
NET VALUE AT RISK/(SURPLUS) – –
Details on the composition of advances, and maturity and sectoral analyses are provided in the notes to the Annual Financial Statements.
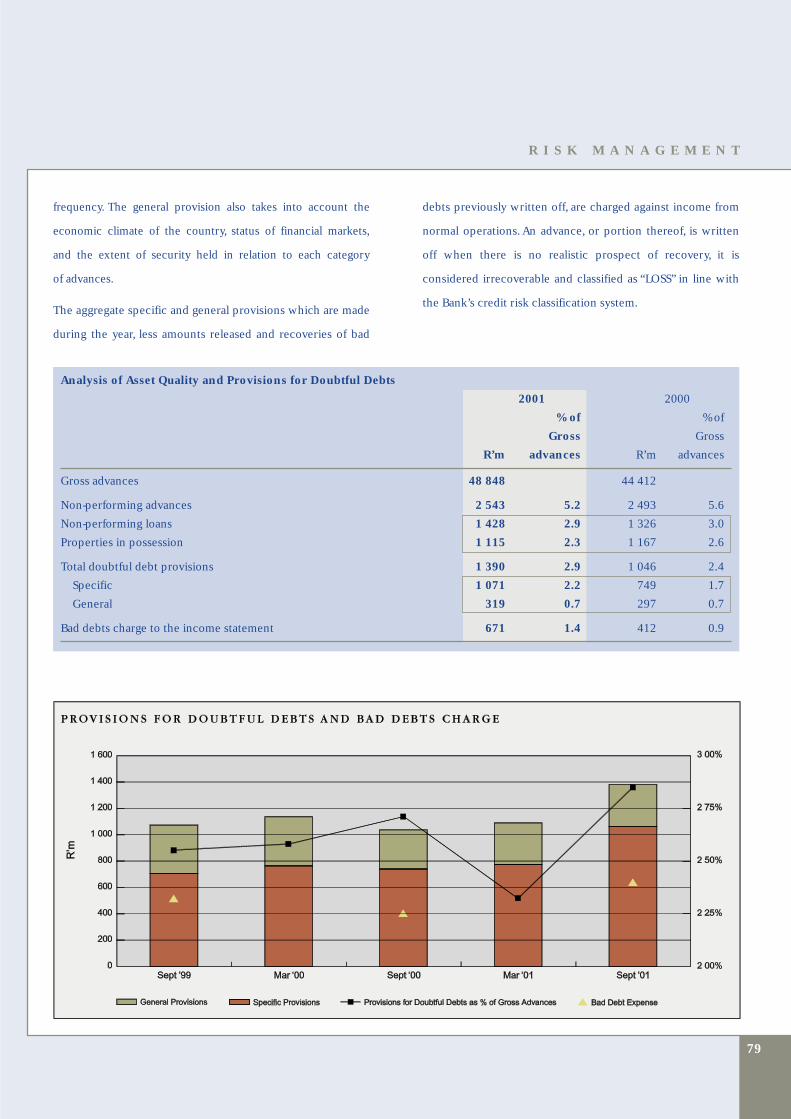
79
R I S K M A N A G E M E N T
frequency. The general provision also takes into account the
economic climate of the country, status of financial markets,
and the extent of security held in relation to each category
of advances.
The aggregate specific and general provisions which are made
during the year, less amounts released and recoveries of bad
debts previously written off, are charged against income from
normal operations. An advance, or portion thereof, is written
off when there is no realistic prospect of recovery, it is
considered irrecoverable and classified as “LOSS” in line with
the Bank’s credit risk classification system.
Analysis of Asset Quality and Provisions for Doubtful Debts
2001 2000
% of % of
Gross Gross
R’m advances R’m advances
Gross advances 48 848 44 412
Non-performing advances 2 543 5.2 2 493 5.6
Non-performing loans 1 428 2.9 1 326 3.0
Properties in possession 1 115 2.3 1 167 2.6
Total doubtful debt provisions 1 390 2.9 1 046 2.4
Specific 1 071 2.2 749 1.7
General 319 0.7 297 0.7
Bad debts charge to the income statement 671 1.4 412 0.9
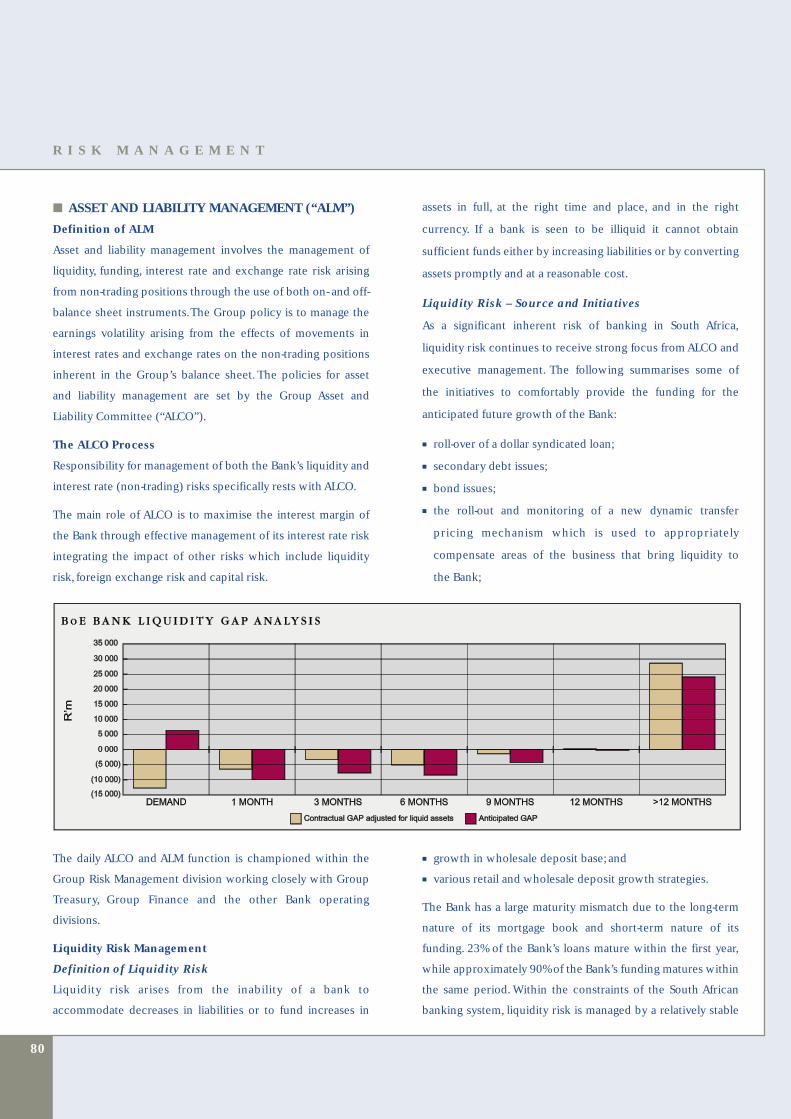
80
R I S K M A N A G E M E N T
■ ASSET AND LIABILITY MANAGEMENT (“ALM”)
Definition of ALM
Asset and liability management involves the management of
liquidity, funding, interest rate and exchange rate risk arising
from non-trading positions through the use of both on- and off-
balance sheet instruments.The Group policy is to manage the
earnings volatility arising from the effects of movements in
interest rates and exchange rates on the non-trading positions
inherent in the Group’s balance sheet. The policies for asset
and liability management are set by the Group Asset and
Liability Committee (“ALCO”).
The ALCO Process
Responsibility for management of both the Bank’s liquidity and
interest rate (non-trading) risks specifically rests with ALCO.
The main role of ALCO is to maximise the interest margin of
the Bank through effective management of its interest rate risk
integrating the impact of other risks which include liquidity
risk, foreign exchange risk and capital risk.
assets in full, at the right time and place, and in the right
currency. If a bank is seen to be illiquid it cannot obtain
sufficient funds either by increasing liabilities or by converting
assets promptly and at a reasonable cost.
Liquidity Risk – Source and Initiatives
As a significant inherent risk of banking in South Africa,
liquidity risk continues to receive strong focus from ALCO and
executive management. The following summarises some of
the initiatives to comfortably provide the funding for the
anticipated future growth of the Bank:
■ roll-over of a dollar syndicated loan;
■ secondary debt issues;
■ bond issues;
■ the roll-out and monitoring of a new dynamic transfer
pricing mechanism which is used to appropriately
compensate areas of the business that bring liquidity to
the Bank;
The daily ALCO and ALM function is championed within the
Group Risk Management division working closely with Group
Treasury, Group Finance and the other Bank operating
divisions.
Liquidity Risk Management
Definition of Liquidity Risk
Liquidity risk arises from the inability of a bank to
accommodate decreases in liabilities or to fund increases in
■ growth in wholesale deposit base; and
■ various retail and wholesale deposit growth strategies.
The Bank has a large maturity mismatch due to the long-term
nature of its mortgage book and short-term nature of its
funding. 23% of the Bank’s loans mature within the first year,
while approximately 90% of the Bank’s funding matures within
the same period. Within the constraints of the South African
banking system, liquidity risk is managed by a relatively stable

81
R I S K M A N A G E M E N T
retail and wholesale deposit base, holding surplus cash and
liquid assets when the need arises, avoiding funding
concentrations, maintaining a diversified funding distribution
and by placing reliance on the South African Reserve Bank as
the lender of last resort.
The Bank’s anticipated maturity mismatch significantly
lengthens the roll-off of liabilities. The expected behaviour
of these liabilities has been determined statistically based on
the historical behaviour of these products.
Various liquidity risk policies, limits and procedures are
enforced in the Bank to actively manage liquidity risk, and
some of these include:
■ Daily cash management procedures;
■ Structuring of the funding maturity profile;
■ Maintenance of a daily average surplus of statutory liquid
assets as determined by ALCO;and
■ Liquidity contingency planning.
Detail on the composition of deposits and other liabilities, and
maturity and sectoral analysis are provided in the notes to the
Annual Financial Statements.
Interest Rate Risk Management
Definition of Interest Rate Risk
Interest rate risk is the potential adverse impact on earnings
and economic value due to changes in interest rates. The main
source of interest rate risk is repricing mismatch risk. This
arises when there are mismatches or gaps in the amount of
assets, liabilities and off-balance sheet instruments that mature
or reprice in different time periods primarily due to customers’
differing term preferences.

82
R I S K M A N A G E M E N T
Interest Rate Risk – Source and Strategy
The interest rate risk arises from the banking operations. All
interest rate risk outside of the 3-month area is transferred to
Group Treasury where it is managed centrally on a daily basis in
conjunction with the Group ALCO function. Supervision is by
the Group ALCO committee which also sets the interest rate
risk appetite, interest rate strategy and policies.
The total Bank exposure is summarised in the form of an
interest rate repricing graph and table which are depicted
below. These summarise the repricing profile of the Bank’s
assets, liabilities and off-balance sheet exposures
at 30 September 2001 and also ref lect the hedging
discussed opposite.
The graph can be used as the basis for the assessment of the
sensitivity of the Bank’s earnings to interest rate movements,
although allowance is also made for other factors such as
anticipated early repayment profiles of the advances portfolio.
In view of the ongoing volatility and uncertainty in financial
markets, the Group’s interest rate risk strategy in 2001 has
been to neutralise substantially its interest rate exposure on the
banking book through the use of derivative instruments. This
is evident, as at 30 September 2001, from the graph and table
below. The Bank neutralises interest rate risk through the use
of BA-linked swaps and Rand Overnight Deposit Swaps.
The Bank’s capital, however, is managed on a yield basis and is
invested in fixed-rate yielding assets ranging from treasury bills
to longer-dated government bonds. The longer-dated
government bonds are included in the positive mismatch in
the greater than 12 month area.
Call – 1 3 6 9 12 >12 Non-rate
REPRICING MATURITY PERIOD: month months months months months months sensitve
Interest rate sensitivity gap (3 463) 2,771 (557) 307 (304) 1 257 (11)
Cumulative interest rate
sensitivity gap (3 463) (692) (1 249) (942) (1 246) 11 0

83
R I S K M A N A G E M E N T
Hedging
Risk management activities employ interest rate swaps (BA-
linked and Rand Overnight Deposit swaps),currency and other
derivatives that are designated as hedges.
The table below provides examples of certain activities
undertaken by the Bank, together with the related market risks
and the types of derivatives that may be used in managing
such risks.
Foreign Exchange Rate Risk
Foreign exchange rate risk is the potential adverse impact on
earnings and economic value due to currency rate movements.
Trading portfolios are exposed to foreign exchange rate risk in
both the spot and forward foreign exchange markets. Spot
foreign exchange rate risk arises when the total present value
of assets in any currency does not equal the total present value
of liabilities in that currency. Forward foreign exchange rate
Activity Risk Type of hedge
Fixed rate lending and fixed Reduced earnings due to an Pay fixed interest rate swaps
rate investments. increase in funding rates. and buy interest rate caps.
Fixed rate funding. Reduced earnings due to a Receive fixed interest rate
fall in lending rates. swaps and buy interest rate
floors.
Firm foreign currency Reduced earnings due to Foreign currency
commitments (e.g. asset changes in exchange rates transactions.
purchases and sales). between arranging a
transaction and completion.
The hedge transactions which are linked to the above activities
are centralised within Group Treasury and the exposure is
transferred to the market principally via independently
managed dealing desks, which treat these transactions as part
of their normal trading activities, and also via third parties.
■ TRADING ACTIVITIES
Market risk associated with trading activities is a result of
proprietary trading in the capital, interest rate, foreign
exchange and equity markets.
Price Risk
Price risk is the risk of a decline in the net realisable value of
on- or off-balance sheet positions in marketable securities and
derivatives arising from adverse movements in market prices.
Market prices are independent variables which include
interest rates, exchange rates, equity and commodity prices.
risk arises when, for a given currency, the maturity profile of
forward purchases differs from the maturity profile of
forward sales.
Equity Risk
Equity risk is the potential adverse impact on earnings due to
movements in individual equity prices or general movements
in the value of the stock market. The Group is engaged in
buying and selling stocks as principal in its stockbroking
businesses, BoE Securities and BoE Personal Stockbrokers, and
its hedge fund management division of BoE Asset Management.
Speculative trading in the equity market for the Group’s own
account is limited to these two divisions and is subject to the
limitations of specific authority levels.

84
R I S K M A N A G E M E N T
Private equity deals are entertained but with a conservative
risk appetite. Investment banking activities are a key feature of
the BoE Merchant Bank division.
Market Risk Management
Risk management policies and limits, within which exposure
to market risk is monitored and controlled, are established.
Market risk in the Bank’s trading portfolios is managed
primarily through a Capital-at-Risk methodology with a major
emphasis on scenario and “What-If” analysis. Market risk
relating to the Bank’s non-proprietary trading activities is
monitored and managed as an integral part of the ALCO
process, including the use of various risk management tools
such as scenario and gap analysis.
The Market Risk Management function within the Group Risk
Management division, which is completely independent of the
trading function, oversees trading risks and develops and
implements comprehensive risk measures, policies and limits
that are observed by each trading desk. This function is also
responsible for the daily monitoring of trading risk exposures
against actual limits using a Capital-at-Risk methodology, and
alerting senior management to adverse trends or positions.
Risk Profile
Trading activities constitute a small portion of the Group’s
business activities. BoE is not a large trading institution and as
such the limits approved are small and very conservative in
relation to BoE’s total capital.
In line with the banking regulations’ Capital Adequacy
Directive, an amount of R100 million has been formally
allocated by the Board of Directors as capital to the proprietary
trading activities, specifically defined as Treasury’s capital
market and interest rate derivatives activities. A further
R53 million has been allocated to the hedge fund management
division.
The Group Market Risk Committee is mandated to amend the
amount of capital allocated to the trading activities of the Bank
should such a need arise, such allocation being presented for
ratification at the Board of Directors’ meeting which follows
such allocation.
Daily reporting of the Bank’s trading exposures is made to the
South African Reserve Bank in terms of banking regulations.
This reporting is made by the independent market risk
management function. Reporting is made to the Group Market
Risk Committee and quarterly to the Board of Directors.
Value-at-Risk (“VAR”)
The Bank has implemented a sophisticated Value-at-Risk model
but has extended its period of back testing before final
adoption to ensure full compliance with the South African
Reserve Bank requirements. Full use is expected early in the
new calendar year. This will ultimately replace the Capital-at-
Risk methodology discussed above.
VAR is an estimate of the loss that can occur on a portfolio
based on historical market movements. The value will vary
with the level of confidence chosen, the holding period, the
number of historical data points used, and the way in which
this historical data is included in the calculation. VAR gives
both a monetary risk value and an associated probability of
realising the loss. It is currently considered the best way to
aggregate risk exposures across markets.
VAR is not only useful for estimating potential losses. It is also
used to estimate the efficiency of risk-taking to better allocate
resources. Efficiency is measured by the return on a portfolio
relative to the risk taken. Measures such as incremental VAR
also indicate a trader’s or desk’s contribution to the overall
VAR. Thus VAR allows more informed decision making, more
refined risk limits and better capital allocation.
Details on the nominal value and contractual maturities of
derivative financial instruments and the components of foreign
currency exposure by major currency are provided in the
notes to the Annual Financial Statements.
■ UNDERWRITING RISK MANAGEMENT
Underwriting risk refers to events that result in unpredicted or
unexpected losses. Underwriting risk relates to BoE’s short-
85
R I S K M A N A G E M E N T
term insurance and life assurance activities. Short-term
insurance risk is the risk associated with fixed or moveable
assets,accidents,guarantees and liabilities.Life assurance risk is
the risk associated with insuring the life or health of an
individual or group of individuals.
Risk processes for managing acceptable levels of underwriting
risk include:
■ reviewing underwriting criteria;
■ ensuring that products are priced in accordance with the
underwriting criteria;
■ the extensive use of reinsurance to manage risks within
acceptable norms and BoE’s conservative risk appetite; and
■ a strong emphasis on AIDS.
■ CAPITAL MANAGEMENT
Definition of Capital Management
Capital management requires balancing the desires for
stronger,competitive capital ratios and maintaining high credit
ratings with the need to provide competitive returns to
shareholders.
Capital management includes the management of capital risk,
being the risk that the Group will become unable to absorb
losses, maintain public confidence and support the
competitive growth of the business.This entails ensuring that
opportunities can be acted upon timeously while solvency is
never threatened.
The primary role of the Group Investment Committee is to
manage the investment returns from the capital of the Group
and the Bank in a manner which achieves a consistent and
appropriate yield over a specified period of time (i.e. the
financial year), adopting a conservative risk appetite and
thereby eliminating undue volatility in such returns.
Capital Ratios
Capital adequacy and the use of regulatory capital are
monitored by the Group Finance division, employing
techniques based on guidelines developed by the Basel
Committee on Banking Supervision (“the Basel Committee”) as
implemented by the South African Reserve Bank for
supervisory purposes.
The Basel Committee has issued a proposed new capital
adequacy framework (“Basel II”) in an effort to strengthen
bank regulation in light of recent developments in global
financial markets. Implementation is expected in 2005 and the
proposed regulations would materially improve the risk-
adjustment process for calculating regulatory minimum capital
levels, strengthen regulatory processes, and more effectively
incorporate market discipline into bank monitoring. The
proposed risk-adjustment mechanisms would require more
capital for some riskier exposures and less for lower-risk
business. Thus, they might shift capital from some asset
classes to others and change the capital adequacy ratios at
particular banks.
Presently the primary measures of regulatory capital strength
for South African Banks are the risk-weighted capital adequacy
ratios developed pursuant to the regulations laid down by the
Registrar of Banks.
Consistent with these regulations, total regulatory capital,
which differs from capital recorded on the balance sheet, is
allocated into three tiers.Tier 1 or primary capital comprises
the more permanent form of capital. The components of
Tier 1 and Tier 2 (secondary) capital are shown in tabular form
overleaf. Tier 3 or tertiary capital may only be applied to
trading activities and is not material in amount to the Bank.
Regulatory capital ratios are calculated by dividing Tier 1 and
total capital by risk-weighted assets. Risk-weighted assets are
determined by applying risk weights to balance sheet assets
and off-balance sheet financial instruments according to the
relative credit risk of the counterparty. The risk weighting for
each balance sheet asset and off-balance sheet financial
instrument is regulated by the South African Banks Act.
The Bank’s capital policy is to remain well capitalised so as to
provide a safety net for the variety of risks that the Bank is
exposed to in the conduct of its business.To be classified as

86
R I S K M A N A G E M E N T
well capitalised, international trends indicate that a bank’s
Tier 1 and total capital ratios should approximate 8% and
12% respectively.
The minimum South African total capital adequacy ratio for
banks has been revised with effect from 1 October 2001 up to
10% of risk-weighted assets. BoE Bank’s ratio at 30 September
2001 was 11.2% (2000: 13%). The Bank believes the optimal
capital adequacy ratio to be 11.5% to 12% and is focused on
achieving this.
The capital and reserves of BoE Bank reflect the Group’s
commitment to ensuring that opportunities can be acted upon
timeously while solvency is never threatened.
BoE Bank Credit Ratings
BoE Bank employs international rating agencies FITCH IBCA
and CA-Ratings (an affiliate of Standard & Poor’s) to annually
conduct formal domestic ratings.
The recent annual rating review by FITCH IBCA left the Bank’s
ratings unchanged as follows:
Short term A1; Long term A+
The initial rating by CA-Ratings was as follows:
Short term A1; Long -term A (outlook positive).
Capital Adequacy Ratios Based on Regulatory Capital
BoE Bank BoE Bank
2001 2000
R’m R’m
TIER 1 (PRIMARY) CAPITAL 4 031 4 235
Share capital and share premium 964 813
Reserves at beginning of the year 3 507 2 987
Retained income for the year 83 520
Less: impairments (438) -
Less: allocated to trading activities (85) (85)
TIER 2 (SECONDARY) CAPITAL 1 070 1 044
Compulsory convertible loans and debentures 937 1 038
General provisions 319 297
Less: impairments (186) (291)
TOTAL QUALIFYING CAPITAL 5 101 5 279
TOTAL RISK-WEIGHTED ASSETS 45 379 40 586
% %
Tier 1 (Primary) ratio 8.9 10.4
Tier 2 (Secondary) ratio 2.3 2.6
Total capital adequacy ratio 11.2 13.0

87
R I S K M A N A G E M E N T
■ OPERATIONAL RISK MANAGEMENT
Definitions and Types of Risks
Operational and technological risk is the risk of loss as a result
of error, fraud, systems breakdown or sabotage by internal or
external parties. Technological risk is also a result of an
uncoordinated, inefficient and/or under-resourced technology
strategy which makes an organisation less competitive.
While operational risk can never be fully eliminated, BoE
endeavours to minimise it by ensuring that the appropriate
infrastructure, controls, systems, and trained and competent
people are in place throughout the Group. Segregation of
duties, delegation of authorities, effective training,
performance measurement, communication of risk tolerance,
risk monitoring, financial management and reporting are
amongst the procedures used to manage operational risk.The
Group also possesses significant back-up capabilities within its
disaster recovery planning and business continuity plans to
support business operations in the event of a disaster.
Significant technology risks facing the financial services
industry, of which BoE is no exception, include risks from
E-commerce,high technological dependence and the arrival of
new competitors.
Qualitative risks are those risks that do not readily lend
themselves to measurement or quantitative analysis but could
ultimately result in a loss to BoE through negative reputation,
loss of key personnel,poor ethics and culture.
Two more significant qualitative risks given considerable
attention by BoE are people and reputation.
People risk is defined as possible inadequacies in the
management of our staff. This may stem from lack of adequate
skills or knowledge, lack of clear consequences of not meeting
performance standards, lack of alignment with strategy or a
reward system that fails to motivate properly.
Reputational risk is the risk that an activity by BoE or its
officials will impair its image in the community, resulting in the
loss of business and/or legal action.
Effective management of all the risks addressed in this report
minimises the potential negative impact of reputational risk.
Internal Audit
A comprehensive Group Internal Audit division is in place
together with the Group Operational Risk Management
function to identify and leverage best industry practices in the
identification,assessment and management of operational risk.
Compliance
Group Compliance aims to address and co-ordinate best
practice from both an industry and Group perspective.
Designed as a means of enhancing management control, the
Group Compliance function addresses the pervasive
regulations associated with the financial services industry in
which the Group operates and monitors the specific
regulations and rules necessary for Group compliance.
The major operations are staffed with appropriately qualified
legal professionals in addition to compliance personnel who
report into the Group Compliance Officer. These individuals
retain primary responsibility for management of the Group’s
legal and regulatory compliance risks.
Crime Control And Money Laundering Initiatives
In line with the continuing high level of white collar crime in
South Africa, together with new and pending Money
Laundering legislation, the Group continues to strengthen its
successful Forensic Investigation Department.Other initiatives
include the implementation of a sophisticated fraud hot line,
“Tip Offs Anonymous”.
Group Insurance Programme
BoE maintains a dynamic and comprehensive Group insurance
programme. The day to day responsibility for this rests with
the head of Group Risk Management who reports thereon
to both Group Exco and the Group Audit, Risk and
Compliance Committee.
■ NON-FINANCIAL RISK MANAGEMENT
The draft Code of Corporate Practices and Conduct laid out by
King II emphasises the need for reporting on a group’s “triple
bottom line”. To manage this process and ensure all non-
financial decisions taken are in line with the strategic direction
of the Group, a separate Triple Bottom Line Committee has
been established.
88
D E F I N I T I O N S
AFTER TAX RETURN ON EQUITY
Headline return on equity
Headline earnings as a percentage of average share capital,
share premium and reserves.
CAPITAL ADEQUACY RATIO
The capital adequacy of banks is measured in terms of the
South African Banks Act requirements. The ratio is calculated
by dividing the Tier 1 and Tier 2 capital by the risk-weighted
assets. The minimum South African total capital adequacy ratio
for banks is now 10% of risk-weighted assets.
Tier 1 (Primary) Capital
Primary capital consists of the issued share capital, the retained
earnings and the reserves of the Bank. This amount is then
reduced by the portion of capital that is allocated to trading
activities.
Tier 2 (Secondary) Capital
Secondary capital is made up of the compulsorily convertible
loans, the general bad debt provision and 50% of any
revaluation reserves.
CASH FLOW
Financing activities
Activities which result in changes to the capital structure of
the Group.
Investing activities
Activities relating to the acquisition, holding and disposal of
fixed assets and long-term investments.
Operating activities
Activities that are not financing or investing activities that arise
from the operations conducted by the Group.
COST TO TOTAL INCOME
Operating expenses as a percentage of income from normal
operations.
CROSS HOLDING
The cross holding arises from the fact that various consolidated
entities in the Group hold shares in BoE Ltd. These shares
held and the income accrued therefrom are eliminated
on consolidation. The consolidated entities’ holdings
are eliminated in determining the weighted average number
of shares.
DEFERRED TAXATION ASSETS
Deferred taxation assets are the amounts of income taxes
recoverable in future periods in respect of:
– deductible temporary differences arising due to differences
between the tax and accounting treatment of transactions;
and
– the carry forward of unused tax losses.
DEFERRED TAXATION LIABILITIES
Deferred taxation liabilities are the amounts of income taxes
payable in future periods due to differences between the tax
and accounting treatment of a transaction.
DOUBTFUL DEBTS PROVISIONS
The specific and general provisions for doubtful debts made in
the annual financial statements for the possible losses to be
incurred on advances. It is generally accepted practice in the
financial services industry to refer to these impairment loss
provisions as provisions for doubtful debts.
DIVIDEND COVER
Headline earnings per share divided by dividends per share.
DIVIDEND PER SHARE
Dividend per share is the actual interim dividend paid and the
final dividend declared expressed as cents per share.
DIVIDEND YIELD
Dividend per ordinary share as a percentage of the closing
share price of ordinary shares.
EARNINGS PER SHARE
Basic earnings basis
Net profit less preference dividends (preference dividends
only apply to years up to and including the 1999 year) divided
by the weighted average number of ordinary shares in issue
during the year.

89
D E F I N I T I O N S
Headline earnings basis
Headline earnings divided by the weighted average number of
shares in issue during the year.
Fully diluted basis
Net profit is adjusted for an assumed income that would have
been earned on the issue of shares issued from dilutive
instruments. The resultant earnings are divided by the
weighted average number of shares and other convertible
instruments outstanding at the year end, assuming they had
been in issue for the year.
Fully converted basis
Earnings per share calculated using the weighted average
number of ordinary shares, preference shares and loan stock
units in issue during the year. This basis only applies to years
up to and including the 1999 year, when the Group had more
than one issued listed instrument.
EARNINGS YIELD
Headline earnings per share as a percentage of the closing
price of ordinary shares.
EFFECTIVE TAX RATE, EXCLUDING ASSOCIATE INCOME
AND EXCEPTIONAL ITEMS
The taxation charge in the income statement excluding
taxation relating to exceptional items as a percentage of
headline earnings excluding the share of earnings of
associate companies.
EMPLOYEE BENEFITS
Employee benefits include all forms of consideration given by
the Group in exchange for services rendered by employees.
EXCEPTIONAL ITEMS
Comprise the following:
■ Surpluses and losses on disposal of long term investments,
subsidiaries, joint ventures and associates;
■ Amortisation of goodwill arising on acquisition of
subsidiaries, joint ventures and associates;
■ Litigation settlements;
■ Provisions in respect of:
• surpluses and losses on the sale or termination of an
operation;
• cost of fundamental reorganisation or restructuring having
a material effect on the nature and focus of the reporting
entities operations;
■ Capital payments to the following:
• BoE Educational Foundation,
• BoE Charitable Trust, and
• NBS Centenary Fund; and
■ Other items of a capital nature.
FINANCING COSTS
Interest and other related costs incurred in connection with
the borrowing of funds outside of normal banking activities.
HEADLINE EARNINGS
Headline earnings is a measure of the Group’s trading
performance for the period and not a measure of maintainable
earnings.
For purposes of the definition and calculation, the opinion on
“Headlines Earnings” as issued by the Institute of Investment
Management and Research in the UK has been used.
Headline earnings consist of the earnings attributable to
ordinary shareholders excluding exceptional items.
HEADLINE EARNINGS PER EMPLOYEE
Headline earnings divided by the number of employees in
service at the year end.
INTEREST MARGIN
Net margin expressed as a percentage of average net advances.
Net advances are used as this closely resembles the quantum of
interest-bearing assets that earn income which is included in
net margin.
MARKET PRICE PREMIUM TO NET ASSET VALUE
The extent to which the closing price of ordinary shares
exceeds the net asset value per share (with investments at
market value) expressed as a percentage.
NET ASSET VALUE PER SHARE
Share capital and reserves adjusted by the difference between
the book and market values of investments divided by the
number of shares in issue, less cross holding shares.

90
D E F I N I T I O N S
NON-INTEREST REVENUE TO TOTAL INCOME
Income from normal operations excluding net margin as a
percentage of income from normal operations.
NON-PERFORMING ADVANCES
Advances are classified as non-performing when:
■ categorised as “doubtful” and “loss” per the bank regulatory
credit risk classification system;
■ a counterparty is under judicial management or declared
insolvent;or
■ management is doubtful about the collection of future cash
flows.
NON-PERFORMING LOANS
Non-performing advances excluding properties in possession.
ORDINARY SHAREHOLDERS’ FUNDS
Ordinary share capital, share premium and reserves.
PRICE EARNINGS RATIO
The closing price of ordinary shares divided by headline
earnings per share.
PROPERTIES IN POSSESSION
Properties acquired through payment defaults of a loan
secured by the property.
RISK-WEIGHTED ASSETS
Risk-weighted assets are determined by applying risk weights
to balance sheet assets and off-balance sheet financial
instruments according to the relative credit risk of the
counterparty. The risk weighting for each balance sheet asset
and off-balance sheet financial instrument is regulated by the
South African Banks Act.
RETURN ON TOTAL ASSETS
Headline earnings expressed as a percentage of average
total assets.
RETURN ON RISK-WEIGHTED ASSETS
Headline earnings expressed as a percentage of average risk-
weighted assets.
SEGMENTAL REPORTING
Market Focus Segment
A distinguishable component of the Group based on the
market which each business area focuses on,and that is subject
to risks and returns that are different from those of other
business segments.
Business Activity Segment
A distinguishable component of the Group that provides
related services, and that is subject to risks and returns that are
different from those of other business segments.
Geographical Segment
A distinguishable component of the Group that is engaged in
providing services within a particular economic environment,
and that is subject to risks and returns that are different from
those of components operating in other economic
environments.
TOPLINE REVENUE
Income from normal operations.
TRIPLE BOTTOM LINE
Triple bottom line refers to sustainability in three dimensions:
the economic, environmental, and social aspects of a
company’s activities. This is an approach which has been
brought to the forefront by the second King Report of
Corporate Governance.
TOTAL INCOME
Income from operations.
WEIGHTED AVERAGE NUMBER OF SHARES
The number of shares in issue, assuming full conversion of
preference shares and loan stock units in issue at the beginning
of the year, increased by shares issued during the year,
weighted on a time basis for the period during which they
have participated in the income of the Group, less shares held
by entities in the Group as part of the cross holding, weighted
on a time basis for the period during which the entities held
these shares.

91
G L O S S A R Y O F T E R M S
International (UK or US) equivalent or brief description
Industry segment or Class of business
Tax term equivalent to US tax depreciation allowances
Market value
Fee and commission payables
Fee and commission receivables
Accounts
Capital lease
Ownership with absolute rights in perpetuity
Surplus or profit
Profit
Profit and loss account
Interest payable
Interest receivable
Long-term debt or loan capital
Allotted
Lendings
Book value
Attributable profit
Called-up share capital
Allowances
Profit and loss account reserve
No direct international equivalent. Tax paid on net difference
between dividends received and paid
Ordinary shares, capital stock or common stock issued and
fully paid
Additional paid-up capital or paid-in surplus
Shareholders’ equity
Shares outstanding
Cash
Charge-offs
Term used in this Annual Report
Business segment
Capital allowances
Fair value (if listed security)
Fee and commission expense
Fee and commission income
Financial statements
Finance lease
Freehold
Gain
Income
Income statement
Interest expense
Interest income
Interest-bearing borrowings
Issued
Loans and advances
Net asset value
Net income
Ordinary shares, issued and fully paid
Provisions
Retained earnings
Secondary tax on companies
Share capital
Share premium account
Shareholders’ funds
Shares in issue
Short-term deposits and cash
Write-offs

92
C O R P O R A T E I N F O R M A T I O N
Secretary
John Acutt
BoE,Clock Tower Precinct,V&A Waterfront,Cape Town 8001
PO Box 86,Cape Town 8000
Telephone:+27 (0)21 416 6000
Telefax:+27 (0)21 416 9927
NBS Kingsmead
90 Ordnance Road,Durban 4001
PO Box 1744,Durban 4000
Telephone: +27 (0)31 364 4400
Telefax: +27 (0)31 364 2900
Email: [email protected]
Investor Relations
Don Bowden
Telephone:+27 (0)21 416 6173
Telefax:+27 (0)21 416 9933
Email: [email protected]
Susan Hemp
Telephone:+27 (0)21 416 6177
Telefax:+27 (0)21 416 9933
Email: [email protected]
Company registration number
1987/003281/06
Auditors
Deloitte & Touche
Actuaries
Southern Africa Actuarial Consultants
Bankers
BoE Bank Limited
PO Box 4,Paarl 7622
Telephone: +27 (0)21 807 2911
Sponsoring Brokers
BoE Securities (Pty) Ltd
UBS Warburg Securities (South Africa) (Pty) Ltd
Transfer Secretaries
Mercantile Registrars Limited
11 Diagonal Street, Johannesburg 2001
PO Box 1053, Johannesburg 2000
Telephone: +27 (0)11 370 5000
Telefax: +27 (0)11 370 5485
Designed by
Susan Hemp John Acutt