contents - cgc.gov.au · web viewthe majority of hospital services are provided by large activity...
TRANSCRIPT

2020 REVIEW
HEALTH
STAFF DRAFT ASSESSMENT PAPERCGC 2018-01/12-S
APRIL 2018

Paper issued 20 April 2018
Commission contact officer Fan Xiang, 02 6229 8817, [email protected]
Submissions sought by 31 August 2018
Submissions should be emailed in Word format to [email protected] .
Submissions of more than 10 pages in length should include a summary section.
Confidential material It is the Commission’s normal practice to make State submissions available on its website under the CC BY licence, allowing free use of content by third parties.
Further information on the CC BY licence can be found on the Creative Commons website (http://creativecommons.org).
Confidential material contained in submissions must be clearly identified or included in separate attachment/s, and details provided in the covering email. Identified confidential material will not be published on the

Commission’s website.
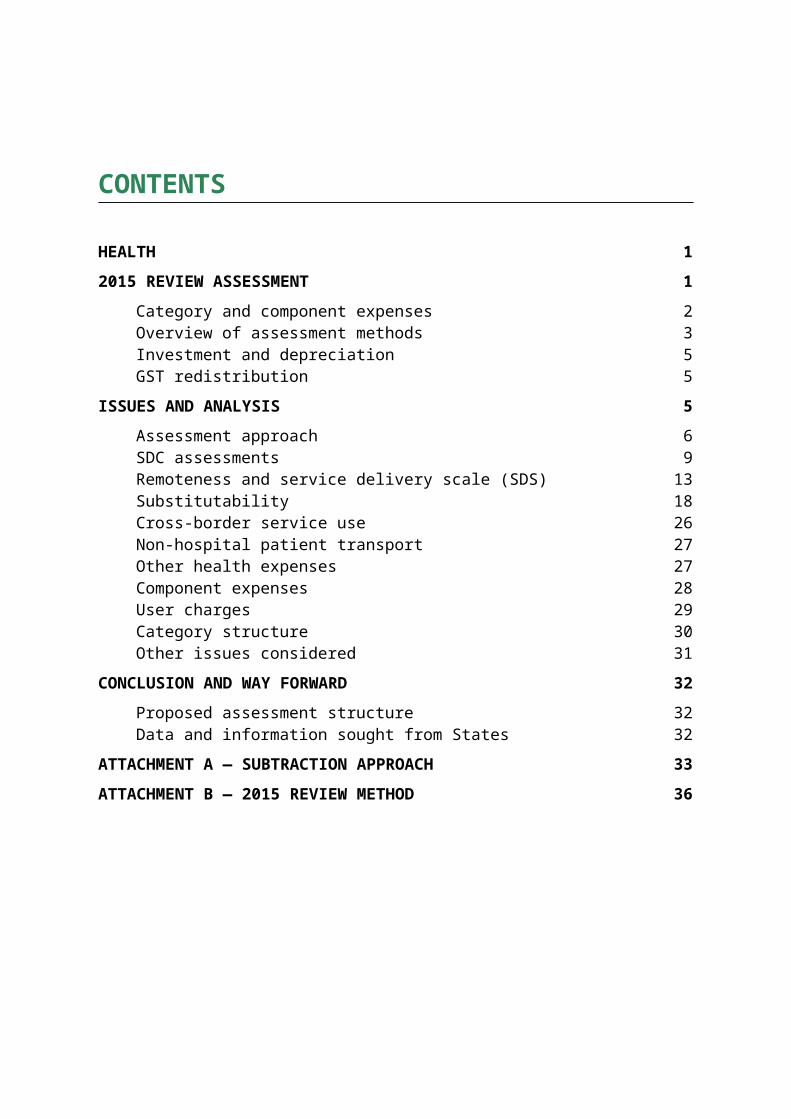
CONTENTS
HEALTH 1
2015 REVIEW ASSESSMENT 1
Category and component expenses 2Overview of assessment methods 3Investment and depreciation 5GST redistribution 5
ISSUES AND ANALYSIS 5
Assessment approach 6SDC assessments 9Remoteness and service delivery scale (SDS) 13Substitutability 18Cross-border service use 26Non-hospital patient transport 27Other health expenses 27Component expenses 28User charges 29Category structure 30Other issues considered 31
CONCLUSION AND WAY FORWARD 32
Proposed assessment structure 32Data and information sought from States 32
ATTACHMENT A — SUBTRACTION APPROACH 33
ATTACHMENT B — 2015 REVIEW METHOD 36
HEALTH
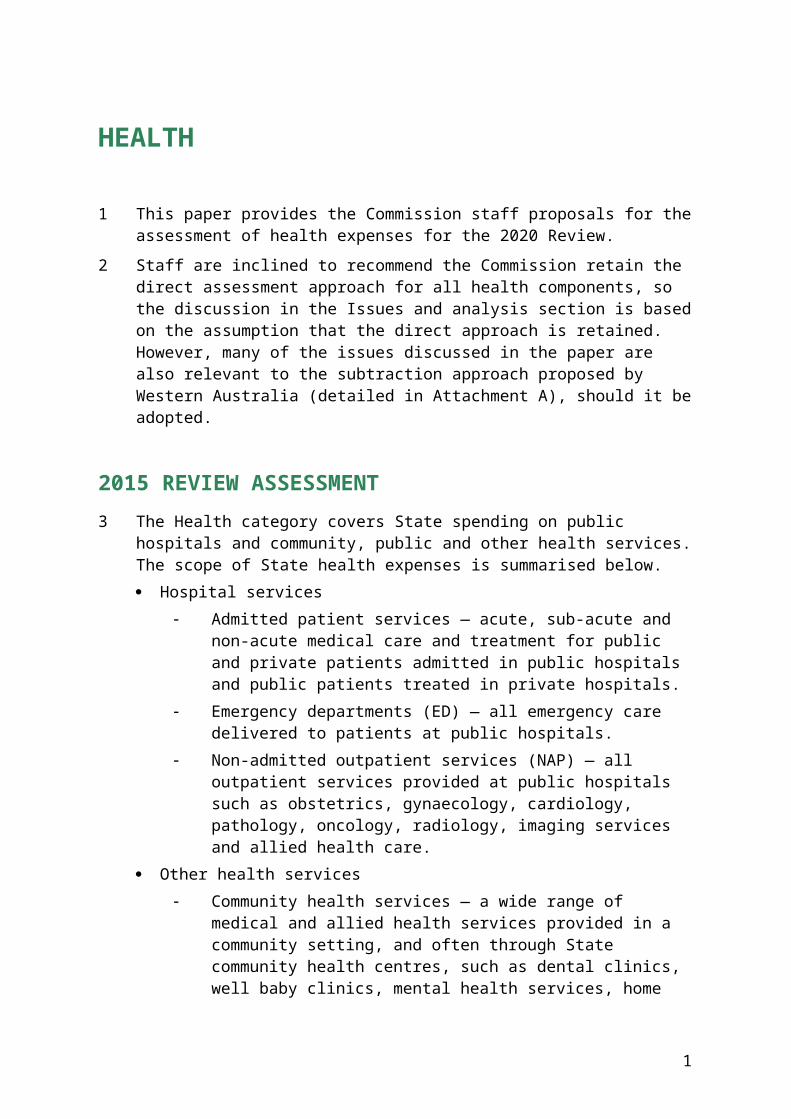
1 This paper provides the Commission staff proposals for the assessment of health expenses for the 2020 Review.
2 Staff are inclined to recommend the Commission retain the direct assessment approach for all health components, so the discussion in the Issues and analysis section is based on the assumption that the direct approach is retained. However, many of the issues discussed in the paper are also relevant to the subtraction approach proposed by Western Australia (detailed in Attachment A), should it be adopted.
2015 REVIEW ASSESSMENT
3 The Health category covers State spending on public hospitals and community, public and other health services. The scope of State health expenses is summarised below. Hospital services
Admitted patient services — acute, sub-acute and non-acute medical care and treatment for public and private patients admitted in public hospitals and public patients treated in private hospitals.
Emergency departments (ED) — all emergency care delivered to patients at public hospitals.
Non-admitted outpatient services (NAP) — all outpatient services provided at public hospitals such as obstetrics, gynaecology, cardiology, pathology, oncology, radiology, imaging services and allied health care.
Other health services Community health services — a wide range of medical and allied health
services provided in a community setting, and often through State community health centres, such as dental clinics, well baby clinics, mental health services, home nursing services, family planning, and alcohol and other drug services.
Public health services — activities for the protection and promotion of health and the prevention of disease, illness or injury. These include organised immunisation, health promotion, screening programs, communicable disease control, and prevention of hazardous and harmful drug use.
Patient transport — land ambulance, aero-medical ambulance services and the reimbursement of costs through Patient Assisted Travel Schemes (PATS).
1
Miscellaneous health services — State provided health services not elsewhere specified including pharmaceuticals, medical aids and appliances, health administration and research.
Category and component expenses4 Table 1 shows health expenses by component in 2016-17. The first three components
cover services which are predominantly provided in a hospital setting — admitted patient, ED and other non-admitted patient services.1 The two remaining components are non-hospital patient transport and community and other health services.2
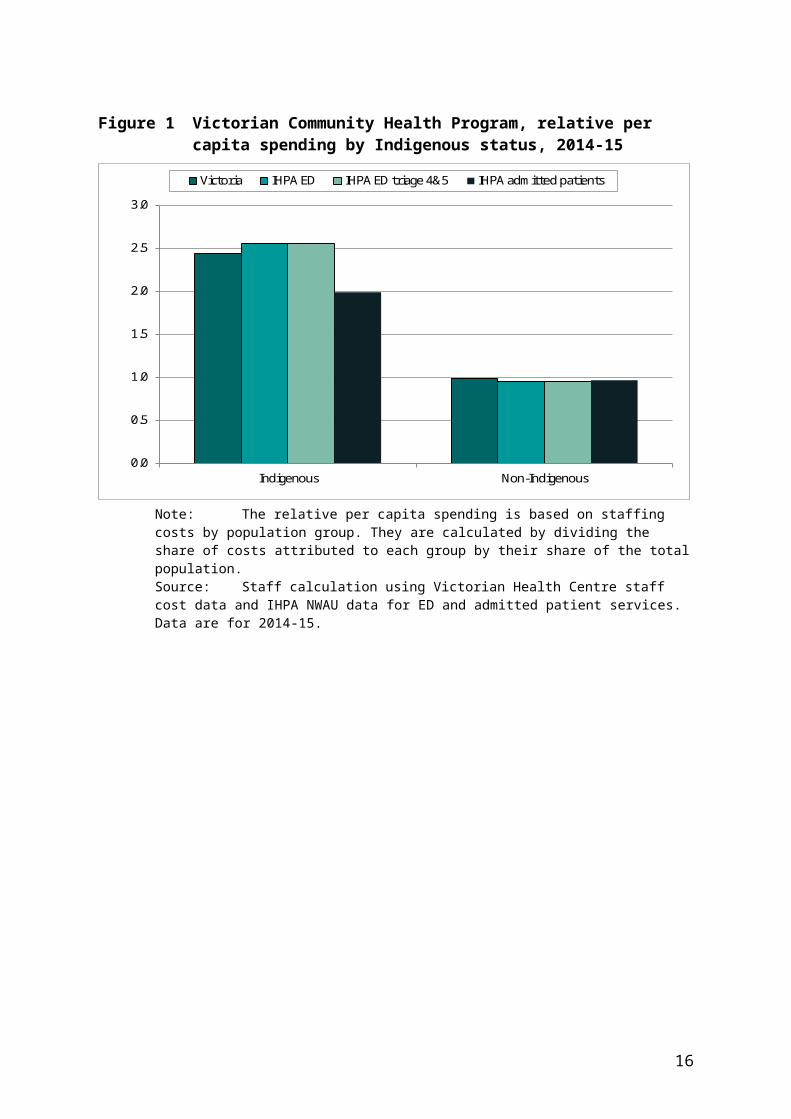
5 All revenues generated from user charges ($7 billion in 2016-17), which mainly comprise private patient hospital fees, are offset against expenses.
6 Health net expenses were $61 billion in 2016-17 or 26% of total State operating expenses. Hospital services, for which admitted patient services is the largest component, were almost 79% of the total. Community and other health expenses accounted for 20%.
Table 1 Health expenses by component, 2016-17
Component Amount (a) Proportion of category expenses
$m %Hospital services
Admitted patients 38 163 62.5Emergency departments (ED) 4 931 8.1Non-admitted patients (NAP) 4 931 8.1
Other health servicesNon-hospital patient transport (b) 589 1.0Community and other health services 12 416 20.3
Total 61 028 100.0(a) Expenses are shown net of user charges. (b) Non-hospital patient transport includes aero-medical ambulance services and the reimbursement of
costs through State PATS. Land ambulance expenses are included in admitted patients.Source: Australian Bureau of Statistics (ABS) Government Finance Statistics (GFS) and State provided data
for the 2018 Update.
1 In this paper, non-admitted patient services other than ED services are referred to as non-admitted patient (NAP) services.
2 The non-hospital patient transport component includes aero-medical ambulance services and the reimbursement of costs through State-funded patient assisted travel schemes (PATS). Land ambulance expenses are included in the admitted patients component because the Commission considers that the disabilities that influence these expenses are similar to the disabilities that influence hospital based services.
2

Overview of assessment methods7 The assessments for hospital services and community and other health services
include three main disabilities. A socio-demographic composition (SDC) disability which recognises there are
differences in the use and cost of services for different population groups and locations. For example, it is well documented that older people, Indigenous people, people from low socio-economic backgrounds and those living in regional areas use State health services more intensively. In addition, Indigenous people and people living in regional areas are more costly when they access health services. The full SDC breakdown for the hospital and community health assessments is shown in Table 2.
A non-State sector disability which recognises that the availability of State-like services from non-State health providers3 in each State influences the level of State spending. The proportion of State spending which the Commission considers is affected by the availability of State-like services is shown in Table 3.
A wage costs disability which recognises that State costs are affected by differences in wage costs between States.4
Table 2 Socio-demographic breakdown for the health assessments, 2015 Review
Indigenous status IRSEO/NISEIFA Remoteness Age
Indigenous Bottom quintile Major cities 0 to 14Non-Indigenous Middle 3 quintiles Inner regional 15 to 44
Top quintile Outer regional 45 to 64Remote and very remote 65 to 74
75+Note: There are 100 cross-classified population groups. Due to data unreliability, remote areas are not
disaggregated by IRSEO/NISEIFA.Source: Report on GST Revenue Sharing Relativities, 2015 Review, Volume 2, page 183.
Table 3 Substitutable expense, 2016-17
Component Component expense 2016-17
Proportion of substitutable services
Substitutable expense 2016-17
$m % $mAdmitted patients 38 163 15 5 724Emergency departments 4 931 15 740Non-admitted patients 4 931 40 1 972Community and other health 12 416 70 8 691
Source: Based on Commission judgements from the 2015 Review and 2016-17 health expenses.
8 In addition, the community and other health services component includes a cross-border disability which recognises that the ACT faces higher costs because it
3 Hereafter referred to as ‘State-like services’.4 Regional costs are picked up in the SDC disability.
3

provides a range of community and public health services to New South Wales residents.5
9 The non-hospital patient transport assessment recognises that aero-medical and PATS services are used disproportionately by people in remote and very remote regions. Since the disabilities which affect these services differ from those for other health services, the expenses are assessed in a separate component.
Data sources10 The main data sources for each component are summarised in Table 4. Data for the
SDC assessments are sourced from the Independent Hospital Pricing Authority (IHPA). At the time of the 2015 Review, there were no reliable data for estimating the national cost weighted use of NAP or community and other health services. Consequently the SDC assessments for these components are based on proxy indicators which are listed in Table 4.
Table 4 Main data sources for the health assessment, 2015 Review
Component SDC assessment Non-State sector indicatorAdmitted patients Admitted patient NWAU data (IHPA) Private admitted patient separations
(AIHW and APRA)Emergency departments ED NWAU data (IHPA) Bulk-billed GP benefits (MBS)Non-admitted patients Admitted patient separations data
(IHPA)Bulk-billed specialist, pathology and
imaging benefits (MBS)Community and other
healthED triage 4 & 5 NWAU data (IHPA) Bulk-bulled GP benefits (MBS)
Indigenous Australians’ Health Program (IAHP) Grants
Non-hospital patient transport
State data on expenses by remoteness area
Note: An NWAU or national weighted activity unit is a measure of hospital service activity expressed as a common unit. In 2017-18, one NWAU was $4 910. The NWAU value for each episode of service is based on the patient’s characteristics and services provided. An episode may be costed as a fraction of an NWAU or a multiple of an NWAU.
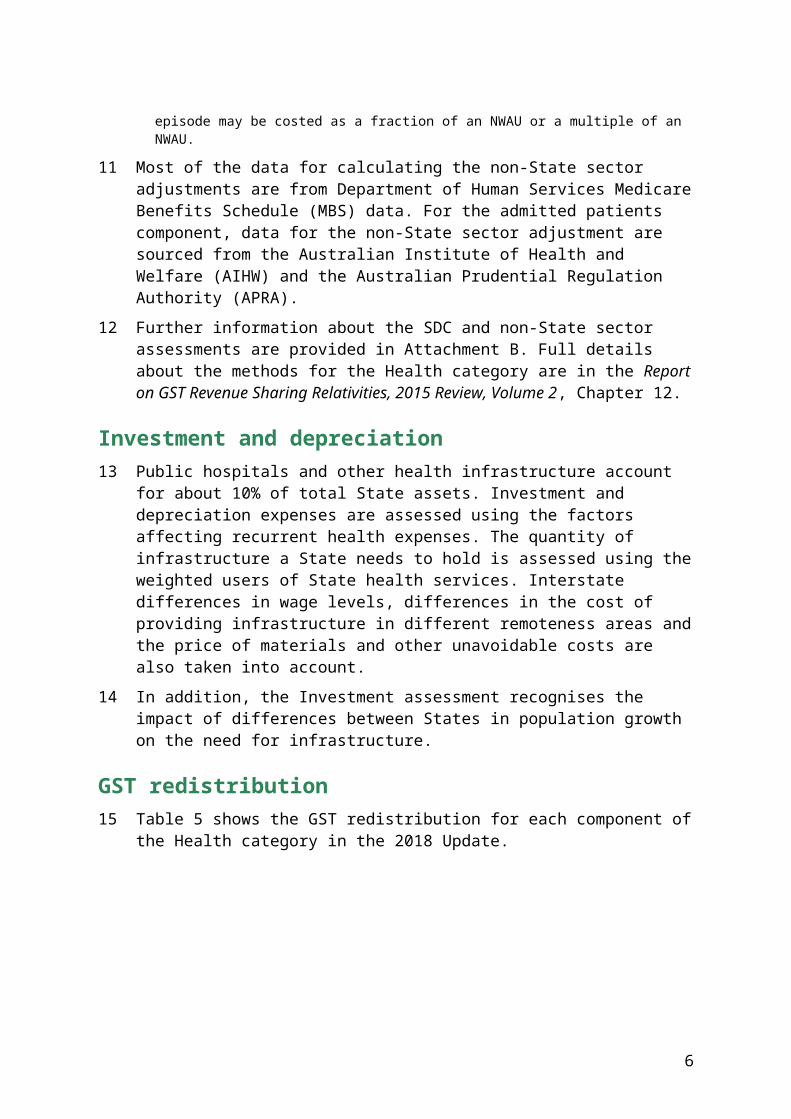
11 Most of the data for calculating the non-State sector adjustments are from Department of Human Services Medicare Benefits Schedule (MBS) data. For the admitted patients component, data for the non-State sector adjustment are sourced from the Australian Institute of Health and Welfare (AIHW) and the Australian Prudential Regulation Authority (APRA).
12 Further information about the SDC and non-State sector assessments are provided in Attachment B. Full details about the methods for the Health category are in the Report on GST Revenue Sharing Relativities, 2015 Review, Volume 2, Chapter 12.
5 Cross-border hospital costs are addressed through a bilateral arrangement between New South Wales and the ACT, and a cross-border adjustment to the Commonwealth contribution to State hospital expenses through National Health Reform funding.
4

Investment and depreciation13 Public hospitals and other health infrastructure account for about 10% of total State
assets. Investment and depreciation expenses are assessed using the factors affecting recurrent health expenses. The quantity of infrastructure a State needs to hold is assessed using the weighted users of State health services. Interstate differences in wage levels, differences in the cost of providing infrastructure in different remoteness areas and the price of materials and other unavoidable costs are also taken into account.
14 In addition, the Investment assessment recognises the impact of differences between States in population growth on the need for infrastructure.
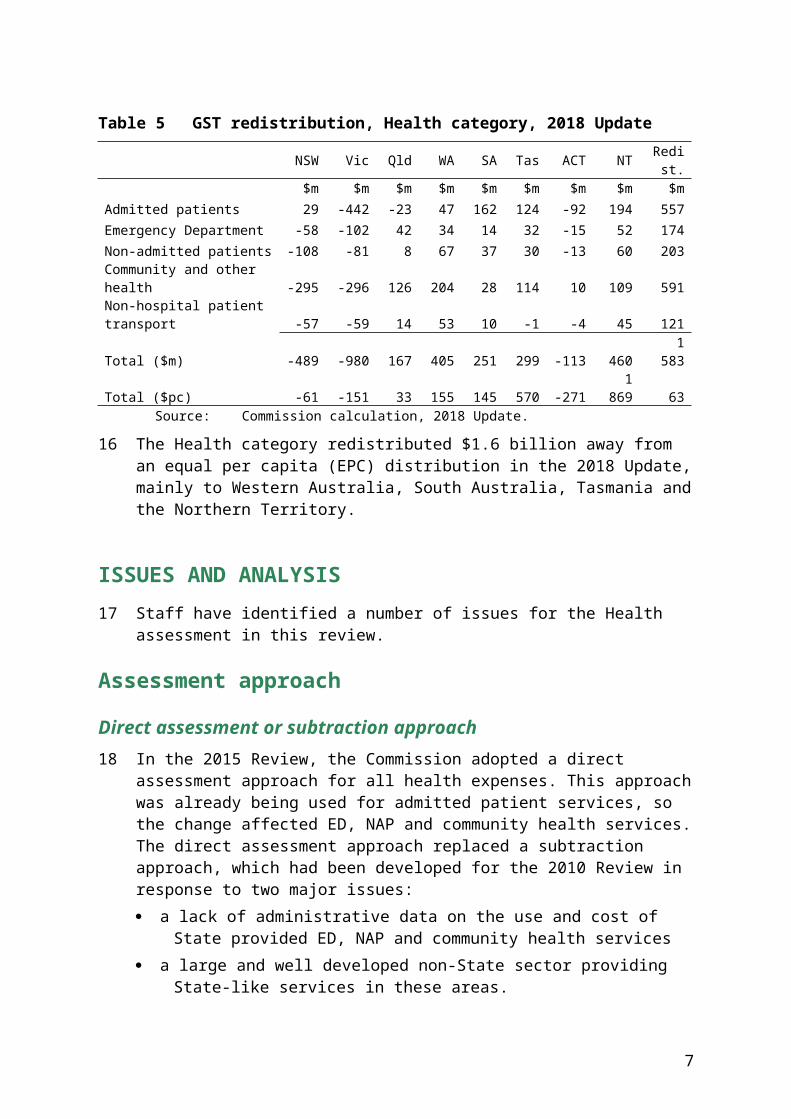
GST redistribution15 Table 5 shows the GST redistribution for each component of the Health category in
the 2018 Update.
Table 5 GST redistribution, Health category, 2018 Update
NSW Vic Qld WA SA Tas ACT NT Redist.
$m $m $m $m $m $m $m $m $mAdmitted patients 29 -442 -23 47 162 124 -92 194 557Emergency Department -58 -102 42 34 14 32 -15 52 174Non-admitted patients -108 -81 8 67 37 30 -13 60 203Community and other health -295 -296 126 204 28 114 10 109 591Non-hospital patient transport -57 -59 14 53 10 -1 -4 45 121Total ($m) -489 -980 167 405 251 299 -113 460 1 583Total ($pc) -61 -151 33 155 145 570 -271 1 869 63
Source: Commission calculation, 2018 Update.
16 The Health category redistributed $1.6 billion away from an equal per capita (EPC) distribution in the 2018 Update, mainly to Western Australia, South Australia, Tasmania and the Northern Territory.
ISSUES AND ANALYSIS
17 Staff have identified a number of issues for the Health assessment in this review.
Assessment approach
Direct assessment or subtraction approach18 In the 2015 Review, the Commission adopted a direct assessment approach for all
health expenses. This approach was already being used for admitted patient services,
5

so the change affected ED, NAP and community health services. The direct assessment approach replaced a subtraction approach, which had been developed for the 2010 Review in response to two major issues: a lack of administrative data on the use and cost of State provided ED, NAP and
community health services a large and well developed non-State sector providing State-like services in these
areas.
19 The decision in the 2015 Review to move to a direct assessment was based on the Commission’s experience with the subtraction approach and changes to the availability of data on State provided hospital services. The interactions between ED, NAP and community health services made it more difficult to develop a community health assessment using the subtraction approach. However, the main considerations in moving to a direct assessment were changes to the availability of data arising from national health reform and a lack of reliable data for assessing total expenditure on State and State-like services.
20 Under a direct assessment approach, the influence of the non-State sector is recognised in two ways. The SDC assessment recognises that there are lower levels of State-like service
provision with increasing remoteness, which leads to an increase in use of similar State services. This higher use can be observed in the national cost data for State provided services.
The calculation of a non-State sector adjustment reflecting different levels of State-like service provision in similar regions between States. The scale of these adjustments is based on the proportion of State spending affected by State-like service provision.6
21 In contrast, the 2010 Review subtraction approach looked at total expenditure on State and State-like services, which was assessed based on estimated national usage patterns and reflecting the SDC of State populations. Spending by the private and Commonwealth sectors on State-like services in each State was then deducted to derive a residual amount representing the spending requirement for each State. The subtraction approach assumed that State and State-like services are fully substitutable.
22 Although a subtraction approach was considered conceptually sound and simple to understand, in practice it required judgements about the scope of State-like services, that is, non-State services considered substitutable for State provided services. In addition, finding reliable and comparable data to build the SDC calculation proved difficult, thereby necessitating additional judgements in developing the assessment for total health expenditure. Data problems were exposed over time as the
6 Also referred to as substitutable services.
6
assessment was updated. The Commission’s main concerns with the 2010 Review subtraction approach are summarised in Attachment A.
23 Therefore, in the 2015 Review, the Commission adopted a direct assessment approach for all Health components. The Commission concluded that the direct approach was not perfect but it represented an improvement over the subtraction approach.
State views on the subtraction approach and staff analysis24 In the 2015 Review, most States agreed with the direct assessment approach,
although there were different views about the proportion of State services affected by the non-State sector. However, Western Australia remained of the view that a subtraction approach would better reflect the higher demands on it due to its relatively low level of non-State services.
25 At an Officer Working Party (OWP) meeting in April 2017, Western Australia agreed to develop a subtraction approach to measure assessed ED, NAP, community and other health expenses, to allow the Commission to evaluate the two options for assessing health services. Western Australia circulated a draft paper titled Non-State Services in the Health Category to the OWP in February 2018 and invited comments from Commission staff and the States.
26 In the paper, Western Australia argues the influence of the non-State sector on State spending is not correctly measured in the direct approach. It States that: the only realistic way to recognise non-State influences is from a long-run
perspective the long-run substitutability between non-State and State services can be
presumed to be 100%, at least at the level of outcomes the scope of substitutable activity is broad and should include all medically
necessary non-State services HFE should equalise States’ capacities to achieve health outcomes for people in
like circumstances, regardless of who is providing the service HFE should take into account non-State sector activities that States have a policy
interest in seeing provided, where these activities may differentially impact on States’ capacity to achieve desired health outcomes.
27 While conceding a number of Western Australia’s arguments, there are three main points on which staff have different views.
28 First, the Commission equalises State budgets; equalising community outcomes as proposed by Western Australia is beyond the scope of HFE. Staff consider the scale of the non-State sector assessment should be directly linked to what States spend on health services. In other assessments, disabilities are scaled or weighted according to what States spend. Therefore, to be consistent with the Commission’s objective and
7
supporting principles, the scale of needs must relate to the level of State spending, and not to total community spending on all medically necessary services regardless of the sector providing the services.
29 Second, Western Australia considers that substitutability should be viewed very broadly, by including all medically necessary services regardless of the sector providing the services. Staff consider the range of services which are substitutable is much narrower than suggested by Western Australia.
30 To understand how the substitutability of services is considered, it is helpful to consider dental services as an example. Although it is understood that poor dental health is a contributor to serious health problems, it is not State policy (or Commonwealth policy) to provide universal dental care. Instead what States do is provide public dental services to about one third of the population comprising children and disadvantaged adults. For most adults accessing public dental services there is no non-State alternative other than dental work that is funded by the MBS. Staff consider that the main factors affecting State dental expenditure are State spending decisions and the SDC of the population who use public dental services. The size of the non-State sector is not considered a significant driver of State spending. This is because the availability of private dental services, largely targeting middle to high socio-economic status (SES) groups, is not likely to have much, if any, impact on the demand for State dental services. Under these circumstances, most private dental services would not be considered substitutable. Staff do not consider that expanding the Health assessment to recognise differences across States in expenditure on private dental services would lead to a better equalisation outcome. The difference in the scale of needs for dental services derived under each approach is directly related to the definition of what constitutes a State-like service.
31 Dental services are an example where adopting a broad view of what constitutes a State-like service could lead to an error in the subtraction approach. It also illustrates the need to carefully consider, on a case-by-case basis, what are State-like services. This includes considering any income constraints which prevent people from accessing non-State services, and any restrictions on access to State services. Staff consider that these matters are highly relevant to HFE and for identifying substitutable services.
32 Finally, apart from these conceptual differences, Western Australia has not yet demonstrated the practicality of implementing a subtraction approach using available data. Only after this is done would staff be able to evaluate the range of judgements required to implement a reliable subtraction model. Experience from the 2010 Review shows that many judgements are required to build an assessment of total expenditure on State and State-like services.
33 In conclusion, staff have not been persuaded that a better equalisation outcome would be achieved by using a subtraction approach with the scope of State-like
8
services and substitutability being viewed broadly, or that scaling should be applied to the outcomes of the direct assessment. The key area of difference between the two approaches is the extent to which State and non-State services are considered substitutable. Since reliable data for directly assessing State spending on health services are available, staff are not inclined to recommend that the Commission revert to a subtraction approach.
34 Staff note that Tasmania and the ACT have responded to Western Australia’s paper. Both support retaining a direct approach on conceptual and data grounds. Staff intend to discuss this issue with all the States at an OWP meeting in May 2018 and will provide Western Australia with more detailed comments on its paper prior to that meeting. It remains open to Western Australia and other States putting forward further arguments on the merits of the Commission adopting a subtraction method as an alternative to the direct method for the Health assessment.
Staff propose to recommend that the Commission: consider retaining the direct approach to assess all components of health
expenses in the 2020 Review rather than reverting to a subtraction approach because the direct approach utilises reliable data to directly assess State health spending and focuses on what States do while appropriately recognising the influence of the non-State sector
not scale the outcomes of the direct assessment method based on a very broad interpretation of what constitutes State-like services.
SDC assessments35 Staff are considering whether the main data sources for assessing State spending on
NAP and community health services should be changed. The SDC assessments for these components currently use proxy indicators to assess spending on different population groups.
Non-admitted patient services36 In the 2015 Review, the Commission decided not to use IHPA’s NAP data for the SDC
assessment of NAP expenses because the data were not considered sufficiently reliable. Admitted patient separations data were used as a proxy indicator.
37 Improvements in the coverage and quality of IHPA’s NAP data are ongoing but staff anticipate the data will be reliable enough to use in the 2020 Review. Staff consider it is preferable to use NAP NWAU data instead of admitted patient separations because it will better reflect the material factors which influence State spending on these services. Staff invite State comments on the coverage and reliability of NAP data
9

provided to IHPA through the National Hospital Cost Data Collection (NHCDC) and NAP activity collections.
38 If the Commission decides to use NAP NWAU data in the 2020 Review, it could consider assessing hospital services in one component using aggregate NWAU data for all hospital services (see paragraph112).
Staff propose to recommend the Commission: continue to use IHPA’s NWAU data for the SDC assessments of admitted and ED
services because the data provide a reliable basis for measuring the material factors which influence State spending on these services
use IHPA’s NAP NWAU data for the SDC assessment of NAP expenses instead of admitted patient separations because the data should be sufficiently reliable by the 2020 Review and it will provide a better measure of the material factors which influence State spending on NAP services.
Community and other health services7
39 In the 2015 Review, the Commission tried to identify a national dataset on the cost weighted use of State-provided community health services but found that data were only available for selected services (for example, cancer screening) which would not reflect the use of all State-provided services. After considering the options the Commission decided to base the SDC assessment for community health services on IHPA’s ED triage 4 and 5 NWAU data.
40 There are still no national datasets for measuring the cost weighted use of community health services. However, we are aware that some States (for example, New South Wales, Victoria and the Northern Territory) have activity data for their community health centres. Victoria has supplied data for Community Health Program (CHP) services provided through its community health centres.
41 Preliminary analysis of Victorian CHP cost data indicates that the population groups which are high cost for hospital services are also high cost for CHP services. Figure 1, Figure 2 and Figure 3 show use rates for CHP services compared to national ED and admitted patient services.8
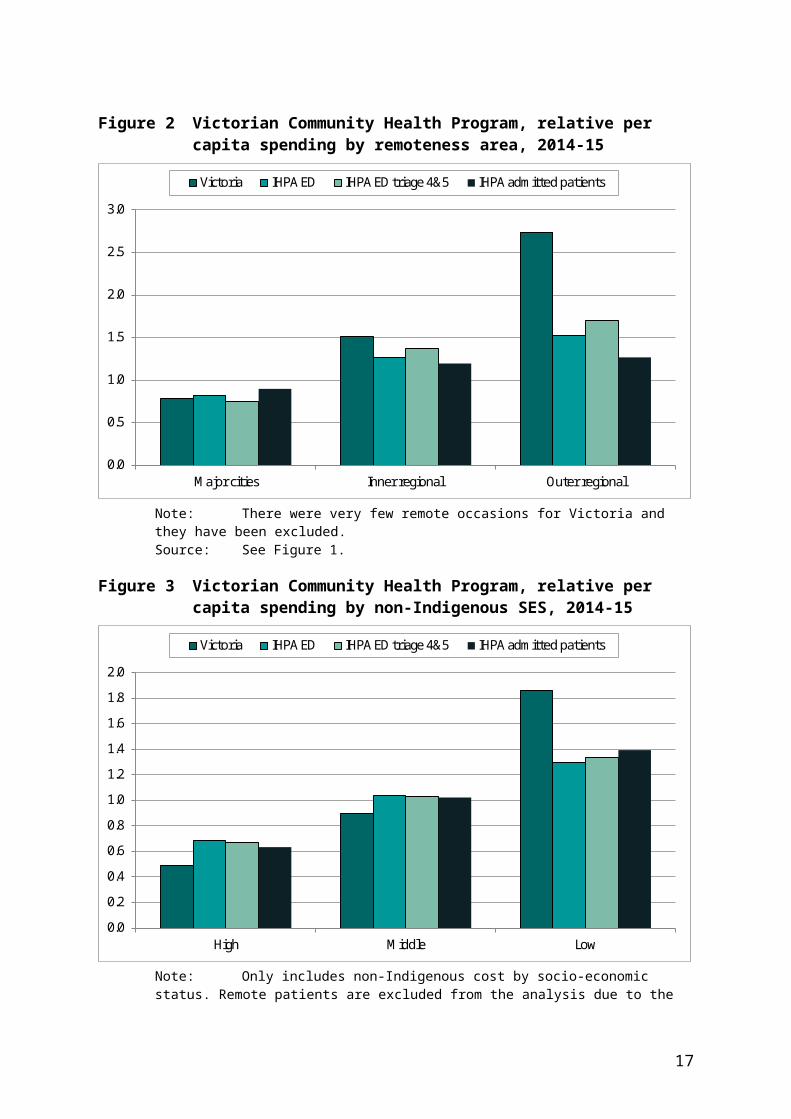
42 The figures indicate that, similar to hospital services, Victoria spends twice as much per capita on CHP services for Indigenous people compared to non-Indigenous people, but the relative per capita spending on CHP services for people from low SES and more remote areas are higher than hospital services. This is probably because CHP services tend to target vulnerable population groups including Indigenous
7 Hereafter referred to simply as ‘community health services’.8 The cost weighted use rates are calculated by dividing the share of costs for each population groups by
the share of population in each group.
10

people, people with an intellectual disability, refugees and people seeking asylum, people experiencing homelessness, people with serious mental illness and children in out-of-home care. The higher relative per capita spending on CHP services for people in regional areas is probably the result of fewer non-State alternatives such as GPs or public hospitals in these locations.
43 Some caution is needed in drawing conclusions from the analysis of Victorian CHP data. As noted, the services covered by the Victorian dataset are a subset of the services provided by Victorian community health centres. It is also much narrower in scope than the community health component. For example, the Victorian dataset does not include dental services, drug programs or public health services such as breast screening and immunisation programs. It could be expected that if data were available for the full range of services, the differences between the community health service data and national hospital data would not be as significant.
44 Staff would like to know if other States are able to provide similar data to Victoria. We know that New South Wales Health and the Northern Territory have similar data which we have already requested. It might be possible to use data from representative States to build a national usage profile for community health services. If this is not possible, the Commission will have to continue to use a proxy indicator for the community health SDC assessment. Hospital data, including subsets of ED and non-admitted patient data, are likely to remain the best way forward.
Figure 1 Victorian Community Health Program, relative per capita spending by Indigenous status, 2014-15
0.0
0.5
1.0
1.5
2.0
2.5
3.0
Indigenous Non-Indigenous
Victoria IHPA ED IHPA ED triage 4&5 IHPA admitted patients
Note: The relative per capita spending is based on staffing costs by population group. They are calculated by dividing the share of costs attributed to each group by their share of the total population.
11
Source: Staff calculation using Victorian Health Centre staff cost data and IHPA NWAU data for ED and admitted patient services. Data are for 2014-15.
Figure 2 Victorian Community Health Program, relative per capita spending by remoteness area, 2014-15
0.0
0.5
1.0
1.5
2.0
2.5
3.0
Major cities Inner regional Outer regional
Victoria IHPA ED IHPA ED triage 4&5 IHPA admitted patients
Note: There were very few remote occasions for Victoria and they have been excluded.Source: See Figure 1.
Figure 3 Victorian Community Health Program, relative per capita spending by non-Indigenous SES, 2014-15
0.0
0.2
0.4
0.6
0.8
1.0
1.2
1.4
1.6
1.8
2.0
High Middle Low
Victoria IHPA ED IHPA ED triage 4&5 IHPA admitted patients
12

Note: Only includes non-Indigenous cost by socio-economic status. Remote patients are excluded from the analysis due to the low number of occasions. SES classification is based on non-Indigenous socio-economic index of areas (NISEIFA).
Source: See Figure 1.
Staff propose to recommend the Commission: investigate whether sufficiently comparable and reliable administrative data on
community health services are available from States to build a national SDC profile for community health services
in the absence of suitable data, staff will consider whether ED triage category 4 and 5 remain the best proxy for measuring the SDC disability for community health services.
Remoteness and service delivery scale (SDS)45 Hospital and patient remoteness, and hospital size affect State spending on health
services. The Commission relies on IHPA to measure how these factors influence State costs. An issue staff have identified for the review is whether the way in which we are using IHPA data is capturing all remoteness and SDS costs.
46 The National Health Reform Agreement (NHRA) gives IHPA the role of determining adjustments to the national efficient price (NEP) and national efficient cost (NEC) for activity based funding (ABF) and block funded hospitals respectively. 9 The NHRA states that the NEP and NEC should reflect legitimate and unavoidable variations in the costs of delivering health care services. These include: hospital type and size hospital location, including regional and remote status patient complexity, including Indigenous status.10
47 For the most part, staff consider that patient remoteness costs are being measured by IHPA and reflected in the NWAU data. We note that IHPA continues to work with State health authorities and other stakeholders to improve its measurement of remoteness costs.
48 Although staff are generally satisfied with the quality and fitness for purpose of the NWAU data, there are two issues we intend to investigate as part of this review. Whether remoteness and SDS costs for small block funded hospitals, which are
reflected in the NEC funding model, are being fully reflected in the assessment. Whether remoteness and SDS costs are being adequately recognised in the
community health assessment.9 There are different types of funding arrangements for different types of hospitals. The majority of
hospital services are provided by large activity based funding (ABF) hospitals. There are almost 400 small, mostly regional hospitals, which receive block funding. Funding for ABF hospitals is based on the NEP and funding for block funded hospitals is based on the NEC.
10 National Health Reform Agreement, clause B13.
13

49 We also note there have been changes to IHPA’s loadings for remote hospitals and patients in the latest NEP specification which will affect the NWAU data for ABF and block funded hospitals from 2018-19.
50 NWAU data. The NEP specification for 2018-19 includes a number of changes to the remoteness loadings, or adjustments. These affect admitted patient and ED NWAU data for ABF and block funded hospitals.
51 A new adjustment in relation to the location of the hospital where the treatment is provided has been introduced for acute admitted patient services (8% for hospitals in remote areas; 12% for hospitals in very remote areas).11 This adjustment is multiplicative to the patient remoteness adjustment, and recognises the higher cost of hospitals located in remote and very remote areas. These loadings will be included in NWAU calculations from 2018-19, and will affect the NWAU data for admitted patients.
52 In the 2018-19 NEP specification, an adjustment for patient remoteness has been introduced for ED services for the first time (22% for patients from remote and very remote areas). It recognises the higher costs incurred for treating ED patients from remote and very remote areas. Similar to the admitted patient loadings, these loadings will be included in the NWAU calculations from 2018-19 and will affect the Commission’s ED assessment from the 2020 Review.
53 Block funded hospitals. Since the 2015 Review, staff have become aware that the NWAU data for block funded hospitals may not reflect all the remoteness and SDS costs IHPA measures for these hospitals.
54 Each year, IHPA estimates the NEC for block funded hospitals which represents the average cost of block funded hospitals across Australia. The NEC is estimated to be $5.171 million in 2018-19. The estimated cost for each of the 400 or so hospital is based on the NEC, adjusted to reflect hospital size, location and the type of services available. The hospital grouping variables for the most recent cost determination are set out below: size groups based on an estimate of total NWAUs for the hospital (eight in total) locality groups
region 1: inner regional, outer regional, remote region 2: very remote
three hospital types type A: hospitals with more than 30 NWAUs of either surgical or obstetric
episodes
11 Note there are two separate loadings or adjustments for admitted patients. One relates to hospital remoteness and the other to patient remoteness.
14
type B: hospitals not in type A that have more than 40% of their total NWAU as admitted activity
type C: other hospitals in region 1, but not in types A or B.
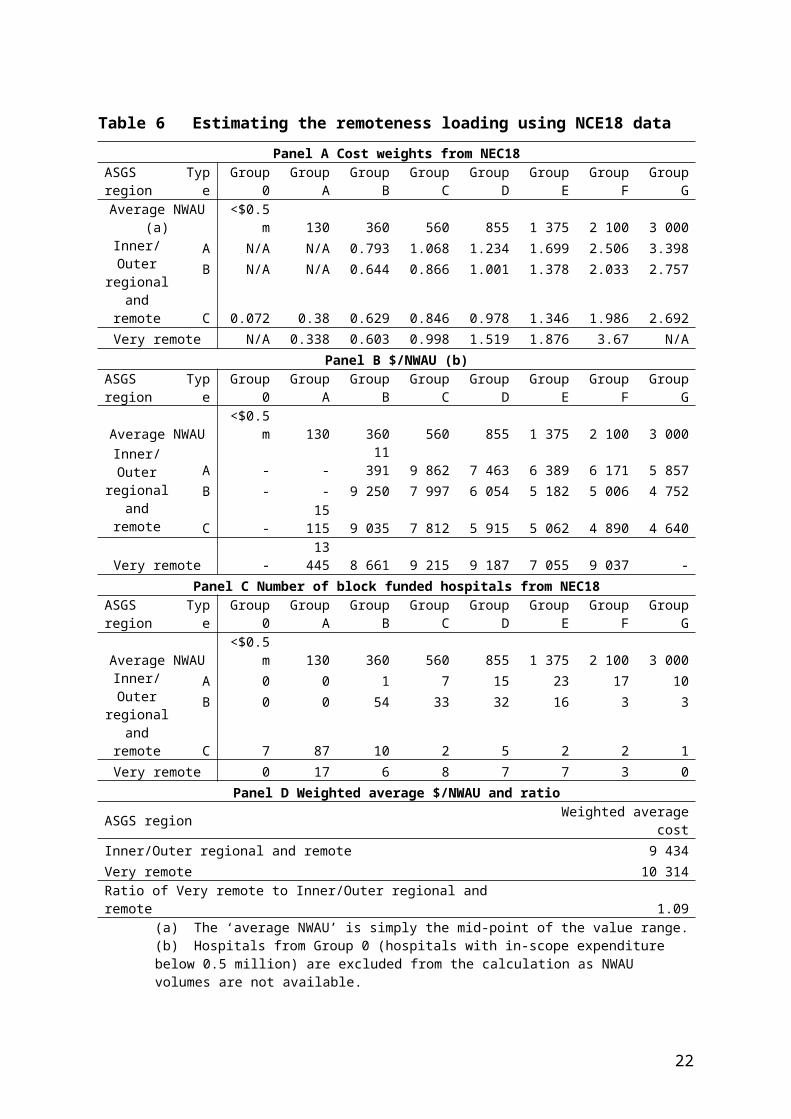
55 Panel A of Table 6 shows the cost weights for each hospital grouping. The estimated cost for hospitals in each group is determined by multiplying the cost weight of the hospital by the NEC.
56 Panel B of Table 6 is a staff calculation which uses the NEC for block funded hospitals in 2018-19 and the average number NWAUs for each volume grouping to calculate the average value of an activity unit for different types of hospitals. From the table we can observe the following. For all volume groupings except Groups B and C, very remote hospitals are
generally more costly than inner/outer regional and remote hospitals. For a given type of hospital, the cost per activity unit is higher for hospitals with
low volumes of activity. As an exception, large (Group F) very remote hospitals are more costly than some of the smaller very remote hospitals. This is likely due to differences between hospitals in case mix.
57 This basic analysis of modelled costs for block funded hospitals illustrates how costs vary with hospital remoteness area and size. These incremental costs are in addition to the patient remoteness costs reflected in the NWAU data for block funded hospitals.
58 Using the average value per NWAU and number of hospitals in each volume grouping, the weighted average cost for hospitals in very remote areas is 1.1 times that of hospitals in inner, outer regional and remote areas (Table 6, Panel D). This ratio gives an indication of the additional cost for very remote hospitals that at face value is not being captured. However, caution is needed when interpreting this ratio as it is heavily influenced by NWAU data from very small block funded hospitals where the NWAUs are less reliable.
59 As part of the 2020 Review work program, staff will consult with IHPA and the States to ensure the final assessment is recognising all, but not double counting any, remoteness and SDS costs for block funded hospitals. Under either a direct or subtraction approach, it is important to ensure all remoteness and SDS costs are appropriately captured in the SDC assessments. This should lead to more reliable estimates of the higher use and cost services in regional areas where the non-State sector is less active.
15

Table 6 Estimating the remoteness loading using NCE18 data
Panel A Cost weights from NEC18ASGS region Type Group 0 Group A Group B Group C Group D Group E Group F Group G
Average NWAU (a) <$0.5m 130 360 560 855 1 375 2 100 3 000Inner/Outer
regional and remote
A N/A N/A 0.793 1.068 1.234 1.699 2.506 3.398B N/A N/A 0.644 0.866 1.001 1.378 2.033 2.757
C 0.072 0.38 0.629 0.846 0.978 1.346 1.986 2.692Very remote N/A 0.338 0.603 0.998 1.519 1.876 3.67 N/A
Panel B $/NWAU (b)ASGS region Type Group 0 Group A Group B Group C Group D Group E Group F Group G
Average NWAU <$0.5m 130 360 560 855 1 375 2 100 3 000Inner/Outer
regional and remote
A - - 11 391 9 862 7 463 6 389 6 171 5 857B - - 9 250 7 997 6 054 5 182 5 006 4 752
C - 15 115 9 035 7 812 5 915 5 062 4 890 4 640Very remote - 13 445 8 661 9 215 9 187 7 055 9 037 -
Panel C Number of block funded hospitals from NEC18ASGS region Type Group 0 Group A Group B Group C Group D Group E Group F Group G
Average NWAU <$0.5m 130 360 560 855 1 375 2 100 3 000Inner/Outer
regional and remote
A 0 0 1 7 15 23 17 10B 0 0 54 33 32 16 3 3
C 7 87 10 2 5 2 2 1Very remote 0 17 6 8 7 7 3 0
Panel D Weighted average $/NWAU and ratioASGS region Weighted average cost
Inner/Outer regional and remote 9 434Very remote 10 314Ratio of Very remote to Inner/Outer regional and remote 1.09
(a) The ‘average NWAU’ is simply the mid-point of the value range.(b) Hospitals from Group 0 (hospitals with in-scope expenditure below 0.5 million) are excluded from the
calculation as NWAU volumes are not available.Source: Staff calculation using IHPA National Efficient Cost Determination 2018-19, Table 1 and National
Pricing Model Technical Specification 2018-19, Table 20.
60 Remoteness and SDS in community and other health services. The community health component currently uses ED triage 4 and 5 NWAU data for its SDC assessment. Any cost adjustments included in the NWAU data for ED services are picked up in the community health assessment.
61 Staff are still considering which data will be most appropriate for the community health SDC assessment in the 2020 Review. However, if the Commission continues using IHPA’s ED data, it will need to ensure that the remoteness and SDS costs are fully recognised in the community health assessment.
16
62 Disaggregation of remoteness areas in the SDC assessments. The SDC assessments for all components of the Health assessment (except patient transport) are currently disaggregated into the four remoteness areas set out in Table 2, with remote and very remote NWAUs combined into one group.12 After we complete our analysis of remoteness costs and make any necessary adjustments to the methodology, we will consider splitting the remote and very remote group. This would be subject to materiality and practicality considerations.
Staff propose to recommend the Commission: note the changes to IHPA’s adjustments for 2018-19 NWAU data, which will affect
the assessment for the first time in the 2020 Review ensure all hospital remoteness and SDS costs for small rural block funded
hospitals are recognised in the SDC assessments for hospital services (admitted patients, ED and NAP)
take steps to ensure that the proxy indicator used in the SDC assessment for community health adequately recognises remoteness and SDS costs
re-test the materiality of splitting remote and very remote areas in the SDC assessments.
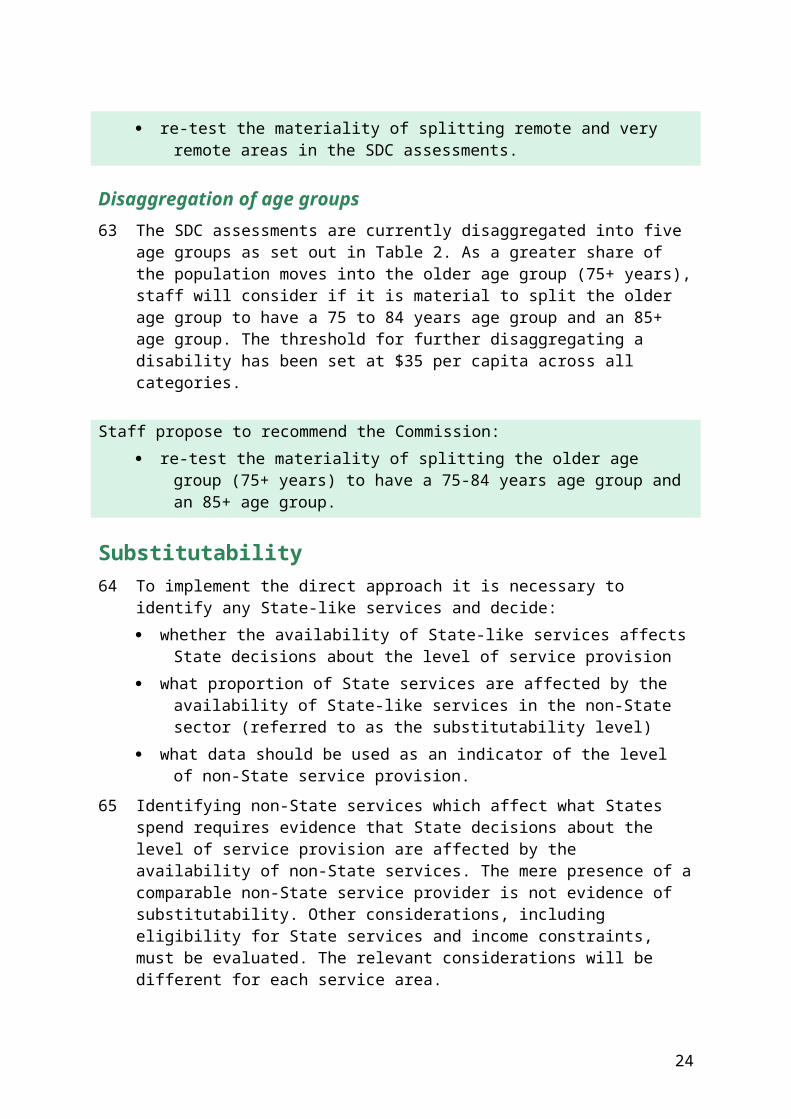
Disaggregation of age groups63 The SDC assessments are currently disaggregated into five age groups as set out in
Table 2. As a greater share of the population moves into the older age group (75+ years), staff will consider if it is material to split the older age group to have a 75 to 84 years age group and an 85+ age group. The threshold for further disaggregating a disability has been set at $35 per capita across all categories.
Staff propose to recommend the Commission: re-test the materiality of splitting the older age group (75+ years) to have a
75-84 years age group and an 85+ age group.
Substitutability64 To implement the direct approach it is necessary to identify any State-like services
and decide: whether the availability of State-like services affects State decisions about the
level of service provision what proportion of State services are affected by the availability of State-like
services in the non-State sector (referred to as the substitutability level)
12 See analysis in Report on GST Revenue Sharing Relativities, 2015 Review, Volume 2, pp.179-180.
17
what data should be used as an indicator of the level of non-State service provision.
65 Identifying non-State services which affect what States spend requires evidence that State decisions about the level of service provision are affected by the availability of non-State services. The mere presence of a comparable non-State service provider is not evidence of substitutability. Other considerations, including eligibility for State services and income constraints, must be evaluated. The relevant considerations will be different for each service area.
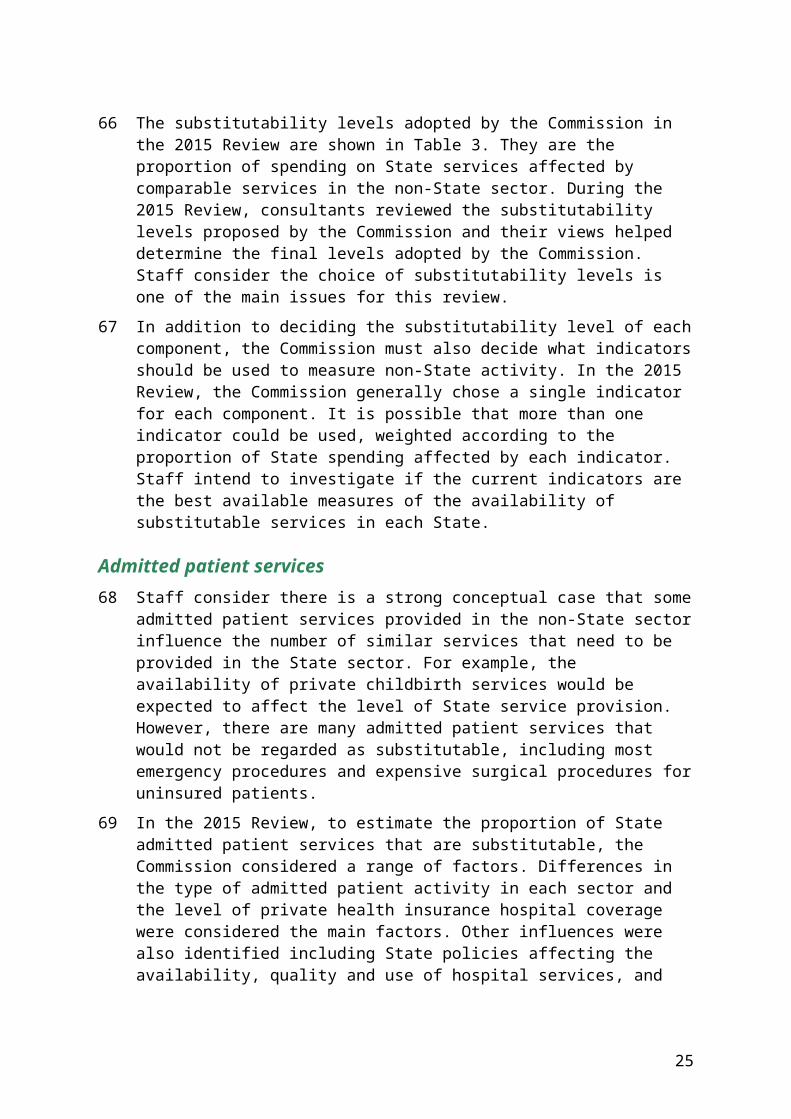
66 The substitutability levels adopted by the Commission in the 2015 Review are shown in Table 3. They are the proportion of spending on State services affected by comparable services in the non-State sector. During the 2015 Review, consultants reviewed the substitutability levels proposed by the Commission and their views helped determine the final levels adopted by the Commission. Staff consider the choice of substitutability levels is one of the main issues for this review.
67 In addition to deciding the substitutability level of each component, the Commission must also decide what indicators should be used to measure non-State activity. In the 2015 Review, the Commission generally chose a single indicator for each component. It is possible that more than one indicator could be used, weighted according to the proportion of State spending affected by each indicator. Staff intend to investigate if the current indicators are the best available measures of the availability of substitutable services in each State.
Admitted patient services 68 Staff consider there is a strong conceptual case that some admitted patient services
provided in the non-State sector influence the number of similar services that need to be provided in the State sector. For example, the availability of private childbirth services would be expected to affect the level of State service provision. However, there are many admitted patient services that would not be regarded as substitutable, including most emergency procedures and expensive surgical procedures for uninsured patients.
69 In the 2015 Review, to estimate the proportion of State admitted patient services that are substitutable, the Commission considered a range of factors. Differences in the type of admitted patient activity in each sector and the level of private health insurance hospital coverage were considered the main factors. Other influences were also identified including State policies affecting the availability, quality and use of hospital services, and the extent to which privately insured patients utilise their private health insurance due to policy excesses and gaps charged by specialists. Staff consider these factors remain relevant for determining the extent to which non-State service provision affects the demand for similar admitted patient services in the State sector.
18
70 Substitutability level. In the 2015 Review, the Commission noted that about 40% of all public admitted patient separations were emergency-type services which were generally not provided by private hospitals. The Commission did not regard these services as substitutable. Furthermore, the Commission noted that the proportion of people with private health insurance hospital cover was 47% at the national level. A person without private health insurance will rarely attend a private hospital, regardless of the availability of private health services in their State. Based on these two factors, it was estimated that the level of potential substitutability would be 60% × 47%=28%. However, this was considered as an upper bound given other policy and non-policy influences. The final level of substitutability adopted by the Commission was 15%.
71 Staff consider the approach for estimating the substitutability level for admitted patients remains appropriate and the data used to estimate the upper limit of 28% are reliable. Since the 2015 Review, there has been little change in the proportion of people with private insurance hospital coverage (47% in 2015-16),13 or the proportion of public admitted patient separations classified as emergency-type services (40% in 2015-2016).14
72 Staff consider the current substitutability level of 15% for admitted patients is the correct order of magnitude but we intend to do some further analysis to confirm that 15% remains appropriate. When this work is completed, we will consult with States through the OWP on the level we expect to recommend to the Commission for the 2020 Review. As part of this work we also intend to consider if the AIHW and Australian Prudential Regulation Authority (APRA) private patient separations data being used to calculate the non-State sector adjustments are the most reliable data available for this purpose.
Staff propose to recommend the Commission: continue to recognise the influence of the non-State sector on admitted
patient expenses using a direct assessment approach confirm the level of substitutability and data used to calculate the non-State
sector adjustment after staff analysis has been completed and States have been consulted.
Emergency department services73 Similar to admitted patients, some State-like ED services can be provided by the
non-State sector.
13 APRA, 2016. Privately insured people with hospital treatment cover annual analysis by sex, age and States.
14 AIHW, 2017. Admitted patient care 2016-17: Australian hospital statistics.
19

GP clinics, which are predominately privately owned, provide some of the services that are provided by EDs. Many of the less severe ED presentations can be managed and treated through GP clinics and nurse walk-in centres. Most States have policies to limit the use of ED services by promoting the use of alternative services including local GPs and after hours GP services, and by ensuring adequate GP services are available.
In addition, private hospitals provide some ED services. In 2015-16, 36 private hospitals provided about 538 000 emergency services, accounting for 7% of total ED presentations in that year.15 However, private ED patients are charged an attendance fee, which is not claimable under Medicare or private health insurance.
74 Staff consider there is a strong conceptual case that the availability of GP services influences the level of ED services provided by States. As part of the review, we intend to reinvestigate to what extent private ED services are substitutable with State ED services.
75 Substitutability level. In the 2015 Review, the level of substitutability for ED services was determined based on the concept of less severe/complex ED presentations that could have been managed by a GP. A number of studies and surveys were used to indicate the level. An AIHW measure of the use of ED services by GP-type patients which was based
on the Australasian Triage Scale (ATS)16 estimated that about 40% of ED visits were ‘GP-type presentations’.
Other location specific and international studies/surveys which estimated that lower proportions of total ED presentations, ranging from 10% to 23%, could have been managed by a GP.
76 Considering the limitations of each of these studies and views of the consultants, the Commission adopted 15% as the level of substitutability. The majority of States supported a substitutability level in the range of 15 to 20%. The ACT and the Northern Territory said the AIHW figure of 40% should apply.
77 The AIHW has recently advised Commission staff that it has no longer been measuring the proportion of ED visits which could be considered GP-type presentations due to methodological and data limitations. It has advised Commission staff that the ATS based method only indicates the urgency, not the severity, of the presenting problem. It is possible that a patient has a low triage category but needs complex care. For example, an elderly patient with multiple chronic conditions who is vomiting would be low in urgency (triage category 4 according to ATS) but high in complexity, requiring comprehensive assessments and support to ensure safe discharge. Such a
15 AIHW, 2017. Emergency department care 2016-17: Australian hospital statistics. 16 ACEM, 2016. Guidelines on the implementation of the Australasian Triage Scale in emergency
departments.
20

patient cannot be easily managed in most GP settings. In addition, people’s access to EDs can also be influenced by the availability of GP and other health services.
78 Staff consider that 15% is the correct order of magnitude for the substitutability level for ED services. Nevertheless, we intend to do some further work to confirm this level by identifying any new studies examining the relationship between GP and ED services, and investigating the influence of private ED services.
79 We will also confirm the current indicator of benefits paid for bulk-billed GPs is the most appropriate data for calculating the non-State sector adjustment. Bulk-billed benefits paid was chosen by the Commission in the 2015 Review because this removed the income constraint faced by people.
Staff propose to recommend the Commission: investigate if there are any new studies examining the relationship between GP
and State provided ED services to support or otherwise indicate a different level of substitutability for ED services
investigate to what extent private ED services are substitutable with State ED services.
Non-admitted patient services
80 Substitutability level. State provided NAP services include a wide range of pre- and post-hospital and clinical treatments. The majority, if not all, of these services are also provided by the private sector. For example, there are private gynaecologists, cardiologists, oncologists, physiotherapists and chiropractors that offer the same types of services provided in public hospitals. Pathology and diagnostic imaging services are also widely available throughout the private sector. Therefore, we would expect the potential substitutability would be high for these services.
81 However, there are usually some patient out-of-pocket costs for services that are provided by the private sector. Medicare provides a variety of subsidies to reduce the cost burden on patients but does not regulate the fees charged by private specialists. In 2016-17, less than one third of all private specialist consultations were bulk-billed and for those who were not bulk-billed, the average patient out-of-pocket expense was $75.17 Pathology and diagnostic imaging services have higher bulk-billing rates than specialist services.
82 In the 2015 Review, the Commission investigated the substitutability level for NAP services using an approach that disaggregated all NAP services into broad groups, and for each group of services, it applied the bulk-billing rate to the proportion of estimated spending. The weighted proportions were summed to give the overall level of substitutability.
17 Department of Health, Annual Medicare Statistics, accessed March 2018.
21
83 Staff consider this approach to be valid and we intend to replicate it using the most recent available data to estimate the substitutability level for the 2020 Review.
84 Indicator for non-State activity. The indicator the Commission chose for measuring the availability of non-State sector services was bulk-billed benefits paid for specialist, pathology and imagining services. Similar to the argument for EDs, this removes the income constraint faced by people and is closer to the concept that the Commission wants to measure.
85 Staff are generally satisfied that these are the main State-like services which affect State NAP spending. However, there are two issues we intend to investigate. One issue raised in the 2015 Review was that pathology and diagnostic imaging
services were generally bundled with a specialist consultation so it was suggested to exclude these services before estimating substitutability.
Whether bulk-billed allied health services should be included in the measure of non-State services. In the 2015 Review, the Commission did not include these services because it considered that most NAP services were linked to in-patient services and would be largely unaffected by levels of private provision.
86 Staff intend to re-examine these issues in the 2020 Review.
Staff propose to recommend the Commission: confirm the current level of substitutability for NAP using the same approach used
in the 2015 Review investigate if service bundling or non-State allied health services have any
implications for State provided NAP services.
Community health services 87 Community health services include a broad range of heterogeneous health services,
and for many, comparable services are available in the non-State sector. In the 2015 Review, the Commission considered that 70% would be a reasonable estimate of the substitutability of community health services. It also considered the most appropriate indicator of substitutable non-State services would be bulk-billed GP benefits paid, given that most community health services can be provided by GP clinics. However, the Commission had concerns regarding how closely the socio-demographic profile of people using GP services reflected the profile of people using other non-State provided community health services. As such, a discount of 25% was applied.
88 Community health was the component for which the Commission had the least amount of information in the 2015 Review to determine the overall substitutability level. This is expected to be the main focus for the Commission in this review.
22
89 Substitutability level. Due to the heterogeneity of community health services, staff consider that it would be sensible to investigate the substitutability for each main area separately and re-estimate the substitutability level. This approach is similar to that for NAP but analysis will be undertaken on a more micro level.
90 The detailed steps include: step 1: assessing the level of substitutability for each service by evaluating
the nature of services provided by the State and non-State sectors accessibility/cost of services provided by the State and non-State sectors
step 2: estimating the expense weight for each service step 3: estimating the substitutability level for the component by combining
substitutability (from step 1) and expense weights (from step 2) for each service and summing them to obtain an estimate of the total proportion of substitutable services.
91 Table 7 illustrates the considerations for step 1 using public dental services as an example.
92 Indicator for non-State activity. The indicator of non-State sector services currently used in the community health assessment is bulk-billed GP services. Given the nature of community and public health services, staff consider bulk-billed GP services are a reasonable indicator for non-State community health activity. As part of the review, we intend to investigate if this is the best available indicator for this purpose.
Staff propose to recommend the Commission: re-estimate the substitutability level for community health using a bottom-up
approach which examines each major service area on a case by case basis investigate if bulk-billed GP benefits data, which is currently being used to
estimate the availability of non-State community health services, is the best available indicator for this purpose.
23
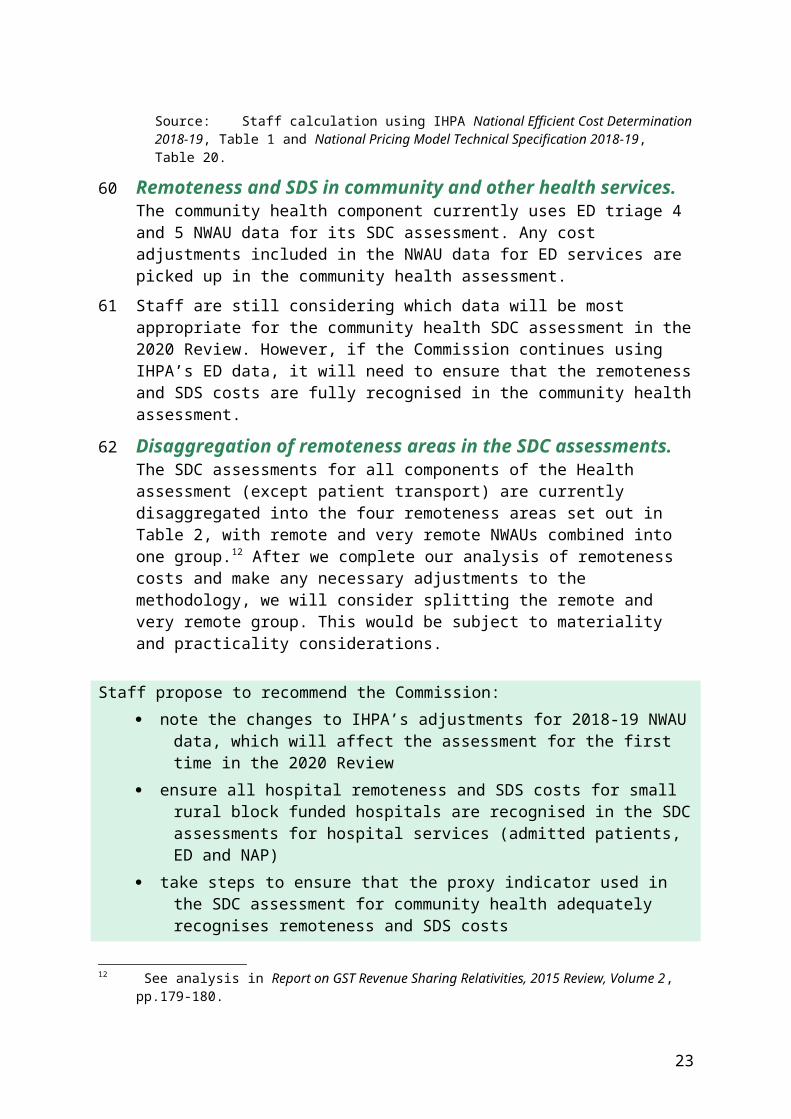
Table 7 Analysis on substitutability level for dental services
Dental services (a)
State sector services
All States provide free or subsidised general and emergency dental services, denture services and special dental care. Services are provided through community health centres, Indigenous community health centres, dental clinics, school dental clinics and mobile dental clinics. Some public dental services are provided by private dentists via a voucher scheme (b). Public dental services target children and disadvantaged adults. The eligible populations are children, Health Care Card and Pensioner Concession Card holders but there are some minor differences in eligibility between States. Waiting times for public dental services mean that some patients eligible for public dental services access private dental services despite the cost. 15% of people reported their last visit to a dentist was to a public dental service (c).
Non-State sector services
The full range of dental services including orthodontics is provided by private dentists and there are no restrictions on access. 85% of people reported their last visit to a dentist was to a private dental service. Most private dental costs are met directly by the patient or by private health insurance. About 50% of people aged five and over had private health insurance with dental cover in 2013. A relatively high proportion (70%) of people eligible for public dental services said they visited a private dentist in the last 12 months. 90% of people who visited a dentist in the last 12 months said they were ineligible for public dental services (c).
Service use data There are fragmented use and cost data by age group/remoteness/SES/provider sector. (c) Latest data are available from Government Health Expenditure National Minimum Dataset (NMDS) (2012-13), National Dental Telephone Interview Survey (NDTIS) (2013), National Survey of Adult Oral Health Survey (2004-2006) and the Child Dental Health Survey (2010). AIHW advises that not all data are comprehensive, timely or comparable between jurisdictions or across time. Available data show that the SDC profiles of public and private patients are very different.
Health workforce Access to dental practitioners varies across States. The number of dentists per 100 000 population ranges from 37.7 in Tasmania to 65.9 in the ACT. By region, remote/very remote areas have the lowest rates of all practitioners except dental therapists. The ratio of private to public dentists is 5:1 (c).
State expenditure
State expenditure in 2014-15 was $848 million or $36 per capita representing 9% of total dental expenditure (NMDS, 2014-15) (d).
Substitutability Similar types of services are provided by the State and non-State sectors. Access to State services is limited to children and concession card holders. These groups account for 35% of the total population. The relatively high cost of private services means that some public patients are unable to access private services. If more State provided services were available this would likely reduce use of private services but an increase in private services would be unlikely to have a noticeable effect on the total use of public dental services. The main influence on the level of State dental service use appears to be the level of State service provision.Overall, the level of substitutability appears to be relatively low.
(a) Excludes hospitalisations due to dental conditions.(b) These arrangements apply in New South Wales, Queensland and Western Australia.(c) AIHW, Oral health and dental care in Australia 2015, pp. 30, 31, 59, 67.(d) Estimate based on total State and local government expenditure plus Commonwealth expenditure
through the Treating More Public Dental Patients NPP.
24
Cross-border service use93 The assessment recognises the effect of cross-border service use on States spending.
The ways in which this is done for hospitals and community health differ.
Hospital services94 There are two aspects to the arrangements for ensuring States are compensated for
the cost of providing hospital services to residents of another State. The first relates to the Commonwealth contribution to the total cost of treating non-residents and the second to the State contribution to these costs. The Commission makes a cross-border adjustment to actual National Health
Reform funding payments used in its Commonwealth payments assessment to ensure that any funding to a State for non-resident activity does not influence a State’s GST distribution. The adjustment is made for all States (not just New South Wales and the ACT) and it ensures that the Commonwealth contribution to the cost of treating non-residents is retained by the State providing the services.
The National Healthcare Agreement provides bilateral agreements between States covering reimbursement of the costs of cross-border service use. These agreements mean that a State can obtain reimbursement for its share of the cost of treating non-residents. There is a bilateral health agreement between New South Wales and the ACT covering costs18 associated with services provided to admitted and non-admitted patients.
95 As a result of these arrangements, no cross-border factor is required in the hospital assessments. No changes to these arrangements are anticipated.
Community health services96 Staff intend to review the approach to the community health cross-border
assessment. The current approach is based on data and an approach developed in the 2010 Review. More details are in the Staff Draft Assessment Paper CGC 2018-01/25-S, Other disabilities.
Staff propose to recommend the Commission: note that the current arrangements ensure that States are reimbursed for the
cost of providing hospital services to residents of another State review the approach to the cross-border assessment for community and other
health services as outlined in the Staff Draft Assessment Paper CGC 2018-01/25-S.
18 Costs include the opportunity cost of capital.
25
Non-hospital patient transport97 Staff intend to collect new data from the States on spending on aero-medical
ambulance services and PATS. Similar data were collected in the 2015 Review. The data will be used to benchmark non-hospital patient transport expenses to GFS patient transport expenses, and to calculate the remote patient cost loading for the 2020 Review. Staff do not propose any change to the current method for this assessment.
98 Although there is no proposal to change the method, staff want to ensure there is no double counting of costs related to inter-hospital transfers, including to interstate hospitals. Inter-hospital transfer costs are captured in IHPA’s cost data.
Staff propose to recommend the Commission: retain the current method for assessing non-hospital patient transport
expenses but collect new data to benchmark patient transport expenses and re-calculate the remote patient cost loading.
Other health expenses99 Community and other health expenses were $12.4 billion or 20% of total category
expenses in 2016-17 (see Table 1). A breakdown of these expenses is shown in Table 8. Community and public health services account for 75% of component expenses. Pharmaceuticals, medical aids and appliances account for a further 17%.
100 Staff intend to investigate whether expenses for pharmaceuticals, medical aids and appliances and health administration not elsewhere classified (n.e.c.) should be included in the community health component or whether most of these expenses relate to the delivery of hospital services. The preliminary staff view, based on analysis of the GFS unit record data, is that most relate to the delivery of hospital services and as such should be included in the admitted patients component instead of the community health component.
26

Table 8 Community and other health expenses by purpose, average expenses 2012-13 to 2015-16
Expense purpose GPC code (a) Share of expenses
%Community mental health services 541 20.0Other community health services 549 41.4Public health services 55 13.2Pharmaceuticals, medical aids and appliances 56 16.8Health research 57 3.0Health administration n.e.c. 59 5.7Total na 100.0
(a) Government Purpose Classification.Source: State GFS unit record data.
Staff propose to recommend the Commission: consider whether expenses for pharmaceuticals, medical aids and appliances
and health administration not elsewhere classified (n.e.c.) should be included in the community and other health component or admitted patients.
Component expenses 101 GFS provides total non-admitted patients expenses but they are not disaggregated
into ED and other NAP services. At the time of the 2015 Review, no data were available to reliably split ED and NAP services, so the Commission decided to split these expenses on a 50:50 basis.
102 New data are now available which may allow the Commission to better estimate ED and NAP expenses. One option would be to use total non-admitted patient expenses from GFS and deduct ED expenses from the NHCDC or AIHW’s Australian Health Expenditure publication to calculate NAP expenses as a residual. Alternatively, given that the NAP NWAU data are likely to be reliable enough by the time of the 2020 Review, NWAU shares for ED and NAP could be used to split ED and NAP expenses.
103 Using either approach it is likely that the Commission will be able to obtain reliable annual estimates of ED and NAP expenses.
Staff propose to recommend the Commission: consider options for deriving annual estimates of ED and NAP expenses.
27
User charges104 In the health assessment all user charges are offset against expenses. Ninety percent
of user charges relate to admitted patient services with the balance attributable to community and other health. If the Commission decides to retain a direct assessment approach for all components of the assessment, staff intend to recommend that the Commission continue to offset all user charges.
105 Hospital services. State Governments and the Commonwealth provide most of the funding for public hospitals in Australia through Australian Health Care Agreements. Other sources of funding for public hospitals include the Department of Veterans’ Affairs, Department of Defence, worker’s compensation, motor vehicle third party claims and other compensation (for example, public liability), health insurance funds (HIFs) and individuals. These other sources of funding reduce State expenses and are often categorised as follows: revenue related to fully compensable expenditure, which refers to funding which
is sourced from the Department of Veterans’ Affairs, Department of Defence, worker’s compensation, motor vehicle third party claims and other compensation
revenue related to partially compensable expenditure, which refers to funding which is sourced from HIFs and individuals.
106 As the labels indicate, expenditure that is fully compensable is funded in full by the relevant party, whereas expenditure which is partially compensable leaves the State with some residual costs. Public hospital expenses which are fully compensable are not eligible for activity based funding. Furthermore, they do not have any effect on a State’s fiscal capacity and it is appropriate to offset any revenue arising from fully compensable services from hospital expenses.
107 Only those services which are partially compensable affect a State’s fiscal capacity, although the net cost of partially compensable services is much lower than services for which the primary source of funding is the State.
108 IHPA’s admitted acute costing model recognises that private patients in public hospitals are less costly than public patients by including two adjustments: a private patient service adjustment and a private patient accommodation adjustment. This means that only the net cost to States of private patients is reflected in the NWAU data. As such it is appropriate to offset any revenue from partially compensable patients from hospital expenses.
109 Community and public health services. Some patients using State community health services contribute to the cost. For example, some patients using public dental services are charged a fee. The revenue generated through user charges for community and other health services is about 10% of State costs.
28
110 Given that exemptions and concessions apply to the most disadvantaged people using community health services it is likely that the SDC profile of people using community health services is different from that of people who contribute to the cost of community health services. Strictly speaking this would suggest that community health user charges should not be offset against expenses.
111 Staff have concerns about the reliability of community health revenue data sourced from GFS and question whether some States may be reporting hospital revenue in the community health classification of GFS. On balance staff are inclined to continue netting off all user charges from category expenses because it is simpler and any other approach is unlikely to be materially different.
Staff propose to recommend the Commission: continue to offset all user charges against expenses to maintain simplicity and
because: fully compensable patients have no effect on State fiscal capacities and
it is appropriate to remove these expenses from the assessment only the residual cost of private patients in public hospitals affect State
fiscal capacities and the NWAU data used in the SDC assessment recognises that private patients in public hospitals are less costly.
Category structure112 Staff are considering one change to the category structure. If non-admitted patient
NWAU data from the IHPA are considered sufficiently reliable by the time of the 2020 Review it may be possible to assess all hospital services (admitted patients, ED and NAP services) in a single component using aggregate NWAU data for all hospital services. This would simplify the Health category by reducing the number of components. Non-State sector adjustments would continue to be estimated separately for each component.
Staff propose to recommend the Commission: consider assessing all hospital services in a single component if IHPA’s NWAU
data for NAP services is considered sufficiently reliable by the time of the 2020 Review.
29

Other issues considered
Cultural and linguistic diversity (CALD)113 In the 2015 Review the Commission considered the conceptual case for including a
CALD disability in the expense assessments, including Health, but decided not to because while costs are often higher for CALD populations, use rates are generally lower.19
114 IHPA recently completed a costing study to inform a policy decision for whether an adjustment is warranted to the NEP for CALD patients.20 The study focused only on the cost impact of CALD patients when hospital based services are utilised. It concluded, based on Round 17 NHCDC data, that a CALD adjustment to the NEP model for sub-acute, ED or outpatient encounters could not be supported. It found that for acute admitted encounters, there was some evidence of CALD patients costing more than non-CALD patients; however the differences were small. Based on this costing study, IHPA decided a cost adjustment for CALD patients could not be justified.
115 The study noted: there is no nationally consistent indicator for identifying CALD patients current cost processes mean that costed activity may not be truly reflective of
CALD patient specific costs (for example, interpreter services or additional nursing or health practitioner time)
one of the consistent and significant characteristics of CALD patients is that they are older in age than the general population, and many of the cost and activity impacts observed for CALD patients closely correlate to the impacts seen within aged patients.
116 The study recommended a number of changes to costing and reporting processes to better support future analysis of the cost impact of CALD patients on hospital services. Until such time that IHPA is able to reliably measure the cost impact of CALD patients and establish that a cost adjustment would be material, staff do not propose to do any further work on this.
Staff propose to recommend the Commission: not include a cost adjustment for culturally and linguistically diverse (CALD)
patients because any additional costs for CALD patients compared with non-CALD patients appear to be small.
19 The CALD disability is discussed in the 2015 Review Report, volume 2, pp. 547-550.20 IHPA, 2015. Culturally and Linguistically Diverse (CALD) Patient Costing Study Report
30
CONCLUSION AND WAY FORWARD
Proposed assessment structure117 Staff propose the following assessment structure for the 2020 Review (Table 9).
Table 9 Proposed Health category structure
Component Disability (a) Influence measured by disability
Hospital services SDC Recognises that the use and cost of State provided services differ among different population groups and regions.
Non-State sector Recognises the impact of the non-State sector on substitutable spending on hospital services.
Wages Recognises differences in wage costs between States.
Community and public health services
SDC Recognises that the use and cost of State provided services differ among different population groups and regions.
Non-State sector Recognises the impact of the non-State sector on substitutable spending on community and public health services.
IRHD adjustment Recognises the impact of Commonwealth grants to Indigenous community health organisations.
Cross-border Recognises the cost to the ACT of providing services to NSW residents.
Wages Recognises differences in wage costs between States.Non-hospital patient transport
Remoteness Recognises the additional costs of providing non-hospital patient transport to people in remote regions.
Wages Recognises differences in wage costs between States.(a) Remoteness costs are included in the SDC assessments.
Data and information sought from States118 States are invited to comment on all the issues raised in this paper. In particular, staff
are seeking data/views on the following: views on the quality and fitness for purpose of IHPA data for the SDC assessments views on the substitutability levels for hospital and community health services use and cost data on State provided community health services.
31
ATTACHMENT A — SUBTRACTION APPROACH1 The decision in the 2010 Review to adopt a subtraction approach for non-admitted
patient services was based on two major issues for the assessment at that time. A lack of comprehensive and reliable administrative data on the use and cost of
State provided ED, NAP and community and other health services. A large and well-developed non-State sector providing similar services to those
provided by States in a number of areas which affects what States need to spend.21
2 In adopting a subtraction approach in the 2010 Review the Commission concluded that States are responsible for providing services not provided by the non-State sector, particularly in areas where it is uneconomic for non-State providers to operate. The subtraction approach assumed that State and non-State provided services are fully substitutable with the result that relatively high levels of non-State service provision would reduce what States needed to spend.
3 During the 2010 Review the Commission engaged a consultant22 to review the conceptual validity of the subtraction approach and the full substitutability assumption, and he concluded that it was reasonable to assume the majority of services provided by the States and non-State providers were equivalent and substitutable.
4 Under the subtraction approach, the Commission calculated assessed expenditure on State-like non-admitted patient services by all sectors — Commonwealth, State or local government and the private sector. The assessment was based on national cost weighted use of these services and the socio-demographic composition of the population in each State. It then subtracted estimated expenditure by the non-State sector on State-like services to derive a residual amount representing the spending requirement to be funded by each State. The calculations are illustrated in Table 10.
Issues with the 2010 Review subtraction approach5 The Commission’s decision in the 2015 Review to move away from a subtraction
approach was made for a number of reasons, which are discussed in the following paragraphs.
21 The non-State sector refers to all service providers other than State governments and includes the private sector, other levels of government and the not-for-profit sector.
22 Professor James Butler, Director of the Australian Centre for Economic Research on Health.
32
Table 10 Illustration of subtraction approach, 2011-12
NSW Vic Qld WA SA Tas ACT NT Total$m $m $m $m $m $m $m $m $m
A. SDC assessed expenditure on State-like services 13 633 10 386 8 475 4 520 3 114 970 690 536 42 324
B1. Commonwealth medical expenses 4 825 3 356 2 545 1 013 963 256 161 69 13 188B2. Commonwealth Indigenous health
grants to NGOs 79 36 97 76 36 8 4 94 431C1. Health insurance fund
contributions to medical and other health services 2 376 1 607 1 385 775 608 134 105 37 7 027
C2. Household out-of-pocket expenses 1 213 1 030 770 300 246 86 54 19 3 719Assessed State expenditure
(A-B1-B2-C1-C2) 5 140 4 357 3 678 2 355 1 260 486 366 316 17 959Source: Staff illustration based on 2010 Review subtraction approach.
Uncertainty in the SDC assessment6 Ideally, the SDC assessment requires data on national spending patterns for all
Commonwealth, State and privately provided services. The data used in the 2010 Review subtraction approach were for a limited range of health services sourced from the AIHW and ABS National Health Survey (NHS). While there were some data for the non-State sector, there were limited data for the State sector. This meant that the SDC assessment heavily relied on data for the non-State sector and the assumption that the profile of service users was similar to that for the State sector. Subsequent State sector data suggest the profile of users in the non-State sector is very different to the State sector.
7 In addition to concerns about how accurately the data reflected spending on total State and State-like services, the main datasets used to construct an overall picture of service use did not include all of the socio-demographic characteristics the Commission wanted to recognise (that is, age, Indigenous status, remoteness and SES). Consequently, adjustments for some of these influences were based on data sources related to a limited range of services or sectors and of varying quality.
Complexity8 Compared to a direct approach, the subtraction approach relied on a much wider
range of data sources and a higher level of judgement in combining these data sources.23
23 For example, see Report on GST Revenue Sharing Relativities — 2010 Review, Volume 2, pp. 238-244.
33
Full substitutability assumption9 Another issue for the subtraction approach was whether services offered by the State
and non-State sector are fully substitutable. In the 2015 Review the Commission identified evidence contradicting the full substitutability assumption. Patient choice appears to be limited by income constraints so States still need to
provide some services regardless of the level of non-State provision. Eligibility requirements restricting access to some State services and significant
differences in the profiles of people using State and non-State services, particularly community health services, suggest less than full substitutability.
For some health services, responsibility for service provision is concentrated in one sector which may indicate low levels of substitutability. For example: the non-State sector is the major service provider of dental services and
changes in the level of non-State provision appear to have a limited effect on the level of State provision
the State sector is the major provider for ED services and the non-State sector has a limited effect on what States need to spend.
10 After considering evidence for a range of services the Commission concluded that there were a significant number for which the full substitutability assumption did not hold including many allied health, dental and ED services.
Data improvements11 The introduction of the National Health Reform Agreement (NHRA) and the creation
of IHPA led to the availability of improved data on the use and cost of hospital services, particularly ED services. These data collections, which are continuing to develop and improve in quality, provided a more accurate picture of non-admitted patient services than previously available data.
Contemporaneity12 While some elements of the subtraction assessment were able to be updated
annually, this was not the case for all data used for the SDC assessment. For the subtraction approach to produce a reliable estimate of what States need to spend, all elements should relate to the same time period. In a period when health expenditure patterns are changing rapidly, the direct assessment method, which can be updated annually, has a significant advantage.
Conclusion13 In the 2015 Review the Commission concluded that the direct approach was not
perfect but it represented an improvement over the subtraction approach.
34

ATTACHMENT B — 2015 REVIEW METHOD1 This attachment provides additional detail about the 2015 Review assessment
methods.
SDC assessments2 The socio-demographic composition (SDC) assessments for the hospital and
community and other health components are similar. Assessed SDC expenses are derived by: allocating the national net expenses to each of the population groups on the basis
of NWAUs or the number of in-scope separations sourced from IHPA dividing the net expenses attributable to each population group by the national
population in that group to obtain the national average cost for each population group
multiplying the national average cost for each population group by the number of people in the corresponding SDC group in each State to obtain assessed expenses for each population group
summing assessed expenses for each population group in each State to obtain the total assessed SDC expenses for each State.
3 The calculations are illustrated in Table 11 using a subset of admitted patients data for 2015-16 and data for New South Wales. The SDC calculations are done for 100 separate population groups. The full SDC breakdown for the hospital and community health assessments is shown in Table 2.
35
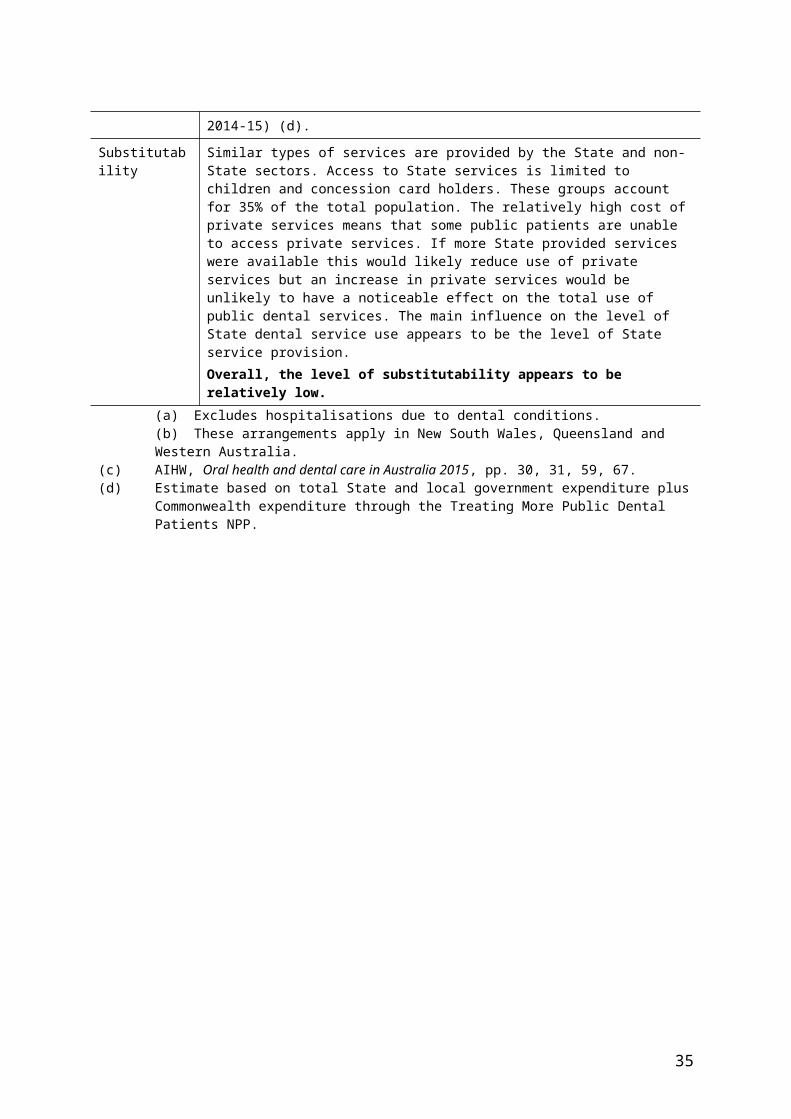
Table 11 SDC assessment for admitted patients component, illustration 2016-17
Indigenous status Remoteness/SES Age
group NWAUs Net expenses Total pop.
National average
cost
New South Wales
Pop Assessed expenses
no. $m no. $ pc no. $m
Indigenous Major cities Middle SES 0-14 11 621 76 57 444 1 324 26 002 34
Indigenous Major cities Middle SES 15-44 26 759 175 73 567 2 381 32 421 77
Indigenous Major cities Middle SES 45-64 17 108 112 27 558 4 064 12 699 52
Indigenous Major cities Middle SES 65-74 4 333 28 5 090 5 573 2 516 14
Indigenous Major cities Middle SES 75+ 1 989 13 2 046 6 366 1 040 7
Non-Indigen. Major cities Middle SES 0-14 220 634 1 444 1 815 654 795 526 770 419
Non-Indigen. Major cities Middle SES 15-44 623 942 4 084 4 484 856 911 1 335 876 1 217
Non-Indigen. Major cities Middle SES 45-64 519 159 3 398 2 302 258 1 476 678 274 1 001
Non-Indigen. Major cities Middle SES 65-74 336 684 2 204 765 566 2 879 225 307 649
Non-Indigen. Major cities Middle SES 75+ 468 604 3 068 615 568 4 983 186 099 927
100 SDC groups
Total (All SDC groups) 5 829 799 38 163 24 381 012 1 565 7 797 791 12 206Source: Commission staff calculation for 2018 Update based on GFS expenses for the Health category,
NWAU data supplied by IHPA and ABS population data.
4 Since the NAP SDC assessment uses separations data which do not include any cost loadings, the general regional costs disability is applied to SDC assessed expenses for this component.
Non-State sector adjustments5 By including remoteness in the SDC assessment, the differential costs to States of
providing services in different regions where the non-State sector is more or less active are recognised. The non-State sector adjustment recognises that, in otherwise comparable regions, States face differential service costs due to differences between States in the level of non-State sector services. The non-State sector is often the Commonwealth, private or not-for profit sector (albeit often partially funded by the Commonwealth government) but not in all cases.
6 A non-State sector adjustment is included for all components except patient transport. To calculate the adjustment the Commission requires an estimate of the proportion of State services affected by the non-State sector. This is referred to as the substitutable expense proportion (or the substitutability level). The proportion for each component is shown in Table 3. The non-State sector adjustment also requires information about the national use of non-State sector services standardised by Indigenous status, remoteness, SES and age, and the actual availability of these services in each State.
36
7 The data sources for calculating the non-State sector adjustments are shown in Table 4. The calculation of the non-State sector adjustment is illustrated in Table 12 using ED data. The main steps in the calculation are as follows. Determine the amount of substitutable State expenses by multiplying the
substitutable proportion by component expenses. Calculate the assessed use of non-State sector services for each State based on
the national profile of people using these services. Apportion the substitutable expenses across States based on each State’s share of
assessed non-State sector service use. Use each States’ share of actual non-State sector service use to apportion the
substitutable expenses across States. Subtract actual non-State sector service use from assessed non-State sector
service use to obtain the non-State sector adjustment for each State.
8 For the community and other health component two non-State sector adjustments are made. The first measures the influence of the level of bulk-billed GP services on State community and other health expenses and the second measures the influence of Commonwealth funding to non-government organisations for Indigenous Australians’ Health Program (IAHP).24
Table 12 Non-State sector adjustment, ED services, 2016-17
NSW Vic Qld WA SA Tas ACT NT Total$m $m $m $m $m $m $m $m $m
Substitutable ED expenses(15% x $4.9 billion) 740
Assessed expenses (a) 242 190 146 74 56 16 11 6 740Actual expenses (b) 255 186 153 66 53 13 7 6 740Non-State sector adjustment (c) -13 4 -8 9 3 3 4 -1 0
(a) Assessment is based on bulk-billed GP benefits standardised by Indigenous status, remoteness, SES and age.
(b) Estimate is based on State shares of actual bulk-billed GP benefits in each State.(c) The difference between assessed and actual bulk-billed GP benefits.Source: Commission calculation, 2018 Update.
24 These grants were formerly Indigenous and Rural Health Division (IRHD) grants.
37