contents › pdf › toushi › ir › ... · against this financial and economic backdrop, the...
TRANSCRIPT


1
Since its establishment in 1952, Chiba Kogyo Bank has contributed to the economic development of the local community under its corporate philosophy of “Moving Forward with the Region, with Heartfelt Kindness Toward Customers”. Chiba Prefecture, the Bank’s business base, is a leading industrial prefecture located on the eastern coast of Japan’s main island of Honshu, facing the Pacific Ocean. Adjoining Tokyo, the prefecture plays a key part in some of the capital’s functions. As such, the Bank seeks to fulfill its role as a leading regional financial institution under its corporate mission of gaining the confidence of the local community through its high profitability, achieved with a small but select staff.
Contents Corporate Profile ・・・・・・・・・・・・・・・・・・・・・・・・・・・・・・・・・・・・・・・・・・・・・・・・・・・・・・・・・・・・・・・・ 1
Economy of Chiba Prefecture – Our Business Base ・・・・・・・・・・・・・・・・・・・・・・・・・・・・・・・・・・・・・ 2
Summary of Selected Financial Data (Consolidated) ・・・・・・・・・・・・・・・・・・・・・・・・・・・・・・・・・・・・ 3
Message from the President ・・・・・・・・・・・・・・・・・・・・・・・・・・・・・・・・・・・・・・・・・・・・・・・・・・・・・・・・ 4
Business Performance (Consolidated) ・・・・・・・・・・・・・・・・・・・・・・・・・・・・・・・・・・・・・・・・・・・・・・・・ 5
Basic Rationale Behind Promoting Region-Based Financing ・・・・・・・・・・・・・・・・・・・・・・・・・・・・・・ 6
Provision of Systems Offering Management Support for Small and Medium Enterprises ・・・・・・・・ 6
Consolidated Financial Statements ・・・・・・・・・・・・・・・・・・・・・・・・・・・・・・・・・・・・・・・・・・・・・・・・・・・ 8
Consolidated Subsidiaries ・・・・・・・・・・・・・・・・・・・・・・・・・・・・・・・・・・・・・・・・・・・・・・・・・・・・・・・・・・ 17
Organization Chart ・・・・・・・・・・・・・・・・・・・・・・・・・・・・・・・・・・・・・・・・・・・・・・・・・・・・・・・・・・・・・・ 17
Board of Directors, Corporate Auditors and Executive Officers ・・・・・・・・・・・・・・・・・・・・・・・・・・・ 18
Major Shareholders (Common Stock) ・・・・・・・・・・・・・・・・・・・・・・・・・・・・・・・・・・・・・・・・・・・・・・・・ 18
Corporate Outline ・・・・・・・・・・・・・・・・・・・・・・・・・・・・・・・・・・・・・・・・・・・・・・・・・・・・・・・・・・・・・・・・ 19
Corporate Profile

2
Chiba Prefecture, Chiba Kogyo Bank’s business base, is located adjacent to Tokyo. Part of the Greater Tokyo
Area, its population exceeds 6 million. Ranking sixth nationally in gross prefectural product, Chiba Prefecture has a warm climate and fertile land.
Possessing both inner-bay and exposed-coast oceanic areas, it is also blessed with rich fishing areas. Accordingly, it boasts one of the largest agricultural outputs and fishery catch outputs in Japan.
Along its Tokyo Bay coastline, an expansive industrial area has formed, centered on the petrochemical and steel industries. With the value of shipments of manufactured goods ranked sixth nationally and the agriculture and marine products, industrial products and commercial trade all ranked in the top 10 nationally, Chiba Prefecture supports affluent lifestyles for its residents.
Chiba Prefecture is also home to Narita International Airport, a hub airport, and it serves as an important base for the people and logistics of the Greater Tokyo Area.
Source: Cabinet Office statistical data (2012), Bank of Japan (End of March, 2015), Census of Manufactures by Ministry of Economy,
Trade and Industry (December 31, 2012)
Gross Prefectural Product(nominal)
19.1 Trillion 6th among
Japanese Prefectures
Balance of Deposits
26.5 Trillion 6th among
Japanese Prefectures
Balance of Loans
13.0 Trillion 7th among
Japanese Prefectures
Economy of Chiba Prefecture – Our Business Base

3
Fiscal year ended March 31 2011 2012 2013 2014 2015
Consolidated ordinary income (Millions of yen)
(Thousands of U.S. dollar)
¥52,424 ¥52,416 ¥53,990 ¥52,555 ¥53,262 $442,854
Consolidated ordinary profit (Millions of yen)
(Thousands of U.S. dollar)
6,736 9,859 11,046 11,864 13,182 109,603
Consolidated net income (Millions of yen)
(Thousands of U.S. dollar)
7,436 8,066 8,675 8,555 8,442 70,192
Consolidated comprehensive income (Millions of yen)
(Thousands of U.S. dollar)
4,223 8,543 16,482 7,960 19,785 164,505
Consolidated net assets (Millions of yen)
(Thousands of U.S. dollar)
127,554 134,678 181,741 126,493 139,269 1,157,970
Consolidated total assets (Millions of yen)
(Thousands of U.S. dollar)
2,256,208 2,312,063 2,405,813 2,397,895 2,502,720 20,809,179
Net assets per share (Yen)
(U.S. dollar)783.56 920.33 1,207.85 1,289.27 1,635.99 13.60
Net income per share (Yen)
(U.S. dollar)
118.76 131.19 137.11 124.37 127.46 1.06
Diluted net income per share (Yen)
(U.S. dollar)
60.21 65.70 64.63 76.11 79.34 0.66
Capital adequacy ratio (%)
5.59 5.75 7.47 5.18 5.46
Consolidated capital adequacy ratio (under Japanese standards)
(%)
10.22 10.42 12.95 8.91 8.42
Consolidated return on equity (%)
5.96 6.22 5.54 5.62 6.45
Consolidated price earnings ratio (Times)
4.01 3.68 6.63 5.75 6.28
Cash flows from operating activities (Millions of yen)
(Thousands of U.S. dollar)
59,087 (17,239) (28,331) 86,807 6,871 57,130
Cash flows from investing activities (Millions of yen)
(Thousands of U.S. dollar)
(10,520) (27,856) 1,426 19,288 (16,538) (137,507)
Cash flows from financing activities (Millions of yen)
(Thousands of U.S. dollar)
(5,620) (1,419) 35,385 (67,456) (7,264) (60,397)
Cash and cash equivalents at end of period (Millions of yen)
(Thousands of U.S. dollar)
¥70,439 ¥24,104 ¥32,839 ¥71,626 ¥54,946 $456,855
Number of employees [Separately, average number of temporary employees]
(Persons)
1,452
[1,096]
1,412
[1,103]
1,368
[1,095]
1,371
[1,115]
1,393
[1,113]
Notes: 1. U.S. dollar amounts are the yen equivalent, calculated, for convenience only, at a rate of ¥120.27 = U.S. $1, the approximate Tokyo foreign exchange market rate as of March 31, 2015.
2. In the accounting treatment for consumption taxes and local taxes of the Bank and its consolidated subsidiaries, the tax-excluded method is used with the exception of some consolidated subsidiaries.
3. In the calculation of Net assets per share, Net income per share and Diluted net income per share (hereinafter “Per Share Information”), “Accounting Standard for Earnings Per Share” (ASBJ Statement No. 2) and “Guidance on Accounting Standard for Earnings Per Share” (ASBJ Guidance No. 4) are applied.
4. Capital adequacy ratio is calculated by dividing (total net assets at the end of current period - subscription rights to shares at the end of current period - minority interests at the end of current period) by total assets at the end of current period.
Summary of Selected Financial Data (Consolidated)

4
Shunichi Aoyagi
President (CEO)
As always, I would like to extend my sincerest appreciation for your patronage of Chiba Kogyo Bank. On this occasion, we have formulated the “Annual Report 2015,” which highlights the Bank’s management
activities and operating results for FY2014, and provides an overview of our CSR and other initiatives. We would be pleased if stakeholders could take the time to peruse this document.
The economy of Chiba Prefecture in FY2014 showed signs of a moderate recovery. Notably, improvements
were observed in the corporate sector with the number of bankruptcies keeping to a low level, while the employment situation continued on a general trend of improvement.
Against this financial and economic backdrop, the Bank focused on its three-year (FY2013–2015) Medium-Term Management Plan, named “2nd Stage of Transformation and Growth Strategy” and actively deployed various measures.
As a result, the Bank achieved strong earnings results, such as realizing the highest ever amount for ordinary profit.
In realizing this achievement, we would like to express our sincerest gratitude for goodwill we received from our customers, shareholders and everyone in the region.
Chiba Prefecture, the Bank’s business base, is a prospering market, which we expect to further grow as we get
ready for the Tokyo Olympics to be held in five years from now. We will work together with everyone in the region to improve Chiba’s strong economic growth, and carry out various initiatives to fulfill our obligation as a regional financial institution.
FY2015 will be the final year of the Medium-Term Management Plan. Continuing our aim to be “the best consultant for our customers in the region” and “a bank that continues to be chosen, with an absolute presence indispensable to the area and our customers,” we intend to mobilize all the resources at the Chiba Kogyo Bank Group’s disposal and push ahead with our tasks.
I look forward to your further support in the future.
Message from the President

5
In FY2014 ended March 31, 2015, the Japanese economy, despite having a temporary slowdown in business
activity after the consumption tax hike, exhibited recovery overall. Notably, a situation of weak yen and rising stock prices was ongoing, driven mainly by the effect of the Government’s economic measures and the Bank of Japan’s additional monetary easing, and this, along with such factors as resource prices remaining at low levels led to improved corporate earnings. Like the national domestic economy, Chiba Prefecture’s economy, which forms the basis for Chiba Kogyo Bank’s business base, was on a track of mild recovery, as characterized by improved corporate earnings, the number of bankruptcies keeping to a low level, and the employment situation continuing in a healthy state, among other factors.
Against this financial and economic backdrop, the Bank focused on its three-year (FY2013–2015) Medium-Term Management Plan, named “2nd Stage of Transformation and Growth Strategy” and actively deployed various measures, aiming to be “the best consultant for our customers in the region.”
As a result, the Group’s performance was as follows. From an operational standpoint, deposits totaled ¥2,269.1 billion, an increase of ¥70.0 billion compared with
the end of FY2013, primarily due to an increase in individual deposits. Loans and bills discounted amounted to ¥1,822.1 billion, an increase of ¥102.0 billion compared with the end of FY2013, as a result of efforts to discover latent financing needs through consulting sales activities. Securities holdings amounted to ¥553.6 billion, up ¥32.6 billion from the end of FY2013.
From a profit and loss standpoint, ordinary income increased ¥706 million year on year to ¥53.262 billion, owing to an increase in fees and commissions due to higher sales of investment trusts and insurance products, and an expansion in earnings such as from a leasing subsidiary. Ordinary expenses decreased ¥611 million year on year to ¥40.079 billion owing to a significant decrease in credit-related expenses resulting from efforts to improve management of clients, despite an increase in general and administrative expenses. As a result, the Group posted its highest ever ordinary profit of ¥13.182 billion, an increase of ¥1.318 billion year on year. Net income, on the other hand, decreased ¥113 million year on year to ¥8.442 billion, owing to the reversal of deferred tax assets due to the effect of tax reform, and a year-on-year increase in total income taxes of ¥1.486 billion.
Business performance by segment was as follows. Ordinary income from banking business increased ¥105 million year on year to ¥44.383 billion, while its segment profit increased ¥1.812 billion to ¥12.440 billion. Ordinary income from leasing business increased ¥613 million year on year to ¥9.027 billion, while its segment profit decreased ¥120 million to ¥320 million. Ordinary income from credit guarantee and credit card business decreased ¥293 million year on year to ¥2.010 billion, while its segment profit decreased ¥263 million to ¥873 million. Ordinary income from other business segment decreased ¥135 million year on year to ¥2.287 billion, while its segment profit decreased ¥51 million to ¥97 million.
The consolidated capital adequacy ratio (under Japanese standards) at the end of FY2014 dropped 0.49 percentage points from the end of FY2013 to 8.42%.
Business Performance (Consolidated)

6
We believe it is our practice of this corporate philosophy that enables us to realize region-based financing. We
aim to fulfill our obligation as a regional financial institution by actively responding to the financing needs of
small and medium enterprises, individual businesses owners, and also individual customers of the region, to
provide a smooth supply of financing, while offering management support to the small and medium enterprises in
the region and actively contributing to the revitalization of the region’s economy.
In promoting region-based financing, the Bank takes a medium- to long-term outlook while continuously
pushing forward with the Bank-wide initiatives of (1) providing consulting functions to client companies, (2)
actively participating in region-wide revitalization, and (3) actively transmitting information to the region and
customers. We believe these initiatives will lead to expansion of the Bank’s customer base, and improvement in
the Bank’s profitability and financial soundness.
In its efforts to improve the management of small and medium enterprises, etc. and revitalize the region, the
Bank ensures coordination between Head Office and Branches and utilizes and cooperates with external
organizations and experts. In this way we are offering systems that provide appropriate consulting functions for
the management issues faced by our small and medium enterprise customers. Moreover, we have received
accreditation under the SME Business Capabilities Enhancement Support Act as a Keiei kakushintou shien kikan.
Basic Rationale Behind Promoting Region-Based Financing
Corporate Philosophy
Moving Forward with the Region, with Heartfelt Kindness Toward Customers
Provision of Systems Offering Management Support for Small and Medium Enterprises

7
Support for Medical Treatment and Nursing Care Sectors
We are providing consulting functions to clients in this sector by allocating 21 Medical Care
Promotion Leaders to branches in areas with many medical care and nursing care operators and
cooperating with medical care related consultancy firms and tax accountancy firms with strengths in the
medical care sector.
Support for Agri-food Businesses
Through agricultural-commercial-
industrial alliances we are working on
initiatives to revitalize agri-food
businesses such as by assigning
experts in agriculture, a major
industry of Chiba Prefecture, to the
Business Administration Division,
providing support for the
development and sales channel
creation of new products through
public subsidies, and providing
support for the establishment of
agricultural corporations.
Support for Business Succession
From April 2014, we now have business succession experts in the Business Administration Division
and are actively engaged in business succession and M&A measures for owner companies in Chiba.
We are also jointly holding business succession seminars with Chiba Industry Advancement Center
and carrying out other activities in cooperation with specialist organizations. Initiatives to support development of next-generation managers
The Chiba Kogin “Keiei juku” was established in September 2004 as an initiative to provide
mentorship for local companies and support the training of successor managers. We regularly hold
observation meetings and seminars to impart
a wide range of management viewpoints. Thus far,
we have provided learning opportunities to more than
200 participants, and from May 2015, we began
activities for our sixth class of students.
Assistance to deploy overseas operations
The Bank is actively developing support for expansion to the Southeast Asian countries (ASEAN)
that are undergoing rapid economic growth, and other globalization needs.
Through establishing cooperation with external functions, we are providing information related to the
overseas investment environment, and introducing experts and consultants and holding business
seminars and the like for our corporate clients who are considering expanding their businesses overseas
or extending their sales channels.
Moreover, we are constructing systems that can respond to inquiries concerning financing and loan
guarantees for overseas business expansion.

8
(1) Consolidated Balance Sheets (Millions of yen) (Thousands of
U.S. dollars)*
As of March 31, 2014
As of March 31, 2015
As of March 31, 2015
Assets
Cash and due from banks ¥78,146 ¥62,590 $520,412
Call loans and bills bought 5,000 – –
Monetary claims bought 1,327 747 6,211
Trading account securities 110 128 1,064
Securities 521,051 553,652 4,603,409
Loans and bills discounted 1,720,148 1,822,154 15,150,528
Foreign exchanges 2,823 3,232 26,873
Other assets 28,762 28,991 241,049
Tangible fixed assets 20,155 19,799 164,621
Buildings, net 6,608 6,485 53,920
Land 10,937 10,934 90,912
Leased assets, net 50 39 324
Construction in progress – 7 58
Other tangible fixed assets 2,558 2,332 19,390
Intangible fixed assets 2,763 2,469 20,529
Software 2,321 2,043 16,987
Leased assets 52 37 308
Other intangible fixed assets 389 389 3,234
Deferred tax assets 16,756 8,098 67,332
Customers’ liabilities for acceptances and guarantees 14,374 13,702 113,927
Allowance for loan losses (13,526) (12,847) (106,818)
Total assets 2,397,895 2,502,720 20,809,179
Consolidated Financial Statements

9
(Millions of yen) (Thousands of U.S. dollars)*
As of March 31, 2014
As of March 31, 2015
As of March 31, 2015
Liabilities
Deposits 2,199,040 2,269,118 18,866,866
Negotiable certificates of deposit 8,540 12,200 101,438
Call money and sale draft – 2,405 19,997
Borrowed money 19,312 37,821 314,467
Foreign exchanges 34 13 108
Other liabilities 20,367 20,118 167,274
Net defined benefit liability 8,672 6,999 58,194
Provision for directors’ retirement benefits 174 56 466
Provision for reimbursement of deposits 884 1,016 8,448
Acceptances and guarantees 14,374 13,702 113,927
Total liabilities 2,271,401 2,363,451 19,651,210
Net assets
Capital stock 57,941 57,941 481,758
Capital surplus 4,566 2,792 23,214
Retained earnings 55,819 59,011 490,654
Treasury shares (66) (69) (574)
Total shareholders’ equity 118,260 119,677 995,069
Valuation difference on available-for-sale securities 7,363 17,433 144,949
Remeasurements of defined benefit plans (1,251) (301) (2,503)
Total accumulated other comprehensive income 6,112 17,131 142,438
Subscription warrant – 15 125
Minority interests 2,120 2,444 20,321
Total net assets 126,493 139,269 1,157,970
Total liabilities and net assets ¥2,397,895 ¥2,502,720 $20,809,179
* Please refer to the note 1 on page 3.

10
(2) Consolidated Statements of Income and Consolidated Statements of Comprehensive Income
(Consolidated Statements of Income)
(Millions of yen) (Thousands of U.S. dollars)*
Fiscal year endedMarch 31, 2014
Fiscal year ended March 31, 2015
Fiscal year endedMarch 31, 2015
Ordinary income ¥52,555 ¥53,262 $442,854
Interest income 30,402 30,396 252,731
Interest on loans and discounts 25,399 24,849 206,610
Interest and dividends on securities 4,564 5,053 42,014
Interest on call loans and bills bought 65 50 416
Interest on deposits with banks 157 223 1,854
Other interest income 215 219 1,821
Fees and commissions 8,897 9,804 81,517
Other ordinary income 2,208 987 8,207
Other income 11,046 12,074 100,391
Recoveries of written off claims 1,711 1,760 14,634
Other 9,335 10,313 85,749
Ordinary expenses 40,691 40,079 333,242
Interest expenses 1,342 1,386 11,524
Interest on deposits 1,078 1,080 8,980
Interest on negotiable certificates of deposit 4 20 166
Interest on call money and bills sold 0 2 17
Interest on payables under securities lending transactions
0 10 83
Interest on borrowings and rediscounts 246 249 2,070
Other interest expenses 11 22 183
Fees and commissions payments 2,699 2,783 23,140
Other ordinary expenses 218 246 2,045
General and administrative expenses 25,162 25,475 211,815
Other expenses 11,268 10,188 84,709
Provision of allowance for loan losses 977 17 141
Other 10,290 10,170 84,560
Ordinary profit 11,864 13,182 109,603
Extraordinary losses 88 118 981
Loss on disposal of non-current assets 31 61 507
Impairment loss 56 56 466
Income before income taxes and minority interests 11,776 13,064 108,622
Income taxes - current 843 436 3,625
Income taxes - deferred 2,059 3,953 32,868
Total income taxes 2,903 4,389 36,493
Income before minority interests 8,873 8,674 72,121
Minority interests in income 317 232 1,929
Net income ¥8,555 ¥8,442 $70,192
* Please refer to the note 1 on page 3.
11
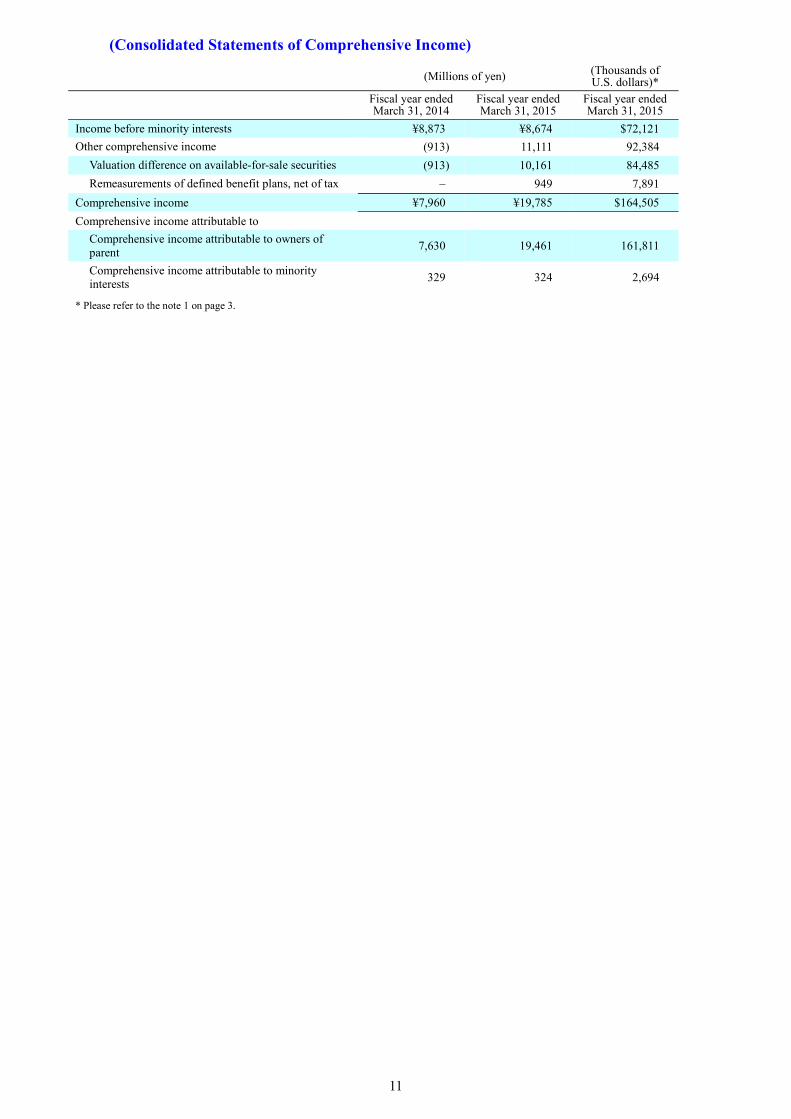
(Consolidated Statements of Comprehensive Income)
(Millions of yen) (Thousands of U.S. dollars)*
Fiscal year endedMarch 31, 2014
Fiscal year ended March 31, 2015
Fiscal year endedMarch 31, 2015
Income before minority interests ¥8,873 ¥8,674 $72,121
Other comprehensive income (913) 11,111 92,384
Valuation difference on available-for-sale securities (913) 10,161 84,485
Remeasurements of defined benefit plans, net of tax – 949 7,891
Comprehensive income ¥7,960 ¥19,785 $164,505
Comprehensive income attributable to
Comprehensive income attributable to owners of parent
7,630 19,461 161,811
Comprehensive income attributable to minority interests
329 324 2,694
* Please refer to the note 1 on page 3.

12
(3) Consolidated Statements of Changes in Equity Fiscal year ended March 31, 2014
(Millions of yen)
Shareholders’ equity
Capital stock Capital surplus Retained earnings Treasury shares Total shareholders’ equity
Balance at beginning of current period 57,941 64,792 48,991 (64) 171,661
Changes of items during period
Dividends of surplus (1,727) (1,727)
Net income 8,555 8,555
Purchase of treasury shares (60,228) (60,228) Retirement of treasury shares (60,226) 60,226 – Net changes of items other than shareholders’ equity
Total changes of items during period – (60,226) 6,827 (1) (53,400) Balance at end of current period 57,941 4,566 55,819 (66) 118,260
Accumulated other comprehensive income
Subscription warrant
Minority interests Total net assets
Valuation difference on available-for-sale securities
Remeasure-ments of defined benefit plans
Total accumulated other comprehensive income
Balance at beginning of current period
8,289 – 8,289 – 1,790 181,741 Changes of items during period
Dividends of surplus (1,727)
Net income 8,555
Purchase of treasury shares (60,228) Retirement of treasury shares – Net changes of items other than shareholders’ equity (925) (1,251) (2,177) – 329 (1,847)
Total changes of items during period (925) (1,251) (2,177) – 329 (55,247) Balance at end of current period 7,363 (1,251) 6,112 – 2,120 126,493

13
Fiscal year ended March 31, 2015 (Millions of yen)
Shareholders’ equity
Capital stock Capital surplus Retained earnings Treasury shares Total shareholders’ equity
Balance at beginning of current period 57,941 4,566 55,819 (66) 118,260
Depends on changing in the bill policy 238 238
Balance at beginning of current period on changing in the bill policy
57,941 4,566 56,057 (66) 118,499
Changes of items during period
Dividends of surplus (2,204) (2,204)
Net income 8,442 8,442
Purchase of treasury shares (5,059) (5,059) Retirement of treasury shares (5,056) 5,056 – From retained earnings to capital surplus 3,283 (3,283) – Net changes of items other than shareholders’ equity
Total changes of items during period – (1,773) 2,953 (2) 1,177
Balance at end of current period 57,941 2,792 59,011 (69) 119,677
Accumulated other comprehensive income
Subscription warrant
Minority interests Total net assets
Valuation difference on available-for-sale securities
Remeasure-ments of defined benefit plans
Total accumulated other comprehensive income
Balance at beginning of current period 7,363 (1,251) 6,112 – 2,120 126,493
Depends on changing in the bill policy
238 Balance at beginning of current period on changing in the bill policy
7,363 (1,251) 6,112 – 2,120 126,732
Changes of items during period
Dividends of surplus (2,204)
Net income 8,442
Purchase of treasury shares (5,059)
Retirement of treasury shares – From retained earnings to capital surplus – Net changes of items other than shareholders’ equity
10,069 949 11,019 15 324 11,359 Total changes of items during period
10,069 949 11,019 15 324 12,537 Balance at end of current period
17,433 (301) 17,131 15 2,444 139,269

14
Fiscal year ended March 31, 2015 (Thousands of U.S. dollars)*
Shareholders’ equity
Capital stock Capital surplus Retained earnings Treasury shares Total shareholders’ equity
Balance at beginning of current period 481,758 37,965 464,114 (549) 983,288
Depends on changing in the bill policy 1,979 1,979
Balance at beginning of current period on changing in the bill policy
481,758 37,965 466,093 (549) 985,275
Changes of items during period
Dividends of surplus (18,325) (18,325)
Net income 70,192 70,192
Purchase of treasury shares (42,064) (42,064) Retirement of treasury shares (42,039) 42,039 –
From retained earnings to capital surplus 27,297 (27,297) –
Net changes of items other than shareholders’ equity
Total changes of items during period – (14,742) 24,553 (17) 9,786
Balance at end of current period 481,758 23,214 490,654 (574) 995,069
Accumulated other comprehensive income
Subscription warrant
Minority interests Total net assets
Valuation difference on available-for-sale securities
Remeasure-ments of defined benefit plans
Total accumulated other comprehensive income
Balance at beginning of current period 61,221 (10,402) 50,819 – 17,627 1,051,742
Depends on changing in the bill policy
1,979 Balance at beginning of current period on changing in the bill policy
61,221 (10,402) 50,819 – 17,627 1,053,729
Changes of items during period
Dividends of surplus (18,325)
Net income 70,192
Purchase of treasury shares (42,064)
Retirement of treasury shares –
From retained earnings to capital surplus –
Net changes of items other than shareholders’ equity
83,720 7,891 91,619 125 2,694 94,446 Total changes of items during period
83,720 7,891 91,619 125 2,694 104,240 Balance at end of current period
144,949 (2,503) 142,438 125 20,321 1,157,970
* Please refer to the note 1 on page 3.

15
(4) Consolidated Statements of Cash Flows
(Millions of yen) (Thousands of U.S. dollars)*
Fiscal year endedMarch 31, 2014
Fiscal year ended March 31, 2015
Fiscal year endedMarch 31, 2015
Cash flows from operating activities
Income before income taxes and minority interests ¥11,776 ¥13,064 $108,622
Depreciation 2,240 2,247 18,683
Impairment loss 56 56 466
Increase (decrease) in allowance for loan losses (666) (679) (5,646)
Increase (decrease) in net defined benefit liability 587 (1,304) (10,842)
Increase (decrease) in provision for directors’ retirement benefits
36 (118) (981)
Increase (decrease) in provision for reimbursement of deposits
185 131 1,089
Gain on fund management (30,402) (30,396) (252,731)
Financing expenses 1,342 1,386 11,524
Loss (gain) related to securities (1,676) (834) (6,934)
Foreign exchange losses (gains) (146) (250) (2,079)
Loss (gain) on disposal of non-current assets 31 61 507
Net decrease (increase) in trading account securities 21 (18) (150)
Net decrease (increase) in loans and bills discounted (65,177) (102,006) (848,142)
Net increase (decrease) in deposit 45,773 70,078 582,672
Net increase (decrease) in negotiable certificates of deposit
3,370 3,660 30,432
Net increase (decrease) in borrowed money (excluding subordinated borrowings)
3,248 18,509 153,895
Net decrease (increase) in deposit (excluding deposit paid to Bank of Japan)
1,132 (1,124) (9,346)
Net decrease (increase) in call loans 82,179 5,580 46,396
Net increase (decrease) in call money – 2,405 19,997
Net decrease (increase) in foreign exchanges - assets (654) (408) (3,392)
Net increase (decrease) in foreign exchanges - liabilities
10 (21) (175)
Proceeds from fund management 31,300 31,060 258,252
Payments for finance (1,413) (1,446) (12,023)
Other, net 4,332 (2,261) (18,799)
Subtotal 87,486 7,370 61,279
Income taxes paid (679) (498) (4,141)
Net cash provided by (used in) operating activities 86,807 6,871 57,130
Cash flows from investing activities
Purchase of securities (142,884) (114,681) (953,530)
Proceeds from sales of securities 93,160 64,608 537,191
Proceeds from redemption of securities 70,936 34,990 290,929
Purchase of tangible fixed assets (1,158) (915) (7,608)
Purchase of intangible assets (765) (540) (4,490)
Net cash provided by (used in) investing activities 19,288 (16,538) (137,507)

16
(Millions of yen) (Thousands of U.S. dollars)*
Fiscal year endedMarch 31, 2014
Fiscal year ended March 31, 2015
Fiscal year endedMarch 31, 2015
Cash flows from financing activities
Decrease in subordinated borrowings (5,500) – –
Cash dividends paid (1,727) (2,204) (18,325)
Purchase of treasury shares (60,228) (5,059) (42,064)
Net cash provided by (used in) financing activities (67,456) (7,264) (60,397)
Effect of exchange rate change on cash and cash equivalents
146 250 2,079
Net increase (decrease) in cash and cash equivalents 38,786 (16,680) (138,688)
Cash and cash equivalents at beginning of period 32,839 71,626 595,543
Cash and cash equivalents at end of period ¥71,626 ¥54,946 $456,855
* Please refer to the Note 1 on page 3.
17
Chiba Kogin Card Service Co., Ltd. Main business line: Credit card business, guarantees of housing and other loans
Established: April 1979
Capital: ¥100 million
Equity share of the Bank and subsidiaries: 100.0%
Chiba Kogin Business Service Co., Ltd. Main business line: Clerical operations for the Bank
Established: January 1986
Capital: ¥10 million
Equity share of the Bank and subsidiaries: 100.0%
Chiba General Lease Co., Ltd. Main business line: Leasing, loans
Established: December 1982
Capital: ¥90 million
Equity share of the Bank and subsidiaries: 26.1%
Chiba Kogin Computer Soft Co., Ltd. Main business line: Development, sale and maintenance of computer systems
Established: July 1991
Capital: ¥30 million
Equity share of the Bank and subsidiaries: 55.0%
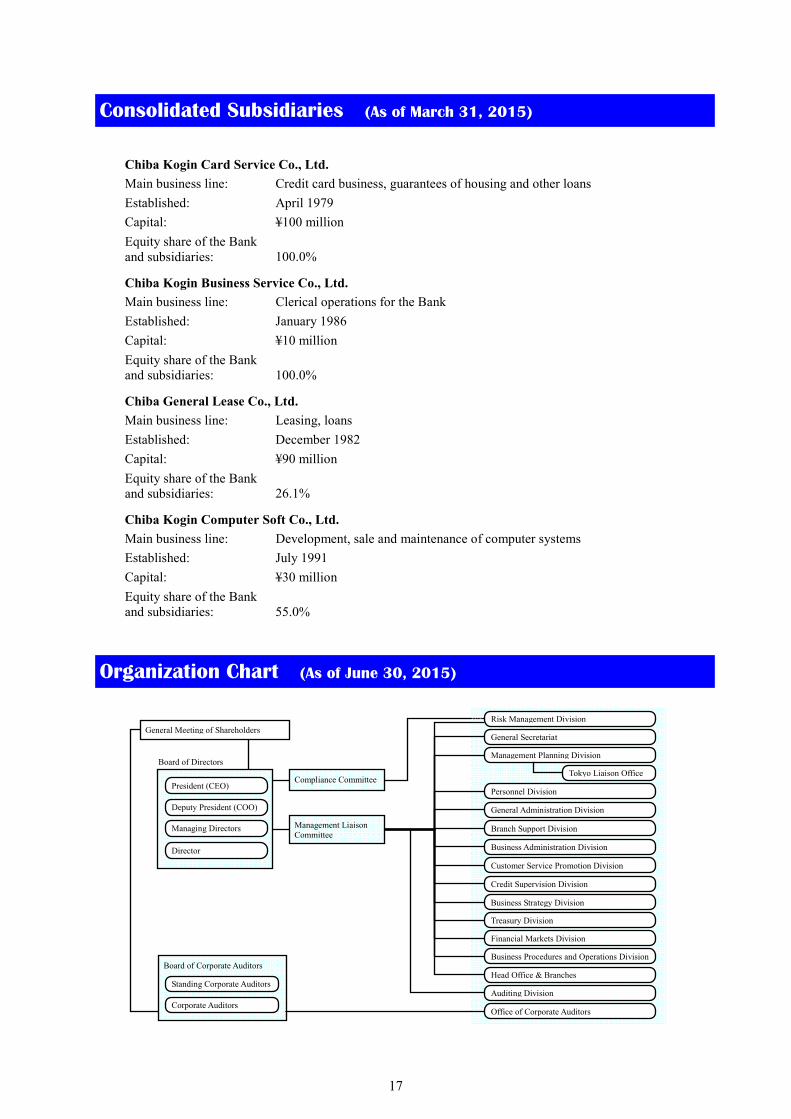
General Meeting of Shareholders
Board of Directors
President (CEO)
Deputy President (COO)
Managing Directors
Board of Corporate Auditors
Standing Corporate Auditors
Corporate Auditors
Compliance Committee
Management Liaison Committee
Financial Markets Division
Risk Management Division
General Secretariat
Management Planning Division
Tokyo Liaison Office
Personnel Division
General Administration Division
Branch Support Division
Business Administration Division
Customer Service Promotion Division
Credit Supervision Division
Treasury Division
Business Procedures and Operations Division
Head Office & Branches
Auditing Division
Office of Corporate Auditors
Business Strategy Division
Director
Consolidated Subsidiaries (As of March 31, 2015)
Organization Chart (As of June 30, 2015)

18
President (CEO): Shunichi Aoyagi
Deputy President (COO): Seiji Umemura
Managing Directors: Satoshi Hoshino Shigeo Okamoto
Director (Independent Director): Hisako Toya
Managing Executive Officers: Shigeto Katoh Yoshiaki Tateno Hironari Itoh
Standing Corporate Auditors: Yasumi Inaba Kazuto Matsui
Corporate Auditors (Independent Corporate Auditors): Nobuya Suzuki Takahiro Itsukaichi
Executive Officers: Ryu-ichiro Ochi Masakazu Ohba Yasuo Toda Shigeki Ikeda Hitoshi Yokoyama Hitoshi Umeda Akio Shimoma Katsumi Shirai
Name Number of Shares
Owned Proportion of Total
Shares (%)
Mizuho Bank, Ltd. 9,583,910 18.91
Japan Trustee Services Bank, Ltd. (trust account) 1,254,000 2.47
Sakamoto Shiryo Co., Ltd. 1,249,700 2.46
Meiji Yasuda Life Insurance Co. 1,158,200 2.28
Sompo Japan Nipponkoa Insurance Inc. 942,000 1.85
Mizuho Trust & Banking Co., Ltd. 926,800 1.82
The Master Trust Bank of Japan, Ltd. (trust account) 897,400 1.77
Chiba Kogyo Bank Employee Ownership 793,017 1.56
Japan Trustee Services Bank, Ltd. (trust account-9) 744,600 1.46
Japan Trustee Services Bank, Ltd. (trust account-4) 681,500 1.34
Board of Directors, Corporate Auditors and Executive Officers (As of June 30, 2015)
Major Shareholders (Common Stock) (As of March 31, 2015)

19
Date of Establishment: January 18, 1952 (Start of Business: March 3, 1952)
Head Office: 1-2, Saiwaicho 2-chome, Mihama-ku, Chiba 261-0001 Telephone: +81-43-243-2111
Financial Market Division: 2-2, Saiwaicho 2-chome, Mihama-ku, Chiba 261-0001 Telephone: +81-43-243-0852 SWIFT Address: CHIK JP JT Fax Number: +81-43-243-0235
Network
Head Office and Branches: 72
Number of Employees: 1,271
Stock Exchange Listing: 1st Section of Tokyo Stock Exchange
Paid-in Capital: ¥57,941 million
Number of Common Stock: Authorized: 296,000 thousand shares Issued and outstanding: 50,722,045 shares
Number of Common Stock Shareholders: 10,395
The Chiba Kogyo Bank, Ltd. is an affiliate under the equity method of Mizuho Financial Group, Inc.
Name Location Business category Capital
(Millions of yen)
Founded Percentage of voting rights of the Bank
Mizuho Financial Group, Inc.
Chiyoda-ku, Tokyo
Holding company for financial service companies
2,255,404Jan. 8, 2003
20.8% (20.8%)
Note: Figures in parentheses in the column “Percentage of voting rights of the Bank” represent the Bank’s shares held by subsidiaries of Mizuho Financial Group, Inc.
* This document follows the Annual Select format for English-language disclosure developed by ZAIHON, INC. to increase the level of convenience of investors outside Japan based on Japanese-language statutory disclosure material, timely disclosure material prescribed by securities exchanges and voluntarily disclosed IR material. Annual Select is a registered trademark of ZAIHON, INC. Reproduction or copying without prior permission is prohibited.
* While every best effort has been made to provide a translation meeting the quality standards required of professionals, the Bank does not guarantee it is 100% accurate. Therefore, please verify the original Japanese text for any final judgments made based on this information.
Corporate Outline (As of March 31, 2015)