content-based assessments 6 - pearson...
TRANSCRIPT

project 6h: operations Chart | Excel 1
6E
Xc
ElprojECt FilEs
For Project 6H, you will need the following file:
e06H_Operations_Chart
You will save your workbook as:
Lastname_Firstname_6H_Operations_Chart
Open the file e06H_Operations_Chart, and then save the file in your Excel Chapter 6 folder as Lastname_Firstname_6H_Operations_Chart Edit the diagram so that employees whose job titles relate to College Recruiting and Internships fall under their respective areas. You might find it useful to open the Text Pane. Add your name and course information to the document properties, and include recruiting operations, internship operations as the tags. Insert the file name in the footer, save your file, and then print or submit your worksheet electronically as directed by your instructor.
End | You have completed project 6h
GO! Fix It project 6h Operations chartApply a combination of the 6A and 6B skills.
cOntent-Based assessments

2 Excel | project 6i: advertisers
projECt FilEsFor Project 6I, you will need the following file:
e06I_Advertisers
You will save your workbook as:
Lastname_Firstname_6I_Advertisers
Each Job Fair event attracts numerous advertisers who place ads inside the event venue and on the various forms and handouts used by both the employers with booth space and the attendees. From your student files, open the file e06I_Advertisers, and then save it in your Excel Chapter 6 folder as Lastname_Firstname_6I_Advertisers By using the skills you have practiced, create the worksheet shown in Figure 6.49. Include sparklines showing the high point, a line chart with a trendline to track the advertisers at the Fort Worth location, and format the chart as shown. Insert the file name in the footer, add appropriate information to the document properties including the tag advertisers and submit as directed by your instructor.
projECt rEsults
GO! Make It project 6I advertisers
End | You have completed project 6i
Apply a combination of the 6A and 6B skills.
FigurE 6.49
cOntent-Based assessments

project 6j: sponsors | Excel 3
6E
Xc
ElprojECt FilEs
For Project 6J, you will need the following file:
e06J_Sponsors
You will save your workbook as:
Lastname_Firstname_6J_Sponsors
Open the file e06J_Sponsors and save it as Lastname_Firstname_6J_Sponsors Using the data for all locations, create a 3-D column chart on a new sheet, to show sponsors by location. Format the chart attractively by applying varying colors of solid fill to the chart area, the plot area, and the floors and walls of the chart. Include a vertical axis title and a chart title. Insert the file name in the footer of both sheets, add appropriate information to the document properties including the tag sponsors and submit as directed by your instructor.
GO! Solve It project 6J sponsors
End | You have completed project 6j
Apply a combination of the 6A and 6B skills.
perf
orm
ance
Cri
teri
a
performance level
Exemplary proficient developing
Create a 3-d Column Chart
Location and year data is appropriately used to create a 3-d column chart.
partial location and year data is used to create a 3-d column chart.
Location and year data is not used appropriately to create a 3-d column chart.
Format a 3-d Column Chart
the chart is attractively formatted with a variety of colors for the chart elements. the chart contains a chart title and a rotated vertical axis title.
the chart is attractively formatted with a variety of colors for some of the chart elements. the chart contains some but not all of the correct information for a chart title and a rotated vertical axis.
the chart is not attractively formatted with a variety of colors for the chart elements. the chart does not contain a chart title or a rotated vertical axis title.
cOntent-Based assessments
4 Excel | rubric
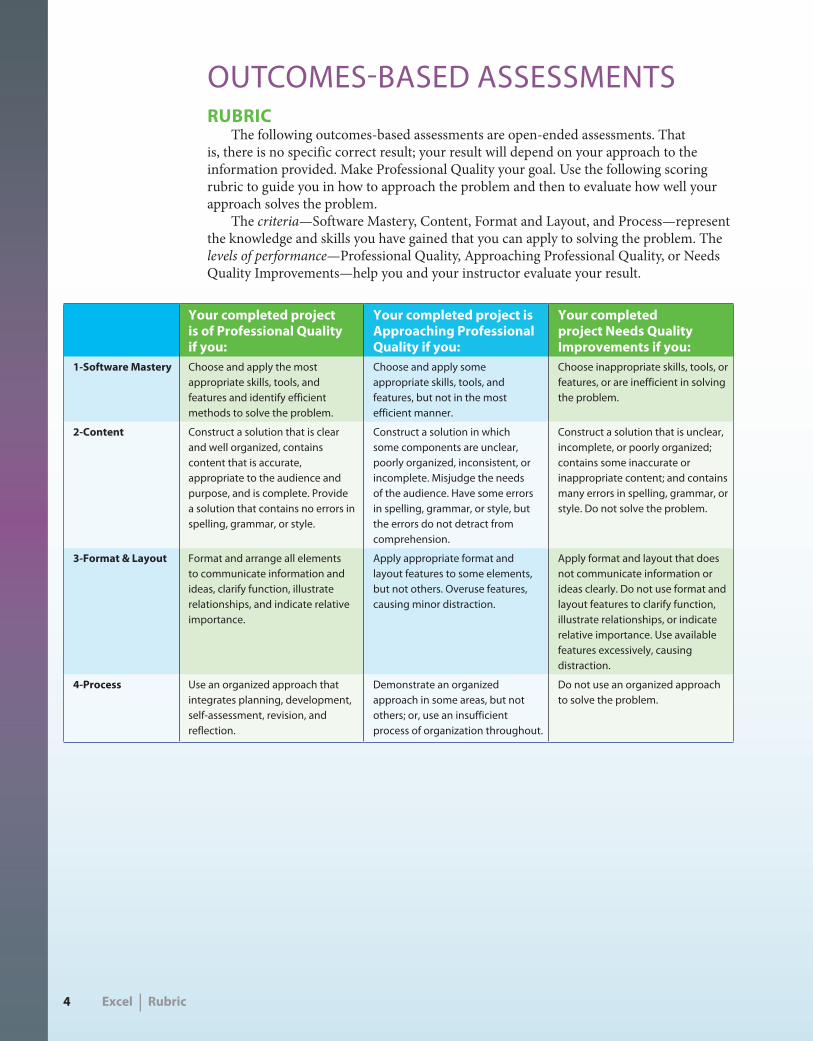
OutcOmes-Based assessmentsrubriC
The following outcomes-based assessments are open-ended assessments. That is, there is no specific correct result; your result will depend on your approach to the information provided. Make Professional Quality your goal. Use the following scoring rubric to guide you in how to approach the problem and then to evaluate how well your approach solves the problem.
The criteria—Software Mastery, Content, Format and Layout, and Process—represent the knowledge and skills you have gained that you can apply to solving the problem. The levels of performance—Professional Quality, Approaching Professional Quality, or Needs Quality Improvements—help you and your instructor evaluate your result.
Your completed project is of professional Quality if you:
Your completed project is approaching professional Quality if you:
Your completed project needs Quality improvements if you:
1-software Mastery choose and apply the most appropriate skills, tools, and features and identify efficient methods to solve the problem.
choose and apply some appropriate skills, tools, and features, but not in the most efficient manner.
choose inappropriate skills, tools, or features, or are inefficient in solving the problem.
2-Content construct a solution that is clear and well organized, contains content that is accurate, appropriate to the audience and purpose, and is complete. provide a solution that contains no errors in spelling, grammar, or style.
construct a solution in which some components are unclear, poorly organized, inconsistent, or incomplete. misjudge the needs of the audience. have some errors in spelling, grammar, or style, but the errors do not detract from comprehension.
construct a solution that is unclear, incomplete, or poorly organized; contains some inaccurate or inappropriate content; and contains many errors in spelling, grammar, or style. do not solve the problem.
3-Format & layout Format and arrange all elements to communicate information and ideas, clarify function, illustrate relationships, and indicate relative importance.
apply appropriate format and layout features to some elements, but not others. Overuse features, causing minor distraction.
apply format and layout that does not communicate information or ideas clearly. do not use format and layout features to clarify function, illustrate relationships, or indicate relative importance. use available features excessively, causing distraction.
4-process use an organized approach that integrates planning, development, self-assessment, revision, and reflection.
demonstrate an organized approach in some areas, but not others; or, use an insufficient process of organization throughout.
do not use an organized approach to solve the problem.

project 6M: location list | Excel 5
EX
cE
l
6projECt FilEsFor Project 6M, you will need the following file:
e06M_Locations
You will save your workbook as:
Lastname_Firstname_6M_Locations
From your student files, open the file e06M_Locations, and then save it in your Excel Chapter 6 folder as Lastname_Firstname_6M_Locations Select an appropriate SmartArt graphic to visually indicate the cities where Job Fairs will be held, which include Dallas, Fort Worth, Arlington, Plano, Irving, Carrollton, Denton, and McKinney. Arrange the cities in alphabetical order, format the graphic attractively. Insert the file name in the footer, add appropriate information to the document properties including the tags fair locations and submit as directed by your instructor.
End | You have completed project 6M
GO! Think project 6m Location List
OutcOmes-Based assessments

6 Excel | project 6n: job Finding
You and GO! project 6n Job Finding
projECt FilEsFor Project 6N, you will need the following file:
New blank Excel workbook
You will save your workbook as:
Lastname_Firstname_6N_Job_Finding
In this chapter, you practiced using Excel to create SmartArt graphics. Think about the steps involved in searching for a job. If necessary, research some Internet sites for assistance. For example, go to www.bls.gov and type Job Search Methods in the search box. Then, create a visual guide to the job search steps or methods using one of the SmartArt graphics. Save the file in your Excel Chapter 6 folder as Lastname_Firstname_6N_Job_Finding Format the worksheet attractively for printing, insert the file name in the footer, add appropriate information to the document properties including the tags job finding and submit as directed by your instructor.
End | You have completed project 6n
Build from Scratch
OutcOmes-Based assessments