content area: mathematics - steve willott's math help …stevewillott.com/lu edu 331 and...
TRANSCRIPT

Francis Howell School DistrictMission Statement
Francis Howell School District is a learning community where all students reach their full potential.
Vision Statement
Francis Howell School District is an educational leader that builds excellence through a collaborative culture that values students, parents, employees, and the community as partners in learning.
Values
Francis Howell School District is committed to: Providing a consistent and comprehensive education that fosters high levels of academic achievement for all Operating safe and well-maintained schools Promoting parent, community, student, and business involvement in support of the school district Ensuring fiscal responsibility Developing character and leadership
Francis Howell School District Graduate Goals
Upon completion of their academic study in the Francis Howell School District, students will be able to:1. Gather, analyze and apply information and ideas.2. Communicate effectively within and beyond the classroom.3. Recognize and solve problems.4. Make decisions and act as responsible members of society.
Mathematics Graduate Goals
Upon completion of their mathematics study in the Francis Howell School District, students will be able to:1. Communicate mathematically2. Reason mathematically3. Make mathematical connections4. Use mathematical representations to model and interpret practical situations
FHSD Academics LRP Algebra I BOE Approved May 2008Page 1

Mathematics Rationale for Algebra I
In order to be effective citizens in the 21st century, students need to understand mathematics. Students often encounter problem situations that require reasoning, computation, and communication. We regularly study the most efficient methods for reaching solutions, but also realize that examining different solution methods help develop more flexible problem solving skills. The instruction and assessment is focused on instilling students with enduring understandings of mathematics. Algebra I seeks to help students become efficient users of algorithms who can articulate their thinking and be able to apply mathematics in different contexts.
Course Description for Algebra I
Students will learn to think logically and symbolically. Using experimentation and reasoning, students will develop the knowledge necessary to create and manipulate symbolic rules. Topics covered will include, but not be limited to, patterns, ratios and proportions, linear equations and inequalities, and quadratic and exponential models.
Curriculum Team
Peggy Cradick-BarnwellSue Dodson-Hollenbeck
Paul Twombly-BryanMelinda Brock-Howell Middle
Diana Unrein-SaegerDanna Tedder-FHCKen Benson-FHHS
Patricia Bartell-FHNDonna Proctor-FHCLaura Bocek-FHHSSue Herwick-FHN
Secondary Content Leader Lisa PirrungDirector of Student Learning Sharon WallChief Academic Office Dr. Pam SloanSuperintendent Dr. Renee Schuster
FHSD Academics LRP Algebra I BOE Approved May 2008Page 2

ALGEBRA 1 COURSE MAP - Revised May 2010Semester 1 CALENDAR
Chp Sections Title DaysSEM 1: 84
days CLE
Incorporate Chapter Zero within the book where applicable and not as an independent chapter 1 FOUNDATIONS FOR ALGEBRA 1-1 Variables and Expressions N1B, 2D 1-2 Add/Subtract Real Numbers N1B, 2D 1-3 Mult/Div Real Numbers N1B, 2D 1-4 Powers and Exponents N2B 1-5 Square Roots & Real Numbers N1A, 1B 1-6 Order of Operations of operations A2B 1-7 Simplify Expressions A2B 1-8 Intro to Functions ~10 days 10 days A2B
2 SOLVING EQUATIONS 2-1 Solve by Add/Sub A2A, 2C 2-2 Solve by Mult/Div A2A, 2C 2-3 Solve 2-step and Multi-step A2A, 2C
2-4 Solve Variable Both Sides A2A, 2C; G1B
2-5 Solve for a Variable G1B extension (p.148) Solve Absolute Value Equations ~ 9 days 19 days A2A, 2C 0-11 Decimals, Fractions, and Percents N1A 2-6 Rates, Ratios, and Proportions M2E 2-7 Applications of Proportions N3E; G1B 2-8 Percents N1A 2-9 Applications of Percents A3A 2-10 Percent Increase and Decrease ~ 9 days 28 days A3A 3 INEQUALITIES 3-1 Graph and Write Inequalities G4B 3-2 Solve Inequalities Add/Sub A2A, 2C 3-3 Solve Inequalities Mult/Div A2A, 2C 3-4 Solve 2-step and Multi-step Inequalities A2A, 2C 3-5 Solve Inequalities w/Variables on Both Sides A2A, 2C 3-6 Solve Compound Inequalities ~10 days 38 days A2A, 2C
FHSD Academics LRP Algebra I BOE Approved May 2008Page 3

4 FUNCTIONS 4-1 Graphing Relationships G4B 4-2 Relations and Functions A2A 4-3 Writing Functions A2A 4-4 Graphing Functions G4B 4-5 Scatter Plots and Trend Lines D2C, 3A 4-6 Pattern Recognition (Arithmetic Sequence) ~9 days 47 days A1B,1C 5 LINEAR FUNCTIONS 5-1 Identifying Linear Functions A1D, 1E 5-2 Using Intercepts A1D, 1E, 4A 5-3 Rates of Change and Slope A4A 5-4 Slope Formula A4A 5-6 Slope-Intercept Form A3A 5-7 Point-Slope Form A3A 5-8 Slopes of Parallel and Perpendicular Lines A3A 5-9 Transforming Linear Functions ~15 days 62 days A1D, 1E
10 DATA ANALYSIS & PROBABILITY 0-2 Tree Diagrams (Counting Principle) D1A 10-1 Organizing and Displaying Data D1C 10-2 Frequency and Histograms D1C 10-3 Data Distributions D1A, 2A 10-4 Misleading Graphs and Statistics D1C 10-5 Experimental Probability (8th grade only) D1A 10-6 Theoretical Probability (8th grade only) ~ 9 days 71 days D1A
Semester 2 CALENDAR
Chp Sections Title DaysSEM 2: 90
days CLE 6 SYSTEMS OF EQUATIONS & INEQUALITIES 6-1 Solve Systems by Graphing A2D 6-2 Solve Systems by Substitution A2D 6-3 Solve Systems by Elimination A2D 6-4 Solve Special Systems A2D 6-5 Solve Linear Inequalities A2C 6-6 Solve Systems of Linear Inequalities ~ 11 days 11 days A2D 7 EXPONENTS & POLYNOMIALS
FHSD Academics LRP Algebra I BOE Approved May 2008Page 4

7-1 Integer Exponents N2B 7-2 Powers of 10 and Scientific Notation N1C 7-3 Multiplication Properties of Exponents A2B 7-4 Division Properties of Exponents A2B 7-5 Polynomials A2B 7-6 Add/Subtract Polynomials A2B 7-7 Multiply Polynomials A2B 7-8 Special Products of Polynomials ~ 15 days 26 days A2B 8 FACTORING POLYNOMIALS 0-7 Prime and Composite Numbers N1D 0-8 Factoring N1D 0-9 GCF and LCM N1D 8-1 Factors and Greatest Common Factors N1D 8-2 Factoring by GCF A2B 8-3 Factoring ax² + bx + c; a = 1 A2B 8-4 Factoring ax² + bx + c; a ≠ 1 A2B 8-5 Factor Special Products A2B 8-6 Choosing a Factoring Method ~ 15 days 41 days A2B
11 EXPONENTIAL & RADICAL FUNCTIONS 11-1 Geometric Sequences A1B,1C 11-2 Exponential Functions A1E 11-3 Exponential Growth and Decay A3A 11-4 Linear, Quad, and Exponential Models ~ 6 days 47 days AlD, 1E, 3A 9 QUADRATIC FUNCTIONS & EQUATIONS 9-1 Identify Quadratic Functions A1D, 1E, 4A 9-2 Characteristics of Quadratic Functions A1D, 1E, 4A 9-3 Graph Quadratic Functions A1D, 1E, 4A 9-4 Transform Quadratic Functions A1D, 1E, 4A 9-5 Solve Quadratic Equations by Graphing A2C, 4A 9-6 Solve Quadratic Equations by Factoring A2C, 4A 9-7 Solve Quadratic Equations using Square Roots A2C,4A 9-9 Quadratic Formula and the Discriminant ~ 17 days 64 days
11 EXPONENTIAL & RADICAL FUNCTIONS 11-6 Radical Expressions 11-7 Add/Subtract Radical Expressions 11-8 multiply/divide radical expressions 11-9 Solve Radical Equations ~ 9 days 73 days
FHSD Academics LRP Algebra I BOE Approved May 2008Page 5

If time allows
12 RATIONAL FUNCTIONS & EQUATIONS 12-3 Simplify Rational Expressions 12-4 Multiply/Divide Rational Expressions 12-5 Add/Subtract Rational Expressions 12-6 Divide Polynomials 12-7 Solve Rational Equations ~ 10 days 83 days Covered throughout the course: Number & Operations 3D Algebraic Relationships 2A Geometric & Spatial Relationships 4B Measurement 2D
Content Area: Mathematics Course: Algebra I Strand: Number and Operations 1
Learner Objectives: Students will understand numbers, ways of representing numbers, relationships among numbers and number systems.
Concepts: A. Read, write and compare numbers
FHSD Academics LRP Algebra I BOE Approved May 2008Page 6

B. Represent and use rational numbersC. Compose and decompose numbers
Students Should Know Students Should Be Able to
Numbers belong to different sets Real Rational Whole Natural Integer Irrational
Rational numbers can be manipulated and ordered Operations Ordering-greater than , less than, equal to
Relations can be shown in multiple forms Tables Verbal Rules Equations Inequalities Graphs
Numbers can be transferred from one representation to another-algebraically, numerically, graphically, verbally
Compose and decompose Numbers and their relationships can be represented in multiple
forms Integers Fractions Decimals Percents Scientific Notation
Compare and order rational and irrational numbers, including finding their approximate locations on a number line (N1AA), MA 5, 1.10, DOK 1
Use real numbers and various models, drawing, etc. to solve problems (N1BA), MA 5, 3.3, DOK 2
Use a variety of representations to demonstrate an understanding of very large and very small numbers (N1CA), MA 5, 1.6, DOK 2
Instructional Support
Student Essential VocabularyReal Rational Irrational Integer Whole Natural
Scientific notation Inequality Decompose Compose
FHSD Academics LRP Algebra I BOE Approved May 2008Page 7

Sample Learning Activities Sample AssessmentsLearning Activity #1 :
Using the Venn diagram, have students place their number in the appropriate category. This activity may be given individually or in groups. Some examples of numbers are given.
-7 8 3.25 0
Activity’s AlignmentCLE N1AACONTENT MA 5 Mathematical systemsPROCESS 1.10 Apply information, ideas and skills
DOK 1
Assessment #1: Categorize each number into their correct system(s). Explain why the numbers b belongs to that system.
Directions: a) Circle each system that is applicable. b) Explain your reasoning.
a) Real Rational Whole Natural Integer Irrational
b)
a) Real Rational Whole Natural Integer Irrational
b)
3.25
a) Real Rational Whole Natural Integer Irrational
b)
Assessment’s Alignment
CLE N1AACONTENT MA 5 Mathematical systemsPROCESS 1.6 Discover/Evaluate relationships
1.10 Apply information, ideas and skillsDOK 2LEVEL OF Mastery level-85%
FHSD Academics LRP Algebra I BOE Approved May 2008Page 8
WHOLE NUMBERS
REAL NUMBERS
INTEGERS
NATURAL NUMBERS
IRRATIONALNUMBERS
RATIONAL NUMBERS

INSTRUCTIONAL STRATEGIES
Ques, questions and advance organizers
Learning Activity #2:
Order the following numbers and place them on a number line:103, 4, , 15, , 3.253
EXPECTATION
Assessment #2:
Rewrite the numbers from least to greatest. (no calculator)a. 7, , 6.1, , , 8.8, ,
Assessment’s AlignmentCLE N1AACONTENT MA 5 Mathematical systemsPROCESS 1.10 Apply information, ideas and skills
DOK 1LEVEL OF EXPECTATION
Mastery level-90%
Student Resources Teacher Resourceswww.brainpop.comwww.classzone.com
Identity Equity and ReadinessGender Equity Technology SkillsRacial/Ethnic Equity Research/InformationDisability Equity Workplace/Job Prep
FHSD Academics LRP Algebra I BOE Approved May 2008Page 9
Activity’s AlignmentCLE N1AACONTENT MA 5 Mathematical systemsPROCESS 1.10 Apply information, ideas and skills
DOK 1INSTRUCTIONAL STRATEGIES
Nonlinguistic representation

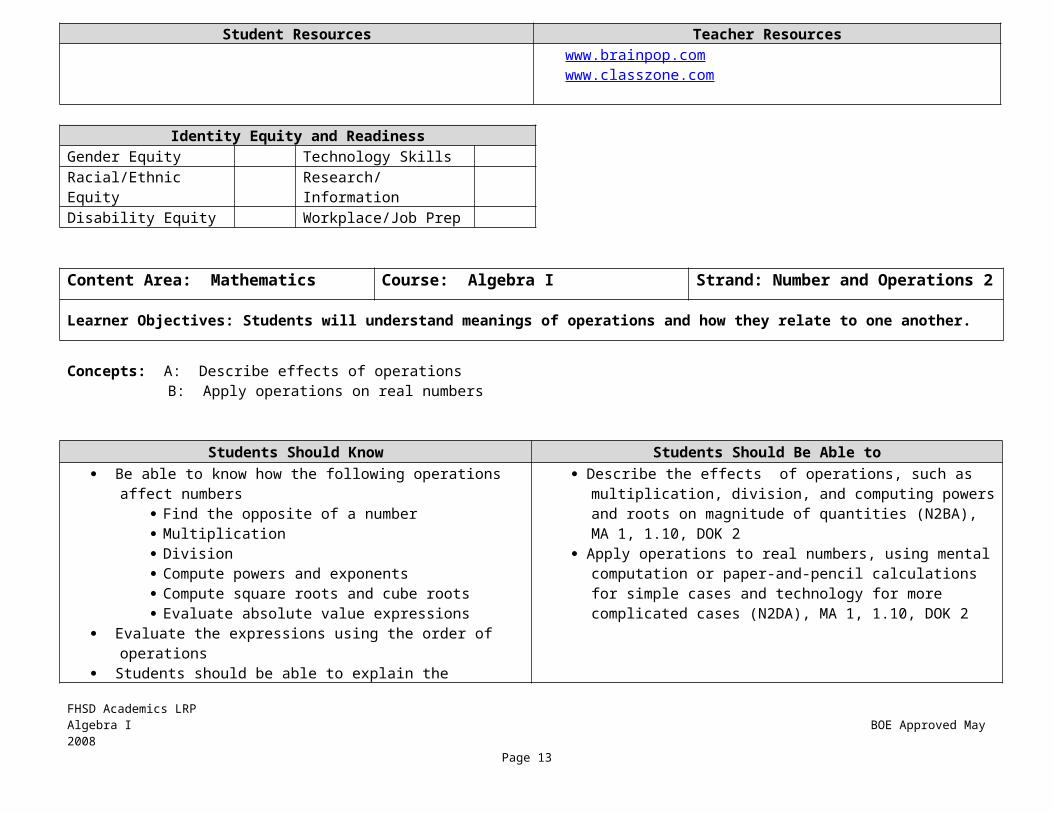
Content Area: Mathematics Course: Algebra I Strand: Number and Operations 2
Learner Objectives: Students will understand meanings of operations and how they relate to one another.
Concepts: A: Describe effects of operations B: Apply operations on real numbers
Students Should Know Students Should Be Able to Be able to know how the following operations affect numbers
Find the opposite of a number Multiplication Division Compute powers and exponents Compute square roots and cube roots Evaluate absolute value expressions
Evaluate the expressions using the order of operations Students should be able to explain the following Algebraic Properties
Commutative Associative Distributive-combine like terms Identity Zero Reflexive Symmetric Transitive
Describe the effects of operations, such as multiplication, division, and computing powers and roots on magnitude of quantities (N2BA), MA 1, 1.10, DOK 2
Apply operations to real numbers, using mental computation or paper-and-pencil calculations for simple cases and technology for more complicated cases (N2DA), MA 1, 1.10, DOK 2
Instructional Support
Student Essential VocabularySquare root Power Cube root Exponent Order of operations Absolute value
Radical Radicand Index Commutative Associative DistributiveIdentity Zero Reflexive Symmetric Transitive Combine like terms
Sample Learning Activities Sample AssessmentsLearning Activity #1 : Assessment #1:
FHSD Academics LRP Algebra I BOE Approved May 2008Page 10

For problems 1 through 6, you are given that 0< a <1 and -1< b <0. Determine whether the value is >0 or <0. Justify your result using the rules for integers.
1. a b 4. a a
2. ba 5. a b
3. bb 6. b a
Answer Key:
1. <0 2. <0 3. >0 4. >0 5. >0 6. <0
Activity’s AlignmentCLE N2BACONTENT MA 1 Operations and applications of operationsPROCESS 1.10 Apply information, ideas and skills
DOK 2INSTRUCTIONAL STRATEGIES
Questions, cues, and advance organizers
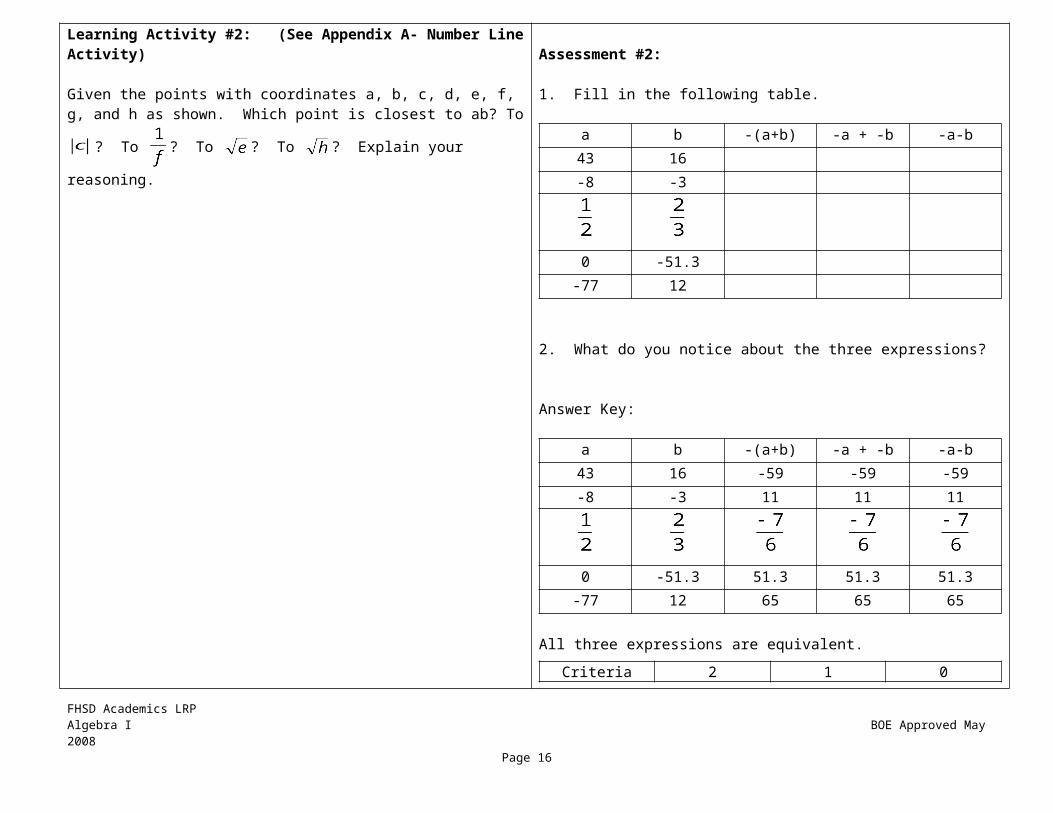
Learning Activity #2: (See Appendix A- Number Line Activity)
Given the points with coordinates a, b, c, d, e, f, g, and h as shown. Which
For problems 1 through 4, you are given that 0< a <1 and -1< b <0. Determine which expression has the larger value. Justify your solution.
1. 2 or a a
2. 2 or b b
3. 11 or a
4. 4 or a a
Answer Key:
1. a, multiplying the fraction by itself is “shrinking” or making the fraction smaller2. , a negative number squared is always positive
3. , dividing by a fraction is the same as multiplying by the reciprocal
4.
Assessment’s AlignmentCLE N2BACONTENT MA 1 Operations and applications of operationsPROCESS 1.10 Apply information, ideas and skills
DOK 2LEVEL OF EXPECTATION
Mastery level-80%
Assessment #2: 1. Fill in the following table.
FHSD Academics LRP Algebra I BOE Approved May 2008Page 11

point is closest to ab? To ? To ? To ? To ? Explain your
reasoning.a b -(a+b) -a + -b -a-b
43 16
-8 -3
0 -51.3
-77 12
2. What do you notice about the three expressions?
Answer Key:
a b -(a+b) -a + -b -a-b
43 16 -59 -59 -59
-8 -3 11 11 11
0 -51.3 51.3 51.3 51.3
-77 12 65 65 65
All three expressions are equivalent.
Criteria 2 1 0Evaluated
- (a+b)All spaces filled
correctly50% or more of the spaced filled
correctly
Less than 50 % of the spaces
filled correctlyEvaluated
-a + -bAll spaces filled
correctly50% or more of the spaced filled
correctly
Less than 50 % of the spaces
filled correctlyEvaluated
-a-bAll spaces filled
correctly50% or more of the spaced filled
correctly
Less than 50 % of the spaces
filled correctly
FHSD Academics LRP Algebra I BOE Approved May 2008Page 12
Activity’s AlignmentCLE N2BACONTENT MA 1 Operations and applications of operationsPROCESS 1.10 Apply information, ideas and skills
DOK 2INSTRUCTIONAL STRATEGIES
Cooperative learning, generating and testing hypothesis
Explanation Correct Error based on filling in table
Incorrect
Assessment’s AlignmentCLE N2DACONTENT MA 1 Number sensePROCESS 1.10 Apply information, ideas and skills
DOK 2LEVEL OF EXPECTATION
Mastery level-90%
Student Resources Teacher Resources
www.brainpop.comwww.classzone.com
Identity Equity and ReadinessGender Equity Technology SkillsRacial/Ethnic Equity Research/InformationDisability Equity Workplace/Job Prep
Content Area: Mathematics Course: Algebra I Strand: Number and Operations 3
FHSD Academics LRP Algebra I BOE Approved May 2008Page 13

Learner Objectives: Students will be able to compute fluently and make reasonable estimates.
Concepts: A: Estimate and justify solutions B: Use proportional reasoning
Students Should Know Students Should Be Able to Solutions can be justified
Estimate Make predictions Approximate to an appropriate degree of precision Mental mathematics Paper-and-pencil computations Use calculators
Solve problems involving proportions Rates Ratios Compare Express as a simplified fraction
Judge the reasonableness of numerical computations and their results (N3DA), MA 1, 3.2, DOK 2 – integrate throughout course
Solve problems involving proportions (N3EA), MA 1, 3.2, DOK 2
Instructional Support
Student Essential VocabularyProportion Rate Ratio Round
Sample Learning Activities Sample AssessmentsLearning Activity #1 :
A. In a group of 1200 adults, there are 300 vegetarians. What is the
Assessment #1:
FHSD Academics LRP Algebra I BOE Approved May 2008Page 14

ratio of non-vegetarians to vegetarians in the group?
B. Explain why ¼ is not the answer to the above problem.
Answer Key:
A. 900/300 = 3/1
B. The proportion is not comparing vegetarians to the total group.
Your job for the summer is working as an intern for a local manager of Best Buy. Your first job is to create a newspaper advertisement stating that the store’s CD players are discounted 20% from the manufacturer’s suggested retail price (MSRP). The store is running a special sale that says all CD players have been discounted an additional 15%. What is the final sale price of a CD player who’s MSRP is $250?
The correct method is to calculate the discounts successively. That is, 20% is taken off the MSRP and then 15% is taken off the resulting price.
Some students will misinterpret the ad and assume that the discounts can be combined, mistakenly thinking that the price is 35% off the MSRP.
Find the price for each interpretation and compare the relationship between the sale price using successive discounts and the sale price using combined discounts. Determine which method your store would use to provide the most profit. Write a short e-mail to your manager supporting your reasoning.
Answer Key:
Case 1:
Case 2:
Case 1 would allow the store to have maximum profit. See student responses for newspaper ad and email to the manager.
Criteria 2 1 0Newspaper Article
Includes both the 20% and 15% off
Only includes 1 discount
No ad or completely wrong
Case 1 Calculation
Set up and solved equation appropriately
Did not set up equation correctly or calculated
Equation incorrect and answer incorrect
FHSD Academics LRP Algebra I BOE Approved May 2008Page 15
Activity’s AlignmentCLE N3EACONTENT MA 1 Number sensePROCESS 3.2 Apply strategies of others
DOK 3INSTRUCTIONAL STRATEGIES
Homework and practice
Learning Activity #2:
Gordon and Chuck are simplifying the following algebraic expression:. Their work is shown.
Gordon Chuck
Which person has completed the problem correctly? Explain what the person making the mistake did incorrectly.
Answer Key:
Gordon. Chuck did not take into consideration the .
wrongCase 2 Calculation
Set up and solved equation appropriately
Did not set up equation correctly or calculated wrong
Equation incorrect and answer incorrect
Final email decision
Includes correct case choice and explanation why
Correct case with no explanation or wrong case with explanation
No final decision
Assessment’s Alignment
CLE N3EACONTENT MA 1 Number sensePROCESS 3.2 Apply strategies of others
DOK 3LEVEL OF EXPECTATION
Mastery level-85%
Assessment #2: The following problem has at least one error in its solution. Locate and correct each error. Write a brief description of the error(s) encountered.
Answer Key:
Distribute the negative to all terms inside the parenthesis, -x-3 and -8-9 = -17, added 9 instead.
FHSD Academics LRP Algebra I BOE Approved May 2008Page 16

Activity’s AlignmentCLE N3DACONTENT MA 1 Number sensePROCESS 3.2 Apply other’s strategies
DOK 2INSTRUCTIONAL STRATEGIES
Homework and practice
Assessment’s Alignment
CLE N3DACONTENT MA 1 Number sensePROCESS 3.2 Apply other’s strategies
DOK 2LEVEL OF EXPECTATION
Mastery level-95%
Student Resources Teacher Resources
www.brainpop.comwww.classzone.com
Identity Equity and ReadinessGender Equity Technology SkillsRacial/Ethnic Equity Research/InformationDisability Equity Workplace/Job Prep
Content Area: Mathematics Course: Algebra I Strand: Algebraic Relationships 1
Learner Objectives: Students will understand patterns, relations and functions.
FHSD Academics LRP Algebra I BOE Approved May 2008Page 17

Concepts: A: Create and analyze patterns B: Classify objects and representations C: Identify and compare functions D: Describe the effects of parameter changes
Students Should Know Students Should Be Able to Understand and utilize definitions
Relation Function
Apply the appropriate representation of a relation and function Mapping Table Set of ordered pairs Graph Verbal rule Equation
Different types of functions are defined, compared and analyzed Explicit function Recursive function Tables Graph linear, quadratic, and exponential functions Symbols
Linear functions can be interpreted using a variety of characteristics Rate of change Growth/decay Intercepts Domain/range
Exponential functions can be interpreted using a variety of characteristics
Growth/decay Quadratic functions can be interpreted using a variety of
characteristics Vertex Line of symmetry/axis of symmetry Translations Intercepts (roots, zeros)
Utilize the terminology for functions and formulas Input Output Domain Range
Generalize patterns using explicitly or recursively defined functions (A1BA,) MA 4, 1.6, DOK 2
Compare and contrast various forms of representations of patterns (A1CA), MA 4, 1.6, DOK 2
Understand and compare the properties of linear and nonlinear functions (A1DA), MA 4, 1.6, DOK 2
Describe the effects of parameter changes on linear, exponential and quadratic functions (include intercepts) (A1EA), MA 4, 1.6, 3.8, DOK 2
FHSD Academics LRP Algebra I BOE Approved May 2008Page 18

Instructional Support
Student Essential VocabularyExplicit Range Exponential function Quadratic function Dependent variable roots
Recursive Linear Growth relation zeros parameterinput output domain vertex Line of symmetry mapping
Function Nonlinear Decay Independent variable intercepts
Sample Learning Activities Sample AssessmentsLearning Activity #1 Assessment #1:
FHSD Academics LRP Algebra I BOE Approved May 2008Page 19

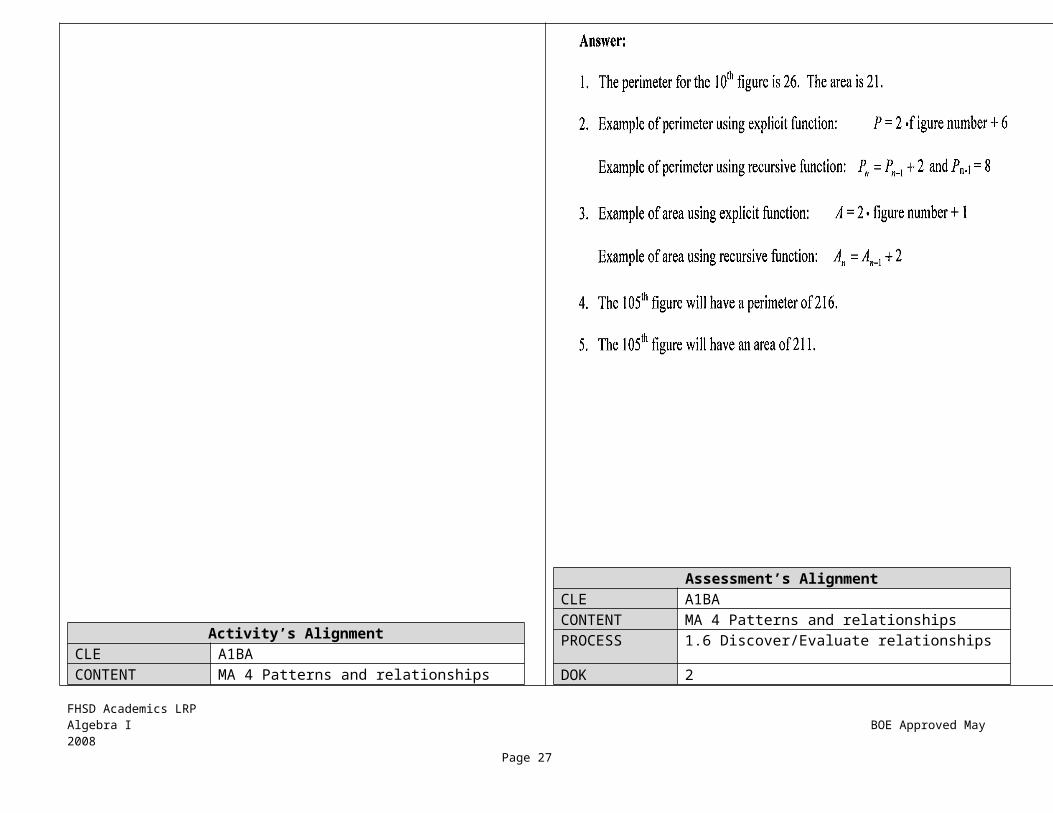
Activity’s AlignmentCLE A1BACONTENT MA 4 Patterns and relationshipsPROCESS 1.6 Discover/Evaluate relationshipsDOK 2INSTRUCTIONAL STRATEGIES
Cooperative learning
Learning Activity #2:
Assessment’s Alignment
CLE A1BACONTENT MA 4 Patterns and relationshipsPROCESS 1.6 Discover/Evaluate relationships
DOK 2LEVEL OF EXPECTATION
Mastery level-75%
Assessment #2:
FHSD Academics LRP Algebra I BOE Approved May 2008Page 20

Activity’s AlignmentCLE A1DACONTENT MA 4 Patterns and relationshipsPROCESS 1.6 Discover/Evaluate relationships
DOK 2INSTRUCTIONAL STRATEGIES
Similarities and differences
Assessment’s Alignment
CLE A1EACONTENT MA 4 Patterns and relationshipsPROCESS 1.6 Discover/Evaluate relationships
3.8 Assess consequencesDOK 2LEVEL OF EXPECTATION
Mastery level-90%
FHSD Academics LRP Algebra I BOE Approved May 2008Page 21

Student Resources Teacher Resources
www.brainpop.comwww.classzone.com
Identity Equity and ReadinessGender Equity Technology Skills XRacial/Ethnic Equity Research/InformationDisability Equity Workplace/Job Prep
Content Area: Mathematics Course: Algebra I Strand: Algebraic Relationships 2
Learner Objectives: Students will be able to represent and analyze mathematical situations and structures using algebraic symbols.
Concepts: A: Represent mathematical situations B: Describe and use mathematical manipulation
C: Utilize equivalent forms D: Utilize systems
Students Should Know Students Should Be Able to
FHSD Academics LRP Algebra I BOE Approved May 2008Page 22

Represent mathematical situations Expression Inequality Relation
Algebraic manipulations are used to simplify expressions Properties of exponents Distributive property (FOIL) Combine like terms
Write equations of linear functions in standard, slope-intercept and point-slope form
Write linear equations given certain conditions Convert between various forms
Solve various forms of linear equations and inequalities Solve quadratic functions
Factoring Quadratic formula
Factor quadratic expressions Factoring-greatest common factor, grouping, difference
of squares, trinomials, perfect square trinomials Solve systems using various methods
Graphing Substitution Elimination
use symbolic algebra to represent and solve problems that involve linear and quadratic relationships (A2AA) MA 4, 3.3, DOK 2
describe and use algebraic manipulations, including factoring and rules of integer exponents and apply properties of exponents (including order of operations) to simplify expressions (A2BA) MA 4, 3.2, DOK 2
use and solve equivalent forms of equations and inequalities (linear, piece-wise and quadratic) (A2CA) MA 4, 3.2, DOK 2
use and solve systems of linear equations or inequalities with 2 variables (A2DA) MA 4, 1.6, DOK 2
Instructional Support
Student Essential VocabularyLinear Standard from Elimination Distributive property Quadratic Combine like terms
Substitution Point-slope Solve for variable FOIL Slope-intercept
Sample Learning Activities Sample AssessmentsLearning Activity #1 :
Students and teacher will use the graphing calculator to find the solution of the following systems of equations. (Show how to find the solution by using
Assessment #1:
The total tuition for students at University College and State College consists of fees plus costs per credit. Some classes have different credit
FHSD Academics LRP Algebra I BOE Approved May 2008Page 23

the TRACE button, the TABLE and the CALC button)
1.) y = 3x – 46x – 2y = 8 (solution: infinitely many)
2.) y = 2x – 34x – 2y = -8 (solution: no solution)
3.) x – y = 12x + y = 8 (solution: (3, 2)
Activity’s AlignmentCLE A2DA
values. The table shows the total tuition for programs with different numbers of credits at each college.
Credits University College $ State College $1 55 473 115 1116 205 2079 295 303
10 325 33512 385 399
a. Write a system of equations that represents the relationship between credit hours and total tuition for each college.
b. Find the solution to this system of equations and check it.
c. Which method did you use to solve this system? Why?
d. What is the real-world meaning of the solution?
e. When is it cheaper to attend University College? Sate College?
Answer Key:
a. where y is tuition for x credits at University; where y is tuition for x credits at Stateb. (5, 175) 175 = 30(5) + 25 175 = 32(5) + 15 c. see student responsed. Student takes 5 credit hours; the tuition at either college is $175.e. It is cheaper to attend University if taking more than 5 credits. Otherwise, it is cheaper to attend State.
Assessment’s Alignment
FHSD Academics LRP Algebra I BOE Approved May 2008Page 24

CONTENT MA 4 Patterns and relationshipsPROCESS 1.6 Discover/Evaluate relationships
DOK 2INSTRUCTIONAL STRATEGIES
Using technology
Learning Activity #2: See Appendix B-The Graph Game
Cut out and separate the Equations and Graphs. Students should be placed in cooperative groups. Have students match each equation with its corresponding graph.
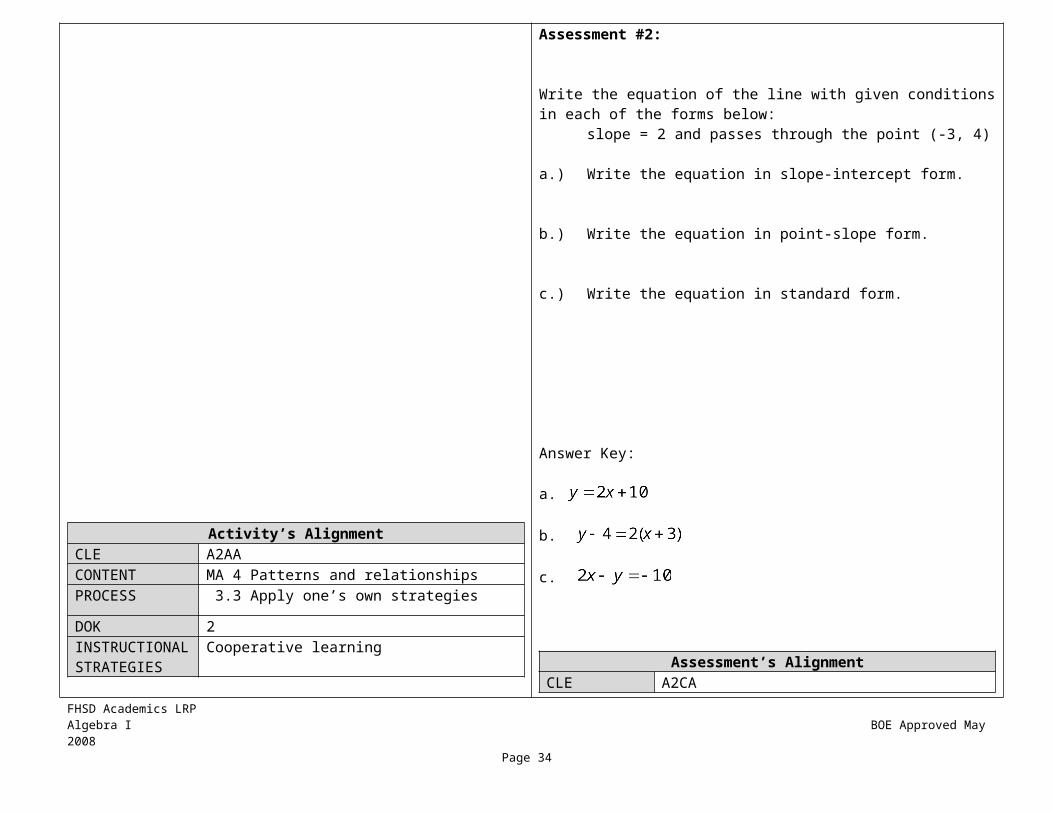
Activity’s AlignmentCLE A2AA
CLE A2AACONTENT MA 4 Patterns and relationshipsPROCESS 3.3 Apply one’s own strategies
DOK 2LEVEL OF EXPECTATION
Mastery level-80%
Assessment #2:
Write the equation of the line with given conditions in each of the forms below:
slope = 2 and passes through the point (-3, 4)
a.) Write the equation in slope-intercept form.
b.) Write the equation in point-slope form.
c.) Write the equation in standard form.
Answer Key:
a.
b.
c.
Assessment’s AlignmentCLE A2CA
FHSD Academics LRP Algebra I BOE Approved May 2008Page 25

CONTENT MA 4 Patterns and relationshipsPROCESS 3.3 Apply one’s own strategies
DOK 2INSTRUCTIONAL STRATEGIES
Cooperative learning
CONTENT MA 4 Patterns and relationshipsPROCESS 3.2 Apply others’ strategies
DOK 2LEVEL OF EXPECTATION
Mastery level-90%
Student Resources Teacher Resources
www.brainpop.comwww.classzone.com
Identity Equity and ReadinessGender Equity Technology Skills XRacial/Ethnic Equity Research/InformationDisability Equity Workplace/Job Prep
Content Area: Mathematics Course: Algebra I Strand: Algebraic Relationships 3
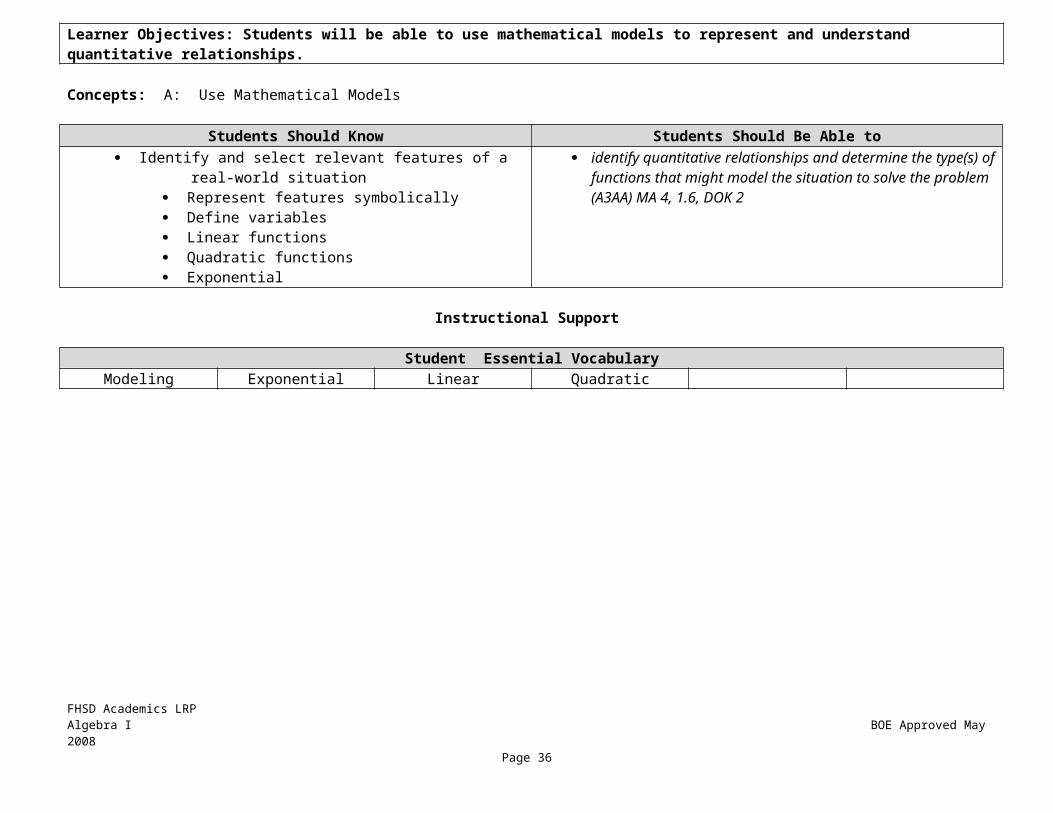
Learner Objectives: Students will be able to use mathematical models to represent and understand quantitative relationships.
Concepts: A: Use Mathematical Models
Students Should Know Students Should Be Able to Identify and select relevant features of a real-world situation
Represent features symbolically Define variables Linear functions Quadratic functions
identify quantitative relationships and determine the type(s) of functions that might model the situation to solve the problem (A3AA) MA 4, 1.6, DOK 2
FHSD Academics LRP Algebra I BOE Approved May 2008Page 26
Exponential
Instructional Support
Student Essential VocabularyModeling Exponential Linear Quadratic
Sample Learning Activities Sample AssessmentsLearning Activity #1 :
A student strained her knee in an intramural volleyball game, and her doctor prescribed an anti-flammatory. She is to take 220 milligram tablets to reduce the swelling. If her kidneys filter 60% of the medicine every 8 hours, how many hours will it take to have less than 2 mg. of the medication in her body?
Answer Key:
Acceptable Answers:
Between 40-48 hours she will have less than 2mg of medication left in her
Assessment #1:
The purchase price for a new car is $26,000. The car depreciates at a rate of 13% every year. How many years will it take for the car to be worth less than $5,000? Support your answer with lists, charts, graphs, equation(s), or written arguments.
Answer Key:
FHSD Academics LRP Algebra I BOE Approved May 2008Page 27
# of hours Mg left8 8816 35.224 14.0832 5.63240 2.2548 .90

body.
Activity’s AlignmentCLE A3AACONTENT MA 4 Patterns and relationships PROCESS 1.6 Discover relationships
DOK 2INSTRUCTIONAL STRATEGIES
Cooperative learning, nonlinguistic, ques, questions and advance organizers
Learning Activity #2:
The chart below shows the best time for 9th grade girls track team in the 100-meter hurdles.
Acceptable Answers:
Between 11-12 years the car will be worth less than 5000 dollars.
Final grade determined by dividing total points by 3.
Assessment’s Alignment
CLE A3AACONTENT MA 4 Patterns and relationshipsPROCESS 1.6 Discover relationships
DOK 2LEVEL OF Mastery level-80%
FHSD Academics LRP Algebra I BOE Approved May 2008Page 28
# of years Value of Car1 226202 19679.403 17121.084 14895.345 12958.946 11274.287 9808.628 8533.509 7424.1510 6459.0111 5619.3412 4888.83
SCORING GUIDE
LEVEL 1 LEVEL 2 LEVEL 3 LEVEL 4
Mathematical accuracy and application of principles of number theory
No findings or few correct answers
Some recognition of applicability of principles of number theory; some correct answers
Most answers correct with limited application of principles of number theory
All answers correct based on complete application of principles of number theory
Approach and Neatness
Random and disorganized;no systematic approach
Some system apparent in the approach; but not well organized
Moderately systematic approach; some use of trial and error
High systematic and organized approach; no reliance on trial and error
Explanation Little or no explanation given
Explanation attempted, but difficult to understand
Explanation fairly clear, but thinking process not always easy to follow
Explanation very clear and thinking process easy to follow

1. Use this information to predict what the best time would be for the 2006
season. Support the prediction with lists, charts, graphs, pictures diagrams, equation(s), written arguments, or statistics.
2. Using your model from question one; predict the year the best time would
break the 13-second barrier. Support the prediction with lists, charts, graphs, pictures, diagrams, equation(s), written arguments, or statistics.
Answer Key:
EXPECTATION
Assessment #2:
To raise money for a local charity, the Student Government Association (SGS) at Kennedy High decides to sell spirit-week baseball caps embroidered with the school mascot. The caps are being donated by a local merchant. The SGA must figure out how many caps to order and how much to charge for each cap.
To help with their project, the SGA conducts a market-research study. They ask 500 students in their school which of the following amounts they would be willing to pay for a baseball cap. $2, $4, $6, $8, $10, $12. The results are shown in the table below.
Price (dollars) 2 4 6 8 10 12Number of Buyers
400 325 230 160 100 25
The SGA can use the pattern in the data to make some predictions.1. Graph the (price, buyers) data, and draw a straight line that
models the trend in the data.2. Write a linear equation for your graph model.3. What do the patterns of change in the (price, buyers) data and the
graph model tell you about the relationship between the price and the number of buyers?
4. Which data pair from the survey data is farthest from your graph model? Why do you think this point is so far from the graph?
Answer Key:
1. See student graph 2. See student equation 3. As the price increases the number of buyers decreases 4. See student response
FHSD Academics LRP Algebra I BOE Approved May 2008Page 29
Year Best Time (sec)
1971 23.51976 21.81981 20.21986 18.71991 17.31996 16.02001 14.8
2006 13.72011 12.7

Activity’s AlignmentCLE A3AACONTENT MA 4 Patterns and relationshipsPROCESS 1.6 Discover relationships
DOK 2INSTRUCTIONAL STRATEGIES
Ques, questions and advance organizers
SCORING GUIDE
LEVEL 1 LEVEL 2 LEVEL 3 LEVEL 4
Mathematical accuracy and application of principles of number theory
No findings or few correct answers
Some recognition of applicability of principles of number theory; some correct answers
Most answers correct with limited application of principles of number theory
All answers correct based on complete application of principles of number theory
Approach and Neatness
Random and disorganized;no systematic approach
Some system apparent in the approach; but not well organized
Moderately systematic approach; some use of trial and error
High systematic and organized approach; no reliance on trial and error
Explanation Little or no explanation given
Explanation attempted, but difficult to understand
Explanation fairly clear, but thinking process not always easy to follow
Explanation very clear and thinking process easy to follow
Final grade determined by dividing total points by 3.
Assessment’s AlignmentCLE A3AACONTENT MA 4 Patterns and relationshipsPROCESS 1.6 Discover relationships
DOK 2LEVEL OF EXPECTATION
Mastery level-85%
Student Resources Teacher Resourceswww.brainpop.comwww.classzone.com
Identity Equity and ReadinessGender Equity Technology SkillsRacial/Ethnic Equity Research/InformationFHSD Academics LRP Algebra I BOE Approved May 2008
Page 30

Disability Equity Workplace/Job Prep
Content Area: Mathematics Course: Algebra I Strand: Algebraic Relationships 4
Learner Objectives: Students will be able to analyze change in various contexts.
Concepts: A: Analyze change
Students Should Know Students Should Be Able to
FHSD Academics LRP Algebra I BOE Approved May 2008Page 31

Characteristics of linear functions Rate of change x and y intercepts zeros/roots
Characteristics of quadratic functions Intercepts Zeros/roots Axis of symmetry Vertex
Graph linear functions using rate of change, x and y intercepts, zeros/roots, and tables
Graph quadratic functions using intercepts, zeros/roots, axis of symmetry, vertex, and tables
analyze linear and quadratic functions by investigating rates of change, intercepts and zeros (A4AA), MA 4, 1.6, DOK 2
Instructional Support
Student Essential VocabularyLinear function Intercepts Axis of symmetry Roots Rate of change Vertex
Quadratic function Zeros
Sample Learning Activities Sample AssessmentsLearning Activity #1 :
Symmetry of Parabolas:a. Graph y = x² - 6x + 5 on graph paper.b. Hold your paper up to the light and fold the parabola in half so the sides match exactly.c. Unfold the paper. Which point on the parabola lies on the fold line? __________
Assessment #1:
You decide:Patty says that y = -x² is the same as y = (-x)². Sue says they are different. Who is correct? Explain and include graphs.
Answer Key:
FHSD Academics LRP Algebra I BOE Approved May 2008Page 32

d. Write an equation to describe the fold line. _____________e) Write a few sentences to describe the symmetry of a parabola based on your findings in this activity.
Answer Key: a. See student graph b. See student graph c. (-3,4) d. x = 3 e. See student response
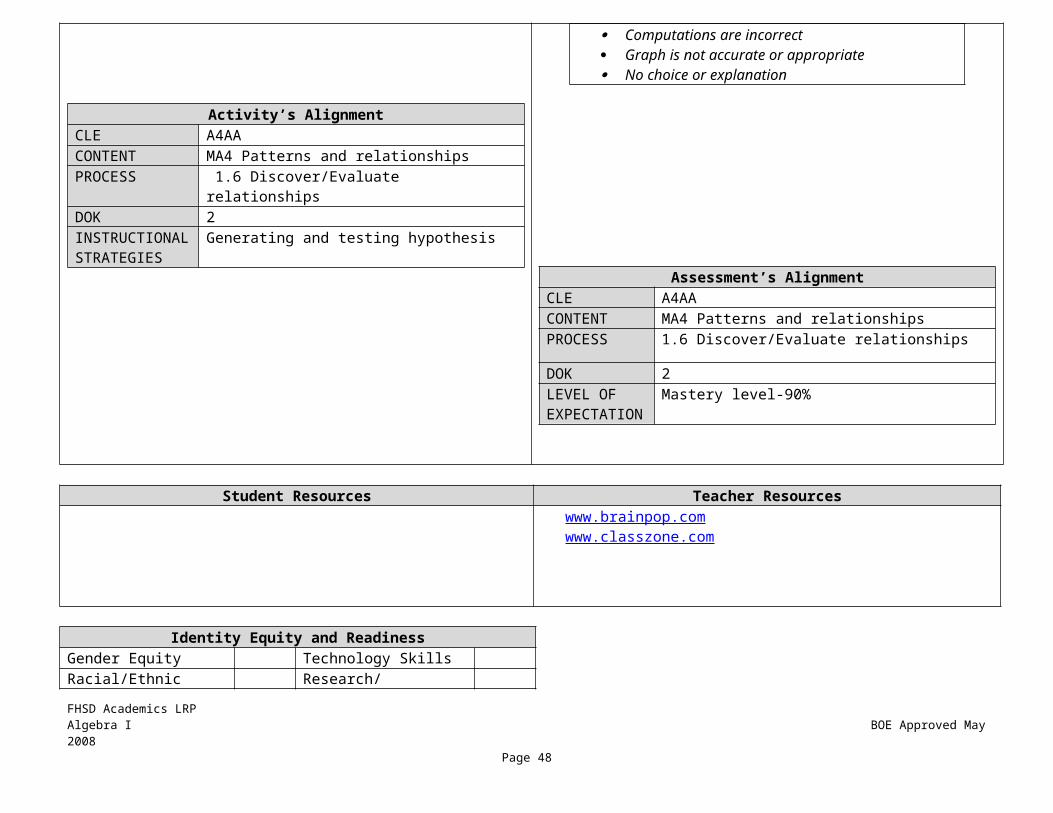
Activity’s AlignmentCLE A4AACONTENT MA4 Patterns and relationshipsPROCESS 1.6 Discover/Evaluate relationships
DOK 2INSTRUCTIONAL STRATEGIES
Generating and testing hypothesis
Learning Activity #2: In a group:
There are two stores in Joe’s neighborhood where he can rent videos: Video World and Mega Video. At one of the stores, you have to buy a membership card first. The other one does not have these cards; you simply pay per video. Both have a daily charge (rate per day). Mega Video has a membership card that costs $15 per year and then each video that is rented costs $2 per day. Video World simply rents each video for $3.25 per day.
If he rarely rents videos, which store should he use? If he often rents videos, which store should he use?
Follow these steps to determine which store he should use. Determine a way to graph this information. Develop a linear equation for each store that describes the amount of
money it costs to rent a video. Determine whether the graphs should be drawn separately or on the
same grid. Investigate the graphs and determine what each graph represents. What factors other than price might Joe want to consider before he
Sue-see student graph and explanation.
Assessment’s Alignment
CLE A4AACONTENT MA4 Patterns and relationshipsPROCESS 1.6 Discover/Evaluate relationships
DOK 2LEVEL OF EXPECTATION
Mastery level-85%
Assessment #2:
Bob baby-sits on weekends. One of his customers, the Smiths, offers to pay $10 plus $1.50 per hour. The Browns will pay him $4 per hour.a) Write and solve a system of equations to model this situation.
b) What does the solution represent?
c) What advice would you give him to decide which job to take if he only baby sits for 4 hours?
FHSD Academics LRP Algebra I BOE Approved May 2008Page 33
chooses a store? Write a paragraph describing various situations for Joe and the
appropriate solutions.
Answer Key:
Mega, use if frequently rent videos
Video World, use if rarely rent videos
12 days or 12 one day rentals is the intersection.
Answer Key:
a. x = 4
b. If Bob baby-sits for 4 hours then he will make the same amount of money.
c. Location, hours-from when to when, what day
3 points – Shows thorough understanding of the concepts of
systems of linear equations and inequalities and solving such systems graphically and algebraically.
Uses appropriate strategies to solve the problem Computations are correct Graph is accurate and appropriate Fully explains reason for choice
2 points – Shows understanding of the concepts of systems of
linear equations and inequalities and solving such systems graphically and algebraically.
Uses appropriate strategies to solve the problem
FHSD Academics LRP Algebra I BOE Approved May 2008Page 34

Activity’s AlignmentCLE A4AACONTENT MA4 Patterns and relationshipsPROCESS 1.6 Discover/Evaluate relationships
DOK 2INSTRUCTIONAL STRATEGIES
Generating and testing hypothesis
Computations are mostly correct Graph is mostly accurate and appropriate Partially explains reason for choice
1 point – Shows understanding of most of the concepts of systems
of linear equations and inequalities and solving such systems graphically and algebraically.
May not use appropriate strategies to solve the problem Computations are mostly correct Graph is mostly accurate and appropriate Makes a choice but does not explain
0 point – Shows little or no understanding of the concepts of
systems of linear equations and inequalities and solving such systems graphically and algebraically.
May not use appropriate strategies to solve the problem Computations are incorrect Graph is not accurate or appropriate No choice or explanation
Assessment’s AlignmentCLE A4AACONTENT MA4 Patterns and relationshipsPROCESS 1.6 Discover/Evaluate relationships
DOK 2LEVEL OF EXPECTATION
Mastery level-90%
FHSD Academics LRP Algebra I BOE Approved May 2008Page 35
Student Resources Teacher Resources
www.brainpop.comwww.classzone.com
Identity Equity and ReadinessGender Equity Technology SkillsRacial/Ethnic Equity Research/InformationDisability Equity Workplace/Job Prep
Content Area: Mathematics Course: Algebra I Strand: Geometric and Spatial Relationships 1
Learner Objectives: Students will be able to analyze characteristics and properties of two-dimensional geometric shapes and develop mathematical arguments about geometric relationships.
Concepts: A: Apply geometric relationships
Students Should Know Students Should Be Able to
FHSD Academics LRP Algebra I BOE Approved May 2008Page 36

Apply properties of two-dimensional shapes Solve multi-step problems involving angle relationships Solve multi-step problems involving similar figures
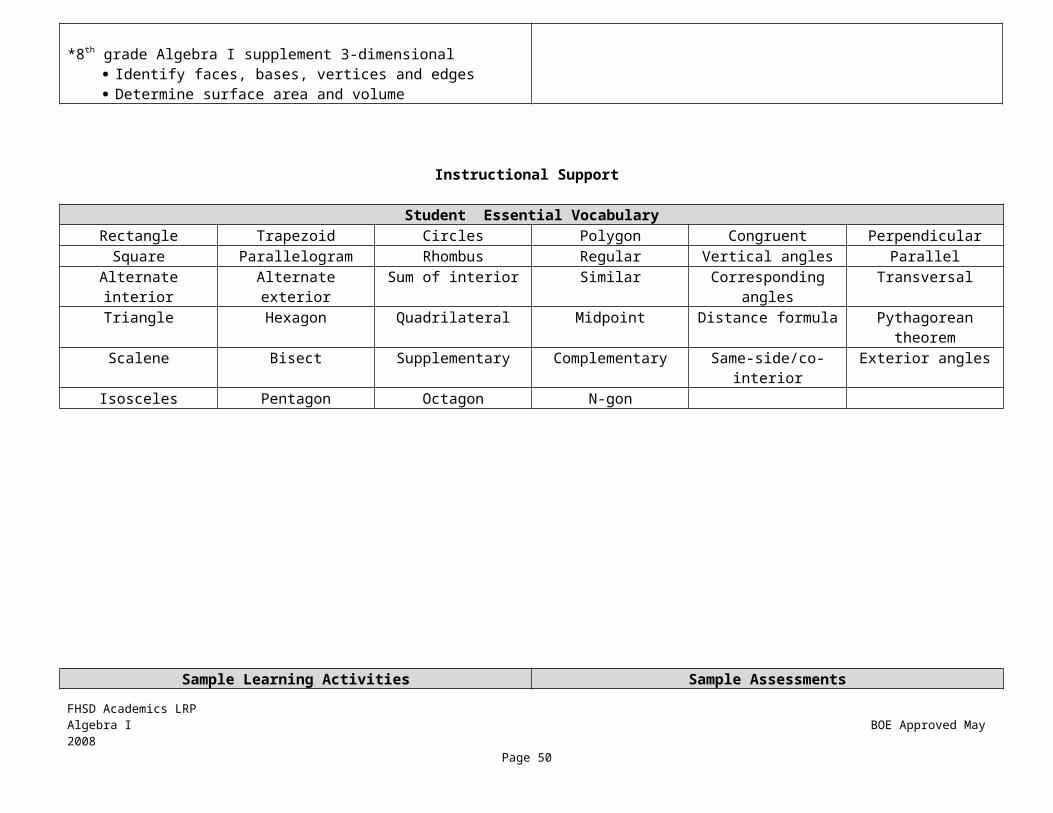
*8th grade Algebra I supplement 3-dimensional Identify faces, bases, vertices and edges Determine surface area and volume
apply geometric properties such as similarity and angle relationship to solve multi-step problems in two dimensions (G1BA), MA2, 3.6, DOK 2
Instructional Support
Student Essential VocabularyRectangle Trapezoid Circles Polygon Congruent Perpendicular
Square Parallelogram Rhombus Regular Vertical angles ParallelAlternate interior Alternate exterior Sum of interior Similar Corresponding angles Transversal
Triangle Hexagon Quadrilateral Midpoint Distance formula Pythagorean theoremScalene Bisect Supplementary Complementary Same-side/co-interior Exterior angles
Isosceles Pentagon Octagon N-gon
Sample Learning Activities Sample AssessmentsLearning Activity #1 :
Given triangle ABC, use the following information to write an equation and find each angle measure.
Assessment #1:
Find the measures of angles A, B, and C. Show all the work that supports your answer.
FHSD Academics LRP Algebra I BOE Approved May 2008Page 37
BC
38° 29°
63°
A

Answer Key:
Activity’s AlignmentCLE G1BACONTENT MA2 Geometric and spatial sensePROCESS 3.6 Examine solutions from many perspectivesDOK 2INSTRUCTIONAL STRATEGIES
Work with a partner
Learning Activity #2:
B Given find the length of .
D 25 10
A C
Answer Key:
Assessment’s AlignmentCLE G1BACONTENT MA2 Geometric and spatial sensePROCESS 3.6 Examine solutions from many perspectives
DOK 2LEVEL OF EXPECTATION
Mastery level-95%
Assessment #2:
Given AC = 18, CE=12 and BD= 8, find the perimeter of ABC. Show all the work that helps you arrive at the answer.
FHSD Academics LRP Algebra I BOE Approved May 2008Page 38
p
qE
A
B C
D

5 E x
Answer Key:
AB = AC BD CE AB/8 = 18/12 AB = 12 (AB)2 + (BC)2 = (AC)2
(12 )2 + (BC)2 = (18)2
144 + (BC)2 = 324 (BC)2 = 180 BC = √ 180 = 6 √ 5
Therefore, the perimeter of ∆ABC = 12 + 6 √ 5 + 18 = 5630
Assessment’s Alignment
CLE G1BACONTENT MA2 Geometric and spatial sensePROCESS 3.6 Examine solutions from many perspectives
DOK 2LEVEL OF EXPECTATION
Mastery level-90%
FHSD Academics LRP Algebra I BOE Approved May 2008Page 39
Activity’s AlignmentCLE G1BACONTENT MA 2 Geometric and spatial sensePROCESS 3.6 Examine solutions from many perspectivesDOK 2INSTRUCTIONAL STRATEGIES
Cooperative learning

Student Resources Teacher Resources
www.brainpop.comwww.classzone.com
Identity Equity and ReadinessGender Equity Technology SkillsRacial/Ethnic Equity Research/InformationDisability Equity Workplace/Job Prep
Content Area: Mathematics Course: Algebra IStrand: Geometric and Spatial
Relationships 4
Learner Objectives: Students will be able to use visualization, spatial reasoning and geometric modeling to solve problems.
Concepts: A: Draw and use visual models
Students Should Know Students Should Be Able to
FHSD Academics LRP Algebra I BOE Approved May 2008Page 40

Create a visual model or sketch to satisfy constraints draw or use visual models to represent and solve problems (G4BA), MA 2, 3.3, DOK 2-integrated throughout the course
Instructional Support
Student Essential VocabularyGraphic Organizer Graph Visual Model Picture Table
Sample Learning Activities Sample AssessmentsLearning Activity #1 :
The eight students in one of the groups in a gym class are standing in a circle evenly spaced from each other. They are told to toss a rubber ball clockwise around the circle so each pass skips two students. The first student starts with a ball and tosses it clockwise so that it goes to the fourth student who then passes it to the seventh student and so forth. How many passes does it take for the first student to get the ball if this pattern continues?
Answer Key:
Assessment #1:
Stephanie and Ryan must run some errands for their parents. They have to make stops at the dry cleaning store, the post office, the utility office, the school, and at the print shop. The relative position of these destinations is shown below.
FHSD Academics LRP Algebra I BOE Approved May 2008Page 41
Home Dry Cleaner

The 8th pass will allow the ball to go back to the first person. ● ●
● ●
● ● Each errand should take 5 minutes to complete and Stephanie and Ryan must be home by 6:00 p. m. They leave at 4:30 p.m. The table below shows the walking time between locations if no other stops are made in between.
Dry Cleaner
Post Office School Print
ShopUtility Office
Home 13.5 7 9.5 12 18
Utility 5 7 4.5 6 0
Print 9.5 5 7.5 0 6
School 4 5 0 7.5 4.5Post
Office 5 0 5 5 7
Select the route which would allow Stephanie and Ryan to spend the least amount of time running errands.
FHSD Academics LRP Algebra I BOE Approved May 2008Page 42
Post Office
School
Print ShopUtility Office

Activity’s AlignmentCLE G4BACONTENT MA 2 Geometric and spatial sensePROCESS 3.3 Apply one’s own strategies
DOK 2INSTRUCTIONAL STRATEGIES
Non-linguistic representation
Answer Key:
7 min Home to Post Office; 5 min P.O. to Dry Cl; 4 D.C. to School;4.5 min School to Utility Office; 6 U.Office to Print Shop; 12 P.S to Home = 38.5 minutes + 25 minutes (5 min/errand) = 63.5 total minutes
Criteria 2 1 0Demonstrate
logical problem solving
Student shows thought
process/plan
Student seems to know where to
begin
Student shows no
understanding of how to begin
Determine quickest route
Calculated time correctly
Made an error in calculating
Calculations were incorrect
Assessment’s Alignment
CLE G4BACONTENT MA 2 Geometric and spatial sensePROCESS 3.3 Apply one’s own strategies
DOK 2LEVEL OF EXPECTATION
Mastery level-85%
Student Resources Teacher Resourceswww.brainpop.comwww.classzone.com
Identity Equity and ReadinessGender Equity Technology SkillsRacial/Ethnic Equity Research/InformationDisability Equity Workplace/Job Prep
Content Area: Mathematics Course: Algebra I Strand: Measurement 2
Learner Objectives: Students will be able to apply appropriate techniques, tools and formulas to determine measurements.
Concepts: A: Analyze precision B: Use relationships within a measurement system
FHSD Academics LRP Algebra I BOE Approved May 2008Page 43

Students Should Know Students Should Be Able to How to round to specific place value How to convert to a unit rate What a conversion factor is How to write and solve proportions How to use dimensional analysis
describe the effects of operations, such as multiplication, division and computing powers and roots on magnitudes of quantities and effects of computation on precision which include the judging of reasonable of numerical computations and their results (M2DA), MA 2, 1.7, DOK 2
use unit analysis to solve problems (M2EA), MA 4, 1.10, DOK 2
Instructional Support
Student Essential VocabularyPowers Operations Ratio Magnitude Rate Unit ConversionsRoots Unit Analysis Proportion
Sample Learning Activities Sample AssessmentsLearning Activity #1 :
If a car travels at 65 miles per hour, determine how many feet are traveled per second.
1 mile = 5280 feet.
Assessment #1: Recipes in many international cookbooks use metric measurements. One cookie recipe calls for 120 milliliters of sugar. How much is this in our customary unit “cups”? (There are 1000 milliliters in a liter, 1.06 quarts in a liter, and 4 cups in a quart.)
Answer Key:
FHSD Academics LRP Algebra I BOE Approved May 2008Page 44

Answer Key:
Activity’s AlignmentCLE M2DACONTENT MA 2 Geometric and spatial sense PROCESS 1.7 Evaluate accuracy of information
DOK 2INSTRUCTIONAL STRATEGIES
Homework and practice
Learning Activity #2:
Find a rate for each situation. Then use the rate to answer the question.
a. Kerstin drove 350 miles last week and used 12.5 gallons of gas. How many gallons of gas will he use if he drives 520 miles this week?
b. Angelo drove 225 miles last week and used 10.7 gallons of gas.
Assessment’s AlignmentCLE M2DACONTENT MA 2 Geometry and spatial sensePROCESS 1.7 Evaluate accuracy of information
DOK 2LEVEL OF EXPECTATION
Mastery level-80%
Assessment #2:
In a fairy tale written by the Brothers Grimm, Rapunzel has hair that is about 20 ells in length (1 ell = 3.75 feet) by the time she is 12 years old. In the story, Rapunzel is held captive in a high tower with a locked door and only one window. From this window, she lets down her hair so that people can climb up.
FHSD Academics LRP Algebra I BOE Approved May 2008Page 45
SCORING GUIDE
LEVEL 1 LEVEL 2 LEVEL 3 LEVEL 4
Mathematical accuracy and application of principles of number theory
No findings or few correct answers
Some recognition of applicability of principles of number theory; some correct answers
Most answers correct with limited application of principles of number theory
All answers correct based on complete application of principles of number theory
Approach and Neatness
Random and disorganized;no systematic approach
Some system apparent in the approach; but not well organized
Moderately systematic approach; some use of trial and error
High systematic and organized approach; no reliance on trial and error
Explanation Little or no explanation given
Explanation attempted, but difficult to understand
Explanation fairly clear, but thinking process not always easy to follow
Explanation very clear and thinking process easy to follow

How far can he drive this week using 9 gallons of gas?
Answer Key:
a.
b.
a. Approximately how long was Rapunzel’s hair in feet when she was 12 years old?
b. If Rapunzel’s hair grew at a constant rate from birth, approximately how many feet did her hair grow per month?
Answer Key:
a.
b.
FHSD Academics LRP Algebra I BOE Approved May 2008Page 46
SCORING GUIDE
LEVEL 1 LEVEL 2 LEVEL 3 LEVEL 4
Mathematical accuracy and application of principles of number theory
No findings or few correct answers
Some recognition of applicability of principles of number theory; some correct answers
Most answers correct with limited application of principles of number theory
All answers correct based on complete application of principles of number theory
Approach and Neatness
Random and disorganized;no systematic approach
Some system apparent in the approach; but not well organized
Moderately systematic approach; some use of trial and error
High systematic and organized approach; no reliance on trial and error
Explanation Little or no explanation given
Explanation attempted, but difficult to understand
Explanation fairly clear, but thinking process not always easy to follow
Explanation very clear and thinking process easy to follow

Activity’s AlignmentCLE M2EACONTENT MA 4 Patterns & relationshipsPROCESS 1.10 Apply acquired information
DOK 2INSTRUCTIONAL STRATEGIES
Homework and practice
Student Resources Teacher Resources
www.brainpop.comwww.classzone.com
Identity Equity and ReadinessGender Equity Technology SkillsRacial/Ethnic Equity Research/InformationDisability Equity Workplace/Job Prep
FHSD Academics LRP Algebra I BOE Approved May 2008Page 47
Assessment’s AlignmentCLE M2EACONTENT MA 4 Patterns & relationshipsPROCESS 1.10 Apply acquired information
DOK 2LEVEL OF EXPECTATION
Mastery level-90%
Content Area: Mathematics Course: Algebra I Strand: Data and Probability 1
Learner Objectives: Students will be able to formulate questions that can be addressed with data and collect, organize and display relevant data to answer them.
Concepts: A: Formulate questions B: Represent and interpret data
Students Should Know Students Should Be Able to How to graph a scatter plot
Determine a line of best fit Determine type of correlation-positive, negative,
none Read, analyze and make predictions using data from
various graphs Circle graph Bar graph Line graph Histogram Tree diagram Stem-and-leaf
Describe the shape of the graph Symmetric U-shaped Bell-shaped Skew
Understand and determine probability to make predictions
Experimental probability Theoretical probability
formulate questions and collect data about a characteristic which include sample spaces and distributions (D1AA), MA 3, 1.2, DOK 3
select and use appropriate graphical representation of data and given one-variable quantitative data, display the distribution and describe its shape (D1CA), MA 6, 1.8, DOK 2
Instructional Support
Student Essential VocabularySample space Scatter plot Bar graph Skew Bell-shaped Experimental ProbabilityDistribution Trends Line graph Symmetric Correlation
Line of best fit Histogram Stem-and-Leaf U-shaped Theoretical Probability
Sample Learning Activities Sample AssessmentsFHSD Academics LRP Algebra I BOE Approved May 2008
Page 48

Learning Activity #1 :
Twenty students were asked to randomly pick a number from zero to 100. Here are the results: 87, 25, 30, 10, 52, 27, 4, 97, 25, 40, 36, 80, 61, 58, 12, 17, 68, 28, 6, 83.
a) Construct a histogram for the data using appropriate bin widths.b) Create a stem plot for the data that includes a key.
Answer Key: See student response
Activity’s AlignmentCLE D1CACONTENT MA6 Discrete mathematicsPROCESS 1.8 Organize data and ideas
DOK 2INSTRUCTIONAL STRATEGIES
Non-linguistic representation
Learning Activity #2:
Assessment #1:
5 0 0 2 4 86 1 3 67 2 5 5 88 3 7 8 8 9 9
6 1 = 61
Use the stem-and-leaf plot to answer the following questions.
a) Which number(s) appear most frequently?b) Are there more numbers greater than 70 or less than 70?c) How many numbers are shown?
Answer Key:
a) 50, 75, 88, 89
b) More that are greater than 70
c) 18
Assessment’s AlignmentCLE D1CACONTENT MA6 Discrete mathematicsPROCESS 1.8 Organize data and ideas
DOK 2LEVEL OF EXPECTATION
Mastery level-95%
Assessment #2: FHSD Academics LRP Algebra I BOE Approved May 2008
Page 49
Divide into groups and have each group roll two six-sided dice. Roll 36 times. Record the sum for each roll.
-Record the experimental probability for all possible sums.-Find the theoretical probability for each possible sum.-Compare group results to the theoretical probability.-Calculate the class results and compare to theoretical probability-List the possible outcomes
Answer Key: Answers will vary
Activity’s AlignmentCLE D1AACONTENT MA3 Data analysisPROCESS 1.2 Conduct research
DOK 3INSTRUCTIONAL STRATEGIES
Cooperative learning
A coin is tossed and a six-sided die is rolled.
a) List all possible outcomes.b) What is the probability of getting a heads and a 5?
Answer Key:
a) H1, H2, H3, H4, H5, H6, T1, T2, T3, T4, T5, T6
b) 1/12
Assessment’s AlignmentCLE D1AACONTENT MA3 Data analysisPROCESS 1.2 Conduct research
DOK 3LEVEL OF EXPECTATION
Mastery level-85%
Student Resources Teacher Resources
www.brainpop.comwww.classzone.comTI-83 and TI-84
Identity Equity and ReadinessGender Equity Technology SkillsRacial/Ethnic Equity Research/InformationDisability Equity Workplace/Job Prep
FHSD Academics LRP Algebra I BOE Approved May 2008Page 50

Content Area: Mathematics Course: Algebra I Strand: Data and Probability 2
Learner Objectives: Students will be able to select and use appropriate statistical methods to analyze data.
Concepts: A: Describe and Analyze data B: Represent data algebraically
Students Should Know Students Should Be Able to Determine measures of Central Tendency/Measures of Center
Mean Median Mode Range Outlier
Understand scatter plots and make predictions using line of best fit and determining types of correlations
Apply statistical measures of center to solve problems (D2AA), MA 3, 3.2, DOK 2
Given a scatter plot, determine an equation for a line of best fit (D2CA), MA 3, 1.6, DOK 2
Instructional Support
Student Essential VocabularyMean Range Line of Best Fit Mode Scatter plot Correlation
Median Outlier
Sample Learning Activities Sample AssessmentsLearning Activity #1 : Assessment #1:
FHSD Academics LRP Algebra I BOE Approved May 2008Page 51

The table shows the cost of some school supplies. Find the mean, median, and mode of the cost of supplies.
Supply CostPencils $0.50Pens $2.00Paper $2.00Pocket Folder $1.25Calculator $5.25Notebook $3.00Erasers $2.50Markers $3.50
Answer Key:Mean: $2.50 Median: $2.25 Mode: $2.00
Activity’s AlignmentCLE D2AACONTENT MA 3 Data analysisPROCESS 3.2 Apply other’s strategiesDOK 2INSTRUCTIONAL STRATEGIES
Homework and practice
Learning Activity #2:
Find the statistics of any baseball team for a particular season. Create a scatter plot of the relationship between batting average and at bats for the team. Make at least two conjectures about the relationship between the variables.
Answer Key: Answers will vary
On her first five history tests, Yoko received the following scores: 82, 96, 92, 83, and 91. What test score must Yoko earn on the sixth test so that her average (mean) for all six tests will be 90%?
Answer Key:
Assessment’s AlignmentCLE D2AACONTENT MA 3 Data analysisPROCESS 3.2 Apply other’s strategies
DOK 2LEVEL OF EXPECTATION
Mastery level-90%
Assessment #2: Is there a relationship between what students scored on their final exam
in math and their SAT math score? Explain your reasoning.
Answer Key: Answers will vary
FHSD Academics LRP Algebra I BOE Approved May 2008Page 52

Activity’s AlignmentCLE D3AACONTENT MA3 Data analysisPROCESS 3.5 Reason logically
DOK 3INSTRUCTIONAL STRATEGIES
Visual representation
Student Resources Teacher Resources
www.brainpop.comwww.classzone.com
Identity Equity and ReadinessGender Equity Technology SkillsRacial/Ethnic Equity Research/InformationDisability Equity Workplace/Job Prep
Content Area: Mathematics Course: Algebra I Strand: Data and Probability 3
FHSD Academics LRP Algebra I BOE Approved May 2008Page 53
2 points: Uses both variables to describe a positive relationship
between math final exam score and SAT math score.
1 point: Does not use the variable names or does not use the term “positive” to describe the relationship.
0 points: Does not use the word “positive” to describe the relationship or use the variable names to describe the relationship.
Assessment’s AlignmentCLE D3AACONTENT MA3 Data analysisPROCESS 3.5 Reason logically
DOK 3LEVEL OF EXPECTATION
Mastery level-85%

Learner Objectives: Students will be able to develop and evaluate inferences and predictions that are based on data.
Concepts: A: Develop and evaluate inferences
Students Should Know Students Should Be Able to Use the line of best fit for a scatter plot to develop and evaluate
inferences and make predictions based on the line of best fit make conjectures about possible relationships between two
characteristics of a sample on the basis of scatter plots of the data (D3AA), MA 3, 3.5, DOK 3
Instructional Support
Student Essential VocabularyInference Characteristic Conjecture Outcomes Omit
Sample Learning Activities Sample AssessmentsLearning Activity #1 : Assessment #1:
FHSD Academics LRP Algebra I BOE Approved May 2008Page 54

The table shows the largest vertical drops of nine roller coasters in the United States and the number of years after 1988 that they were opened.
Years Since 1988
1 3 5 8 12 12 12 13 15
Vertical Drop (ft)
151 155 225 230 306 300 255 255 400
a. Draw a scatter plot and determine what relationships exist, if any, in the data.b. Draw a line of best fitc. Write the slope-intercept form of an equation for the line of best fit.d. Estimate the largest vertical drop of a roller coaster that is opened in 2007.
Answer Key: Answers will vary depending on calculated slope
a. See student graphb. See student graphc. d. Estimated to be 405 feet.
Activity’s AlignmentCLE D2CACONTENT MA 3 Data analysisPROCESS 1.6 Discover/Evaluate relationshipsDOK 2INSTRUCTIONAL STRATEGIES
Cooperative Learning
Learning Activity #2:
Use the table to enter the actual measurements in list 1 and the estimated
Use the table below that shows the amount the United States government has spent on space and other technologies in selected years.
Year 1980 1985 1990 1995 1996 1997 1998 1999 2004Spending (billions
of $)4.5 6.6 11.6 12.6 12.7 13.1 12.9 12.4 15.4
a. Draw a scatter plot and determine what relationships exist, if any, in the data.b. Draw a line of best fitc. Write the slope-intercept form of an equation for the line of best fit.d. Predict the amount that will be spent on space and other technologies in 2007.e. Make a critical judgment about the amount that will be spent on space and other technologies in the next century. Would the equation you wrote be a useful model?
Answer Key:
a. See student graphb. See student graphc. sample answer using (0,4.5) and (16,12.7) d. Sample answer: about 18.3 billione. Sample answer: The amount spent will probably not increase at a constant rate, so the linear equation that is useful in making predictions in the near future would not be useful in making predictions in the distant future.
Assessment’s AlignmentCLE D2CACONTENT MA 3 Data analysisPROCESS 1.6 Discover/Evaluate relationships
DOK 2LEVEL OF EXPECTATION
Mastery level-90%
Assessment #2: 1. Find a line that fits the overall pattern of points. What is the equation
FHSD Academics LRP Algebra I BOE Approved May 2008Page 55

measurements in list 2 of the calculator. Graph the scatter plot of the data and record the window used. Graph the equation y = x on the calculator.a) What does it mean when points are above the line?b) What does it mean when points are below the line?c) What does it mean when points are on the line?
Description Actual Distance (m) Est. distance (m)Item 1 8 9Item 2 5 8Item 3 12 12Item 4 10 7Item 5 16 15
Activity’s AlignmentCLE D3AACONTENT MA3 Data analysisPROCESS 3.5 Reason logically
DOK 3INSTRUCTIONAL STRATEGIES
Cooperative learning
of the line?
2. Predict the quality rating for peanut butter priced at 80 cents per serving. Explain.
Answer Key: Answers will vary depending on chosen slope
Student Resources Teacher Resources
FHSD Academics LRP Algebra I BOE Approved May 2008Page 56
Assessment’s AlignmentCLE D3AACONTENT MA3 Data analysisPROCESS 3.5 Reason logically
DOK 3LEVEL OF EXPECTATION
Mastery level-90%

www.brainpop.comwww.classzone.com
Identity Equity and ReadinessGender Equity Technology SkillsRacial/Ethnic Equity Research/InformationDisability Equity Workplace/Job Prep
FHSD Academics LRP Algebra I BOE Approved May 2008Page 57