contentsdigitalcollections.qut.edu.au/1655/177/clean_air_vol.37_no.1... · contents 2 list of...
TRANSCRIPT

Contents 2 List of Office Bearers
6 Editorial
Einstein - or what does a CV Tell us?
8 President's Column Notes from the President
9 Stop Press
Environmental Trade Mission to Canada
9 Australian Institute of Energy Hydrogen Division
Internationa Hydrogen Conference
10 New Zealand News
11 News from Environment Australia
Setting a Fuel Quality Standard for Biodiesel
11 Welcome to New Members
12 Company and Industry News
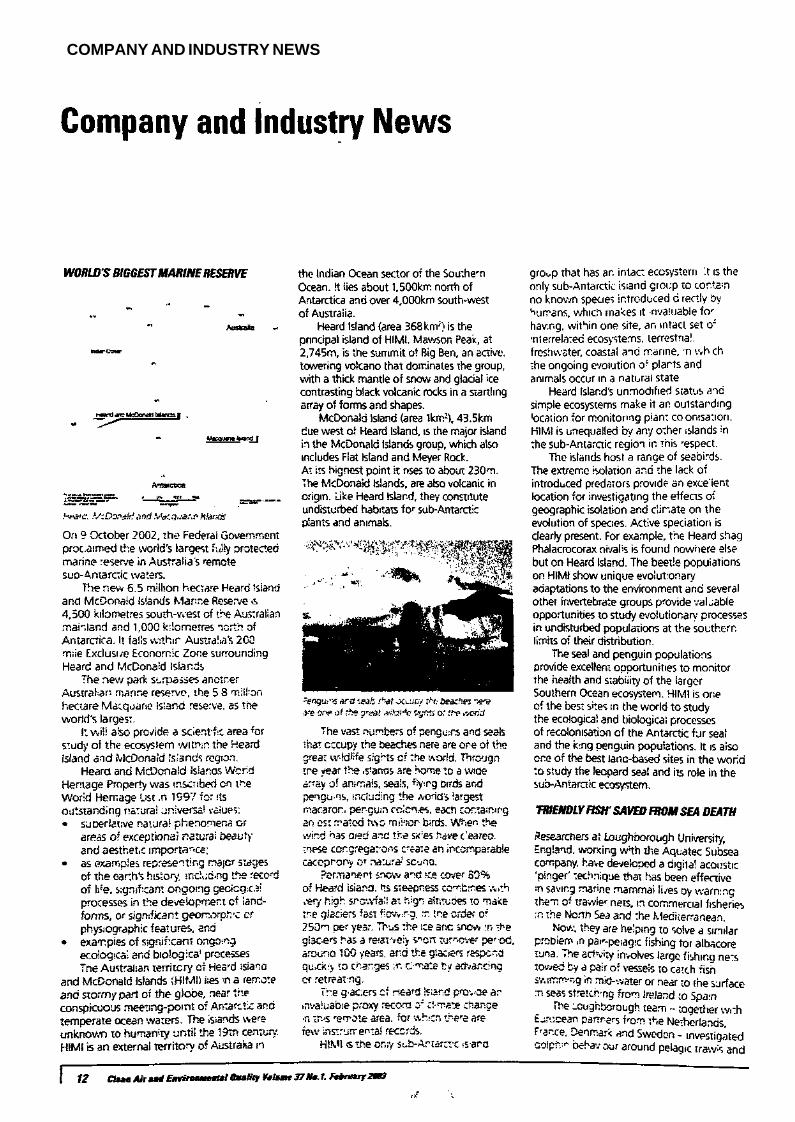
World's Biggest Marine Reserve
'Friendly Fish' Saved frorr Sea Death
New Chief of CSIRO Atmospheric Research D vision
Electric Bikes
Local Government and Greenhouse
Australian Trade Festival Latin America
Australia and Bears
Solar Powers Australia's Greenest Cornercial Building
Incremental Electricity Supply Costs from Additional Renewable and Gas-Fired Generator
Ministers Act on Air Quality and Waste Management
FASTS and National Research Priorities
Queen Victoria Market Solar Energy Project
The Eden Garden Project
Novera and Renewable Energy
Flames, Trains and Tunne s
New Wind Farn Developments for Pacific Hydro
Ministerial Council on Energy Meeting
Liquid Fuels from Trees
Bioenergy Resources Onlne
Bhopal Toxic Waste Clean-Up
Synchrotron Licht Assists Environrnenta Research
United Nations State of World Population Report 2002
Ethical Investment Funds
Impending Global Water Crisis
A Citizen's Guide to Air Pollution 25 Conservation Volunteers Australia
Reports:
26 R.M. Mitchell and J.L Gras Calibration of the Radiance Research M903 Integrating Nephelometer using a non Ozone-depleting Gas The use of ozone-depleting gases for the calibration of integrating nephelometers is being abandoned in favour of chlorine-free compounds Determination of the scattering coefficient of non-ozone depleling HFC-227ea, relevant to the Radiance Research type M903 integrating nephelometer, is discussed.
Clean Air and Environmental Quality Volume 31 No. 1. February 2003 1
Contents 29 D. Mesaros
The Low VOC House - Part 1 How successfully can the theory be put into practice ? The paper discusses acceptable indoor air quality in the modern home. New building codes specify severe airtightness and insuiation levels. Acceptable indoor air quality depends on the reduction of contaminants :n the home and effective ventilation. This is difficult to achieve given the proliferation of new chemical products and their introduction into building materials, furnishings, finishes, and maintenance products.
35 R.K. Seethaler, N. Kunzli, H. Sommer, 0. Chanel. M. Herry, S. Masson, J.C. Vernaud, P. Filliger, F. Horak Jr., ft Kaiser, S. Medina, V. Puybonnieux-Texier, P. Quenel, J. Schneider, M. Studnicka and J. Heldstab Economic Costs of Air Pollution Related Health Impacts - an Impact Assessment Project of Austria, France and Switzerland The quantification of environmental related health effects and their valuation in mcne:ary units play a key role for a sustainability-orientated planning- of policy measures. The paper discusses the calculation of air pollution related health costs using the tri-nat;onal study of Austria, France and Switzerland on health costs due to transport related air pollution.
43 Conference Notes
44 J.Ferris
Acid Drainage and Ecological Risk in a Temporary Stream This short report describes an Australian Nuclear Science and Technology Organisatior. study of the health of a stream affected by acid mine waste.
46 Indoor Air and Environment News: D. Mesaros Report on the National Indoor Air Quality Workshop held at the 16th CASANZ International Conference An overview from :he national indoor air workshop in Christchurch, New Zealand.
49 National Clean Air Conference

Thermo Andersen Ambient Low Volume Air Samplers
US EPA Designated Federal Reference Method Samplers
RAAS2.5 Chemical Speciation Sampler
PM10.PM2.5 Dichotomous Sampler
- Sample both Fractions Simultaneously
RAASZ5 Audit Sampler
also available as -PM10
- 8 Day Sequential Sampler per US Method
Isokinetic Stack Sampling Equipment Ambient Volatile Collection Systems (AVOCS) Viable and Nonviable Cascade Impactors
Lear Siegler Australasia Pty Ltd leaders in environmental monitoring and process control technology Unit 26, 65-75 Captain Cook Drive, Caringbah NSW 2229 PO Box 2735 Taren Point 2229 Tel: 61 2 9531-5444, Fax: 61 2 9531-5411 Email: [email protected] Web: www.learsiegler.com.au

New products taking FH62 BETA GAUGE
Beta Attenuation Mass Monitor for TSP, PM10 and PM2.5
Features
• Direct and continuous measurement of concentration without interruption of sampling.
• Internal logger with storage for 1/2 h averages up to one year (option).
• Low detection limit and high measuring accuracy by optimised resolution.
• Low maintenance, tape life up to three years!
Sampling options
• PM10,PM2.5,TSP
On line data validation
The user can select criteria for data validation including deviation from rolling average,
excursions, and power failure. An error log is maintained!

Australasia by Storm! API Releases the NEW "E" Series
Features
• Expanded microprocessor capability.
• Increase data storage up to 999,999 averages or diagnostics readings, or 5 minute averages for almost 10 years!
• New near-universal power supply reduces the weight of the units. • Flow is now measured by Mass Flow Meters, to increase the accuracy of readings. • The input output board is multi-functional and options now include RS232, RS485,
Ethernet and Analogue. • The Ethernet connection has the ability to assign an IP/TCP address and allows
connection directly to the web.
For supply, spare parts and service technicians located in your state contact TES
The Complete Ambient Analyser Range!
Go Modern...
Contact us for the modern day solutions
Thomson Environmental Systems
PO Box 485, Jannali NSW 2226
Ph: +612 95891666 Fox: +612 95891777
Email: [email protected]
Website: www.thomsongroup.com.Gu

EDITORIAL
Einstein - or what does a CV tell us? Jack O'Heare
Albert Einstein was born on 14 March 1879, at number 20 Bahnhofstrasse, in the city of Ulm, Germany.
Tne street was renamed Einsteinstrasse sometime after Einstein had become an internationally acclaimed scientist. During the Nazis domination of Germany they renamed it Fichestrasse. after an eighteenth century rationalistic German philosopher, to remove the Jewish association. With the defeat of the Mazis it was renamed yet again - guess what - Einsteinstrasse. Einstein said it should be named Windfahrenstrasse (Weather Vane street) to satisfy all future political persuasions.
His parents at ore stage were concerned about his mental ability as he did not begin to speak untii ne was three years old. However he developed into a promising student at elementary school. His mother fondly spoke of her son being an excellent student (what's new?)
At Luitpold Gymnasium, his secondary school, he suffered under a draccnian teacn.ng system and became a run-of-the-mill student. He sad much later in a letter, 'As a student: was neither particularly good orr bad. My principal weakness was a poor memory, especially for words and texts.'
He dropped out of school in his final year at the age of 1b. At 16 he failed the ertrance exam.nation to the Engineering department of the Swiss Federal Institute of Technology Zurich. After a year at a Swiss Cantona. School he obtained a diploma that gave him entry to the Zurich Polyteomic, where he did little on subjects that did not interest him.
With all this on his CV it is not surprising that on his graduation in 1900 he could not find an academic position. In part this would have been due his former teachers, who resented his offhandedness, brashness and questioning, despite flashes of brilliance.
He survived by taking temporary teaching positions. Whi e doing this he found time to submit a treatise on thermodynamics, to the University of Zurich. It was rejected.
He eventually found permanent employment as an Engineer Class 2 at the Swiss Patent Office in Bern. Here he would seem to have spent a major par of his time in the furtive development of scientific theories.
Tharks to nis surreptitious activities he managed to get four papers published in Annalen der Physic, in 1905. They form the basis for our present day understanding of time, space, energy and matter. They also established his reputation internationally as a physicist and mathematician. All of this and a doaoral thesis prepared while working
at the Patent Office, God alone knows how efficient he was at his patent work.
The doctoral thesis was rejected for being too short. It is said that he subsequently resubmitted it with only one sentence added and it was accepted.
With his scientific reputation established, Einstein obtained an academic position at the University of Bern in 1909. In 1914 he was given a Professorship without teaching obligations at the University of Berlin. Anti Jewish hostility in Germany forced him to quit Berlin in 1933. He took up a position at the Institute of Advanced Studies in Princeton USA in 1933. He died at Princeton on 18 April 1955.
The writer now has a number of options for filling the remainder of this page. One would be to compare the conditions of present day teaching tenures in Australian universities and the degree of corporate influence as compared with AE's tenure. However :t is hard to go past Einstein's link with nuclear power with all its pros and cons.
As uranium mining has been mentioned on a previous occasion perhaps we could look at Australia's sole nuclear reactor at Lucas Heights, Sydney.
The Australian Nuclear Science and Technology Organisation (ANSTO) has operated the HIFAR (High Flux Australian Reactor) at Lucas Heights since 1958. HIFAR has made major contributions to Australian activities, particularly in the areas of medicine, research, industry and the environment. It also provides Australia with technical expertise for government decisions on nuclear issues.
The Government decided in 1997 that, subject to environmental cetera being met, HIFAR should be replaced at an estimated cost of $286 million. This is to ensure that Australia retains the capabilties to produce its own nuclear medicines and industrial radioisotopes, to conduce nuclear research and to remain abreast of regional and international nuclear developments
Following a comprehensive environmental assessment process, contacts were s.gned in July 2000 for the construction of Australa's replacement nuclear research reactor, between ANSTO and the Argentinian company INVAP S.E. and its Australian alliance partners, John Holland Construction and Engineering Pty Ltd and Evar.s Deakin Industries Limited. The replacement research reactor is due -or completion in 2005.
HIFAR is one of some 260 research reactors operating around the world. About 50 are in the Asia-Pacific region.
None has had an adverse impact on its community. They are often sited on university campuses or in residential areas.
The reactor produces most of Australia's growing nuclear medicine needs and supports ANSTO's research. HIFAR also provides more than 7,000 hours per year in neutron beam time to scientists and students from Australia and overseas, making it a major research too .
HIFAR :s used to make radioisotopes for medicine, agriculture, industry, and research.
Nuclear medicine is one of the fastest growing fields in modern medicine (over 10% per year). On current projections, one in every two Australians can expect to have a nuclear medicine procedure in their lifetime.
It is also used for neutron transmutation doping of silicon. Irradiated silicon is returned to suppliers overseas, where it is sliced into wafers for use in the electronics industry, for example in videos, fax machines, transistors, rectifiers for power transmission, air conditioning control and computers.
Neutron beam faclities are installed around the periphery of the reactor. They help provide stronger, lighter, more heat resistant materials for industry, new chemicals and advanced pharmaceuticals.
HIFAR is housed in a circular steel building, 21 metres in diameter and 21 metres high designed for containment control.
END NOTES
1. Throughout his career Einstein received thousands of letters. Most eventually went to the waste paper basket. Here is one he chose to keep: Dear Mr Einstein i am a little girl of six. I saw your picture in the paper. I think you ought to have your hair cut, so you can look better Cordially yours, Ann G. Kccin.
2. I hope that the above has been useful, in particular the parents of teenagers should realise that there is still hope!
REFERENCES
1. Albert Einstein Creator and Rebel by Bariesh Hoffman published by Har.-Davis. MacGibbon, London. 1973.
2. Albert Through the Looking Glass by Ze'ev Rosenkranz, Jewish National University and Libra'y, The Hebrew University of Jerusalem.
The material on the HIFAR Reactor came from ANSTO, Lucas Heights, Sydney.
Environmental Monitoring Systems & Instruments The widest range of advanced systems & instruments
from the world's leading manufacturers
Flow Measuring Hoods
Dust & Aerosol Monitors
Handheld Particle Counters
Weather Stations & Accessories
Vane Anemometers
IAQ Monitors & Loggers
Advanced Particle Sizers
Particle Research Systems
Hotwire Anemometers
Ultra-fine Particle Counters
Multi-stage Impactors
Digital Micro Manometers
Multi-gas IAO Monitors
Aerosol & Powder Sizers
Condensation Particle Counters Water Quality Instrumentation
Portable Respirable Samplers UV Aerosol Spectrometers Nephelometers Many Other Advanced Products
With nearly 40 years experience, a rental division, a state-of-the-art calibration laboratory, advanced service facilities and professionally trained, experienced sales and technical staff, Kenelec Scientific can provide you with the world's best instrumentation at very competitive prices. FREE lifetime technical support and software updates are all part of the service.
23 Redland Drive, Mitcham Vic 3132 Tel: 1300 732 233 Fax: 1300 732 244 Email: [email protected] www.kenelec.com.au

PRESIDENT'S COLUMN
Notes from the President G.W. Fisher
Greetings
We start 2C03 w i t h a new President -and it's a challenge I'm looking forward to.
| Frstly. I must record a large 'thank you' I to Len Ferrari - b o t h personal'y and on behalf f of ail members. He has done a great job, and
• don't think any of us fully appreciate all the hours of effort he has put in on our behalf. Itrust Len will. r e m a i n a key part of CASANZ for sometime yet .
Secondly, I m u s t also extend my thanks and appreciation to all the others - TOO numerojs to list here • who have given their time freeiy to furthering our aims and I also hope t h i s continues!
Executive Director
One of the biggest chances we've seen for while - initiated by Len and the Executive Committee in 2 0 0 2 - is the appointment of Dr Arlie McQueen as our Executive Director. You will become more familiar with her over the coming m o n t h s , as she undertakes to visit branches a n d come up to speed witn cur activities. Ar l ie is enthusiastic, committed and very professional. We had a number of very highly qualif ied applicants -or this position, and it was a hard choice. We nave some ambitious hooes f o r this new direction we are taking, ard I t rust you will embrace It as much as you c a n .
When Anie j o i n e d us, she quite naturally asked the quest ion 'Weil, what is T you do exactly?' CK, this is easy I thought. We have meetings, hold workshops and training courses, produce a journal we are proud c7', get together at var ious conferences, and
• generally try to ne twork and have professional interactions (and f u n ) whenever we can. But then, that rea l l y doesn't answer the fundamental ques t ion about what goes on a: these even:s. W h a t are they key things we are trying to achieve? Are we rea;ly making a difference? Do we cover the right topics? What should we be doing in the future?
All this prompted a ot of new 'strategising - so we sat down and thought we should take a wider look at w h a t ' s happening in our world, and have come up with a 'mega trends' analysis in air qua l i t y and environment. It's difficult to cove r everything, so the outline following is just o n e view. I hope it helps us over the coming year to stay up-to-date and responsive to t h e challenges ahead.
MEGA TRENDS IN AIR QUALITY AND ENVIRONMENT
What are the trends happening in the world which are l'kely to chance the way we interact with our environment, especially the air?
1. The world is getting warmer
We hear about it all the time. Some might still debate the cause - but there's little argument about the fact. There is huge and growing demand to know more about the effects. More droughts. More floods. Worse storms. Fewer glaciers. Coasts suffering. New diseases. Biodiversity shot. Different crops. More surfing. Less skiing. These are just an obvious few!
2. Carbon constraints are here
The Kyoto Protocol has been signed by nearly 100 countries. There is every likelihood it will come into effect - even without the USA. Many countries, particularly in Europe, have already enacted legislation and are spending serious money on emissions reduction schemes. Many have forward-looking development policies that take account of future carbon constraints. So have many private companies, and many of the world's leading development and investment banks. It will radically change the way we think.
3. Energy demands won't go away
Since the advent of the 'oil' age, the world's energy demand has grown exponentially (in 1900 it was 50 exajoules, in 1950 it was 100, by 2000 it was 500, and by 2050 it's projected to be *,500) A iot of the world is going to be catching up to the energy use rates of the developed nations. Most of the people in the world don't have electricity on-line. Most don't have a car. Most don't have a TV. or a phone, or a fridge, or a computer. They want these things that we take for granted. They need a lot of energy to run!
4. The hydrogen economy is coming
Many of us will live to see the end of the fossil fuel' age. Oil is running out, but it will
almost certainly be supplanted by renewables, hydrogen technnology. and who knows what else, well before we have a crisis. Can we adapt in time?
The hydrogen prospect is very interesting. From an air discharge point of view - it's almost a perfect fuel. Even some of the safety concerns appear overstated. There are still many obstacles to overcome - but the prospects look excellent. The Japanese manufacturers already have a hydrogen fuel cell powered car on the market.
5. Cities are getting bigger - and dirtier
There are now five city areas in the world that have more people than the whole of Australia and New Zealand put together! London, Tokyo, New York, Sao Paulo and Beijing. By 2020 there will be 15 - most in developing nations. Emissions per capita in the west are falling, but not in the emerging economies. Anyone who has visited any one of a number of the new mega-cities can fully understand the challenge!
6. We spend more time indoors
We spend 85-95% of our time indoors, yet most of our effort in assessing environmental exposures ignores this! Dr Joel Schwartz says '...poor indoor air quality is the most significant unresolved environmental cause of preventable deaths :n the world today...' So does WHO. CASANZ has already taken significant initiatives on this with the development of the recent report on indoor air quality. But it's a complex problem, the effects of which are not currently well understood in our homes and offices.
7. We are finding more things that harm us
Almost every time we study something closely enough - we find it's bad for us! Or at least some of us - the old, the young, or the health compromised members of our society. Ultrafine particles, formaldehyde, PAHs, organo-metal complexes, microwaves, EMF, moulds, spores, airborne diseases - perhaps even genetically modified seeds carried through the air! How-do we assess these? Can we - should we -do something about them?
& Business issues drive more environmental action
A number of businesses- both large and small are discovering 'being nice to the environment is good :or business'.
For instance, BP :s no longer an 'oil' company, but is now an 'energy' company, and is the world's biggest investor in solar technology.
Dupont have iarge'.ed an 85% reduction in greenhouse emissions, and are gong to meet it well ahead of schedule. The companies in the Sustainable Business Index on \'YSF are performing significantly better that others.
Legislation has been enacted in France and the UK requiring mandatory sustainable development reporting by businesses. This is a very active and fast moving area requiring mandatory sustainaole development reporting on all businesses.


COMPANY AND INDUSTRY NEWS

_ *


COMPANY AND INDUSTRY NEWS
enough polution-free electricity to supply the needs of more tnan 42,000 average Victorian homes.
The wind farms will abate over 290,000 tonnes of greenhouse gas emissions eacn year, which is equivalent to eliminating the annual emissions from over 65,000 cars
Energy retailer Origin Energy has signed iong term power purchase agreements to buy the energy and renewable energy certificates generated by the wind farms, providing a stable revenue steam for both projects. Origin Energy has also secured an option of taking a future equity stake of 50% in the Challicum Hills project.
The Challicum Hills wind farm will consist of 35 wind energy generators which will be the first suppiled under the 600MW agreement secured by Pacific Hydro with leading Danish wind generator manufacturer NEG Micon. The role of turnkey contractor for the development wiII also be completed by NEG Micon.
The Yambuk wind farm consists of 20 wind energy generators and will also be part of the frame agreement. The development of this project Is conditional upon the Portland Wind Energy Project gaining Federal Government environmental approval.
This is the frst step in a process that will ultimately see a vibrant local wind energy manufacturing industry established in regional Victoria, said Jeff Harding, Pacific Hydro Managing D rector.
'The projects continue Pacific Hydro's track record of successful project development and demonstrate that our business models
and development processes are sound. 'We are delighted to continue our
relationship with Orgin Energy and are encorraged by their commitment to and confidence in Pacific Hydro and the renewable energy sector.
'The- critical mass provided by the Potland Wind Energy Project and Challicum Hills wind farm will underpin the NEG Micon manufacturing program.
The Challicum Hills development will provide a significant boost to the local economy from construction through to operations, maintenance and local tourism. Already one regionally based business. Portland engineering company Keppel Prince, is expanding tower fabricaton facilities as a result of this project,' said Mr Harding.
These power purchase agreements continue the excellent working relationship between Origin Energy and Pacific Hydro that began with the Codrington wind farm,' said Peter Vines, Origin Energy Executive General Manager Retail.
'These contracts clearly demonsrate our commitment to growing Australia's renewable energy sector. The 100% clean energy from the wind farms will supply our growing Green Earth customer demand for clean. electricity. Any energy generated surplus to our Green Earth demand will assist in meeting our Mandatory Renewable Energy Target obligations,' said Mr Vines.
Both wind farms will be connected to the natonal energy market via the local distribution network owned and operated by Powercor Australia.
For further information contact: Jeff Harding, Managing Director Roy Adair, Chief Operating Officer Andrew Richards, Marketing Manager Pacific Hydro Limited Tel: 03 9620 4400 Fax: 03 9620 4433
MINISTERIAL COUNCIL ON ENERGY MEETING
The Ministerial Council on Energy (MCE) held its third meeting in Brisbane during November 2002.
The Council comprises Commonwealth, State and Territory Ministers with responsibility for energy policy. Energy ministers from New Zealand and Papua New Guinea have observer status on the Council.
The Council of Australian Governments (COAG) has charged the Council with a set of priority tasks that focus on energy market reform, it recognition that energy market reform is a key strategic issue and priority for Australia's future economic wellbeing.
A key element for Council consideration was the COAG independent review of Energy Market Directions. A draft report was released on 15 November 2002. The Ministerial Council will prepare a report to be submitted to COAG in, mid-2003. Other main issues discussed included:
Security of the Energy Sector
Ministers discussed the national response and processes that would be undertaken, in the event of a threat to the security cf the energy operations, including installations and supplies.
Clean Air and Environmental Quality Volume 37 No. 7. February 2003 21

COMPANY AND INDUSTRY NEWS
Review of Gas Access Regime
MCE agreed to the review of the Gas Access Regime (code and legislation). Draft terms of reference will be reviewed in 2003.
Standby Power Strategy
The Council released its 10 year strategy for addressing standby power for consumer products w'th the release of tre publication Money Isn't All You're Saving
Australian Governments have noted that standby power consumption accounted for up to 11.6% of Australia's household electricty usage, costing Austalian households more than $500 million and generating more than five million tonnes of carbon dioxide per annum in 2000.
MCE's Role in Greenhouse Issues
In recognition of the importance of greenhouse issues in setting future national energy policy and programs undertaken by the Council, a standing agenda itern for future Council meetings was established on the MCE's role in respect to development of nationa greenhouse policies and measures.
Mandatory Renewable Energy Target Review
The Council discussed the terms of reference for tne fortncoming review of the Commonwealth Renewable Energy (Electricty) Act 2000 in addition to those outlined in the Act. Details of the conduct of the r e v i e w were expected to be announced bofore 18 January 2003 and it is expected that the Council will be a contributor to the Review.
Zero Emissions for Coal-Fired Power Generation
Dr Robin Batterham, Commonwealth Chief Scientist, provided Ministers with a presentation on 'Get:ing Emissions (Way) Down, Stationary Power: A Key Target'. It focused on the opportunities and potential, for development of clean coal technologies, specifically coal gasification coupled with CO2 capture and geological sequestrator to be able to reduce or eliminate emissions from power stations.
The next meeting of the Ministerial Council on Energy is scheduled for April 2003.
LIOUID FUELS FROM TREES
A new report from the Joint Venture Agroforestry Program (JVAP) has found significant potential for an alcohol fuel industry based on trees harvested from farm forestry.
Titled Wood for Alcohol Fuels: Status of technology and cost benefits analysis of farm forestry for bioenergy, the report states the potential market for these fuels in Australia is considerable and a liquid fuels industry using biomass may be a driver for tree planting on a massive scale.
The report said the alcohol fuels metharol and ethanol can be obtained from trees. Ethanol is already in use in a number of countries, both as a liquid transport fuel in its own right and via blends of ethanol and petroi.
Currently, there is a relatively large price gap between the cost of alchol fuels from biomass and the ex-refinery cost of petrol. Alcond fuels cannot be expected to compete on a simple economic basis (with no accounting for environmental or other benefits) against petrol unless there is a large, and sustained, increase n the price of crude oil.
However, the report said it is recognised the cost of alcohol fuels from wood should come down with technical improvements over the next few years. In addition, alcohol fuels can provide significant benefits in terms of greenhouse gas reduction, both over petrol and over many other renewable fuels.
The planting of trees in selected areas is also antcipated to bring about salinity benefits and potentially other benefits to the environment and rural Australia.
Planting trees in selected areas will bring salnity reduction benefits as well as greenhouse gas reduction benefits.
In this study, greenhouse gas benefits and on-farm salinity benefits have been assessed in terms of their ability to close the gap that is identified for biomass based fuels.
The report includes preliminary cost conversions and price estimates that allow for initial comparisons between the cost of renewable liquid fuels arid their fossil fuel counterparts now and in the future.
It is possible that other products could be produced in conjunction with the manufacture of alcohol fuels from trees. Work under way in Western Australia with integrated processing of mallee eucalypts for renewable electricity, activatec carbon and eucalyptus oil is one example of multiple products supporting improved project economics.
Co-products relevant to liquid fuel production include oils extracted from leaf material and new products from the lignin. If produced in sufficient quantites or at sufficient value, such co-products would improve the commercial viability of alcohol fuel production.
Copies of R.IRDC reports can be downloaded free of charge from the RJRDC website: www.rirdc.gov.au Hard copies can be purchased online or by tel: 02 6272 4819 A free publication catalogue is also available.
BIOENERGY RESOURCES ONLINE
A new tool to assist the development of Australia's emerging bioenergy industry was launched on 7 December at the Bioenergy Australia 2002 conference in Syeney.
The online Bioenergy Atlas of Australia (www.brs.gov.au/bioeneruv_atlas) brings together the best avalable data and information on existing and potential resources, industry and infrastructure. The Atias has two main components: • a Geographic Information System (GIS)
providing online mapping and query capabilities; and
• a Decision Support System (DSS) that is used to peform predetermined analyses. Users can identify the location and extent
of bioenergy resources that meet specified criteria using the DSS, for example, processing residues with n 50 kilometres of major roads and centres.
In addition to the national GIS and DSS. more detailed information (where available) is provided for the Lachlan and Goulburn-Broken catchments of south-eastern Australia. Further development and update of the Atlas in consultation with users is envisaged to include other relevant bioenergy industry data and information for various regions across Australia.
Background
The Federal Govenrment's Mandatory Renewable Energy Target (MRET) commenced on 1 April 2001, as part of Australia's response to global warming.
It requires the generation of 9,500GWh of extra renewable electricity per year by 2010 - this is enough power to meet the residential energy needs of approximately four million people.
Compared with other forms of renewable energy, use of biomass for electricity production, bioenergy does not increase the overall levels of carbon dioxide in the atmosphere. Carbon dioxide is emitted when, biomass is burned or energy is extracted in other ways, but regrowth of the biomass
22 Clean Air and Environmental duality Volume 37 No. 1. February 2003
Fuels from biomass can replace petrol or diesel in vehicals.

COMPANY AND INDUSTRY NEWS
takes an equivalent amount of carbon dioxide from the atmosphere.
Biofuels like ethanol can also be used to replace petrol or diesel powered vehicles, similarly reducing net carbon dioxide emissions. A current government initiated study is investigating market barriers to increased use of biofuels in transport in order to develop a broad strategy that will increase production of biofuels to 350 million litres per year by the year 2010. Government initiatives of this type are expected to provide further market incentives for bioenergy in Australia
The project was undertaken by the University of Adelaide and Bureau of Rural Sciences in collaboration with the Australian Greennouse Office and the Jonint Venture Agroforestry Program.
BHOPAL TOXIC WASTE CLEAN-UP
Delhi, 25 November 2002: Police arrested 56 volunteers. including survivors of the 1984 Union Carbide gas disaster and Greenpeace activists from 14 countries, to prevent them from cleaning up toxic waste in Bhopal.
The volunteers, including several Australians, were attempting to safely contain some of the hundreds of tonnes of toxic chemicals abandoned in Bhopal by the US multinational. The 1984 gas leak caused the world's worst industrial disaster killing 8,000 people within days and injuring half a million. 20,000 peoole have died since and one person still dies each day from illnesses related to the accident.
Mr Ananthapadmanabhan, Executive Director of Greenpeace lndia said, 'It's Dow, as the new new owner of Union Carbide, that's behaving criminally by abandoning these poisons here, not these peaceful volunteers. It is surprising that the Government of India arrested us rather than supporting our efforts to protect people and make sure Dow accepts its responsibilities in Bhopal.'
Despite repeated demands by Bhopal survivors, neither Union Carbide nor Dow has come forward to clean up the site. Greenpeace scientific assessments have found hundreds of tonnes of toxic pesticides and other hazardous materials throughout the factory that have leaked into the soil and contaminated the water used by nearby communities. The factory site and surrounding area is an ongoing threat to the health of 500 families that live nearby.
Here in Bhopal, many people say the lucky ones are those who died in 1984. Dow's refusal to clean up the factory site is poisoning us daily. By refusing to clean up the site, Dow is exposing another gereration of children to dangerous chemicals. 'They can arrest us but will not stop us in our struggle for justice' said Rashida Bi, who survived the 1984 gas disaster.
'The Bhopal disaster will not end until Dow Chemicals cleans up Bhopal, provdes medical assistance, clean running drinking water and full compensation to survivors. Dow has accepted liabiities for environmental crimes commuted by Union Carbide in the US, row It must accept its liabilities here in India.' added Mr Ananthapadmanabhan.
For further information see; www.greenpeace.org for reports on the Bhopal Legacy and Technical Clean up Guidelines.
(Source: Grecnoeace Ajstralia Pacific Tel: 02 9261 4665 Fax: 02 9251 4588)
SYNCHROTRON LIGHT ASSISTS ENVIRONMENTAL RESEARCH
From fighting diseases and polution to coping with global warming, an Australian synchrotron light will provide environmental science with a new set of research tools of unprecedented power says Dr Mark Rivers, an associate director of the University of Chicago's Cente for Advanced Radiation Sources at the Advanced Photon Source (APS) at Argonne National Laboratory near Chicago.
Synchrotron light is a billion times more powerful than rays from a medical X-ray machine, and can be delivered in a beam as small as one thousandth of a millimetre in diameter for less than cne billionth of a second, it allows uS to analyse minute samples and TO.low complex reactions step by step.
'The environmental research applications are myriad,' Mark fives says. 'For example, at Argonne, we are using synchrotron light to: • generate a daily ocean temperature
report for the last 10,000 years; • reduce arsenic poisoning in wetlands
in America, and in wells in Ind.a and Bangladesh;
• reduce the chances of wheat crops being devastated by take-all fungus;
Clean Air and Environmental Quality Volume 37 Ho. 1. February 2003 23

COMPANY AND INDUSTRY NEWS
• fellow the life cycle of wild fish; and • study new possibilities for carbon sinks.
Dr Mark Rivers spoke about these and other envirormental applications of synchronotron light at Australia's first workshop on the topic in Melbourne last October.
Short stories about each or these applications are online a: www.byc.com.au
Dr Rivers' visit coincides with commencenent of site preparation works at Monash University in Clayton, Melbourne, signalling that Australia's most significant scientific infrastructure project - the synchrotron - s on track for completion by early2007.
UNITED NATIONS STATE OF WORLD POPULATION REPORT 2002
The medium projection assumes that past progress in bringing down birth rates is maintained. But if we make poor progress in the decades ahead, we could be on target for the United Nations high projection. This would mean a world population of 8.6 billion people by 2025 and 11.2 by 2050.
The United Nations Population Fund (UNFP), annual State of World Population. Report, was launched on 3 December 2002, by Dr Brendan Nelson MP, Minister for Education, Sciences and Training.
The report titled People, Poverty and Possibilities, discusses recent global demographic fends and draws links between population, poverty and development. The report states 'The number of people {3 billion) living on $2 a day or less is the same as additions to world population since I960. Of course the relationship is not direct but population cannot be ignored in the discussion about poverty and how to end it.
Fertility and population growth are highest in tne poorest countries. Some of the least developed countries will most likely triple their population by 2050. Initiatives which aim to reduce poverty, improve health care and create ecucation and employment opportunities are key to slowing population growth. The State of World Population 2002 report suggests that a downturn in fertility can, within one generation, create a demographic window of opportunity for countries to imorove their economic potential - a period in which a large group of working-age people are supporting relatively fewer older and younger'dependents.
The report calls for greater cooperation between governments, the intenational community and the private sector to imorove assistance tc developing countries, particularly in the areas of reproductive health, HIV prevention and ecucation. Developed countries contribute less than a quarter of current expenditure towards the goal of universal access to reproductive health care. The vast majority of funding for these programs is providec by developing nations.
The resort is being released at a time ot increasing controversy and debate around issues of reproductive health and population both within Australia and internationally. For example: 1. There are increasing concerns within the
Australian, business community about the impact of Australia's declining national fertility rate on economic sustainabiirty. This has led to calls for policies and programs aimed at supporting an increase in Australia's population. However, globally there is a need to slow population growth in order for poorer countries to achieve sustainable development and economic growth. A. global perspective on population issues is necessary as Australia will inevitably have to address the effects of poverty and overpopulation such as increasing numbers of refugees.
2. Poverty and inequality are heightened in countries where massive population numbers contribute to scarcity of resources. This contributes to civil unrest and drives migration in search of more favourable conditions, in political terms, there are direct links between the problems of poverty and overpopulation and issues regarding immigration refugees and global security.
3. The United States Government recently •withdrew its support for the official program of action agreed to at the 19S4 International Conference on Population and Development. In particular the US wants to remove all reference to repro-ductive health services and reproductive rights from the Program of Action. This has occurred despite evidence that suggests improving reproductive health care is central to slowing fertility rates and reducing cases of HIV.
For further information contact: ARHA Tel: 02 6287 4422 Fax: 02 6287 3532
ETHICAL INVESTMENT FUNDS
Totai Environment Centre has released the draft results of their study into Australian Socially Responsible Investment Products titled Ethical investment.
The review was undertaken as part of Total Environment Centre's Green Capital Program with support of a wide variety of leading social and environment groups including Amnesty international Australia, Greenpeace Australia Pacific, The Key Centre, Griffith University, Minerals Policy Institute, NSW Council of Social Services. NSW Nature Conservation Council, Oxfam Community
Aid Abroad, Planet Ark, and Worldwide Fund for Nature.
Leading Fund Managers and NGOs met in Sydney tc debate the key, findings of the report in fon t of some 25C leaoers from bus ness. governrnent and community sectors. The reoori concluded: • that generally SRI funds have deveiooed
rigorous metnodologies to assess the social and environmental imoacls of Australian companies;
• community croups generally felt tnat SRI fund managers needed to 'raise the bar to ensure that these assessments eliminated the companies with poor records in terms of their sustainability performance; and
• that the SRI fund managers operated in a far more transparent manner than their mainstream counterparts, but still needed to go much further to allow their investors to see how their social va ues were reflected through their chosen SRI funds Overall, few turd managers were
transparent about their processes for assessing a company's non financial performance ana this is clearly the strongest area for reform. Transparency should involve disclosure of: • details of the principles and policies of
the fund or process; • details of the methodologies applied,
including criteria, weightings, rankirgs and thresholds;
• details of companies screened cut and why; and
• details of companies included and why. Total Environment Centre commissioner.
leading Sydney multi-disciplinary environment, health, safety ana planning firm ERM Australia to undertake analysis and data collation for the review.
IMPENDING GLOBAL WATER CRISIS
if current trends in water policy anc investment ho.d or worsen, we wi:l soon face threats to the global food supply, further environmental damage, and ongoing health risks for the hundreds of millions of people lacking access to clean water. These findings come f rom Global Water Outlook to 2025: Averting an Impending Crisis, a report oy the International Food Policy Research Institute (IFPRI) and the International Water Management Institute (MM!) released on 15 October last.
The report projects that by 2025, water scarcity will cause annual global losses of 350 million, tonnes of food production -slightly more than the entire current US grain crop.
Unless we change polices and priorities, in 20 years, there won't be enough wa*er for cities, households, the environment, or growing food,' cautioned Dr Mark Rose'grant, lead author of the report and senior research fellow at IFPRI. 'Water is not like oil. There is no substitute. If we continue to take it for granted, much of the earth is going to run short of water or food - or both.'
Due in part to rapid population growth and urbanisation in developing countries water use for households, industry, and agriculture will increase by at Ieast 50%
24 Clean Air ant Eaviroameirtal Oaality Volume 37 No. 1. febraary 2003

COMPANY AND INDUSTRY NEWS
in the next 20 years, increased competition for water will severely limit the availability ot water for irrigation, which in turn will seriously constrain the world's production of food.
Declines in food supply could cause prices to skyrocket, and higher prices will lead to significant increases in malnutrition, since many poor people in developing countrys already spend more than half their income on food.
'For hundreds of millions of poor farmers in developing countries, a lack of access to water for growing food is the most important constraint they face,' said Frank Rijsberman, director general of IWMI 'If countries continue to under-invest in building strong institutions and policies to support water governance and approaches to give better access to water to poor communities, growth rates for crop yields will fall worldwide in the next 25 years, primarily because of water scarcity.'
According to the report, it would take only a moderate worsening in global water policy to bring about a genuine water crisis. If governments continue to cut spending on crop research, techology, and infrastructure, while failing to implement institutional and management refomns, global grain production will drop by 10% over business as usual levels, equivalent to losing the entire annual grain crop of India.
Lack of adequate investment and poorly planned systems will hamper progress in providing water and sanitation services for hundreds of millions of people.
'Currentl more than one billion people around the world do not have access to a safe water supply, and adequate sanitation is even less available.' noted Dr Joachim von Braun, director general of IFPRI. Lack of clean water and sanitation is a major cause of disease and child mortality. While world leaders recently agreed at the World Summit on Sustainable Development to cut n half the number of peoole without access to clean water by 2015, this goal will not become a reality unless governments redirect their water policies to meet the needs of poor people.'
Fundamental changes in water policies and investment priorities could achieved substantial benefits and sustainable use of water. For example, the report recommends pricing water to reflect its cost and value.
'Athough water subsidies are commonplace in developing countries, they tend to benefit relativey wealthy people,' explained Dr Peter Hazel:, director of Environment and Production Technology at IFPRI.
'Making affluent people pay for water would encourage them to conserve. It would also free up financial resources to provide clean, safe water to poor people.'
The report also recommends increased investment in crop research, technologies; change, and rurai nfrastructure to boost water productivity and growth of crop yields in rain-fed fanning, which will account for one-half the increase in food production, between 1995 and 2025.
For further information see: hhtp://www.ifpri.org and hhtp://www.iwmi.org ,
A CITIZENS GUIDE TO AIR POLLUTION
Our attention has brought to the publication of David Bates latest book on air pollution A Citizen's Guide to Air Pollution, published recently by the David Suzuki Foundation in Vancouver (see their website for details). Cost is C$25, plus postage. Apparently it is not light reading, but has been strongly recommended. David Bates will be known to many of our members.
CONSERVATION VOLUNTEERS AUSTRALIA
Last year, more than 50 Conservation Volunteers Australia volunteers, have enjoyed tie experience of a lifetime on World Conservation Programs hosted by organisations in the United States,
. Europe and Central America. Last October a team of Australian,
volunteers left Australia to be hosted by the California Conservation Corps (CCC), as part of the California #2 Experience, based at CCC Centres in central and southern California,
Members of the California Conservation Corps participated in CVA projects in South and Western Australia. Following the team's arrival in Adelaide at the end of August, half the team went to the Eyre Peninsula where they spent two weeks constructing a viewing platform at Locks Well Beach near the coastal town of Eltiston. Meanwhile, the other members travelled south to the Fleurieu Peninsula to work in the Yankalilla Bay area on a coastal project and then on to Mitang to a wetland project.
After spending a month in South Australia, the members moved on to Western Australia before returning to America at the end of October.
The CVA-CCC Exchange program now in its fifteenth year, has provided an excellent opportunity for both CCC and CVA volunteers to experience first hand, the environmental and conservation problems associated with two quite different countries.
For further information Conservation Volunteers Australia Freecalt 1800 032 501 Fax: 03 5333 2166 or go to www.corvservationvolunteers.com.au
Clean Air and environmental Quality Volume 37 No 1 Febuary 2003 25

INTEGRATING NEPHELOMETER CALIBRATION
Calibration of the Radiance Research M903 Integrating Nephelometer using non Ozone-depleting Gas R.M. Mitchell and J.L Gras
ABSTRACT
Tne use of ozone-depleting gases for the calibration of integrating nephelometers is being abandoned in favour of chlorine-free compounds such as HFC-227ea (heptafluoropropane), also known by its trade name, FM-200.
This paper reports a determination of the scattering coefficient of HFC-227ea relevant to the Radiance Research type M903 integrating nephelometer. While HFC-227ea is non ozone-depleting, it has significant global warming potential, and may be subject to future regulation. Hence, alternative reference gases such as hydrofluoroethers should be considered.
INTRODUCTION
The use of halocarbon gases such as HCFC-22 and CFC-12 for the up-scale calibration of integrating nephelometers has become a standard procedure. But, given the ozone depleting potential of these substances and Thereduced availability following the introduction of the Montreal Protocol, alternative gases are being considered. For example, carbon dioxide (CO2) is useful where relatively clean condit:ions are expected, out for urban, conditions or where scattering coefficients of hundrecs cf inverse me-game'res (Mm ) or more- are anticipated, an alternative gas with a scattering coefficient similar to that of CFC-12 is desirable, i.e. in the range of a few honored M m ' . Heptafluoropropane (CF3CHFCF3 known as HFC-227ea or more commonly by the trade name FM-200) is now the calibrand gas recommended by AS3508.12.1 (Standards Australia 2001), and the empirical determination of its scattering coefficient nas been reported by B-Dinges (1998) fo- two nephelometer types.
Although tne instruments considered cy B-Dinges ('.998) have been in wide use in air quality monitoring networks across Australia, they represent 'previous-generation' nephelometer designs. More accurate and stable nephelometers with multi-wavelength capacity are now available for fixed applications and smaller lightweight single-wavelength instruments have also become available recently. The empirical calibrations of scattering coefficient reported by B-Dinges (1998) earner be used without validation for other instruments, including these newer designs. Nephelometer response is a direct function of the wavelength of light used, or the effective wavelength if the instruments are broadband.
This depends on the combination of the distribution of wavelengths in the right source and wavelength dependent response of the detector.
Over recent years, several Radiance Resea'ch M903 neohelometers have been used in the Aerosol Program at CSIRO Atmospheric Research. These instruments are compact, lightweight, and have low power consumption, making them deal for applications ranging from portable sampling (Gras etal. 1999, 2000, 2001 ) to deployment at rerrote soiar-powerec aerosol ground stations (Mitchel- and Forgan 2003). These ground stations are aimed at the characterisation of natural aerosol at remote desert and tropical locations, where the nephelometer surface measurements comolerrent column aerosol optical depth measurements obtained from a sun photometer.
Since the M903 nephelometer falls into the broadband class, empirical determination of the effective scattering coefficient is necessary. The purpose of this communication is to describe an empircal determination of the response to HFC-227ea of Radiance Research type M903 nephelometers. This has been determined using a set of five CSIRO in-service nephelometers in order to facilitate the use of HFC-227ea in future calibrations of this type of instrument, it is recommended that this determination replace the result previously reported in the informative section cf Australian Standard AS3S80.12 1 (Standards Australia 2001), where it was indirectly attrbuted to CSIRO.
METHOD
The methodology used in this determination is broadly similar to that used in the study reported by B-Dinges (1998), in that it uses a transfer calibration from gases with known scattering coefficient. In this study we used filtered air and HCFC-22 as the reference gases. HC.FC-22 was taken to have a scattering coefficient 7.69±0.O8 times that of air at the same temperature and pressure, based on Harrison (1977), in agreement with the varue cf 7.7±2% reported by Anderson and Ogren (1998), but significantly higher than the undocumented value of 7.53 given in the M903 user's manual.
Transfer calibration experiments were performed in April 1999, involving a simultaneous determination using five M903 nephelometers, identified as RM2, JG1, JG2, JG3 and JG4. The procedure was repeated in June 2000 using instrument JG4 only. For the
first series of determinations the five nephelometers were connected in series, in the order listed previously. The instruments together were supplied consecutively with air, HCFC-22, HFC-227ea and f i n a l l y air again, all of which were filtered through a high efficiency particulate air '.HEPAj nltc-r 'Pal -Gelman 12144;. At intervals, the direction of gas flow was reversed to remove possible biases due to flov. d!rection. T'he instruments' signal processing software was set u identically, with an averaging period of one minute. Calibrations were carneo out 'with a gas transfer system that al.owed the ca::bration gases to effectively equilibrate to room temperature (flow rates typically 3 L ' or less). In all cases pressure, temperature and humidity were measured in the sample stream as it exited the scattering chamoer giving a good representation of the conditions in the chamber. Al' subsequent analyses utilise the normalised response based on filtered air (scattering coefficient 14.27 Mm" at wavelength / .= 530 nm, T= 0"C. P= 1013hPa) and HCFC-22 (scattering coefficient 107.5 Mm ' at X = 530 nm, T= 0°C, P = 10'.3hPa, with all data reduced to 0°C and 1013 hPa. Although the pressure and temperature sensors were not calbrated irnmediately prior to the experiment, tnis reduction remains valid provided that the sensors respond linearly over the ranges encountered.
Tne time series of one minute mean scattering coeficent values measured by the f ve instruments is shown in Figure 1 whilst Figure 2 shows the corresponcing piot 'or the recalibration of instrument JG4. Filtered air was passed through the instruments both before and after the span gases. Trie small Discrepancy in the filtered air signal between instrument JG4 and the others before the introduction of HC^C-22 led to the adoption of the filtered air data after 1300 in the analysis.
The transition between filtered air and HCFC-22 is markedly sharper than that between HCFC-22 and HFC-227ea. This may result from the fact that HFC-227ea is approximately half the density of HCFC-22, combined with the introduction of the gas at the base of the vertically-standing instruments. Hence, the lighter gas will tend to float to the exit port at the top of the instrument rather than displace the heavier HCFC-22. In addition, flow rates were kept low (<3L min ') to avoid disturbing temperature equilibrium, further extending flushing times. Fiow direction of HFC-227ea was reversed at 1249, by which time the instrument response was essentially stable.
I 26 Clean Air and Environmental Quality Volume 37 No. 1. February 2003
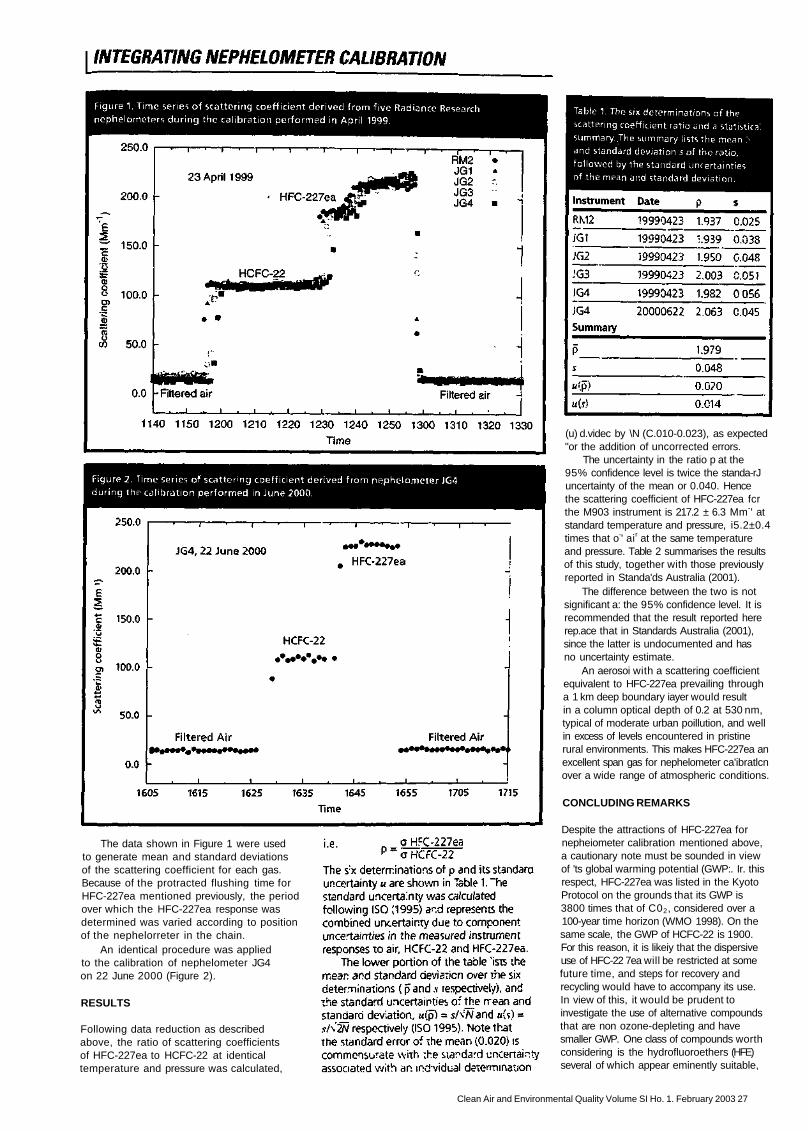
The data shown in Figure 1 were used to generate mean and standard deviations of the scattering coefficient for each gas. Because of the protracted flushing time for HFC-227ea mentioned previously, the period over which the HFC-227ea response was determined was varied according to position of the nephelorreter in the chain.
An identical procedure was applied to the calibration of nephelometer JG4 on 22 June 2000 (Figure 2).
RESULTS
Following data reduction as described above, the ratio of scattering coefficients of HFC-227ea to HCFC-22 at identical temperature and pressure was calculated,
(u) d.videc by \N (C.010-0.023), as expected "or the addition of uncorrected errors.
The uncertainty in the ratio p at the 95% confidence level is twice the standa-rJ uncertainty of the mean or 0.040. Hence the scattering coefficient of HFC-227ea fcr the M903 instrument is 217.2 ± 6.3 Mm-' at standard temperature and pressure, i5.2±0.4 times that o-' air at the same temperature and pressure. Table 2 summarises the results of this study, together with those previously reported in Standa'ds Australia (2001).
The difference between the two is not significant a: the 95% confidence level. It is recommended that the result reported here rep.ace that in Standards Australia (2001), since the latter is undocumented and has no uncertainty estimate.
An aerosoi with a scattering coefficient equivalent to HFC-227ea prevailing through a 1 km deep boundary iayer would result in a column optical depth of 0.2 at 530 nm, typical of moderate urban poillution, and well in excess of levels encountered in pristine rural environments. This makes HFC-227ea an excellent span gas for nephelometer ca'ibratlcn over a wide range of atmospheric conditions.
CONCLUDING REMARKS
Despite the attractions of HFC-227ea for nepheiometer calibration mentioned above, a cautionary note must be sounded in view of 'ts global warming potential (GWP:. Ir. this respect, HFC-227ea was listed in the Kyoto Protocol on the grounds that its GWP is 3800 times that of C02, considered over a 100-year time horizon (WMO 1998). On the same scale, the GWP of HCFC-22 is 1900. For this reason, it is likeiy that the dispersive use of HFC-22 7ea will be restricted at some future time, and steps for recovery and recycling would have to accompany its use. In view of this, it would be prudent to investigate the use of alternative compounds that are non ozone-depleting and have smaller GWP. One class of compounds worth considering is the hydrofluoroethers (HFE) several of which appear eminently suitable,
Clean Air and Environmental Quality Volume SI Ho. 1. February 2003 27

INTEGRATING NEPHELOMETER CALIBRATION
for example.HFE-7200 (C4F9OC2H5), WMO (1998). Experimental determination of scattering coefficients will be required to assess the potential of such compounds as nepnelometer reference gases.
Details of the nomenclature of the gases considered in this paper are given in Table 3.
ACKNOWLEDGEMENTS
The authors wish to thank Mr T. Firestone and Ms J. Powell for ethnical assistance.
AUTHORS
R.M. Mitchell CSIRO Atmospheric Research, Earth Observation Centre, GPO Box 3023, Canberra, ACT 2601 Australia
J.L. Gras CSIRO Atmospheric Research PMB 1, Aspendale, VIC 3195 Australia
28 Clean Air and Environmental Quality Volume 37 No. 1. February 2003
REFERENCES

THE LOW VOC HOUSE- PART 1
The Low VOC House - Part 1 How successfully can the theory be put into practice? D. Mesaros
BACKGROUND
When reviewing published Australian literature on non-industral indoor environments, very little attention has been directed on the possibilities of achieving acceptable indoor air quality within the home envronment. Overall, we spend a s;gnificant proportion of our daliy time budget (approximately 57%) in the home environment (ABS 1998, Cat No. 4153.0), yet indoor air issues regarding tne health risks associated with exoosure to contaminants inside our homes has been largely neglected.
Generally, home building technology has been advancing rapidly in the past two decades, and widespread new building codes now specify airtigntness and insulation levels unheard of by previous generations. While the capability for improved comfort, energy efficiency, and control of indoor air quality are part of this new technology, acceptable irdoor air quality remains entirely dependent on reduction of contaminants in the hone and the provision of effective ventilation. Yet this is almost impossible to achieve given the proliferation of new chemical products and their introduction into building materials, furnishings, finishes, and maintenance products. The most notable of these chemical products are those belonging to the VOC class (Table 1). VOCs have long been associated with acute and chronic health effects, and their presence indoors is of great concern as many have been identified as possessing carcinogenic, neurotoxic, mutagenic and toxicological properties (Tafazoli et al. 1998, Tap et al. 1996).
APPROACHES UNDERTAKEN TO REDUCE VOCs IN THE HOME
Even though the sources of VOCs are numerous (Table 2), anc complete elimlnation is unachievable, their presence can be greatly reduced by applying some foretnought in the building design process. There is overwhelming evidence to demonstrate that the best way to achieve this is source control (European Communities 1989, NKB 1991). According to the Council of the European Communities (CEC), (1989), a building must be designed and constructed in a way that will not be a threat to the hygiene or health of the occupants or neighbours, as a result of any of the following:
• the giving-off of toxic gas; • presence of dangerous particles or
gases in the air; • pollution or poisoning of the soil; and
• the presence of damp in parts of the works or on surfaces within the works The Environmentat Protection Authority
(Victoria; elaborated on the CEC s broad requirements in their proposed ideal house' (Environment Australia 2001, p.189) As an example, EPA Victoria outlined a number of features the idea house would possess, as a means of source control. Therefore: • it would be built on land that had
minimal levels of radon emissions; • it would be designed to allow natural
ventilation of around 1.5 air changes per hour in all weather conditions, while maintainhg a comfortable temperature and relative humidity of 50% or less;
• it would be constructed of natural wood products or brick, with no reconstituted wood-based pane's used in construction or furnishings;
• joinery would be done without the use of solvents and cauking compounds;
• surfaces would be finished with low-emission coatings:
• heating anc cooking appl ances wouic be maintained correcty and operated with local exhaust ventilation;
• no aspestos, or other materials containing respirablie fibres would be used; and
• no tobacco smoking would take place. Even though these directives and
illustrations were designed for an overall reduction in a number of indoor air pollutants (i.e. physical, chemical and biological), their apolication in building design, construction and maintenance would undoubtedly assist in the elimination of many common indoor VOC sources.
DESIGNING THE LOW VOC HOUSE
In response to the concerns over exposure to VOCs and their numerous sources, a project was undertaken in an attempt to determine it a contemporary home could be constructed using materials that were known to be chemically inert, or have very low 'out-gassing' properties. The project's main objective was to ascertain whether all known indoor VOC sources (used in the building construction and maintenance phase) could be reduced to the lowest possible level, and if total elimination of many VOC sources could be achieved.
To date, there has been no house built in Australia with these specific objectives in mind. Significant attempts have been made in designing 'healthy' houses (Gilbert et al. 2002), with some VOC reduction strategies, yet they do not adequately address
(Source: US EPA 1987)
(Source: US EPA 1987)
Clean Air and Environmental Quality Volume 31 No. 1. February 2003 29

THE LOW VOC HOUSE- PART 1
extensive VOC source control or elimination. For example, test houses built (Gilbert et al. 2002) focus on 'source modificaton', and use low-polluting products, sucn as low allergy carpers and low VOC emission paints. Even though these products 'assist' in lowering VOC emissions (Brown 2001), their use can be seen as a compromise. If 'actual' VOC source c o n t r o l were to be achieved, then it would be preferable to eliminate tne use of these materials in the construct on of a home.
Therefore, the house outlined in this article focuses on source elimination, and illustrates steps taken in achieving an indoor home environment that has significantly reduced the presence of VOCs. Overall, all elements associated with construction of the low VOC house were taken into consideration including site planning, overall architectual design (i.e. openable windows), ventilation and Climate control, material selection, and the actual construction process. Because everything used in the house had to be carefully selected, an extensive review was undertaken on VOC sources (US EPA 1987), material emissions (Levin 1991, Maroni & Lundgren 1998, NK6 1991, Salthammer 1997, Wolkoff & Nielsen 1996) and natural house design. Interestingly, very Iittle information was availaole on less conventional building techniques and materials. As a result, many of the methods discussed were achived from 'old fashioned' technology used by previous generations in building construction and maintenance.
CONSTRUCTING THE TASMANIAN LOW VOC HOUSE
Step 1: Site Selection
Many VOCs enter the home from outside sources therefore site selection was of primary importance in the construction of this house
The building site is located in a suburb 20 minutes south of Hobart, Tasmania (Lat 40 S/Long 145°E). The State of Tasmania was chosen to build the low VOC house for the following reasons: • Tasmania has considerably low ambient
air pollution levels (greenhouse gases) when compared to other Australian states (NGGIC 1996); and
• unlike other Australian states1, there are no regulations requiring the foundation to be chemically treated with termiticides (e.g. organic pesticides and insecticides including aldrin, heptachlor, chlordane and dieldrin) before and after construction, Tasmania is exempt from the application of soil treatments under the national termite risk management plan outlined in the Building Code of Australia (BCA 1996, paragraph 3.1.3, par: iii). This exemption is of great importance when trying to build a house low in organic chemicals, because significant contamination
(including those of the VOC class2) from the foundation can be eliminated. An historical search of the site was
undertaken to determine its use prior to purchase. This included an extensive site evaluation to assess possible on-site sources of contamination in tne soil (excluding radon3)
and groundwater, local topography, local temperature and humidity, wind (e.g. seasonal prevailing wind directions and local wind patterns), and distance from nearby air pollutant sources.
Following the site evaluation, the home was then located and orientated in respect to the following main considerations 1. A number of efforts were made to
locate the house well away from air contamination sources (e g. traffic and smog), and regional/local factors that affect air quality (e.g. agriculture, industry, and plants that have a high terpenes content (such as radiata pine). The home was therefore built on an unvegetated, five acre hilltop site, in an area which is well away from many of the common urban and suburban activities.
2. Because natural air movement and control of dampness/mould growth (for MVOC control) were considered a high priority, the house was orientated to face a northerly aspect to gain maximum sunlight, warmth (for thermal comfort), energy efficiency and vertilation. Large opening windows were used extensively to encourage as much natural sunlight and ventilation into the home as possible.
3. To control dampness/mould growth, all surface drainage was sloped away from the building. In addition, a broad, porous border of washed gravel was placed around the foundations to help control any dampness near the house.
4. Winds are predominantly from a westerly direction, therefore windows were positioned with these drections in mine to allow for healthful cross ventilation. Large opening windows were placed on opposite sides of the home, in line with wind directions, to gain maximum berefit and maximum dilution of pollutants (particularly VOCs).
Step 2: Materials and Selection
As seen in Figure 1, only materials that are known to be chemically inert or have lovv outgassing properties were used in the construction of the low VOC house. A complete summary of materials and the reason for their use is oulined in Table 3.
Overall, the house is of a double brick construction (rendered internally), and features Tasmanian hardwood floors, Tasmarian hardwood roof supports, and a tiled roof. All wood was nailed rather than glued (which is known to contain organic solvents) to any supports. Only Tasmanian hardwood was selected for this project for the following reasons:
• Tasmanian harewood is a warm, dense and resilient hardwoco;
• Tasmanian hardwood is kiln dried which accelerates the outgassing of terpene compounds;
• Tasmanian hardwood has a low moisture content and is therefore impervious to most types of insect attack (D Bashford, Entomologist, Forestry Tasmania, personal communication). In Tasmania, this hardwood does ro t require any chemical treatment, unlike wood used in other Australian, states (e g. NSW and Queensland) that is chemically treated5 as an insect control measure (AS1604-1997);
• Tasmanian hardwood is sold free of sapwood reducing lyctid susceptibility (by the lyctid Borer (lyctus brunneus) or Powder Post Borer); and
• unlike some softwoof species (e.g Huon Pine), hardwoods do not have excessively high levels of natural volatile oils. This is seen in Table 4, which illustrates the types of wooes that are suitable and unsuitable for use in a low VOC home. Frequently softwoods are required to be washed with organic solvents for preparation and are best glued using a formaldehyde-based glue, therefore their use is best avoided.
(Source: NASA, American spacecraft substance grading 1990)
30 Clean Air and Environmental duality Volume 37 No. 1. February 2003

THE LOW VOC HOUSE - PART 1
Table 3. Summary of materials used in the Tasmanian low VOC house.
in addition to the materials/products summarised in Table 3, a number of additional considerations were taken into account to further reduce VOC sources. Therefore: • Ceramic tiles were used extensively
throughout the house on the floors, including the walls of the bathrooms (to ceiling height). A tiled wall in the bathroom ensures thai the whole batnroom area is waterproof and is easy to keep clean (simple to wet wipe). By using tiles, the need for treated paint (with mould inhibitors) was eliminated;
• The bathrooms were designed to have extra large opening windows (ensuring high ventilation rates),
to reduce dampness and mould growth i.e. MVOCs.
The kitchen is fitted out with American Oak timber (as seen in plate 1). American Oak has a lower terpenes content than Tasmanian hardwood: A solid stone benchtop (bolted into place rather than glued) was used in the kitchen area rather than a laminated surface; Two extra large windows were placed in the kitchen to increase ventilation and eliminate cooking odours (volatile oils); and Rainwater and not mains water is used in the home so VOC contamination from hot water sources could be eliminated
(e.g. volatilisation of VOCs such as 1,1,1-trichlcroethane, chlorine, chloroform and trichloroethylene during showering and bathing (McKone & Knezovich 1991, Squillace et al. 2002). A filter system was also installed for the drinking water.
American Oak is a 'true' oak (Genus-Quercus). Quercus spp. has a lower teroenes content than Tasmanian Oak which is a eucalypt. Ever though Eucalypt species contain volatile oils, their concentrations can be greatly reduced by the kiln drying process.
Clean Air and Environmental duality Volume 37 No. 1. February 2003 31

THE LOW VOC HOUSE- PART 1
(Source: Forestry Tasmania 2002, Botan'ca 1997)
Step 3: Home Heating
A.I heating and appliances in the low VOC home run on elecricity. Heating is achieved through trie use o! electric radiant wall panels. These panels have no moving pans therefore there s ro frying or stirring of dust. The panels themselves are constructed of an aluminium shelI with a baked ceramic surface. Baked ceramic and metal significantly reduce outgassing of the heated materials.
Step 4: Hard and Soft Furnishings
When renewing tne average home, there are many examples of design features (especially :he extensive use of synthetic furniture) that have the potential to outgas volatile organic compounds into the indoor atmosphere. Generally it is d i f fcu l t to choose between more sutabie build:ng materials (e.g. untreated hardwood) and conventional products -e.g. regular chipboard containing formaldehyde resin and medium density fibreboard) because of a variety of factors. Pressure to use commercial products is great given the extent to which products are acvertised, the overall lack of awareness by individuals of the chemical properties of products and because of the cost involved in using alternatives. In. many cases inapropriate building design elements are unwittingly introduced even though their potential as a contaminant has been well established (Douglas 1998). An example of this is chipboard furnish ng, which is known to outgas formaldehyde but is frequently used regardless.
When constructing and fitting out tne low VOC house, hard and sof: furnishings were also selected with ther outgassing proper t ies in mind (Table 5).
There is an extensive use of giass, stone and brass, all of which are chemically inert (Brown 2001). All soft furnishings used in the house are composed of untreated cotton (including mattresses and rugs), linen or silk. Dark coloured materials were avoided to further reduce the introduction of VOCs (i.e. 1,2,4-trichlorobenzene which is commonly used in dyes). The home was also furnished
conservatively, in an attempt to further reduce the total area of VCC emitting materials.
Step S: Building Maintenance
When reviewing articles on healthy home design, there is almost no mention of ongoing home maintenance. Although rational cleaning of internal surfaces essentially removes potential airborne pollutants from
32 Clean Air aad Environmental Quality Volume 31 No.1. February 2003

THE LOW VOC HOUSE- PART 1
Clean Air and Environmental Quality Volume 31 Wo. J. February 2003 33 1

THE LOW VOC HOUSE- PART 1
Dr Desiree Mesaros Honorary Research Associate School of Geography and Environmental Studies Uriversity of Tasmania Tel. 03 6267 1810
DO WE HAVE YOUR EMAIL ADDRESS?
HAS IT CHANGED RECENTLY?
Please ensure that the Clean Air Society is aware of your current email address. If you haven't received an email message from us recently, and you have a new or changed email address, please send details of your email address to the Secretariat at: [email protected]
34 Clean Mr ami Environmental Quality Volume 37 No. 1. February 2003

AIR POLLUTION RELATED HEALTH IMPACTS
Economic Costs of Air Pollution Related Health Impacts - an Impact Assessment Project of Austria, France and Switzerland R.K. Seethaler, N. Kunzli, H. Sommer, O. Chanel, M. Herry, S. Masson, J.C. Vernaud, P. Filliger, F. Horak Jr., R. Kaiser, S. Medina, V. Puybonnieux-Texier, P. Quenel, J. Schneider, M. Studnicka and J. Heldstab
SUMMARY
The quantification of environmental related health effects and their valuation in monetary units play a key role for a sustainability orientated planning of policy measures. The present paper demonstrates the calculation of air pollution related health costs using the tri-national study of Austria, France and Switzerland on health costs due to transport related air pollution, that was conducted on behalf of the Third WHO Ministerial Conference (London, 1999).
The epidemiological information on exposure-response functions (effect estimates) and health outcome frequencies (mortality and morbidity; prevalence, incidence, or person-days) combined with the air pollution exposure of the population, provides the number of attributable cases to total air pollution and to traffic related air pollution. For the assessment of health costs, two different methods are available. The main method consists of the willingness-to-pay approach, that assesses the willingness to pay for a reduction in risk, that is, for the prevention of a (statistical) fatality or illness. This approach includes the material costs as well as intangible cost elements, i.e. for pain, suffering and the loss of life quality.
A partial method is the human-capital approach that estimates the medical costs and the toss of income, production or consumption arising due to premature mortality or morbidity and which only covers the material cost elements.
Across the three countries (74 million inhabitants) the health costs due to traffic related air pollution for the year 1996 amount to some 27 billion€. This amount translates to approximately 1.7% of GDP and an average of 360€ per capita per year. In all three countries, premature mortality is predominant, accounting for about 70% of the costs.
Keywords air pollution; particulate matter PM10; health risk assessment; monetarisation of health effects; willingness-to-pay approach.
INTRODUCTION
The context of the tri-national study on air pollution related health costs of Austria, France and Switzerland
At the Third WHO Ministerial Conference for Environment and Health (London, 1999), the WHO released a Charter on Transport,
Environment and Health, which claims tnat one of the key elements for sustainabiliity orientated poiicy cesign is the quantification of environmental related health effects and rheir vacation in monetary terms WHO, 1999i. The present paper demonstrates the calculation of air pollution related health costs using the tri-national study of Austria, France and Switzerland on health costs due to transport related air pollution, that was conducted on behalf of the Third WHO Ministerial Conference in London, 1999 (V.-HC, 1999). The main partners for this tri-national project were the Austrian Federal Ministry of Environment, Youth and Family A Pairs and the Federal Environment Agency, the French Agency for Environment and Energy Management and for Switzerland the Federal Department for Environment. Transport, Energy and Communications.
The general structure of the tri-national study
In this project three scientific disciplines worked together: Physics, Epidemiology and Economics. • The air pollution team had to assess the
exposure of tne residential population and identify the transport related share of as pollution exposure.
• The epidemiologic team had to identify the relevant health effects reated to air pollution and establish exposure-response functions that would allow calculation of tne number of attributable cases.
• The economic team had to identify the different cost components related to tne health impacts and determine a way of valuing them in monetary terms. In addition to the population exposure
to the annual average of total air pollution as It was registered in 1996 tor the three countries, a hypothetical situation without the traffic related share of air pollution exposure was established. Knowing the air pollution exposure of the study population in both situations and the relationship between exposure and frequency of health outcomes, the number of mortality and morbidity cases due to air pollution could be calculated for both situations: for the total air pollution and the hypothetical situation without the traffic related air pollution. The difference between the two situations corresponds to the health impacts attributable to traffic related air pollution, which constitutes one of the key interests for the transport policy in the three countries involved n this project.
Finally, for each health outcome the costs had to be established.
Wherever assumptons had to be made in one of the three scientific, domains, the more conservative alterative was chosen resulting in an 'at least approach'. This means that the results must be considered as an 'a: east to be expected level'.
ESTIMATION OF THE POPULATION EXPOSURE
General objectives
In the dornain of air pollution, the annual mean exposure of the residential population had to be assessed. The result is a geographic rapping of different levels of exposure and the number of persons ir each exposure ciass. The emission factor includes not only transport but other sources as well, such as industry and households.
Important epidemiological studies, that were available at the time of the project, established the exposure-response function for the annual average outdoor exposure to PM10. Therefore, PM10 was chosen as the main indicator representing the ambient air pollution mix.
PM1C consists of particulate matter with a diameter lower than 10 micro-meter that pass the larynx ard can reach the lower airways.
Common methodological framework for exposure assessment
In spite of major differences in tneir monitoring networks of ambient air pollution and tne availab.lity of emission inventories in the three countries, a common methodological framework vvas established, which contained the following steps: • Acquisition and analysis of data on the
ambient concentration of particulate matter. Monitoring networks for Black smoke, Total Suspended Particulates
Clean Air and Environmental Quality Volume 31 Wo.7. February 2003 35
between different particle measurement methods. PM10 measured by gravimetric filter samplers as proposed by the European Standardisation Office is used as a reference. Production of a PM10 map for each country, by means of: a. spaiial interpolation between the
measurement stations using statistical methods, setting up a relationship between measured concentration and iand use parameters (e.g. industrial area, traffic area, agricultural area

AIR POLLUTION RELATED HEALTH IMPACTS
36 Clean Air and Environmental Quality Volume 37 No. 1. February 2003

AIR POLLUTION RELATED HEALTH IMPACTS
Overall, these studies give strong evidence for a variety of acute short term as well as long term effects of air pollution on health. Based on this information, the number of additional cases attributable to air oollut:on had to be assessed for each level of exposure.
Common methodological framework
F.gure 3 illustrates a simplified model of an exposure response function. Two elements are important for its determination: • the gradiert or effect estimate indicating
the additional cases for each increase in concentration of PM10; and
• the base line frequency of cases at a concentration level where no impacts are to be expected. The WHO recommends that no lower
threshold for PMIO be used, indicating that even very low mean annual concentrations may have long-term effects on a population. But there are currently no epidemiological studies available that measure the effects below an annual average concentration of 5 ug/m3 of PM10. The lowest level in this study was therefore chosen at 7.5 ug/nrf-which is the class mean of 5-10 ug/m3 PM10.
It needs to be remembered, that whereas the exposure-response function has the same gradient for every country, the base line frequency (which is the number of cases at lowest measured exposure) varies from country to country due to socio-demographic differences in the populations.
In epidemiological studies the result is normally reported as relative risk based on
a multiplicative risk function. For very small relative risks as usually observed for air polluton related health effects, tne difference between multiplicative and additive risk functions is however very small across the range of observed exposure.
In this study the relevant health outcomes have been chosen along two criteria: • Firstly, they are strictly separable from
each other by the ICD-codes (international code of disease) in order to avoid double counting.
• Secondly, the chosen health outcomes must describe health endpoints to which a medical treatment and treatment costs are attributed (e.g. asthma). For example, the decrease in lung function is a health indicator with a strong correlation or exposure response function with regards to air pollution. However it is not a separate health endpoint with a specific medical treatment and was therefore not used in this study.
The included health indicators were: • total mortality (due to long-term exposure)
in aduits (>30 years of age); • hospital admissions for respiratory
and cardiovascular hospital admissions (all ages);
• chronic bronchitis in adults (>25 years of age);
• acute bronchitis h children (<15 years of age);
• restricted activity days in adults (>30 years of age);
• days with asthma attacks in children
(<15 years of age); and • days with asthma attacks In aduits
(>15 years of age). A number of effects for which exposure-
response functions exist were not included, such as the acute effects on mortality, emergency room visits, respiratory symptoms, infant mortality, etc. Either these health outcomes are partially included in the categories chosen (SUCH as emergency room visits that end up in a hospital admission) or no specific medical treatment is defined for them (such as decrease in lung function), or there is insufficient epidemiologic evidence currently available (infant mortality).
Where possible, epidemiological studies from the three countries were used and combined with studies from overseas. Where several studies were available, a meta-analysis was performed. Since there was r.o possibility to conduct a primary epidemiological assessment specifically for this project, this procedure was considered to be more reliable, instead of relying only on one single study at a time. The overall effect estimates were calculated as the variance weighted average across the results of ail studies considered.
Hence, studies with low standard errors entered into this joint estimate with a higher weight.
Combining the base line frequency (Po) at an exposure level of 7.5 ug/m3 PM10 for each heaith Indicator ir each country with the relative risk (RR-1) due to an increase of 10 ug/m3PM 10, the fixed increment (D10) of additional cases can be calculated for an increase in 10 ug/m3 PM10, as showr in equation (t) and Figure 4:
Special attention has to be paid to the . issue of mortality. In the present study the
Song term effect of air pollution or. mortality was considered. The relative risk of these effects Is assessed by cohort studies that follow a large number of people over many years. In contrast, the effect of s shor t term variation in air pollution exposure on daily mortality is measured in time series studies and shows a iower relative risk level-
In the present study the health outcome of long term mortality has been chosen, because the effects of air pollution have two dimensions in time.
First, for some people the level of pollution on a given day or week may trigger
Clean Air and Environmental Quality Valnme 37 No. 1. February 2003 37

AIR POLLUTION RELATED HEALTH IMPACTS
38 Clean Air and Bariroamental Quality Valnme 37 Ne. 1. February 2003