consumption vs. investments for stimulating economic
TRANSCRIPT
Full Terms & Conditions of access and use can be found athttps://www.tandfonline.com/action/journalInformation?journalCode=rero20
Economic Research-Ekonomska Istraživanja
ISSN: 1331-677X (Print) 1848-9664 (Online) Journal homepage: https://www.tandfonline.com/loi/rero20
Consumption vs. Investments for stimulatingeconomic growth and employment in the CEECountries – a panel analysis
Magdalena Radulescu, Luminita Serbanescu & Crenguta Ileana Sinisi
To cite this article: Magdalena Radulescu, Luminita Serbanescu & Crenguta Ileana Sinisi (2019)Consumption vs. Investments for stimulating economic growth and employment in the CEECountries – a panel analysis, Economic Research-Ekonomska Istraživanja, 32:1, 2329-2353, DOI:10.1080/1331677X.2019.1642789
To link to this article: https://doi.org/10.1080/1331677X.2019.1642789
© 2019 The Author(s). Published by InformaUK Limited, trading as Taylor & FrancisGroup.
Published online: 09 Aug 2019.
Submit your article to this journal
Article views: 347
View related articles
View Crossmark data
Consumption vs. Investments for stimulating economicgrowth and employment in the CEE Countries – apanel analysis
Magdalena Radulescu, Luminita Serbanescu and Crenguta Ileana Sinisi
Faculty of Economics and Law, University of Pitesti, Romania
ABSTRACTThe aim of this paper is to find out if the high economic growthrates achieved by the CEE countries are based either on con-sumption or on investments, considering many exogenous factorsthat impact on the economic growth and how these factors cancontribute to the employment process in the CEE economies tostress if these trends of economic growth and employment aresustainable in the long run. We performed two Panel LeastSquares and Pool Least Squares estimations to determine theimpact of the exogenous variables on the economic growth (asGDP per capita growth) and on the unemployment rate in theshort and long run, depending on the lags of the exogenous vari-ables used in the analysis. We used yearly data series during2004–2017 for eight selected CEE countries. Our results show thatprivate consumption is positively related with economic growthin the short run, but it doesn’t support the job creation process,in the same way as the savings rate can’t determine positiveeffects on the employment. Public spending is strongly and nega-tively correlated with economic growth and positively correlatedwith the unemployment rate in the CEE region, while the netexport is weakly impacting on the economic growth in the CEEregion and doesn’t support the employment process in this area.The impact of the domestic investments on the economic growthis weaker in the CEE area than the impact of both private andpublic spending, but they are positively correlated with the eco-nomic growth and negatively correlated with the unemploymentrate, while the correlation of the foreign direct investments (FDIs)with both economic growth and unemployment is very weak, asit is the case of net exports. We conclude that the economicgrowth in the CEE area is mainly based on the private consump-tion in the short run but the private consumption doesn’t supportthe job creation process either in the long run or in the shortrun. The qualitative factors included in the analysis by usingglobal competitiveness index (corruption control, bureaucracy,infrastructure quality, governance effectiveness, political stability,
ARTICLE HISTORYReceived 18 September 2018Accepted 20 December 2018
KEYWORDSCEE countries; consumption;investments; economicgrowth; unemployment;panel analysis
JEL CLASSIFICATIONSE22; E23; E24; E62; F16;F21; F43; H71; H72;J64; O52
CONTACT Magdalena Radulescu [email protected] Faculty of Economics and Law, University of Pitesti,Str. Targu din Vale no.1, Pitesti, Arges, postal code 110194 Romania� 2019 The Author(s). Published by Informa UK Limited, trading as Taylor & Francis Group.This is an Open Access article distributed under the terms of the Creative Commons Attribution License (http://creativecommons.org/licenses/by/4.0/), which permits unrestricted use, distribution, and reproduction in any medium, provided the original work isproperly cited.
ECONOMIC RESEARCH-EKONOMSKA ISTRA�ZIVANJA2019, VOL. 32, NO. 1, 2329–2353https://doi.org/10.1080/1331677X.2019.1642789
rule of law factors, property rights, markets efficiency, etc.) andcorruption perception index are strongly and positively correlatedwith the economic growth and negatively correlated with theunemployment rate.
1. Introduction
After acceding to the European Union (EU), the Central and Eastern European(CEE) economies achieved high economic growth rates, based both on attracting alarge volume of FDI inflows and on a significant increase of the private consumption,boosted by the decreasing interest rates in this area and some very lax credit condi-tions. Many times, the CEE economies were compared to the Asian ‘tigers’ in termsof economic growth. However, the FDIs dropped and the consumption based on bor-rowings generated a high share of non-performing loans during the crisis. That iswhy it would be interesting to see if the re-launch of the economic growth after thecrisis in the CEE area is based on investments or on consumption and how are theinvestment and consumption inter-correlated to see if the economic growth is sus-tainable in the long-run or a new crisis can erupt in the near future in the CEE area.
The FDIs impact on the economic growth was different among the CEE countries.A higher impact was observed for Hungary, the Czech Republic and Slovakia,whereas a lower impact was observed for Poland and Slovenia (Hlavacek &Domanska, 2016). The austerity measures adopted by those countries during the crisisresulted in low investment activity. FDIs are showing a longer-term downward trend.A new growth model is needed in the CEE region (Disoska, 2016). The novelty ofthis paper is that it analyzes the economic growth and employment together and itelaborates a complex model of economic growth and employment for the CEE region,based both on some quantitative and qualitative factors.
The significant emigration process in this region and increase of wages didn’t sup-port the FDIs inflows in this region after the crisis. Thus, FDIs volume remainedmodest after the crisis in the CEE region. Except for the Czech Republic andHungary, the low wages represented a major advantage for the CEE economies intheir race to attract FDIs. With an increasing competition from other developingeconomies, it is challenging to compete on wages alone or even taxation. Developingeconomies in Asia are already shifting into higher-value-added activities. However,the supply of skilled workers is not growing as quickly as may be needed in thisregion (Labaye et al., 2013).
The main issue for the developing economies is getting the financial resources inexcess of domestic savings, which are not very high as in the developed economies.Total savings couldn’t cover the domestic investments and CEE economies becamedependent on the foreign capital. FDIs should support domestic investments, but thisimpact varies among countries depending on the national policies, the type of FDIsand the strength of the domestic firms (Agosin & Machado, 2005; Titarenko, 2005).Mi�sun and Tom�s�ık (2002) proved the crowding in effect (complementary effects) inthe Czech Republic and Hungary and the crowding out effect in Poland. Szkorupov�a
2330 M. RADULESCU ET AL.
(2015) proved there is a crowding out effect in the Central and Eastern Europe (theCzech Republic, Estonia, Hungary and Slovakia) using panel regression. Therefore,FDIs tend to substitute domestic investments in the CEE region on average. Thenational authorities in the CEE region granted much more advantages to the foreigninvestors, in a context of a very friendly fiscal environment with very low levels ofcorporate income tax, but all these advantages couldn’t stop the large FDIs outflowsfrom the CEE countries, once the crisis erupted. So, the economic recovery remainedto be achieved mainly through domestic effort. Thus, other factors – qualitative ones– started to gain importance in this area for the investments and the economicgrowth in this area. If the institutional nature of the factors shaping the frameworkwhere the firms act is not fully understood in the emerging economies, the economicpolicies may become inefficient. This can help firms in the emerging economiesenhance their competitiveness (Peng, Wang, & Jiang, 2008). The developments in theinstitutional framework have been essential in reducing uncertainties for firms.
The relation between consumption and GDP is stronger for low and middle-income countries, because high-income countries allocate more capital for investmentand for research and development purposes (Diacon & Maha, 2015). It is a generalconsensus that the economic growth in developing countries is necessarily consump-tion-led instead of investment-led, mainly because the private consumption share ofGDP in these economies usually ranges between 70 and 75% (Mishra, 2011).
Kim (2017) investigated the relationship between the private consumption andother variables and economic growth in 52 Asian countries/territories and showedthat the consumption-led economic growth hypothesis in Asia is validated, consider-ing some important specific features of the Asian economies such as high global com-petitiveness and some high-saving rates or large public spending. However, thegrowth of consumption and investments has mainly stimulated imports in the CEEcountries. They were not balanced with the exports, thus creating a large vulnerabilityfor the CEE economies. Only Slovenia and the Czech Republic presented stableexports (Disoska, 2016).
After 2014, this region started to grow again, displaying very high rates in someCEE countries such as Romania, Slovenia, Poland or the Czech Republic. Private con-sumption significantly increased because the interest rates decreased almost continu-ously in an attempt of the monetary authorities from these countries to re-launch theeconomic growth after the crisis. Public spending also increased during and after thecrisis due to the public wages increase and because it financed some social protec-tion purposes.
When analysing the effect of an increase in government spending on the economicgrowth, the response of household consumption is a key determinant for explainingthe impact (Gal�ı et al., 2007; Cogan, Cwik, Taylor, & Wieland, 2010). Alexiou (2009)also proved for the South Eastern Europe a positive correlation between public spend-ing for capital purposes, private investments and trade openness and economicgrowth. However, it is financed through taxation or borrowing and both represent aburden for the economy in the long-run.
The aim of this paper is to analyze the main determinants of the GDP per capitagrowth (as a proxy for the economic growth) and of the unemployment rate, during
ECONOMIC RESEARCH-EKONOMSKA ISTRA�ZIVANJA 2331
2004–2017 for eight selected CEE countries (Bulgaria, the Czech Republic, Hungary,Poland, Romania, Slovakia, Slovenia and Croatia). The analysed period starts with theyear when the first CEE countries joined the EU and mainly covers the crisis andafter-crisis period which displayed interesting changes of the impact of the macroeco-nomic variables on the economic growth. This panel analysis uses panel/pool leastsquares estimations for determining the correlation and the impact of the exogenousvariables on GDP per capita growth and on the unemployment rate. This way wecould emphasise any potential changes of their impact over time. The variables used asexogenous factors for determining the GDP per capita growth and the developments ofthe unemployment rate were both quantitative and, also, qualitative factors. The selec-tion of these variables was based on a previous study performed by Kim (2017) formany Asian countries, according to the specific features of the CEE countries, thussome of the variables used in the study for Asia were excluded. The econometric mod-elling techniques also differ from Kim’s study (2017). This way we have adapted themacroeconomic model presented by Kim (2017) in his study and try to build a com-plete macroeconomic model to estimate the economic growth and unemployment ratefor the CEE region, considering the specific features of these economies.
The question of this research is whether the higher growth rates of the CEE regioncompared to the rates of other EU countries are based on public or private consump-tion rather than on public or private investments, and whether these economicgrowth rates are sustainable in the long-run, supporting the employment process andthe economic development of these economies, or, they can’t be supported in thelong-run making the CEE region vulnerable to a new economic crisis in the future.This study tries to bring additional information in this area, with a special focus onthe CEE region, region that displays specific features and a large gap compared to theeurozone in terms of real convergence, by building a complex economic growthmodel, with various quantitative or qualitative exogenous factors, growth that willalso support better employment in this region.
2. Literature review
Many studies revealed the role of FDIs in the economic growth in the developing orless-developed countries, through technological spillovers in the host economy. Ullah,Shah, and Ullah Khan (2014) and Ghazali (2010) found similar results in Pakistanand bidirectional causality has been found between FDIs and domestic investments.A unidirectional causality is found between FDIs and economic growth and all thesefindings show that FDIs supports both domestic investment and economic growth inPakistan. Khan (2007) found a negative relation between FDIs and domestic capitalinvestments in the short run while in the long run it became positive in Pakistan.Domestic infrastructure, the financial sector and macroeconomic stability are import-ant for FDIs to produce positive spillovers. Falki (2009) analysed the effect of FDIson economic growth in the case of Pakistan and showed a negative and weak rela-tionship between GDP and FDIs. She suggests that more greenfield investments alongwith manufacturing investment could improve the export sector and would supporteconomic growth. The government should also improve the infrastructure and skills
2332 M. RADULESCU ET AL.
of the labour force, strengthen the domestic entrepreneurship and provide a suitablemacroeconomic climate for generating positive externalities of FDIs. Eregha (2011)showed that FDIs have a positive impact on domestic investment and economicgrowth in the African countries.
Akanbi (2010) observed that the domestic investment provides more employmentopportunities than the FDIs. Montek (2002) and Villa (2008) find that the causalityruns from domestic investment to economic growth in India and Italy, respectively.Choe (2003) and Qin, Cagas, Quising, and He (2006) showed that the causality runsfrom economic growth to domestic investment in 80 countries worldwide and China,respectively. Furthermore, Tang, Selvanatha, and Selvanathan (2008) investigate thecausal link between foreign direct investment, domestic investment and economicgrowth in China and show that domestic investment and economic growth are posi-tively correlated and find a bi-directional causality between them.
Roman and Padureanu (2012) analysed the relation between domestic investments,FDIs and economic growth using a Cobb–Douglas function and proved a positiverelationship. Ionescu (2015) showed that the worst situation of the FDIs in Romaniaafter the crisis is accompanied by low domestic investment flows and pointed out thenegative impact of some political and institutional factors on investments. Verhornand Vasarevici (2011) proved that FDIs and domestic investment as well as a prudentfiscal and monetary policy are significant determinants of the economic growth inCentral and East European countries.
There are two groups of economists who proved opposite results for the relationbetween public expenditure and economic growth. The first group found a negativerelationship (Romero & Strauch, 2003; Schaltegger & Benno, 2006) between the levelof public expenditure and economic growth. These authors believe that increasing thelevel of public expenditure will lead to the decline of the economic growth and gener-ate a substitution effect on private investments, because when the governmentincreases its spending it needs to increase taxes and that has negative effects upon theeconomy. Szarowsk�a (2011) proved a negative relation between total public expensesand GDP growth in the Czech Republic, the strongest correlation being for the eco-nomic affairs and public services expenses. Justesen (2008) found that a small size ofgovernment is enhancing economic growth. A study conducted by Nut�a, et al. (2015)proved a negative relationship between public expenditure and GDP in Romaniabased on quarterly data during 1990–2011. The second group of economists estab-lished a positive relationship between public spending (for consumption and transferspurposes) and economic growth claiming that an increase in the public spending willimprove the investment climate (Carlsson & Lundstr€om, 2002; Chen & Lee, 2005;Magazzino, 2012; Mavrov, 2007). Szarowsk�a (2012) found a positive correlationbetween public expenses and GDP for eight CEE countries that confirms theKeynesian theory of stimulating the economy by public spending.
Recent empirical evidence suggests that private consumption is stimulated by gov-ernment spending and this evidence is against the existing macroeconomic theory,according to which a rise in public expenditure (based on taxation) should decreaseconsumption (Bouakez & Rebei, 2003). Recent empirical studies based on vectorautoregressions (VARs) find that an increase in public spending leads to a significant
ECONOMIC RESEARCH-EKONOMSKA ISTRA�ZIVANJA 2333

and persistent increase in private consumption and they are complementary for theeconomic growth (Gali, Lopez-Salido, & Valles, 2007; Okubo, 2003; Perotti, 2002). Ifthe government finances the expenditure with loans, private consumption couldincrease. But in the future the government must repay the loans and/or increasetaxes, therefore this positive correlation cannot be supported in the long run. It islargely considered that governments spend money less efficiently than the private sec-tor, not to mention that an increasing government sector and bureaucracy do notsupport productivity and domestic investments.Anghelache, Marinescu, Avram,Burea, and Bodo (2017) found a positive link between the private and public con-sumption and GDP in Romania, but the relation between the private consumptionand GDP is strong, while the relation between the public consumption and GDP isweak. Private consumption was stimulated by the low interest rates and a high risk ofthe allocation process that inhibited the saving process in Romania. Scutaru et al.(2015) proved there is a great impact of the wages and banking loans on the privateconsumption in Romania during 2000–2013. In a study elaborated for 11 CEE coun-tries, Gozgor (2013) showed that only in Croatia and Slovenia the fiscal and budget-ary policy impact on the private consumption in the long run, while in the other 9CEE countries, there will be only temporary effects.
Gbosi (2005) proved that by changing the taxation and public spending, govern-ments can influence the aggregate demand for goods and services. So, he believes tax-ation is positively correlated with unemployment, while public spending is negativelycorrelated with unemployment rate. Battaglini and Coates (2011) observe that theattempt of the governments to fight unemployment by increasing public spending istempered by the high levels of resultant indebtedness. Schclarek (2007) examined theimpact of fiscal policy on private consumption and employment using annual paneldata for 40 countries from all over the world and highlighted the same results forboth industrialised and developing countries. Mahdavi and Alanis (2013) examinedthe unemployment rate–government expenditure relation in a panel of 50 AmericanState and Local Governments and found they are co-integrated in the long run andthat there is a weekly decreasing impact on the unemployment rate. Their results sug-gest that public spending cannot be used as a quick fix in relation to unemployment.Onodugo, Onyebuchi Obi, Anowor, Nwonye, and Ofoegbu (2017) and Genius,Choga, Maredza, and Mavetera (2013) proved in their study that public spending forconsumption purposes and taxation are positively correlated with unemployment,while public expenditure for investments purposes and private investments are nega-tively correlated with unemployment in an emerging market such as Nigeria or SouthAfrica, respectively.
However, there are other studies that proved just the opposite. Feldmann (2006)used data from 19 industrialised countries and proved that a larger share of publicinvestment than private investment in these countries is detrimental to job creation.In their studies, Br€uckner and Pappa (2010, 2012) proved that fiscal policy is not thebest instrument to reduce unemployment using structural VAR. Using OLS estima-tions for Nigeria, Nwosa (2014) observed that government expenditure has positiveand statistically significant impact on unemployment rate (the capital public expend-iture represented a low share of the total public expenditure), while it has a negative
2334 M. RADULESCU ET AL.
and weak impact on poverty rate, mainly because the public expenditure was directedespecially to social purposes and in Nigeria. Abiad, Furceri, and Topalova (2015)study the impact of increased public investments for the employment process for 17OECD countries and show that this impact is significant only in countries with ahigh level of public investment efficiency. Arestis, Baddeley, and Sawyer (2007) andAlexiou and Pitelis (2003) proved that there is a significant and negative relationshipbetween investments and unemployment for the European countries, based on apanel analysis.
Yildirim and Yildirim (2017) show that consumption shocks have a significantimpact on both the unemployment rate and the investments. Positive investmentshocks reduced unemployment rates and a shock in consumption increases invest-ment through the accelerator effect.
AbuAl-Foul (2010) examined the long-term and short-term relationship betweenthe savings rate and economic growth in Tunisia and Morocco using the co-integra-tion technique and Granger causality tests. He found evidence for a long-run rela-tionship in Morocco, but not for Tunisia. In the short-run, he proved a bidirectionalcausality between those two variables in Morocco and a unidirectional causality fromsavings to economic growth in Tunisia.
Romm (2005) used VECM technique to study the relationship between growthand savings in South Africa and confirmed that private saving rate has a direct aswell as an indirect positive effect on economic growth. The positive cause and effectrelation between domestic savings and economic growth may appear in advancedeconomies, in which quite high domestic savings may constitute an essential sourceof financing domestic investment and an economic growth factor, without the neces-sity of using foreign investment, but this is not the case of poorer countries that bor-row mainly to invest and don’t rely on domestic savings, but on the foreign ones(Misztal, 2011). Using an ADLM model, Najarzadeh, Reed, and Tasan (2014) demon-strated a significant positive effect of savings on the economic growth in Iran and abi-directional causality between those two variables.
Andrei and Huidumac (2013) used a panel data analysis in 17 countries from theEuro area and they found that there is a positive relationship between growth andsavings in the long term, as there is a delay of four years. They also proved that theintensity of this relationship depends on the political stability of these countries fromthe eurozone.
Using the Granger causality test, Mohan (2006) proved that only in 2 out of the19 analysed countries (with different economic development level) a higher savingrate causes economic growth, in 13 countries the relation was just the opposite, in 2there was no causal relationship, while in the rest of 2 countries there was a bidirec-tional causality. Baharumshah, Thanoon, and Rashid (2002) also examined the rela-tion between economic growth and savings in five Asian countries (Singapore, SouthKorea, Malaysia, Thailand, and Philippines) using the VECM model and concludedthat the growth rate of savings didn’t determine the economic growth in all analysedcountries with the exception of Singapore.
There are few studies focused on the CEE countries during 1995–2010 that used apanel analysis and shaped the relationship between the economic growth and savings
ECONOMIC RESEARCH-EKONOMSKA ISTRA�ZIVANJA 2335
during the last crisis period and found a negative relationship between those two var-iables. During the boom years, most of the income is directed to consumption, whilein the crisis context, this behaviour changes in the favor of savings. The last hypoth-esis is partly confirmed, because there are some CEE countries with low saving rates(Romania, Bulgaria) where economic uncertainty constraints the population to ‘safetysavings’ (Aron-Niculescu & Mihaescu, 2014). The pattern of savings also depends onthe trade balance, inflation and real interest rates. Ramudo, Grela, and Garcia (2014)pointed out that an increase in the savings rate should cause an increase in theunemployment rate (due to the fall in consumption), but in the long run, throughinvestment, savings could induce a reduction in unemployment. However, in the pre-sent context of very high indebtedness of families and firms, these benefits are notlikely to take place, because increased savings are precautionary and the banking sec-tor has cut credit to the private sector during and after the crisis. Thus, a large con-sumption decrease after the last crisis may have negatively impacted on theinvestment and on the labour market in the long run.
Based on a VEC model, Akalpler (2017) showed that there is a long run co-inte-gration between net exports and economic growth in USA. Import levels andunemployment were observed to be negatively related to economic growth. Somestudies proved that domestic investments are the key to achieving economic growth,while others stated that net exports are an engine of economic growth (Awokuse,2003; Kalaitizi, 2013; Kim & Lin, 2009). Liu, Burridge, and Sinclair (2002) investi-gated the causal links between trade, economic growth and inward foreign directinvestment in China. They found a long-run relationship between growth, exports,imports and FDIs based on a co-integration technique and a bidirectional causalitybetween economic growth, FDIs and exports. Only few researchers such as Crespo-Cuaresma and W€orz (2003) found that net export contributions are not significantenough to cause major changes in economic growth and that net exports are just anindicator of an economy’s productive capacity.
Do�gan (2012) showed that exports decrease unemployment in Turkey. Tiryaki and€Ozkan (2011) analyze the link between economic growth and unemployment andindicate that there is a one-way causality from economic growth to the unemploy-ment rate. Dutt, Mitra, and Ranjan (2009) and Felbermayr, Prat, and Schmerer(2011) analyze the effect of trade policies on the unemployment rate in a heteroge-neous group of countries and found that open trade policies lower unemployment.
Krugman et al. (1995) proved just the opposite, namely a positive relationshipbetween trade and the unemployment rate. In most European countries, trade seemsto have resulted in higher unemployment. Helpman and Itskhoki (2010) argue thatlower trade barriers can lead to an increase in unemployment. Moore and Ranjan(2005) argue that aggregate unemployment is likely to decrease in a skilled-labourabundant country and increase in an unskilled-labour abundant country as an effectto trade liberalisation. Using data for twenty OECD countries, Kim (2011) showedthat an increase in trade leads to higher total unemployment if the labour market isrigid, while it may reduce total unemployment if the labour market is more flexible.Johansson, Heady, Arnold, Brys, and Vartia (2008) or Lee and Gordon (2005) studiedthe impact of different types of taxes on economic growth in OECD member
2336 M. RADULESCU ET AL.
countries. They conclude that economic growth is the most jeopardised by corporatetax, income tax, and consumption taxes. Based on the analysis results, Macek (2015)found that for stimulating economic growth in OECD countries, the economic-polit-ical authorities should lower corporate taxation and personal income taxes, and theloss of income tax revenues should be compensated by the growth of indirect tax rev-enues. On the other hand, there are also very few studies that do not demonstratethis relationship (Vasiliauskaite & Stankevicius, 2009). These few studies proved apositive relation between taxation and GDP per capita growth, but only for the highlydeveloped countries.
Governments concerned with attracting foreign direct investment and boostingeconomic growth should lower corruption, keep taxes low, maintain investment ininfrastructure rather than using revenue for consumption expenditures (Goodspeed,Vasquez, & Zhang, 2006). A rise of the corruption perception index means that cor-ruption perception is improving. Mathur and Singh (2013) proved negative relation-ship between corruption and economic growth.
Some authors (Lambsdorff, 2007) demonstrated that causality runs mainly fromcorruption to GDP and there is a negative relationship between those two variables.Blackburn, Bose, and Haque (2005) and Brown and Shackman (2007) find evidenceof bi-directional causality between GDP and corruption and a negative relationship.Others (Paldam, 2001) stated a uni-directional causality from GDP to corruption anda negative relation. Aidt, Dutta, and Sena (2008) found a bidirectional causality and anegative relation only in the countries with high quality institutions and no relation-ship in countries with low quality institutions.
M�eon and Sekkat (2005) or Mendez and Sepulveda (2006) analysed the relation-ship between corruption and long-run economic growth in the context of the politicalfreedom. They found no relationship between corruption and growth in the ‘not-free’countries. Heckelman and Powell (2008) also found that corruption could supporteconomic growth when economic freedom is very limited but the impact reverseswhen economic freedom is higher.
Borovic (2014) found that higher economic freedom increased the economicgrowth, but its components display various effects on the economic growth. Thesestudies analysed countries with different levels of development. The size of the publicsector limits economic freedom according to the Fraser Institute description ofEconomic Freedom Index. A panel analysis for 57 countries with different level ofeconomic development for the period 2004–2014 also shows a positive impact on theeconomic freedom index on the GDP per capita growth rate, institutional factorsplaying the most important role (Hussain & Haque, 2016).
Heckalman tested the causality between economic freedom and the level of GDPand found the existence of a uni-directional causality running from the economic free-dom to the GDP level. Dawson (2003) showed that causality runs from GDP growth toeconomic freedom. Cebula (2011) found a positive impact of the ten components ofthe economic freedom index on the economic growth in OECD nations, using panelleast squares estimations and panel two-stage least squares estimations.
Olczyk and Kordalska (2015) test the relationship between the GlobalCompetitiveness Index (GCI) and the economic growth rate by using a panel
ECONOMIC RESEARCH-EKONOMSKA ISTRA�ZIVANJA 2337
Granger causality analysis for 114 countries. They confirm a strong unidirectionalcausality running from GDP growth to the competitiveness and find that the GCI isnot successful in predicting economic growth for the majority of the 114 counties,with the exception of few large economies such as China, India, the United Statesand Russia and low-income countries. Thus, the causality from GCI to economicgrowth is mainly valid for the low-income countries.
Schwab (2015) and Lopez-Claros et al. (2006) found that a more competitive econ-omy grows faster. Cazacu (2015) examined the linkage between economic growth andcompetitiveness index on a panel of 28 European countries, during 2006–2013 andfound that a shock in the competitiveness index had a positive impact on GDP devel-opments. Other researchers claim the lack of a good theoretical basis for the selectionof its variables (Berger & Bristow, 2009) and methodological errors which may deter-mine wrong results (Freudenberg, 2003) or that it is not an adequate index for pre-dicting economic growth because it covers so many variables (Xia, Liang, Zhang, &Wu, 2012). Petryl_e (2017) finds no correlation between GCI and GDP growth in EU-27 countries plus Norway, Switzerland, Iceland, the United States and the RussianFederation, but shows that high GCI values avoid sharp GDP fluctuations.
3. Methodology and data
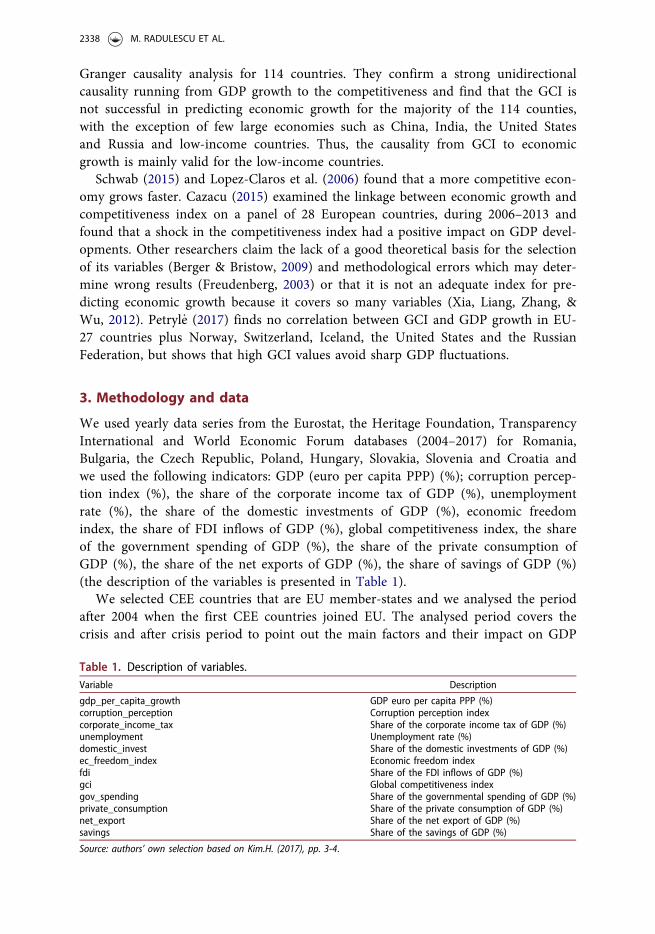
We used yearly data series from the Eurostat, the Heritage Foundation, TransparencyInternational and World Economic Forum databases (2004–2017) for Romania,Bulgaria, the Czech Republic, Poland, Hungary, Slovakia, Slovenia and Croatia andwe used the following indicators: GDP (euro per capita PPP) (%); corruption percep-tion index (%), the share of the corporate income tax of GDP (%), unemploymentrate (%), the share of the domestic investments of GDP (%), economic freedomindex, the share of FDI inflows of GDP (%), global competitiveness index, the shareof the government spending of GDP (%), the share of the private consumption ofGDP (%), the share of the net exports of GDP (%), the share of savings of GDP (%)(the description of the variables is presented in Table 1).
We selected CEE countries that are EU member-states and we analysed the periodafter 2004 when the first CEE countries joined EU. The analysed period covers thecrisis and after crisis period to point out the main factors and their impact on GDP
Table 1. Description of variables.Variable Description
gdp_per_capita_growth GDP euro per capita PPP (%)corruption_perception Corruption perception indexcorporate_income_tax Share of the corporate income tax of GDP (%)unemployment Unemployment rate (%)domestic_invest Share of the domestic investments of GDP (%)ec_freedom_index Economic freedom indexfdi Share of the FDI inflows of GDP (%)gci Global competitiveness indexgov_spending Share of the governmental spending of GDP (%)private_consumption Share of the private consumption of GDP (%)net_export Share of the net export of GDP (%)savings Share of the savings of GDP (%)
Source: authors’ own selection based on Kim.H. (2017), pp. 3-4.
2338 M. RADULESCU ET AL.
per capita growth and the unemployment rate in the selected CEE countries, basedon a panel analysis.
We tested those series for unit root with common root Levin-Lin-Chu test andindividual root PP-Fisher test and found out that all these data-series are I(1) - varia-bles are not stationary at levels but become stationary at first-differences.
We have built two panel data regressions (using Panel LS) for estimating GDP percapita growth PPP and unemployment rate. The linear panel regressions that we built(using LS estimations with fixed effects) display the following equation:
Yit ¼ a þ b � Xit þ ct þ eit (2)
where Yit is the dependent variable, Xit is a K-dimensional vector of regressors, bt isa K-dimensional vector of the regression coefficients, ct represents fixed specificeffects for the units of the transversal or for the specific time period section and Eitrepresents the innovations associated with the equation, unexplained by the inde-pendent variables X, for M transversal units and T periods. K is the numberof regressors.
To allow for heterogeneity across the selected CEE countries, we used an error-component model estimated as fixed effects. We tested this model by using theredundant fixed effects test and the chosen model was validated by the results of thetest. Fixed effects method is a feasible generalised least squares technique which isasymptotically more efficient than Pooled OLS when time constant attributes are pre-sent. We also presented Pooled OLS estimations for GDP per capita growth PPP andunemployment rate for comparison.
4. Results and discussion
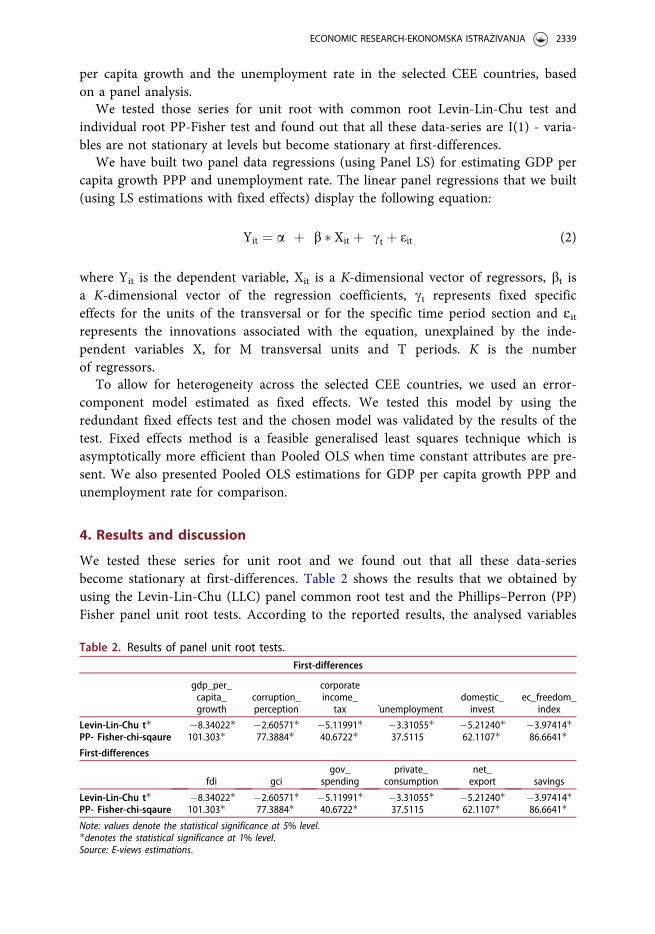
We tested these series for unit root and we found out that all these data-seriesbecome stationary at first-differences. Table 2 shows the results that we obtained byusing the Levin-Lin-Chu (LLC) panel common root test and the Phillips–Perron (PP)Fisher panel unit root tests. According to the reported results, the analysed variables
Table 2. Results of panel unit root tests.First-differences
gdp_per_capita_growth
corruption_perception
corporateincome_
tax �unemploymentdomestic_invest
ec_freedom_index
Levin-Lin-Chu t� �8.34022� �2.60571� �5.11991� �3.31055� �5.21240� �3.97414�PP- Fisher-chi-sqaure 101.303� 77.3884� 40.6722� 37.5115 62.1107� 86.6641�First-differences
fdi gcigov_
spendingprivate_
consumptionnet_export savings
Levin-Lin-Chu t� �8.34022� �2.60571� �5.11991� �3.31055� �5.21240� �3.97414�PP- Fisher-chi-sqaure 101.303� 77.3884� 40.6722� 37.5115 62.1107� 86.6641�Note: values denote the statistical significance at 5% level.�denotes the statistical significance at 1% level.Source: E-views estimations.
ECONOMIC RESEARCH-EKONOMSKA ISTRA�ZIVANJA 2339
are not stationary at levels but become stationary at first-differences at 1% or 5% levelof significance.
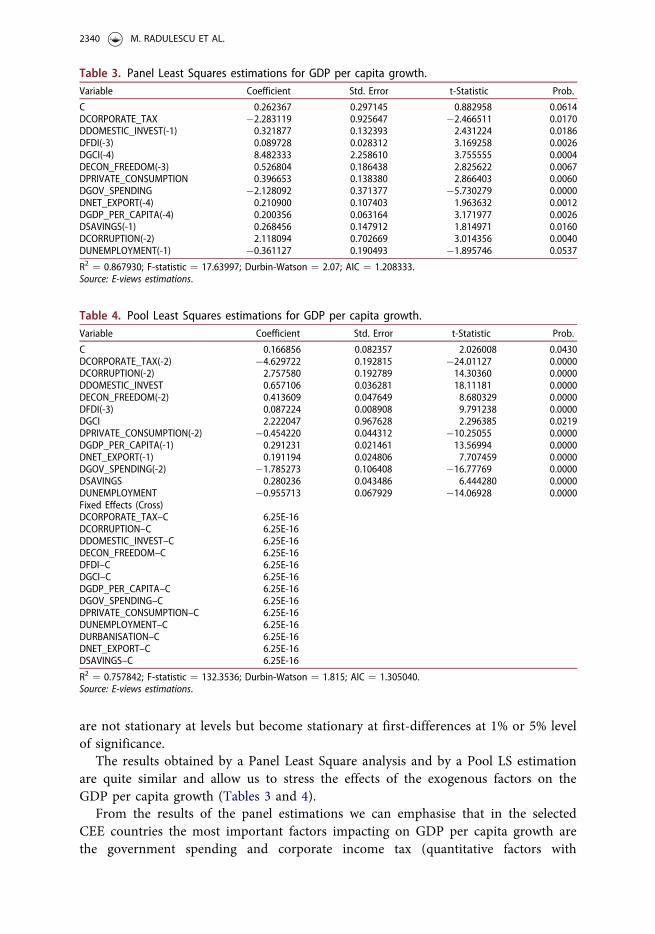
The results obtained by a Panel Least Square analysis and by a Pool LS estimationare quite similar and allow us to stress the effects of the exogenous factors on theGDP per capita growth (Tables 3 and 4).
From the results of the panel estimations we can emphasise that in the selectedCEE countries the most important factors impacting on GDP per capita growth arethe government spending and corporate income tax (quantitative factors with
Table 3. Panel Least Squares estimations for GDP per capita growth.Variable Coefficient Std. Error t-Statistic Prob.
C 0.262367 0.297145 0.882958 0.0614DCORPORATE_TAX �2.283119 0.925647 �2.466511 0.0170DDOMESTIC_INVEST(-1) 0.321877 0.132393 2.431224 0.0186DFDI(-3) 0.089728 0.028312 3.169258 0.0026DGCI(-4) 8.482333 2.258610 3.755555 0.0004DECON_FREEDOM(-3) 0.526804 0.186438 2.825622 0.0067DPRIVATE_CONSUMPTION 0.396653 0.138380 2.866403 0.0060DGOV_SPENDING �2.128092 0.371377 �5.730279 0.0000DNET_EXPORT(-4) 0.210900 0.107403 1.963632 0.0012DGDP_PER_CAPITA(-4) 0.200356 0.063164 3.171977 0.0026DSAVINGS(-1) 0.268456 0.147912 1.814971 0.0160DCORRUPTION(-2) 2.118094 0.702669 3.014356 0.0040DUNEMPLOYMENT(-1) �0.361127 0.190493 �1.895746 0.0537
R2 ¼ 0.867930; F-statistic ¼ 17.63997; Durbin-Watson ¼ 2.07; AIC ¼ 1.208333.Source: E-views estimations.
Table 4. Pool Least Squares estimations for GDP per capita growth.Variable Coefficient Std. Error t-Statistic Prob.
C 0.166856 0.082357 2.026008 0.0430DCORPORATE_TAX(-2) �4.629722 0.192815 �24.01127 0.0000DCORRUPTION(-2) 2.757580 0.192789 14.30360 0.0000DDOMESTIC_INVEST 0.657106 0.036281 18.11181 0.0000DECON_FREEDOM(-2) 0.413609 0.047649 8.680329 0.0000DFDI(-3) 0.087224 0.008908 9.791238 0.0000DGCI 2.222047 0.967628 2.296385 0.0219DPRIVATE_CONSUMPTION(-2) �0.454220 0.044312 �10.25055 0.0000DGDP_PER_CAPITA(-1) 0.291231 0.021461 13.56994 0.0000DNET_EXPORT(-1) 0.191194 0.024806 7.707459 0.0000DGOV_SPENDING(-2) �1.785273 0.106408 �16.77769 0.0000DSAVINGS 0.280236 0.043486 6.444280 0.0000DUNEMPLOYMENT �0.955713 0.067929 �14.06928 0.0000Fixed Effects (Cross)DCORPORATE_TAX–C 6.25E-16DCORRUPTION–C 6.25E-16DDOMESTIC_INVEST–C 6.25E-16DECON_FREEDOM–C 6.25E-16DFDI–C 6.25E-16DGCI–C 6.25E-16DGDP_PER_CAPITA–C 6.25E-16DGOV_SPENDING–C 6.25E-16DPRIVATE_CONSUMPTION–C 6.25E-16DUNEMPLOYMENT–C 6.25E-16DURBANISATION–C 6.25E-16DNET_EXPORT–C 6.25E-16DSAVINGS–C 6.25E-16
R2 ¼ 0.757842; F-statistic ¼ 132.3536; Durbin-Watson ¼ 1.815; AIC ¼ 1.305040.Source: E-views estimations.
2340 M. RADULESCU ET AL.
negative impact on the GDP per capita growth) and global competitiveness index andthe corruption perception index (qualitative factors with a positive impact on theGDP per capita growth). The most important factor (government spending) nega-tively impacts on the GDP per capita growth. The government spending in the CEEregion was mainly directed to social protection purposes (especially during the crisisin Bulgaria, Romania and Hungary) and to increase wages in the public sector, sothese are non-productive public expenses that didn’t support GDP per capita growth.In some selected CEE countries (Croatia, Hungary, Slovenia), the public debt is exces-sive because the non-productive government spending was mainly financed throughan excessive borrowing process. That is why, the long-run and the short-run impactof this factor on the unemployment rate is significant and positive. In these selectedCEE countries, government spending didn’t support public investments, so, the effecton the GDP per capita was strongly negative because these large public sectors didn’tcreate jobs. These findings are in line with previous studies that found a negative cor-relation between public spending and GDP growth (Romero & Strauch, 2003;Schaltegger & Benno, 2006; Nut�a, et al., 2015).
GCI and the corporate income tax are the most important factors both in the shortand in the long run for the GDP per capita growth, followed by the corruption per-ception index and government spending. The government spending strongly andnegatively impacts on the GDP per capita growth in the short run, but its negativeimpact on the GDP per capita growth decreases over time. The unemployment rate(with a negative impact on the GDP per capita growth), domestic investments, theprivate consumption and the savings rate (with a positive impact on the GDP percapita growth) also represent important factors for the GDP per capita growth.Private consumption changes its impact on the GDP per capita. In the short run itsimpact is positive, whereas in the long run this impact becomes negative. The impactof FDIs on the GDP per capita growth is weak and positive in the CEE region.
Corruption perception index improved in many selected CEE countries (Bulgaria,Romania, Croatia and even Slovakia) and that positively impacts on the GDP per capitagrowth. Global competitiveness index positively impacts on the GDP per capita growth.This index includes macroeconomic environment factors, education, infrastructure andmarket efficiency factors (such as corruption control, bureaucracy, infrastructure quality,governance effectiveness, political stability, rule of law factors, property rights). The nextimportant factors impacting on the GDP per capita growth rate are unemployment, pri-vate consumption and savings rate. Unemployment rate is negatively correlated with theGDP per capita growth, as we expected. In the CEE region, the high rates of economicgrowth were achieved by the significant increase in private consumption. This increase inprivate consumption was supported by lax credit conditions and by the rise of total wages(although labour productivity didn’t support such wage increase especially in the publicsector). Thus, the impact of private consumption on the GDP per capita growth was simi-lar to the impact of government spending and it was negative in the long run, while theimpact on unemployment rate was positive both in the short and in the long run. Savingsshould support investments if they are efficiently used, but in the CEE region, they werenot sufficient for investments or efficiently used for the investment purposes, because of ahigh increase in consumption based on banking borrowings at low interest rates. The
ECONOMIC RESEARCH-EKONOMSKA ISTRA�ZIVANJA 2341
correlation between private consumption-savings-domestic investments-net exports-gov-ernment spending is presented in Appendix (a VAR analysis – Table 1) and we can seethat between savings and private consumption there is a negative strong correlation, whilethe correlation between savings and domestic investments and net exports is positive butmuch weaker.
Corporate income tax displays a moderate negative impact on the GDP per capitagrowth, despite the fact that there are few selected CEE countries where this tax isthe lowest in the entire EU (such as in Romania or Bulgaria). Still, the fiscal factorsdon’t seem to be the most important factors for investments and for the increase ofGDP per capita. In the above-mentioned countries there are some additional dutiesaffecting investments and there are some other important factors that negativelyimpact on private investments (domestic or foreign) and, thus, on GDP per capitagrowth, such as corruption, lack of infrastructure, political instability or frequent fis-cal changes. Economic freedom index and FDIs are positively and weakly impactingon the GDP per capita growth, while net exports impact very weakly and positivelyon GDP per capita growth. This means that in some of the selected CEE countries,the imports overlap exports the entire analysed period during 2004–2017 or most ofthat period. FDIs’ impact decreased a lot once the financial crisis erupted in 2008 inEurope, because the CEE region faced important FDI outflows. This trend reversedstarting with 2014, but the FDI inflows never reached important numbers as they didduring 2004–2007 (Tables 3 and 4).
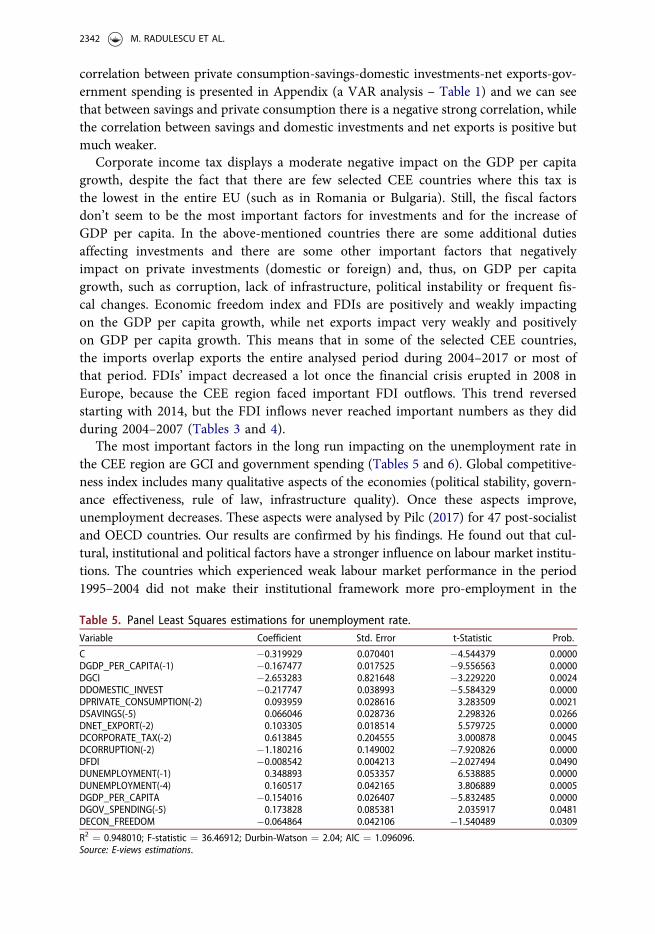
The most important factors in the long run impacting on the unemployment rate inthe CEE region are GCI and government spending (Tables 5 and 6). Global competitive-ness index includes many qualitative aspects of the economies (political stability, govern-ance effectiveness, rule of law, infrastructure quality). Once these aspects improve,unemployment decreases. These aspects were analysed by Pilc (2017) for 47 post-socialistand OECD countries. Our results are confirmed by his findings. He found out that cul-tural, institutional and political factors have a stronger influence on labour market institu-tions. The countries which experienced weak labour market performance in the period1995–2004 did not make their institutional framework more pro-employment in the
Table 5. Panel Least Squares estimations for unemployment rate.Variable Coefficient Std. Error t-Statistic Prob.
C �0.319929 0.070401 �4.544379 0.0000DGDP_PER_CAPITA(-1) �0.167477 0.017525 �9.556563 0.0000DGCI �2.653283 0.821648 �3.229220 0.0024DDOMESTIC_INVEST �0.217747 0.038993 �5.584329 0.0000DPRIVATE_CONSUMPTION(-2) 0.093959 0.028616 3.283509 0.0021DSAVINGS(-5) 0.066046 0.028736 2.298326 0.0266DNET_EXPORT(-2) 0.103305 0.018514 5.579725 0.0000DCORPORATE_TAX(-2) 0.613845 0.204555 3.000878 0.0045DCORRUPTION(-2) �1.180216 0.149002 �7.920826 0.0000DFDI �0.008542 0.004213 �2.027494 0.0490DUNEMPLOYMENT(-1) 0.348893 0.053357 6.538885 0.0000DUNEMPLOYMENT(-4) 0.160517 0.042165 3.806889 0.0005DGDP_PER_CAPITA �0.154016 0.026407 �5.832485 0.0000DGOV_SPENDING(-5) 0.173828 0.085381 2.035917 0.0481DECON_FREEDOM �0.064864 0.042106 �1.540489 0.0309
R2 ¼ 0.948010; F-statistic ¼ 36.46912; Durbin-Watson ¼ 2.04; AIC ¼ 1.096096.Source: E-views estimations.
2342 M. RADULESCU ET AL.
following years and, in consequence, also recorded low values of the employment rate inthe period 2010–2015. The economic factors occurred to be on average an insufficienttrigger for labour market reforms in the group of the analysed countries. A research con-ducted by Cyrek (2017) also indicates that Polish regions, which were the most efficient interms of social integration, were simultaneously those with the best economic results interms of GDP per capita. The highest social efficiency level was characteristic for the high-est employment in the service sector.
Government spending is positively impacting on unemployment rate, because aswe stated above, most of the public spending in the CEE region was directed to socialprotection purposes or to increase wages in the public sector, not to public invest-ments that would have supported the employment process and would have createdjobs in the economies. These findings are in line with those of Feldmann (2006),Bruckner and Pappa (2010, 2012), Genius et al. (2013), Nwosa (2014), and Abiadet al. (2015).
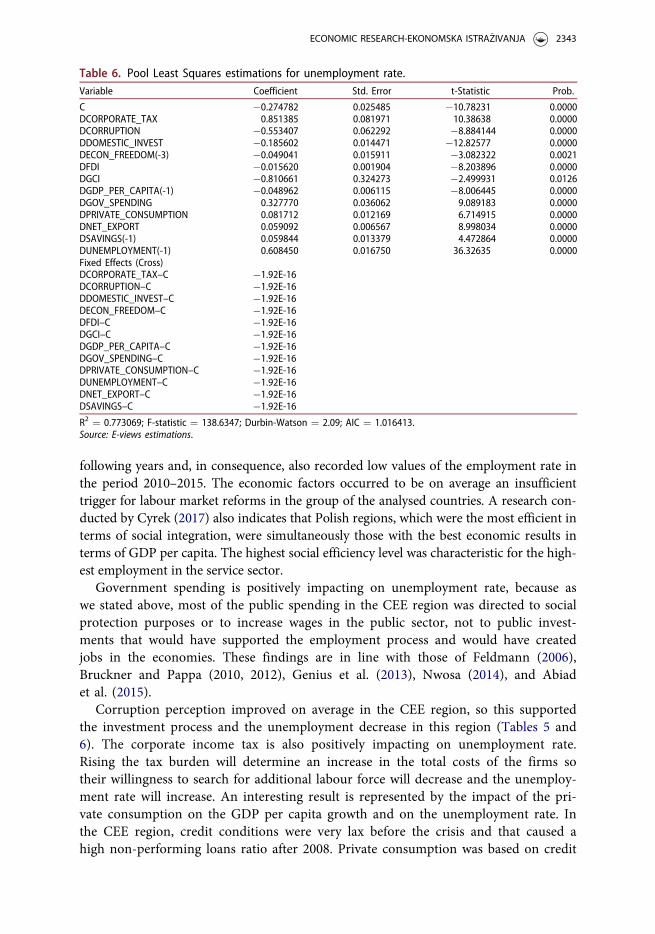
Corruption perception improved on average in the CEE region, so this supportedthe investment process and the unemployment decrease in this region (Tables 5 and6). The corporate income tax is also positively impacting on unemployment rate.Rising the tax burden will determine an increase in the total costs of the firms sotheir willingness to search for additional labour force will decrease and the unemploy-ment rate will increase. An interesting result is represented by the impact of the pri-vate consumption on the GDP per capita growth and on the unemployment rate. Inthe CEE region, credit conditions were very lax before the crisis and that caused ahigh non-performing loans ratio after 2008. Private consumption was based on credit
Table 6. Pool Least Squares estimations for unemployment rate.Variable Coefficient Std. Error t-Statistic Prob.
C �0.274782 0.025485 �10.78231 0.0000DCORPORATE_TAX 0.851385 0.081971 10.38638 0.0000DCORRUPTION �0.553407 0.062292 �8.884144 0.0000DDOMESTIC_INVEST �0.185602 0.014471 �12.82577 0.0000DECON_FREEDOM(-3) �0.049041 0.015911 �3.082322 0.0021DFDI �0.015620 0.001904 �8.203896 0.0000DGCI �0.810661 0.324273 �2.499931 0.0126DGDP_PER_CAPITA(-1) �0.048962 0.006115 �8.006445 0.0000DGOV_SPENDING 0.327770 0.036062 9.089183 0.0000DPRIVATE_CONSUMPTION 0.081712 0.012169 6.714915 0.0000DNET_EXPORT 0.059092 0.006567 8.998034 0.0000DSAVINGS(-1) 0.059844 0.013379 4.472864 0.0000DUNEMPLOYMENT(-1) 0.608450 0.016750 36.32635 0.0000Fixed Effects (Cross)DCORPORATE_TAX–C �1.92E-16DCORRUPTION–C �1.92E-16DDOMESTIC_INVEST–C �1.92E-16DECON_FREEDOM–C �1.92E-16DFDI–C �1.92E-16DGCI–C �1.92E-16DGDP_PER_CAPITA–C �1.92E-16DGOV_SPENDING–C �1.92E-16DPRIVATE_CONSUMPTION–C �1.92E-16DUNEMPLOYMENT–C �1.92E-16DNET_EXPORT–C �1.92E-16DSAVINGS–C �1.92E-16
R2 ¼ 0.773069; F-statistic ¼ 138.6347; Durbin-Watson ¼ 2.09; AIC ¼ 1.016413.Source: E-views estimations.
ECONOMIC RESEARCH-EKONOMSKA ISTRA�ZIVANJA 2343
and this high indebtedness of the firms and of the population negatively affectedGDP growth and caused an increase of the unemployment rate in this region for animportant period of time after the crisis erupted in 2008. The private consumptionrelaunched after 2015 in the CEE region and started to support the economic growth(it significantly supported the GDP growth in some CEE selected countries such asRomania which recorded the highest economic growth rate in the entire EU in thelast two analysed years 2016–2017). The rebound of the private consumption is alsobased on credit and this could endanger the economic stability in the CEE regionand could determine a new crisis in the future. These results are in line with the find-ings of some previous studies carried out by Scutaru et al. (2014) and Gozgor (2013)for CEE countries.
The factors weakly and negatively impacting on the unemployment rate aredomestic investments, FDIs and savings. Investments rebounded after 2014 in theCEE region, but they never reached an increase rate similar to their growth rateachieved before 2008. We can also stress that in the analysed period, the impact ofdomestic investments on the GDP per capita and on the unemployment rate is stron-ger than the FDIs’ impact. FDIs decreased a lot after the crisis erupted in the CEEregion. Moreover, the wage increase and a large labour force emigration processweren’t very attractive factors for the foreign investors to locate their businesses inthe CEE region. This is valid especially for the CEE countries displaying the lowestcorporate income tax such as Romania and Bulgaria, while in Hungary the FDIsstrongly rebounded in the last analysed years. The savings rate was positively corre-lated with the GDP per capita growth, but the savings didn’t support job creation inthe CEE region, thus we can state that savings reached low levels because of lowinterest rates and a significant increase of inflation in the CEE countries (especially inRomania, Bulgaria, Croatia) and weren’t efficiently used for investment purposes.These findings are in line with those of Ramudo et al. (2014). Savings are stronglyand negatively correlated with private consumption (which mainly fueled imports,not the domestic production as we can see from Table 1 in Appendix) and weaklyand positively correlated with domestic investments, because private consumptiondidn’t significantly support domestic investments. Thus, although positively impactingon the GDP per capita growth, they can’t create positive effects for the employmentprocess. Also, the impact of net exports on the GDP per capita growth is marginaland they couldn’t support employment. This may be explained by mainly low-skilledlabour force (determined by a significant emigration process of ‘brains’ from the CEEcountries) and the increase of wages in the CEE region on average. It is also corre-lated with rigid labour markets in the CEE region on average. Moreover, most of theexports in the CEE countries rely on imports. Imports were boosted by the increaseof the private consumption based on credit. Private consumption didn’t stimulatemostly the domestic production, so its impact on the employment rate in the longrun is negative. These findings regarding the impact of the net exports on theunemployment rate are in line with the previous findings of Krugman et al. (1995),Helpman and Itskhoki (2010), and Moore and Ranjan (2005).
The significant increase of the private consumption in the CEE region didn’t gen-erate a similar increase of the domestic investments in the long run and the FDI
2344 M. RADULESCU ET AL.
inflows decreased dramatically after the crisis erupted in 2008 (see Appendix,Table 1). The contribution of the domestic investments to the GDP per capita growthand to the unemployment reduction was rather modest. Reversing the increasingtrend of the private consumption in the CEE region (when credit conditions wors-ened once the crisis erupted in 2008) caused serious negative problems for these ana-lysed economies and negatively impacted on the GDP per capita growth andemployment. The share of the non-performing loans ratio significantly increased inmany CEE countries (Croatia, Romania, Bulgaria).
The most important factors impacting on the unemployment rate are GCI, thecorporate income tax and the corruption perception index, the same as for determin-ing the GDP per capita growth. The government spending is also important for theunemployment rate developments in the CEE region. Both in the short and in thelong run, the impact of the government spending on the unemployment rate is posi-tive. This means that in the CEE region, on average, the state didn’t support the jobcreation process through its budgetary policy and it mainly acted through the fiscalpolicy to stimulate investments or by improving the macroeconomic environment(e.g., decreasing inflation rate in many CEE countries). The savings proved to beinsufficient and inefficiently used and didn’t support the employment process. Theimpact of the economic freedom index, FDIs, private consumption or net exports onthe unemployment rate is positive, but weak both in the shortrun and in the longrun (Tables 5 and 6).
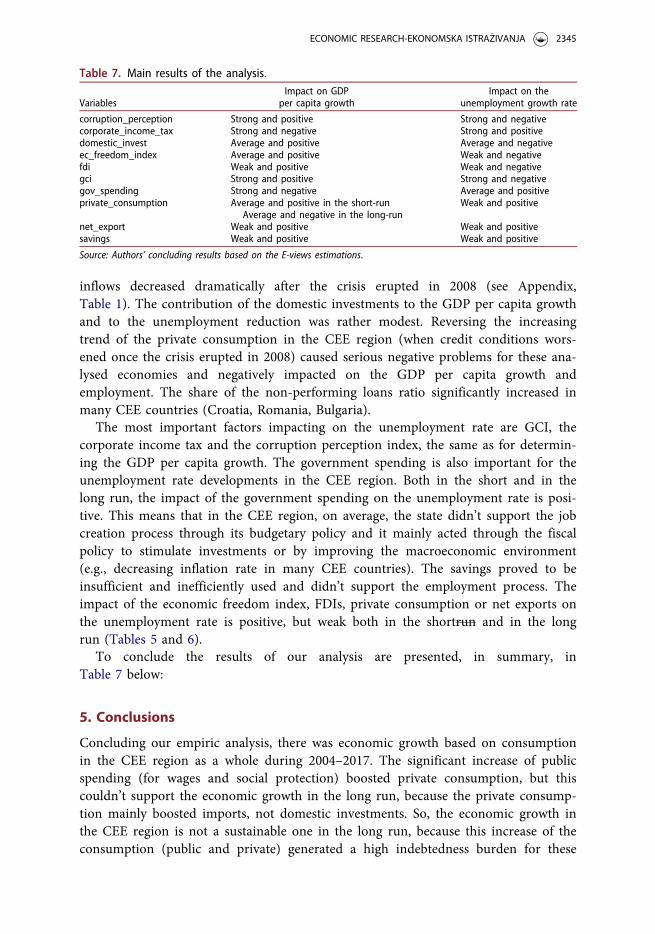
To conclude the results of our analysis are presented, in summary, inTable 7 below:
5. Conclusions
Concluding our empiric analysis, there was economic growth based on consumptionin the CEE region as a whole during 2004–2017. The significant increase of publicspending (for wages and social protection) boosted private consumption, but thiscouldn’t support the economic growth in the long run, because the private consump-tion mainly boosted imports, not domestic investments. So, the economic growth inthe CEE region is not a sustainable one in the long run, because this increase of theconsumption (public and private) generated a high indebtedness burden for these
Table 7. Main results of the analysis.
VariablesImpact on GDP
per capita growthImpact on the
unemployment growth rate
corruption_perception Strong and positive Strong and negativecorporate_income_tax Strong and negative Strong and positivedomestic_invest Average and positive Average and negativeec_freedom_index Average and positive Weak and negativefdi Weak and positive Weak and negativegci Strong and positive Strong and negativegov_spending Strong and negative Average and positiveprivate_consumption Average and positive in the short-run
Average and negative in the long-runWeak and positive
net_export Weak and positive Weak and positivesavings Weak and positive Weak and positive
Source: Authors’ concluding results based on the E-views estimations.
ECONOMIC RESEARCH-EKONOMSKA ISTRA�ZIVANJA 2345
economies and couldn’t generate significant employment effects. FDIs are weakly cor-related with the economic growth currently, while the political and institutional fac-tors became very important for achieving GDP per capita growth or for theemployment process.
The most important factors impacting both on the GDP per capita growth and onthe unemployment rate are GCI (including political and economic institutional fac-tors), the corruption perception index, the corporate income tax and the governmentspending. Corporate income tax displays a much significant negative impact in thelong run than in the short run on the GDP per capita growth and a significant short-run positive impact on the unemployment rate, thus it must be kept at low levels,therefore the issue of financing a higher public or private consumption remains. Thegovernment spending focused mainly on social protection purposes and on wagesincrease in the public sector, disregarding the labour force productivity, didn’t sup-port the GDP per capita growth in the CEE region or the employment process,because public expenses didn’t stimulate the domestic investments. Thus, inflationresurged in Romania, Croatia or Bulgaria at some significant levels compared to EU.In the economies with a large state sector, the efficiency of using the governmentspending and savings for the domestic investments is low. Moreover, the savings ratein the CEE region is much lower than in the developed economies and the savingprocess wasn’t stimulated in the context of a significant decrease of the interest ratesafter the crisis. Thus, the consumption and the investments are based on bankingborrowing and this represents a burden for these economies as we could see from thedevelopments of the non-performing loans during the crisis period. The qualitativeaspects included in the GCI are the most important determinants for the GDP percapita growth and for the unemployment rate developments both in the short and inthe long run. The authorities of the selected CEE countries should focus on improv-ing the labour market efficiency through training and specialisation programs for thelabour force in order to reduce the unemployment rate (which is still high inSlovakia and Croatia), should support the education process in order to improve theskills of the labour force and its productivity, should support the public investments,especially for the infrastructure and should provide a stable macroeconomic environ-ment and social-political stability to ensure a stable and sustainable GDP per capitagrowth in the future. They should direct more of their public spending to some pro-ductive public spending (education, economic affairs) and should stimulate thedomestic investors to produce and to expand on the domestic or foreign markets, sothat the consumption should rely less on imports of goods and services. Highervalue-added activities could be supported by the government policy which will focusmainly on education, research and development and cooperation with the businesssector, as Kol'vekov�a and Pala�s�c�akov�a (2017) proved with their analysis for theSlovak economy.
The high economic growth rates achieved by this region lately, mainly based onthe increase of the private consumption can’t be supported in the long run, becausethe impact of the private consumption reverses in the long run and becomes negative.The significant increase of the public expenses during and after the crisis determinedhigher public deficits and public debts in Poland, Romania, Croatia, Hungary and
2346 M. RADULESCU ET AL.

Slovenia. The private consumption is also based in the CEE region, on average, onbanking borrowing and this could endanger the economic stability in this region.Improving the global competitiveness of these CEE economies will support domesticinvestments and thus, both the GDP per capita growth and the employment process.The CEE countries should focus on improving these aspects and the relevance of thedomestic investments for the GDP per capita growth will increase. High inflows ofFDIs are not expected in the CEE region in the future as a result of the general wagesincrease in the CEE region and, in some countries, as a result of a lack of adequateinfrastructure, macroeconomic or political stability (Romania, for example). So, theauthorities should aim at public investments and support domestic investmentsas well.
References
Abiad, A., Furceri, D., & Topalova, P. (2015). The macroeconomic effects of public investment:Evidence from advanced economies. IMF Working Paper, WP/15/95, May 2015. doi:10.5089/9781475578874.001
AbuAl-Foul, B. (2010). The causal relation between savings and economic growth: Some evi-dence from MENA Countries. Topics in Middle Eastern and African Economies, Vol. 12,1–12.
Agosin, M. R., & Machado, R. (2005). Foreign investment in developing countries: Does itcrowd in domestic investment. Oxford Development Studies, 33(2), 149–162. doi:10.1080/13600810500137749
Aidt, T., Dutta, J., & Sena, V. (2008). Governance regimes, corruption and growth: Theory andevidence. Journal of Comparative Economics, 36(2), 195–220. doi:10.1016/j.jce.2007.11.004
Akalpler, E. (2017). The role of net export on economic growth in USA. Journal of AppliedEconomic Sciences, XII, 3(49), 772–781.
Akanbi, O. A. (2010). Role of governance in explaining domestic investment in Nigeria. WorkingPaper Number 168. Department of Economics. South Africa: University of Pretoria.
Alexiou, C. (2009). Government spending and economic growth: Econometric evidence fromthe South Eastern Europe (SEE). Journal of Economic and Social Research, 11(1), 1–16.
Alexiou, C., & Pitelis, C. (2003). On capital shortages and European unemployment: A paneldata investigation. Journal of Post Keynesian Economics, 25(4), 613–631. doi:10.2753/PKE0160-3477320307
Andrei, E. A., & Huidumac, C. E. (2013). Saving and economic growth: An empirical analysisfor euro area countries. Theoretical and Applied Economics, 20(7), 43–58.
Anghelache, C., Marinescu, A. I., Avram, D., Burea, D., & Bodo, G. (2017). Model analysis ofthe correlation between GDP and final consumption components. Romanian StatisticalReview, Supplement no. (2), 84–95.
Arestis, P., Baddeley, M. C., & Sawyer, M. (2007). The relationship between capital stock,unemployment and wages in nine EMU countries. Bulletin of Economic Research, 59(2),125–148. doi:10.1111/j.0307-3378.2007.00254.x
Aron-Niculescu, I., & Mihaescu, C. (2014). Modelling the impact of economic, demographicand social determinants on household saving rate in the former socialist countries (Centraland Eastern Europe). Procedia Economics and Finance, 10, 104–113. doi:10.1016/S2212-5671(14)00283-4
Awokuse, T. O. (2003). Is the export led growth hypothesis valid for Canada? CanadianJournal of Economics/Revue Canadienne d�Economique, 36(1), 126–136. doi:10.1111/1540-5982.00006
Baharumshah, A. Z., Thanoon, M. A., & Rashid, S. (2002). Savings dynamic in AsianCountries. Journal of Asian Economics, 204(13), 1–19. doi:10.1016/S1049-0078(02)00187-2
ECONOMIC RESEARCH-EKONOMSKA ISTRA�ZIVANJA 2347
Battaglini, M., & Coates, S. (2011). Fiscal policy and unemployment. National Bureau ofEconomics Research (NBER) Working Paper 17562.
Berger, T., & Bristow, G. (2009). Competitiveness and the benchmarking of nations – A crit-ical reflection. International Advances in Economic Research, 15(4), 378–392. doi:10.1007/s11294-009-9231-x
Blackburn, K., Bose, N., & Haque, M. E. (2005). The incidence and persistence of corruptionin economic development. Journal of Economic Dynamics & Control, 30, 2447–2467. doi:10.1016/j.jedc.2005.07.007
Borovic, Z. (2014). Does economic freedom impact economic growth: Decomposing the effectsfor Bosnia and Herzegovina. Acta Economica, XII(21), 9–20.
Bouakez, H., & Rebei, N. (2003). Why does private consumption rise after a Governmentspending shock? Available online at http://fmwww.bc.edu/repec/sce2004/up.27817.1075497619.pdf.
Brown, S. F., & Shackman, J. (2007). Corruption and related socioeconomic factors: A timeseries study. Kyklos, 60(3), 319–347. doi:10.1111/j.1467-6435.2007.00374.x
Br€uckner, M., & Pappa, E. (2010). Fiscal expansions affect unemployment, but they mayincrease it. CEPR Discussion Papers, 7766.
Br€uckner, M., & Pappa, E. (2012). Fiscal expansions, unemployment, and labor force participa-tion. International Economic Review, 54(4), 1205–1228. doi:10.1111/j.1468-2354.2012.00717.x
Carlsson, F., & Lundstr€om, S. (2002). Economic freedom and growth: Decomposing the effects.Public Choice, 112(3/4), 335–344. doi:10.1023/A:1019968525415
Cazacu, A. M. (2015). Global competitiveness index and economic growth. Theoretical andApplied Economics, 369–373. Supplement I, International Finance and Banking ConferenceFIBA 2015 XIIIth Edition,
Cebula, R. J. (2011). Economic growth, ten forms of economic freedom, and political stability:An empirical study using panel data, 2003–2007. Journal of Private Enterprise, 26(2), 61–81.
Chen, S. T., & Lee, C. C. (2005). Government size an economic growth in Taiwan: A thresholdregression approach. Journal of Policy Modeling, 27(9), 1051. doi:10.1016/j.jpolmod.2005.06.006
Choe, J. I. (2003). Do foreign direct investment and gross domestic investment promote eco-nomic growth?. Review of Development Economics, 7(1), 44–57. doi:10.1111/1467-9361.00174
Cogan, J. F., Cwik, T., Taylor, J. B., & Wieland, V. (2010). New Keynesian versus oldKeynesian Government spending multipliers. Journal of Economic Dynamics and Control,34(3), 281–295. doi:10.1016/j.jedc.2010.01.010
Crespo-Cuaresma, J., & W€orz, J. (2003). On Export Composition and Growth. University ofVienna, Department of Economics, Vienna, Austria and Vienna Institute for InternationalEconomic Studies (WIIW), Vienna, Austria. Available at : http://www.wiiw.ac.at/pdf/crespo_woerz_etsg_2003.pdf.
Cyrek, M. (2017). Social efficiency of employment in three sectors — a comparison of polishregions. Equilibrium, 12(3), 417–432. doi:10.24136/eq.v12i3.22
Dawson, J. W. (2003). Causality in the freedom-growth relationship. European Journal ofPolitical Economy, 19(3), 479–495. doi:10.1016/S0176-2680(03)00009-0
Diacon, P. E., & Maha, L. G. (2015). The relationship between income, consumption andGDP: A time series, cross-country analysis. Procedia Economics and Finance, 23, 1535–1543.doi:10.1016/S2212-5671(15)00374-3
Disoska, E. M. (2016). Re-shaping the model of economic growth of the CEE Countries. BalticJournal of European Studies, 6, 2(21), 137–159. doi:10.1515/bjes-2016-0016
Do�gan, T. T. (2012). Macroeconomic variables and unemployment: The case of Turkey.International Journal of Economics, and Financial Issues, 2(1), 71–78.
Dutt, P., Mitra, D., & Ranjan, P. (2009). International trade and unemployment: Theory andcross-national evidence. Journal of International Economics, 78 (1), 32–44. doi:10.1016/j.jin-teco.2009.02.005
2348 M. RADULESCU ET AL.
Eregha, P. (2011). The dynamic linkages between foreign direct investment and domesticinvestment in ECOWAS countries: A panel cointegration analysis. In Proceedings of theConference of the Centre for the Study of African Economics. Oxford, UK: Oxford University.
Falki, N. (2009). Impact of foreign direct investment on economic growth in Pakistan.International Review of Business Research Papers, 5(5), 110–120.
Felbermayr, G., Prat, J., & Schmerer, H. (2011). Globalisation and labour market outcomes:Wage bargaining, search frictions, and firm heterogeneity. Journal of Economic Theory, 146(1), 39–73. doi:10.1016/j.jet.2010.07.004
Feldmann, H. (2006). Government size and unemployment: Evidence from industrial coun-tries. Public Choice, 127(3–4), 443–444. doi:10.1007/s11127-005-9003-y
Freudenberg, M. (2003). Composite indicators of country performance: A critical assessment.OECD Science, Technology and Industry, Working Papers, 2003/16.
Gali, J., Lopez-Salido, J. D., & Valles, J. (2007). Understanding the effects of governmentspending on consumption. Journal of the European Economic Association, 5(1), 227–270.
Gbosi, A. N. (2005). The dynamics of managing chronic unemployment in Nigeria’s depressedeconomy. Inaugural lecture (Series No. 42). Presented at University of Port Harcourt, 3June.
Genius, M., Choga, I., Maredza, A., & Mavetera, N. (2013). Fiscal policy and unemploymentin South Africa: 1980–2010. Mediterranean Journal of Social Sciences, 4(6), 579–587. doi:10.5901/mjss.2013.v4n6p579
Ghazali, A. (2010). Analyzing the relationship between foreign direct investment domesticinvestment and economic growth for Pakistan. International Research Journal of Financeand Economics, 47, 127–135.
Goodspeed, T., Vasquez, J. M., & Zhang, L. (2006). Are other government policies moreimportant than taxation in attracting FDI?. Andrew Young School of Policy Studies,Research Paper Studies, Working Paper 28.
Gozgor, G. (2013). Stochastic properties of the consumption-income ratios in central and east-ern European countries. Zbornik Radova Ekonomskog Fakulteta U Rijeci, 31(2), 193–207.
Heckelman, J. C., & Powell, B. (2008). Corruption and the Institutional environment forgrowth. Working papers 6, Suffolk University.
Helpman, E., & Itskhoki, O. (2010). Labour market rigidities, trade and unemployment.Review of Economic Studies, 77 (3), 1100–1137. doi:10.1111/j.1467-937X.2010.00600.x
Heritage Foundation. (2017). https://www.heritage.org/index/ [accessed on 12th June 2018].Hlavacek, P., & Domanska, B. B. (2016). Impact of foreign direct investment on economic
growth in Central and Eastern European Countries. Inzinerine Ekonomika-EngineeringEconomics, 27(3), 294–303.
Hussain, M. E., & Haque, M. (2016). Impact of economic freedom on the growth rate: A paneldata analysis. Economies, 4(4), 5–15. 5, doi:10.3390/economies4020005
Ionescu, R. V. (2015). Foreign direct investment vs domestic investment across the EuropeanUnion. Case study: Romania. Euro Economica, 2(34), 129–138.
Johansson, Å., Heady, C., Arnold, J., Brys, B., & Vartia, L. (2008). Tax and economic growth,OECD Working Paper 620, Organization for Economic Cooperation and Development.Economics department, available online at https://www.oecd-ilibrary.org/docserver/241216205486.pdf?expires=1535011635&id=id&accname=guest&checksum=4725B459C69E6A3A16935D0E732C6DA6 [accessed at 21st July 2018].
Justesen, M. K. (2008). The effect of economic freedom on growth revisited: New evidence oncausality from a panel of countries 1970–1999. European Journal of Political Economy, 24(3),642–660. doi:10.1016/j.ejpoleco.2008.06.003
Kalaitizi, A. (2013). Exports and economic growth in the United Arab Emirates. Submitted to:RIBM Doctoral Symposium. Manchester Metropolitan University Business School.
Khan, M. A. (2007). Foreign direct investment and economic growth: The role of domesticfinancial sector. Working Paper 18, Pakistan Institute of Development Economics,Islamabad, Pakistan.
ECONOMIC RESEARCH-EKONOMSKA ISTRA�ZIVANJA 2349
Kim, D. H., & Lin, S. C. (2009). Trade and growth at different stages of economic develop-ment. Journal of Development Studies, 45(8), 1211–1224. doi:10.1080/00220380902862937
Kim, H. (2017). The effect of consumption on economic growth in Asia. Journal of GlobalEconomics, 05(03), 1–8. doi:10.4172/2375-4389.1000259
Kim, J. (2011). The effects of trade on unemployment: Evidence from 20 OECD countries,Stockholm University, Department of Economics, Working Paper no.19/2011.
Kol'vekov�a, G., & Pala�s�c�akov�a, D. (2017). Analysis of Bratislava and �Zilina as urban areas inWestern Slovakia in the context of associations among employment and industries.Oeconomia Copernicana, 8(4), 537–552. doi:10.24136/oc.v8i4.33
Krugman, P., Cooper, R. N., & Srinivasan, T. N. (1995). Growing world trade: Causes andconsequences. Brookings Papers on Economic Activity, 1995(1), 327–377. 25th AnniversaryIssue, doi:10.2307/2534577
Labaye, E., Sjåtil, P. E., Wojtek, B., Novak, J., Mischke, J., Fruk, M., & Ionut, O. (2013). A newdawn: Reigniting growth in Central and Eastern Europe, McKinsey Global Institute andMcKinsey in Central and Eastern Europe, available online at https://www.mckinsey.com/�/media/McKinsey/Featured%20Insights/Europe/A%20new%20dawn%20Reigniting%20growth%20in%20Central%20and%20Eastern%20Europe/MGI_CEE_A_new_dawn_Full_report_Dec_2013.ashx [accessed at 3rd October 2018]
Lambsdorff, J. G. (2007). The institutional economics of corruption and reform. Cambridge,UK: Cambridge University Press.
Lee, Y., & Gordon, R. H. (2005). Tax Structure and Economic Growth. Journal of PublicEconomics, 89(5-6), 1027–1043. doi:10.1016/j.jpubeco.2004.07.002
Liu, X., Burridge, P., & Sinclair, P. J. N. (2002). Relationships between economic growth, for-eign direct investment and trade: Evidence from China. Applied Economics, 34(11),1433–1440. doi:10.1080/00036840110100835
Lopez-Claros, A., Altinger, L., Blanke, J., Drzeniek, M., & Mia, I. (2006). The GlobalCompetitiveness Index: Identifying the Key Elements of Sustainable Growth. The GlobalCompetitiveness Report 2006-2007, World Economic Forum, Palgrave Macmillan.
Macek, R. (2015). The impact of taxation on economic growth: Case study of OECDCountries. Review of Economic Perspectives, 14(4), 309–328. doi:10.1515/revecp-2015-0002
Magazzino, C. (2012). Wagner versus Keynes: Public spending and national income in Italy.Journal of Policy Modeling, 34(6), 890–905. doi:10.1016/j.jpolmod.2012.05.012
Mahdavi, S., & Alanis, E. (2013). Public expenditures and the unemployment rate in theAmerican states: Panel evidence. Applied Economics, 45(20), 2926–2937. doi:10.1080/00036846.2012.690849
Mathur, A., & Singh, K. (2013). Foreign direct investment, corruption and democracy. AppliedEconomics, 45(8), 991–1002. doi:10.1080/00036846.2011.613786
Mavrov, H. (2007). The Size of government expenditure and the rate of economic growth inBulgaria. Economic Alternatives, 1, 52–63.
Mendez, F., & Sepulveda, F. (2006). Corruption, growth and political regimes: Cross countryevidence. European Journal of Political Economy, 22, 82–98.
M�eon, P. G., & Sekkat, K. (2005). Does corruption grease or sand the wheels of growth?.Public Choice, 122(1–2), 69–97. doi:10.1007/s11127-005-3988-0
Mishra, P. K. (2011). Dynamics of the relationship between real consumption expenditure andeconomic growth in India. Indian Journal of Economics & Business, 10(4), 541–551.
Mi�sun, J., & Tom�s�ık, V. (2002). P�r�ım�e zahrani�cn�ı investice ve st�redn�ı Evrop�e: Vyt�es�nuj�ı nebovtahuj�ı dom�ac�ı investice? Politick�a Ekonomie, 2, 251–259. doi:10.18267/j.polek.359
Misztal, P. (2011). The relationship between savings and economic growth in countries withdifferent level of economic development. E-Finanse, 7(2), 17–29.
Mohan, R. (2006). Causal relationship between savings and economic growth in countries withdifferent income levels. Economics Bulletin, 5(3), 1–12.
Montek, S. A. (2002). State-level performance under economic reforms, economic policy reformsand the indian economy. A. O. Krueger (ed.). Chicago and London: University of ChicagoPress.
2350 M. RADULESCU ET AL.
Moore, M. P., & Ranjan, P. (2005). Globalisation vs skill-biased technological change:Implications for unemployment and wage inequality. The Economic Journal, 115 (503),391–422. doi:10.1111/j.1468-0297.2005.00994.x
Najarzadeh, R., Reed, M., & Tasan, M. (2014). Relationship between savings and economicgrowth: The case for Iran. Journal of International Business and Economics, 2(4), 107–124.doi:10.15640/jibe.v2n4a7
Nut�a, A. C., Nut�a, F. M., Chiril�a, V., Roman, A., & Pusc�a, A. C. (2015). Testing the relation-ship between public expenditure and economic growth in Romania. Acta UniversitatisDanubius-Economica, 11(4), 1–10.
Nwosa, P. I. (2014). Government expenditure, unemployment and poverty rates in Nigeria.JORIND, 12 (1), 77–84.
Okubo, M. (2003). Intratemporal substitution between private and government consumption:The case of Japan. Economics Letters, 79(1), 75–81. doi:10.1016/S0165-1765(02)00290-2
Olczyk, M., & Kordalska, A. (2015). Global competitiveness and economic growth: A one-wayor two-way relationship? VIII th International Conference on Applied EconomicsContemporary Issues in Economy under the title Market or Government?, Institute ofEconomic Research, Working Papers No. 63/2015, Poland, available online at: http://www.badania-gospodarcze.pl/images/Working_Papers/2015_No_63.pdf
Onodugo, V. A., Onyebuchi Obi, K., Anowor, O. F., Nwonye, N. G., & Ofoegbu, G. N. (2017).Does public spending affect unemployment in an emerging market? Risk Governance &Control: Financial Markets & Institutions, 7(1), 32–40.
Paldam, M. (2001). Corruption and religion. Adding to the economic model. Kyklos, 54(2–3),383–414. doi:10.1111/1467-6435.00160
Peng, M. W., Wang, D., & Jiang, Y. (2008). An institution-based view of international businessstrategy: A focus on emerging economies. Journal of International Business Studies, 39(5),920–936.
Perotti, R. (2002). Estimating the effects of fiscal policy in OECD Countries. ISOM conference,Frankfurt.
Petryl_e, V. (2017). Does the global competitiveness index demonstrate the resilience of coun-tries to economic crises? Ekonomika, 95(3), 28–36. doi:10.15388/Ekon.2016.3.10326
Pilc, M. (2017). Cultural, political and economic roots of the labor market institutional frame-work in the OECD and post-socialist countries. Equilibrium, 12(4), 713–731. doi:10.24136/eq.v12i4.37
Qin, D., Cagas, M. A., Quising, P., & He, X. H. (2006). How much does investment drive eco-nomic growth in China? Journal of Policy Modeling, 28(7), 751–774. doi:10.1016/j.jpolmod.2006.02.004
Ramudo, R. B., Grela, M. F., & Garcia, D. R. (2014). Consumption, investment and unemploy-ment: SVAR tests of the effects of changes in the consumption-saving pattern. CogentEconomics & Finance, 2933676, 1–7.
Roman, M. D., & Padureanu, A. (2012). Models of foreign direct investments influence oneconomic growth: Evidence from Romania. International Journal of Trade, Economics andFinance, 3(1), 25–29.
Romero, D., & Strauch, R. (2003). Public finances and long-term growth in Europe – evidencefrom a panel data analysis. ECB Working Paper, No. 246.
Romm, A. T. (2005). The relationship between savings and growth in Africa: A time seriesanalysis. The South African Journal of Economics, 73(2), 171–189. doi:10.1111/j.1813-6982.2005.00012.x
Schaltegger, C. A., & Benno, T. (2006). Growth effects of public expenditure on the state andlocal level: Evidence from a sample of rich governments. Applied Economics, 38(10),1181–1192. doi:10.1080/00036840500392334
Schclarek, A. (2007). Fiscal policy and private consumption in industrial and developing coun-tries. Journal of Macroeconomics, 29(4), 912–939. doi:10.1016/j.jmacro.2006.03.002
Schwab, K. (2015). The Global Competitiveness Report 2014-2015. Retrieved from http://www.weforum.org [accessed at 9th June 2018].
ECONOMIC RESEARCH-EKONOMSKA ISTRA�ZIVANJA 2351
Scutaru, C., Saman, C., & Pauna, B. (2015). The dynamics of household consumption inromania during economic crisis. Procedia Economics and Finance, 22, 820–827. doi:10.1016/S2212-5671(15)00316-0
Szarowsk�a, I. (2011). Relationship between government spending and economic growth in theCzech Republic. Acta Universitatis Agriculturae et Silviculturae Mendelianae Brunensis,LIX(7), 415–421. doi:10.11118/actaun201159070415
Szarowsk�a, I. (2012). Public spending cyclicality and wagner’s law in Central and EasternEuropean Countries. Acta Universitatis Agriculturae et Silviculturae Mendelianae Brunensis,60(2), 383–390. doi:10.11118/actaun201260020383
Szkorupov�a, S. (2015). Relationship between foreign direct investment and domestic invest-ment in selected countries of central and Eastern Europe. Procedia Economics and Finance,23, 1017–1022. doi:10.1016/S2212-5671(15)00350-0
Tang, S., Selvanatha, E. A., & Selvanathan, S. (2008). Foreign direct investment, domesticinvestment, and economic growth in china: A time series analysis. Research Paper No. 19.Department of International Business and Asian Studies, Griffith University.
Tiryaki, A., & €Ozkan, H. N. (2011). Economic activity and unemployment dynamics inTurkey. Eskisehir Osmangazi University. FEAS Journal, 6(2), 173–184.
Titarenko, D. ( (2005). ). The influence of foreign direct investment on domestic investmentprocesses in Latvia. MPRA Paper No. 1819, 1-9.
Transparency International. (2017). Corruption perception index, available online at http://www.transparency.org/cpi2017 [accessed at June 5th 2018].
Ullah, I., Shah, M., & Ullah Khan, F. (2014). Domestic investment, foreign direct investment,and economic growth Nexus: A case of Pakistan. Economics Research International, 2014,1–5. doi:10.1155/2014/592719
Vasiliauskaite, A., & Stankevicius, E. (2009). Tax burden management and GDP growth: Caseof EU countries. Economics & Management, 14, 202–209.
Verhorn, C. L., & Vasarevici, A. (2011). FDI and macroeconomic policies, Central and EasternEuropean Countries. Zagreb International Review of Economics & Business, 14(1), 23–34.
Xia, R., Liang, T., Zhang, Y., & Wu, S. (2012). Is global competitive index a good standard tomeasure economic growth? A suggestion for improvement. International Journal of Servicesand Standards, 8(1), 45–57. doi:10.1504/IJSS.2012.048438
Yildirim, M. O., & Yildirim, A. E. (2017). The influence of consumption and investment onunemployment in Turkey: A SVAR approach. Ekonomika, 96(1), 74–92.
2352 M. RADULESCU ET AL.
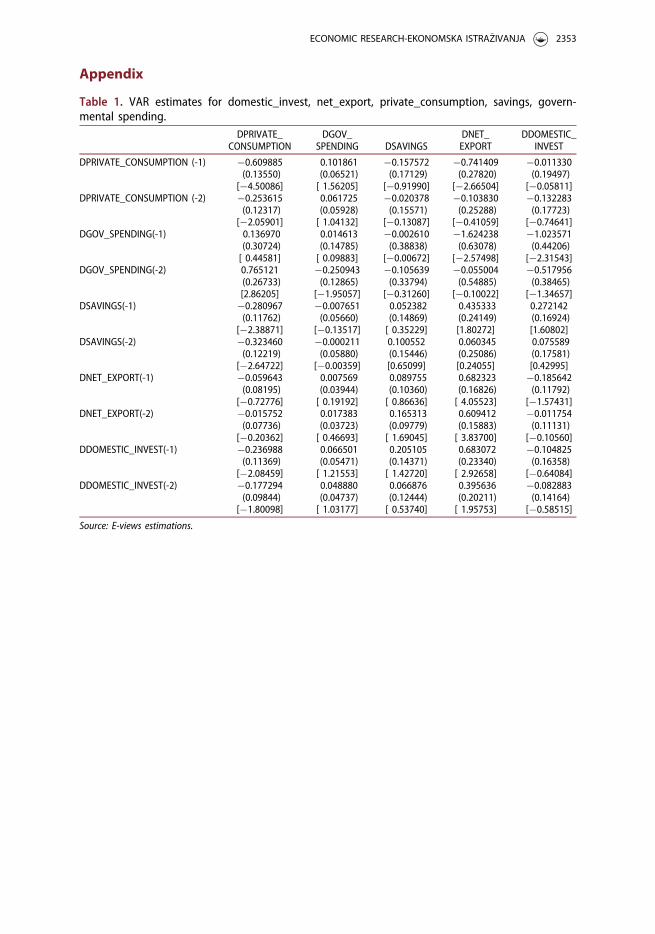
Appendix
Table 1. VAR estimates for domestic_invest, net_export, private_consumption, savings, govern-mental spending.
DPRIVATE_CONSUMPTION
DGOV_SPENDING DSAVINGS
DNET_EXPORT
DDOMESTIC_INVEST
DPRIVATE_CONSUMPTION (-1) �0.609885 0.101861 �0.157572 �0.741409 �0.011330(0.13550) (0.06521) (0.17129) (0.27820) (0.19497)
[�4.50086] [ 1.56205] [�0.91990] [�2.66504] [�0.05811]DPRIVATE_CONSUMPTION (-2) �0.253615 0.061725 �0.020378 �0.103830 �0.132283
(0.12317) (0.05928) (0.15571) (0.25288) (0.17723)[�2.05901] [ 1.04132] [�0.13087] [�0.41059] [�0.74641]
DGOV_SPENDING(-1) 0.136970 0.014613 �0.002610 �1.624238 �1.023571(0.30724) (0.14785) (0.38838) (0.63078) (0.44206)[ 0.44581] [ 0.09883] [�0.00672] [�2.57498] [�2.31543]
DGOV_SPENDING(-2) 0.765121 �0.250943 �0.105639 �0.055004 �0.517956(0.26733) (0.12865) (0.33794) (0.54885) (0.38465)[2.86205] [�1.95057] [�0.31260] [�0.10022] [�1.34657]
DSAVINGS(-1) �0.280967 �0.007651 0.052382 0.435333 0.272142(0.11762) (0.05660) (0.14869) (0.24149) (0.16924)
[�2.38871] [�0.13517] [ 0.35229] [1.80272] [1.60802]DSAVINGS(-2) �0.323460 �0.000211 0.100552 0.060345 0.075589
(0.12219) (0.05880) (0.15446) (0.25086) (0.17581)[�2.64722] [�0.00359] [0.65099] [0.24055] [0.42995]
DNET_EXPORT(-1) �0.059643 0.007569 0.089755 0.682323 �0.185642(0.08195) (0.03944) (0.10360) (0.16826) (0.11792)
[�0.72776] [ 0.19192] [ 0.86636] [ 4.05523] [�1.57431]DNET_EXPORT(-2) �0.015752 0.017383 0.165313 0.609412 �0.011754
(0.07736) (0.03723) (0.09779) (0.15883) (0.11131)[�0.20362] [ 0.46693] [ 1.69045] [ 3.83700] [�0.10560]
DDOMESTIC_INVEST(-1) �0.236988 0.066501 0.205105 0.683072 �0.104825(0.11369) (0.05471) (0.14371) (0.23340) (0.16358)
[�2.08459] [ 1.21553] [ 1.42720] [ 2.92658] [�0.64084]DDOMESTIC_INVEST(-2) �0.177294 0.048880 0.066876 0.395636 �0.082883
(0.09844) (0.04737) (0.12444) (0.20211) (0.14164)[�1.80098] [ 1.03177] [ 0.53740] [ 1.95753] [�0.58515]
Source: E-views estimations.
ECONOMIC RESEARCH-EKONOMSKA ISTRA�ZIVANJA 2353