consumption smoothing and productive investments in rural zambia
TRANSCRIPT
Consumption Smoothing and
Productive Investments in Rural
Zambia
Juan Bonilla – AIR
A. Handa (UNICEF), N. Rai (AIR), D. Seidenfeld (AIR)
November 2015
Copyright © 2015 American Institutes for Research. All rights reserved.

AMERICAN INSTITUTES FOR RESEARCH
The case for Consumption Smoothing
• Rural households in developing countries face substantial risk
• Need to free consumption from income so not to be driven to extremities
when income is low
– LC/PIH: Modigiliani, 1959; Friedman, 1957.
• CS mechanisms: precautionary savings, risk pooling, assets as buffer
stocks, crop diversification.
• but, evidence suggests HHs only partially able to protect consumption
from income shocks
– (Kaziaga & Udri, 2006; Alderman & Paxon, 1994; Jalan and Ravallion, 1999; Townsend, 1994)
• A minimum level of income required?
2
AMERICAN INSTITUTES FOR RESEARCH
Consumption Smoothing & UCTs
• Cash transfers: potential vehicle for sustaining household consumption
– Settings with limited formal insurance and weak credit markets
– Limited empirical evidence
Research Question:
• Do UCTs for very low income households reduce consumption
variability over time?
– If so, what are the mechanisms used to smooth consumption
3

AMERICAN INSTITUTES FOR RESEARCH
Zambia’s Child Grant Program
- Started in 2010
- Households with a child under 3 enrolled
- Unconditional
- 55 Kwacha per month (increased over time)
- No differentiation by household size

AMERICAN INSTITUTES FOR RESEARCH
CGP Districts: Greatest Poverty Levels(Travel Time from Lusaka by Vehicle)
Kaputa
(20 Hrs)
Kalabo
(12 Hrs)
Shangombo
(16 Hrs)
AMERICAN INSTITUTES FOR RESEARCH
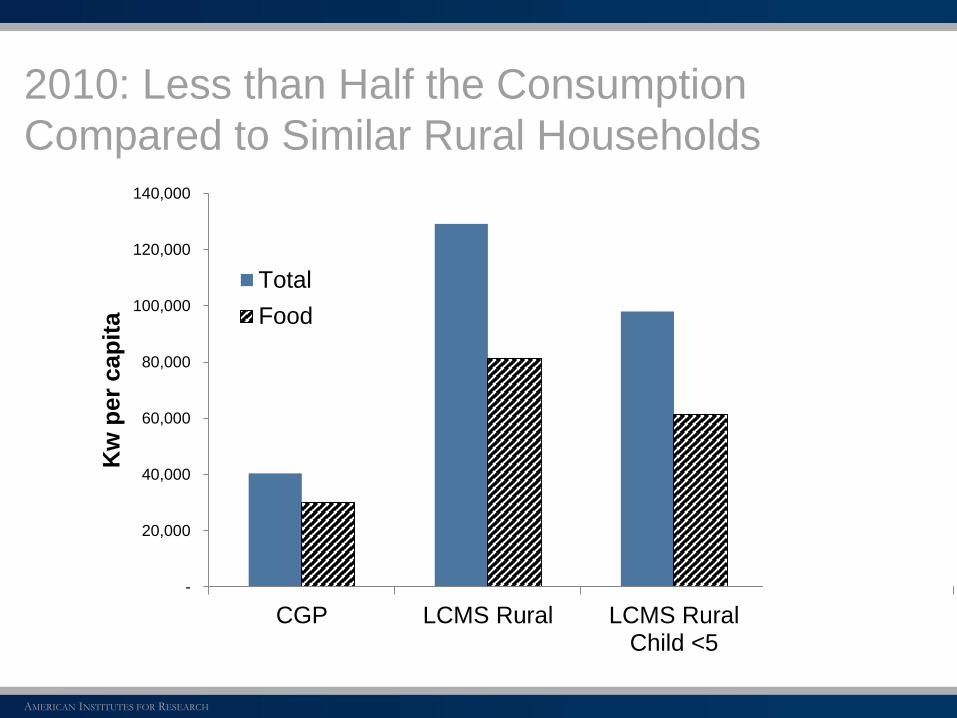
2010: Less than Half the Consumption
Compared to Similar Rural Households
-
20,000
40,000
60,000
80,000
100,000
120,000
140,000
CGP LCMS Rural LCMS RuralChild <5
LCMS 3 districts,Child<5
Kw
per
cap
ita
Total
Food
AMERICAN INSTITUTES FOR RESEARCH
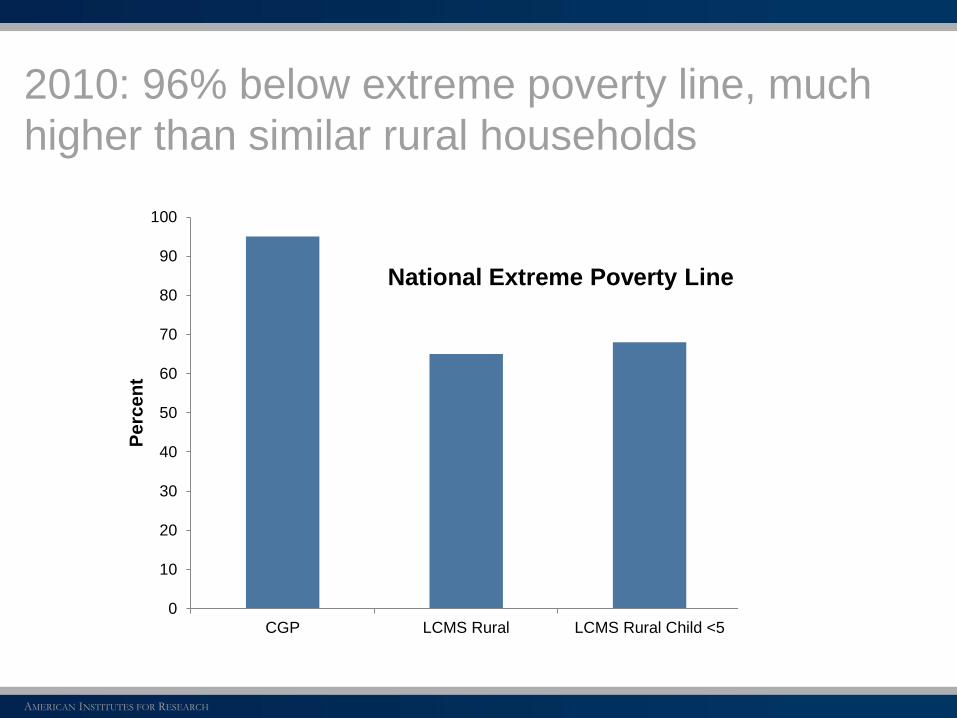
2010: 96% below extreme poverty line, much
higher than similar rural households
0
10
20
30
40
50
60
70
80
90
100
CGP LCMS Rural LCMS Rural Child <5 LCMS 3 districts, Child<5
Perc
en
t
National Extreme Poverty Line
AMERICAN INSTITUTES FOR RESEARCH
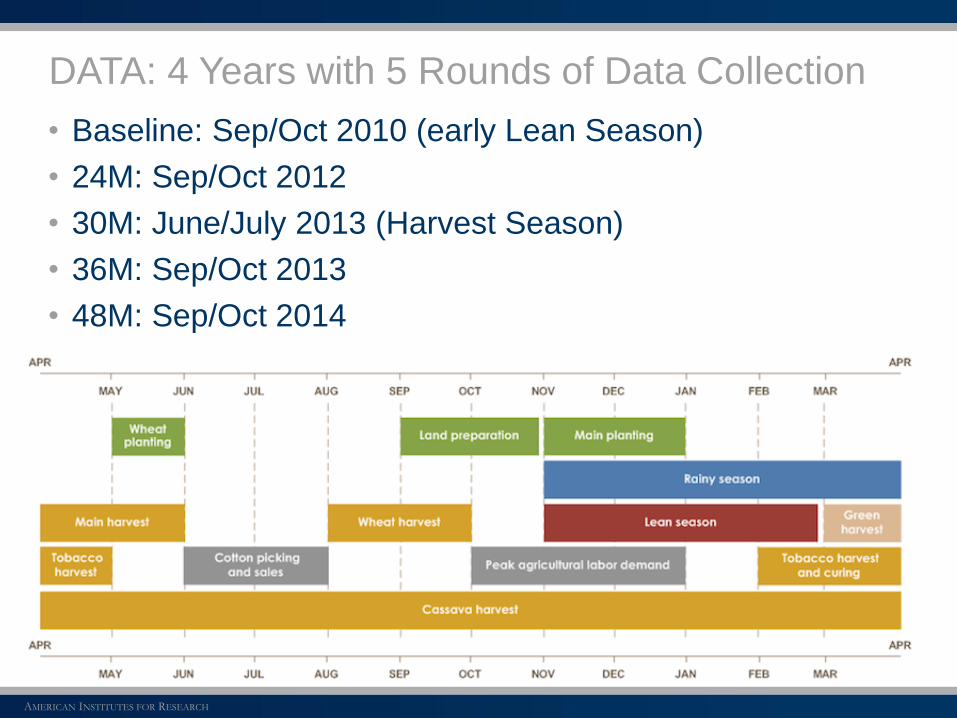
DATA: 4 Years with 5 Rounds of Data Collection
• Baseline: Sep/Oct 2010 (early Lean Season)
• 24M: Sep/Oct 2012
• 30M: June/July 2013 (Harvest Season)
• 36M: Sep/Oct 2013
• 48M: Sep/Oct 2014
AMERICAN INSTITUTES FOR RESEARCH
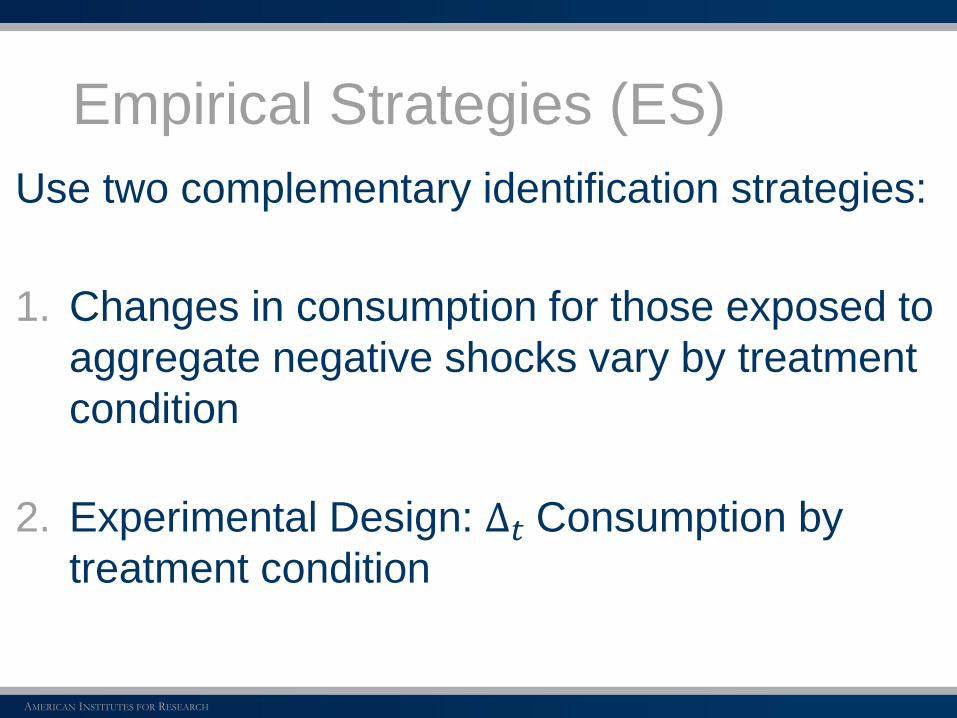
Empirical Strategies (ES)
Use two complementary identification strategies:
1. Changes in consumption for those exposed to
aggregate negative shocks vary by treatment
condition
2. Experimental Design: ∆𝑡 Consumption by
treatment condition

AMERICAN INSTITUTES FOR RESEARCH
ES 1: DD over shocks and CGP
𝑌𝑖𝑗𝑡 = 𝛼 + 𝛽1𝑆ℎ𝑜𝑐𝑘𝑖𝑗𝑡 + 𝛽2𝐶𝐺𝑃𝑖𝑗 + 𝛽3𝑆ℎ𝑜𝑐𝑘𝑖𝑗𝑡 ∗ 𝐶𝐺𝑃𝑖𝑗+𝜃𝑋𝑖𝑗0 + 𝜂𝑡 + 𝜙𝑗 + 𝜀𝑖𝑗𝑡
𝑌𝑖𝑗𝑡 log of consumption for hh i in district j at time t
𝑠ℎ𝑜𝑐𝑘𝑖𝑗𝑡 = 1 if i affected by shock at time t
𝐶𝐺𝑃𝑖𝑗 = 1 if i is a CGP beneficiary
𝜂𝑡,𝜙𝑗 time and district fixed effects
Test for Consumption Smoothing: 𝐻0 : 𝛽1 + 𝛽3 = 0
Consistency: Shocks ⊥ 𝜀𝑖𝑗𝑡 and CGP ⊥ 𝜀𝑖𝑗𝑡
10
AMERICAN INSTITUTES FOR RESEARCH
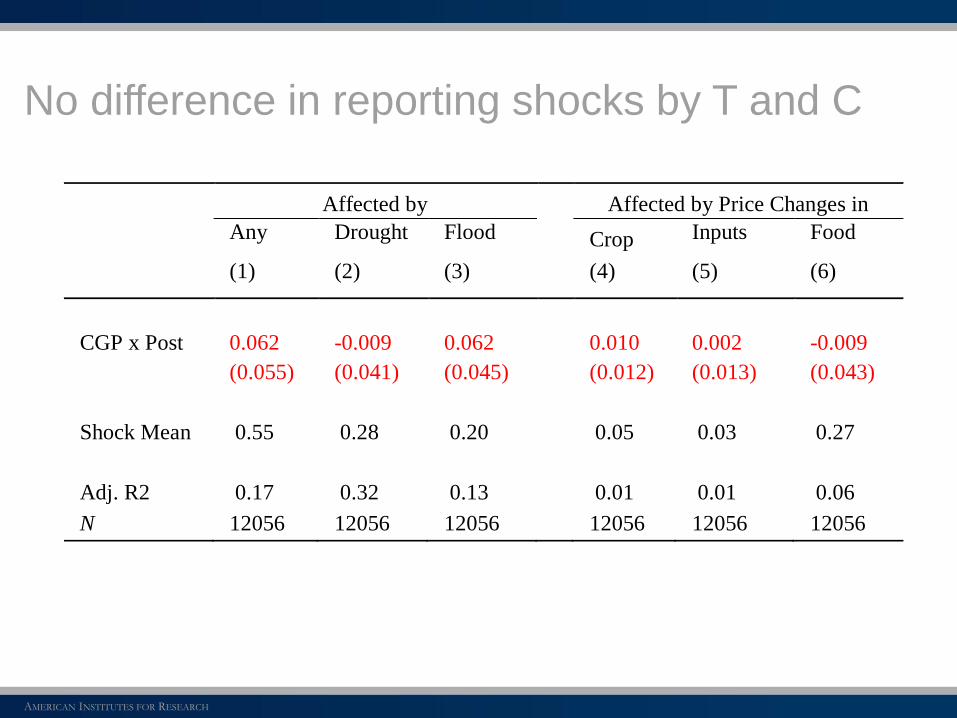
No difference in reporting shocks by T and C
Affected by Affected by Price Changes in
Any Drought Flood Crop Inputs Food
(1) (2) (3) (4) (5) (6)
CGP x Post 0.062 -0.009 0.062 0.010 0.002 -0.009
(0.055) (0.041) (0.045) (0.012) (0.013) (0.043)
Shock Mean 0.55 0.28 0.20 0.05 0.03 0.27
Adj. R2 0.17 0.32 0.13 0.01 0.01 0.06
N 12056 12056 12056 12056 12056 12056

AMERICAN INSTITUTES FOR RESEARCH
… and no correlation between observables and
reporting a negative shocks
Coefficient SE
CGP recipient -0.003 0.014
Household size 0.001 0.021
Recipient is married 0.010 0.009
Age of recipient -0.000 0.001
Recipient highest grade -0.000 0.001
Number of people ages 0-5 0.001 0.021
Number of people ages 6-12 0.002 0.021
Number of people ages 13-18 -0.002 0.022
Number of people ages 19-35 -0.005 0.023
Number of people ages 36-55 0.004 0.022
Number of people ages 56-69 -0.013 0.027
N 9523

AMERICAN INSTITUTES FOR RESEARCH
Coefficient SE
Maize grain price -0.000 0.001
Bean price 0.010*** 0.004
Dry fish price -0.003 0.003
Cooking oil price 0.007 0.006
Sugar price -0.006 0.007
Table salt price -0.000 0.002
Toilet soap price -0.001 0.009
Laundry soap price -0.009 0.008
Secondary school fee -0.000 0.000
Total expenditures 0.000 0.001
HH owned any chickens 0.008 0.008
HH owned any cows 0.018 0.019
HH owned any milk cows -0.019 0.014
HH owned any goats 0.014 0.028
HH owned any goats 0.014 0.021
N 9523
… and no correlation between observables and
reporting a negative shocks

AMERICAN INSTITUTES FOR RESEARCH
Results: CGP insulates recipients against shocks
Log of Total Expenditures
(1) (2) (3) (4)
Negative Shock (𝜷𝟏) -0.07*** -0.07*** -0.06** -0.05**
(0.02) (0.02) (0.02) (0.02)
CGP (𝛽2) 0.27*** 0.26*** 0.24*** 0.20***
(0.05) (0.05) (0.04) (0.03)
CGP x Shock (𝛽3) 0.03 0.04 0.05 0.06*
(0.04) (0.03) (0.03) (0.03)
Shock, CGP -0.037 -0.024 -0.007 0.010
(𝜷𝟏 + 𝜷𝟑) (0.028) (0.029) (0.025) (0.022)
Mean of Shock 0.60 0.60 0.60 0.60
Time FE Yes Yes Yes
Demographics Yes Yes
Food prices Yes
Adj. R2 0.06 0.07 0.19 0.21
N 9541 9541 9541 9539
AMERICAN INSTITUTES FOR RESEARCH
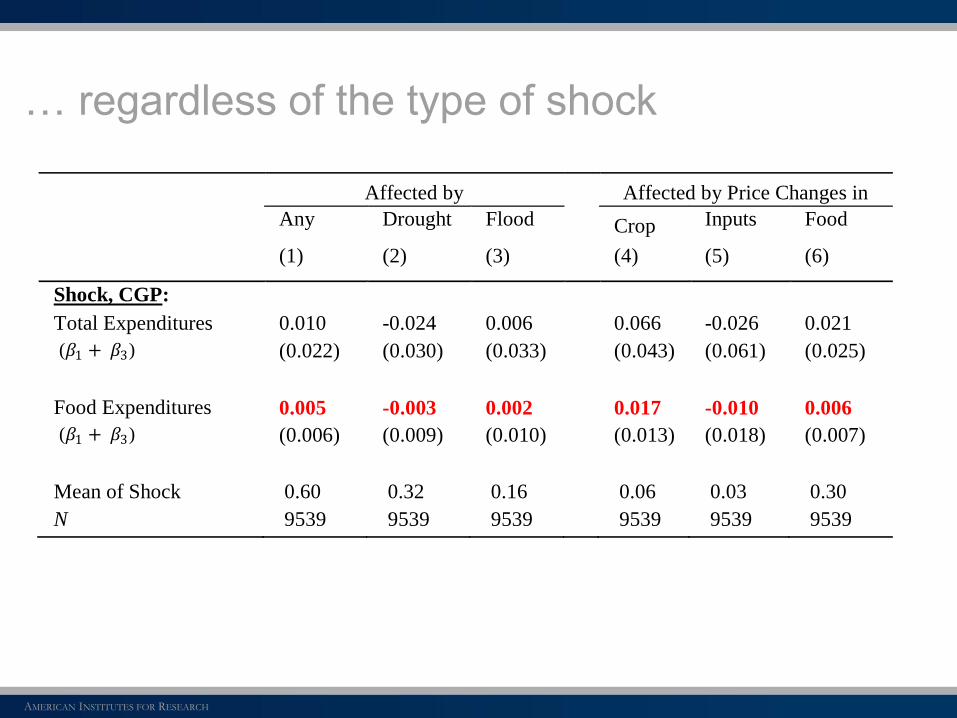
… regardless of the type of shock
Affected by Affected by Price Changes in
Any Drought Flood Crop Inputs Food
(1) (2) (3) (4) (5) (6)
Shock, CGP:
Total Expenditures 0.010 -0.024 0.006 0.066 -0.026 0.021
(𝛽1 + 𝛽3) (0.022) (0.030) (0.033) (0.043) (0.061) (0.025)
Food Expenditures 0.005 -0.003 0.002 0.017 -0.010 0.006
(𝛽1 + 𝛽3) (0.006) (0.009) (0.010) (0.013) (0.018) (0.007)
Mean of Shock 0.60 0.32 0.16 0.06 0.03 0.30
N 9539 9539 9539 9539 9539 9539

AMERICAN INSTITUTES FOR RESEARCH
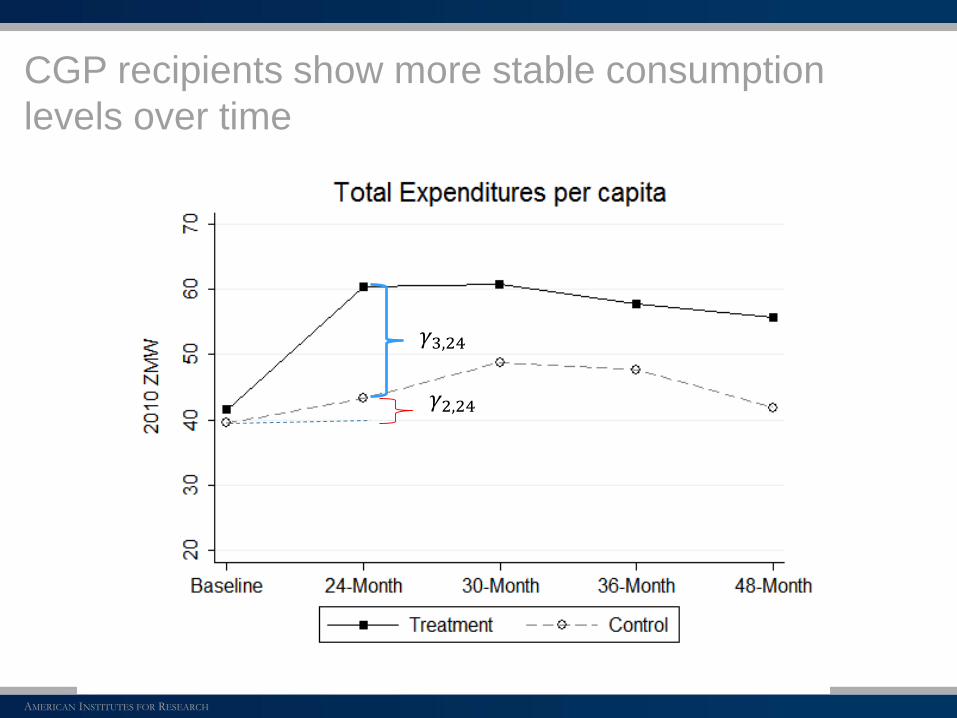
Empirical Strategy 2:
Tracking expenditure levels over time
𝑦𝑖𝑗𝑡 = α + 𝛾1𝐶𝐺𝑃𝑖𝑗 + 𝛾2t𝑑𝑡 + 𝛾3t𝑑𝑡 ∗ 𝐶𝐺𝑃𝑖𝑗 +𝜓𝑋𝑖𝑗0 + 𝜁𝑖𝑗t
𝑌𝑖𝑗𝑡 consumption for household i in district j at time t
𝐶𝐺𝑃𝑖𝑗 = 1 if i is a CGP beneficiary
𝑑𝑡 time fixed effects
Test for Consumption Smoothing:
Control: 𝐻0𝐶: 𝛾2,24 = 𝛾2,30 = 𝛾2,36 = 𝛾2,48
CGP: 𝐻0𝑇: 𝛾2,24 + 𝛾3,24 = 𝛾2,30 + 𝛾3,30 = 𝛾2,36 + 𝛾3,36 = 𝛾2,48 + 𝛾3,48
16
𝑆24 𝑆30 𝑆36 𝑆48
AMERICAN INSTITUTES FOR RESEARCH
CGP recipients show more stable consumption
levels over time
𝛾2,24
𝛾3,24
AMERICAN INSTITUTES FOR RESEARCH
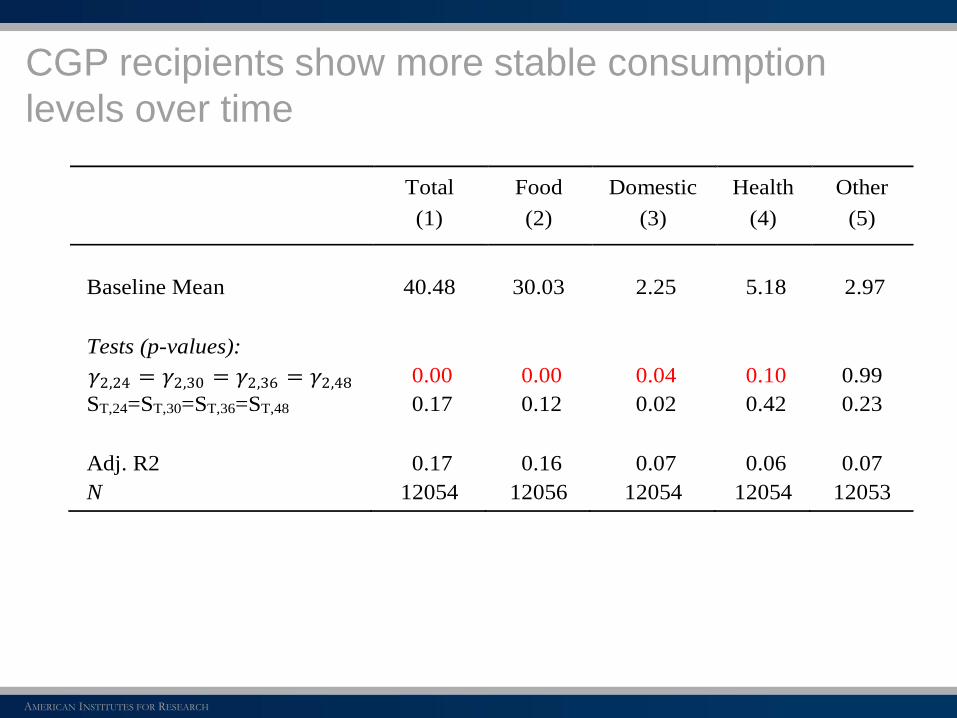
CGP recipients show more stable consumption
levels over time
Total Food Domestic Health Other
(1) (2) (3) (4) (5)
Baseline Mean 40.48 30.03 2.25 5.18 2.97
Tests (p-values):
𝛾2,24 = 𝛾2,30 = 𝛾2,36 = 𝛾2,48 0.00 0.00 0.04 0.10 0.99
ST,24=ST,30=ST,36=ST,48 0.17 0.12 0.02 0.42 0.23
Adj. R2 0.17 0.16 0.07 0.06 0.07
N 12054 12056 12054 12054 12053

AMERICAN INSTITUTES FOR RESEARCH
… the control group exhibits more food consumption
volatility as a fraction of total spending
AMERICAN INSTITUTES FOR RESEARCH
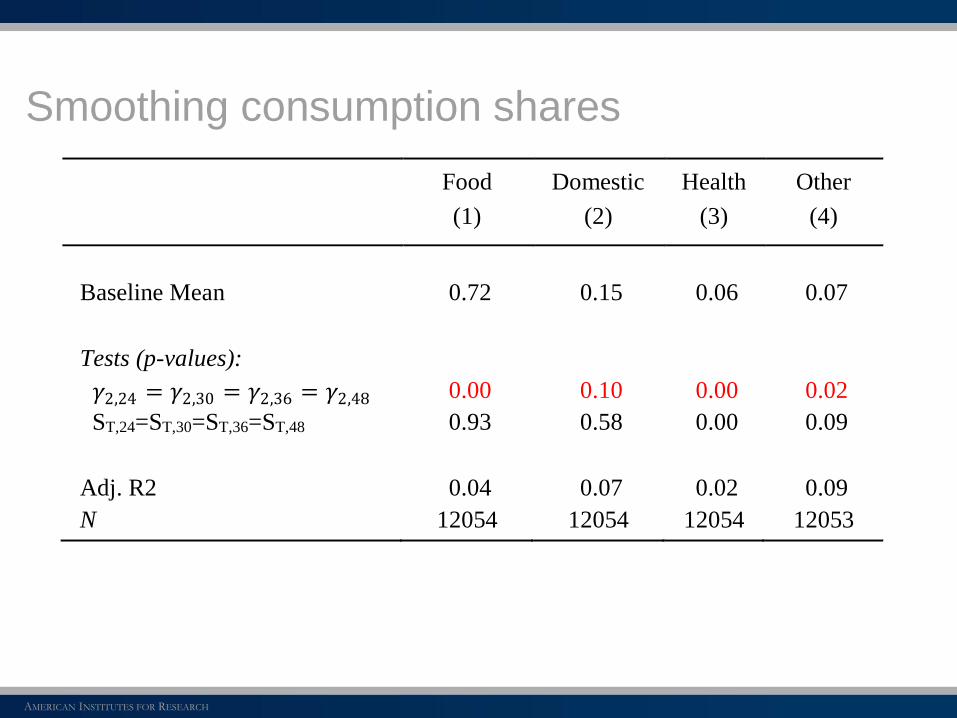
Smoothing consumption shares
Food Domestic Health Other
(1) (2) (3) (4)
Baseline Mean 0.72 0.15 0.06 0.07
Tests (p-values):
𝛾2,24 = 𝛾2,30 = 𝛾2,36 = 𝛾2,48 0.00 0.10 0.00 0.02
ST,24=ST,30=ST,36=ST,48 0.93 0.58 0.00 0.09
Adj. R2 0.04 0.07 0.02 0.09
N 12054 12054 12054 12053
AMERICAN INSTITUTES FOR RESEARCH
Mechanisms for Consumption
Smoothing
- Use of Livestock as buffer stock
- Build precautionary savings
- Invest in productive activities
- Reduce debt burden

AMERICAN INSTITUTES FOR RESEARCH
Livestock may be used as buffer stock
AMERICAN INSTITUTES FOR RESEARCH
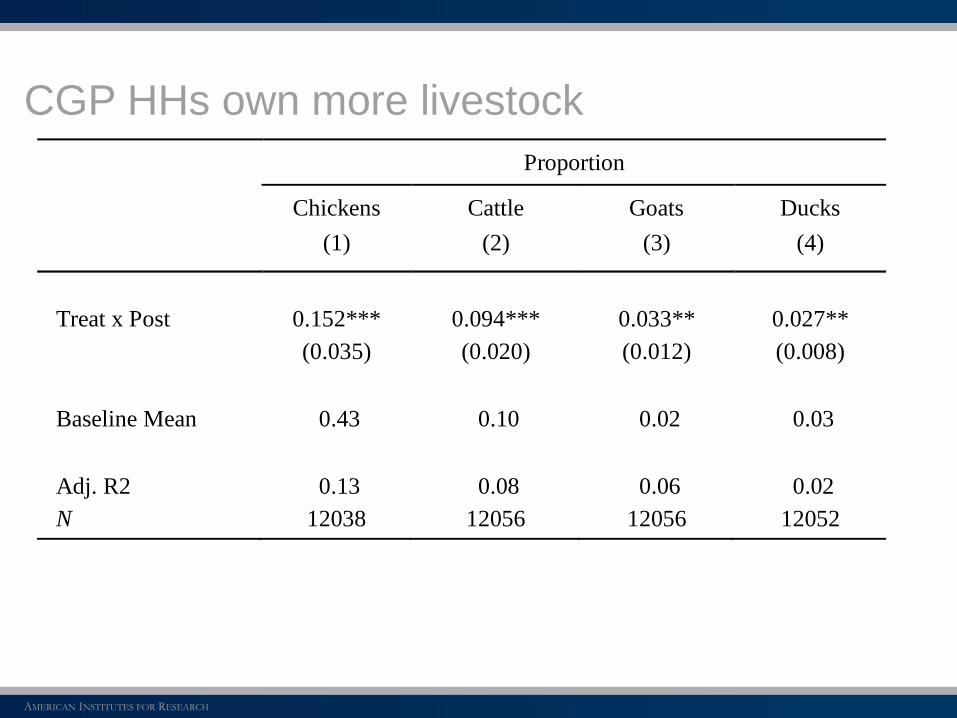
CGP HHs own more livestock
Proportion
Chickens Cattle Goats Ducks
(1) (2) (3) (4)
Treat x Post 0.152*** 0.094*** 0.033** 0.027**
(0.035) (0.020) (0.012) (0.008)
Baseline Mean 0.43 0.10 0.02 0.03
Adj. R2 0.13 0.08 0.06 0.02
N 12038 12056 12056 12052

AMERICAN INSTITUTES FOR RESEARCH
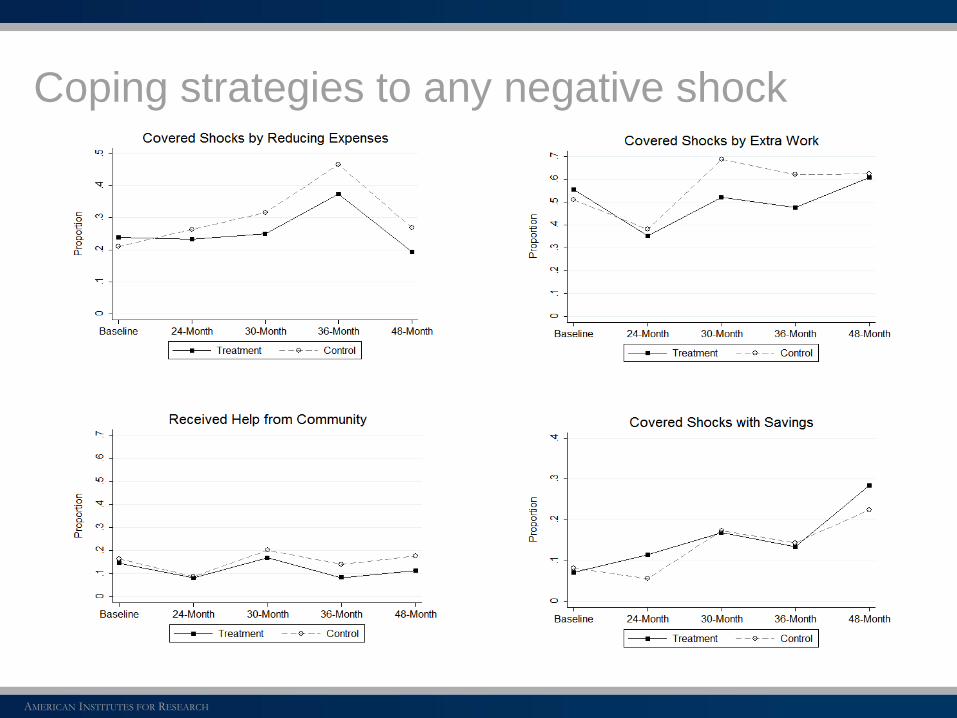
Results consistent with reported coping strategies to
negative shocks
Use
Savings
Sold
Assets
Reduce
Expenses
Work
More
Use
CGP
(1) (2) (3) (4) (5)
Treat x Post 0.032* -0.002 -0.069* -0.115** 0.106***
(0.016) (0.006) (0.036) (0.044) (0.011)
Outcome Mean 0.04 0.01 0.13 0.39 0.00
Adj. R2 0.04 0.01 0.04 0.05 0.17
N 6980 6980 6980 6980 5156
AMERICAN INSTITUTES FOR RESEARCH
Coping strategies to any negative shock
AMERICAN INSTITUTES FOR RESEARCH
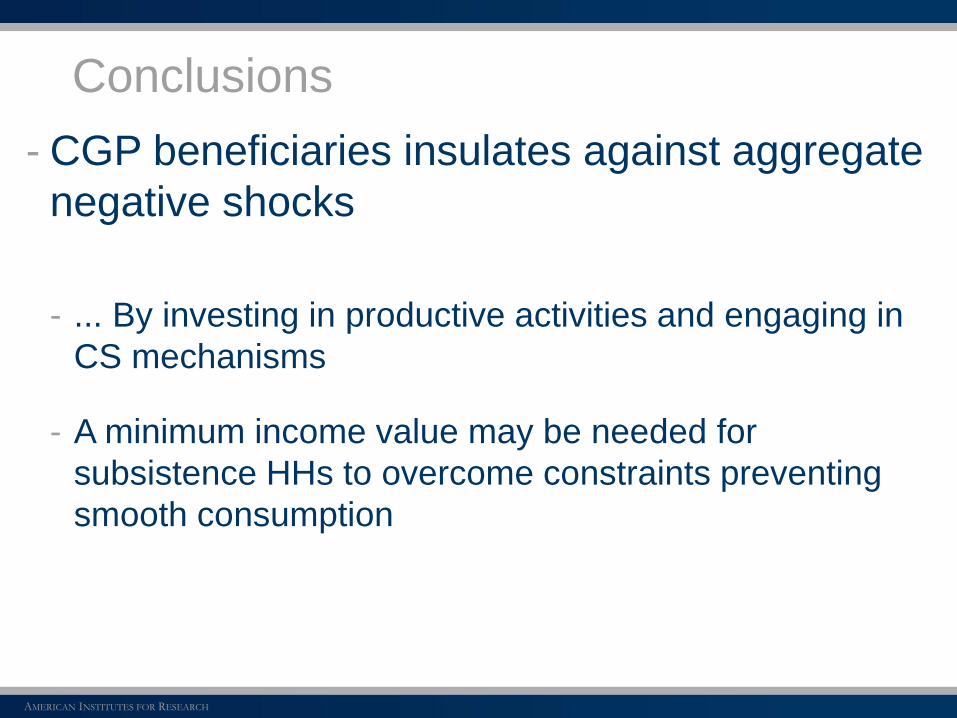
Conclusions
- CGP beneficiaries insulates against aggregate
negative shocks
- ... By investing in productive activities and engaging in
CS mechanisms
- A minimum income value may be needed for
subsistence HHs to overcome constraints preventing
smooth consumption

Juan Bonilla
1000 Thomas Jefferson Street NW
Washington, DC 20007-3835
General Information: 202-403-5000
www.air.org
27