consumption in india? deepthi kolady shivendra...
TRANSCRIPT

1
Can agricultural growth explain the reversal of a declining trend in per capita calorie
consumption in India?1
Deepthi Kolady
Department of Economics
South Dakota State University
Shivendra Srivastava
Scientist (Agricultural Economics)
ICAR- National Institute of Agricultural
Economics and Policy Research,
New Delhi, India
Jaspal Singh
Research Associate
ICAR- National Institute of Agricultural
Economics and Policy Research,
New Delhi, India
Selected Paper prepared for presentation at the 2016 Agricultural & Applied Economics
Association Annual Meeting, Boston, Massachusetts, July 31-August 2
Copyright 2016 by [authors]. All rights reserved. Readers may make verbatim copies of this
document for non-commercial purposes by any means, provided that this copyright notice
appears on all such copies.
1PRELIMINARY AND INCOMPLETE – DO NOT CITE WITHOUT THE AUTHORS’ PERMISSION.

2
Introduction
Conventional wisdom suggests that hunger and malnutrition should be eliminated by economic
growth. There is enough evidence on the positive relationship between income growth poverty
reduction and consumption expenditure (Deaton and Dreze 2002; Patnaik 2010; Smith 2013).
However, India has been presenting a paradoxical trend since 1970s; a decline in per capita calorie
consumption even when economy was growing and per capita real incomes were increasing. For
instance, although with fluctuations, India’s annual GDP growth increased from 5.5% in 1990 to
10.3% in 2010 and poverty declined from 45.3% in 1993 to 29.8% in 2009, suggesting a period of
robust economy growth and poverty reduction. Paradoxically, per capita calorie consumption
declined 5.2 % percent from 2146 in 1993 to 2034 in 2004-5 and a further decline of 1.17% to
2010 in 2009-10. This unexpected decline of per capita calorie consumption is often referred to as
“calorie consumption puzzle” in India. However, examination of data from the household consumer
expenditure surveys (HCES) conducted by the National Statistical Survey Office (NSSO) in 2011-
12, shows a four percent increase in per capita calorie consumption to 2088 in 2011-12. This is the
first time since 1970s per capita calorie consumption intake increases in India. This first time
reversal raises questions such as, what are the drivers of this increase in per capita calorie
consumption intake? and whether this increase in trend will endure in the future?
In the available literature focusing on the calorie consumption puzzle in India, considerable attention
has been given to explain the consumption puzzle and identify the factors responsible for the puzzle
(Rao 2000; Palmer-Jones 2005; Deaton and Dreze 2009; Basu and Basole 2012). Basu and Basole
(2012) categorized the body of research on consumption puzzle into two broad strands: coercive
factors and non-coercive factors. Supporters of theory of coercive factors argue that general rural
impoverishment is the cause of the puzzle while supporters of theory of non-coercive factors
attribute it to factors such as food budget squeeze, declining subsistence consumption, and
diversification of diets, urbanization, changes in occupational structures, declining energy
requirements, and improvements in epidemiological environment. There is another strand of
explanation which argues that calorie intake in India is not low or declining as reported in the
literature, but it is the result of poor data collection and reporting (Smith 2013).

3
In contrast, much less is known about the role of agriculture, which provides livelihood for about
55% of India’s total work force, in causing the puzzle or in the reversal of the puzzle. Since 2004-
05, India has witnessed unprecedental growth in agriculture, including livestock. To our knowledge,
no previous studies has looked at the micro-and macro level effects of this improved agricultural
growth on food security and nutrition. In this study, our objectives are three fold. First, identify the
factors responsible for the calorie consumption puzzle in India. Second, examine the role of
agriculture, if any, in solving the calorie consumption puzzle in rural areas. Third, examine whether
the reported increase in calorie intake is due to the improvements in data collection implemented for
the 2011-12 HCES survey.
We hypothesize that improvements in agricultural sector since 2004-05 resulted in improved
agricultural household income in rural areas and contributed to improvements in calorie intake. Our
second hypothesis is that improvements in data collection for the 2011-12 HCES survey have a
positive effect on the increase in calorie intake. We will use HCES data for the rural sector for years
2004-05 and 2011-12 and data from the Situation Assessment Survey of Agriculture 2013, for our
analysis. HCES surveys collect household level data on variables such as demography, consumption
expenditure and quantity for both food and non-food items, diet diversity, and economic status.
NSSO conducts the Situation Assessment Survey of agriculture and collects detailed information on
agricultural production and different income sources in the rural sector.
We find supporting evidence for our hypotheses. Findings from our study generate discussions on
the following fronts. First, the fact that after four decades of declining trend there is a reversal in per
capita calorie intake, in itself is a topic for discussion. Second, to our knowledge, ours is the first
study to empirically examine the trend reversal in per capita calorie intake in India and to examine
the role of agriculture if any in this significant achievement. Our study brings agriculture to the
forefront of debate on calorie consumption puzzle in India. Third, policy implications of the study
will be another topic for discussion. Finally, there can be discussion about the data and methodology
and the potential for improvement. All these discussions will contribute to the better understanding
of linkages between agriculture and nutrition and its role in food security and improved nutrition,
while emphasizing the need for a thorough, well designed, and integrated data collection process to
have a more complete data set for future studies in the field.
4
This paper is organized as follows. In the next section, we present the background for our study.
Then we present the household level survey data and carry out a descriptive analysis to understand
the changes in consumption patterns between 2004-05 and 2011-12, before using a set of regression
models to test the hypothesis more formally. We use instrumental variable approaches to take into
account endogeneity issues. The last section concludes and discusses policy implications.
2. Background
Calorie consumption debate: Since the economic liberalization in 1990s, national income per
capita in India has increased substantially (Drez and Sen 2011). The per capita income in real
terms (at 2011 -12 prices) during 2014-15 was 5.9 % higher than that during 2013-14. This
economic transition has been accompanied by urbanization, changes in food consumption pattern,
and epidemiological transitions, all of which have implications on calorie intake (Smith 2013). In a
critical review of calorie debate in India, Smith (2013) summarizes the explanations of the puzzle
so far: declining calorie requirement (Deaton and Dreze 2009), increasing food prices over time
(Gaiha et al 2009), food budget squeeze (Basu and Basole 2012), incorrect measurement of
poverty levels in India where money-metric poverty line is delinked from calorie requirements
(Deaton and Dreze 2009, Patnaik 2010), cultural density which acts against adoption of high
calorie western style foods (Landy 2010); and consumers deliberate choices where they prefer
luxurious consumption over food consumption (Banerjee and Duflo 2011). Smith 2013 shows that
although some may serve as partial explanations, available empirical evidence does not support the
above explanations fully.
Most of the empirical research focusing on Indian calorie consumption debate uses nationally
representative HCES data (Basu and Basole, Deaton and Dereze 2009, Smith 2013). Studies using
food consumption data available from alternate sources such as National Nutrition Monitoring
Bureau (NNMB) also show a declining trend in calorie intake and an increasing trend in
undernourishment up until 2011-12 (Figure 1). Smith 2013 questions the validity of the
assumption that the data from which calorie consumption intake and undernourishment estimates
are derived are collected incorrectly. Using propensity score matching techniques, Smith 2013
shows that the declining trend in calorie consumption is at least partially a result of incomplete
collection of data on food consumed away from home (an issue we will return later in the chapter).

5
However, Smith 2013 did not use data from 2011-12 HCES survey, but used data from previous
surveys.
It is clear from the review of calorie consumption debate above that role of agriculture (direct and
indirect effects) has not given any attention so far. However, there is a push from the central
government and non-profit organizations to leverage the agriculture-nutrition linkage to address
the undernourishment issues in India. Our study fills this gap by examining whether changes in the
agricultural sector happened during the last decade can explain the reversal of the declining trend
in calorie consumption in India.
Source: Compiled by authors using various rounds of NSSO’s HCES data.
Note: The mean calorie intake was compared with the minimum required calorie level for a healthy and active life to assess theadequacy of nutritional intake. Indian Council of Medical Research (ICMR) uses calorie norms of 2400 kcal for rural areas and2100 kcal for urban areas, while Food and Agriculture Organization (FAO) uses a common minimum required calorie norm of1800 Kcal per person per day.
Indian agriculture sector since 2004-05
Examination of the decadal growth trajectory of agricultural GDP in India during 1971-72 to
2012-13 shows two points of structural breaks: first in 1996-97, shortly after the economic
liberalization in 1991, which brought down the growth trajectory and second, in 2005-06. Thus,
these two years of structural breaks divide the agricultural performance in the last two decades into
two phases: phase I from 1995-06 to 2005-06 representing a period of slowdown in agriculture,
and, phase II beginning with year 2005-06 representing a period of recovery and acceleration
2153
2047 2020
20992146
20342010
2088
0
20
40
60
80
100
1900
1950
2000
2050
2100
2150
2200
1993-94 2004-05 2009-10 2011-12
Figure 1:Trends in calorie intake and undernoursihment inIndia, 1993-2011
Undernourishment Rural(ICMR norms) Undernourishment Rural (FAO norms)
Rural All India
6
(Chand and Parappurathu 2012; Chand 2014). The period of recovery and acceleration is further
evident by the fact that during the last decade, GDP of agriculture did not witness a single year
with negative growth in output. Further the growth in agricultural sector during the last decade was
very broad based: the annual rates of growth for crop, fruits and vegetables, and livestock were
3.3%, 5.3%, and 4.8%, respectively (Chand 2014). The National Food Security Mission (NFSM)
launched in 2007, which focused on improving production of cereals and pulses might have
contributed to the impressive performance of food grains and pulses during the last decade.2 If
increased production results in decreased farm prices, then the net effect of increased production
and productivity on net farm income is conditional upon various factors including domestic and
international demand and supply factors, government policy etc. It is important to note that during
the last decade, agricultural prices relative to non-agricultural prices have risen by about 30%
(Chand 2014).
Although, these national level figures of agricultural performance are very impressive, there is lot
of variation in the agricultural growth rates at state levels; from -1.15% in Kerala to 5.91% in
Chattisgarh (Chand 2014). Overall states with better irrigation infrastructure, good soil, marketing
and credit infrastructure perform better. Concerned with the relatively poor performance of
agriculture in eastern region of India, the central government launched a new initiative called
“Bringing Green Revolution to Eastern India (BGREI)” in 2010-11 in seven states of Eastern India
namely; Assam, Bihar, Chhattisgarh, Jharkhand, Eastern Uttar Pradesh, Orissa and West Bengal.
Other social welfare programs in India
The public distribution system (PDS) which is designed to sell rice, wheat, sugar, and kerosene
at highly subsidized prices to poor household systems in India has undergone substantial
changes since 2004-05. Although, still deeply flawed, performance of PDS improved in many
states resulting in less leakage and better access to poor households with positive implications
on calorie consumption (Himanshu and Sen, 2013). The National Food Security Act (NFSA)
enacted in 2013 would increase the monthly entitlement of food grains to 5 kilograms (kg) per
person for “priority” households and 35 kg per household for Antyodaya Anna Yojana (AAY)
households, which are the poorest of the poor households. It would expand the fraction of
eligible households to include up to 75 percent of the rural population and 50 percent of the
2 The growth rate in food grains sector increased from 0.71 percent during 1994-95 to 2003-04 to 2.66 percent during2003-04 to 2012-13. The pulse sector also witnessed an impressive growth from -0.64 during 1994-95 to 2003-04 to3.31 percent during 2003-04 to 2012-13.
7
urban population. Since our study focuses on the period prior to NFSA, it will not be
accountable for the upward trend in calorie intake.
The Mahatma Gandhi National Rural Employment Act (MGNAREGA 2005) implemented in
India under the “Right to Work” campaign aims to enhance the livelihood security of poor
people living in rural areas by guaranteeing hundred days of work if they are willing to
volunteer. Although, MGNAREGA might have positive implications on calorie consumption
and food security in rural areas, examination of the same is beyond the scope of this study.
Data and Sample Characteristics
We use data from Household Consumption Expenditure (HCES) surveys conducted by National
Sample Survey Office (NSSO), the 68th Round of 2011-12 and 61st Round of 200-05 to analyze
the changes in food consumption pattern between 2004 and 2011 and to identify the drivers of
trend reversal of calorie intake. Although, HCES covers both rural and urban sectors, our study
focuses only on rural sector. We also use data from Situation Assessment Survey of Agriculture of
2013 conducted by NSSO to examine the role of agriculture if any in the upward trend reversal of
calorie intake. Although, Situation Assessment Survey of Agriculture was conducted in 2013,
most of the information refers to the 2012-13 crop year making it compatible with the 2011-12
and HCES data. The NSSO surveys cover all the states and union territories for the HCES rounds
and covers all the major agricultural producing states for the Situation Assessment Survey. NSSO
adopts a rigorous sampling framework for the data collection.
HCES Data
The main focus of HCES is to collect household level consumption levels and expenditures. The
consumption data is at the household level not at individual level within a household. The 2011-12
survey divided the sample households into two groups and followed two different schedules. In
schedule Type 1, for food items, it had a 30 day recall period for consumption of all food items. In
schedule Type 2, a few food items had a 30 day reference period and the rest had a 7 day reference
(recall) period. Schedule Type 1 is done to maintain continuity with past series. The data for this
analysis is based on the 30 days recall period for both food and non-food expenditures. Thus our
data follows a Uniform Reference Period (URP) of 30 days and follows Schedule Type 1. This 30
day recall period raises the possibilities of reporting errors and biases. When it comes to food
consumption, data on meals consumed at home, meals purchased and consumed outside of home,

8
free meals consumed including mid -day school meal program are collected. For the home cooked
meals detailed item-wise data is collected (kg/month). For example (rice, wheat, barley, cabbage,
tomato (vegetables), mango, orange (fruits), milk, egg, fish, meat, beverages etc). Comparison of
survey schedules between 2004-05 and 2011-12 shows that 2011-12 survey included more food
items than that of 2004-05 and collected more details on variables such as meals consumed outside
home. As suggested in Smith 2013, whether these improvements in data collection contributed to
the trend reversal of calorie intake is a debatable topic and we address this issue in our study.
Nutrient conversion: For this analysis, the food quantities are converted into kilo calories (Kcal)
based on the Indian Council of Medicine Research (ICMR) report “Nutritive Values of Indian
Foods” by Gopalan et al (1991). The nutrient content of each item (calories, protein, and fat) in the
schedule per unit of quantity are given in the ICMR report. For items newly introduced in the 68th
Round, nutrient coefficients have been computed according to the procedures recommended by the
Sub Group of the Working Group for 68th Round formed specifically for this purpose.
Outliers: We have noticed that the published reports from NSSO use the data without removing
any outliers in the data. Outliers is an important issue, especially for key variables such as per
capita calorie consumption, with values ranging from 0-51,000. After looking at the scatter plot,
standard deviation etc, we have dropped the upper 0.5 percentile of values for per capita calorie
consumption for rural observations. For the lower side it was hard to come up with any such cut
off, mainly because of the argument that there is extreme undernourishment in many parts of
India. Hence for the lower side, we have dropped observations with zero per capita calorie
consumption values. The total number of rural observations after removing the outliers are 78,064
for 2004-05 and 58,699 for 2011-12.
Situation Assessment Survey 2013
We use data from situation assessment survey at farm household level mainly to estimate income
from various occupation sources and to examine whether the source and level of income have any
effect on calorie intake. We are still in the process of extracting data from the 2005 Situation
Assessment Survey. Upon completion of extraction of the 2005 Situation Assessment Survey data
we will pool the data from the two rounds of survey for our econometric analysis.
Descriptive Analysis
Calorie and nutrition intake, expenditures, and calorie prices

9
Table 1 presents the weighted summary statistics, using HCES data, for calorie, protein, and fat
intake for 2004-05 and 2011-12. It is clear from Table 1 that all the nutrient indicators improved
between 2004 and 2011, with per capita fat consumption experiencing the most improvement (21%).
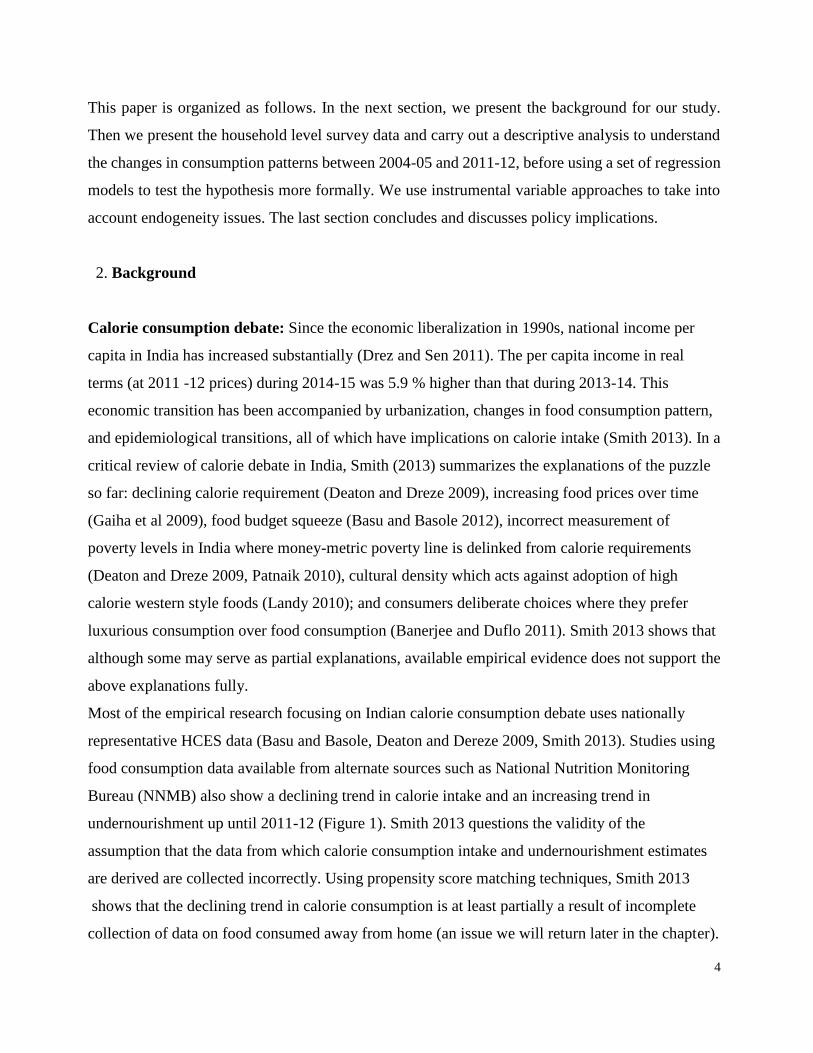
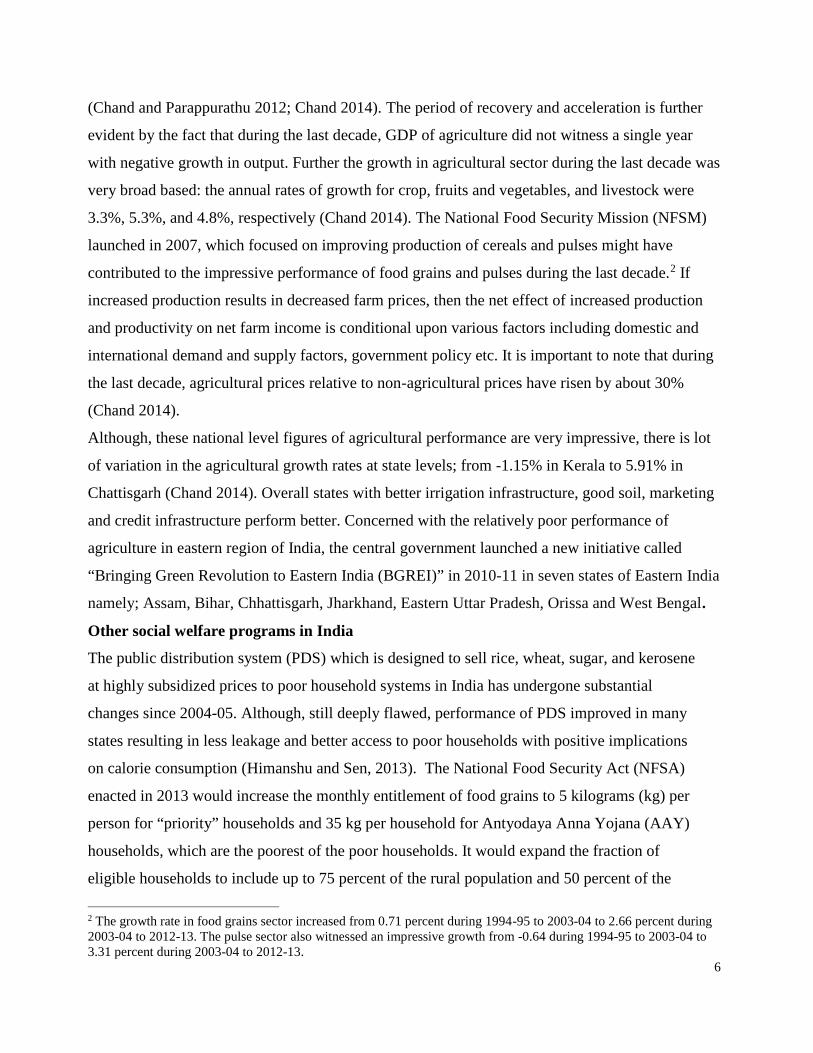
Figures 2-4 shows spatial pattern of this change using district level data. Per capita calorie
consumption levels are high in districts in the north-west region. Comparison of figure 2a and 2b
shows that most of the improvements in per capita calorie consumption happened in the north-west
region and parts of south and central India. As reported in Deaton and Dreze 2009, patterns for
protein intake is very similar to the pattern for calorie intake. (Figure 3a and 3b). However, fat intake
maps in 4a and 4b shows an overall improvement across the country except for east and north east
regions.
Figure 2a: Per capita calorie intake 2004 Figure 2b: Per capita calorie intake 2011
10
Figure 3a: Per capita protein intake 2004 Figure 3b: Per capita protein intake 2012
Figure 4a: Per capita fat intake 2004 Figure 4b: Per capita fat intake 2012

11
Table1: Trends in per capita calorie, protein, and fat intake in India, 2004-2011
Category 2004-05 2011-12 Percentage changePer capita calorie consumption (Kcal/day/person) 2047 2099 2.55
Per capita protein consumption (gm/day/person) 55 57 3.63Per capita fat consumption (gm/day/person) 34 41 20.59Source: Authors
Cereals (mainly rice and wheat) is the main source of calorie intake in India. As reported in
Deaton and Dreze (2009) calorie intake from cereals is declining (Table 2), even after the
significant reforms in the PDS, which improved poor households’ access to PDS and offtake
from PDS (Table 3). Consumption of pulses, milk, and non-vegetarian (egg, fish, and meat) is
on the rise while consumption of vegetables is declining with a slight increase in fruit
consumption (Table 2).
Table 2: Food group-wise consumption and calorie intake in India, 2004-2011
Category 2004-05 2011-12 Percentagechange
Cereals (Kg/person/month) 12.11 11.23 -7.26672Pulses (Kg/person/month) 0.70 0.78 11.42857
Milk (Kg/person/month) 4.06 4.58 12.80788

12
Non-vegetarian (egg, fish, meat) (Kg/person/month) 0.40 0.43 7.5Vegetables (Kg/person/month) 5.16 4.55 -11.8217Fruits (Kg/person/month) 0.55 0.58 5.454545Per capita calorie consumption from cereals(Kcal/day/person)
1381 1281 -7
Per capita calorie consumption from pulses(Kcal/day/person)
79 90 14
Per capita calorie consumption from milk and dairyproducts (Kcal/day/person)
133 152 14
Per capita calorie consumption from non-vegetarianitems (Kcal/day/person)
15 17 13
Per capita calorie consumption from vegetables(Kcal/day/person)
84 83 -1
Per capita calorie consumption from fruits(Kcal/day/person)
15 15 0
Source: Authors
Table 3: Consumption of cereals and calorie intake through PDS purchase in India,
2004-11
Category 2004 2011 Percentagechange
Wheat purchased through PDS (Kg/capita) 0.31 0.76 145.1613
Proportion of wheat purchased through PDS 0.10 0.23 130
Rice purchased through PDS(Kg/capita) 0.84 1.66 97.61905
Proportion of rice purchased through PDS 0.13 0.25 92.30769
Calorie intake from PDS wheat (Kcal/day/person) 34.82 86.35 147.9897
Calorie intake from PDS rice (Kcal/day/person) 96.67 191.94 98.55177
Access to antoyadaya PDS card (%) 3 6 100
Access to below poverty line PDS card (%) 26 37 42.31
Calorie intake- with ration card(Kcal/day/person) 2026.75 2099.73.599359
Calorie intake without ration card(Kcal/day/person)
1944.47 2020.263.89772
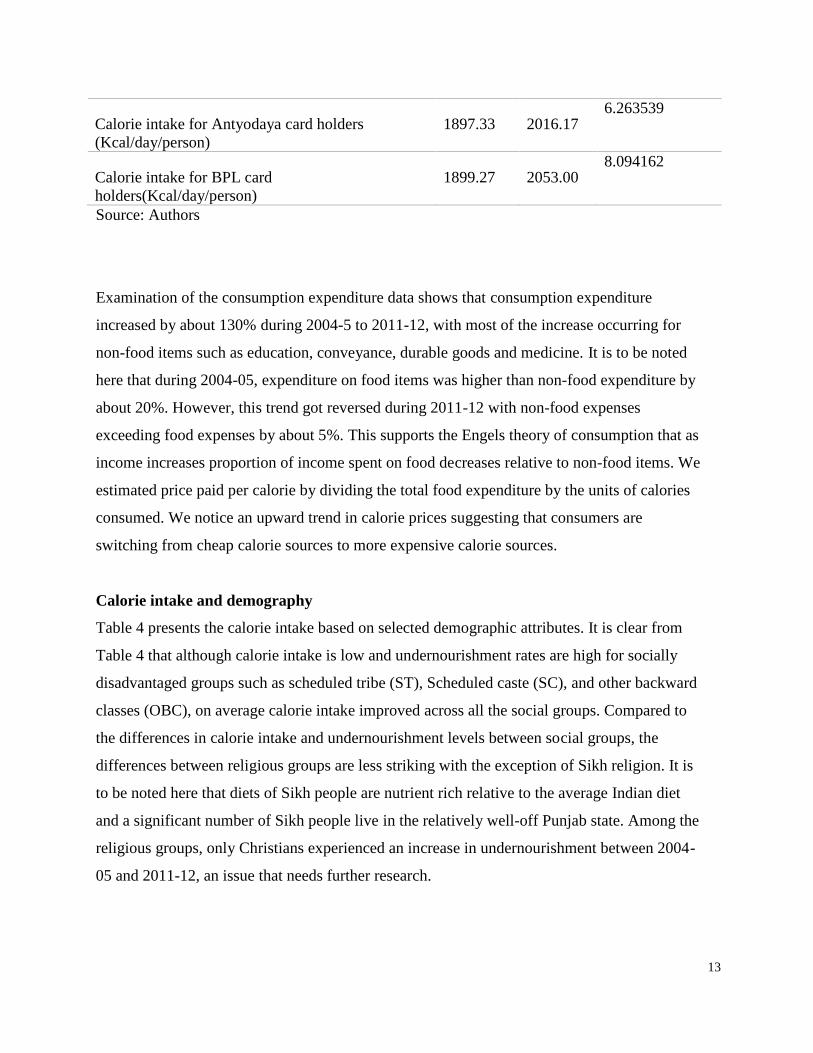
13
Calorie intake for Antyodaya card holders(Kcal/day/person)
1897.33 2016.176.263539
Calorie intake for BPL cardholders(Kcal/day/person)
1899.27 2053.008.094162
Source: Authors
Examination of the consumption expenditure data shows that consumption expenditure
increased by about 130% during 2004-5 to 2011-12, with most of the increase occurring for
non-food items such as education, conveyance, durable goods and medicine. It is to be noted
here that during 2004-05, expenditure on food items was higher than non-food expenditure by
about 20%. However, this trend got reversed during 2011-12 with non-food expenses
exceeding food expenses by about 5%. This supports the Engels theory of consumption that as
income increases proportion of income spent on food decreases relative to non-food items. We
estimated price paid per calorie by dividing the total food expenditure by the units of calories
consumed. We notice an upward trend in calorie prices suggesting that consumers are
switching from cheap calorie sources to more expensive calorie sources.
Calorie intake and demography
Table 4 presents the calorie intake based on selected demographic attributes. It is clear from
Table 4 that although calorie intake is low and undernourishment rates are high for socially
disadvantaged groups such as scheduled tribe (ST), Scheduled caste (SC), and other backward
classes (OBC), on average calorie intake improved across all the social groups. Compared to
the differences in calorie intake and undernourishment levels between social groups, the
differences between religious groups are less striking with the exception of Sikh religion. It is
to be noted here that diets of Sikh people are nutrient rich relative to the average Indian diet
and a significant number of Sikh people live in the relatively well-off Punjab state. Among the
religious groups, only Christians experienced an increase in undernourishment between 2004-
05 and 2011-12, an issue that needs further research.

14
Table 4: Calorie intake and undernourishment among social and religious groups in
India, 2004-2011
Category 2004-05 2011-12
Calorie intake
(Kcal/capita/d
ay)
Undernour
ishment
(%)
Calorie intake
(Kcal/capita/d
ay)
Undernouri
shment (%)
% change
in
undernour
ishment
ST 1855.149
(492.46)
82.43 1986.06
(470.43)
78.27 -5.05
SC 1934.16
(503.50)
79.66 2052.73
(460.69)
72.71 -8.72
OBC 2026.27
(544.08)
73.92 2089.43
(492.88)
70.75 -4.29
Other castes 2123.89
(568.85)
65.75 2174.69
(520.19)
61.64 -6.25
Hindu 2019.42
(542.55)
73.55 2095.89
(491.75)
69.06 -6.10
Muslim 1941.36
(516.31)
77.72 2027.35
(478.66)
70.23 -9.63
Christian 1972.75
(575.22)
80.66 1974.41
(483.29)
83.49 3.50
Sikh 2289.95
(609.89)
54.02 2388.86
(562.67)
49.61 -8.15
Source: Authors
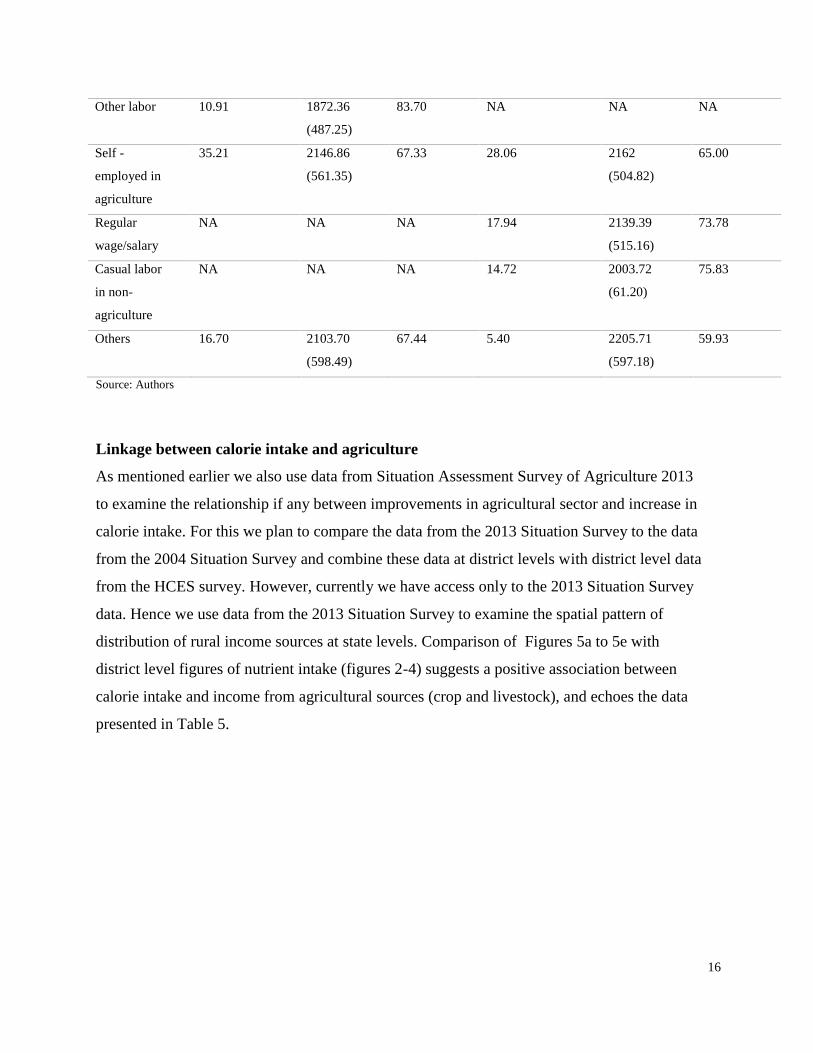
Another socio-economic/demographic information available from the HCES data is the
categorization of households based on their main occupation and income source. In the 2004-
05 survey households were categorized into five groups (self-employed in agriculture, self-
employed in non-agriculture, agricultural laborer, other laborer, and others) while in the 2011-

15
12 survey there were six groups (self-employed in agriculture, self-employed in non-
agriculture, casual laborer in agriculture, casual laborer in non-agriculture, regular wage/salary
earning and others). Because of the differences in the categorization of household types, a
direct comparison between 2004-05 is not possible. It is clear from Table 5 that on average,
calorie intake is high and undernourishment is low for those self-employed in agriculture
(cultivators). Table 5 also shows that agriculture is the main source of livelihood for rural
people in India accounting for about 50% (combining self-employed in agriculture and casual
labor in agriculture categories) in 2004-05 and 36% in 2011-12. Table 5 suggests the
importance of agriculture in reducing undernourishment and suggests the potential of a
positive association between agriculture and calorie intake.
Table 5: Calorie intake and undernourishment by household types in India, 2004-11
Category 2004-05 2011-12
% of rural
population
Calorie
intake
(Kcal/capit
a/day)
Undernour
ishment
(%)
% of rural
population
Calorie
intake
(Kcal/capit
a/day)
Undernour
ishment
(%)
Self -
employed in
non-
agriculture
22.48 2001.48
(512.18)
76.82 25.66 2053.58
(504.82)
73.78
Agriculture
labor
14.62 1839.76
(470.07)
85.60 8.21 1999.47
(459.94)
78.09
16
Other labor 10.91 1872.36
(487.25)
83.70 NA NA NA
Self -
employed in
agriculture
35.21 2146.86
(561.35)
67.33 28.06 2162
(504.82)
65.00
Regular
wage/salary
NA NA NA 17.94 2139.39
(515.16)
73.78
Casual labor
in non-
agriculture
NA NA NA 14.72 2003.72
(61.20)
75.83
Others 16.70 2103.70
(598.49)
67.44 5.40 2205.71
(597.18)
59.93
Source: Authors
Linkage between calorie intake and agriculture
As mentioned earlier we also use data from Situation Assessment Survey of Agriculture 2013
to examine the relationship if any between improvements in agricultural sector and increase in
calorie intake. For this we plan to compare the data from the 2013 Situation Survey to the data
from the 2004 Situation Survey and combine these data at district levels with district level data
from the HCES survey. However, currently we have access only to the 2013 Situation Survey
data. Hence we use data from the 2013 Situation Survey to examine the spatial pattern of
distribution of rural income sources at state levels. Comparison of Figures 5a to 5e with
district level figures of nutrient intake (figures 2-4) suggests a positive association between
calorie intake and income from agricultural sources (crop and livestock), and echoes the data
presented in Table 5.

17
Figures 5a-5b: Spatial distribution of income sources in India, 2013.
Figure 5a. Monthly Income from all sources Figure 5b. Monthly Income from cultivation 2013
Figure 5c: Monthly Income from Cultivation and livestock

18
Figure 5d. Monthly income from non-farm sources
Figure 5e. Monthly income from wages and salaries
19
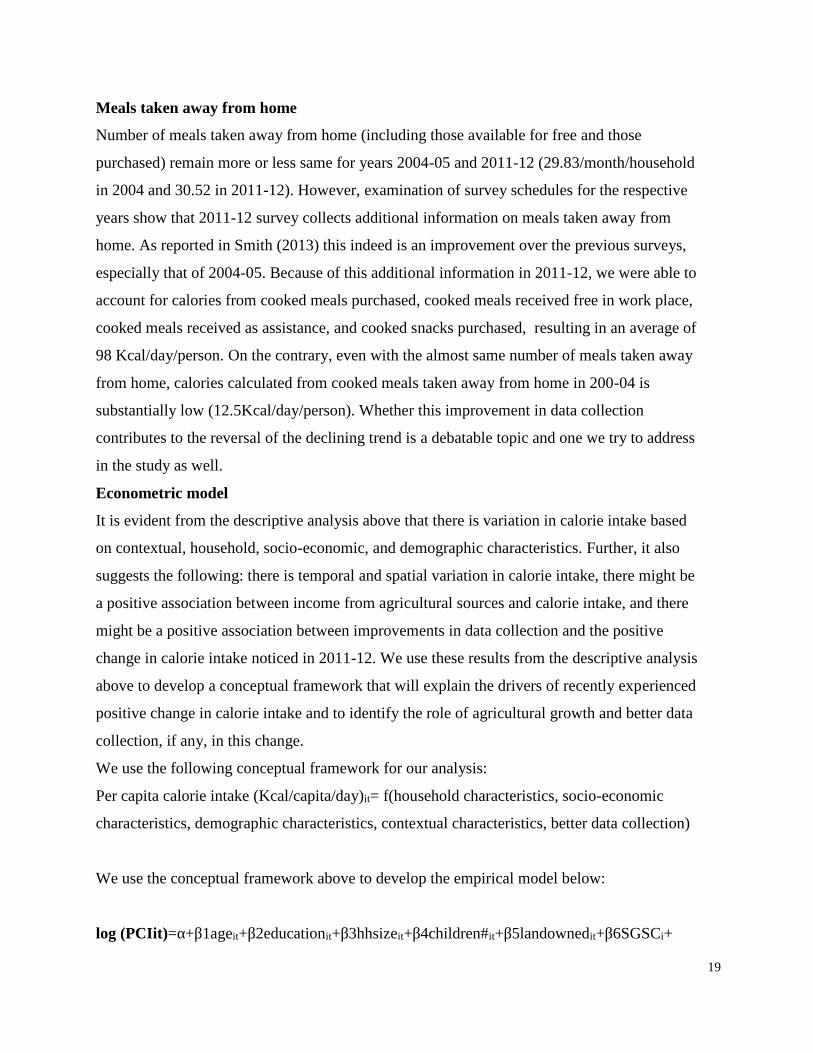
Meals taken away from home
Number of meals taken away from home (including those available for free and those
purchased) remain more or less same for years 2004-05 and 2011-12 (29.83/month/household
in 2004 and 30.52 in 2011-12). However, examination of survey schedules for the respective
years show that 2011-12 survey collects additional information on meals taken away from
home. As reported in Smith (2013) this indeed is an improvement over the previous surveys,
especially that of 2004-05. Because of this additional information in 2011-12, we were able to
account for calories from cooked meals purchased, cooked meals received free in work place,
cooked meals received as assistance, and cooked snacks purchased, resulting in an average of
98 Kcal/day/person. On the contrary, even with the almost same number of meals taken away
from home, calories calculated from cooked meals taken away from home in 200-04 is
substantially low (12.5Kcal/day/person). Whether this improvement in data collection
contributes to the reversal of the declining trend is a debatable topic and one we try to address
in the study as well.
Econometric model
It is evident from the descriptive analysis above that there is variation in calorie intake based
on contextual, household, socio-economic, and demographic characteristics. Further, it also
suggests the following: there is temporal and spatial variation in calorie intake, there might be
a positive association between income from agricultural sources and calorie intake, and there
might be a positive association between improvements in data collection and the positive
change in calorie intake noticed in 2011-12. We use these results from the descriptive analysis
above to develop a conceptual framework that will explain the drivers of recently experienced
positive change in calorie intake and to identify the role of agricultural growth and better data
collection, if any, in this change.
We use the following conceptual framework for our analysis:
Per capita calorie intake (Kcal/capita/day)it= f(household characteristics, socio-economic
characteristics, demographic characteristics, contextual characteristics, better data collection)
We use the conceptual framework above to develop the empirical model below:
log (PCIit)=α+β1ageit+β2educationit+β3hhsizeit+β4children#it+β5landownedit+β6SGSCi+

20
β7SGSTi+β8OBCi+β9religionhindui+ β10religionmuslimi+ β11reliogionchristiani+
β12HHtypeselfemplagrlit+Β13HHtypeselfemplnon-agrlit+
β14HHtypecasuallaboragrlit+β152PDScerealproportionit+ β16proportionnon-foodexpenseit+
β17SIDdiversityit+ β18MPCEit+ β19 Caloriepriceit+β20regionnorthi+ β21regionnortheasti+
β22regioneasti+ β23regionwesti+ β24regionsouthi+ β25yeardummy2011i+
β26yeardummy2011i*HHtypeselfemplagrlit+ β27yeardummy2011i* HHtypeselfemplnon-
agrlit+ β28yeadummy2011i* HHtypecasuallaboragrlit+ui+vit (1)
Where
PCI= Per capita calorie intake (Kcal/capita/day) for person i in year t
age- Age of household head in years
education- Education level of household head
hhsize- household size
children# -Number of children in the household
landowned- Hectares of land owned
SGST- Social group dummy for scheduled tribe (S(C)
SGSC- Social group dummy for scheduled caste (SC)
OBC- Social group dummy for other backward class (OBC)
Religionhindu- religion dummy for Hindu, equals 1 if Hindu, 0 otherwise
Religionmuslim-religion dummy for Muslim, equals 1 if Muslim, 0 otherwise
Reliogionchristian-religion dummy for Christain, equals 1 if Christian, 0 otherwise
HHtypeselfemplagrl-household type dummy equals 1 if its main occupation is self employed
in agriculture (cultivator), 0 otherwise
HHtypeselfemplnon-agrl- household type dummy equals 1if its main occupation is self
employed in non- agriculture (business and service), 0 otherwise
HHtypecasuallaboragrl- household type dummy equals 1 if its main occupation is casual
labor in agriculture, 0 otherwise
PDScerealproportion- proportion cereals purchased through PDS out of total cereal
consumption
Proportionnon-foodexpense- proportion of expenses spent on non-food items

21
SIDdiversity- Simposns Index of Diet diversity calculated using proportion of income spent
on various food groups
MPCE: Monthly per capita consumption expenditure used as a proxy for total income and
well being
Calorieprice- Rs per 1,000 Calories/day/capita
Regionnorth- region dummy equals 1, if belongs to northern region, 0 otherwise
Regionnortheast-region dummy equals 1 if belongs to north east region, 0 otherwise
Regioneast-region dummy equals 1 if belongs to eastern region, 0 otherwise
Regionwest-region dummy equals 1 if belongs to western region, 0 otherwise
Regionsouth-region dummy equals 1 if belongs to southern region, 0 otherwise
yeardummy2011- year dummy equals 1 if year is 2011, 0 if year is 2004
yeardummy2011i*HHtypeselfemplagrl- interaction term between year dummy and
household type self-employed in agriculture
yeardummy2011i* HHtypeselfemplnon-agrl- interaction term between year dummy and
household type self-employed in non-agriculture
yeadummy2011i* HHtypecasuallaboragrl- interaction term between year dummy and
household type casual labor in agriculture
HCES data does not collect any income data so we use monthly per capita consumption
expenditure (MPCE) as a proxy for income variable. However, MPCE is an endogenous
variable conditional on many other factors. To address the endogeneity issues associated with
this covariate, we employ instrumental variable regression using two state least squares
(2SLS). We use the following as instruments: dummy variables representing cooking fuel
source (LPG_cooking=1 if LPG is used for cooking, 0 otherwise), lighting fuel
source(Electricity_ligthing=1 if electricity is the source of lighting, 0 otherwise), two dummies
representing type of PDS ratio card possessed (PDS ration card_antoyadaya=1 if possess
antoyaday card, 0 otherwise; PDS rationcard BPL=1 if possess below poverty line card, 0
otherwise), and monthly expenses on durable goods.

22
Year dummy variable is expected to capture the improvements in data collection happened for
meals taken away from home for the 2011 HCES round and the improvements in agricultural
sector experienced between 2004-05 and 2011-12. A positive and significant coefficient on the
year dummy variable will support our hypothesis that improvements in data collection and
agricultural growth have positive effects on calorie intake. Household type dummies based on
main source of income are expected to capture the effects of income sources on calorie intake.
By interacting the household type dummies with year dummy we expect to capture the effect
of changes in income sources between 2004-05 and 2011-12 on calorie intake. A positive and
statistically significant coefficient on the interaction term between self-employed in agriculture
and year dummy will support our hypothesis that improvements in agricultural sector have
positive effect on calorie intake.
Although, the states covered under the surveys are same for the above two rounds of surveys,
the households are not same. Hence we do not have a panel data at household level. We
estimate the above model using data from HCES for years 2004-05 and 2011-12 separately,
and using pooled data for the above two years. Since our focus is on calorie consumption in
rural areas, for the model estimation, we do not include six union territories which are highly
urbanized. We include data from rural areas from all other states in India.
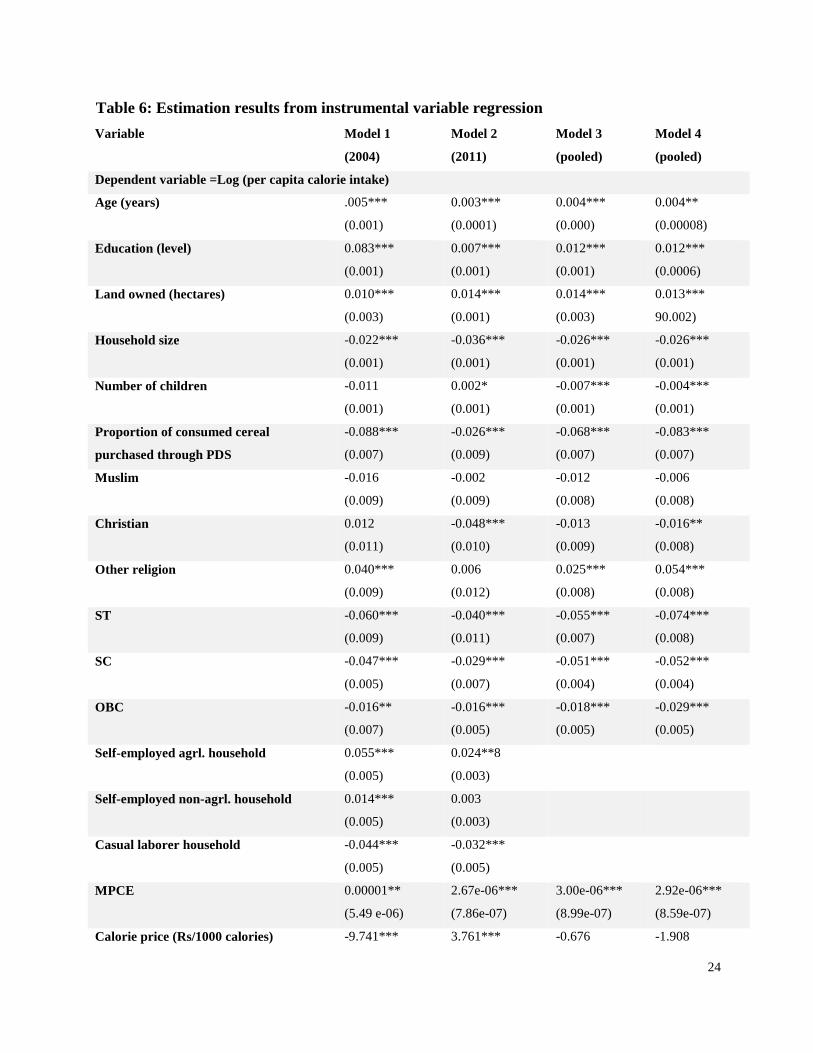
Results and Discussion
Results of the instrumental variable regression are shown in Table 6. The four models
presented in Table 6 differ from each other by the following: Model 1 uses data from 200-05
HCES survey only, Model 2 uses data from 2011-12 HCES survey only, Model 3 and 4 uses
pooled data from 2004-05 and 2011-12 but differ in their inclusion of interaction terms. We
estimated Model 1 and 2 to examine whether there is any changes in the effects of household,
demographic, socio-economic, and contextual factors on calorie intake between 2004 and
2011. First we focus on results which are common across all the models and then we examine
the differences in results between the models.
Overall, results in Table 6 show that age of household head, education level of the household
head, and land ownership have positive effect on calorie intake. This supports the conventional
wisdom that per capita calorie intake is high in households with higher land ownership and
better educated and experienced households. Size of the household has negative effect on per
capita calorie intake suggesting that as the number of people in a household increases per

23
capita calorie intake decreases. It is clear from Table 6 that as the proportion of calorie intake
from the cereals purchased through PDS increases, per capita calorie intake decreases. It is
assumed that poor people will have higher proportion of PDS purchase of cereals compared to
relatively well-off people. Echoing the results in Table 3, the negative and significant
coefficient might be capturing this effect.
As expected, per capita calorie intake for socially disadvantaged groups is low and monthly
per capita consumption expenditure (a proxy for general well-being and income level) has
positive effect on per capita calorie intake. As reported in Basu and Basole (2012), proportion
of expenses spent on non-food items have a negative effect on per capita calorie intake. We
also find a negative and significant effect of diet diversity on per capita calorie intake
suggesting that as consumers switch from cheap calorie sources to more diversified diet, their
calorie intake decreases.
As mentioned earlier, there are differences in results between the four models presented in
Table 6. For example, as shown in Table 4, Christians had lower per capita calorie intake in
2011, while there was no such negative and significant effect in 2004. We grouped, all the
minor religions (other than Hinduism, Islam, and Christianity) into a variable “other religion’. It
is interesting to note that while the coefficient on ‘other religion’ was positive and significant in
2004, no such effect is evident in 2011. However, using pooled data, the coefficient becomes
positive and significant in Models 3 and 4.
24
Table 6: Estimation results from instrumental variable regression
Variable Model 1
(2004)
Model 2
(2011)
Model 3
(pooled)
Model 4
(pooled)
Dependent variable =Log (per capita calorie intake)
Age (years) .005***
(0.001)
0.003***
(0.0001)
0.004***
(0.000)
0.004**
(0.00008)
Education (level) 0.083***
(0.001)
0.007***
(0.001)
0.012***
(0.001)
0.012***
(0.0006)
Land owned (hectares) 0.010***
(0.003)
0.014***
(0.001)
0.014***
(0.003)
0.013***
90.002)
Household size -0.022***
(0.001)
-0.036***
(0.001)
-0.026***
(0.001)
-0.026***
(0.001)
Number of children -0.011
(0.001)
0.002*
(0.001)
-0.007***
(0.001)
-0.004***
(0.001)
Proportion of consumed cereal
purchased through PDS
-0.088***
(0.007)
-0.026***
(0.009)
-0.068***
(0.007)
-0.083***
(0.007)
Muslim -0.016
(0.009)
-0.002
(0.009)
-0.012
(0.008)
-0.006
(0.008)
Christian 0.012
(0.011)
-0.048***
(0.010)
-0.013
(0.009)
-0.016**
(0.008)
Other religion 0.040***
(0.009)
0.006
(0.012)
0.025***
(0.008)
0.054***
(0.008)
ST -0.060***
(0.009)
-0.040***
(0.011)
-0.055***
(0.007)
-0.074***
(0.008)
SC -0.047***
(0.005)
-0.029***
(0.007)
-0.051***
(0.004)
-0.052***
(0.004)
OBC -0.016**
(0.007)
-0.016***
(0.005)
-0.018***
(0.005)
-0.029***
(0.005)
Self-employed agrl. household 0.055***
(0.005)
0.024**8
(0.003)
Self-employed non-agrl. household 0.014***
(0.005)
0.003
(0.003)
Casual laborer household -0.044***
(0.005)
-0.032***
(0.005)
MPCE 0.00001**
(5.49 e-06)
2.67e-06***
(7.86e-07)
3.00e-06***
(8.99e-07)
2.92e-06***
(8.59e-07)
Calorie price (Rs/1000 calories) -9.741*** 3.761*** -0.676 -1.908

25
(3.694) (1.022) (1.476) (1.497)
Proportion of non-food expenses -0.083***
(0.018)
-0.232***
(0.018)
-0.137***
(0.014)
-0.123***
(0.015)
Simpsons Index of diet diversity -0.086**
(0.040)
-0.10***
(0.036)
-0.071***
(0.027)
-0.094***
(0.028)
North 0.107***
(0.013)
0.082***
(0.009)
0.06***
(0.009)
Northeast 0.003
(0.017)
-0.043***
(0.016)
-0.012
(0.010)
East 0.023
(0.017)
0.004
(0.010)
0.018
(0.013)
Central -0.026**
(0.012)
0.005
(0.012)
-0.012
(0.009)
South -0.018
(0.016)
-0.049***
(0.015)
-0.034**
(0.014)
Year dummy (=2011) 0.018*
(0.010)
0.026**
(0.013)
Yeardummy*selfempl.agrl 0.013***
(0.004)
0.013***
(0.004)
Yeardummy*casuallaboragrl -0.009**
(0.004)
-0.016***
(0.004)
Yeardummy*selfemplyednonagrl. 0.001
(0.004)
-0.004
(0.004)
Yeardummy*north 0.074***
(0.010)
Yeardummy*northeast -0.046***
(0.016)
Yeardummy*east 0.004
(0.011)
Yeardummy*central -0.005
(0.0120
Yeardummy*south -0.034**
(0.014)
Constant 7.616***
(0.028)
7.812***
(0.030)
7.663**8
(0.023)
7.697***
(0.024)
Number of observations 65597 49658 11525 11525
R2 0.22 0.18 0.17 0.15
26
Households categorized as self-employed in agriculture has a positive and effect on calorie
intake in 2004 & 2011 supporting our findings in Table 5. On the contrary, households
categorized as causal laborers in agriculture have negative effect on calorie intake, while the
effect of households categorized as self-employed in non-agriculture vary between 2004 &2011.
The negative and significant effect of casual labor households may be because of the fact that
they are the most vulnerable to food price fluctuations and inflations. The difference in the sign
and significance of the calorie price variable is quite interesting; negative and significant in
2004, positive and significant in 2011, while no such effect in Models 3 and 4. This may be
because as reported in Deaton and Dreze (2009), with the general improvements in economy,
people might be switching to calorie rich items.
Overall, the signs and significance levels of coefficients on regional dummy variable support
the Figures 2a and 2b. As expected, northern region has positive and significant effect on calorie
intake in both 2004 and 2011. For the other regions, as reflected in figures 2a and 2b, there are
significant differences between 2004 and 2011: northeast and south experienced a decline in
calorie intake, while the negative and significant effect of the coefficient on central region
dummy variable disappeared in 2011. The low level of calorie intake and its further decline in
south and northeast is puzzling, given that these are religiously highly diverse regions (with
significant presence of Muslims and Christians), implying a higher level of consumption of non-
vegetarian food. However, examination of Simpsons index of diet diversity show that south has
the highest level of diet diversity, and as shown earlier diet diversity has negative effect on
calorie intake. It has to be noted here that as shown in Figures 5a to 5c, monthly income form
cultivation and livestock is relatively low in South compared to other income sources.
As mentioned earlier, we included a year dummy variable to represent the improvements in data
collection happened in 20011-12 HCES survey over the 2004-05 survey and to represent the
improvements in agricultural sector occurred between 2004 and 2011. The positive and
significant coefficient on the year dummy variable supports our hypothesis that improvements
in data collection and improvements in agriculture have a positive effect on calorie intake. The
positive and significant coefficient on the interaction term between self-employed in agriculture
and year dummy variable in Models 3 and 4 also support our hypothesis that improvements in
agricultural sector contributed to increases in calorie intake for those engaged in agriculture. It
is interesting to note that, on the contrary, the coefficient is negative and significant for

27
interaction term between casual labor in agriculture and year dummy. In general, casual laborers
in agriculture are landless people or those who have insufficient income from their owned land
or other economic activities. For casual laborers wage rates are not only low but also vary from
place to place and between seasons. Because of this low income level and high fluctuations in
income levels, as mentioned earlier, they are highly vulnerable to food price shocks and
inflation trends. The differences in coefficients between those who own land and engage in
farming (self-employed in agriculture) and casual laborers in agriculture (in general landless
people) suggest that the former benefited from overall economic growth in the economy, while
the latter was adversely affected. As shown in Model 4 in Table 6, coefficients on the
interaction terms between year dummy and region dummies support our earlier finding that on
average calorie intake improved in north, while it declined in northeast and south, a fact
reflected in Figures 2-4.
Conclusions and Policy Implications
Results from our study show supporting evidence for structural change in calorie intake in
India since 2011. However, there is spatial variation in the changes in calorie intake, with
north experiencing positive changes, while northeast and south experiencing negative changes.
Even with the improvements in PDS system, socially disadvantaged groups still have low
calorie intake relative to the general population, a matter of concern for Indian policy makers.
Among the religious groups, Christians experienced a decline in calorie intake, a matter that
needs further attention. While these findings from our study suggest the need for targeted
interventions in south and northeast regions, and those targeting certain social and religious
groups, further research is needed to understand the specific reasons for the low and declining
calorie intake in these regions and for these groups.
Findings from our study show that calorie intake of those who own land and self-employed in
farming is high relative to casual laborers engaged in agriculture. This suggests that
government efforts to support the agricultural sector will have positive effects on food security
while most of those benefits will be skewed towards farmers who own land and cultivate it.
This imply the need for having interventions targeted at casual laborers in agriculture, to
effectively address their food insecurity issues.

28
Our study shows that, improvements in data collection, especially for meals taken away from
home and improvements in agricultural sector have positive effects on the reversal of the
declining trend of calorie intake in India. Findings from our study also imply the need for
further improvements in data collection, especially given that the life styles and consumption
patterns, even in rural areas are changing drastically. As evident form our study, HCES data
does not have detailed information on income levels and sources, and hence, using HCES data
only to explain the calorie consumption puzzle is a challenge. Although, Situation Assessment
Survey of Agriculture conducted by NSSO, collects detailed information on income sources,
the time lines and sampling strategies followed are different, leading to problems in merging
household level data from the two surveys. Findings form our study also imply the need to
have an integrated survey that collects information on consumption, nutrition, agriculture, and
anthropometric data at household levels. Given that NSSO is well equipped with resources to
conduct national level surveys, adding relevant and appropriate modules to the existing
surveys should not be a major challenge.
References
Banerjee, A. and Duflo, E. (2011). More than 1 Billion People are Hungry in the World. But what if theExperts are Wrong?, Foreign Policy, May/June.
Basu, D. and Basole, A. (2012). The Calorie Consumption Puzzle in India: An Empirical Investigation,PERI Working Paper Series 285, Amherst: Political Economy Research Institute, University ofMassachusetts.
Chand, R. and Parapppurathu, S. (2012). Temporal and Spatial Variations in Agricultural Growth and itsDeterminants. Economic and Political Weekly, Vol. XLVII No. 26 & 27: 55-64.
Chand, R. 2014. From slow down to fast track: Indian Agriculture Since 1995.Working Paper, NationalCentre for Agricultural Economics and Policy Research, Indian Council of Agricultural Research(ICAR), New Delhi, India. Available athttp://www.ncap.res.in/upload_files/Slowdown_final%20for%20printing.pdf. Accessed April,2016.
Deaton, A. and Drèze, J. (2002). Poverty and Inequality in India: A Re-examination, Economic& Political Weekly, 7 September, pp 3729-48.
Deaton, A. and Drèze, J.P. (2009). Food and Nutrition in India: Facts and Interpretations, Economic andPolitical Weekly, 14 February, XLIV.7.
Drèze, J. and Sen A. (2002). India: Development and Participation (New Delhi: Oxford UniversityPress).
29
Gaiha, R., Jha, R., and Kulkarni, V. S. (2009). How Pervasive is Eating Out In India?, ASARC WorkingPaper 2009/17, Canberra: Australia South Asia Research Centre, Arndt-Corden Division ofEconomics. Australian National University.
Gopalan,C., Sastri, R.B.V., and Balasubramanian, SC. 1991. Nutritive Value of Indian Foods, Revisedand updated. National Institute for Nutrition, ICMR, India.
Himanshu, and Sen, A. (2013). In-kind food transfers – I: Impact on poverty. Economic and PoliticalWeekly, 48(45-46), 46-54.
Landy, F. (2009). India, “Cultural Density” and the Model of Food Transition, Economic and PoliticalWeekly XLIV.20: 59–61.
Palmer-Jones, R. (2005). Can We Set Poverty Lines Using Calorie Norms in India or Bangladesh?, draftmanuscript, University of East Anglia.
Patnaik, U. (2010). A Critical Look at Some Propositions on Consumption and Poverty, Economic andPolitical Weekly, 6 Feb, XLV.47.
Rao, C. H.H. (2000). Declining Demand for Food grains in Rural India: Causes and Implications,Economic and Political Weekly 35.4: 201–6.
Smith, L.C. 2013. The Great Indian Calorie Debate: Explaining Rising Undernourishment
during India’s Rapid Economic Growth. IDS Working Paper 430. Institute of Development
Studies. Available at http://www.ids.ac.uk/publication/the-great-indian-calorie-debate-
explaining-rising-undernourishment-during-india-s-rapid-economic-growth. Accessed
3/10/2016.