consuming health: drivers of attitudes towards healthy...
TRANSCRIPT
Consuming health: Drivers of attitudes
towards healthy eating and packaged foods International Life Sciences Institute (ILSI) Southeast Asia Region & ILSI Malaysia 8th Scientific Seminar
Food Innovation/Renovation for Healthier Food Choices – Collaborative efforts for effective implementation
A/P May O. Lwin
Wee Kim Wee School of Communication and Information
Agenda
(incorporating Research Trajectory)
• Background: Key Study Areas Regarding
Consumption of Food
• Environment
– Retail Landscape
– Advertising & Consumption
• Home & Culture
• Consumer Psychology
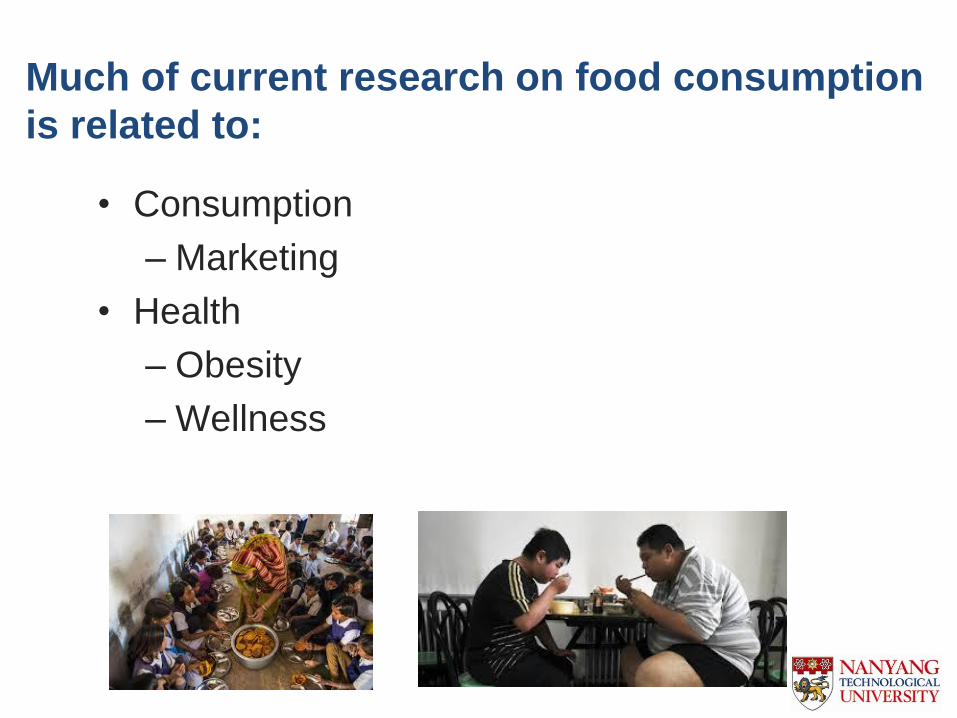
Much of current research on food consumption
is related to:
• Consumption
– Marketing
• Health
– Obesity
– Wellness
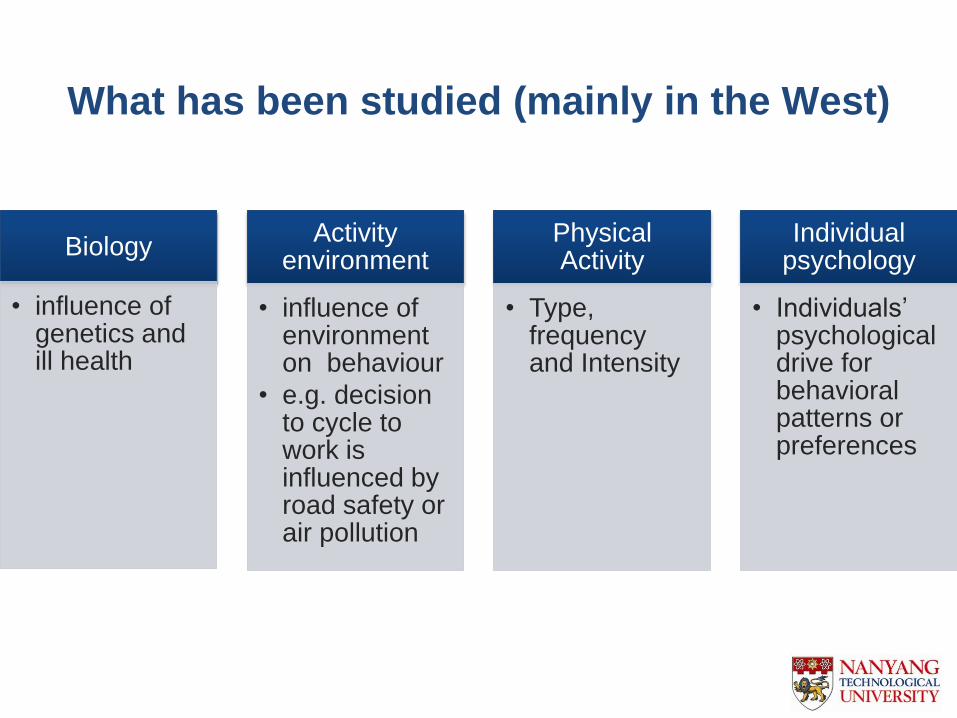
What has been studied (mainly in the West)
Biology
• influence of genetics and ill health
Activity environment
• influence of environment on behaviour
• e.g. decision to cycle to work is influenced by road safety or air pollution
Physical Activity
• Type, frequency and Intensity
Individual psychology
• Individuals’ psychological drive for behavioral patterns or preferences
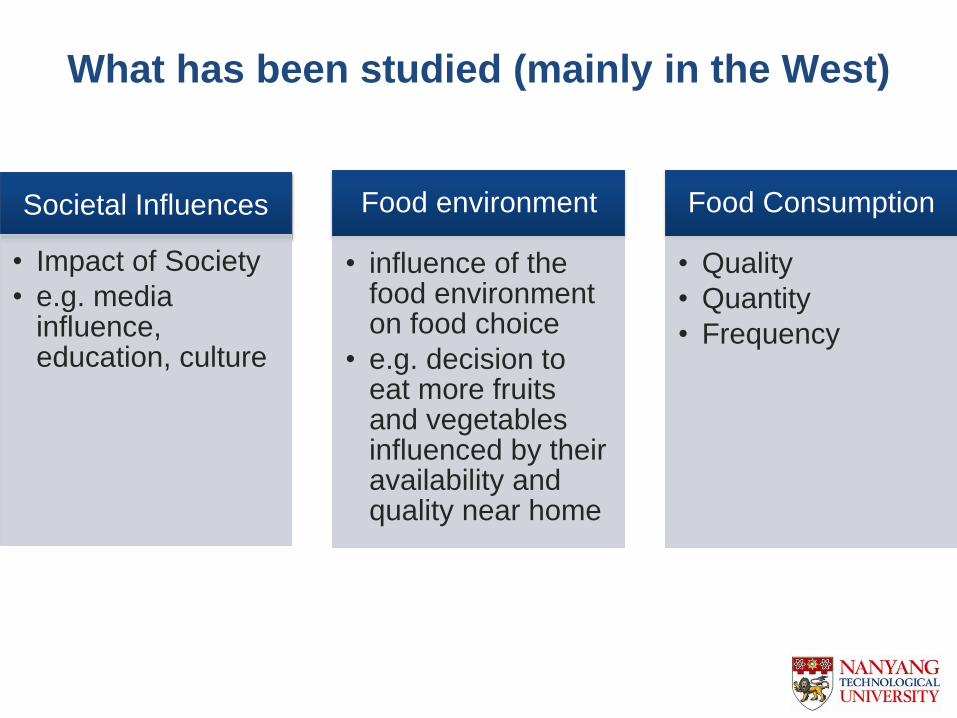
What has been studied (mainly in the West)
Societal Influences
• Impact of Society
• e.g. media influence, education, culture
Food environment
• influence of the food environment on food choice
• e.g. decision to eat more fruits and vegetables influenced by their availability and quality near home
Food Consumption
• Quality
• Quantity
• Frequency
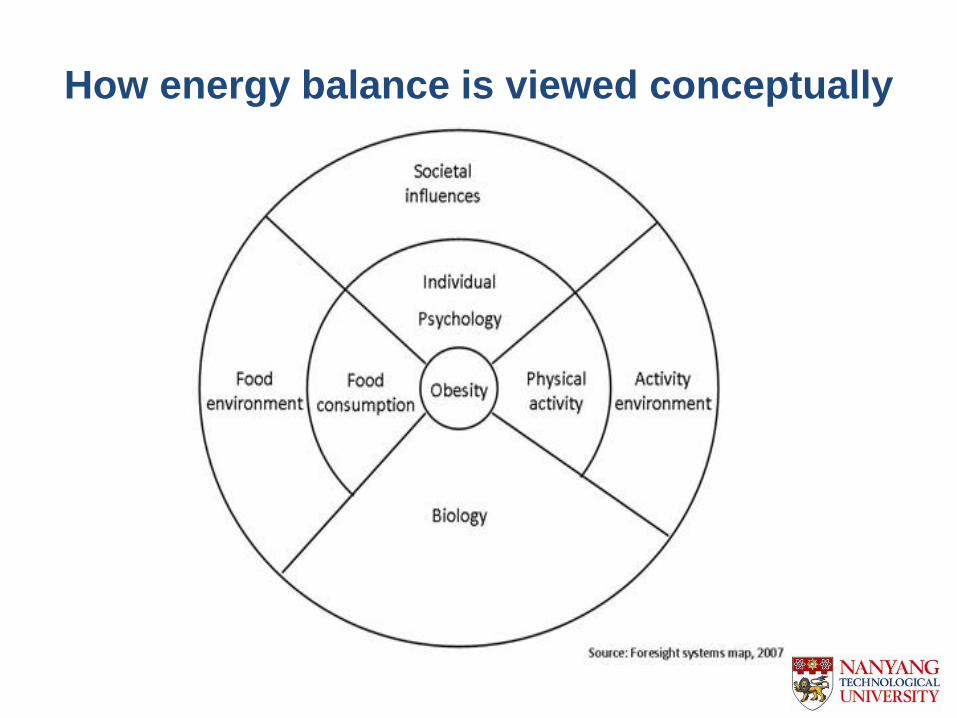
How energy balance is viewed conceptually
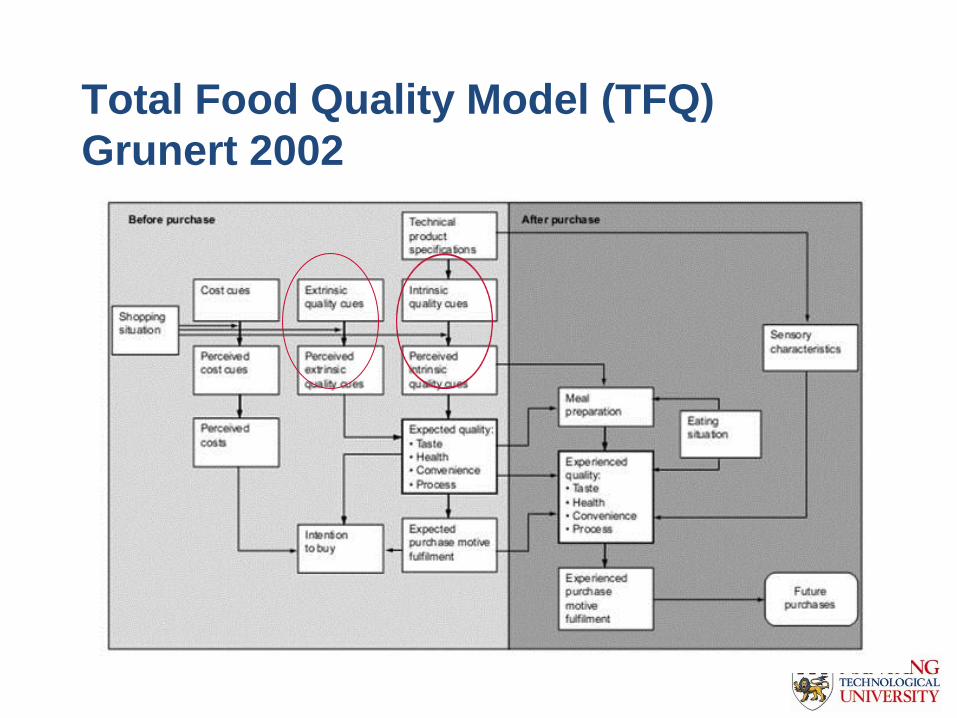
Total Food Quality Model (TFQ)
Grunert 2002

Major Drivers of Consumption
Environment
Choice concept formation e.g.
Theory of Planned Behavior
Preferences & Behavior
Awareness
External
Home & Culture
Normative Attitudes
Consumer Psychology
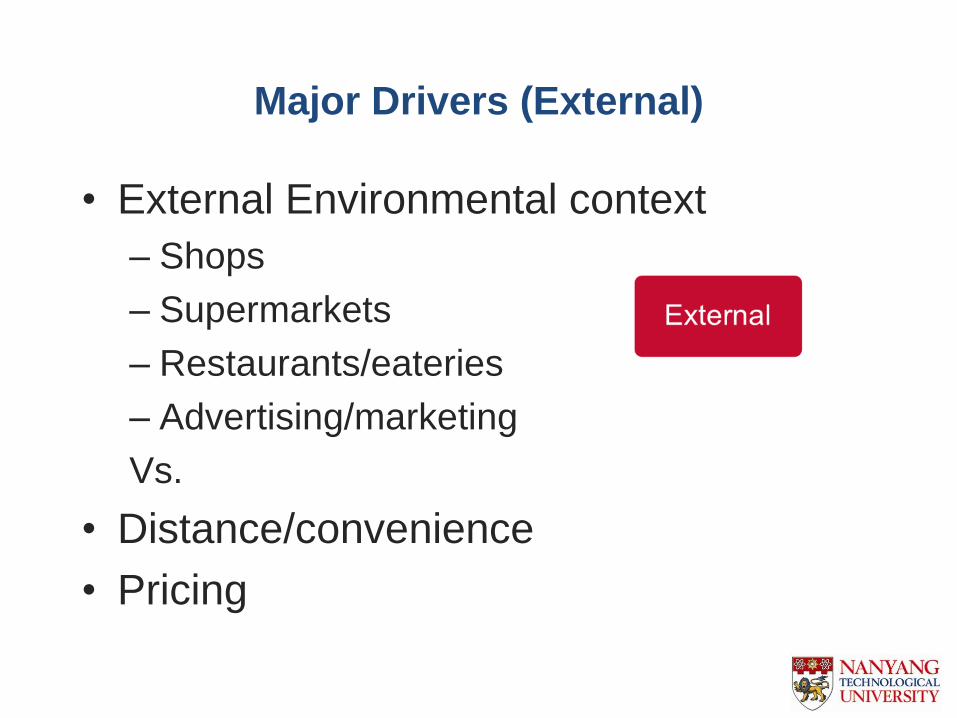
Major Drivers (External)
• External Environmental context
– Shops
– Supermarkets
– Restaurants/eateries
– Advertising/marketing
Vs.
• Distance/convenience
• Pricing
Searching for Healthy Food: analysis of distribution
of food outlets in cities and counties in California by the California Center for Public Health (CCPHA)
• Growing scientific evidence that what people eat—
and their likelihood of being obese—is influenced
by the food environment in which they live.
• Ready access to healthy foods is critical in battling
the obesity crisis
• CCPHA’s analysis shows a landscape crowded
with food outlets that offer little fruits, vegetables,
and other healthy products.
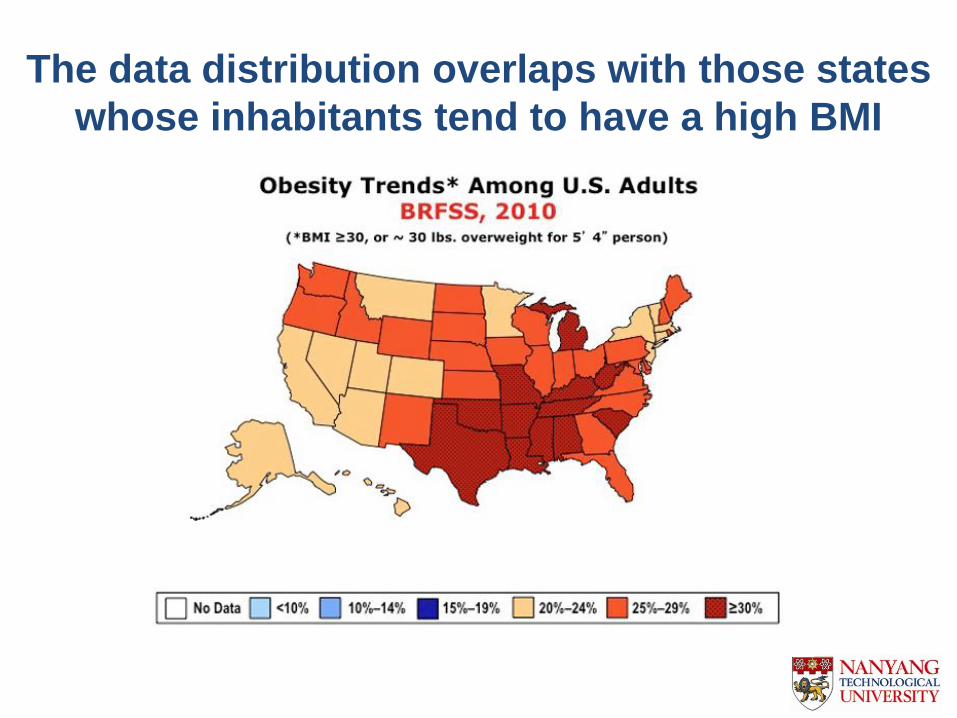
The data distribution overlaps with those states
whose inhabitants tend to have a high BMI
Does Advertising Influence
Food Purchase & Consumption?
• ―Yes‖ for sales of unhealthy snacks (e.g. Huang &
Yang 2013)
• ―The association between TV and increased BMI
may be explained by exposure to TV ads for high
calorie, nutritionally questionable foods, and eating
while watching TV, which distracts from natural
signals the body gives for when it is hungry or
satisfied‖ (David Bickham et al. 2014)
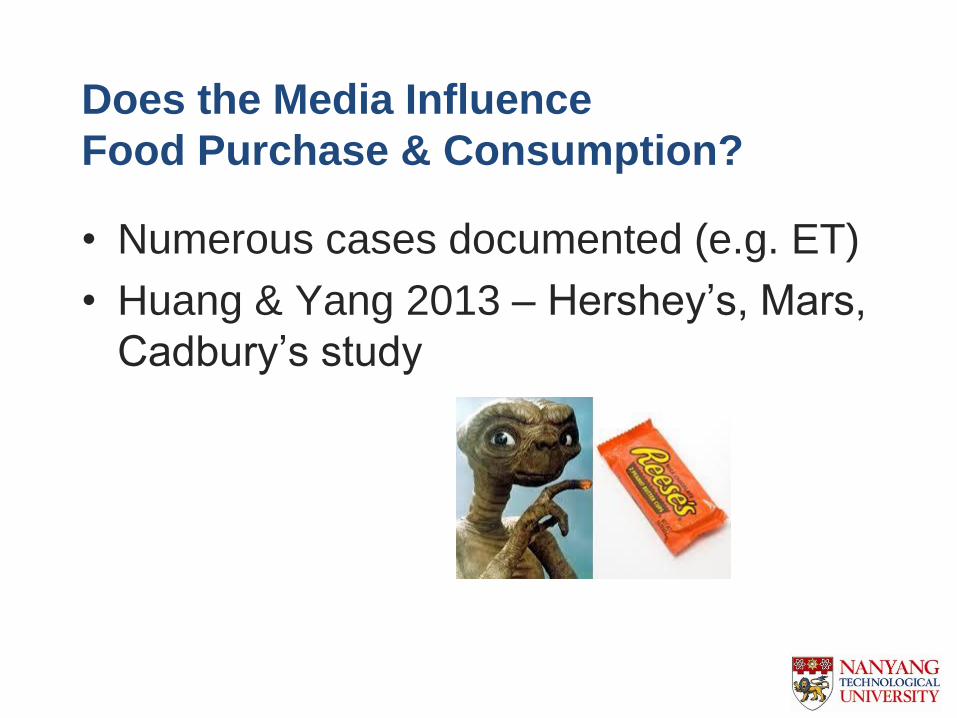
Does the Media Influence
Food Purchase & Consumption?
• Numerous cases documented (e.g. ET)
• Huang & Yang 2013 – Hershey’s, Mars,
Cadbury’s study
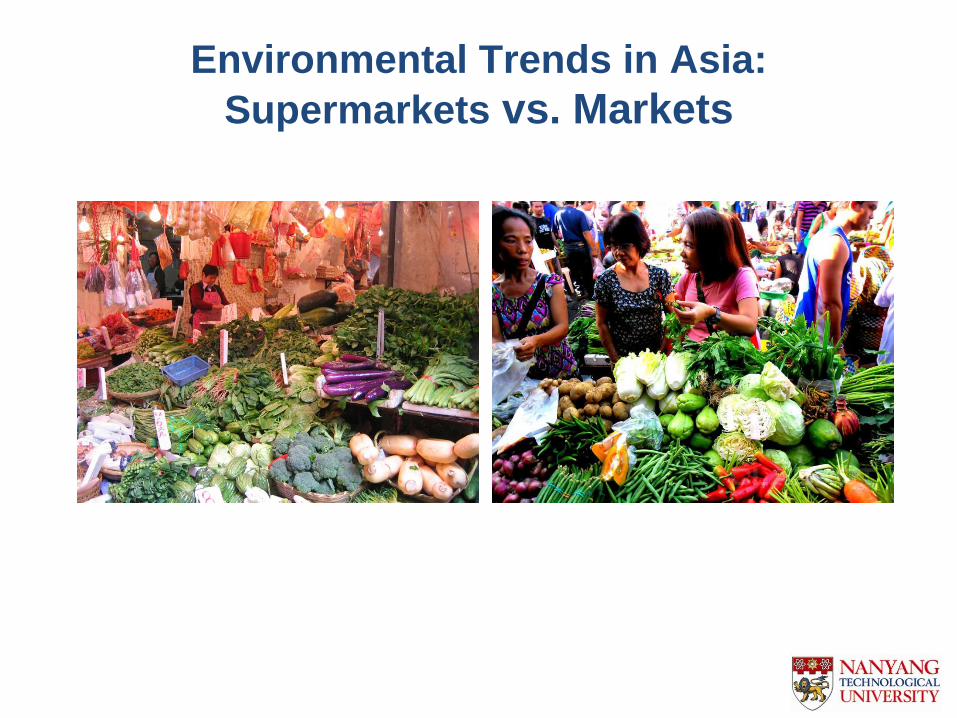
Environmental Trends in Asia:
Supermarkets vs. Markets
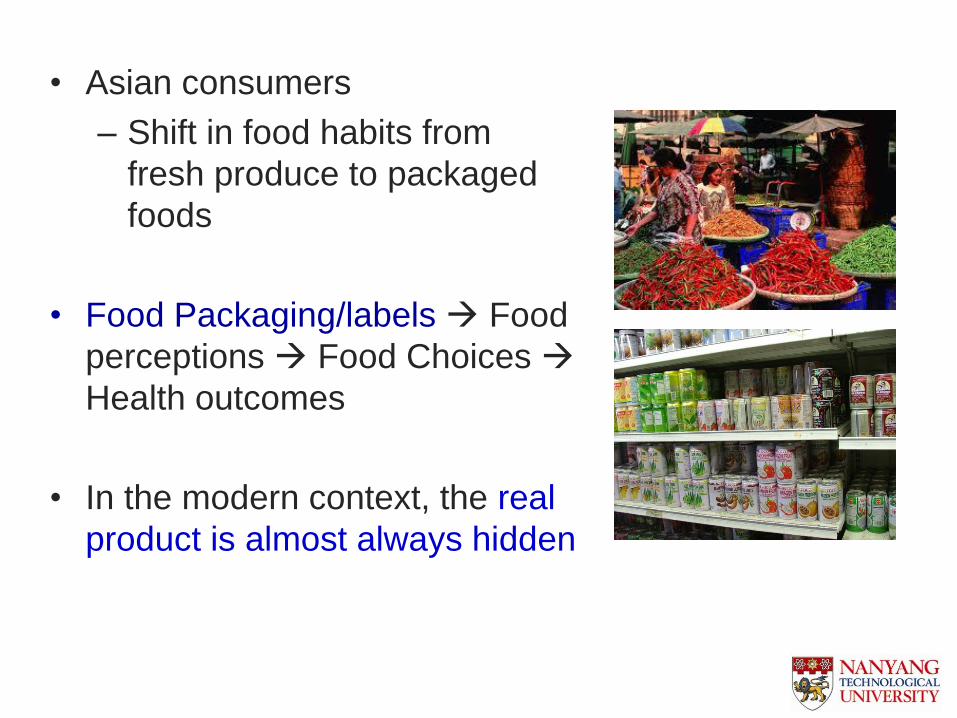
• Asian consumers
– Shift in food habits from
fresh produce to packaged
foods
• Food Packaging/labels Food
perceptions Food Choices
Health outcomes
• In the modern context, the real
product is almost always hidden
• Extrinsic Cues
– Used by consumers to form perceptions about
products (Richardson, Dick & Jain, 1994;
Miyazaki, Grewal & Goodstein, 2005)
– All elements on a product packaging plays a part
in influencing perception (Rao & Monroe, 1988;
Richardson et al., 1994)
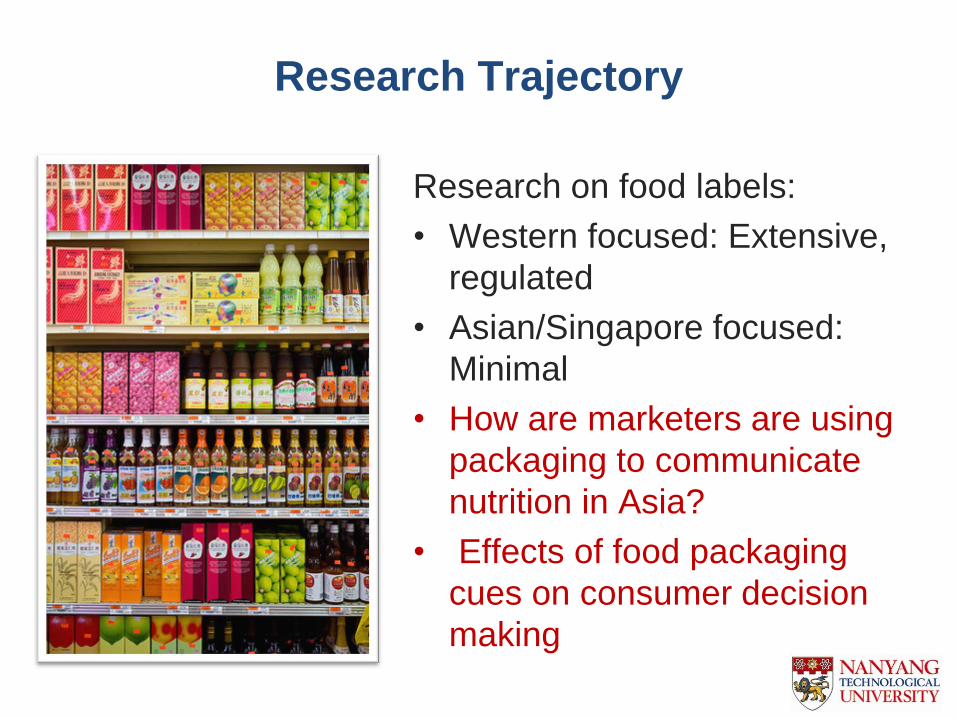
Research Trajectory
Research on food labels:
• Western focused: Extensive,
regulated
• Asian/Singapore focused:
Minimal
• How are marketers are using
packaging to communicate
nutrition in Asia?
• Effects of food packaging
cues on consumer decision
making
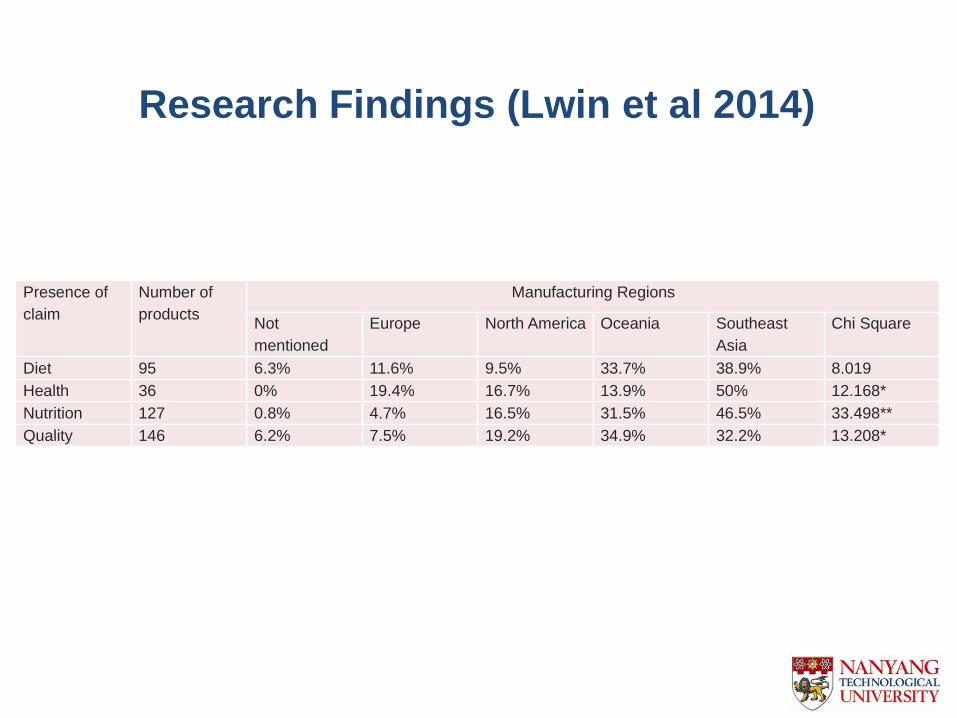
Research Findings (Lwin et al 2014)
Presence of
claim
Number of
products
Manufacturing Regions
Not
mentioned
Europe North America Oceania Southeast
Asia
Chi Square
Diet 95 6.3% 11.6% 9.5% 33.7% 38.9% 8.019
Health 36 0% 19.4% 16.7% 13.9% 50% 12.168*
Nutrition 127 0.8% 4.7% 16.5% 31.5% 46.5% 33.498**
Quality 146 6.2% 7.5% 19.2% 34.9% 32.2% 13.208*
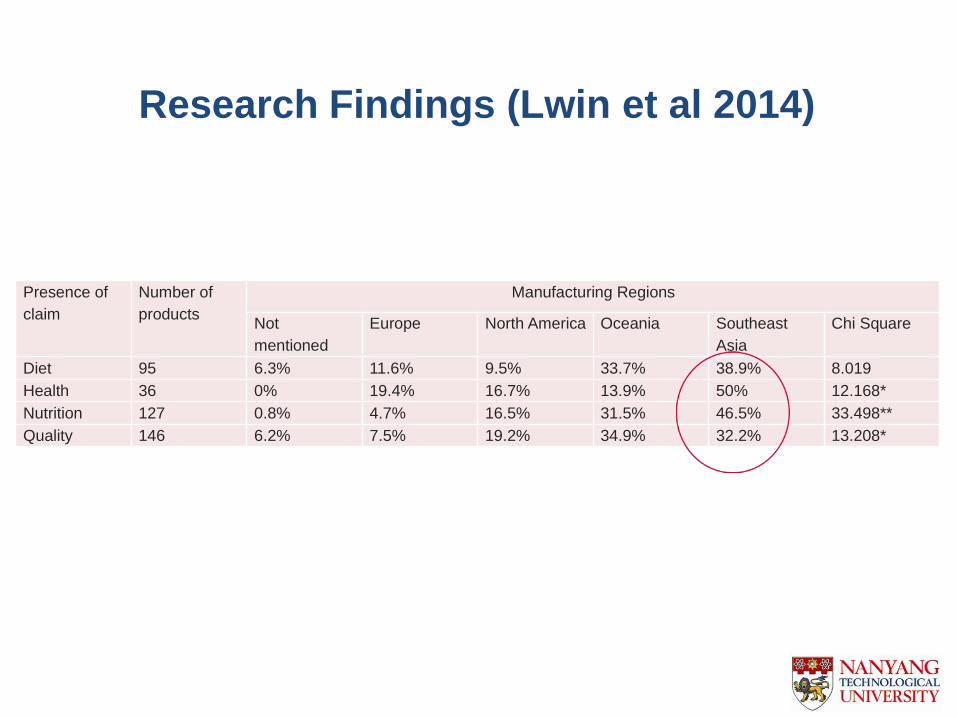
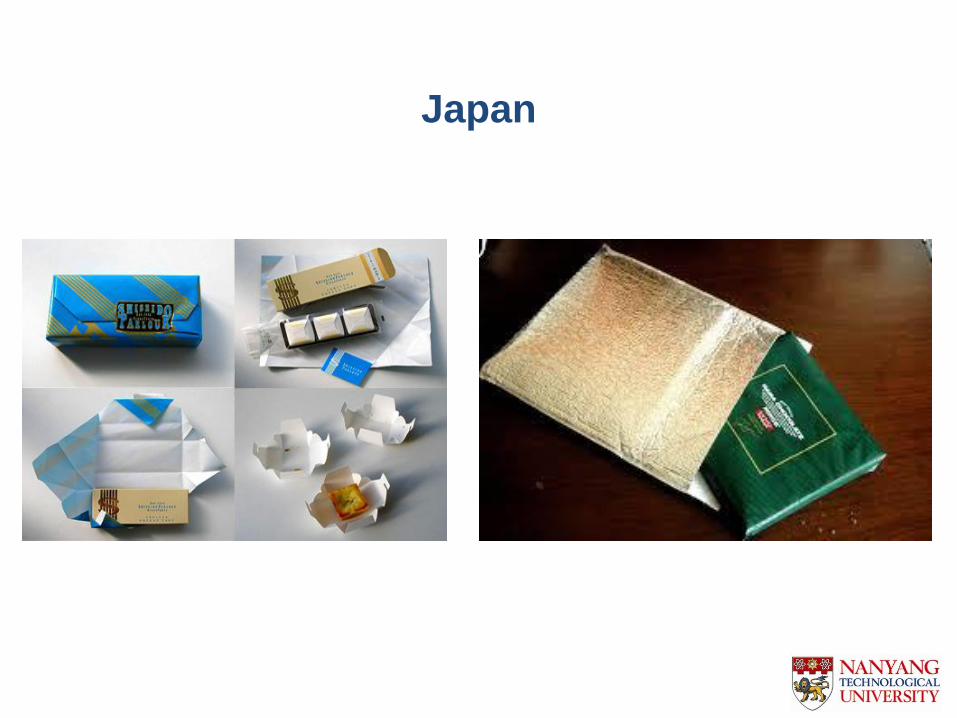
Japan
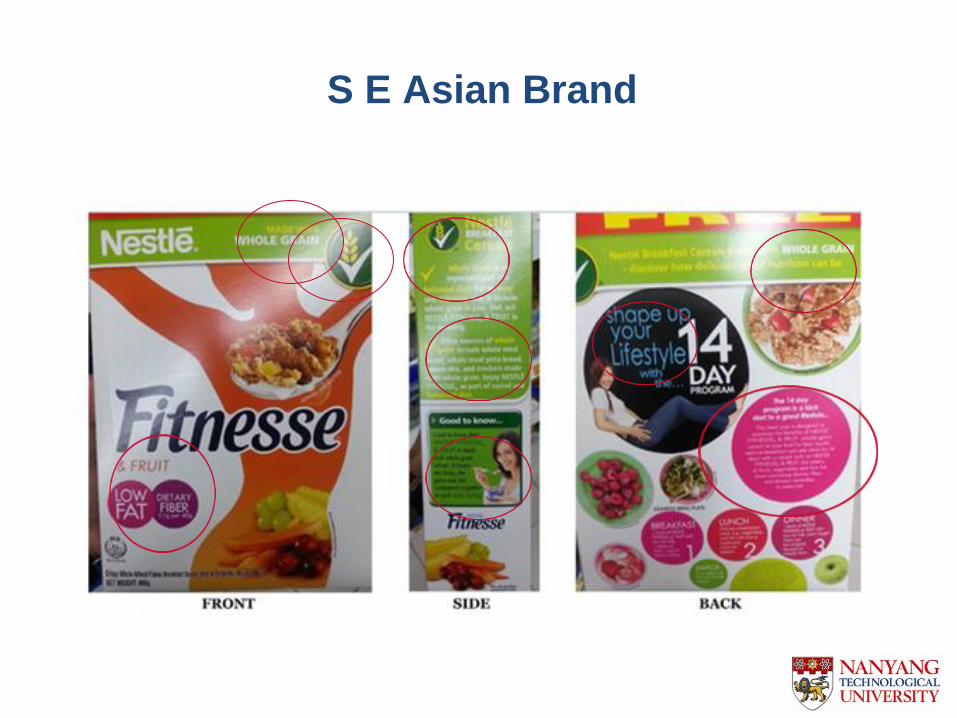
S E Asian Brand
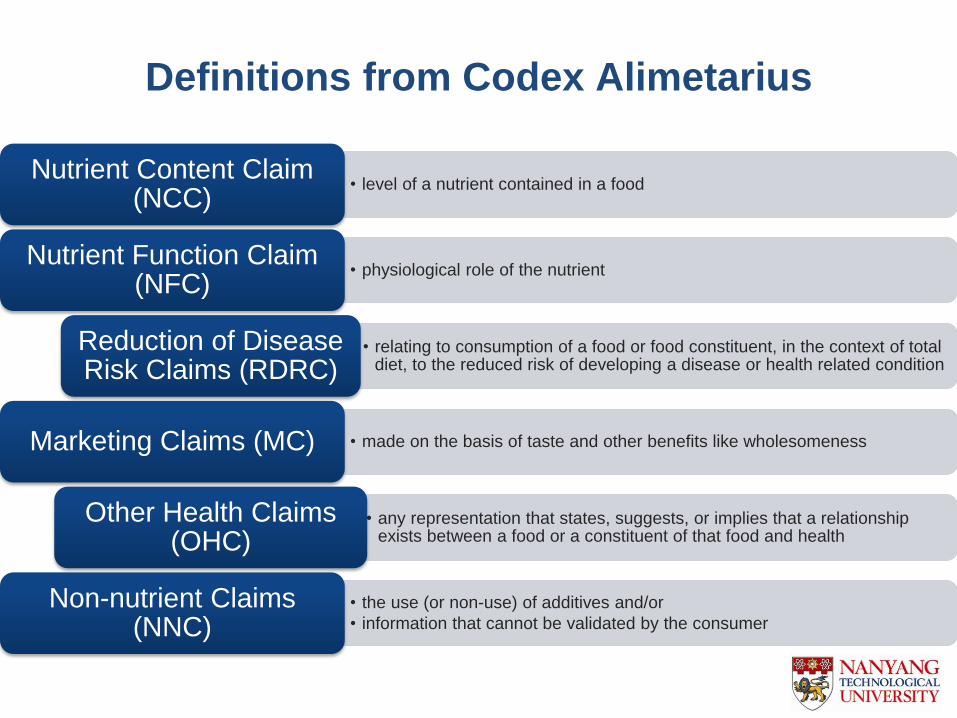
Definitions from Codex Alimetarius
• level of a nutrient contained in a food Nutrient Content Claim
(NCC)
• physiological role of the nutrient Nutrient Function Claim
(NFC)
• relating to consumption of a food or food constituent, in the context of total diet, to the reduced risk of developing a disease or health related condition
Reduction of Disease Risk Claims (RDRC)
• made on the basis of taste and other benefits like wholesomeness Marketing Claims (MC)
• any representation that states, suggests, or implies that a relationship exists between a food or a constituent of that food and health
Other Health Claims (OHC)
• the use (or non-use) of additives and/or
• information that cannot be validated by the consumer
Non-nutrient Claims (NNC)
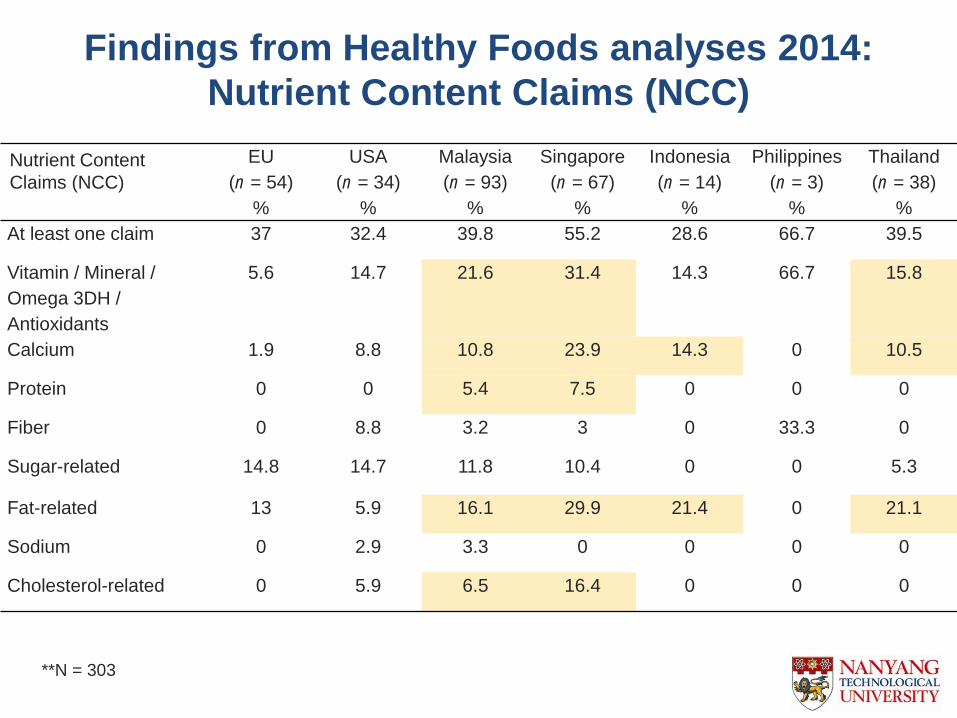
Findings from Healthy Foods analyses 2014:
Nutrient Content Claims (NCC)
Nutrient Content
Claims (NCC)
EU
(n = 54)
%
USA
(n = 34)
%
Malaysia
(n = 93)
%
Singapore
(n = 67)
%
Indonesia
(n = 14)
%
Philippines
(n = 3)
%
Thailand
(n = 38)
%
At least one claim 37 32.4 39.8 55.2 28.6 66.7 39.5
Vitamin / Mineral /
Omega 3DH /
Antioxidants
5.6 14.7 21.6 31.4 14.3 66.7 15.8
Calcium 1.9 8.8 10.8 23.9 14.3 0 10.5
Protein 0 0 5.4 7.5 0 0 0
Fiber 0 8.8 3.2 3 0 33.3 0
Sugar-related 14.8 14.7 11.8 10.4 0 0 5.3
Fat-related 13 5.9 16.1 29.9 21.4 0 21.1
Sodium 0 2.9 3.3 0 0 0 0
Cholesterol-related 0 5.9 6.5 16.4 0 0 0
**N = 303
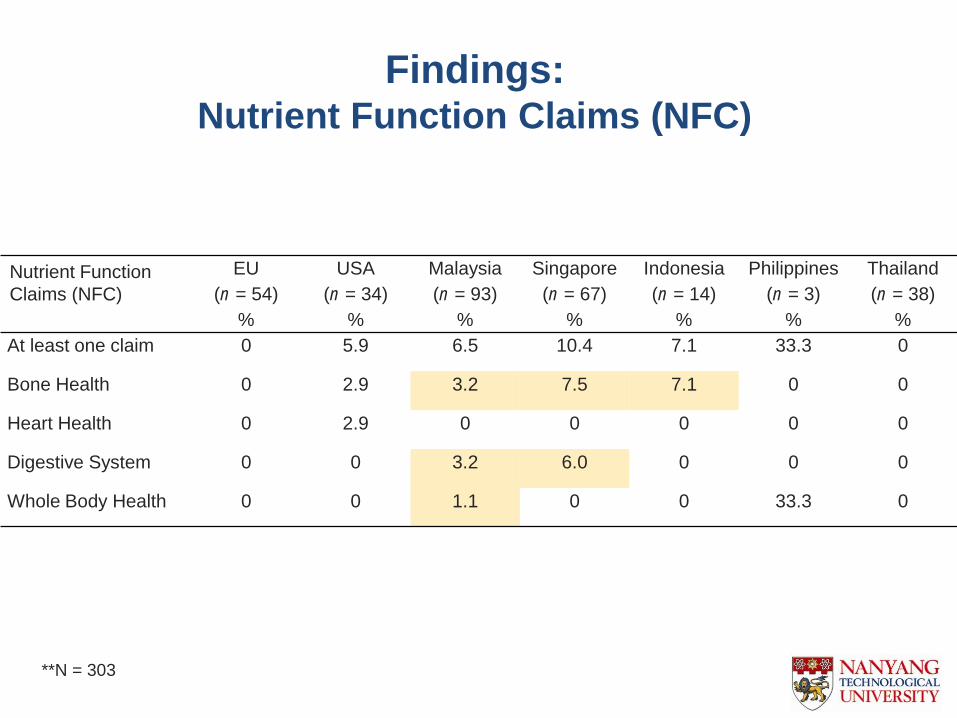
Nutrient Function
Claims (NFC)
EU
(n = 54)
%
USA
(n = 34)
%
Malaysia
(n = 93)
%
Singapore
(n = 67)
%
Indonesia
(n = 14)
%
Philippines
(n = 3)
%
Thailand
(n = 38)
%
At least one claim 0 5.9 6.5 10.4 7.1 33.3 0
Bone Health 0 2.9 3.2 7.5 7.1 0 0
Heart Health 0 2.9 0 0 0 0 0
Digestive System 0 0 3.2 6.0 0 0 0
Whole Body Health 0 0 1.1 0 0 33.3 0
Findings: Nutrient Function Claims (NFC)
**N = 303
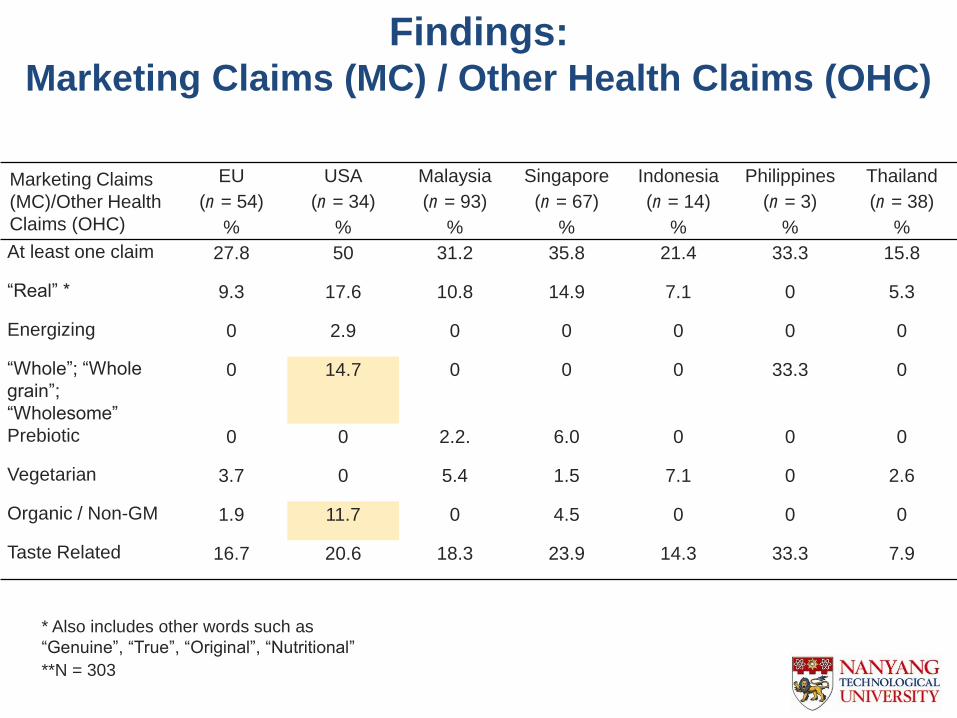
Marketing Claims
(MC)/Other Health
Claims (OHC)
EU
(n = 54)
%
USA
(n = 34)
%
Malaysia
(n = 93)
%
Singapore
(n = 67)
%
Indonesia
(n = 14)
%
Philippines
(n = 3)
%
Thailand
(n = 38)
%
At least one claim 27.8 50 31.2 35.8 21.4 33.3 15.8
“Real” * 9.3 17.6 10.8 14.9 7.1 0 5.3
Energizing 0 2.9 0 0 0 0 0
“Whole”; “Whole
grain”;
“Wholesome”
0 14.7 0 0 0 33.3 0
Prebiotic 0 0 2.2. 6.0 0 0 0
Vegetarian 3.7 0 5.4 1.5 7.1 0 2.6
Organic / Non-GM 1.9 11.7 0 4.5 0 0 0
Taste Related 16.7 20.6 18.3 23.9 14.3 33.3 7.9
Findings: Marketing Claims (MC) / Other Health Claims (OHC)
* Also includes other words such as
―Genuine‖, ―True‖, ―Original‖, ―Nutritional‖
**N = 303
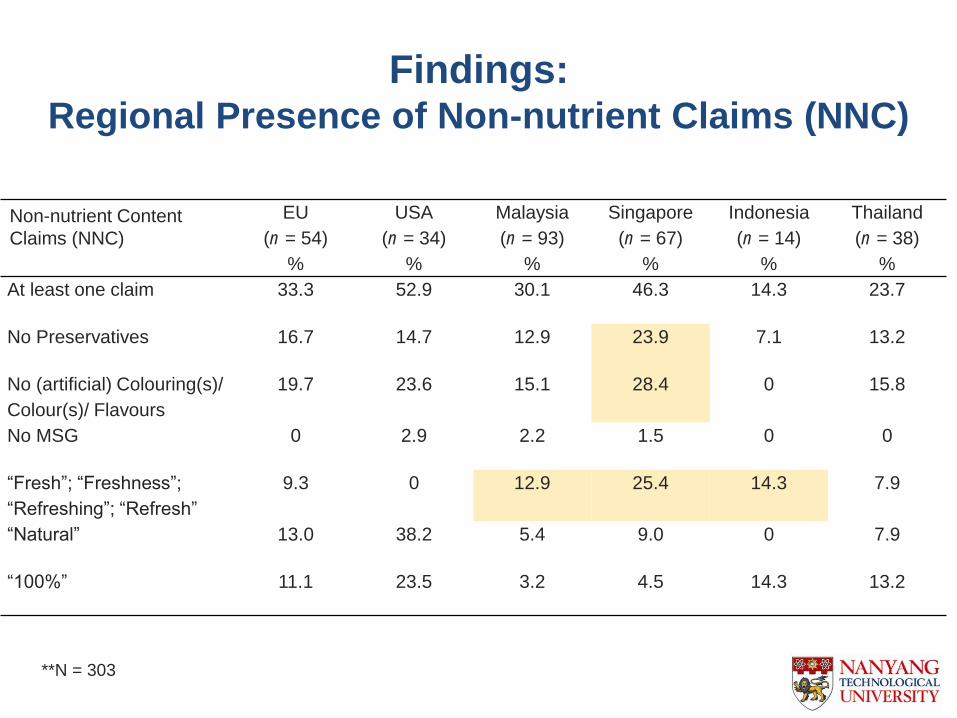
Non-nutrient Content
Claims (NNC)
EU
(n = 54)
%
USA
(n = 34)
%
Malaysia
(n = 93)
%
Singapore
(n = 67)
%
Indonesia
(n = 14)
%
Thailand
(n = 38)
%
At least one claim 33.3 52.9 30.1 46.3 14.3 23.7
No Preservatives 16.7 14.7 12.9 23.9 7.1 13.2
No (artificial) Colouring(s)/
Colour(s)/ Flavours
19.7 23.6 15.1 28.4 0 15.8
No MSG 0 2.9 2.2 1.5 0 0
“Fresh”; “Freshness”;
“Refreshing”; “Refresh”
9.3 0 12.9 25.4 14.3 7.9
“Natural” 13.0 38.2 5.4 9.0 0 7.9
“100%” 11.1 23.5 3.2 4.5 14.3 13.2
Findings: Regional Presence of Non-nutrient Claims (NNC)
**N = 303
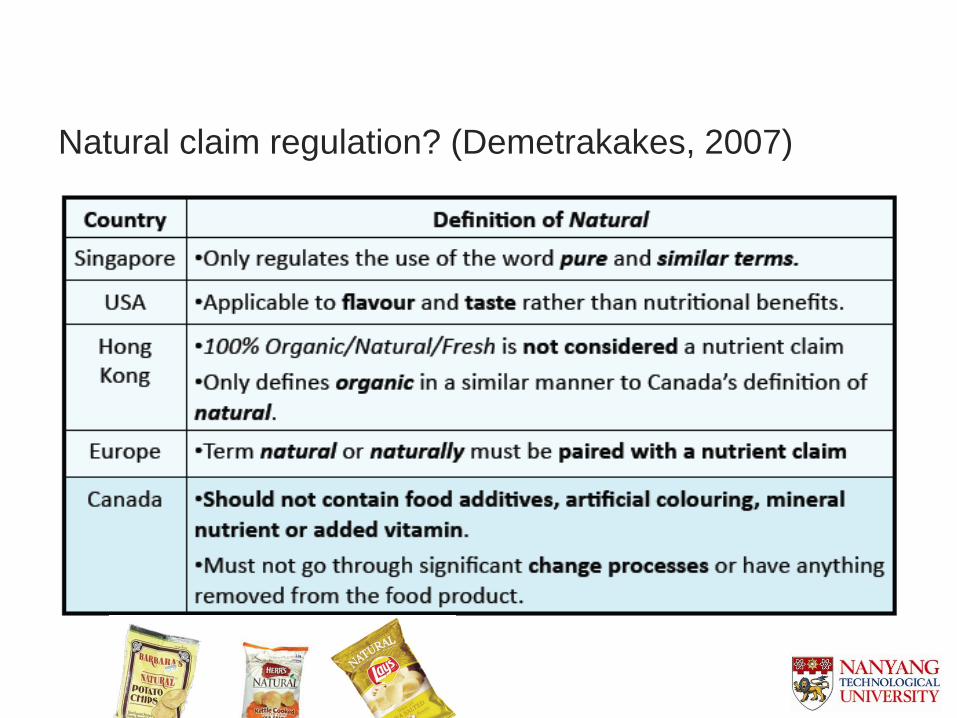
Natural claim regulation? (Demetrakakes, 2007)
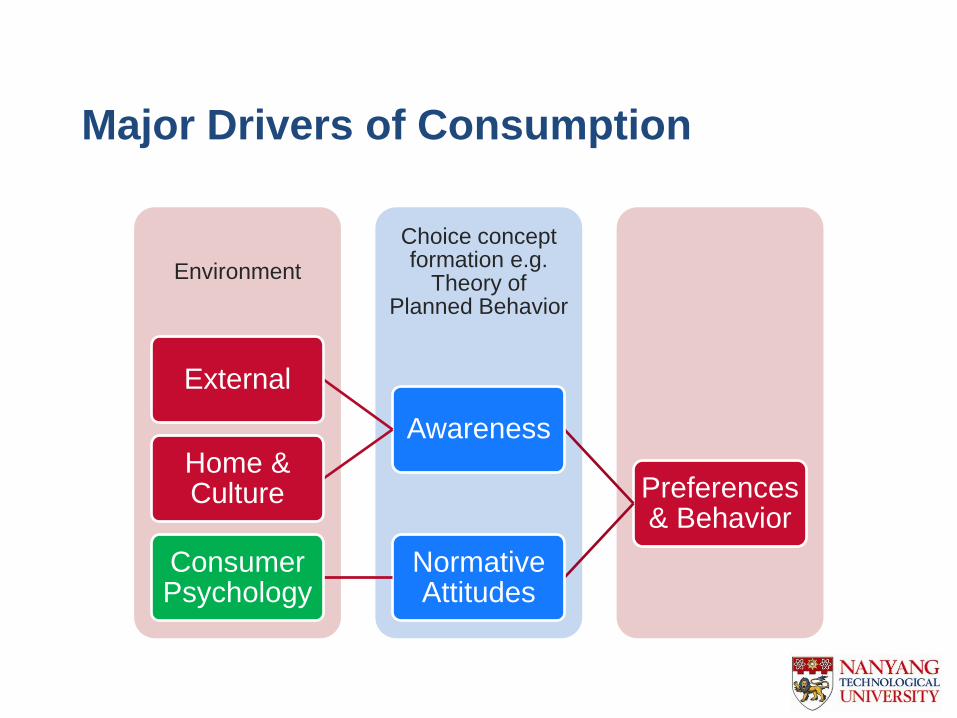
Major Drivers of Consumption
Environment
Choice concept formation e.g.
Theory of Planned Behavior
Preferences & Behavior
Awareness
External
Home & Culture
Normative Attitudes
Consumer Psychology
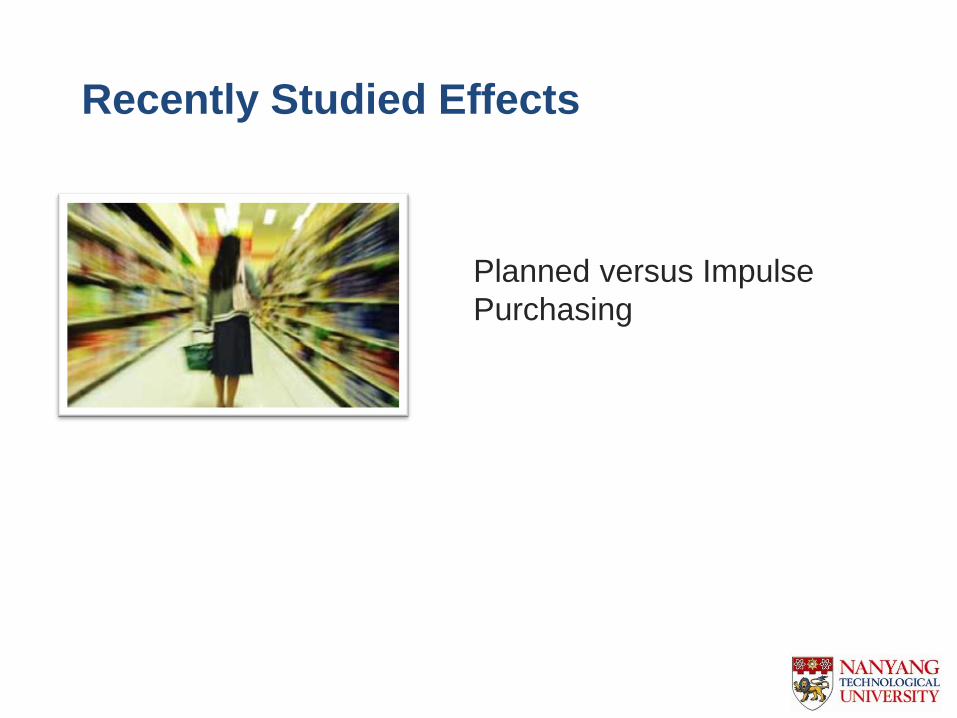
Recently Studied Effects
Planned versus Impulse
Purchasing
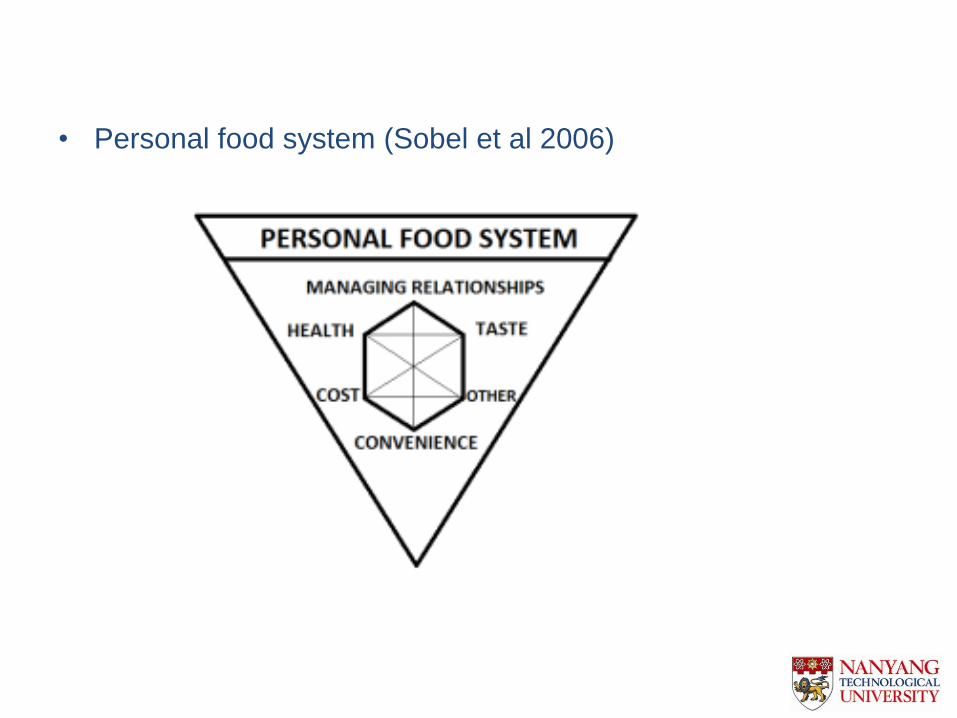
• Personal food system (Sobel et al 2006)
• Consumer Perception of Claims
• Generalization Effects
– Consumers tend to over-generalize claims (Ippolito &
Mathios, 1991; Garretson & Burton, 2000; Kozup et al, 2003)
– For example, over-generalizing a product with a ―no
cholesterol‖ as considerably ―healthier‖ (Andrews,
Netemeyer & Burton,1998)
Recently Studied Effects
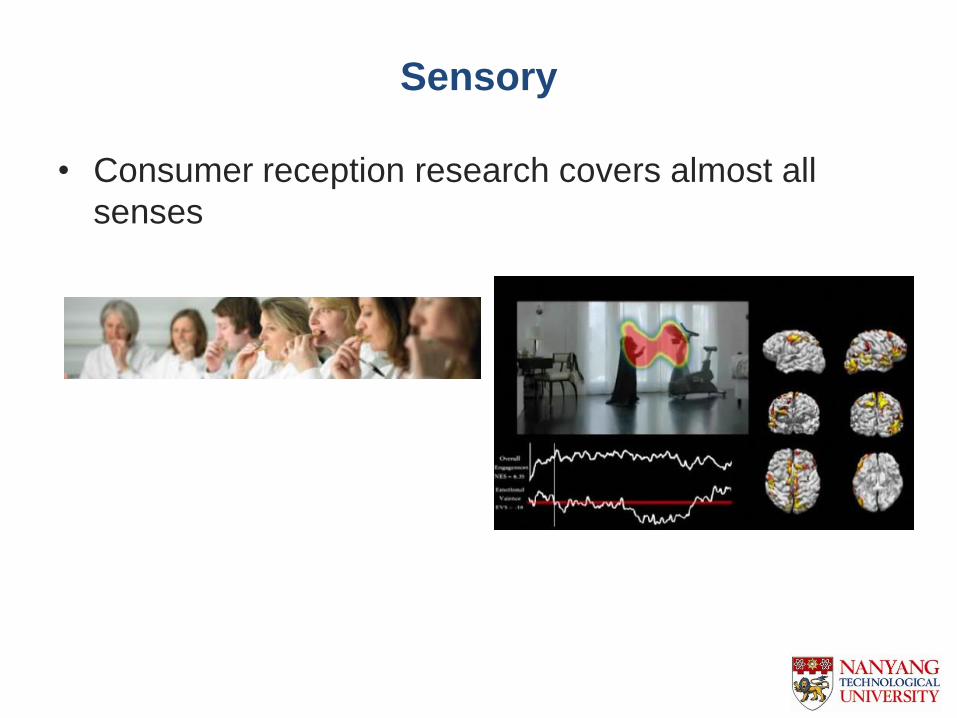
Sensory
• Consumer reception research covers almost all
senses
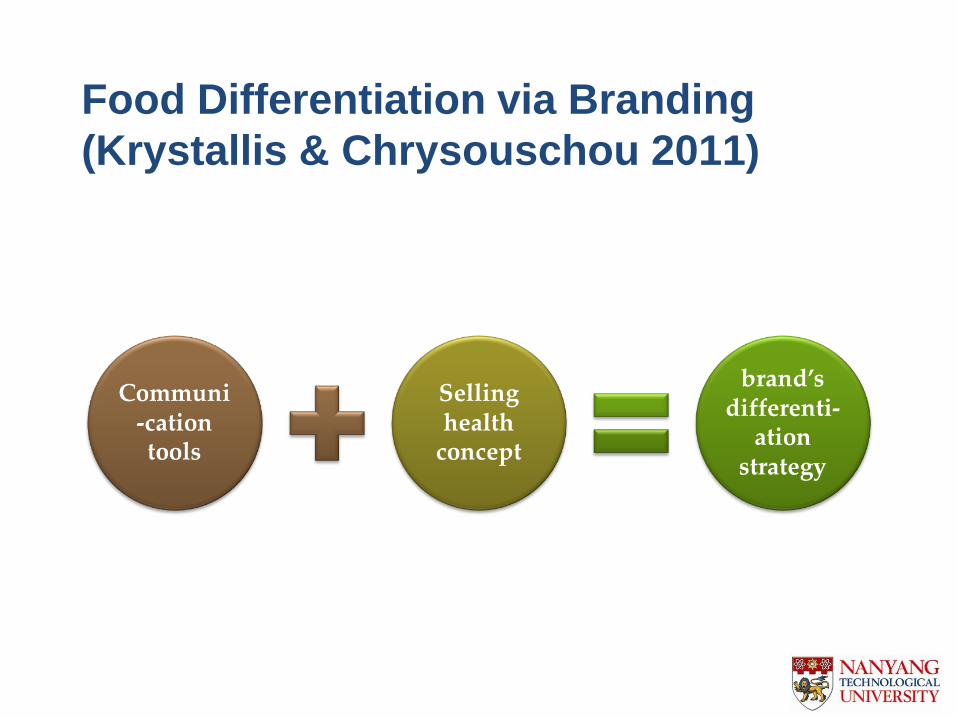
Food Differentiation via Branding
(Krystallis & Chrysouschou 2011)
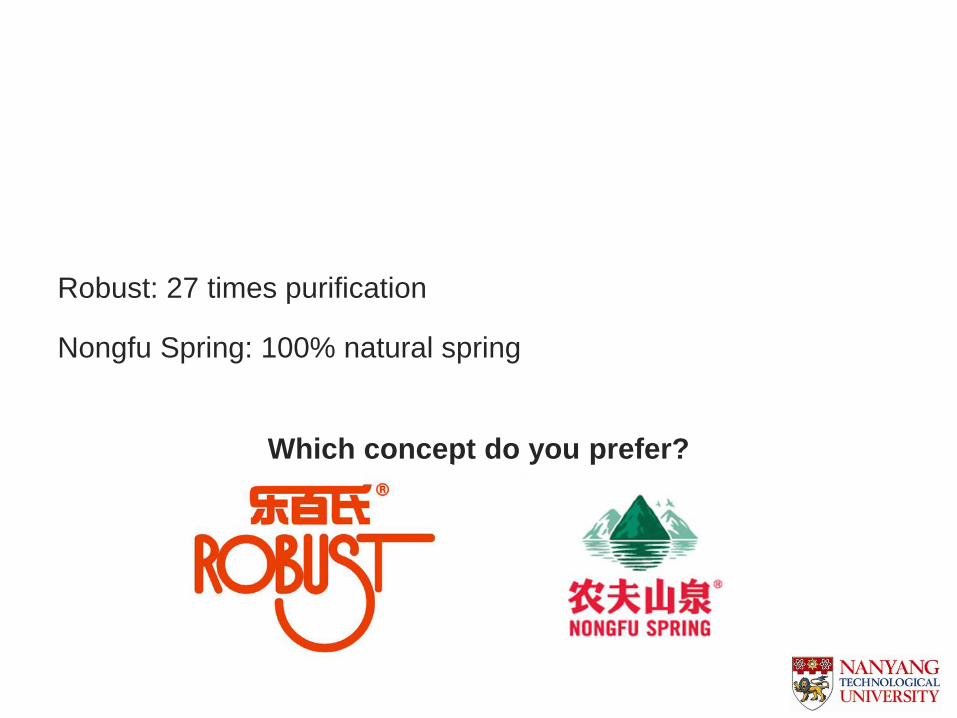
Robust: 27 times purification
Nongfu Spring: 100% natural spring
Which concept do you prefer?
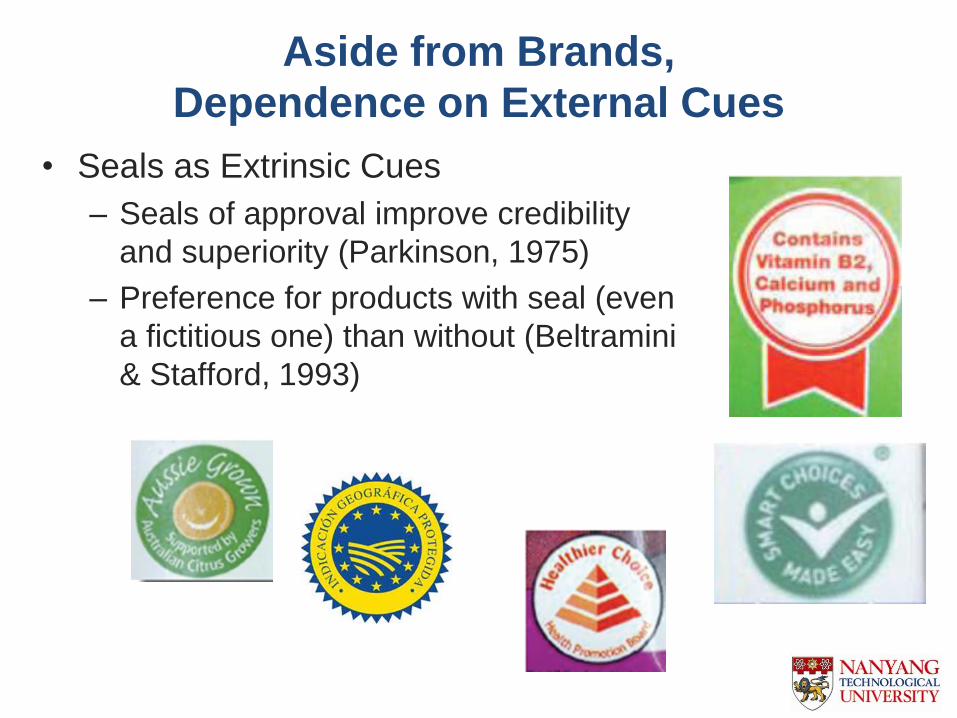
• Seals as Extrinsic Cues
– Seals of approval improve credibility
and superiority (Parkinson, 1975)
– Preference for products with seal (even
a fictitious one) than without (Beltramini
& Stafford, 1993)
Aside from Brands,
Dependence on External Cues
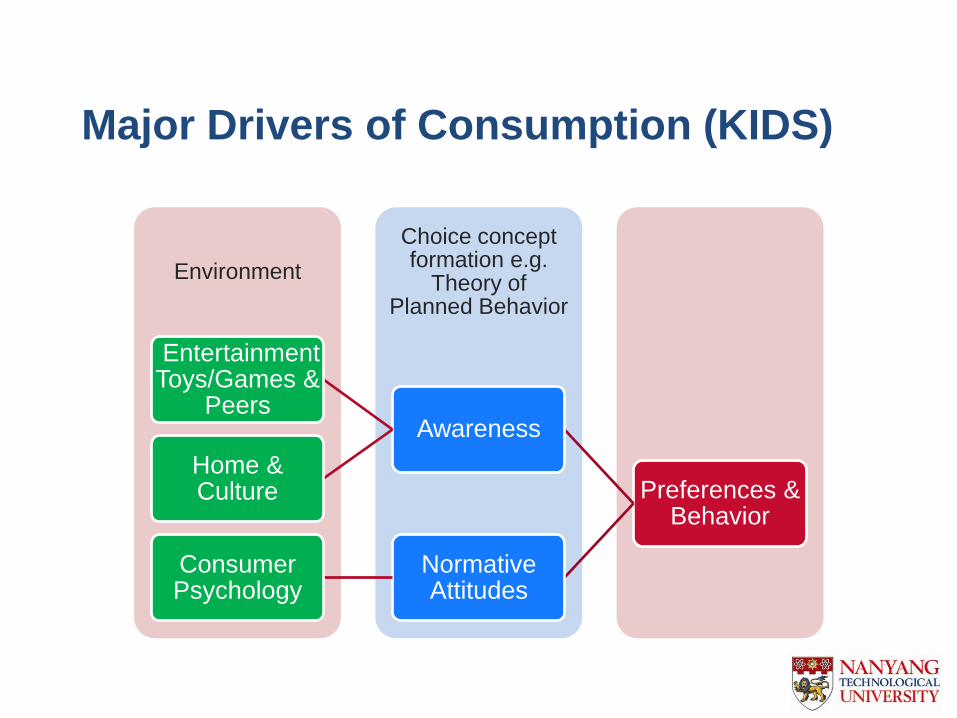
Major Drivers of Consumption (KIDS)
Environment
Choice concept formation e.g.
Theory of Planned Behavior
Preferences & Behavior
Awareness
Entertainment Toys/Games &
Peers
Home & Culture
Normative Attitudes
Consumer Psychology

Taste Test!
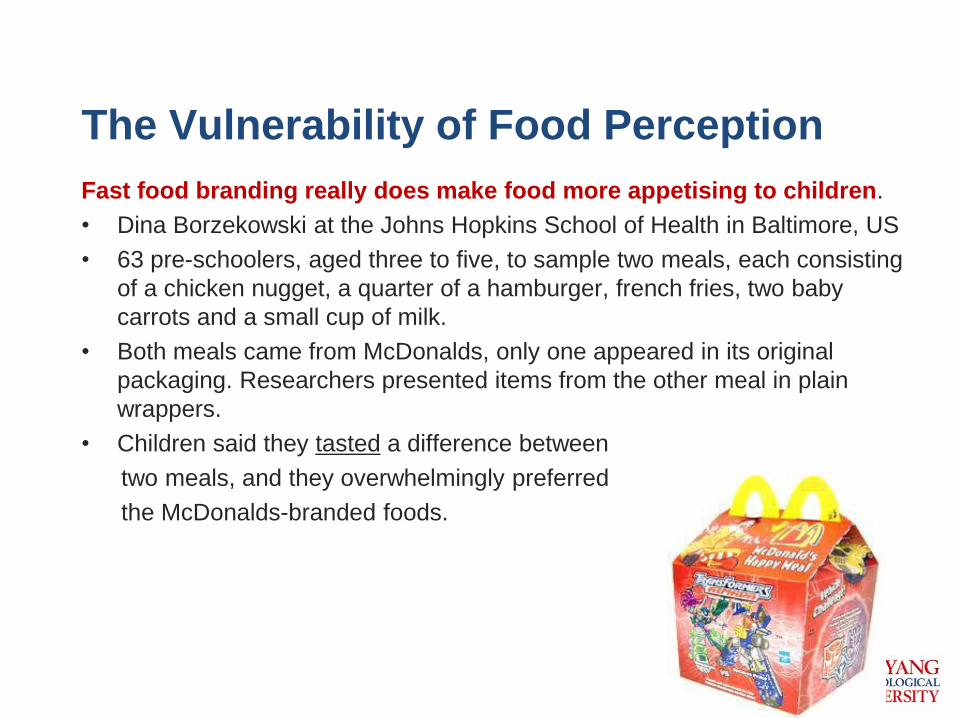
The Vulnerability of Food Perception
Fast food branding really does make food more appetising to children.
• Dina Borzekowski at the Johns Hopkins School of Health in Baltimore, US
• 63 pre-schoolers, aged three to five, to sample two meals, each consisting
of a chicken nugget, a quarter of a hamburger, french fries, two baby
carrots and a small cup of milk.
• Both meals came from McDonalds, only one appeared in its original
packaging. Researchers presented items from the other meal in plain
wrappers.
• Children said they tasted a difference between
two meals, and they overwhelmingly preferred
the McDonalds-branded foods.
Food Differentiation via Branding
(Williams 2000 - 2014)
Overall Marketing Statistics (2004 Report):
• $11.26 billion spent on all advertising food, beverages and meals in 2004 (measured media).
• $5 to $6.6 billion spent on all television advertising in 2004.
.
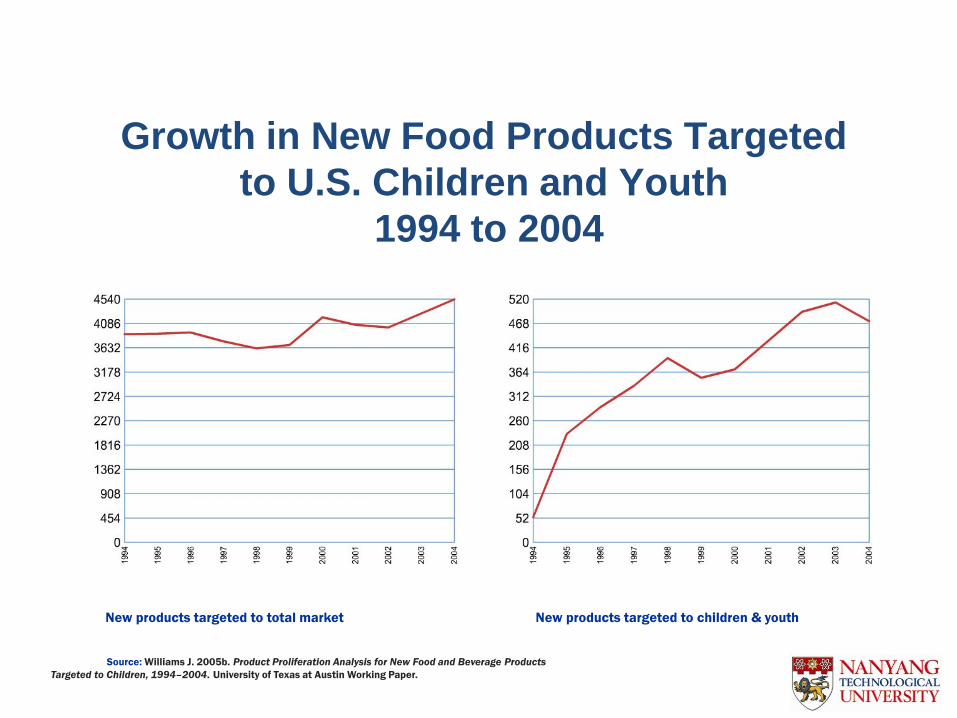
Growth in New Food Products Targeted
to U.S. Children and Youth
1994 to 2004
New products targeted to total market New products targeted to children & youth
Source: Williams J. 2005b. Product Proliferation Analysis for New Food and Beverage Products
Targeted to Children, 1994–2004. University of Texas at Austin Working Paper.
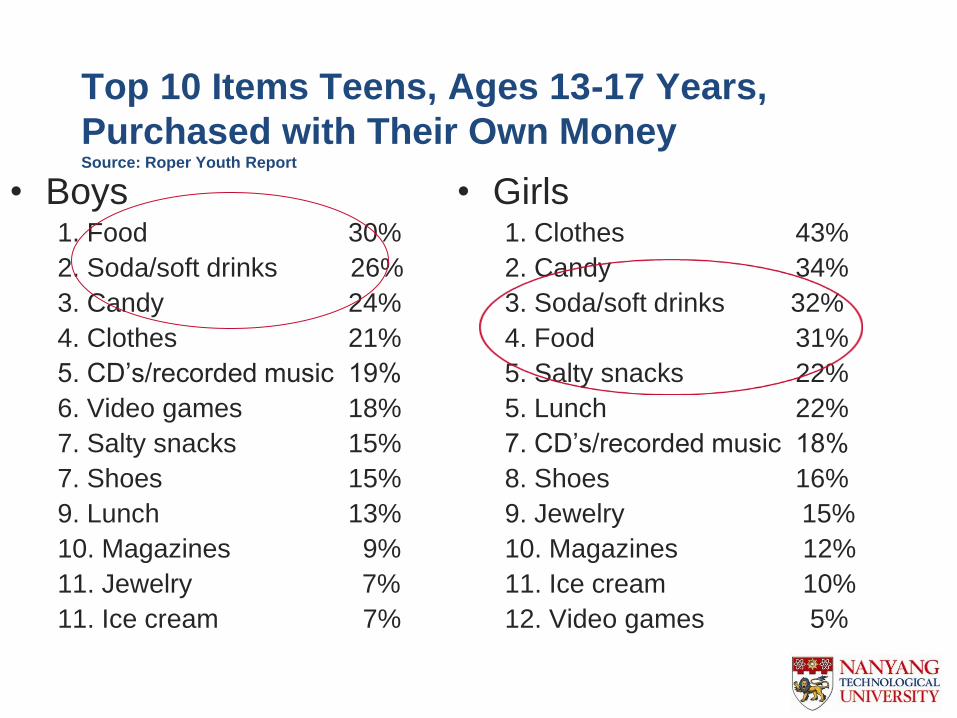
Top 10 Items Teens, Ages 13-17 Years,
Purchased with Their Own Money Source: Roper Youth Report
• Boys 1. Food 30%
2. Soda/soft drinks 26%
3. Candy 24%
4. Clothes 21%
5. CD’s/recorded music 19%
6. Video games 18%
7. Salty snacks 15%
7. Shoes 15%
9. Lunch 13%
10. Magazines 9%
11. Jewelry 7%
11. Ice cream 7%
• Girls 1. Clothes 43%
2. Candy 34%
3. Soda/soft drinks 32%
4. Food 31%
5. Salty snacks 22%
5. Lunch 22%
7. CD’s/recorded music 18%
8. Shoes 16%
9. Jewelry 15%
10. Magazines 12%
11. Ice cream 10%
12. Video games 5%
Food Advertisements and Children’s
Saturday Morning Shows
• Taped Sat AM children’s shows from 7:00 - 10:30 am
• Networks: ABC, CBS, NBC, Fox, Nickelodeon
• Over half (53%) of all ads were food ads (n= 564)
• About 41% of the ads were for toys (n=331)
Kotz and Story JADA
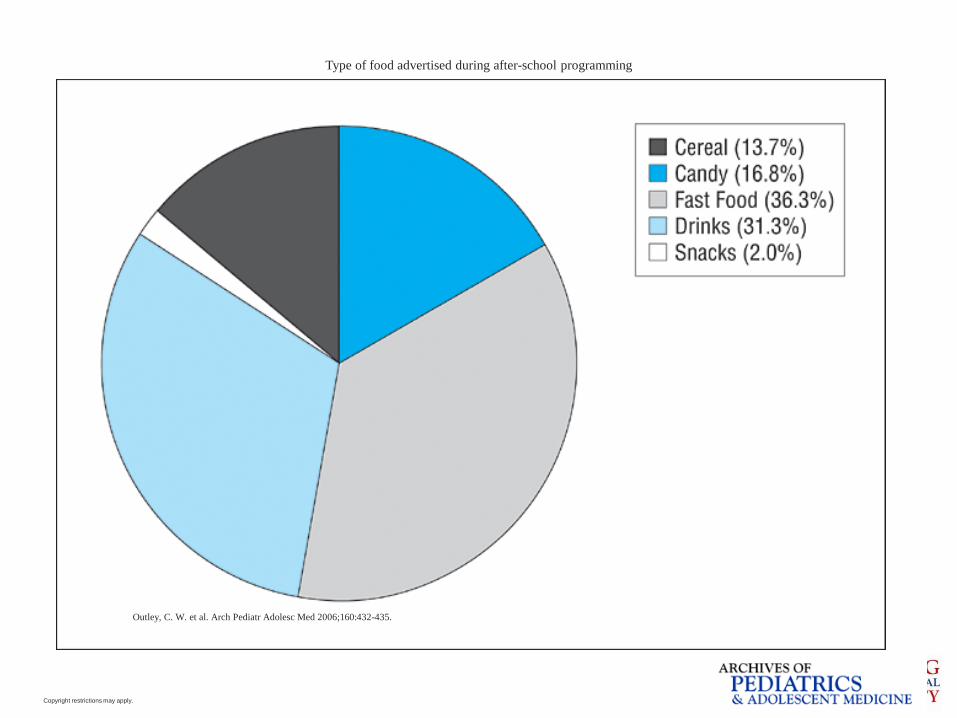
Copyright restrictions may apply.
Outley, C. W. et al. Arch Pediatr Adolesc Med 2006;160:432-435.
Type of food advertised during after-school programming
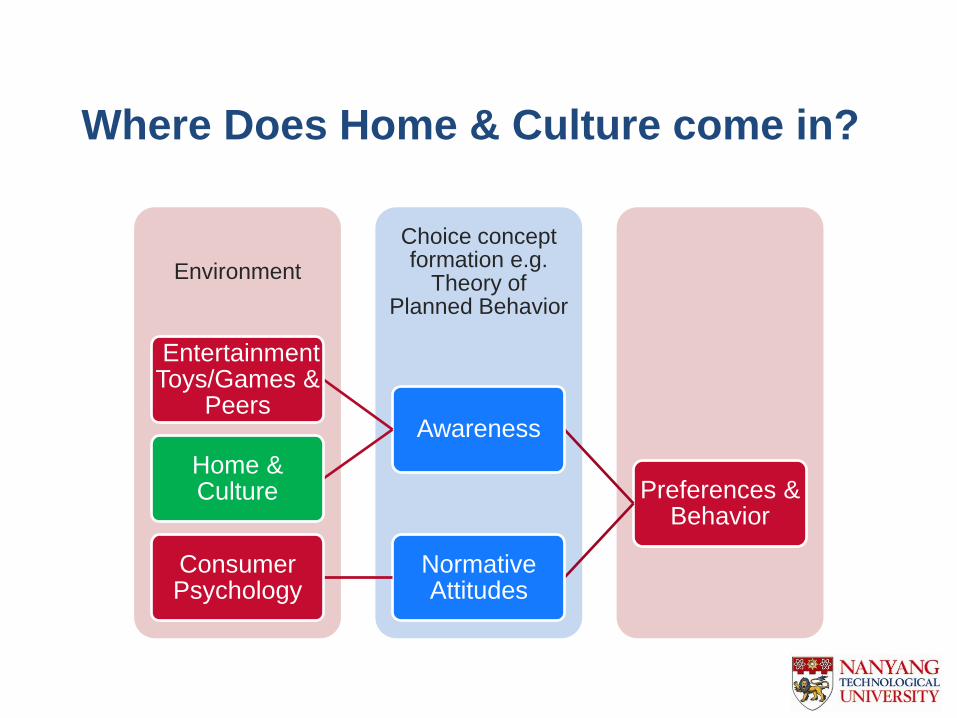
Where Does Home & Culture come in?
Environment
Choice concept formation e.g.
Theory of Planned Behavior
Preferences & Behavior
Awareness
Entertainment Toys/Games &
Peers
Home & Culture
Normative Attitudes
Consumer Psychology
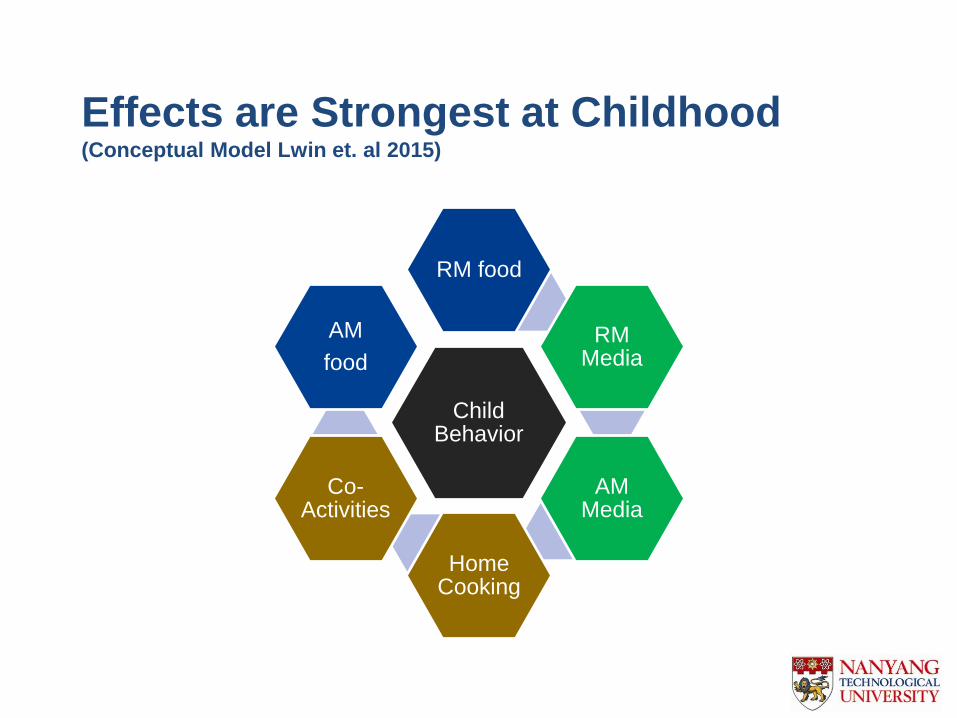
Effects are Strongest at Childhood
(Conceptual Model Lwin et. al 2015)
Child Behavior
RM food
RM Media
AM Media
Home Cooking
Co-Activities
AM
food
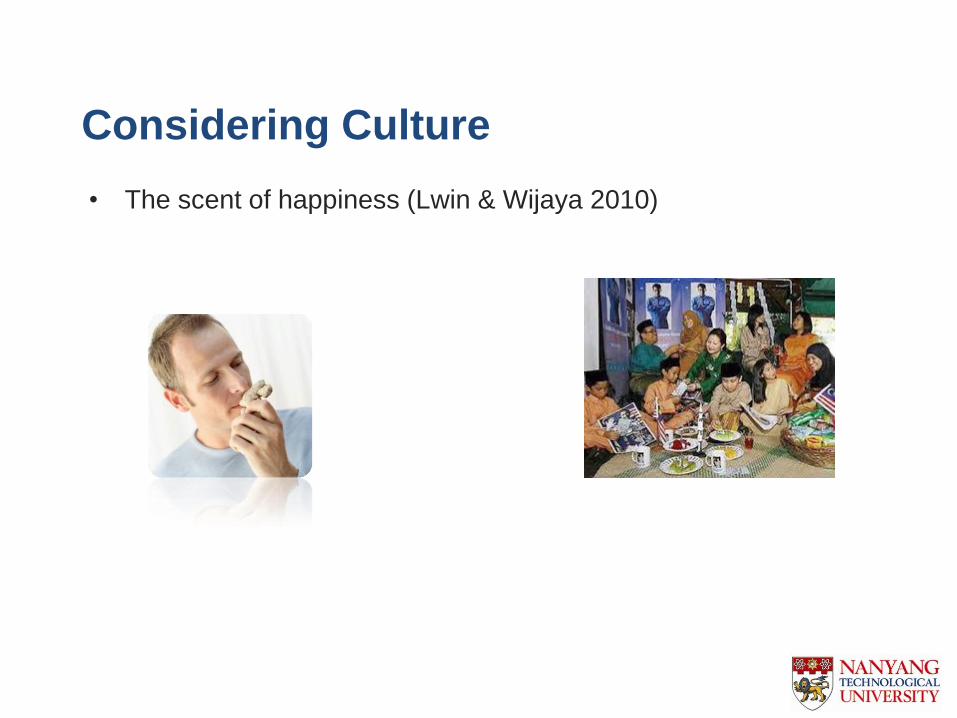
Considering Culture
• The scent of happiness (Lwin & Wijaya 2010)
The Paradox of Health
• Consumers anticipate low-fat
foods to be healthy but not
pleasure-giving, whereas the
opposite was expected for full-
fat products.
(Tuorila and Cardello 1994)
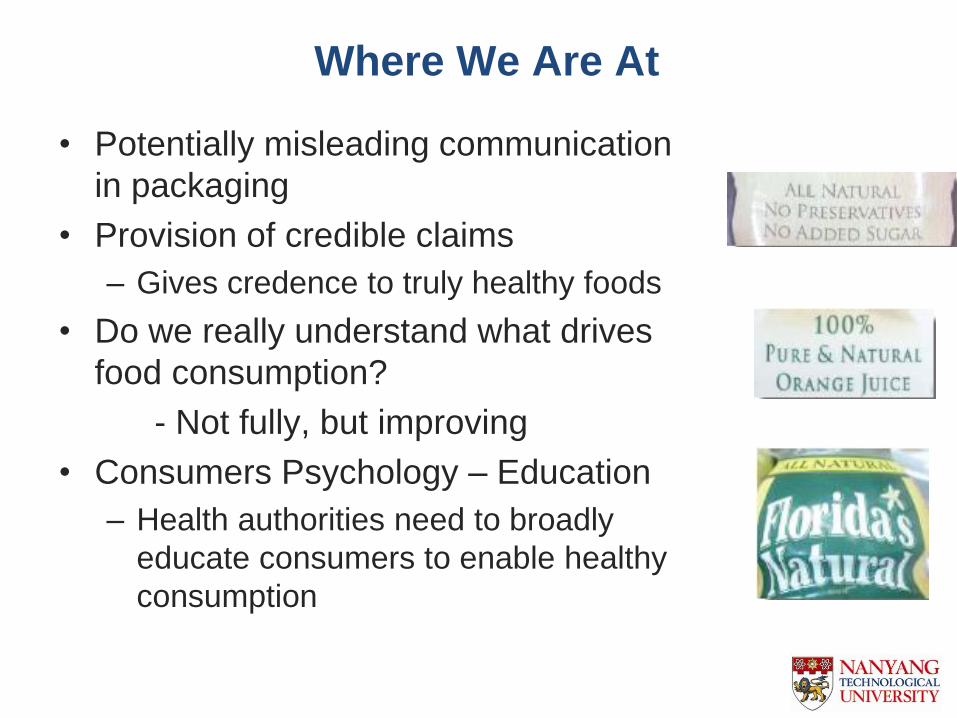
• Potentially misleading communication
in packaging
• Provision of credible claims
– Gives credence to truly healthy foods
• Do we really understand what drives
food consumption?
- Not fully, but improving
• Consumers Psychology – Education
– Health authorities need to broadly
educate consumers to enable healthy
consumption
Where We Are At
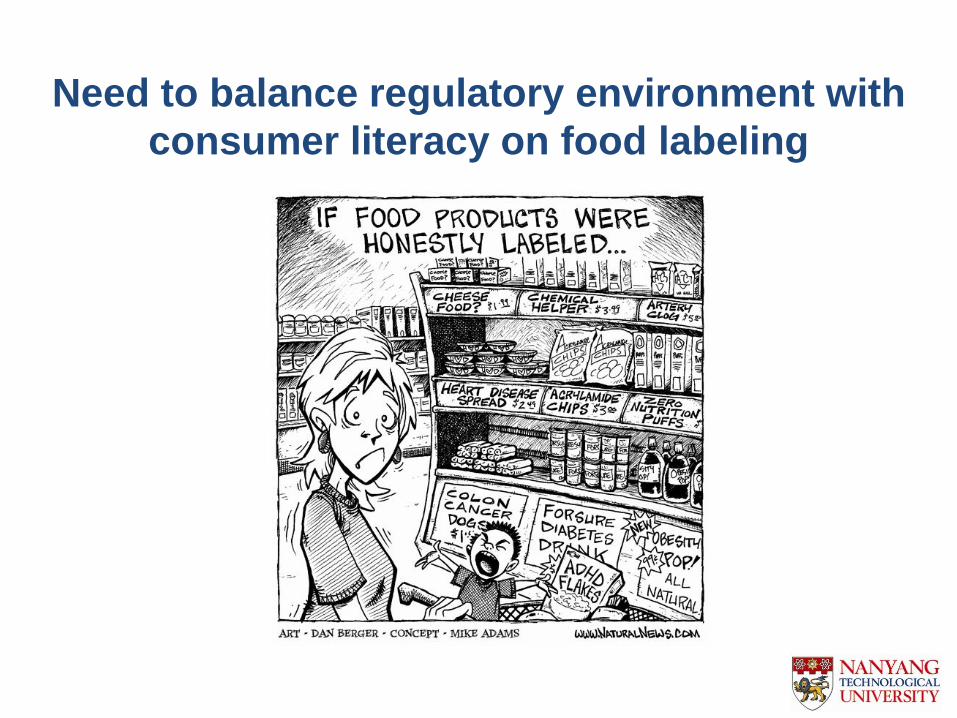
Need to balance regulatory environment with
consumer literacy on food labeling
Consumer Behavior & Healthy Eating
• Much of the scientific knowledge is now
being utilized to develop programs and
interventions targeted at various
populations, with special consideration
to be made to children

Q & A