consumer trends and trade challenges...consumer trends and trade challenges content food security...
TRANSCRIPT
EU Agricultural Markets Briefs are available on Europa: http://ec.europa.eu/agriculture/markets-and-prices/market-briefs/index_en.htm
Agriculture
and Rural
Development
EU Agricultural Markets Briefs No 16 | September 2019
Global food supply and demand
Consumer trends and trade challenges
Content
World food trends
Regional challenges
Food security has been and will continue to be a key driver of socio-political priorities at
global, regional and national level. Increasing world population, sustainability concerns
and uneven income growth present the food and agricultural sector with the permanent
challenges of: (1) increasing total food availabilities, (2) satisfying the increasing
diversification of consumers’ basket, and (3) meeting higher quality standards (safety,
environment, welfare and ethic), while (4) keeping food affordable.
Global production is increasing, yet the level of increase as well as agricultural
development patterns differ widely worldwide. Beyond natural constraints, these
differences reflect diverging economic and structural reforms as well as marketing
strategies, and are crucially relevant in maintaining diversified agricultural landscapes
worldwide.
Production and trade can both help to meet these challenges: on the production side, by
increasing total output in a way that renders food affordable, diversified and accessible
for everyone. On demand, by meeting quality and new societal standards on climate and
environmental matters. On productivity, by turning the sustainable use of natural
resources into the game-changer in the current context of limited resources. On trade,
by allowing globalisation to address seasonality as well as promote specialisation of
production where it is the most efficient. Finally, by facilitating trade flows with the
increase of quality and sanitary standards.
© Enviromantic_iStock
© Enviromantic_iStock
© Ales-A_iStock
Global food supply and demand
2
How to read the graphs?
The data is coming from FAOSTAT (1960-2013) and the OECD-FAO agricultural outlook (2019-20281). Generally,
the data from FAOSTAT are used up to 2013 and the OECD-FAO database is used afterwards. For consistency purposes, the two databases are merged to have results that are more accurate. ‘Consumption’ relates to the supply domestically available for the different uses (food, feed, industrial uses including ethanol uses). For what concerns the regional aggregates: ‘European Union’ corresponds to the European Union at 28 Member States; North America is the US and Canada; South America does not include Central American and Caribbean countries; Asia englobes central, east and south Asian countries; Oceania corresponds to all Oceanian countries;
Africa includes North and sub-Saharan Africa; and the Black Sea includes Kazakhstan, the Russian Federation and Ukraine. The aggregated products included in this analysis are cereals (wheat, maize, rice and other coarse grains); meat in carcass weight equivalent (beef and veal, pigmeat, poultry and sheepmeat); sugar (raw equivalent); dairy products (liquid milk, yoghurts, cream, cheese, milk powders, in raw milk equivalent); vegetable oils (soya oil
and other vegetable oils).
1 OECD-FAO Outlook 2019-2028. http://www.agri-outlook.org/
Graphs of consumption trends
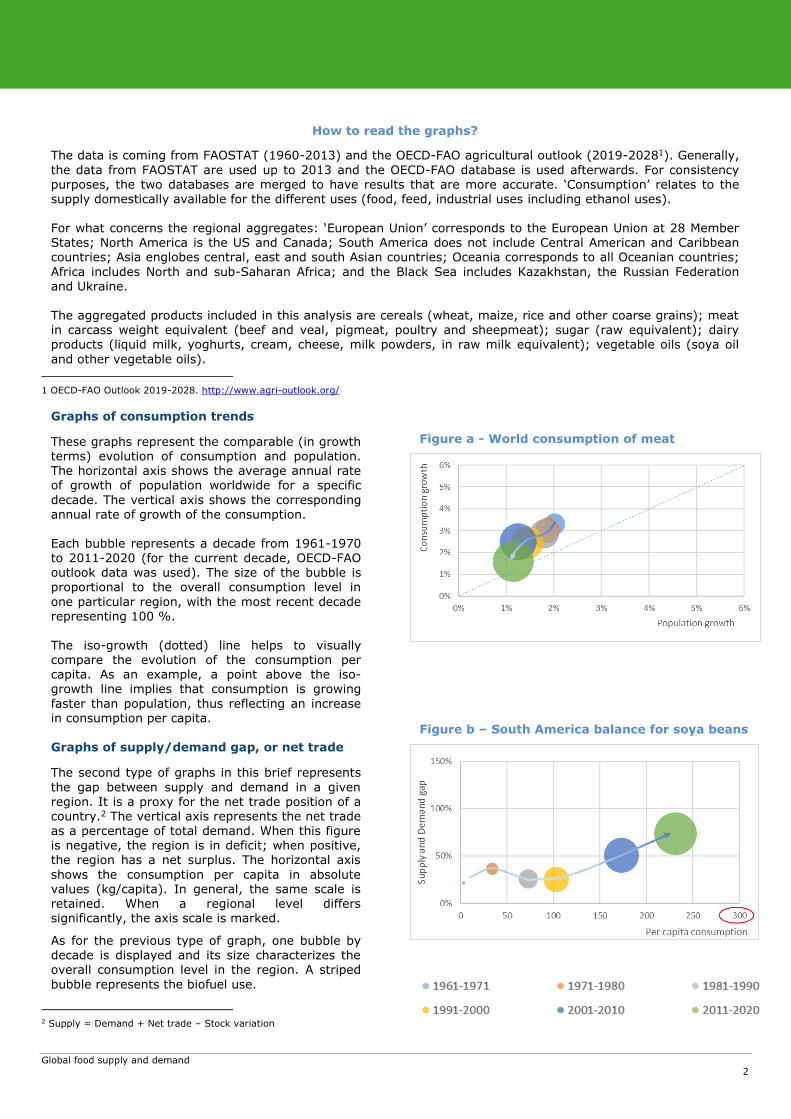
These graphs represent the comparable (in growth terms) evolution of consumption and population. The horizontal axis shows the average annual rate of growth of population worldwide for a specific
decade. The vertical axis shows the corresponding annual rate of growth of the consumption. Each bubble represents a decade from 1961-1970 to 2011-2020 (for the current decade, OECD-FAO outlook data was used). The size of the bubble is
proportional to the overall consumption level in
one particular region, with the most recent decade representing 100 %. The iso-growth (dotted) line helps to visually compare the evolution of the consumption per capita. As an example, a point above the iso-growth line implies that consumption is growing
faster than population, thus reflecting an increase in consumption per capita. Graphs of supply/demand gap, or net trade
The second type of graphs in this brief represents
the gap between supply and demand in a given region. It is a proxy for the net trade position of a country.2 The vertical axis represents the net trade
as a percentage of total demand. When this figure is negative, the region is in deficit; when positive, the region has a net surplus. The horizontal axis
shows the consumption per capita in absolute values (kg/capita). In general, the same scale is retained. When a regional level differs significantly, the axis scale is marked.
As for the previous type of graph, one bubble by decade is displayed and its size characterizes the overall consumption level in the region. A striped
bubble represents the biofuel use.
2 Supply = Demand + Net trade – Stock variation
Figure a - World consumption of meat
Figure b – South America balance for soya beans
Global food supply and demand
3
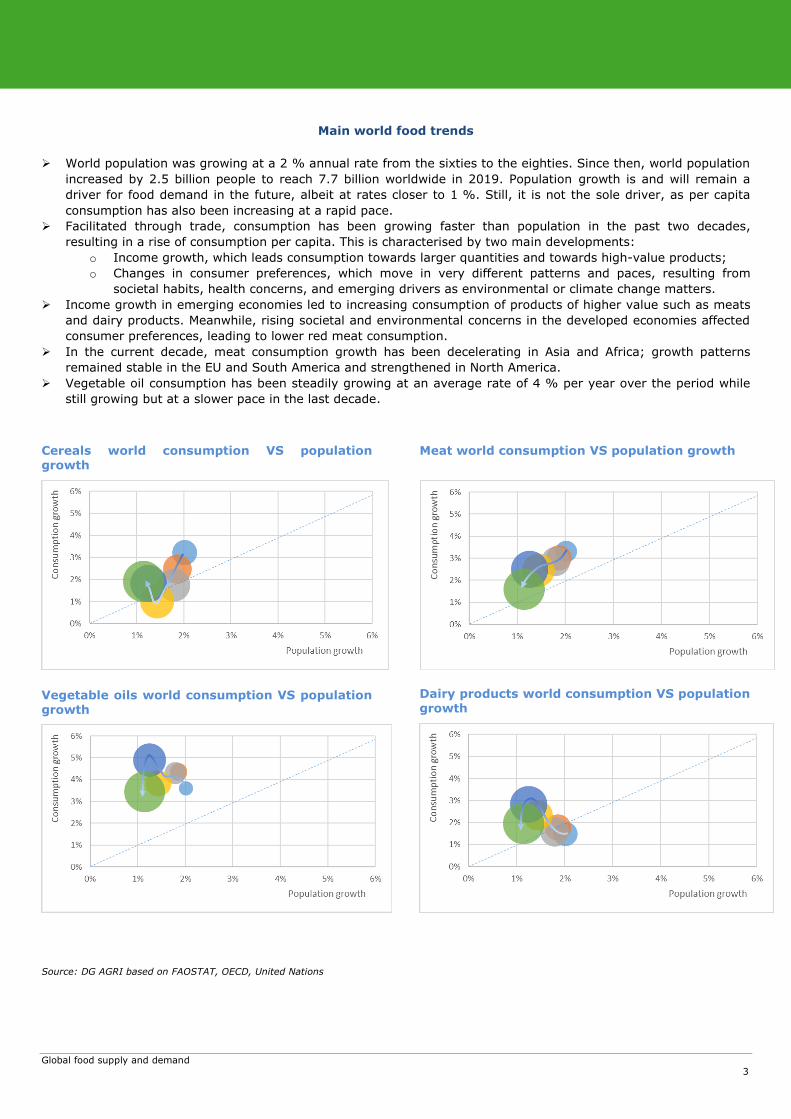
Main world food trends
World population was growing at a 2 % annual rate from the sixties to the eighties. Since then, world population
increased by 2.5 billion people to reach 7.7 billion worldwide in 2019. Population growth is and will remain a
driver for food demand in the future, albeit at rates closer to 1 %. Still, it is not the sole driver, as per capita
consumption has also been increasing at a rapid pace.
Facilitated through trade, consumption has been growing faster than population in the past two decades,
resulting in a rise of consumption per capita. This is characterised by two main developments:
o Income growth, which leads consumption towards larger quantities and towards high-value products;
o Changes in consumer preferences, which move in very different patterns and paces, resulting from
societal habits, health concerns, and emerging drivers as environmental or climate change matters.
Income growth in emerging economies led to increasing consumption of products of higher value such as meats
and dairy products. Meanwhile, rising societal and environmental concerns in the developed economies affected
consumer preferences, leading to lower red meat consumption.
In the current decade, meat consumption growth has been decelerating in Asia and Africa; growth patterns
remained stable in the EU and South America and strengthened in North America.
Vegetable oil consumption has been steadily growing at an average rate of 4 % per year over the period while
still growing but at a slower pace in the last decade.
Cereals world consumption VS population growth
Vegetable oils world consumption VS population growth
Meat world consumption VS population growth
Dairy products world consumption VS population growth
Source: DG AGRI based on FAOSTAT, OECD, United Nations
Global food supply and demand
4
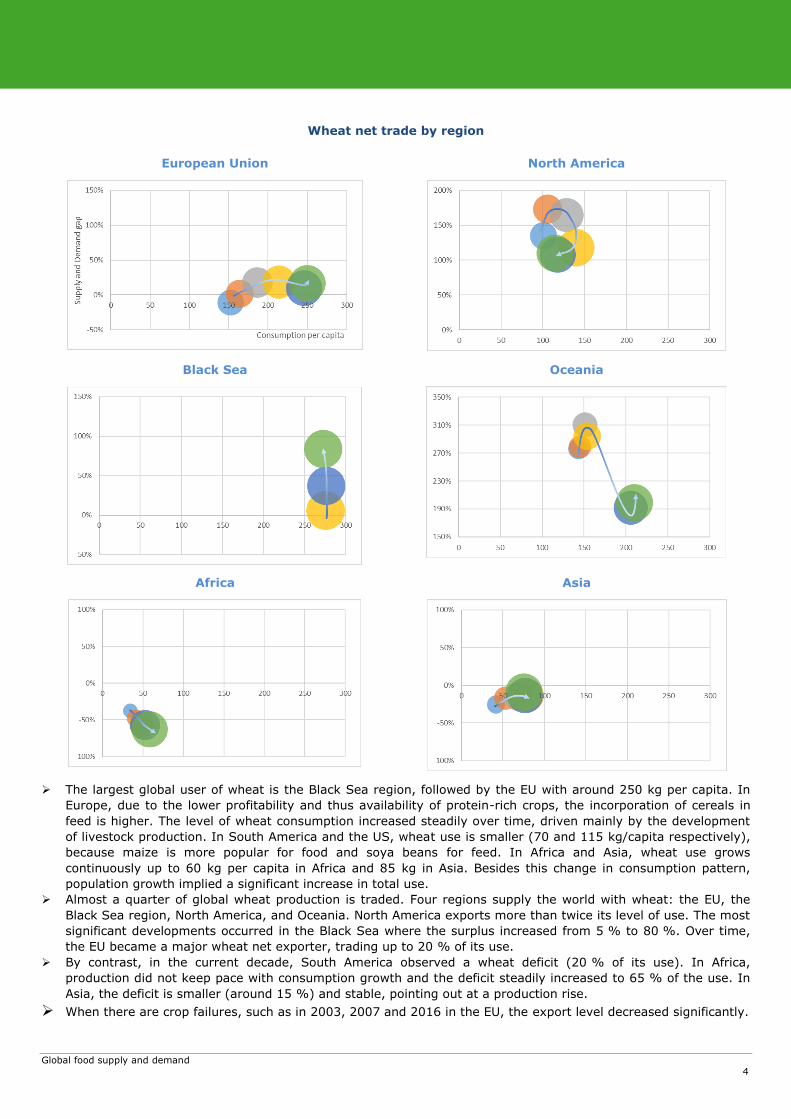
Wheat net trade by region
European Union
North America
Black Sea
Oceania
Africa
Asia
The largest global user of wheat is the Black Sea region, followed by the EU with around 250 kg per capita. In
Europe, due to the lower profitability and thus availability of protein-rich crops, the incorporation of cereals in
feed is higher. The level of wheat consumption increased steadily over time, driven mainly by the development
of livestock production. In South America and the US, wheat use is smaller (70 and 115 kg/capita respectively),
because maize is more popular for food and soya beans for feed. In Africa and Asia, wheat use grows
continuously up to 60 kg per capita in Africa and 85 kg in Asia. Besides this change in consumption pattern,
population growth implied a significant increase in total use.
Almost a quarter of global wheat production is traded. Four regions supply the world with wheat: the EU, the
Black Sea region, North America, and Oceania. North America exports more than twice its level of use. The most
significant developments occurred in the Black Sea where the surplus increased from 5 % to 80 %. Over time,
the EU became a major wheat net exporter, trading up to 20 % of its use.
By contrast, in the current decade, South America observed a wheat deficit (20 % of its use). In Africa,
production did not keep pace with consumption growth and the deficit steadily increased to 65 % of the use. In
Asia, the deficit is smaller (around 15 %) and stable, pointing out at a production rise.
When there are crop failures, such as in 2003, 2007 and 2016 in the EU, the export level decreased significantly.
Global food supply and demand
5
Maize net trade by region
European Union
North America
South America
Black Sea
Africa
Asia
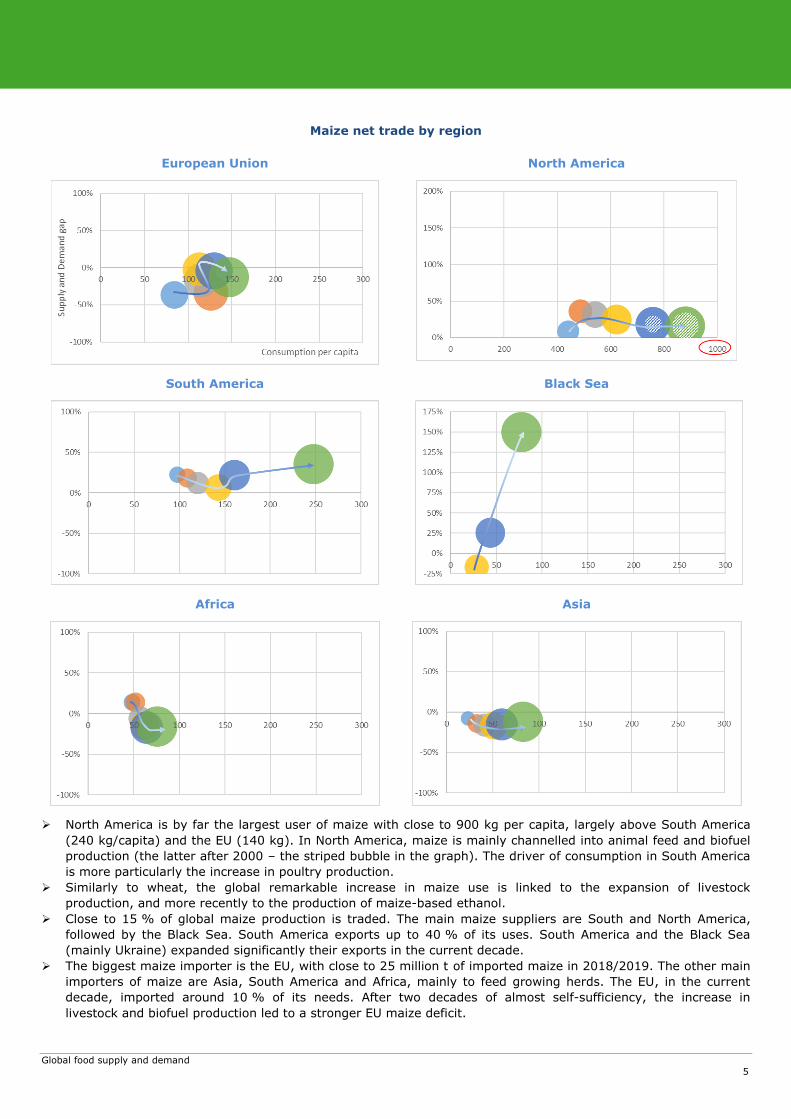
North America is by far the largest user of maize with close to 900 kg per capita, largely above South America
(240 kg/capita) and the EU (140 kg). In North America, maize is mainly channelled into animal feed and biofuel
production (the latter after 2000 – the striped bubble in the graph). The driver of consumption in South America
is more particularly the increase in poultry production.
Similarly to wheat, the global remarkable increase in maize use is linked to the expansion of livestock
production, and more recently to the production of maize-based ethanol.
Close to 15 % of global maize production is traded. The main maize suppliers are South and North America,
followed by the Black Sea. South America exports up to 40 % of its uses. South America and the Black Sea
(mainly Ukraine) expanded significantly their exports in the current decade.
The biggest maize importer is the EU, with close to 25 million t of imported maize in 2018/2019. The other main
importers of maize are Asia, South America and Africa, mainly to feed growing herds. The EU, in the current
decade, imported around 10 % of its needs. After two decades of almost self-sufficiency, the increase in
livestock and biofuel production led to a stronger EU maize deficit.
Global food supply and demand
6
Soya bean net trade by region
European Union
North America
South America
Black Sea
Africa
Asia
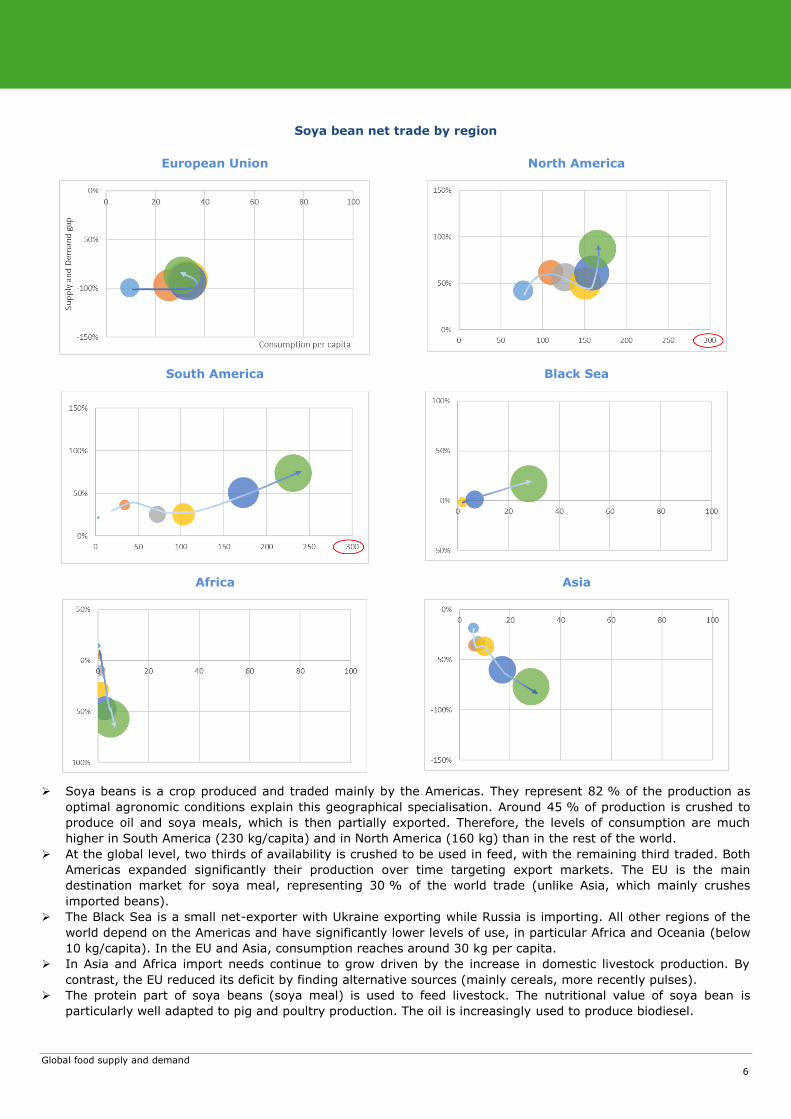
Soya beans is a crop produced and traded mainly by the Americas. They represent 82 % of the production as
optimal agronomic conditions explain this geographical specialisation. Around 45 % of production is crushed to
produce oil and soya meals, which is then partially exported. Therefore, the levels of consumption are much
higher in South America (230 kg/capita) and in North America (160 kg) than in the rest of the world.
At the global level, two thirds of availability is crushed to be used in feed, with the remaining third traded. Both
Americas expanded significantly their production over time targeting export markets. The EU is the main
destination market for soya meal, representing 30 % of the world trade (unlike Asia, which mainly crushes
imported beans).
The Black Sea is a small net-exporter with Ukraine exporting while Russia is importing. All other regions of the
world depend on the Americas and have significantly lower levels of use, in particular Africa and Oceania (below
10 kg/capita). In the EU and Asia, consumption reaches around 30 kg per capita.
In Asia and Africa import needs continue to grow driven by the increase in domestic livestock production. By
contrast, the EU reduced its deficit by finding alternative sources (mainly cereals, more recently pulses).
The protein part of soya beans (soya meal) is used to feed livestock. The nutritional value of soya bean is
particularly well adapted to pig and poultry production. The oil is increasingly used to produce biodiesel.
Global food supply and demand
7
Sugar net trade by region
European Union
North America
South America
Black Sea
Africa
Asia
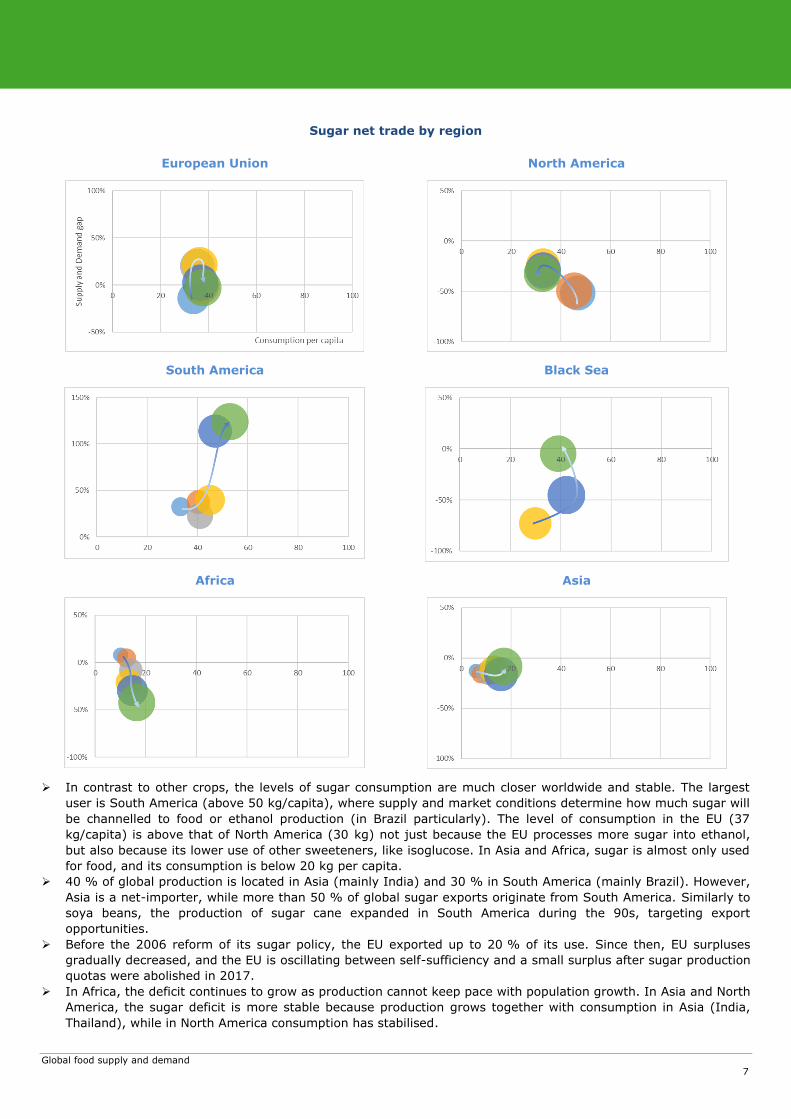
In contrast to other crops, the levels of sugar consumption are much closer worldwide and stable. The largest
user is South America (above 50 kg/capita), where supply and market conditions determine how much sugar will
be channelled to food or ethanol production (in Brazil particularly). The level of consumption in the EU (37
kg/capita) is above that of North America (30 kg) not just because the EU processes more sugar into ethanol,
but also because its lower use of other sweeteners, like isoglucose. In Asia and Africa, sugar is almost only used
for food, and its consumption is below 20 kg per capita.
40 % of global production is located in Asia (mainly India) and 30 % in South America (mainly Brazil). However,
Asia is a net-importer, while more than 50 % of global sugar exports originate from South America. Similarly to
soya beans, the production of sugar cane expanded in South America during the 90s, targeting export
opportunities.
Before the 2006 reform of its sugar policy, the EU exported up to 20 % of its use. Since then, EU surpluses
gradually decreased, and the EU is oscillating between self-sufficiency and a small surplus after sugar production
quotas were abolished in 2017.
In Africa, the deficit continues to grow as production cannot keep pace with population growth. In Asia and North
America, the sugar deficit is more stable because production grows together with consumption in Asia (India,
Thailand), while in North America consumption has stabilised.
Global food supply and demand
8
Beef net trade by region
European Union
North America
South America
Oceania
Africa
Asia
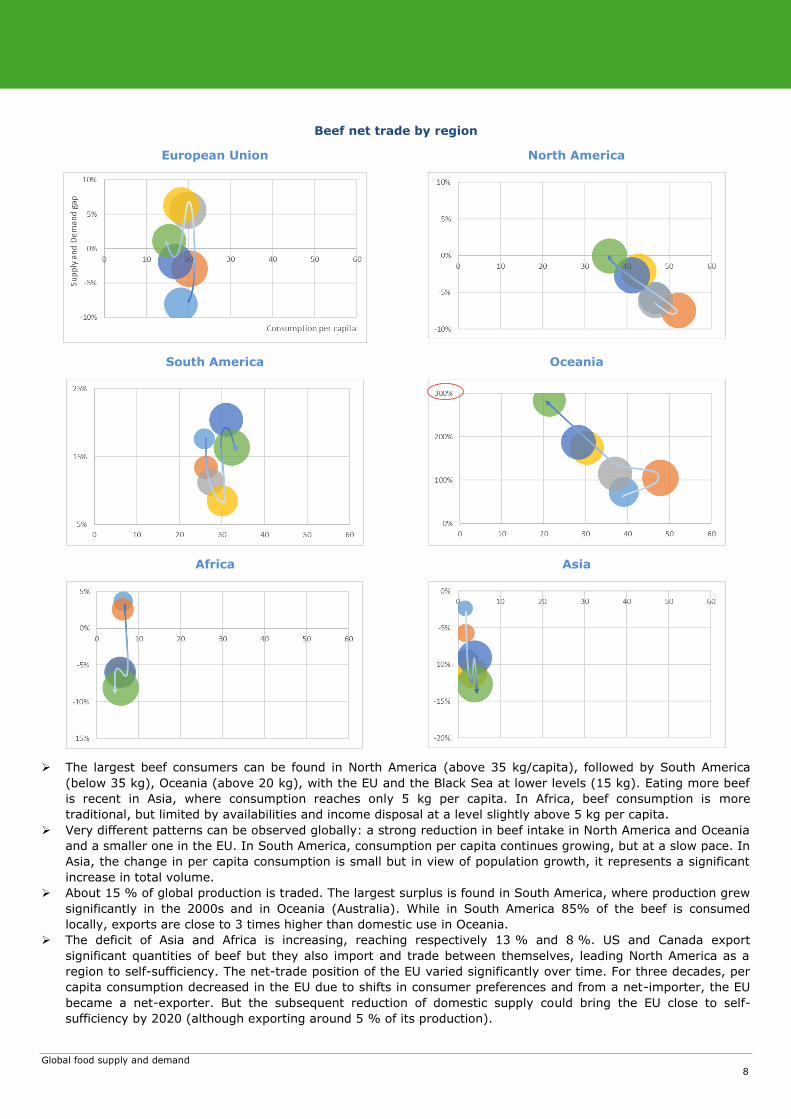
The largest beef consumers can be found in North America (above 35 kg/capita), followed by South America
(below 35 kg), Oceania (above 20 kg), with the EU and the Black Sea at lower levels (15 kg). Eating more beef
is recent in Asia, where consumption reaches only 5 kg per capita. In Africa, beef consumption is more
traditional, but limited by availabilities and income disposal at a level slightly above 5 kg per capita.
Very different patterns can be observed globally: a strong reduction in beef intake in North America and Oceania
and a smaller one in the EU. In South America, consumption per capita continues growing, but at a slow pace. In
Asia, the change in per capita consumption is small but in view of population growth, it represents a significant
increase in total volume.
About 15 % of global production is traded. The largest surplus is found in South America, where production grew
significantly in the 2000s and in Oceania (Australia). While in South America 85% of the beef is consumed
locally, exports are close to 3 times higher than domestic use in Oceania.
The deficit of Asia and Africa is increasing, reaching respectively 13 % and 8 %. US and Canada export
significant quantities of beef but they also import and trade between themselves, leading North America as a
region to self-sufficiency. The net-trade position of the EU varied significantly over time. For three decades, per
capita consumption decreased in the EU due to shifts in consumer preferences and from a net-importer, the EU
became a net-exporter. But the subsequent reduction of domestic supply could bring the EU close to self-
sufficiency by 2020 (although exporting around 5 % of its production).
Global food supply and demand
9
Pigmeat net trade by region
European Union
North America
South America
Oceania
Black Sea
Asia
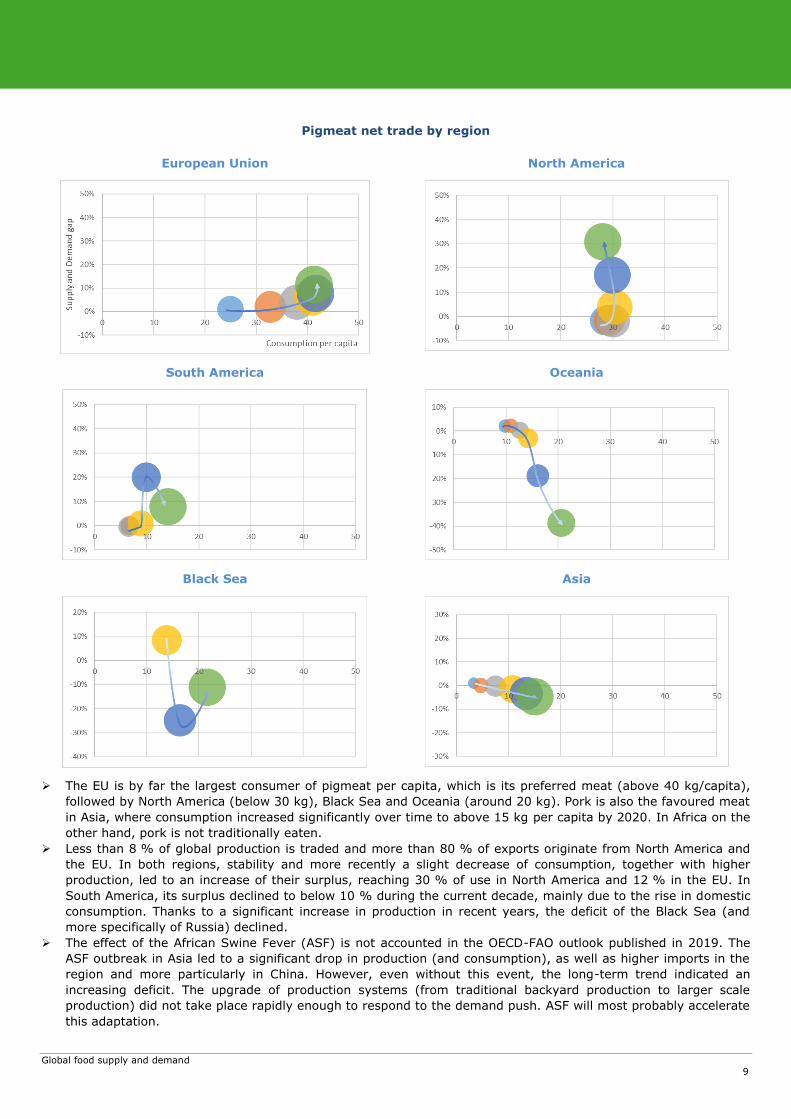
The EU is by far the largest consumer of pigmeat per capita, which is its preferred meat (above 40 kg/capita),
followed by North America (below 30 kg), Black Sea and Oceania (around 20 kg). Pork is also the favoured meat
in Asia, where consumption increased significantly over time to above 15 kg per capita by 2020. In Africa on the
other hand, pork is not traditionally eaten.
Less than 8 % of global production is traded and more than 80 % of exports originate from North America and
the EU. In both regions, stability and more recently a slight decrease of consumption, together with higher
production, led to an increase of their surplus, reaching 30 % of use in North America and 12 % in the EU. In
South America, its surplus declined to below 10 % during the current decade, mainly due to the rise in domestic
consumption. Thanks to a significant increase in production in recent years, the deficit of the Black Sea (and
more specifically of Russia) declined.
The effect of the African Swine Fever (ASF) is not accounted in the OECD-FAO outlook published in 2019. The
ASF outbreak in Asia led to a significant drop in production (and consumption), as well as higher imports in the
region and more particularly in China. However, even without this event, the long-term trend indicated an
increasing deficit. The upgrade of production systems (from traditional backyard production to larger scale
production) did not take place rapidly enough to respond to the demand push. ASF will most probably accelerate
this adaptation.
Global food supply and demand
10
Poultry net trade by region
European Union
North America
South America
Black Sea
Africa
Asia
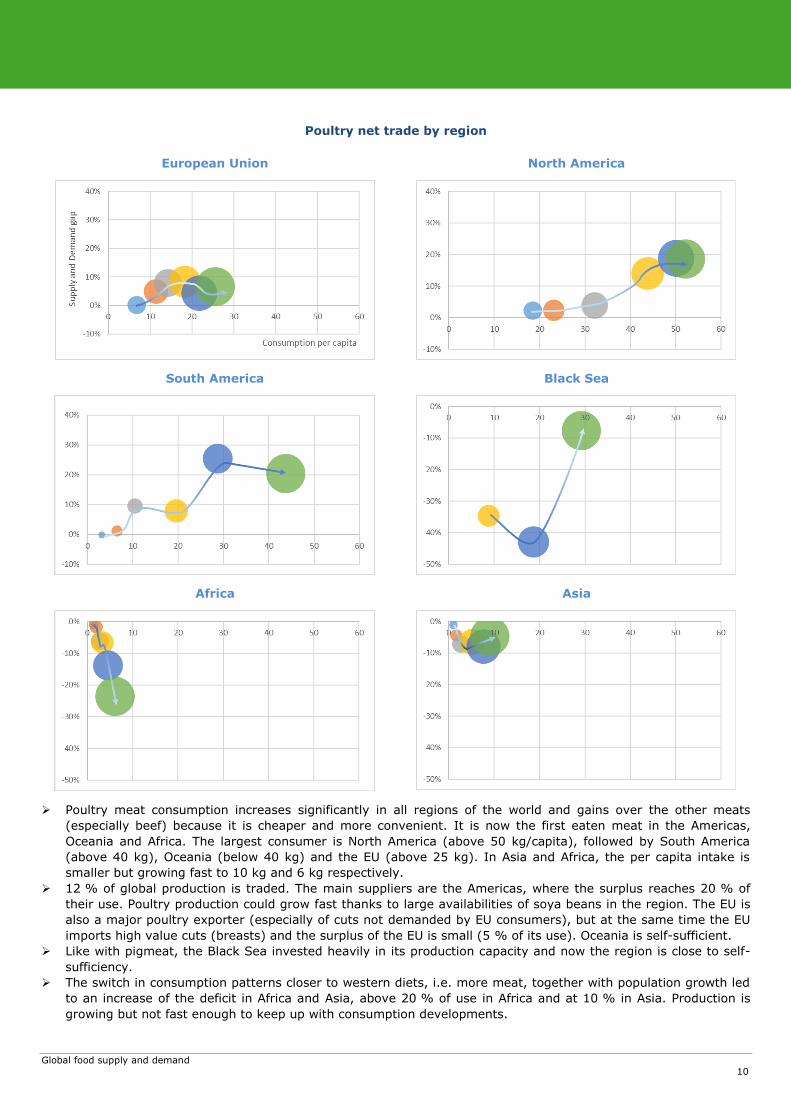
Poultry meat consumption increases significantly in all regions of the world and gains over the other meats
(especially beef) because it is cheaper and more convenient. It is now the first eaten meat in the Americas,
Oceania and Africa. The largest consumer is North America (above 50 kg/capita), followed by South America
(above 40 kg), Oceania (below 40 kg) and the EU (above 25 kg). In Asia and Africa, the per capita intake is
smaller but growing fast to 10 kg and 6 kg respectively.
12 % of global production is traded. The main suppliers are the Americas, where the surplus reaches 20 % of
their use. Poultry production could grow fast thanks to large availabilities of soya beans in the region. The EU is
also a major poultry exporter (especially of cuts not demanded by EU consumers), but at the same time the EU
imports high value cuts (breasts) and the surplus of the EU is small (5 % of its use). Oceania is self-sufficient.
Like with pigmeat, the Black Sea invested heavily in its production capacity and now the region is close to self-
sufficiency.
The switch in consumption patterns closer to western diets, i.e. more meat, together with population growth led
to an increase of the deficit in Africa and Asia, above 20 % of use in Africa and at 10 % in Asia. Production is
growing but not fast enough to keep up with consumption developments.
Global food supply and demand
11
Dairy products net trade by region
European Union
North America
Black Sea
Oceania
Africa
Asia
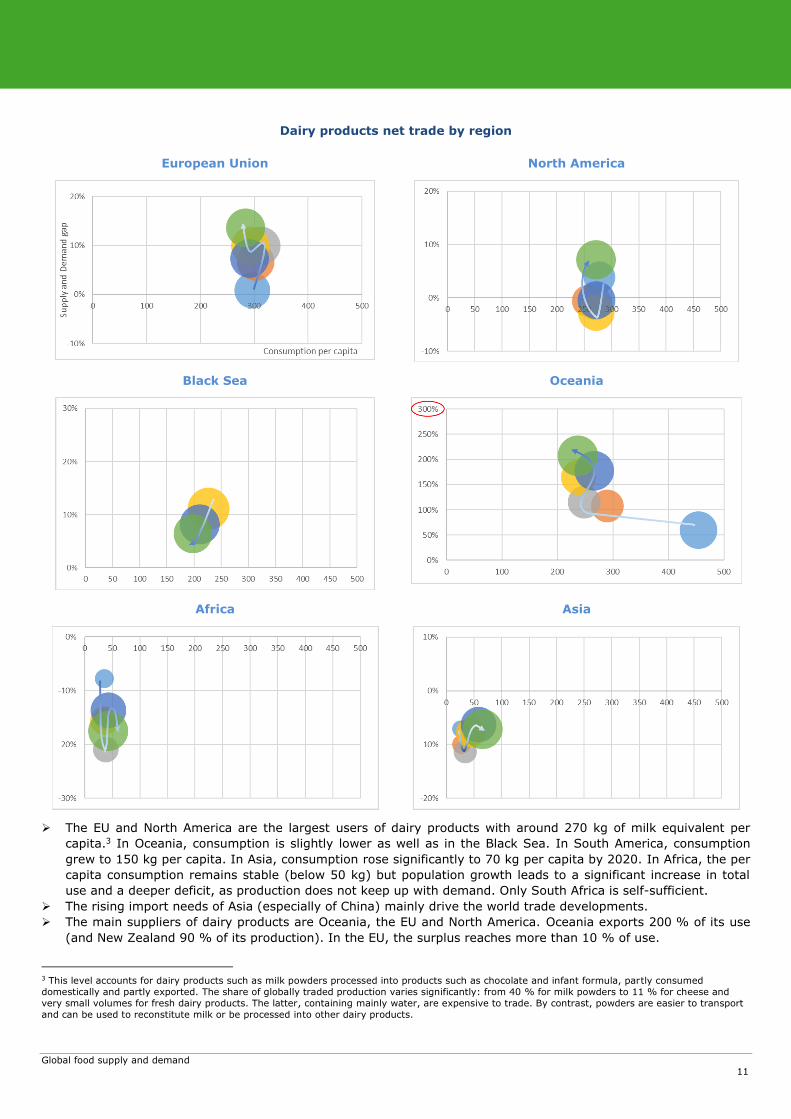
The EU and North America are the largest users of dairy products with around 270 kg of milk equivalent per
capita.3 In Oceania, consumption is slightly lower as well as in the Black Sea. In South America, consumption
grew to 150 kg per capita. In Asia, consumption rose significantly to 70 kg per capita by 2020. In Africa, the per
capita consumption remains stable (below 50 kg) but population growth leads to a significant increase in total
use and a deeper deficit, as production does not keep up with demand. Only South Africa is self-sufficient.
The rising import needs of Asia (especially of China) mainly drive the world trade developments.
The main suppliers of dairy products are Oceania, the EU and North America. Oceania exports 200 % of its use
(and New Zealand 90 % of its production). In the EU, the surplus reaches more than 10 % of use.
3 This level accounts for dairy products such as milk powders processed into products such as chocolate and infant formula, partly consumed
domestically and partly exported. The share of globally traded production varies significantly: from 40 % for milk powders to 11 % for cheese and
very small volumes for fresh dairy products. The latter, containing mainly water, are expensive to trade. By contrast, powders are easier to transport
and can be used to reconstitute milk or be processed into other dairy products.

Global food supply and demand
12
This document does not necessarily represent the official views of the European Commission
Contact: DG Agriculture and Rural Development, Unit Analysis and outlook
Tel: +32-2-29 91111 / E-mail: [email protected]
http://ec.europa.eu/agriculture/markets-and-prices/index_en.htm
© European Union, 2019 — Reproduction authorised provided the source is acknowledged