consumer price awareness in food shopping: the case...
TRANSCRIPT
CONSUMER PRICE AWARENESS IN FOOD SHOPPING:
THE CASE OF QUANTITY SURCHARGES
by
James K. Binkley
and
John Bejnarowicz*
Conference of the American Agricultural Economics Association,
Nashville, Tennessee, 1999.
*Purdue University and A.C.Nielsen, Inc. Copyright 1999 by J. Binkley andJ.Bejnarowicz. All rights reserved. Readers may make verbatim copies of this document for non-commercial purposes by any means, provided this copyright notice appears thereon.
Introduction
A not uncommon price phenomenon in retail food markets is the presence of quantity
surcharges: higher unit prices for larger than smaller sizes of the same product. Store surveys
have found that approximately 25% of brands exhibit some surcharge pricing (e.g., Widrick,
1979a, 1979b; Nason and Della Bitta, 1983; Agrawal, et al.,1993 ). While in part surcharges
arise due to temporary price promotions or from pricing errors, Widrick found they do not occur
randomly but reflect conscious pricing policy. Indeed, for some commodities surcharging is more
the rule than the exception.
Since consumers can avoid surcharges by buying smaller sizes, why don’t they do so?
One possibility is simply a preference for larger sizes. Undoubtedly there are consumers with this
preference. However, it seems more reasonable to suppose that the majority of surcharge
purchasers are simply unaware that the surcharge exists. Consumers vary considerably in their
knowledge of prices and thus their sensitivity to them. One study found that little more than 50
percent of buyers are aware of prices paid, even immediately after selection (Dickson and Sawyer,
1990 ). While this is a departure from standard economic assumptions, it is the grist of the mill of
information economics (Stigler). Obtaining accurate price information is costly, depending on the
value of time, and optimum behavior requires a comparison of benefits to costs. Benefits are
small when purchasing low-valued goods, as in retail grocery markets, and so
Cude and Walker (1984) show that blind adherence to this rule is on balance a money-1
saving strategy.
complete information in support of all decisions is beyond the constraints of many time-pressed
shoppers. Then they are likely to ignore all but broad price differences across products, or they
may use shopping rules. One such rule---the “volume discount heuristic” (Nelson and Della Bitta,
1983)---is the source of the present problem. Generally the rule works, since discounting is the
norm---larger sizes are often labeled as “economy size.” However, complete reliance on this1
rule opens the way to paying quantity surcharges.
This study is an empirical analysis of consumer response to quantity surcharges. We
analyze the role of prices and consumer characteristics in determining sensitivity to a surcharge.
We are guided by the economics of information, and our study can be regarded as a test of its
implications. Actual behavior under surcharges has not previously been examined, owing to the
difficulty of obtaining appropriate data. Our study came about through access to a large sample
from a grocery product tracking firm. The data consists of measures from large grocery
marketing
districts rather than data on individual consumers. We find a surprising amount of variability in
prices and consumer characteristics over these markets. We examine a single commodity, canned
tuna, which surveys and current data indicate is universally surcharge Our results are generally
supportive of the economics of information explanation of surcharges.
Widrick (1979a) cites an article in a 1957 issue of the Consumer Bulletin.2
Background
Quantity surcharges have been documented in trade, government, and academic literatures
for more than 40 years. Canned tuna is surcharged with the greatest frequency. Widrick (1979a)2
found 85% of tuna brands had surcharges, the most in his survey. In Nason and Della Bitta’s
survey of two years’ prices, tuna was consistently among the most surcharged items in both years.
Cude and Walker found tuna to be the commodity most likely to thwart a strategy of buying large
sizes. In Agrawal et al.’s 1993 price audit, tuna was the most surcharged item.
Data compiled by USDA from the 1988-1995 A.C.Nielsen Scantrack Database — a compilation
of annual scanner data from 3000 supermarkets nationwide — shows a stunning surcharge for
tuna. Across the U.S. the largest (12.5 oz.) size is on average 40% more costly per ounce than
the popular 6.5 oz. size Below we provide additional evidence that tuna surcharges are
substantial and universal across U.S. markets.
There is considerable literature of relevance to surcharges, especially studies of price
search and unit pricing (Boynton et al. (1983); Kujala and Johnson (1993)) Much of this is
based on Stigler’s information theory. Goldman and Johansson (1978) directly tested this theory
using a survey of gasoline purchasers and found weak support. Urbany, Dickson, and Kalapuraki
(1996) examined determinants of grocery price search and found a negative association with
income, hours worked, and the presence of young children, and a positive effect of education,
results which are all expected implications of information economics. In an early study of unit
prices, Granger and Billson (1975) showed that in the absence of unit prices consumers had
difficulty choosing best values; in a later study Capon and Kuhn (1982) found 40% of buyers
questioned could not do so. Although this would seem to increase the use of unit prices,
Detailed data was not available for private label, but only total cases and sales of all types. 3
With no information on sizes, we could not use it. It accounts for 12% of tuna sales.
Dickson and Sawyer (1990) found that only 8% of buyers did so. This will obviously contribute
to falling victim to surcharges.
Data
All data on product sales came from Sales Area Marketing, Inc (SAMI), a product
tracking firm which discontinued operation in 1991. SAMI monitored grocers’ warehouse
shipments of 484 categories in 54 market areas, which were aggregations of counties and which
accounted for 85 per cent of US grocery sales. The warehouses provided SAMI with data on
case movements to supermarkets, along with corresponding retail sales and price data.
We had paper reports showing, for each market, price, cases, sales, and share figures for
every variation of every brand (e.g. Starkist chunk light in 6.5 oz. cans packed in water in 24-can
cases), for the previous four weeks and year. Annual 1990 data (the last year available) was
compiled from these, but not all brands, types, and sizes were included. We confined attention to
the main type of tuna sold, chunk light. The majority of this is sold in a 6.5 oz. can, with much
also sold in a larger 12.5 oz. size. These were the study focus. We used data for the three
leading brands (Starkist, Chicken-of-the-Sea, and Bumblebee), which account for 77% of US
sales, and the fourth largest other brand for each individual market. No distinction between oil3
pack and water pack was made (i.e. they were aggregated), for these generally sell for the same
price.
Demographic data for the study came from the US Bureau of the Census “USA Counties”
CD-rom, containing county data from numerous federal agencies. An algorithm was developed to
aggregate this county data into the 54 SAMI regions.
P12/P6
P12 P6 S(P12P6)
�12P12��6P6 �S
�12�6
Of course there are other possibilities, one being the ratio . However, there is no a4
priori reason for a measure differing from the two specified.
By this we mean that the consumer would choose a large over a small size when unit5
prices were identical and known.
. Model Formula
The model used for the analysis was of the following general form:
SMALLCAN= f (PRICES, DEMOGRAPHICS).
SMALLCAN is the ratio of tuna sold in the 6.5 ounce size to the total sold in 6.5 and 12.5 ounces
combined, PRICES are the unit prices for each, and DEMOGRAPHICS are relevant
characteristics of the market, as discussed below.
An important question is how prices should be included, in particular, whether as the
individual variables and or as the direct surcharge measure , with model
components and (P - P ), respectively. The second is the first with the12 64
restriction that . The restriction holds if consumers are choosing large sizes by
preference, for they would tradeoff sizes on the basis of this difference. Because we wanted to
test this, not impose it, we included the prices as separate variables.
The demographic variables were chosen based on two considerations: (1) factors which
affect consumer proneness to buy large sizes for reasons other than a belief in quantity discounts ,5
and (2) factors which affect price search behavior. Note these are independent. Although we
would expect a consumer who does not make careful price comparisons to be prey to surcharges,
we first need to determine whether the consumer would ever buy a large quantity. A giant-sized
box of corn flakes is likely to languish to unpalatability in a single person’s cupboard, but quickly
disappear in a household full of children. In the former case, no matter how cheaply-bought, it
�
will in the end be quite expensive. Thus, we would expect a single-person household, no matter
how price-insensitive, to be less subject to surcharges than a larger
household.
In both cases (1) and (2), the variables used were based on the literature reviewed above
and on our own judgement. We were somewhat restricted in this process, however, because we
were dealing with market-level data, as opposed to survey measures for individual households.
This is especially true in the case of (1). We could not use variables like “shopping trips per
week,” “distance to the nearest store,” and “household storage space” (as discussed in Agrawal et
al.). We used only two measures: HHSIZE, the average household size in the market, and
HOMES, the percent of households in single-family detached dwellings. The reason for the first
is obvious, and we expect its coefficient to be negative. HOMES is a proxy measure of storage
space, and the ability to inventory goods in the household facilitates stocking up and purchasing
large sizes. Thus its coefficient should be 0.
We included eight variables to capture various aspects of search costs. INCOME, per
capita income, and FEMLAB, the female labor force participation rate, are factors higher values
of which increase the value of time, thus making careful shopping less likely. We expect negative
coefficients. The opposite applies to OLDER, the percentage of the population over 65, and
UNEMP, the overall unemployment rate. Also, in the case of unemployment, the value of
information--careful shopping--would be expected to rise, also contributing to a positive effect.
Four of the variables capture ease of processing information. HIGH and COLLEGE are the per
cents of market population with high school and college educations, respectively. We expect
more education to increase the likelihood of surcharge awareness, implying positive coefficients.
However, unlike many items, an opened can of tuna will not keep. Therefore, higher6
consumption due to greater consumption frequency would not create a tendency to large sizes. Only more “tuna intensive” dishes would do this.
For opposite reasons, we expect a non-positive coefficient for LANG, the percentage of
households speaking other than English at home.
As a measure of shopping experience, we include TUNA, the per capita consumption of
chunk light tuna in the market. The more often an item is purchased, the more likely that buyers
acquire detailed knowledge of prices of its various forms. Also, the cost of information is spread
over a greater number of purchases. So we expect a positive effect.
However, TUNA has a second dimension. Households consuming more tuna would be
expected to have a greater tendency to purchase larger quantities and hence larger sizes. To the6
extent this is important, TUNA would have a negative impact on small can purchases. If both
dimensions are present, they may counterbalance each other, leaving no detectable effect. Our
view is that the information effect is the more important.
The model also contained three regional dummies to control for possible regional
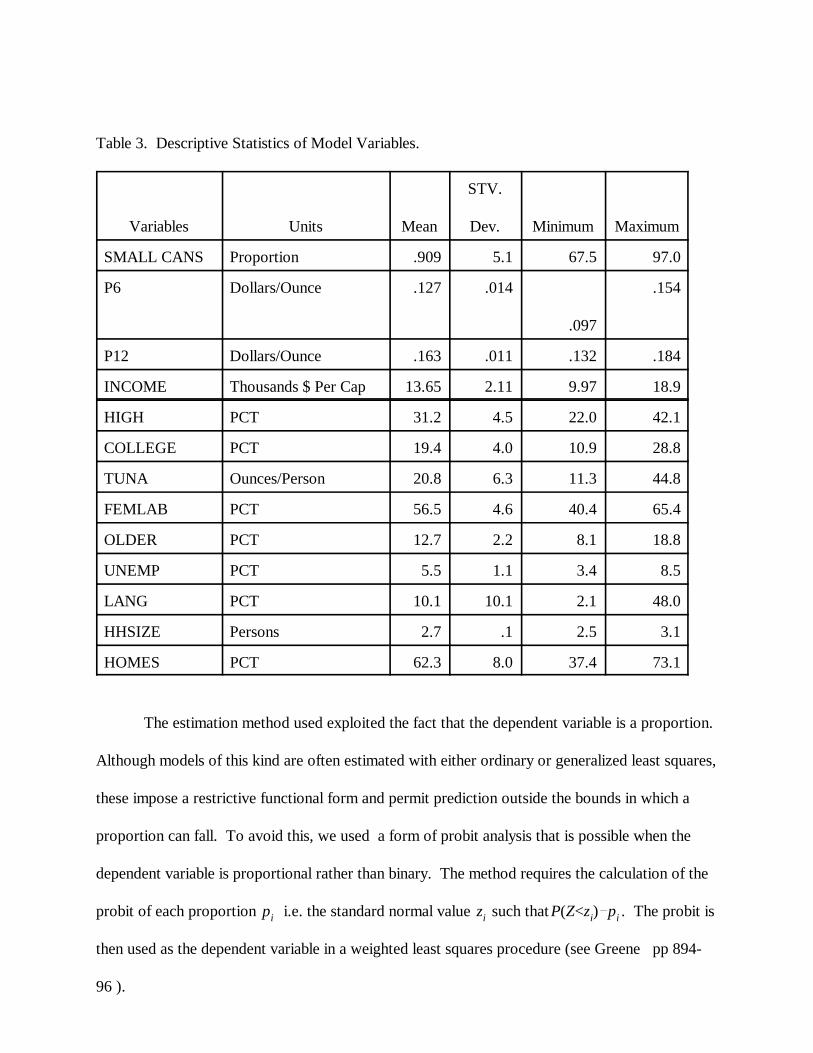
differences of unknown nature or cause. Descriptive measure of all variables are presented in
table 3.
pi zi P(Z<zi)pi
Table 3. Descriptive Statistics of Model Variables.
Variables Units Mean Dev. Minimum Maximum
STV.
SMALL CANS Proportion .909 5.1 67.5 97.0
P6 Dollars/Ounce .127 .014 .154
.097
P12 Dollars/Ounce .163 .011 .132 .184
INCOME Thousands $ Per Cap 13.65 2.11 9.97 18.9
HIGH PCT 31.2 4.5 22.0 42.1
COLLEGE PCT 19.4 4.0 10.9 28.8
TUNA Ounces/Person 20.8 6.3 11.3 44.8
FEMLAB PCT 56.5 4.6 40.4 65.4
OLDER PCT 12.7 2.2 8.1 18.8
UNEMP PCT 5.5 1.1 3.4 8.5
LANG PCT 10.1 10.1 2.1 48.0
HHSIZE Persons 2.7 .1 2.5 3.1
HOMES PCT 62.3 8.0 37.4 73.1
The estimation method used exploited the fact that the dependent variable is a proportion.
Although models of this kind are often estimated with either ordinary or generalized least squares,
these impose a restrictive functional form and permit prediction outside the bounds in which a
proportion can fall. To avoid this, we used a form of probit analysis that is possible when the
dependent variable is proportional rather than binary. The method requires the calculation of the
probit of each proportion i.e. the standard normal value such that . The probit is
then used as the dependent variable in a weighted least squares procedure (see Greene pp 894-
96 ).
P6
P12 P12
�12�6 �.05 F 138
P6
P12
Results
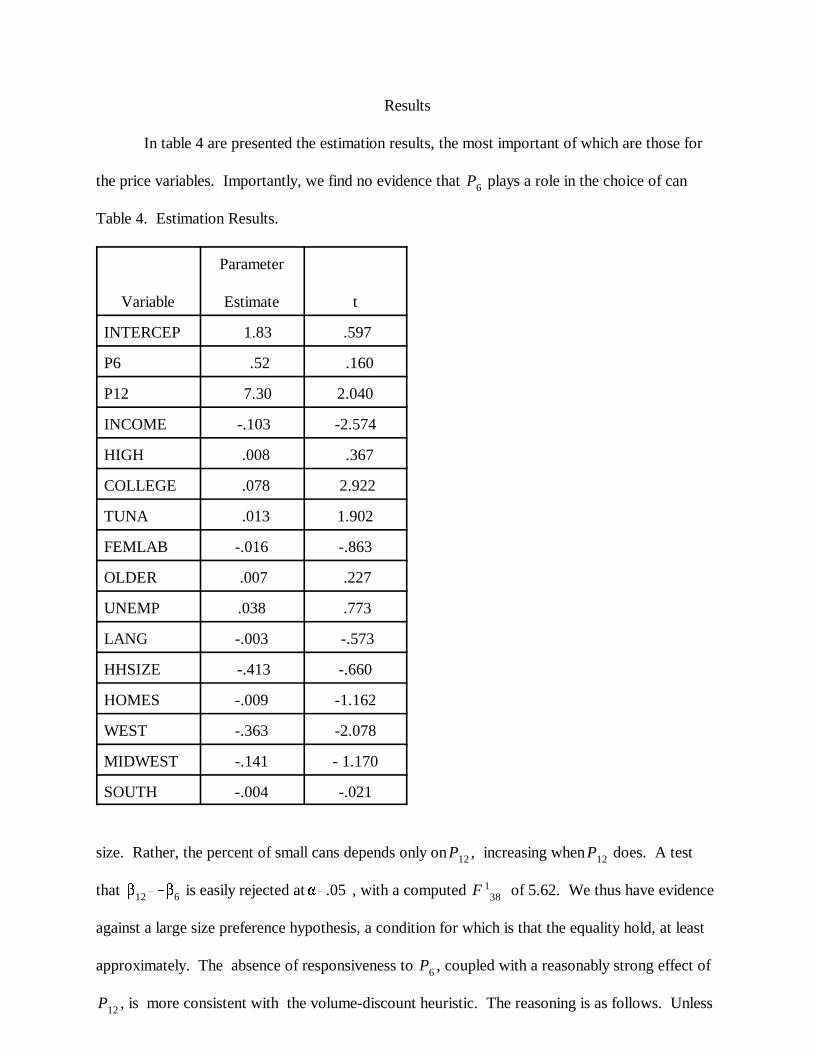
In table 4 are presented the estimation results, the most important of which are those for
the price variables. Importantly, we find no evidence that plays a role in the choice of can
Table 4. Estimation Results.
Variable Estimate t
Parameter
INTERCEP 1.83 .597
P6 .52 .160
P12 7.30 2.040
INCOME -.103 -2.574
HIGH .008 .367
COLLEGE .078 2.922
TUNA .013 1.902
FEMLAB -.016 -.863
OLDER .007 .227
UNEMP .038 .773
LANG -.003 -.573
HHSIZE -.413 -.660
HOMES -.009 -1.162
WEST -.363 -2.078
MIDWEST -.141 - 1.170
SOUTH -.004 -.021
size. Rather, the percent of small cans depends only on , increasing when does. A test
that is easily rejected at , with a computed of 5.62. We thus have evidence
against a large size preference hypothesis, a condition for which is that the equality hold, at least
approximately. The absence of responsiveness to , coupled with a reasonably strong effect of
, is more consistent with the volume-discount heuristic. The reasoning is as follows. Unless
f(X�̂)
f(X�̂)
P12 P12
The interpretation of HIGH is somewhat ambiguous because it measures the per cent of7
the population with only a high school education. Nevertheless, it might be viewed as a subtleindictment of the oft-bemoaned state of math education in the nation’s public schools.
price is being ignored completely, it is likely to be employed in the decision as to whether to buy
tuna. The price observed will be the form whose purchase is contemplated, the large size. If this
price is judged excessive, the consumer will consider substituting other items--the more expensive
but higher quality solid white variety of tuna, other protein products, etc. Certainly this process
may involve switching to smaller cans of tuna, either as a means to reduce tuna consumption or
because the high price for the large size has jarred the consumer into noticing that the smaller can
is cheaper. All of these can only increase the share of sales of 6.5 ounce cans. We conclude that
consumers are buying the large size of tuna not by preference but on the mistaken belief that it is
cheaper. They are evidently not willing to take the time required for careful price comparison.
We need to point out that the coefficients in the table are not the marginal effects of the
variables on the proportion of small cans, as they would be in a linear model. The marginal effects
are found by multiplying the coefficients by , where f is the standard normal density
(Greene p. 976). Thus, the marginal effects are a function of X. Following the standard practice
of evaluating at the sample means, we obtain a value of .16. The marginal effect of
greatest interest, that for , is thus 1.18 at the means. Since is measured in dollars, this
implies that a one cent increase in the unit price of the large can will increase the small can
proportion by about .01.
A value of information interpretation of the price results is supported by results for many
of the value of time and information variables. INCOME is highly significant, with the
anticipated negative effect. Although HIGH, the per cent with a high school degree, is of no
importance, COLLEGE has a strong positive effect. More highly educated markets are less
subject to surcharges, presumably due to an enhanced ability to detect them. 7
Furthermore, for tuna, availability of storage is unlikely to play a role in the choice of8
size. The binding constraint in most home pantries is shelf space, not volume, and two stackedsmall cans require less shelf space than a single large can.
An inspection of influence diagnostics (Belsley, Kuh, and Welsch 19__) revealed this9
coefficient to be the most sample-sensitive in the equation, one reason for which being that themarket with the largest HHSIZE, Salt Lake City, was among those with the largest proportion ofsales in small cans.
The result for TUNA, our measure of shopping experience, is perhaps most interesting.
As previously discussed, TUNA can also be taken as a measure of size preference, and the two
interpretations generate different signs. The strong positive effect, the effect we expected,
supports the information hypothesis: in markets where tuna purchase is more frequent, consumers
are less likely to be victims of surcharges. The TUNA result is thus completely consistent with
the price estimates, discriminating between the two hypotheses in the same manner.
Although none of the remaining information variables is estimated to have a strong
impact, signs agree with the information framework. The same applies to the variables meant to
measure large-size proneness. In the case of HOMES, the absence of a perceptible impact may
not be surprising, for it is at best an inadequate proxy for storage space. The absence of a8
measurable effect for HHSIZE, on the other hand, is somewhat unexpected, for it can hardly be
questioned that larger households are more likely to buy larger sizes. 9
The dummy variables results indicate there are geographic differences unexplained by the
model. (A joint test that they are zero is easily rejected at a 5% level of significance.) The
coefficients suggest that the East, the reference region, is the least prone to large cans and the
West the most. This is also the relationship among the sample means.
Concluding Remarks
The results of this study form a coherent pattern of a cost of information of consumer
behavior under surcharges and provide evidence that the economics of information exercises an
It would also be a means of sidestepping antitrust strictures against manufacturers’10
setting retail price.
active role in retail food markets. They thus support what we regard as the most likely
explanation for consumers to buy surcharged goods: time-short consumers are using low-cost
information, in this case the general tendency for larger sizes of grocery items to be more
economical--in place of careful price comparison and evaluation of a particular grocery item. If
the time-costs of expanded information exceed the benefits--benefits unlikely to be large in retail
food purchasing--this is the rational thing to do. However, it opens the way to falling victim to
surcharges.
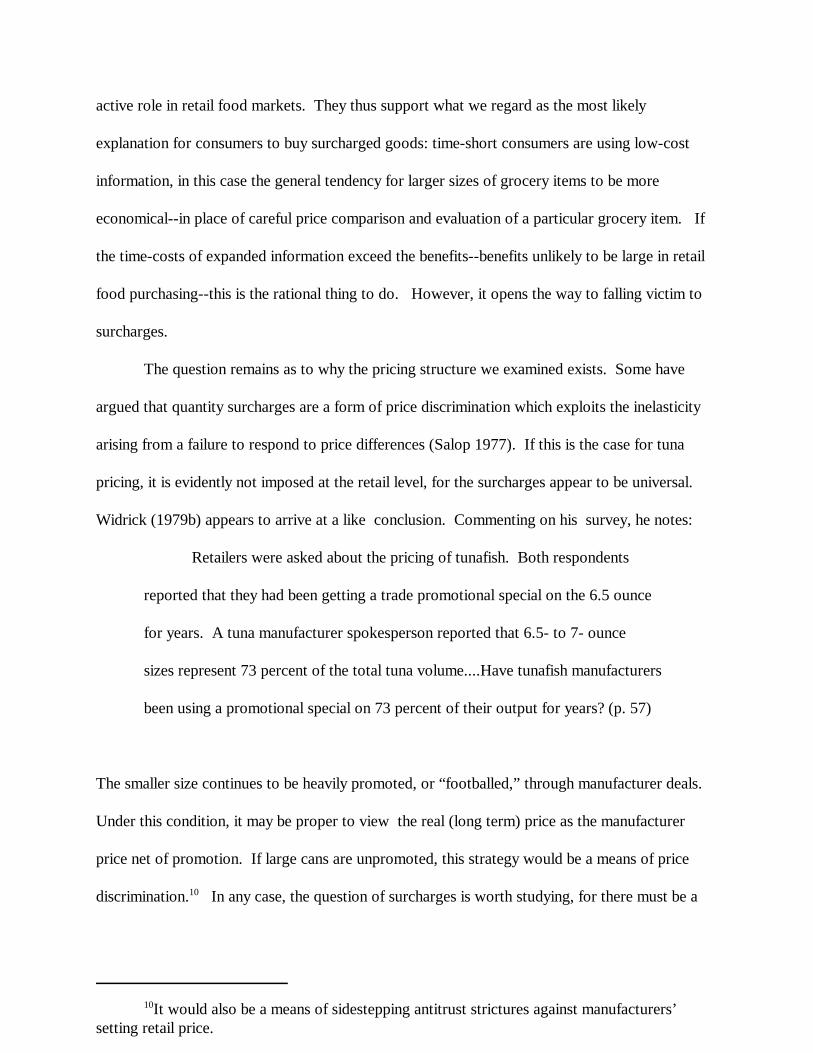
The question remains as to why the pricing structure we examined exists. Some have
argued that quantity surcharges are a form of price discrimination which exploits the inelasticity
arising from a failure to respond to price differences (Salop 1977). If this is the case for tuna
pricing, it is evidently not imposed at the retail level, for the surcharges appear to be universal.
Widrick (1979b) appears to arrive at a like conclusion. Commenting on his survey, he notes:
Retailers were asked about the pricing of tunafish. Both respondents
reported that they had been getting a trade promotional special on the 6.5 ounce
for years. A tuna manufacturer spokesperson reported that 6.5- to 7- ounce
sizes represent 73 percent of the total tuna volume....Have tunafish manufacturers
been using a promotional special on 73 percent of their output for years? (p. 57)
The smaller size continues to be heavily promoted, or “footballed,” through manufacturer deals.
Under this condition, it may be proper to view the real (long term) price as the manufacturer
price net of promotion. If large cans are unpromoted, this strategy would be a means of price
discrimination. In any case, the question of surcharges is worth studying, for there must be a10

reason for their persistence. They are not all happenstance. Indeed, in the market we studied,
quantity surcharges are long-standing and apparently cemented into the pricing structure.
Bibliography
1. Agrawal, J., P. Grimm and N. Srinivisan, “Quality Surcharges on Groceries” (1993), Journal
of Consumer Affairs, 27:335-356.
2. Belsley, David A., Edwin Kuh, and Row E. Welsch (1980), Regression Diagnostics, New
York, John Wiley.
3. Boynton, Robert D., Brian F. Blake, and Joe N. Uhl (1983), “Retail Price Reporting Effects
in Local Food Markets,” American Journal of Agricultural Economics, 65 (February), 20-
29.
4. Capon, N. and D. Kuhn (1982), “Can Consumers Calculate Best Buys?” Journal of
Consumer Research, 8:449-453.
5. Cude, B. and R. Walker (1984), “Quantity Surcharges: Are The Important in Choosing a
Shopping Strategy?”, Journal of Consumer Affairs, 18:287-295.
6. Dickson, P. and A. Sawyer (1990), “The Price Knowledge and Search of Supermarket
Shoppers”, Journal of Marketing, 54:42-53.
7. Goldman, A. and J. Johansson (1978), “Determinants of Search For Lower Prices: An
Empirical Assessment of the Economics of Information Theory”, Journal of Consumer
Research, 5:176-186.
8. Granger, C.W.J. and A. Billson (1972), “Consumer Attitudes Toward Package Size and
Price,” Journal of Marketing Research, 9:239-248.
9. Greene, W.H. (1997), Econometric Analysis. Upper Saddle River, NJ. Prentice-Hall.
10. Kaufman, P.R., J.M. MacDonald, S.M. Lutz and D.M. Smallwood (1997), “Do The Poor
Pay More Food? AER Report Number 759, Economic Research Service, USDA, November.
11. Kujala, Jouni T. and Michael D. Johnson (1993), “Price Knowledge and Search Behavior for
Habitual, Low Involvement Food Purchases,” Journal of Economic Psychology, 14(June),
249-65.
12. Nason, R.W. and A.J. Della Bitta (1983), “The Incidence and Consumer Perceptions of
Quantity Surcharges”, Journal of Retailing, 59:40-54.
13. Salop, S. (1977), “The Noisy Monopolist: Imperfect Information, Price Dispersion and Price
Discrimation”, Review of Economic Studies, 44:393-406.
14. Stigler, G. (1961), “The Economics of Information”, Journal of Political Economy, June,
Vol. 69, No. 3.
15. Urbany, J.E., P.R. Dickson, and R. Kalapurakal (1996), “Price Search in the Retail Grocery
Market”, Journal of Marketing, 60:91-104.
16. Widrick, S.M. (1979a), “Measurement of Incidents of Quantity Surcharge Among Selected
Grocery Products”, Journal of Consumer Affairs, 13:99-107.
17. Widrick, S.M. (1979b), “Quantity Surcharge: A Pricing Practice Among Grocery Store
Items-Validation and Extension”, Journal of Consumer Affairs 55:47-58.