consumer attitudes to new zealand food product · pdf fileconsumer attitudes to new zealand...
TRANSCRIPT
Consumer Attitudes toNew Zealand Food Product Attributes and Technology Use in Key International Markets
Caroline SaundersMeike GuentherTim DriverPeter TaitPaul DalzielPaul Rutherford
Research Report No. 333 May 2015
ii
Research to improve decisions and outcomes in agribusiness, resource,
environmental, and social issues.
The Agribusiness and Economics Research Unit (AERU) operates from Lincoln University providing
research expertise for a wide range of organisations. AERU research focuses on agribusiness, resource,
environment, and social issues.
Founded as the Agricultural Economics Research Unit in 1962 the AERU has evolved to become an
independent, major source of business and economic research expertise.
The Agribusiness and Economics Research Unit (AERU) has four main areas of focus. These areas are
trade and environment; economic development; non-market valuation, and social research.
Research clients include Government Departments, both within New Zealand and from other countries,
international agencies, New Zealand companies and organisations, individuals and farmers.
MISSION
To exercise leadership in research for sustainable well-being
VISION
The AERU is a cheerful and vibrant workplace where senior and emerging researchers are working
together to produce and deliver new knowledge that promotes sustainable well-being
AIMS
To be recognised by our peers and end-users as research leaders for sustainable well-being
To mentor emerging researchers and provide advanced education to postgraduate students
To maintain strong networks to guide AERU research efforts and to help disseminate its research
findings
To contribute to the University’s financial targets as agreed in the AERU business model
DISCLAIMER
While every effort has been made to ensure that the information herein is accurate, the AERU does not
accept any liability for error of fact or opinion which may be present, nor for the consequences of any
decision based on this information.
A summary of AERU Research Reports, beginning with #254, are available at the AERU website
www.lincoln.ac.nz/aeru
Printed copies of AERU Research Reports are available from the Secretary.
Information contained in AERU Research Reports may be reproduced, providing credit is given and a
copy of the reproduced text is sent to the AERU.
iii
Consumer Attitudes to New Zealand Food Product
Attributes and Technology Use in Key International
Markets
Caroline Saunders
Meike Guenther
Tim Driver
Peter Tait
Paul Dalziel
Paul Rutherford
Research Report No. 333
May 2015
Agribusiness and Economics Research Unit
P O Box 85084
Lincoln University
Lincoln 7647
Christchurch
New Zealand
Ph: (64) (3) 423 0372
www.lincoln.ac.nz/AERU
ISSN 1170-7682 (Print)
ISSN 2230-3179 (Online)
ISBN 978-1-877519-36-9

iv
v
Table of Contents
LIST OF FIGURES vii
INTRODUCTION 1
METHODOLOGY 3
2.1 Sampling method 3
2.2 Survey method 4
IMPORTANCE OF ATTRIBUTES 7
3.1 Importance of base attributes 7
IMPORTANCE OF FACTORS IN RELATION TO FOOD
SAFETY, ENVIRONMENTAL QUALITY, ANIMAL WELFARE AND
HEALTH FOOD 9
4.1 Food safety 9
4.2 Environmental quality 14
4.3 Animal welfare 19
4.4 Health foods 24
4.5 Perceptions of New Zealand 30
ONLINE SHOPPING, SOCIAL MEDIA, MOBILE AND OTHER
TECHNOLOGY USE 33
CONCLUSION 41
REFERENCES 45
APPENDIX 1 SOCIAL MEDIA FIGURES 47
APPENDIX 2 DEMOGRAPHICS 51

vi
vii
List of Figures
Figure 3.1: Importance of quality, price and fair trade attributes when shopping 7
Figure 3.2: Importance of animal welfare, environmental quality, health food and food
safety attributes when shopping 8
Figure 4.1: Importance of hygiene standards, rates of contamination and traceability in
relation to food safety 9
Figure 4.2: Importance of private certification, government certification and labelling of
“use by date” in relation to food safety 10
Figure 4.3: Importance of barn-raised animals, type of feed and animal welfare in relation
to food safety 11
Figure 4.4: Importance of reduced use of pesticides, organic production, GM-free and
number of additives in relation to food safety 12
Figure 4.5: Importance of environmental quality and low input agriculture in relation to
food safety 13
Figure 4.6: Importance of freshness, brand and country of origin in relation to food safety 13
Figure 4.7: Importance of water quality, protection of wetlands and protection of coastal
and sea-life in relation to environmental quality 15
Figure 4.8: Importance of protection of endangered plants and animals, native biodiversity
and non-native biodiversity in relation to environmental quality 16
Figure 4.9: Importance of air quality and greenhouse gas (GHG) emissions in relation to
environmental quality 17
Figure 4.10: Importance of organic production, low input agriculture and recycling in
relation to environmental quality 18
Figure 4.11: Importance of open spaces and wilderness in relation to environmental quality 19
Figure 4.12: Importance of good quality of life, good shelter and living conditions and
certification in relation to animal welfare 20
Figure 4.13: Importance of well-fed animals and type of feed in relation to animal welfare 21
Figure 4.14: Importance of no cruelty and humane slaughter in relation to animal welfare 22
Figure 4.15: Importance of free range, natural conditions and barn-raised in relation to
animal welfare 23
Figure 4.16: Importance of digestive health and detoxification in relation to health foods 24
Figure 4.17: Importance of beauty and skin benefits in relation to health foods 25
Figure 4.18: Importance of heart health, blood health and bone and joint health in relation
to health foods 26
Figure 4.19: Importance of pregnancy, child health and baby health in relation to health
foods 27
Figure 4.20: Importance of energy and endurance, weight management and cholesterol in
relation to health foods 28
Figure 4.21: Importance of memory and immune system in relation to health foods 29
Figure 4.22: Importance of country of origin and brand in relation to health foods 30
Figure 5.1: Percentage of shopping done online (by type) 33
Figure 5.2: Reasons for shopping online 34
Figure 5.3: Type of mobile device owned 36
viii
Figure 5.4: Mobile apps used for food information retrieval 37
Figure 5.5: The use of mobile devices in food purchasing (by frequency) 37
Figure 5.6: Mobile use in conjunction with barcodes and/or QR codes 38
Figure 5.7: Experience(s) with QR code use 39
Figure 5.8: Use of RFID technology 39
1
Introduction
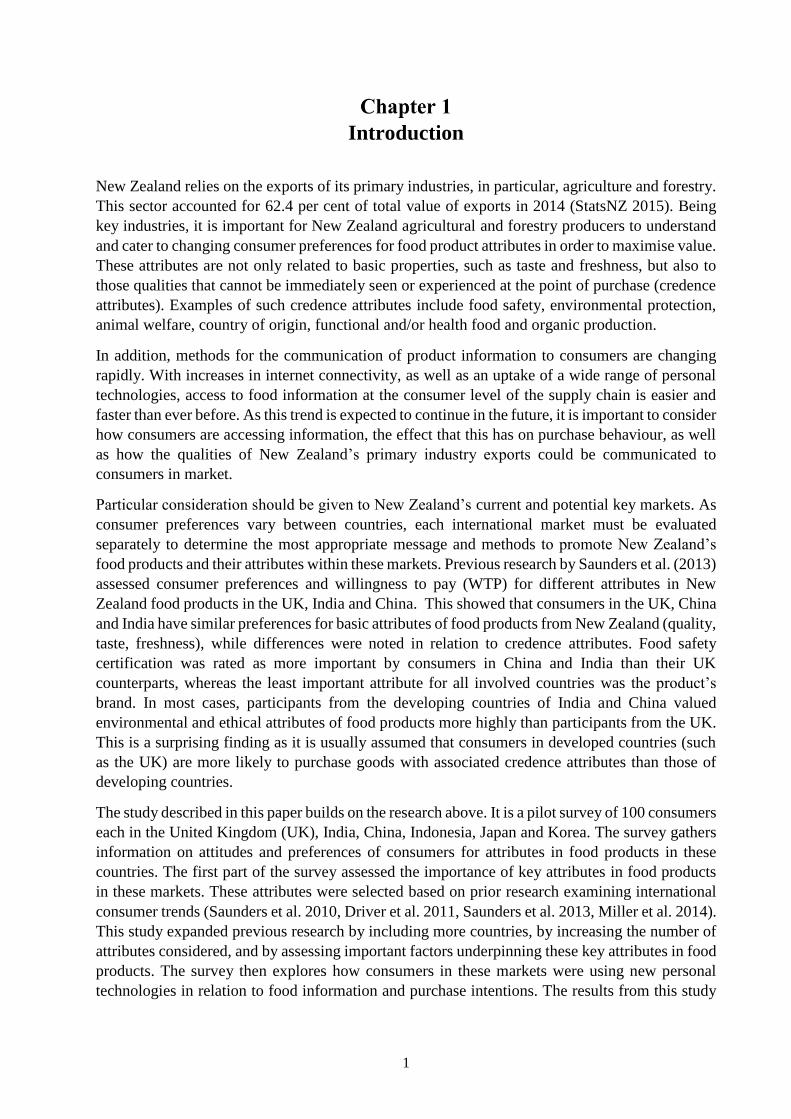
New Zealand relies on the exports of its primary industries, in particular, agriculture and forestry.
This sector accounted for 62.4 per cent of total value of exports in 2014 (StatsNZ 2015). Being
key industries, it is important for New Zealand agricultural and forestry producers to understand
and cater to changing consumer preferences for food product attributes in order to maximise value.
These attributes are not only related to basic properties, such as taste and freshness, but also to
those qualities that cannot be immediately seen or experienced at the point of purchase (credence
attributes). Examples of such credence attributes include food safety, environmental protection,
animal welfare, country of origin, functional and/or health food and organic production.
In addition, methods for the communication of product information to consumers are changing
rapidly. With increases in internet connectivity, as well as an uptake of a wide range of personal
technologies, access to food information at the consumer level of the supply chain is easier and
faster than ever before. As this trend is expected to continue in the future, it is important to consider
how consumers are accessing information, the effect that this has on purchase behaviour, as well
as how the qualities of New Zealand’s primary industry exports could be communicated to
consumers in market.
Particular consideration should be given to New Zealand’s current and potential key markets. As
consumer preferences vary between countries, each international market must be evaluated
separately to determine the most appropriate message and methods to promote New Zealand’s
food products and their attributes within these markets. Previous research by Saunders et al. (2013)
assessed consumer preferences and willingness to pay (WTP) for different attributes in New
Zealand food products in the UK, India and China. This showed that consumers in the UK, China
and India have similar preferences for basic attributes of food products from New Zealand (quality,
taste, freshness), while differences were noted in relation to credence attributes. Food safety
certification was rated as more important by consumers in China and India than their UK
counterparts, whereas the least important attribute for all involved countries was the product’s
brand. In most cases, participants from the developing countries of India and China valued
environmental and ethical attributes of food products more highly than participants from the UK.
This is a surprising finding as it is usually assumed that consumers in developed countries (such
as the UK) are more likely to purchase goods with associated credence attributes than those of
developing countries.
The study described in this paper builds on the research above. It is a pilot survey of 100 consumers
each in the United Kingdom (UK), India, China, Indonesia, Japan and Korea. The survey gathers
information on attitudes and preferences of consumers for attributes in food products in these
countries. The first part of the survey assessed the importance of key attributes in food products
in these markets. These attributes were selected based on prior research examining international
consumer trends (Saunders et al. 2010, Driver et al. 2011, Saunders et al. 2013, Miller et al. 2014).
This study expanded previous research by including more countries, by increasing the number of
attributes considered, and by assessing important factors underpinning these key attributes in food
products. The survey then explores how consumers in these markets were using new personal
technologies in relation to food information and purchase intentions. The results from this study
2
are aimed to better inform New Zealand’s export industries, allowing for enhanced value garnered
throughout the value chain. A full survey will take place in 2015.
This study is also part of a wider research programme “Maximising Export Returns (MER)”, a
Ministry of Business, Innovation and Enterprise (MBIE) funded three-year project undertaken by
the Agribusiness and Economics Research Unit (AERU) at Lincoln University. This project aims
to explore how export firms can capture price premiums by including and communicating
credence attributes in products for overseas markets.
3
Methodology
2.1 Sampling method
The overall aim of the project was to explore consumer preferences toward selected key credence
attributes in food, beverage, and other products in China, India, Indonesia, Japan, Korea and the
UK. The targeted consumer groups were the middle and upper class consumers who are expected
to be more likely to be willing to pay a premium for these attributes, thus informing New Zealand
industries of possible opportunities for maximising their export returns. Therefore, the focus was
on sampling the population of interest, and not a non-probabilistic sampling in order to provide a
representative sample of the whole population.
In surveys, different methods can be used to obtain a sample of consumers. In probabilistic
sampling, theoretically, each person of the target population would be included in the sampling
frame. Statistical methods enable testing of the sample representation, if data relating to the sample
population and the total population characteristics exists – hence sampling error can be estimated
(Dillman et al. 2009). Common methods to obtain random samples include telephone and/or mail
surveys (Dillman et al. 2009). In recent years, internet surveys have become increasingly popular.
However, obtaining a probabilistic sample in internet surveys can be more challenging compared
to more traditional methods. In internet surveys, online panels are commonly used (Callegaro et
al. 2014a). These are considered as non-probabilistic/non-random sampling methods as, by
definition, not all members of the population have access to the internet while these panels are
also likely to include people who are more frequent and experienced internet users (Callegaro et
al. 2014b; Callegaro and Krosnick 2014). A disadvantage of non-probabilistic sampling methods
is that they do not satisfy the classic conditions of probability sampling where one can make
statistical inferences of representativeness of the general population (Callegaro et al. 2014a). One
solution is to include some auxiliary variables in the survey for which information on the
population distribution is available (Callegaro et al. 2014a). These auxiliary variables can be used
to adjust the sample (e.g. using post-stratification, raking/rim-weighting or propensity scoring) if
this is not representative of the population (Baker and Göritz 2014; Tourangeau et al. 2013), or
setting up sample quotas.
However, the challenge is to retrieve data for these variables. While there is sufficient population
(census) data available for the UK, this is not often the case in many Asian countries which are of
interest in this research project. Across these countries (China, India, Indonesia, Japan, Korea and
the UK), census data availability for particular categories varied. Gender distribution data was
available for all countries, with age distribution data available for all countries except Korea. In
addition, educational attainment data was only available for Indonesia and Korea. However, no
census data was available for income distribution ranges for any of the countries.
The latest census data for each market was available for 2010 for most markets, with 2011 census
data used for India. In contrast, statistics housed within the 2010 Population Census of the People’s
Republic of China was only available on a data disc (to be ordered from the China Statistics Press),
not digitally, and thus was excluded.
4
Another concern in online panels are the “professional” or more experienced survey respondents
and associated concerns about data quality (Hillygus et al. 2014) as these respondents may have
different attitudes, opinions and/or beliefs compared to the less-experienced survey respondents,
rush through the survey focusing on receiving the incentive rather than being serious about the
topic, thus introducing measurement error in the data, and answer strategically in order to avoid
possible follow-up questions.
On the other hand, experienced respondents may be more consistent in their responses and can be
more likely to answer sensitive questions (e.g., on income or race) and therefore improving
validity of the results (Hillygus et al. 2014). Thus, the level of concern including professional
respondents is unclear as the evidence of impact on is inconclusive and it can also be difficult to
identify these respondents. One way to check validity is to exclude “too quick” answers (i.e.,
incentive seekers). Also, constantly selecting “don’t know” options, “straight line” or gibberish in
the open-ended questions answers can be an indication of measurement errors (Baker et al. 2010,
as cited in Hillygus et al. 2014).
2.2 Survey method
This study used an internet survey. Primary data was collected using Qualtrics™, a web-based
survey system. A non-random/non-probabilistic survey panel of consumers in China, India,
Indonesia, Japan, Korea and the United Kingdom was purchased from an international market
research company as a probabilistic sample from these countries would be very difficult.
Respondents were recruited by email. The email included a short description of the study, a link
to start the online survey and instructions to run the survey. Participation was voluntary and each
participant was asked to provide an electronic consent.
As mentioned above, the online panel for each country was provided by a market research
company. The company has offices in different countries worldwide which allowed us an access
to survey consumers in these specific countries of interest. These panels were profiled, broadly
recruited and frequently refreshed. The respondents for each survey were recruited by online
marketing, and if required, the company holds a participation history of every member of the
panel. Each respondent who completes the survey is compensated with a form of retail voucher.
In order to target the sub-population of interest in each country, two screening questions were
used. The screening was enforced at the beginning of the questionnaire rather than in the sampling
process (Callegaro et al. 2014a) thus allowing researchers to be in control of the screening process.
The screening questions included the frequency of grocery shopping (respondents were screened
out if they do not go grocery shopping at least once per month) and awareness of New Zealand
(respondents were screened out if they were not aware of New Zealand).
Quota sampling was used to target the middle and upper class in each country. This is a common
method to ensure a maximum number of respondents from key sub-populations is received
(Callegaro et al. 2014a). These questions included household income and the main occupation of
the chief income earner of the household. In data analysis, the income and occupational
information can be used as an auxiliary weighting variable, if there is difference between the
population of interest and the sample (subject to data availability), to adjust the sample to be
representative of the population of interest.
In addition, the validity of the responses was verified. Respondents were excluded from the final
sample for analysis if they completed the survey in a time that is considered insufficient to allow
5
for adequate consideration of the questions (i.e., respondents just clicked through the survey). This
protocol attempts to maintain data quality by removing respondents who may complete surveys
solely on the basis of receiving the compensation. The time below which respondents were
excluded was determined on a survey-by-survey basis, including an evaluation of the distribution
of completion times by other respondents, and the judgement of the researchers.
In summary, this survey used a specialty panel of sub-population (population of interest) defined
by screening questions and quotas used in this survey. Credibility of results was provided by using
a high-quality international market research company that provides the online panel, non-
probabilistic sampling with screening questions to get a sample of the population of interest,
quotas to refine the distribution of population (to target the middle and upper class consumers),
and data quality checks by excluding the pure incentive seekers of the sample. This method
provided quality-checked data from the population of interest in these specific markets.

6
7
Importance of Attributes
3.1 Importance of base attributes
This research is aimed at examining consumer preferences for attributes in food products in key
international markets. It supports earlier work which showed that developing countries (India,
China, Indonesia) found key attributes in food to be more important than their developed country
counterparts (UK, Japan, Korea). These key attributes were freshness, taste, quality, price, brand,
country of origin, recyclability, animal welfare certification, environmental quality certification,
traceability, organic and GM-free. For this study, the key attributes explored were quality, price,
fair trade, animal welfare, environmental quality, health food and food safety.
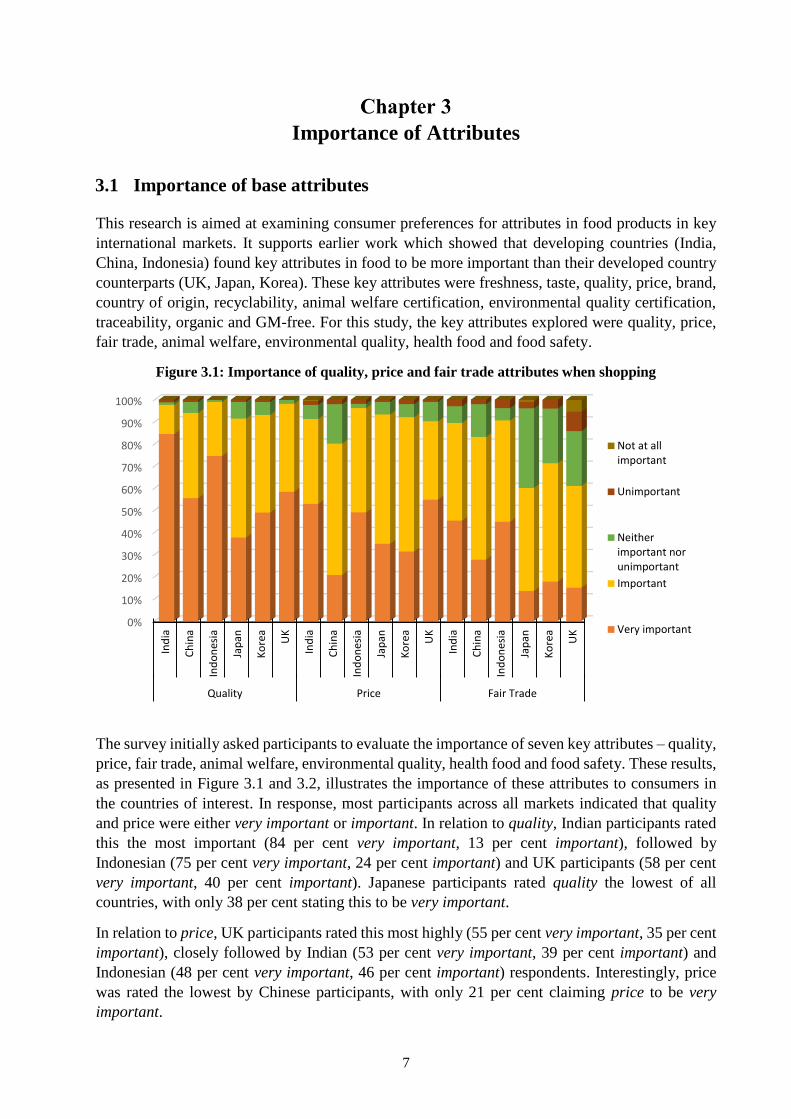
Figure 3.1: Importance of quality, price and fair trade attributes when shopping
The survey initially asked participants to evaluate the importance of seven key attributes – quality,
price, fair trade, animal welfare, environmental quality, health food and food safety. These results,
as presented in Figure 3.1 and 3.2, illustrates the importance of these attributes to consumers in
the countries of interest. In response, most participants across all markets indicated that quality
and price were either very important or important. In relation to quality, Indian participants rated
this the most important (84 per cent very important, 13 per cent important), followed by
Indonesian (75 per cent very important, 24 per cent important) and UK participants (58 per cent
very important, 40 per cent important). Japanese participants rated quality the lowest of all
countries, with only 38 per cent stating this to be very important.
In relation to price, UK participants rated this most highly (55 per cent very important, 35 per cent
important), closely followed by Indian (53 per cent very important, 39 per cent important) and
Indonesian (48 per cent very important, 46 per cent important) respondents. Interestingly, price
was rated the lowest by Chinese participants, with only 21 per cent claiming price to be very
important.
0%
10%
20%
30%
40%
50%
60%
70%
80%
90%
100%
Ind
ia
Ch
ina
Ind
on
esia
Jap
an
Ko
rea
UK
Ind
ia
Ch
ina
Ind
on
esia
Jap
an
Ko
rea
UK
Ind
ia
Ch
ina
Ind
on
esia
Jap
an
Ko
rea
UK
Quality Price Fair Trade
Not at allimportant
Unimportant
Neitherimportant norunimportant
Important
Very important
8
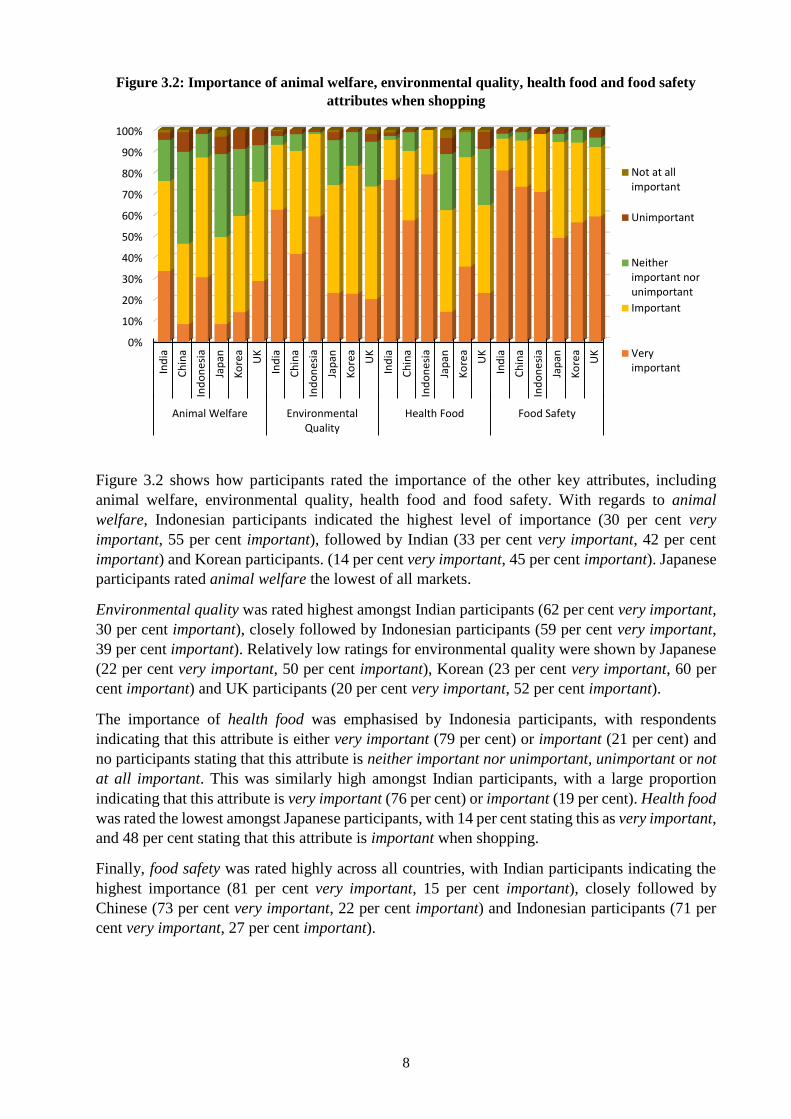
Figure 3.2: Importance of animal welfare, environmental quality, health food and food safety
attributes when shopping
Figure 3.2 shows how participants rated the importance of the other key attributes, including
animal welfare, environmental quality, health food and food safety. With regards to animal
welfare, Indonesian participants indicated the highest level of importance (30 per cent very
important, 55 per cent important), followed by Indian (33 per cent very important, 42 per cent
important) and Korean participants. (14 per cent very important, 45 per cent important). Japanese
participants rated animal welfare the lowest of all markets.
Environmental quality was rated highest amongst Indian participants (62 per cent very important,
30 per cent important), closely followed by Indonesian participants (59 per cent very important,
39 per cent important). Relatively low ratings for environmental quality were shown by Japanese
(22 per cent very important, 50 per cent important), Korean (23 per cent very important, 60 per
cent important) and UK participants (20 per cent very important, 52 per cent important).
The importance of health food was emphasised by Indonesia participants, with respondents
indicating that this attribute is either very important (79 per cent) or important (21 per cent) and
no participants stating that this attribute is neither important nor unimportant, unimportant or not
at all important. This was similarly high amongst Indian participants, with a large proportion
indicating that this attribute is very important (76 per cent) or important (19 per cent). Health food
was rated the lowest amongst Japanese participants, with 14 per cent stating this as very important,
and 48 per cent stating that this attribute is important when shopping.
Finally, food safety was rated highly across all countries, with Indian participants indicating the
highest importance (81 per cent very important, 15 per cent important), closely followed by
Chinese (73 per cent very important, 22 per cent important) and Indonesian participants (71 per
cent very important, 27 per cent important).
0%
10%
20%
30%
40%
50%
60%
70%
80%
90%
100%
Ind
ia
Ch
ina
Ind
on
esia
Jap
an
Ko
rea
UK
Ind
ia
Ch
ina
Ind
on
esia
Jap
an
Ko
rea
UK
Ind
ia
Ch
ina
Ind
on
esia
Jap
an
Ko
rea
UK
Ind
ia
Ch
ina
Ind
on
esia
Jap
an
Ko
rea
UK
Animal Welfare EnvironmentalQuality
Health Food Food Safety
Not at allimportant
Unimportant
Neitherimportant norunimportant
Important
Veryimportant
9
Importance of Factors in Relation to Food Safety, Environmental
Quality, Animal Welfare and Health Food
The pilot survey then examined four of the seven key attributes in more detail and asked how
important other factors were in relation to each of these. These four key attributes were food safety,
environmental quality, animal welfare and health food. Participants were asked to rate the
importance of a range of factors related to each of the four key attributes in order to determine
which factors were most important, with a different set of factors examined for each key attribute.
4.1 Food safety
Firstly, the survey asked participants to consider the importance of factors relating to food safety.
These factors included hygiene standards, rates of contamination, traceability, private and
government certification, labelling of “use by date”, barn-raised animals, type of feed, animal
welfare, reduced use of pesticides, organic production, GM-free, number of additives,
environmental quality, low input agriculture, freshness, brand and country of origin. As
consistently displayed throughout the survey results, participants in developing countries tended
to rate factors attributed to food safety higher than participants within developed countries. The
most important factors within all countries were freshness, labelling of “use by date”, hygiene
standards and rates of contamination, particularly within developing countries.
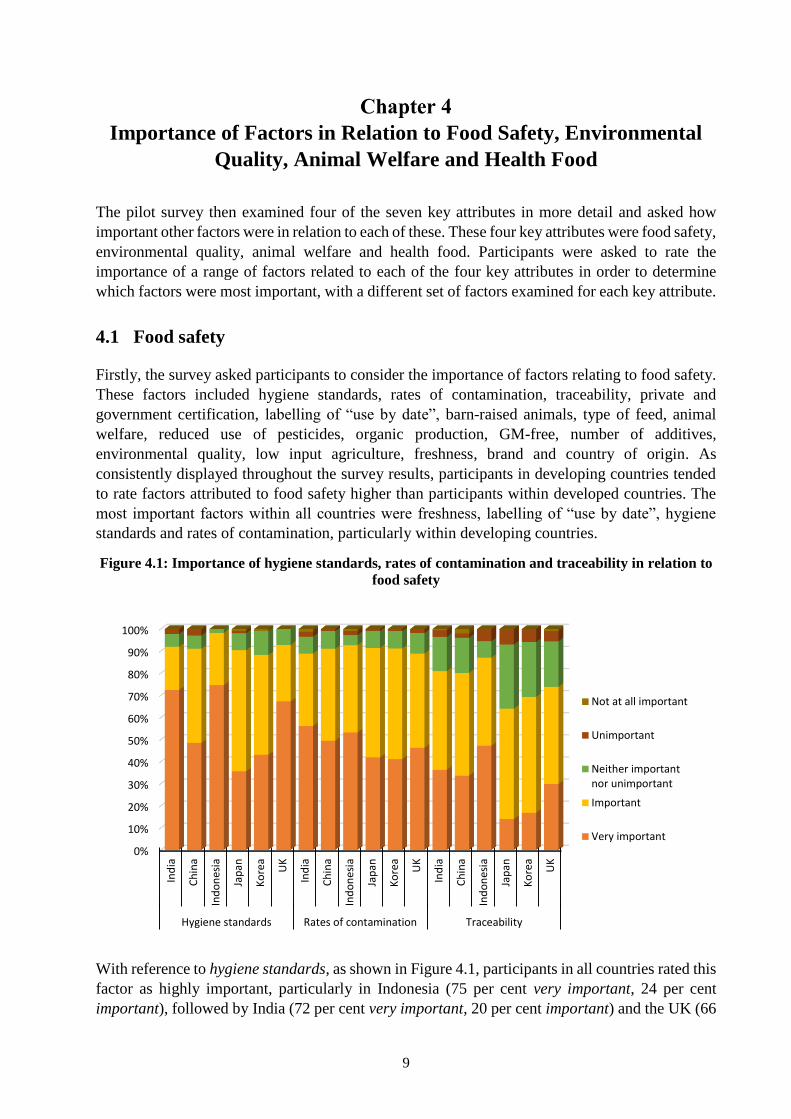
Figure 4.1: Importance of hygiene standards, rates of contamination and traceability in relation to
food safety
With reference to hygiene standards, as shown in Figure 4.1, participants in all countries rated this
factor as highly important, particularly in Indonesia (75 per cent very important, 24 per cent
important), followed by India (72 per cent very important, 20 per cent important) and the UK (66
0%
10%
20%
30%
40%
50%
60%
70%
80%
90%
100%
Ind
ia
Ch
ina
Ind
on
esia
Jap
an
Ko
rea
UK
Ind
ia
Ch
ina
Ind
on
esia
Jap
an
Ko
rea
UK
Ind
ia
Ch
ina
Ind
on
esia
Jap
an
Ko
rea
UK
Hygiene standards Rates of contamination Traceability
Not at all important
Unimportant
Neither importantnor unimportant
Important
Very important
10
per cent very important, 25 per cent important). A similar response pattern was shown by all
countries in relation to rates of contamination. Indian participants showed the highest importance
(55 per cent very important, 32 per cent important), followed by Indonesia (53 per cent very
important, 39 per cent important) and the UK (44 per cent very important, 41 per cent important).
Finally, traceability was rated the highest in relation to food safety amongst developing countries,
with the highest importance indicated by Indonesian participants (47 per cent very important, 40
per cent important), followed by Indian (35 per cent very important, 43 per cent important) and
Chinese participants (34 per cent very important, 47 per cent important). Within developed
countries, this attribute was rated the lowest, particularly by Japanese participants. This may be
due to the existence of effective traceability systems within the supply chains of these markets.
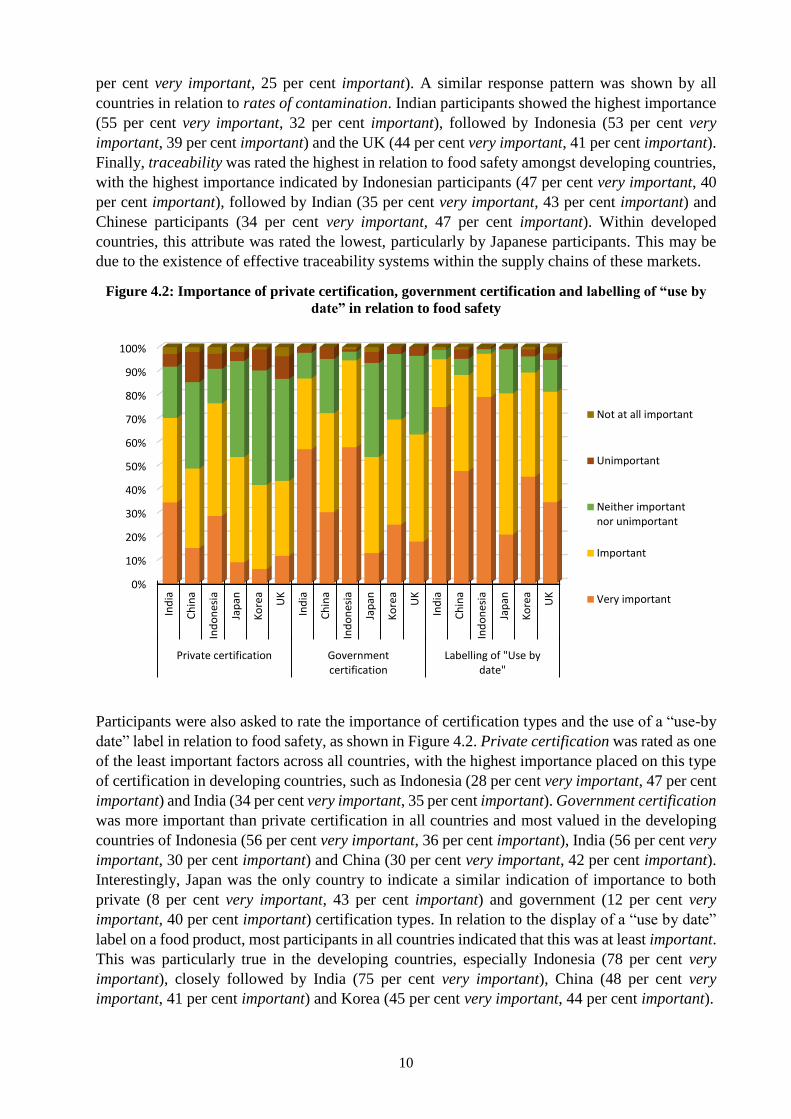
Figure 4.2: Importance of private certification, government certification and labelling of “use by
date” in relation to food safety
Participants were also asked to rate the importance of certification types and the use of a “use-by
date” label in relation to food safety, as shown in Figure 4.2. Private certification was rated as one
of the least important factors across all countries, with the highest importance placed on this type
of certification in developing countries, such as Indonesia (28 per cent very important, 47 per cent
important) and India (34 per cent very important, 35 per cent important). Government certification
was more important than private certification in all countries and most valued in the developing
countries of Indonesia (56 per cent very important, 36 per cent important), India (56 per cent very
important, 30 per cent important) and China (30 per cent very important, 42 per cent important).
Interestingly, Japan was the only country to indicate a similar indication of importance to both
private (8 per cent very important, 43 per cent important) and government (12 per cent very
important, 40 per cent important) certification types. In relation to the display of a “use by date”
label on a food product, most participants in all countries indicated that this was at least important.
This was particularly true in the developing countries, especially Indonesia (78 per cent very
important), closely followed by India (75 per cent very important), China (48 per cent very
important, 41 per cent important) and Korea (45 per cent very important, 44 per cent important).
0%
10%
20%
30%
40%
50%
60%
70%
80%
90%
100%
Ind
ia
Ch
ina
Ind
on
esia
Jap
an
Ko
rea
UK
Ind
ia
Ch
ina
Ind
on
esia
Jap
an
Ko
rea
UK
Ind
ia
Ch
ina
Ind
on
esia
Jap
an
Ko
rea
UK
Private certification Governmentcertification
Labelling of "Use bydate"
Not at all important
Unimportant
Neither importantnor unimportant
Important
Very important
11
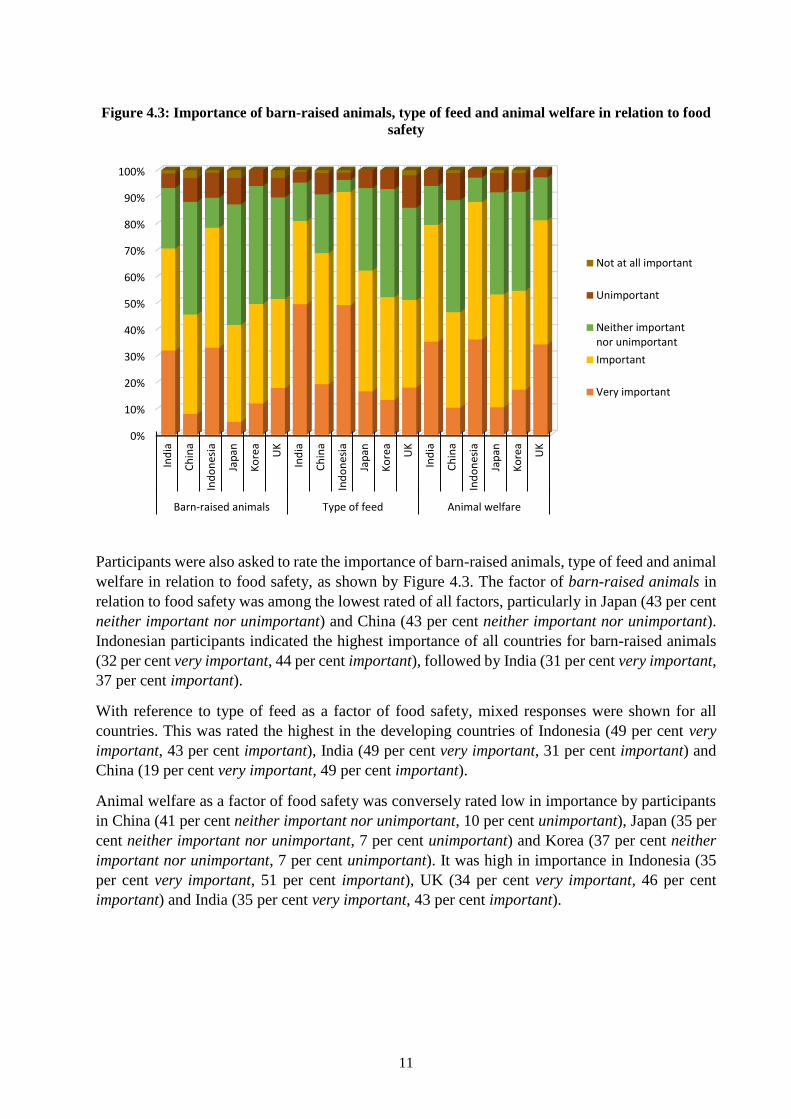
Figure 4.3: Importance of barn-raised animals, type of feed and animal welfare in relation to food
safety
Participants were also asked to rate the importance of barn-raised animals, type of feed and animal
welfare in relation to food safety, as shown by Figure 4.3. The factor of barn-raised animals in
relation to food safety was among the lowest rated of all factors, particularly in Japan (43 per cent
neither important nor unimportant) and China (43 per cent neither important nor unimportant).
Indonesian participants indicated the highest importance of all countries for barn-raised animals
(32 per cent very important, 44 per cent important), followed by India (31 per cent very important,
37 per cent important).
With reference to type of feed as a factor of food safety, mixed responses were shown for all
countries. This was rated the highest in the developing countries of Indonesia (49 per cent very
important, 43 per cent important), India (49 per cent very important, 31 per cent important) and
China (19 per cent very important, 49 per cent important).
Animal welfare as a factor of food safety was conversely rated low in importance by participants
in China (41 per cent neither important nor unimportant, 10 per cent unimportant), Japan (35 per
cent neither important nor unimportant, 7 per cent unimportant) and Korea (37 per cent neither
important nor unimportant, 7 per cent unimportant). It was high in importance in Indonesia (35
per cent very important, 51 per cent important), UK (34 per cent very important, 46 per cent
important) and India (35 per cent very important, 43 per cent important).
0%
10%
20%
30%
40%
50%
60%
70%
80%
90%
100%In
dia
Ch
ina
Ind
on
esia
Jap
an
Ko
rea
UK
Ind
ia
Ch
ina
Ind
on
esia
Jap
an
Ko
rea
UK
Ind
ia
Ch
ina
Ind
on
esia
Jap
an
Ko
rea
UK
Barn-raised animals Type of feed Animal welfare
Not at all important
Unimportant
Neither importantnor unimportant
Important
Very important
12
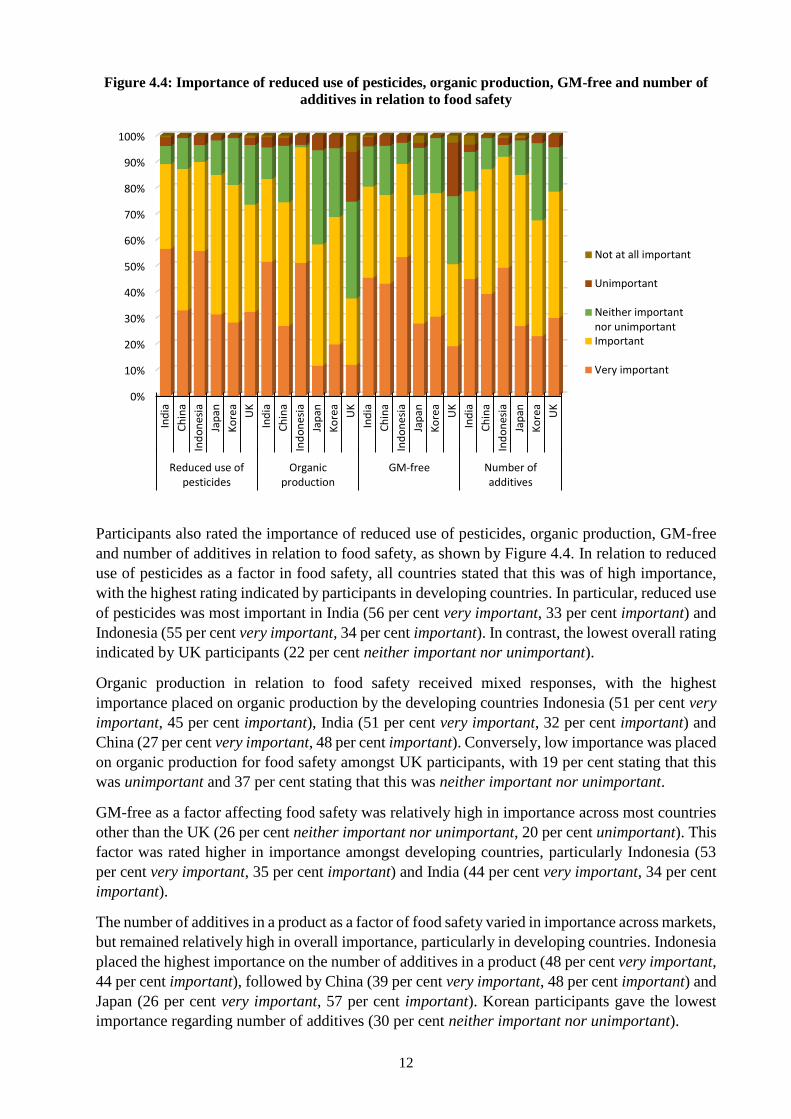
Figure 4.4: Importance of reduced use of pesticides, organic production, GM-free and number of
additives in relation to food safety
Participants also rated the importance of reduced use of pesticides, organic production, GM-free
and number of additives in relation to food safety, as shown by Figure 4.4. In relation to reduced
use of pesticides as a factor in food safety, all countries stated that this was of high importance,
with the highest rating indicated by participants in developing countries. In particular, reduced use
of pesticides was most important in India (56 per cent very important, 33 per cent important) and
Indonesia (55 per cent very important, 34 per cent important). In contrast, the lowest overall rating
indicated by UK participants (22 per cent neither important nor unimportant).
Organic production in relation to food safety received mixed responses, with the highest
importance placed on organic production by the developing countries Indonesia (51 per cent very
important, 45 per cent important), India (51 per cent very important, 32 per cent important) and
China (27 per cent very important, 48 per cent important). Conversely, low importance was placed
on organic production for food safety amongst UK participants, with 19 per cent stating that this
was unimportant and 37 per cent stating that this was neither important nor unimportant.
GM-free as a factor affecting food safety was relatively high in importance across most countries
other than the UK (26 per cent neither important nor unimportant, 20 per cent unimportant). This
factor was rated higher in importance amongst developing countries, particularly Indonesia (53
per cent very important, 35 per cent important) and India (44 per cent very important, 34 per cent
important).
The number of additives in a product as a factor of food safety varied in importance across markets,
but remained relatively high in overall importance, particularly in developing countries. Indonesia
placed the highest importance on the number of additives in a product (48 per cent very important,
44 per cent important), followed by China (39 per cent very important, 48 per cent important) and
Japan (26 per cent very important, 57 per cent important). Korean participants gave the lowest
importance regarding number of additives (30 per cent neither important nor unimportant).
0%
10%
20%
30%
40%
50%
60%
70%
80%
90%
100%
Ind
ia
Ch
ina
Ind
on
esia
Jap
an
Ko
rea
UK
Ind
ia
Ch
ina
Ind
on
esia
Jap
an
Ko
rea
UK
Ind
ia
Ch
ina
Ind
on
esia
Jap
an
Ko
rea
UK
Ind
ia
Ch
ina
Ind
on
esia
Jap
an
Ko
rea
UK
Reduced use ofpesticides
Organicproduction
GM-free Number ofadditives
Not at all important
Unimportant
Neither importantnor unimportantImportant
Very important
13
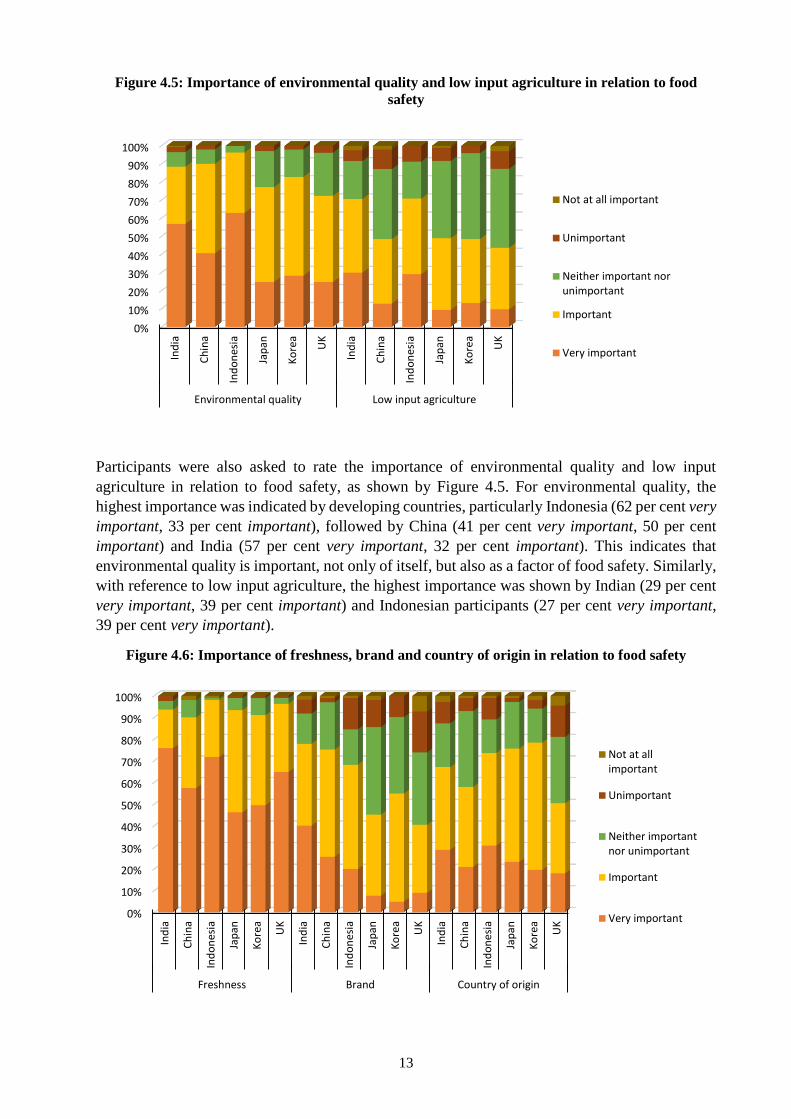
Figure 4.5: Importance of environmental quality and low input agriculture in relation to food
safety
Participants were also asked to rate the importance of environmental quality and low input
agriculture in relation to food safety, as shown by Figure 4.5. For environmental quality, the
highest importance was indicated by developing countries, particularly Indonesia (62 per cent very
important, 33 per cent important), followed by China (41 per cent very important, 50 per cent
important) and India (57 per cent very important, 32 per cent important). This indicates that
environmental quality is important, not only of itself, but also as a factor of food safety. Similarly,
with reference to low input agriculture, the highest importance was shown by Indian (29 per cent
very important, 39 per cent important) and Indonesian participants (27 per cent very important,
39 per cent very important).
Figure 4.6: Importance of freshness, brand and country of origin in relation to food safety
0%
10%
20%
30%
40%
50%
60%
70%
80%
90%
100%
Ind
ia
Ch
ina
Ind
on
esia
Jap
an
Ko
rea
UK
Ind
ia
Ch
ina
Ind
on
esia
Jap
an
Ko
rea
UK
Environmental quality Low input agriculture
Not at all important
Unimportant
Neither important norunimportant
Important
Very important
0%
10%
20%
30%
40%
50%
60%
70%
80%
90%
100%
Ind
ia
Ch
ina
Ind
on
esia
Jap
an
Ko
rea
UK
Ind
ia
Ch
ina
Ind
on
esia
Jap
an
Ko
rea
UK
Ind
ia
Ch
ina
Ind
on
esia
Jap
an
Ko
rea
UK
Freshness Brand Country of origin
Not at allimportant
Unimportant
Neither importantnor unimportant
Important
Very important
14
Participants were also asked to rate the importance of freshness and brand in relation to food
safety, as shown by Figure 4.6. Freshness was rated highly amongst all countries, being highest in
importance in developing countries, particularly in India (76 per cent very important) and
Indonesia (72 per cent very important). In contrast, brand was seen to be among the lowest rated
factors affecting food safety overall, especially within Japan (40 per cent neither important nor
unimportant) and the UK (33 per cent neither important nor unimportant). Brand was rated the
highest by Indian participants (40 per cent very important), yet still low in comparison to other
factors. Country of origin as a factor affecting food safety received mixed response from all
countries, with the importance of this factor rated the highest amongst Korean participants (20 per
cent very important, 59 per cent important), followed by Japanese (23 per cent very important, 52
per cent important) and Indonesian participants (31 per cent very important, 43 per cent
important).
In summary, participants from all surveyed countries rated the factors of freshness, hygiene
standards, rates of contamination and labelling of “use by date” as the most important in relation
to food safety. Furthermore, environmental quality as a factor of food safety was rated highly
amongst participants from developing countries. The least important factors of food safety as
indicated by all countries were low input agriculture, barn-raised animals, brand, animal welfare
and private certification.
4.2 Environmental quality
The survey also asked participants to consider the importance of factors affecting environmental
quality. These factors included water quality, the protection of species and environments (such as
wetlands, coastal and sea-life, endangered plants and animals, and native and non-native
biodiversity), air quality, greenhouse gas emissions, organic production, low input agriculture,
recycling, open spaces and wilderness. Almost consistently, the developing countries considered
all factors to be more important to environmental quality than developed countries.
15
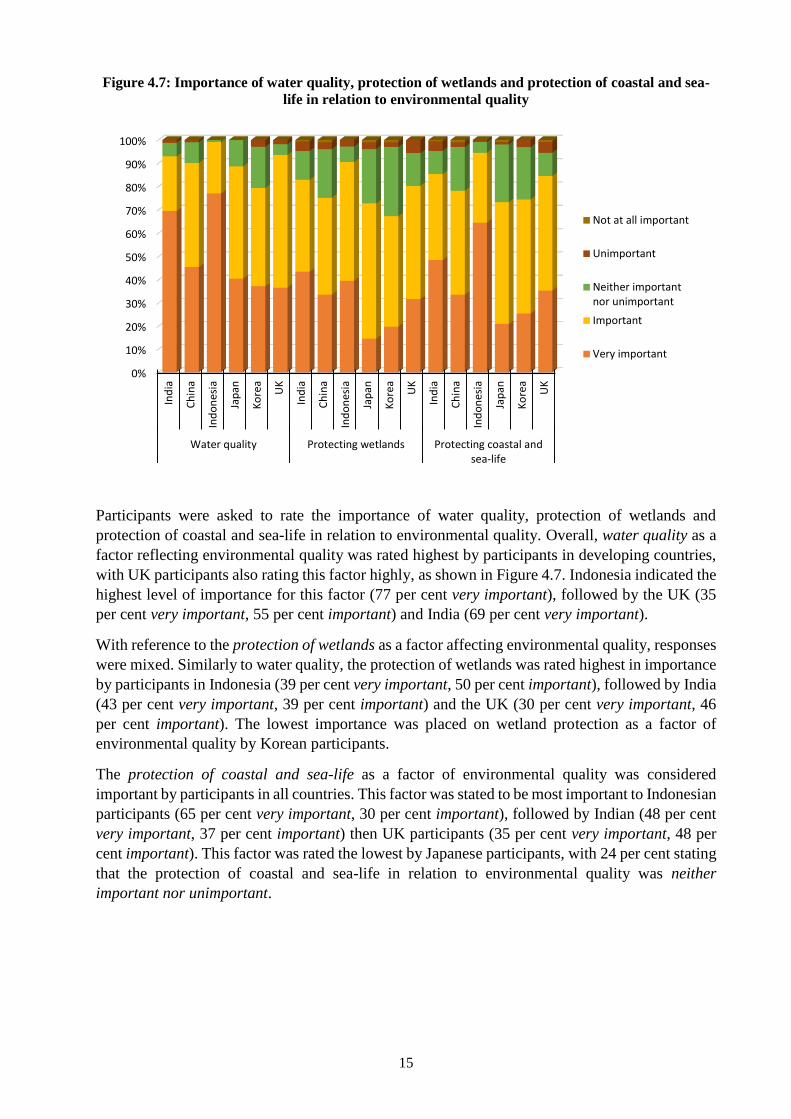
Figure 4.7: Importance of water quality, protection of wetlands and protection of coastal and sea-
life in relation to environmental quality
Participants were asked to rate the importance of water quality, protection of wetlands and
protection of coastal and sea-life in relation to environmental quality. Overall, water quality as a
factor reflecting environmental quality was rated highest by participants in developing countries,
with UK participants also rating this factor highly, as shown in Figure 4.7. Indonesia indicated the
highest level of importance for this factor (77 per cent very important), followed by the UK (35
per cent very important, 55 per cent important) and India (69 per cent very important).
With reference to the protection of wetlands as a factor affecting environmental quality, responses
were mixed. Similarly to water quality, the protection of wetlands was rated highest in importance
by participants in Indonesia (39 per cent very important, 50 per cent important), followed by India
(43 per cent very important, 39 per cent important) and the UK (30 per cent very important, 46
per cent important). The lowest importance was placed on wetland protection as a factor of
environmental quality by Korean participants.
The protection of coastal and sea-life as a factor of environmental quality was considered
important by participants in all countries. This factor was stated to be most important to Indonesian
participants (65 per cent very important, 30 per cent important), followed by Indian (48 per cent
very important, 37 per cent important) then UK participants (35 per cent very important, 48 per
cent important). This factor was rated the lowest by Japanese participants, with 24 per cent stating
that the protection of coastal and sea-life in relation to environmental quality was neither
important nor unimportant.
0%
10%
20%
30%
40%
50%
60%
70%
80%
90%
100%
Ind
ia
Ch
ina
Ind
on
esia
Jap
an
Ko
rea
UK
Ind
ia
Ch
ina
Ind
on
esia
Jap
an
Ko
rea
UK
Ind
ia
Ch
ina
Ind
on
esia
Jap
an
Ko
rea
UK
Water quality Protecting wetlands Protecting coastal andsea-life
Not at all important
Unimportant
Neither importantnor unimportant
Important
Very important
16
Figure 4.8: Importance of protection of endangered plants and animals, native biodiversity and
non-native biodiversity in relation to environmental quality
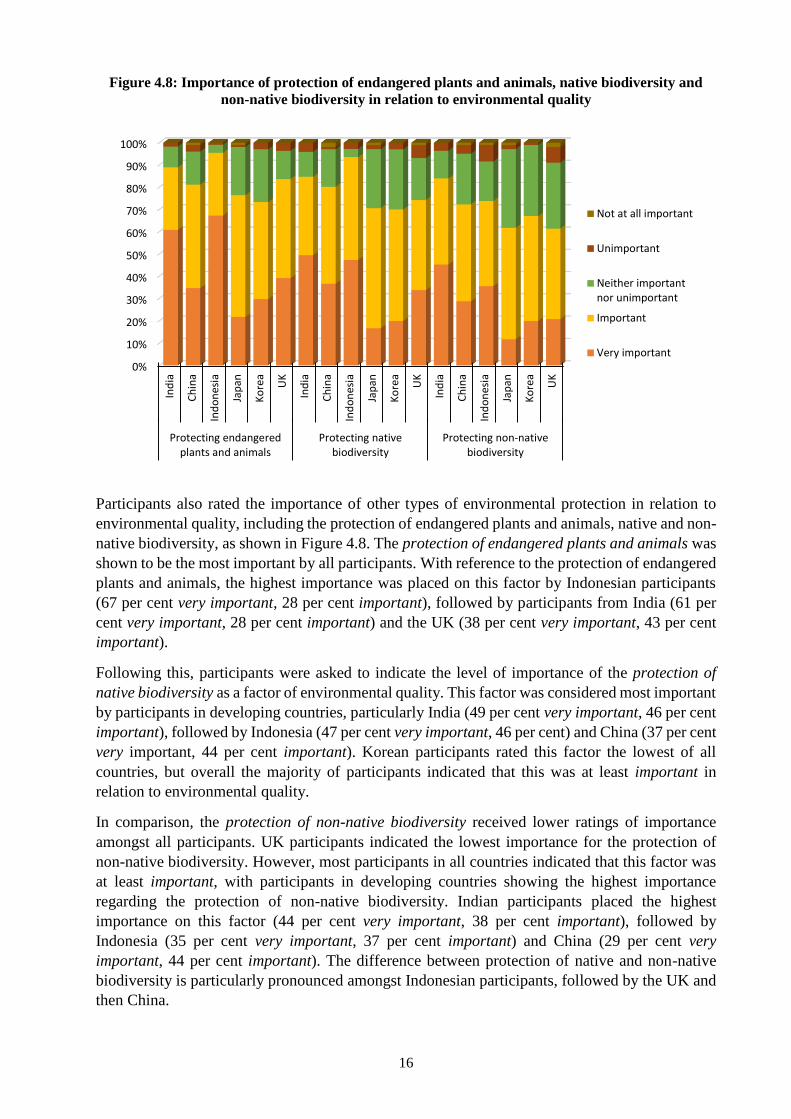
Participants also rated the importance of other types of environmental protection in relation to
environmental quality, including the protection of endangered plants and animals, native and non-
native biodiversity, as shown in Figure 4.8. The protection of endangered plants and animals was
shown to be the most important by all participants. With reference to the protection of endangered
plants and animals, the highest importance was placed on this factor by Indonesian participants
(67 per cent very important, 28 per cent important), followed by participants from India (61 per
cent very important, 28 per cent important) and the UK (38 per cent very important, 43 per cent
important).
Following this, participants were asked to indicate the level of importance of the protection of
native biodiversity as a factor of environmental quality. This factor was considered most important
by participants in developing countries, particularly India (49 per cent very important, 46 per cent
important), followed by Indonesia (47 per cent very important, 46 per cent) and China (37 per cent
very important, 44 per cent important). Korean participants rated this factor the lowest of all
countries, but overall the majority of participants indicated that this was at least important in
relation to environmental quality.
In comparison, the protection of non-native biodiversity received lower ratings of importance
amongst all participants. UK participants indicated the lowest importance for the protection of
non-native biodiversity. However, most participants in all countries indicated that this factor was
at least important, with participants in developing countries showing the highest importance
regarding the protection of non-native biodiversity. Indian participants placed the highest
importance on this factor (44 per cent very important, 38 per cent important), followed by
Indonesia (35 per cent very important, 37 per cent important) and China (29 per cent very
important, 44 per cent important). The difference between protection of native and non-native
biodiversity is particularly pronounced amongst Indonesian participants, followed by the UK and
then China.
0%
10%
20%
30%
40%
50%
60%
70%
80%
90%
100%
Ind
ia
Ch
ina
Ind
on
esia
Jap
an
Ko
rea
UK
Ind
ia
Ch
ina
Ind
on
esia
Jap
an
Ko
rea
UK
Ind
ia
Ch
ina
Ind
on
esia
Jap
an
Ko
rea
UK
Protecting endangeredplants and animals
Protecting nativebiodiversity
Protecting non-nativebiodiversity
Not at all important
Unimportant
Neither importantnor unimportant
Important
Very important
17
Figure 4.9: Importance of air quality and greenhouse gas (GHG) emissions in relation to
environmental quality
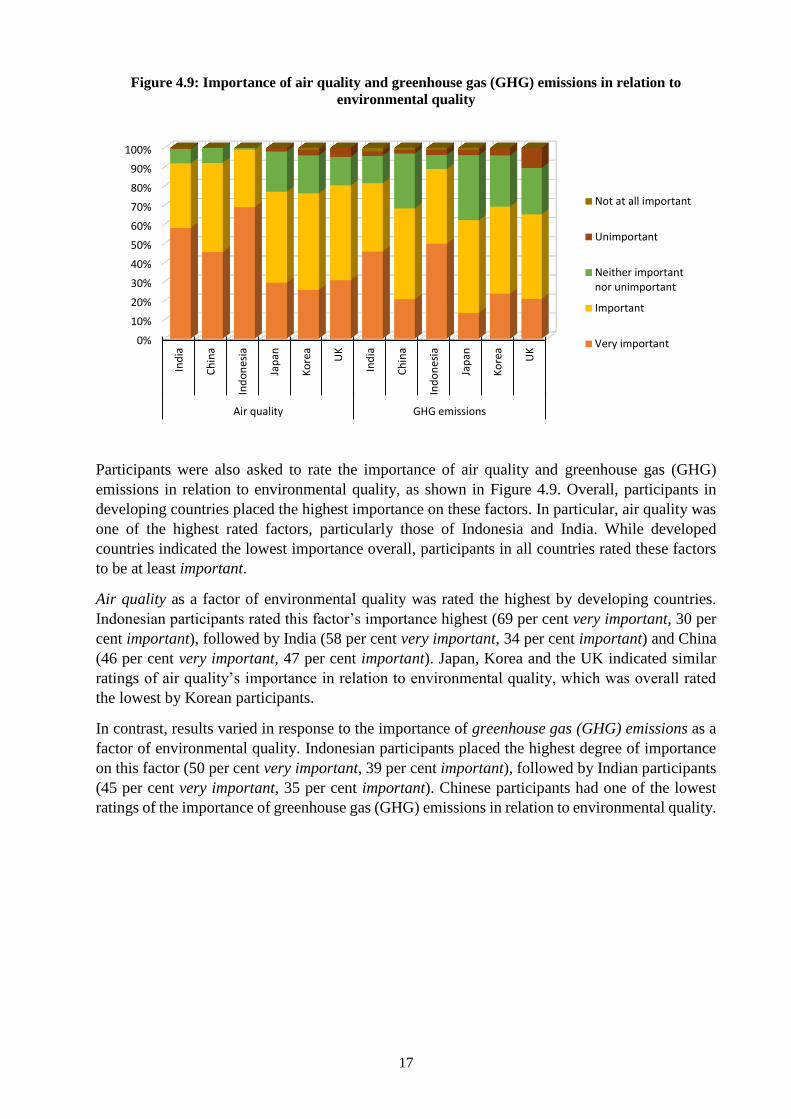
Participants were also asked to rate the importance of air quality and greenhouse gas (GHG)
emissions in relation to environmental quality, as shown in Figure 4.9. Overall, participants in
developing countries placed the highest importance on these factors. In particular, air quality was
one of the highest rated factors, particularly those of Indonesia and India. While developed
countries indicated the lowest importance overall, participants in all countries rated these factors
to be at least important.
Air quality as a factor of environmental quality was rated the highest by developing countries.
Indonesian participants rated this factor’s importance highest (69 per cent very important, 30 per
cent important), followed by India (58 per cent very important, 34 per cent important) and China
(46 per cent very important, 47 per cent important). Japan, Korea and the UK indicated similar
ratings of air quality’s importance in relation to environmental quality, which was overall rated
the lowest by Korean participants.
In contrast, results varied in response to the importance of greenhouse gas (GHG) emissions as a
factor of environmental quality. Indonesian participants placed the highest degree of importance
on this factor (50 per cent very important, 39 per cent important), followed by Indian participants
(45 per cent very important, 35 per cent important). Chinese participants had one of the lowest
ratings of the importance of greenhouse gas (GHG) emissions in relation to environmental quality.
0%
10%
20%
30%
40%
50%
60%
70%
80%
90%
100%
Ind
ia
Ch
ina
Ind
on
esia
Jap
an
Ko
rea
UK
Ind
ia
Ch
ina
Ind
on
esia
Jap
an
Ko
rea
UK
Air quality GHG emissions
Not at all important
Unimportant
Neither importantnor unimportant
Important
Very important
18
Figure 4.10: Importance of organic production, low input agriculture and recycling in relation to
environmental quality
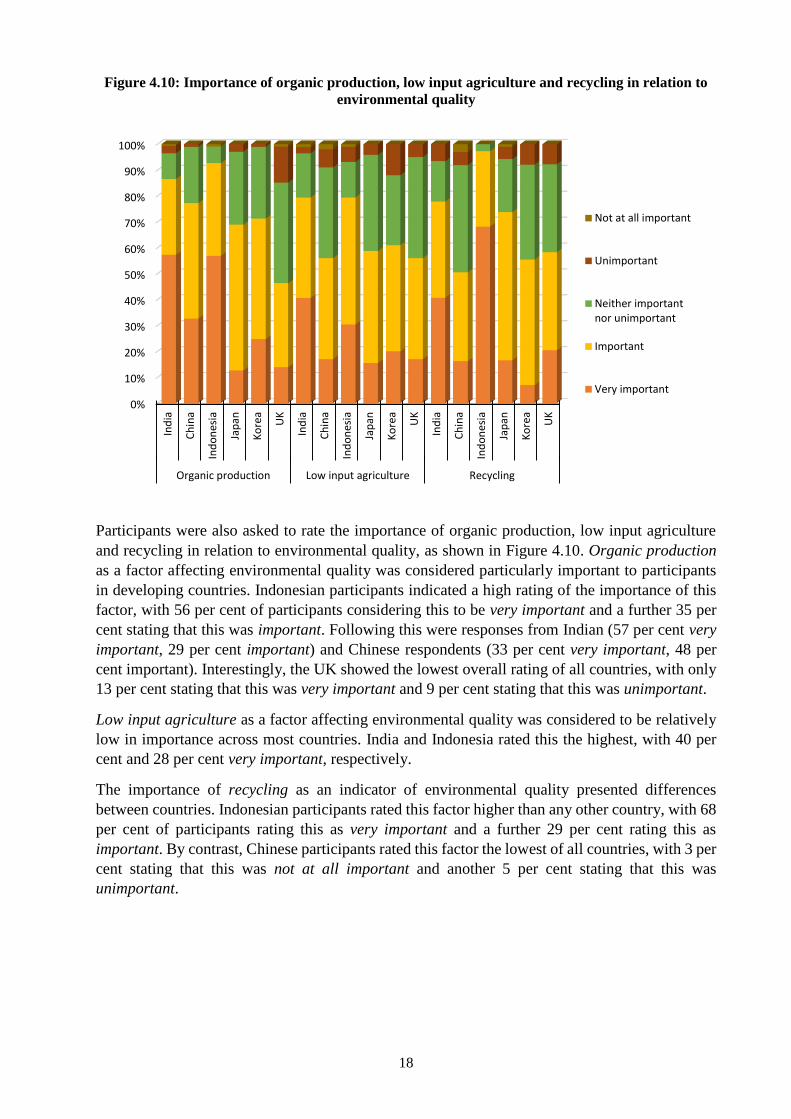
Participants were also asked to rate the importance of organic production, low input agriculture
and recycling in relation to environmental quality, as shown in Figure 4.10. Organic production
as a factor affecting environmental quality was considered particularly important to participants
in developing countries. Indonesian participants indicated a high rating of the importance of this
factor, with 56 per cent of participants considering this to be very important and a further 35 per
cent stating that this was important. Following this were responses from Indian (57 per cent very
important, 29 per cent important) and Chinese respondents (33 per cent very important, 48 per
cent important). Interestingly, the UK showed the lowest overall rating of all countries, with only
13 per cent stating that this was very important and 9 per cent stating that this was unimportant.
Low input agriculture as a factor affecting environmental quality was considered to be relatively
low in importance across most countries. India and Indonesia rated this the highest, with 40 per
cent and 28 per cent very important, respectively.
The importance of recycling as an indicator of environmental quality presented differences
between countries. Indonesian participants rated this factor higher than any other country, with 68
per cent of participants rating this as very important and a further 29 per cent rating this as
important. By contrast, Chinese participants rated this factor the lowest of all countries, with 3 per
cent stating that this was not at all important and another 5 per cent stating that this was
unimportant.
0%
10%
20%
30%
40%
50%
60%
70%
80%
90%
100%
Ind
ia
Ch
ina
Ind
on
esia
Jap
an
Ko
rea
UK
Ind
ia
Ch
ina
Ind
on
esia
Jap
an
Ko
rea
UK
Ind
ia
Ch
ina
Ind
on
esia
Jap
an
Ko
rea
UK
Organic production Low input agriculture Recycling
Not at all important
Unimportant
Neither importantnor unimportant
Important
Very important

19
Figure 4.11: Importance of open spaces and wilderness in relation to environmental quality
Participants were also asked to rate the importance of open spaces and wilderness in relation to
environmental quality, as shown in Figure 4.11. It can be seen that results varied across countries.
Indonesian participants indicated the highest level of importance for open spaces as a factor
affecting environmental quality (47 per cent very important, 42 per cent important), followed by
Indian (49 per cent very important, 36 per cent important) and UK participants (22 per cent very
important, 50 per cent important). Koreans indicated the lowest overall importance, with 43 per
cent of participants stating that this factor was neither important nor unimportant in considering
environmental quality.
Finally, participants were asked to indicate the importance of wilderness as a factor of
environmental quality. Indonesian (47 per cent very important, 42 per cent important) and Indian
(49 per cent very important, 38 per cent important) participants showed the highest level of
importance in relation to this factor, followed by UK participants (37 per cent very important, 47
per cent important). Chinese, Japanese and Korean participants indicated similar responses, and
overall all countries showed that this factor was at least important.
To summarise, all countries surveyed rated the factors of water quality, air quality, protection of
endangered animals and plants, as well as coastal and sea-life, as the most important in relation to
environmental quality. The least important factors affecting environmental quality as indicated by
most countries were recycling, low input agriculture, GHG emissions, open spaces and the
protection of non-native biodiversity.
4.3 Animal welfare
In the next question, participants were asked about the importance of factors affecting animal
welfare. These factors included good quality of life, good shelter and living conditions,
certification, adequate diets, type of feed, no cruelty, humane slaughter, free range, natural
conditions and barn-raised animals.
0%
10%
20%
30%
40%
50%
60%
70%
80%
90%
100%
Ind
ia
Ch
ina
Ind
on
esia
Jap
an
Ko
rea
UK
Ind
ia
Ch
ina
Ind
on
esia
Jap
an
Ko
rea
UK
Open spaces Wilderness
Not at all important
Unimportant
Neither importantnor unimportant
Important
Very important
20
Figure 4.12: Importance of good quality of life, good shelter and living conditions and certification
in relation to animal welfare
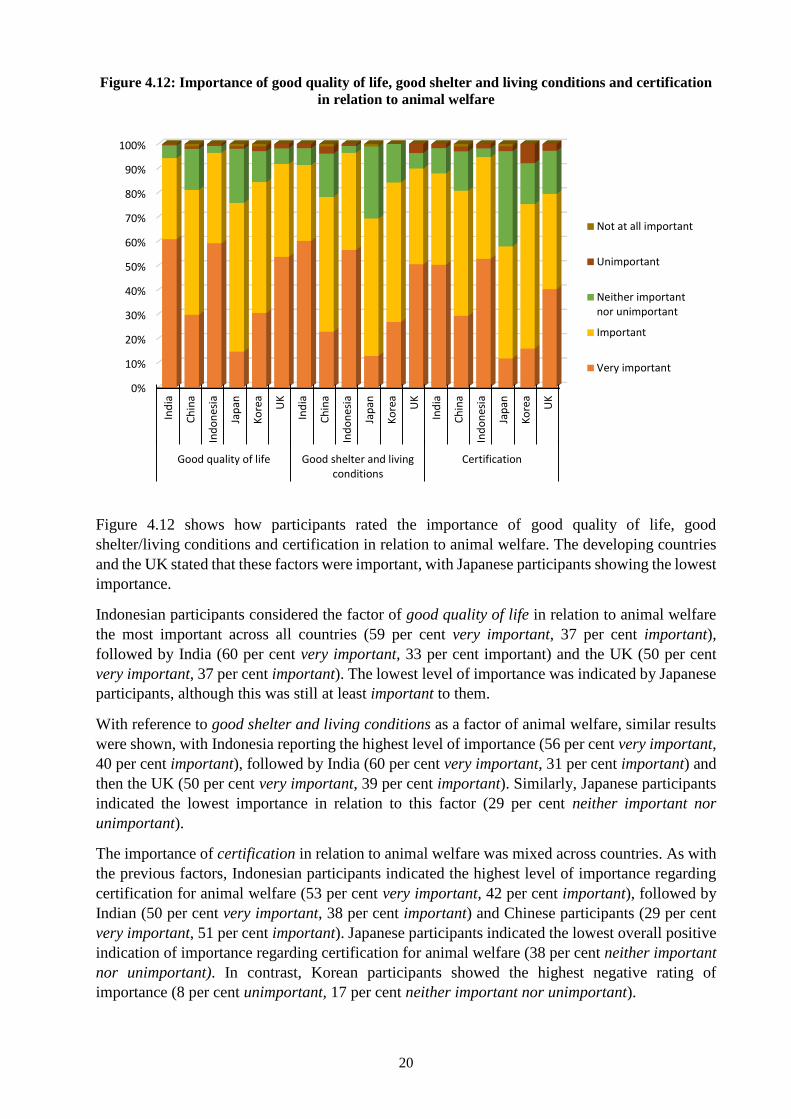
Figure 4.12 shows how participants rated the importance of good quality of life, good
shelter/living conditions and certification in relation to animal welfare. The developing countries
and the UK stated that these factors were important, with Japanese participants showing the lowest
importance.
Indonesian participants considered the factor of good quality of life in relation to animal welfare
the most important across all countries (59 per cent very important, 37 per cent important),
followed by India (60 per cent very important, 33 per cent important) and the UK (50 per cent
very important, 37 per cent important). The lowest level of importance was indicated by Japanese
participants, although this was still at least important to them.
With reference to good shelter and living conditions as a factor of animal welfare, similar results
were shown, with Indonesia reporting the highest level of importance (56 per cent very important,
40 per cent important), followed by India (60 per cent very important, 31 per cent important) and
then the UK (50 per cent very important, 39 per cent important). Similarly, Japanese participants
indicated the lowest importance in relation to this factor (29 per cent neither important nor
unimportant).
The importance of certification in relation to animal welfare was mixed across countries. As with
the previous factors, Indonesian participants indicated the highest level of importance regarding
certification for animal welfare (53 per cent very important, 42 per cent important), followed by
Indian (50 per cent very important, 38 per cent important) and Chinese participants (29 per cent
very important, 51 per cent important). Japanese participants indicated the lowest overall positive
indication of importance regarding certification for animal welfare (38 per cent neither important
nor unimportant). In contrast, Korean participants showed the highest negative rating of
importance (8 per cent unimportant, 17 per cent neither important nor unimportant).
0%
10%
20%
30%
40%
50%
60%
70%
80%
90%
100%
Ind
ia
Ch
ina
Ind
on
esia
Jap
an
Ko
rea
UK
Ind
ia
Ch
ina
Ind
on
esia
Jap
an
Ko
rea
UK
Ind
ia
Ch
ina
Ind
on
esia
Jap
an
Ko
rea
UK
Good quality of life Good shelter and livingconditions
Certification
Not at all important
Unimportant
Neither importantnor unimportant
Important
Very important
21
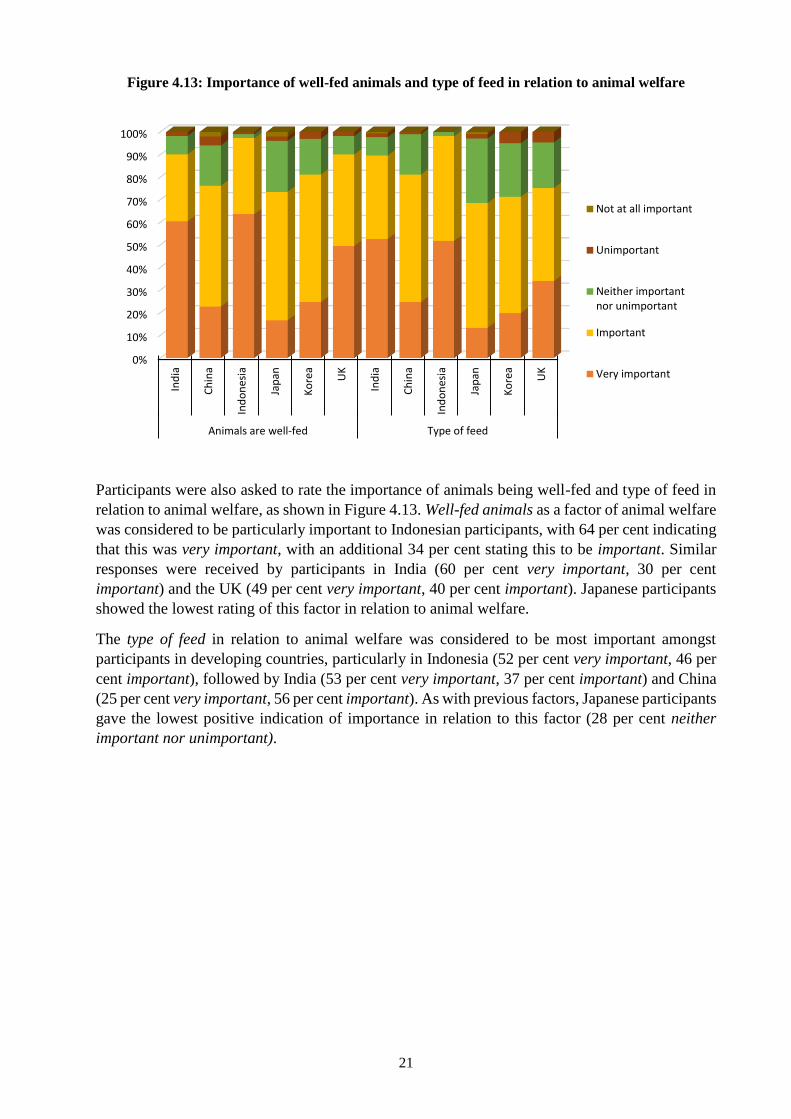
Figure 4.13: Importance of well-fed animals and type of feed in relation to animal welfare
Participants were also asked to rate the importance of animals being well-fed and type of feed in
relation to animal welfare, as shown in Figure 4.13. Well-fed animals as a factor of animal welfare
was considered to be particularly important to Indonesian participants, with 64 per cent indicating
that this was very important, with an additional 34 per cent stating this to be important. Similar
responses were received by participants in India (60 per cent very important, 30 per cent
important) and the UK (49 per cent very important, 40 per cent important). Japanese participants
showed the lowest rating of this factor in relation to animal welfare.
The type of feed in relation to animal welfare was considered to be most important amongst
participants in developing countries, particularly in Indonesia (52 per cent very important, 46 per
cent important), followed by India (53 per cent very important, 37 per cent important) and China
(25 per cent very important, 56 per cent important). As with previous factors, Japanese participants
gave the lowest positive indication of importance in relation to this factor (28 per cent neither
important nor unimportant).
0%
10%
20%
30%
40%
50%
60%
70%
80%
90%
100%
Ind
ia
Ch
ina
Ind
on
esia
Jap
an
Ko
rea
UK
Ind
ia
Ch
ina
Ind
on
esia
Jap
an
Ko
rea
UK
Animals are well-fed Type of feed
Not at all important
Unimportant
Neither importantnor unimportant
Important
Very important
22
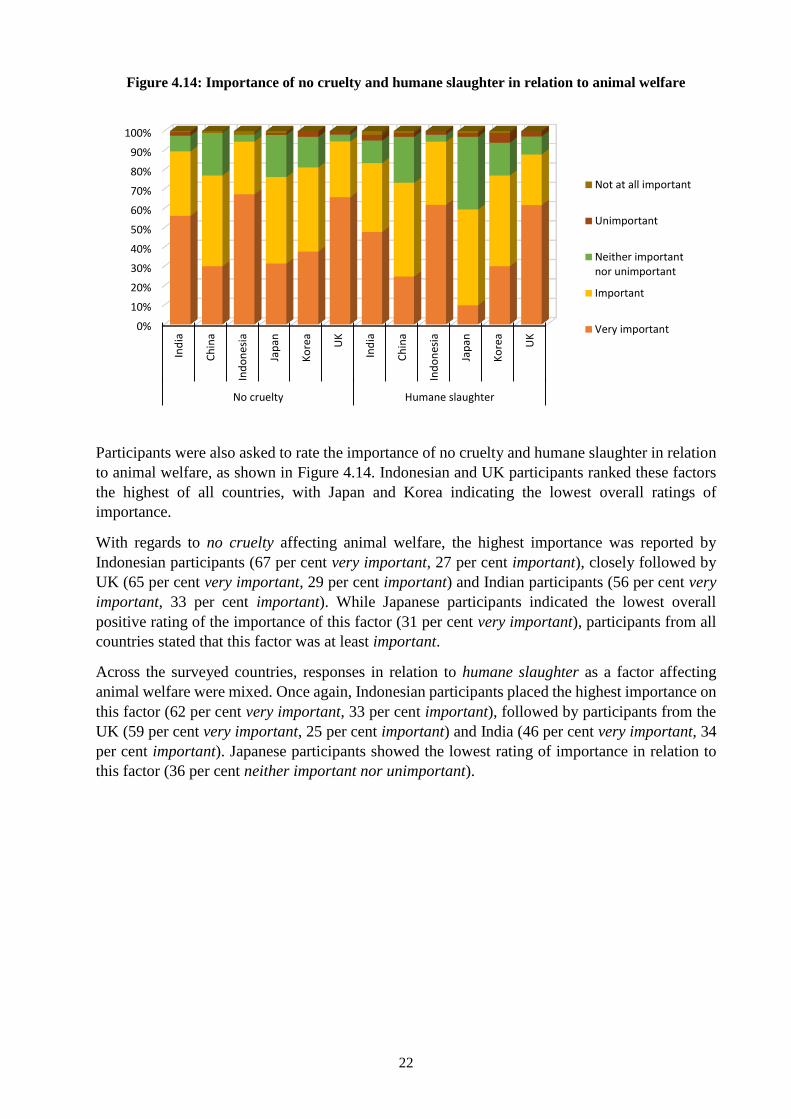
Figure 4.14: Importance of no cruelty and humane slaughter in relation to animal welfare
Participants were also asked to rate the importance of no cruelty and humane slaughter in relation
to animal welfare, as shown in Figure 4.14. Indonesian and UK participants ranked these factors
the highest of all countries, with Japan and Korea indicating the lowest overall ratings of
importance.
With regards to no cruelty affecting animal welfare, the highest importance was reported by
Indonesian participants (67 per cent very important, 27 per cent important), closely followed by
UK (65 per cent very important, 29 per cent important) and Indian participants (56 per cent very
important, 33 per cent important). While Japanese participants indicated the lowest overall
positive rating of the importance of this factor (31 per cent very important), participants from all
countries stated that this factor was at least important.
Across the surveyed countries, responses in relation to humane slaughter as a factor affecting
animal welfare were mixed. Once again, Indonesian participants placed the highest importance on
this factor (62 per cent very important, 33 per cent important), followed by participants from the
UK (59 per cent very important, 25 per cent important) and India (46 per cent very important, 34
per cent important). Japanese participants showed the lowest rating of importance in relation to
this factor (36 per cent neither important nor unimportant).
0%
10%
20%
30%
40%
50%
60%
70%
80%
90%
100%
Ind
ia
Ch
ina
Ind
on
esia
Jap
an
Ko
rea
UK
Ind
ia
Ch
ina
Ind
on
esia
Jap
an
Ko
rea
UK
No cruelty Humane slaughter
Not at all important
Unimportant
Neither importantnor unimportant
Important
Very important
23
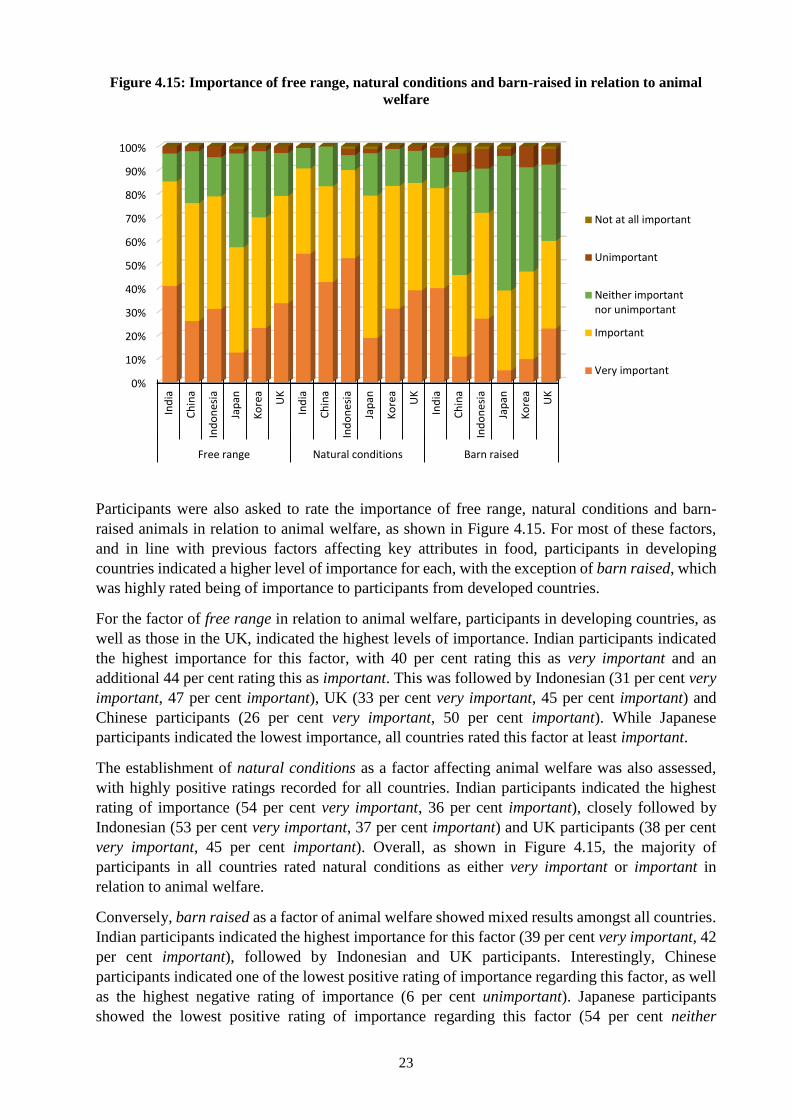
Figure 4.15: Importance of free range, natural conditions and barn-raised in relation to animal
welfare
Participants were also asked to rate the importance of free range, natural conditions and barn-
raised animals in relation to animal welfare, as shown in Figure 4.15. For most of these factors,
and in line with previous factors affecting key attributes in food, participants in developing
countries indicated a higher level of importance for each, with the exception of barn raised, which
was highly rated being of importance to participants from developed countries.
For the factor of free range in relation to animal welfare, participants in developing countries, as
well as those in the UK, indicated the highest levels of importance. Indian participants indicated
the highest importance for this factor, with 40 per cent rating this as very important and an
additional 44 per cent rating this as important. This was followed by Indonesian (31 per cent very
important, 47 per cent important), UK (33 per cent very important, 45 per cent important) and
Chinese participants (26 per cent very important, 50 per cent important). While Japanese
participants indicated the lowest importance, all countries rated this factor at least important.
The establishment of natural conditions as a factor affecting animal welfare was also assessed,
with highly positive ratings recorded for all countries. Indian participants indicated the highest
rating of importance (54 per cent very important, 36 per cent important), closely followed by
Indonesian (53 per cent very important, 37 per cent important) and UK participants (38 per cent
very important, 45 per cent important). Overall, as shown in Figure 4.15, the majority of
participants in all countries rated natural conditions as either very important or important in
relation to animal welfare.
Conversely, barn raised as a factor of animal welfare showed mixed results amongst all countries.
Indian participants indicated the highest importance for this factor (39 per cent very important, 42
per cent important), followed by Indonesian and UK participants. Interestingly, Chinese
participants indicated one of the lowest positive rating of importance regarding this factor, as well
as the highest negative rating of importance (6 per cent unimportant). Japanese participants
showed the lowest positive rating of importance regarding this factor (54 per cent neither
0%
10%
20%
30%
40%
50%
60%
70%
80%
90%
100%
Ind
ia
Ch
ina
Ind
on
esia
Jap
an
Ko
rea
UK
Ind
ia
Ch
ina
Ind
on
esia
Jap
an
Ko
rea
UK
Ind
ia
Ch
ina
Ind
on
esia
Jap
an
Ko
rea
UK
Free range Natural conditions Barn raised
Not at all important
Unimportant
Neither importantnor unimportant
Important
Very important
24
important nor unimportant, 3 per cent unimportant), with highly mixed results across countries
shown.
In summary, all countries surveyed rated the factors of good quality of life, good shelter and living
conditions, natural conditions, well-fed animals, type of feed and no cruelty as the most important
in relation to animal welfare. The least important factors of animal welfare as indicated by most
countries were barn raised, humane slaughter and free range.
4.4 Health foods
The survey then asked participants to consider the importance of factors relating to health foods.
These factors included digestive health, detoxification, beauty and skin benefits, heart, blood and
bone/joint health, pregnancy, child/baby health, energy and endurance, weight management,
cholesterol, memory, immune system, country of origin and brand.
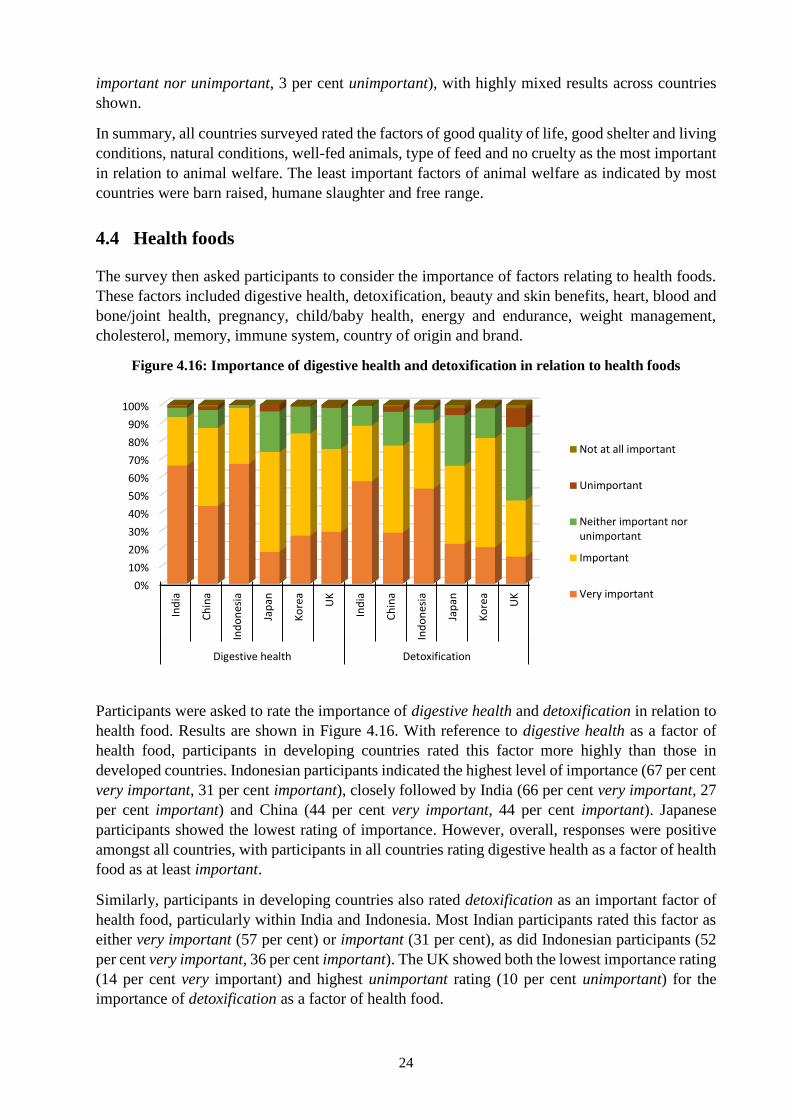
Figure 4.16: Importance of digestive health and detoxification in relation to health foods
Participants were asked to rate the importance of digestive health and detoxification in relation to
health food. Results are shown in Figure 4.16. With reference to digestive health as a factor of
health food, participants in developing countries rated this factor more highly than those in
developed countries. Indonesian participants indicated the highest level of importance (67 per cent
very important, 31 per cent important), closely followed by India (66 per cent very important, 27
per cent important) and China (44 per cent very important, 44 per cent important). Japanese
participants showed the lowest rating of importance. However, overall, responses were positive
amongst all countries, with participants in all countries rating digestive health as a factor of health
food as at least important.
Similarly, participants in developing countries also rated detoxification as an important factor of
health food, particularly within India and Indonesia. Most Indian participants rated this factor as
either very important (57 per cent) or important (31 per cent), as did Indonesian participants (52
per cent very important, 36 per cent important). The UK showed both the lowest importance rating
(14 per cent very important) and highest unimportant rating (10 per cent unimportant) for the
importance of detoxification as a factor of health food.
0%
10%
20%
30%
40%
50%
60%
70%
80%
90%
100%
Ind
ia
Ch
ina
Ind
on
esia
Jap
an
Ko
rea
UK
Ind
ia
Ch
ina
Ind
on
esia
Jap
an
Ko
rea
UK
Digestive health Detoxification
Not at all important
Unimportant
Neither important norunimportant
Important
Very important
25
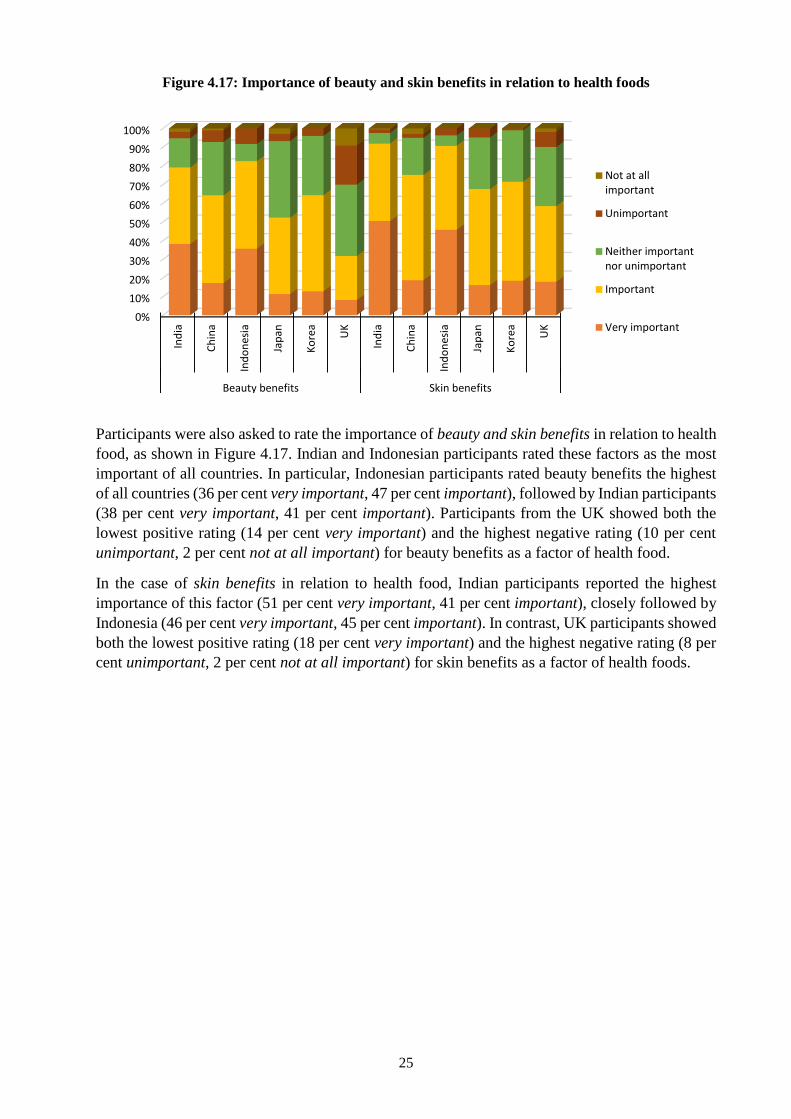
Figure 4.17: Importance of beauty and skin benefits in relation to health foods
Participants were also asked to rate the importance of beauty and skin benefits in relation to health
food, as shown in Figure 4.17. Indian and Indonesian participants rated these factors as the most
important of all countries. In particular, Indonesian participants rated beauty benefits the highest
of all countries (36 per cent very important, 47 per cent important), followed by Indian participants
(38 per cent very important, 41 per cent important). Participants from the UK showed both the
lowest positive rating (14 per cent very important) and the highest negative rating (10 per cent
unimportant, 2 per cent not at all important) for beauty benefits as a factor of health food.
In the case of skin benefits in relation to health food, Indian participants reported the highest
importance of this factor (51 per cent very important, 41 per cent important), closely followed by
Indonesia (46 per cent very important, 45 per cent important). In contrast, UK participants showed
both the lowest positive rating (18 per cent very important) and the highest negative rating (8 per
cent unimportant, 2 per cent not at all important) for skin benefits as a factor of health foods.
0%
10%
20%
30%
40%
50%
60%
70%
80%
90%
100%
Ind
ia
Ch
ina
Ind
on
esia
Jap
an
Ko
rea
UK
Ind
ia
Ch
ina
Ind
on
esia
Jap
an
Ko
rea
UK
Beauty benefits Skin benefits
Not at allimportant
Unimportant
Neither importantnor unimportant
Important
Very important
26
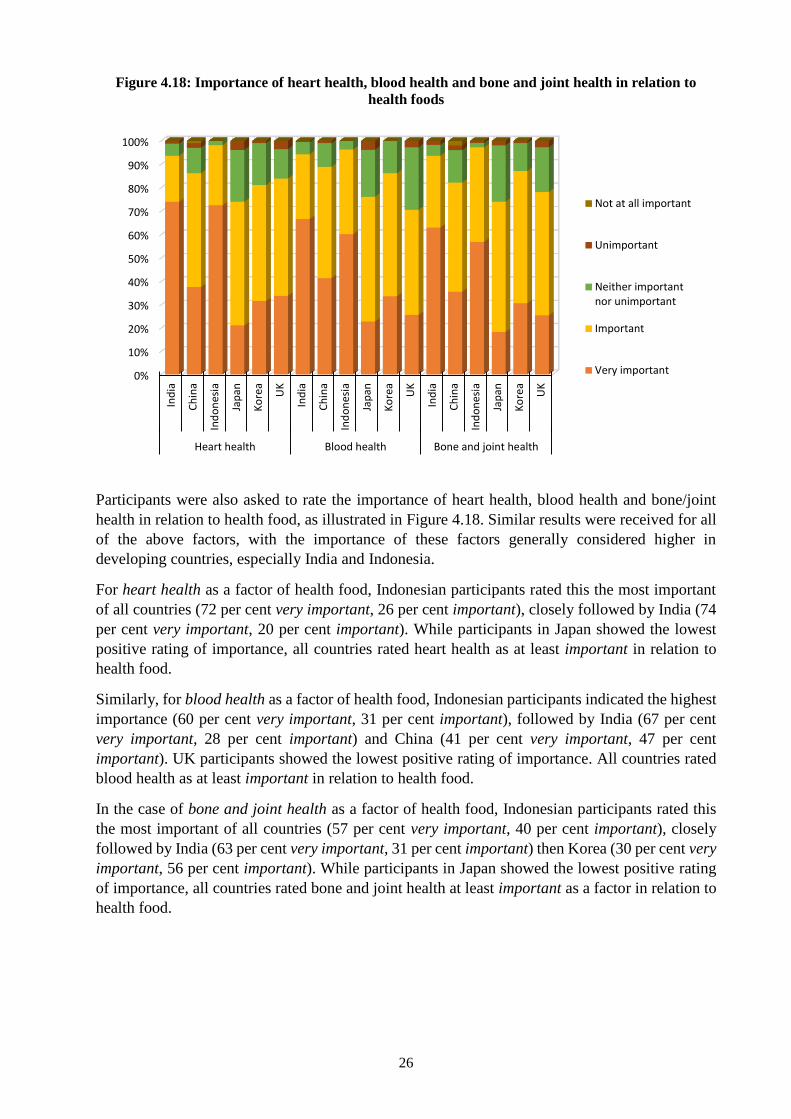
Figure 4.18: Importance of heart health, blood health and bone and joint health in relation to
health foods
Participants were also asked to rate the importance of heart health, blood health and bone/joint
health in relation to health food, as illustrated in Figure 4.18. Similar results were received for all
of the above factors, with the importance of these factors generally considered higher in
developing countries, especially India and Indonesia.
For heart health as a factor of health food, Indonesian participants rated this the most important
of all countries (72 per cent very important, 26 per cent important), closely followed by India (74
per cent very important, 20 per cent important). While participants in Japan showed the lowest
positive rating of importance, all countries rated heart health as at least important in relation to
health food.
Similarly, for blood health as a factor of health food, Indonesian participants indicated the highest
importance (60 per cent very important, 31 per cent important), followed by India (67 per cent
very important, 28 per cent important) and China (41 per cent very important, 47 per cent
important). UK participants showed the lowest positive rating of importance. All countries rated
blood health as at least important in relation to health food.
In the case of bone and joint health as a factor of health food, Indonesian participants rated this
the most important of all countries (57 per cent very important, 40 per cent important), closely
followed by India (63 per cent very important, 31 per cent important) then Korea (30 per cent very
important, 56 per cent important). While participants in Japan showed the lowest positive rating
of importance, all countries rated bone and joint health at least important as a factor in relation to
health food.
0%
10%
20%
30%
40%
50%
60%
70%
80%
90%
100%
Ind
ia
Ch
ina
Ind
on
esia
Jap
an
Ko
rea
UK
Ind
ia
Ch
ina
Ind
on
esia
Jap
an
Ko
rea
UK
Ind
ia
Ch
ina
Ind
on
esia
Jap
an
Ko
rea
UK
Heart health Blood health Bone and joint health
Not at all important
Unimportant
Neither importantnor unimportant
Important
Very important
27
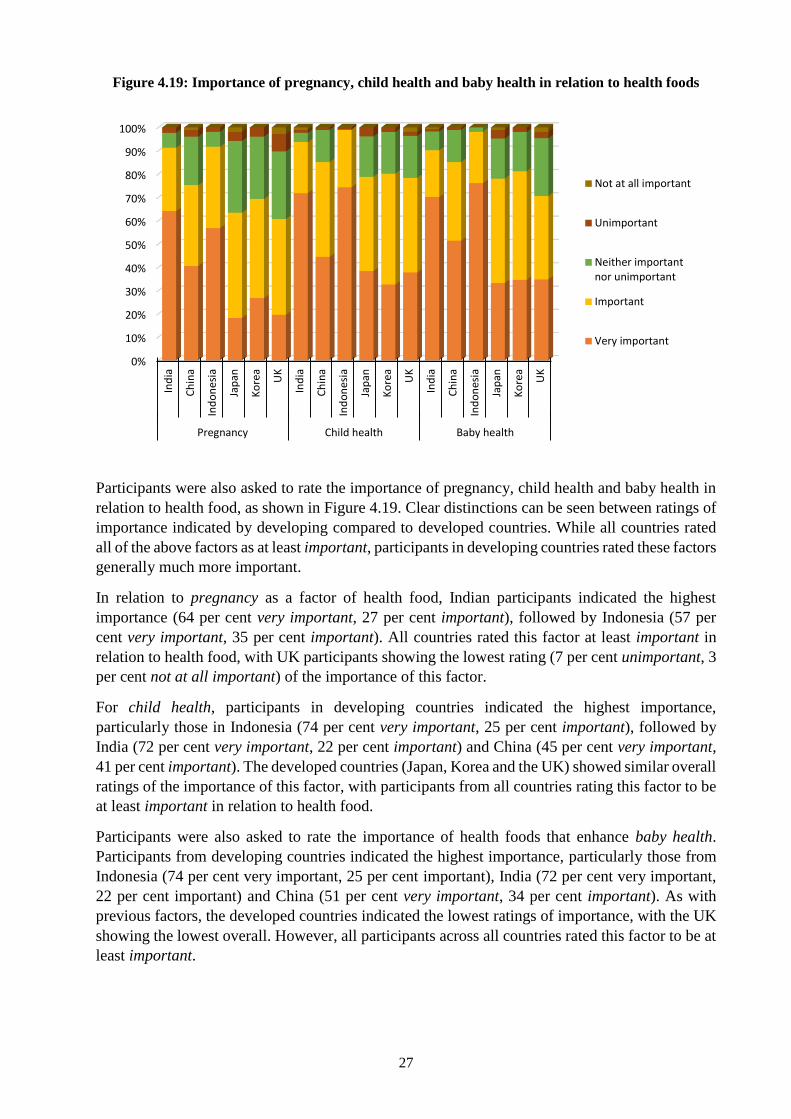
Figure 4.19: Importance of pregnancy, child health and baby health in relation to health foods
Participants were also asked to rate the importance of pregnancy, child health and baby health in
relation to health food, as shown in Figure 4.19. Clear distinctions can be seen between ratings of
importance indicated by developing compared to developed countries. While all countries rated
all of the above factors as at least important, participants in developing countries rated these factors
generally much more important.
In relation to pregnancy as a factor of health food, Indian participants indicated the highest
importance (64 per cent very important, 27 per cent important), followed by Indonesia (57 per
cent very important, 35 per cent important). All countries rated this factor at least important in
relation to health food, with UK participants showing the lowest rating (7 per cent unimportant, 3
per cent not at all important) of the importance of this factor.
For child health, participants in developing countries indicated the highest importance,
particularly those in Indonesia (74 per cent very important, 25 per cent important), followed by
India (72 per cent very important, 22 per cent important) and China (45 per cent very important,
41 per cent important). The developed countries (Japan, Korea and the UK) showed similar overall
ratings of the importance of this factor, with participants from all countries rating this factor to be
at least important in relation to health food.
Participants were also asked to rate the importance of health foods that enhance baby health.
Participants from developing countries indicated the highest importance, particularly those from
Indonesia (74 per cent very important, 25 per cent important), India (72 per cent very important,
22 per cent important) and China (51 per cent very important, 34 per cent important). As with
previous factors, the developed countries indicated the lowest ratings of importance, with the UK
showing the lowest overall. However, all participants across all countries rated this factor to be at
least important.
0%
10%
20%
30%
40%
50%
60%
70%
80%
90%
100%
Ind
ia
Ch
ina
Ind
on
esia
Jap
an
Ko
rea
UK
Ind
ia
Ch
ina
Ind
on
esia
Jap
an
Ko
rea
UK
Ind
ia
Ch
ina
Ind
on
esia
Jap
an
Ko
rea
UK
Pregnancy Child health Baby health
Not at all important
Unimportant
Neither importantnor unimportant
Important
Very important

28
Figure 4.20: Importance of energy and endurance, weight management and cholesterol in relation
to health foods
Participants were also asked to rate the importance of enhancing energy and endurance, weight
management and reducing cholesterol in relation to health food, as shown in Figure 4.20. For all
of the above, Indonesian and Indian participants in particular rated these factors the highest, with
developed countries showing the overall lowest rating of importance for the above factors.
In relation to energy and endurance as a factor of health food, Indonesian participants indicated
the highest importance (59 per cent very important, 36 per cent important), closely followed by
India (62 per cent very important, 29 per cent important). All other countries rated this factor at
least important, with UK participants indicating both the lowest rating of importance (7 per cent
unimportant, 2 per cent not at all important) for this factor.
For weight management, participants in Indonesia showed the highest importance (51 per cent
very important, 38 per cent important), followed by India (52 per cent very important, 34 per cent
important) and Korea (30 per cent very important, 49 per cent important). While participants in
the UK showed the lowest positive rating of importance in relation to this factor, all participants
across all countries rated this factor to be at least important in relation to health food.
Similar results were shown for cholesterol as a factor of health food, with the highest importance
indicated by Indonesia (54 per cent very important, 39 per cent important), closely followed by
India (57 per cent very important, 32 per cent important). All countries showed similarly high
ratings of the importance of cholesterol as a factor of health food.
0%
10%
20%
30%
40%
50%
60%
70%
80%
90%
100%
Ind
ia
Ch
ina
Ind
on
esia
Jap
an
Ko
rea
UK
Ind
ia
Ch
ina
Ind
on
esia
Jap
an
Ko
rea
UK
Ind
ia
Ch
ina
Ind
on
esia
Jap
an
Ko
rea
UK
Energy and endurance Weight management Cholesterol
Not at all important
Unimportant
Neither importantnor unimportant
Important
Very important
29
Figure 4.21: Importance of memory and immune system in relation to health foods
Participants were also asked to rate the importance of health food to aid memory and the immune
system, as shown in Figure 4.21 above. Similarities can been seen in the importance placed on the
above factors, with developing countries indicating an overall higher importance on food which
aids both memory and the immune system than developed countries.
Memory enhancement as a factor of health food was rated as highly important by developed
countries, particularly Indonesia (60 per cent very important, 33 per cent important) and India (61
per cent very important, 32 per cent important). Japanese participants showed the lowest rating in
relation to the importance of this factor. However, all participants across all countries rated this
factor to be at least important.
Similarly, in relation to health foods that enhance the immune system, high ratings of importance
were indicated by both Indonesian (64 per cent very important, 33 per cent important) and Indian
participants (65 per cent very important, 30 per cent important). In addition, similarly high ratings
were indicated by Chinese (39 per cent very important, 47 per cent important) and Korean
participants (37 per cent very important, 50 per cent important). Japanese participants indicated
the lowest rating of this factor, but again, participants from all countries rated this factor to be at
least important in relation to health food.
0%
10%
20%
30%
40%
50%
60%
70%
80%
90%
100%
Ind
ia
Ch
ina
Ind
on
esia
Jap
an
Ko
rea
UK
Ind
ia
Ch
ina
Ind
on
esia
Jap
an
Ko
rea
UK
Memory Immune system
Not at allimportant
Unimportant
Neither importantnor unimportant
Important
Very important
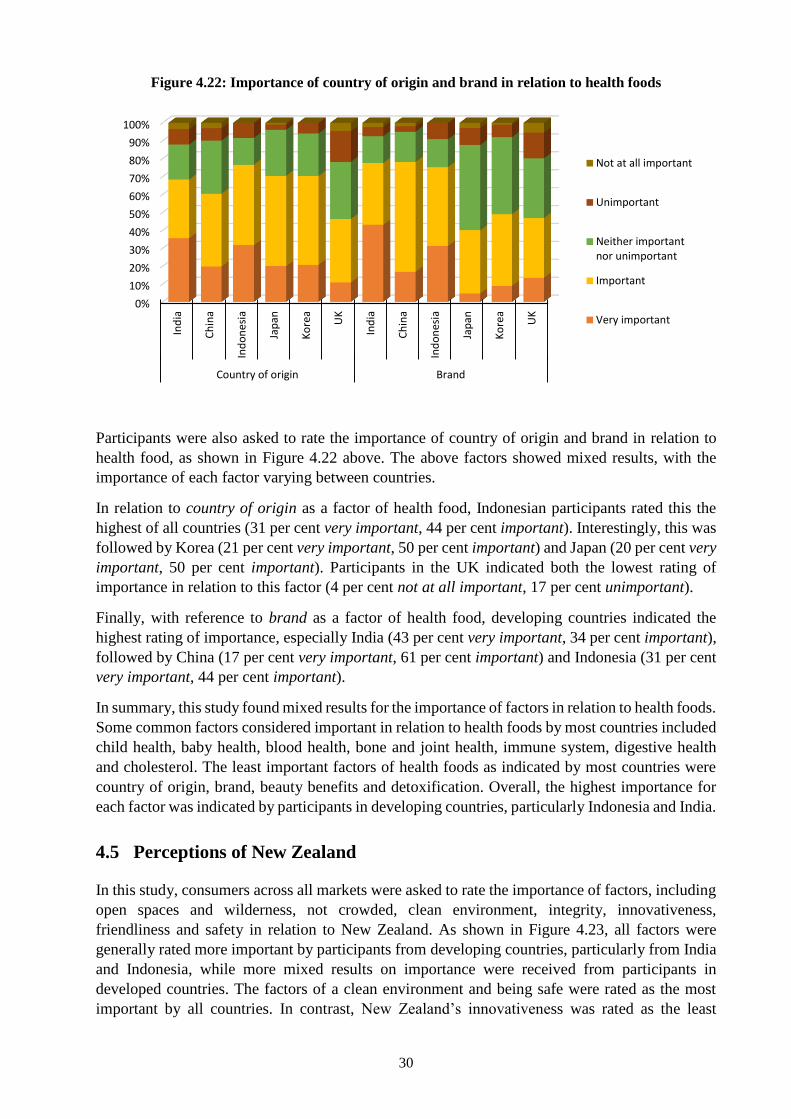
30
Figure 4.22: Importance of country of origin and brand in relation to health foods
Participants were also asked to rate the importance of country of origin and brand in relation to
health food, as shown in Figure 4.22 above. The above factors showed mixed results, with the
importance of each factor varying between countries.
In relation to country of origin as a factor of health food, Indonesian participants rated this the
highest of all countries (31 per cent very important, 44 per cent important). Interestingly, this was
followed by Korea (21 per cent very important, 50 per cent important) and Japan (20 per cent very
important, 50 per cent important). Participants in the UK indicated both the lowest rating of
importance in relation to this factor (4 per cent not at all important, 17 per cent unimportant).
Finally, with reference to brand as a factor of health food, developing countries indicated the
highest rating of importance, especially India (43 per cent very important, 34 per cent important),
followed by China (17 per cent very important, 61 per cent important) and Indonesia (31 per cent
very important, 44 per cent important).
In summary, this study found mixed results for the importance of factors in relation to health foods.
Some common factors considered important in relation to health foods by most countries included
child health, baby health, blood health, bone and joint health, immune system, digestive health
and cholesterol. The least important factors of health foods as indicated by most countries were
country of origin, brand, beauty benefits and detoxification. Overall, the highest importance for
each factor was indicated by participants in developing countries, particularly Indonesia and India.
4.5 Perceptions of New Zealand
In this study, consumers across all markets were asked to rate the importance of factors, including
open spaces and wilderness, not crowded, clean environment, integrity, innovativeness,
friendliness and safety in relation to New Zealand. As shown in Figure 4.23, all factors were
generally rated more important by participants from developing countries, particularly from India
and Indonesia, while more mixed results on importance were received from participants in
developed countries. The factors of a clean environment and being safe were rated as the most
important by all countries. In contrast, New Zealand’s innovativeness was rated as the least
0%
10%
20%
30%
40%
50%
60%
70%
80%
90%
100%
Ind
ia
Ch
ina
Ind
on
esia
Jap
an
Ko
rea
UK
Ind
ia
Ch
ina
Ind
on
esia
Jap
an
Ko
rea
UK
Country of origin Brand
Not at all important
Unimportant
Neither importantnor unimportant
Important
Very important
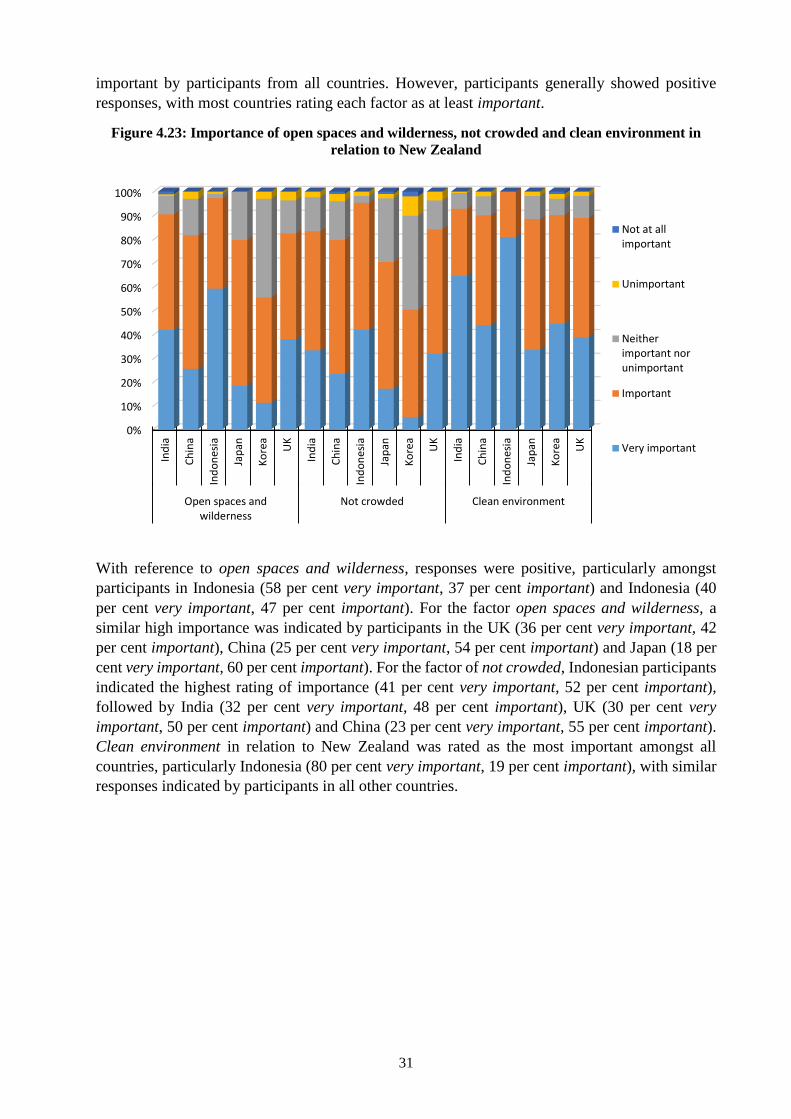
31
important by participants from all countries. However, participants generally showed positive
responses, with most countries rating each factor as at least important.
Figure 4.23: Importance of open spaces and wilderness, not crowded and clean environment in
relation to New Zealand
With reference to open spaces and wilderness, responses were positive, particularly amongst
participants in Indonesia (58 per cent very important, 37 per cent important) and Indonesia (40
per cent very important, 47 per cent important). For the factor open spaces and wilderness, a
similar high importance was indicated by participants in the UK (36 per cent very important, 42
per cent important), China (25 per cent very important, 54 per cent important) and Japan (18 per
cent very important, 60 per cent important). For the factor of not crowded, Indonesian participants
indicated the highest rating of importance (41 per cent very important, 52 per cent important),
followed by India (32 per cent very important, 48 per cent important), UK (30 per cent very
important, 50 per cent important) and China (23 per cent very important, 55 per cent important).
Clean environment in relation to New Zealand was rated as the most important amongst all
countries, particularly Indonesia (80 per cent very important, 19 per cent important), with similar
responses indicated by participants in all other countries.
0%
10%
20%
30%
40%
50%
60%
70%
80%
90%
100%
Ind
ia
Ch
ina
Ind
on
esia
Jap
an
Ko
rea
UK
Ind
ia
Ch
ina
Ind
on
esia
Jap
an
Ko
rea
UK
Ind
ia
Ch
ina
Ind
on
esia
Jap
an
Ko
rea
UK
Open spaces andwilderness
Not crowded Clean environment
Not at allimportant
Unimportant
Neitherimportant norunimportant
Important
Very important
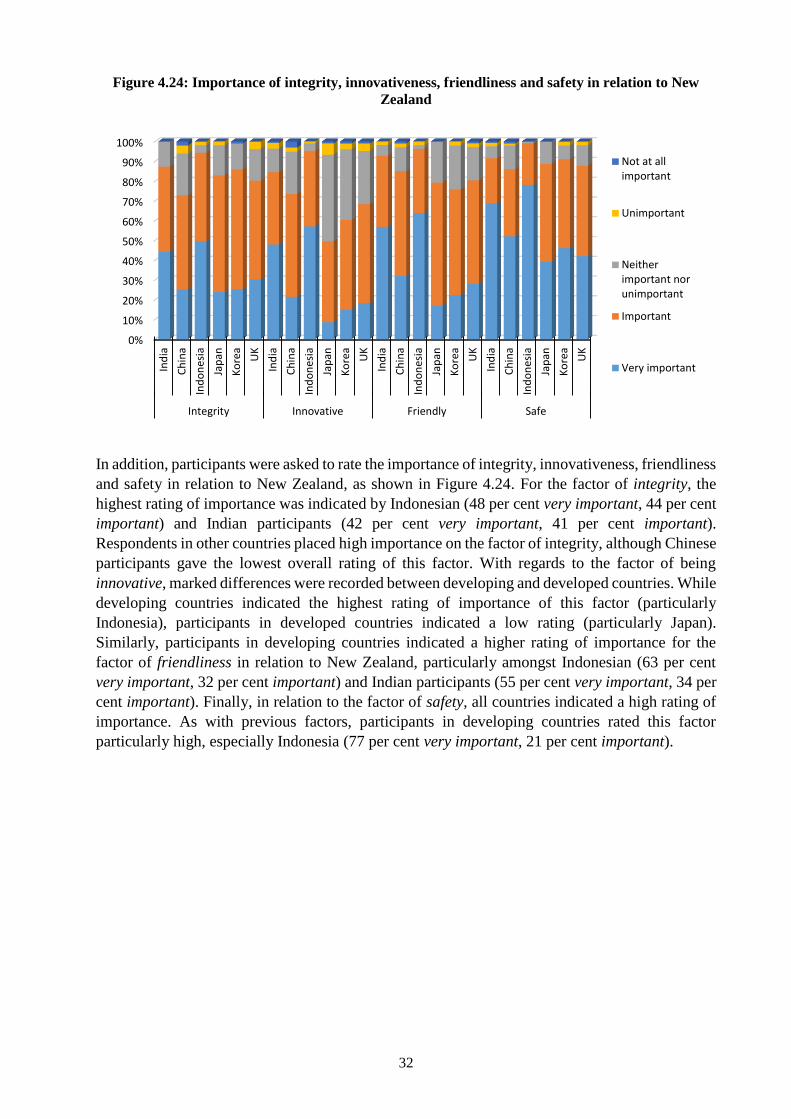
32
Figure 4.24: Importance of integrity, innovativeness, friendliness and safety in relation to New
Zealand
In addition, participants were asked to rate the importance of integrity, innovativeness, friendliness
and safety in relation to New Zealand, as shown in Figure 4.24. For the factor of integrity, the
highest rating of importance was indicated by Indonesian (48 per cent very important, 44 per cent
important) and Indian participants (42 per cent very important, 41 per cent important).
Respondents in other countries placed high importance on the factor of integrity, although Chinese
participants gave the lowest overall rating of this factor. With regards to the factor of being
innovative, marked differences were recorded between developing and developed countries. While
developing countries indicated the highest rating of importance of this factor (particularly
Indonesia), participants in developed countries indicated a low rating (particularly Japan).
Similarly, participants in developing countries indicated a higher rating of importance for the
factor of friendliness in relation to New Zealand, particularly amongst Indonesian (63 per cent
very important, 32 per cent important) and Indian participants (55 per cent very important, 34 per
cent important). Finally, in relation to the factor of safety, all countries indicated a high rating of
importance. As with previous factors, participants in developing countries rated this factor
particularly high, especially Indonesia (77 per cent very important, 21 per cent important).
0%
10%
20%
30%
40%
50%
60%
70%
80%
90%
100%
Ind
ia
Ch
ina
Ind
on
esia
Jap
an
Ko
rea
UK
Ind
ia
Ch
ina
Ind
on
esia
Jap
an
Ko
rea
UK
Ind
ia
Ch
ina
Ind
on
esia
Jap
an
Ko
rea
UK
Ind
ia
Ch
ina
Ind
on
esia
Jap
an
Ko
rea
UK
Integrity Innovative Friendly Safe
Not at allimportant
Unimportant
Neitherimportant norunimportant
Important
Very important
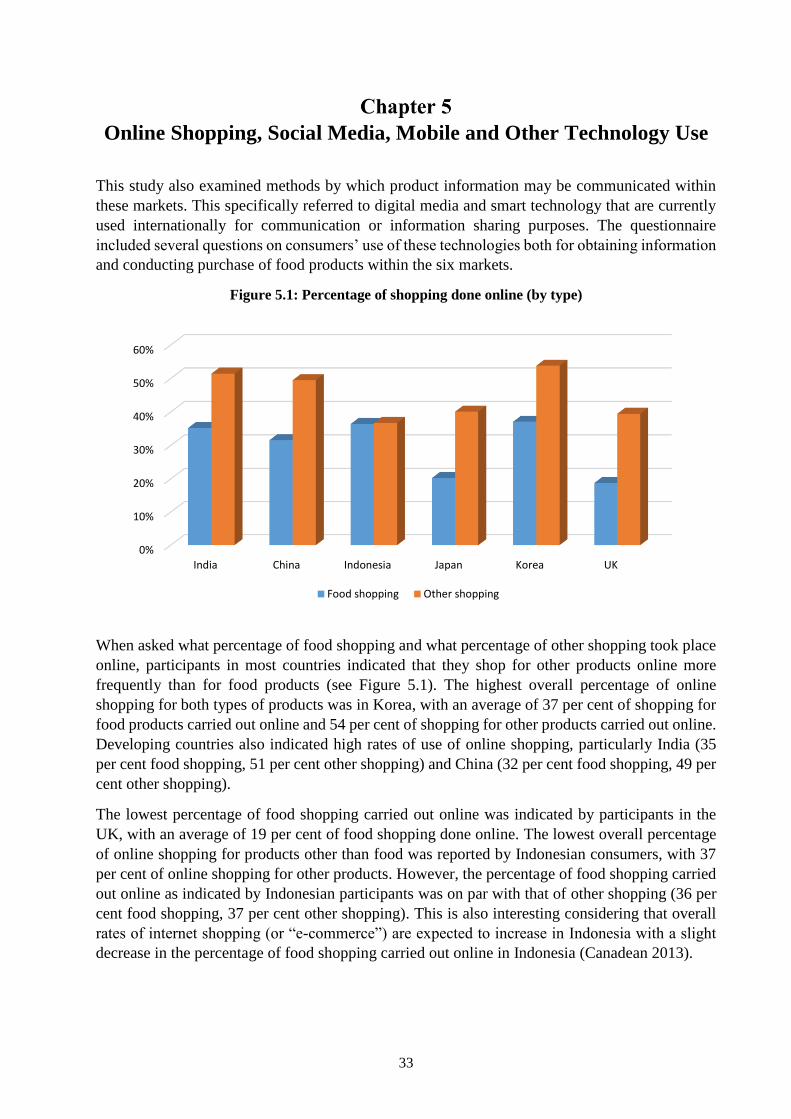
33
Online Shopping, Social Media, Mobile and Other Technology Use
This study also examined methods by which product information may be communicated within
these markets. This specifically referred to digital media and smart technology that are currently
used internationally for communication or information sharing purposes. The questionnaire
included several questions on consumers’ use of these technologies both for obtaining information
and conducting purchase of food products within the six markets.
Figure 5.1: Percentage of shopping done online (by type)
When asked what percentage of food shopping and what percentage of other shopping took place
online, participants in most countries indicated that they shop for other products online more
frequently than for food products (see Figure 5.1). The highest overall percentage of online
shopping for both types of products was in Korea, with an average of 37 per cent of shopping for
food products carried out online and 54 per cent of shopping for other products carried out online.
Developing countries also indicated high rates of use of online shopping, particularly India (35
per cent food shopping, 51 per cent other shopping) and China (32 per cent food shopping, 49 per
cent other shopping).
The lowest percentage of food shopping carried out online was indicated by participants in the
UK, with an average of 19 per cent of food shopping done online. The lowest overall percentage
of online shopping for products other than food was reported by Indonesian consumers, with 37
per cent of online shopping for other products. However, the percentage of food shopping carried
out online as indicated by Indonesian participants was on par with that of other shopping (36 per
cent food shopping, 37 per cent other shopping). This is also interesting considering that overall
rates of internet shopping (or “e-commerce”) are expected to increase in Indonesia with a slight
decrease in the percentage of food shopping carried out online in Indonesia (Canadean 2013).
0%
10%
20%
30%
40%
50%
60%
India China Indonesia Japan Korea UK
Food shopping Other shopping
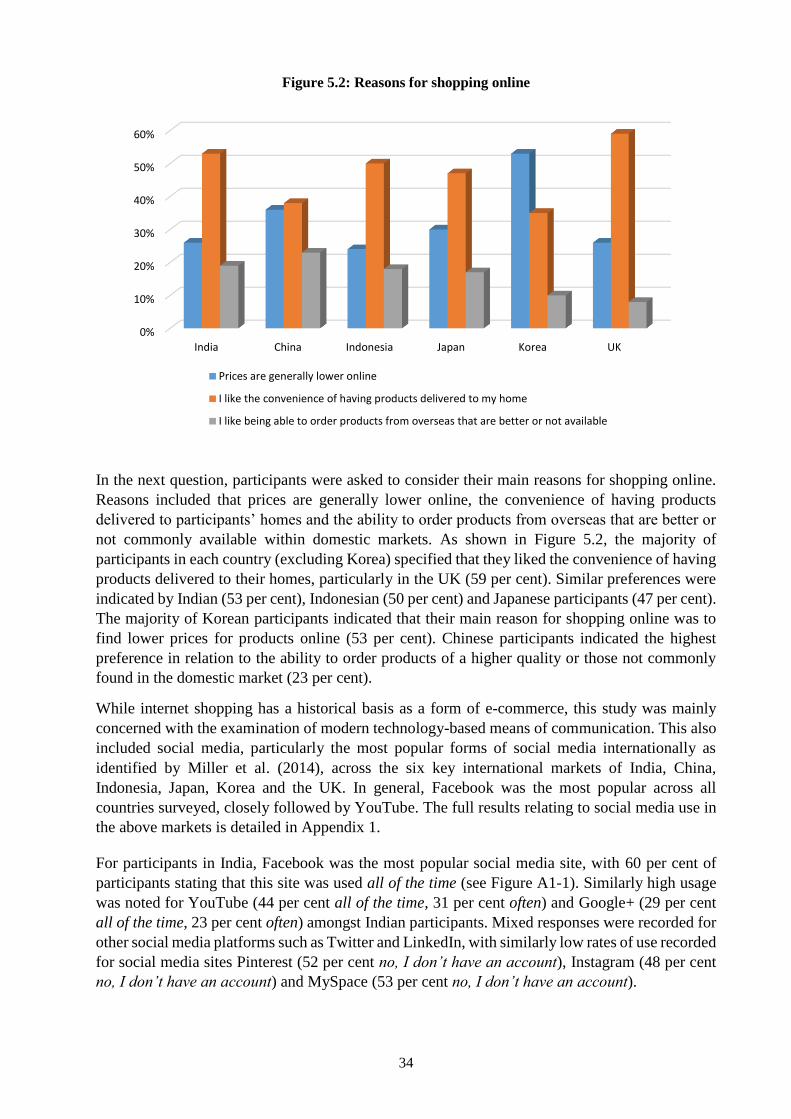
34
Figure 5.2: Reasons for shopping online
In the next question, participants were asked to consider their main reasons for shopping online.
Reasons included that prices are generally lower online, the convenience of having products
delivered to participants’ homes and the ability to order products from overseas that are better or
not commonly available within domestic markets. As shown in Figure 5.2, the majority of
participants in each country (excluding Korea) specified that they liked the convenience of having
products delivered to their homes, particularly in the UK (59 per cent). Similar preferences were
indicated by Indian (53 per cent), Indonesian (50 per cent) and Japanese participants (47 per cent).
The majority of Korean participants indicated that their main reason for shopping online was to
find lower prices for products online (53 per cent). Chinese participants indicated the highest
preference in relation to the ability to order products of a higher quality or those not commonly
found in the domestic market (23 per cent).
While internet shopping has a historical basis as a form of e-commerce, this study was mainly
concerned with the examination of modern technology-based means of communication. This also
included social media, particularly the most popular forms of social media internationally as
identified by Miller et al. (2014), across the six key international markets of India, China,
Indonesia, Japan, Korea and the UK. In general, Facebook was the most popular across all
countries surveyed, closely followed by YouTube. The full results relating to social media use in
the above markets is detailed in Appendix 1.
For participants in India, Facebook was the most popular social media site, with 60 per cent of
participants stating that this site was used all of the time (see Figure A1-1). Similarly high usage
was noted for YouTube (44 per cent all of the time, 31 per cent often) and Google+ (29 per cent
all of the time, 23 per cent often) amongst Indian participants. Mixed responses were recorded for
other social media platforms such as Twitter and LinkedIn, with similarly low rates of use recorded
for social media sites Pinterest (52 per cent no, I don’t have an account), Instagram (48 per cent
no, I don’t have an account) and MySpace (53 per cent no, I don’t have an account).
0%
10%
20%
30%
40%
50%
60%
India China Indonesia Japan Korea UK
Prices are generally lower online
I like the convenience of having products delivered to my home
I like being able to order products from overseas that are better or not available

35
Similarly, within Indonesia, Facebook was the most popular site, with 39 per cent of participants
stating that they used this site all of the time and an additional 45 per cent stating to use Facebook
often (see Figure A1-3). High user rates were also indicated for the online video site YouTube (12
per cent all of the time, 50 per cent often). Interestingly, in relation to Twitter, mixed responses
were recorded, with 6 per cent claiming to use this site all of the time. This is surprising, as
previous work examining social media use in Indonesia has shown high rates of use of Twitter
within this market (Miller et al 2014). In general, mixed responses were given by respondents in
relation to most sites listed. The least used sites as indicated by Indonesian participants were
Pinterest (64 per cent no, I don’t have an account), Instagram (51 per cent no, I don’t have an
account) and MySpace (64 per cent no, I don’t have an account). This is similar to social media
use rates shown by Indian participants within this study.
Within Japan, low rates of use were indicated by participants for all sites in comparison with other
markets within this study. The most used site as shown by Japanese participants was YouTube (17
per cent all of the time) (see Figure A1-4), followed by Facebook (16 per cent all of the time) and
Line (20 per cent all of the time). Low user rates of use were recorded for most other sites,
especially LinkedIn (87 per cent no, I don’t have an account), Pinterest (89 per cent no, I don’t
have an account), Instagram (83 per cent no, I don’t have an account) and MySpace (86 per cent
no, I don’t have an account).
Similar patterns in relation to social media and similar site preferences were recorded in Korea
(see Figure A1-5). Facebook was indicated as the most popular site amongst Korean participants
(25 per cent all of the time, 35 per cent often), closely followed by YouTube (14 per cent all of the
time, 35 per cent often). Mixed responses were recorded for a number of social media sites,
including Twitter, Google+ and Cyworld. In line with the Japanese results for social media use,
low rates of use were indicated by Korean participants in relation to LinkedIn (65 per cent no, I
don’t have an account), Pinterest (66 per cent no, I don’t have an account), Instagram (64 per cent
no, I don’t have an account) and MySpace (70 per cent no, I don’t have an account).
For UK participants, overall low rates of use for all sites were recorded (see Figure A1-6). The
most popular site as indicated by UK participants was Facebook (26 per cent all of the time, 20
per cent often), followed by YouTube (9 per cent all of the time, 22 per cent often). The sites with
the lowest indicated use within the UK were Pinterest (89 per cent no, I don’t have an account)
and MySpace (89 per cent no, I don’t have an account), followed by Instagram (84 per cent no, I
don’t have an account), LinkedIn (71 per cent no, I don’t have an account), Twitter (66 per cent
no, I don’t have an account) and Google+ (62 per cent no, I don’t have an account).
Within China, access to particular western social media sites (such as Facebook and Twitter) is
restricted by the Chinese government. However, equivalent social media sites now exist (Miller
et al 2014). The most popular social media sites as indicated by Chinese participants were QQ (51
per cent all of the time, 35 per cent often) and Weixin QQ (49 per cent all of the time, 32 per cent
often), followed by Qzone (28 per cent all of the time, 33 per cent often) and e-commerce site
Alibaba (15 per cent all of the time, 39 per cent often) (see Figure A1-2). Mixed responses were
shown for a range of other sites, including Tencent, RenRen, Kaixin and Jingdong. The lowest
usage was shown for the professional social networking site Dajie, with 63 per cent of participants
indicating that they did not have an account.
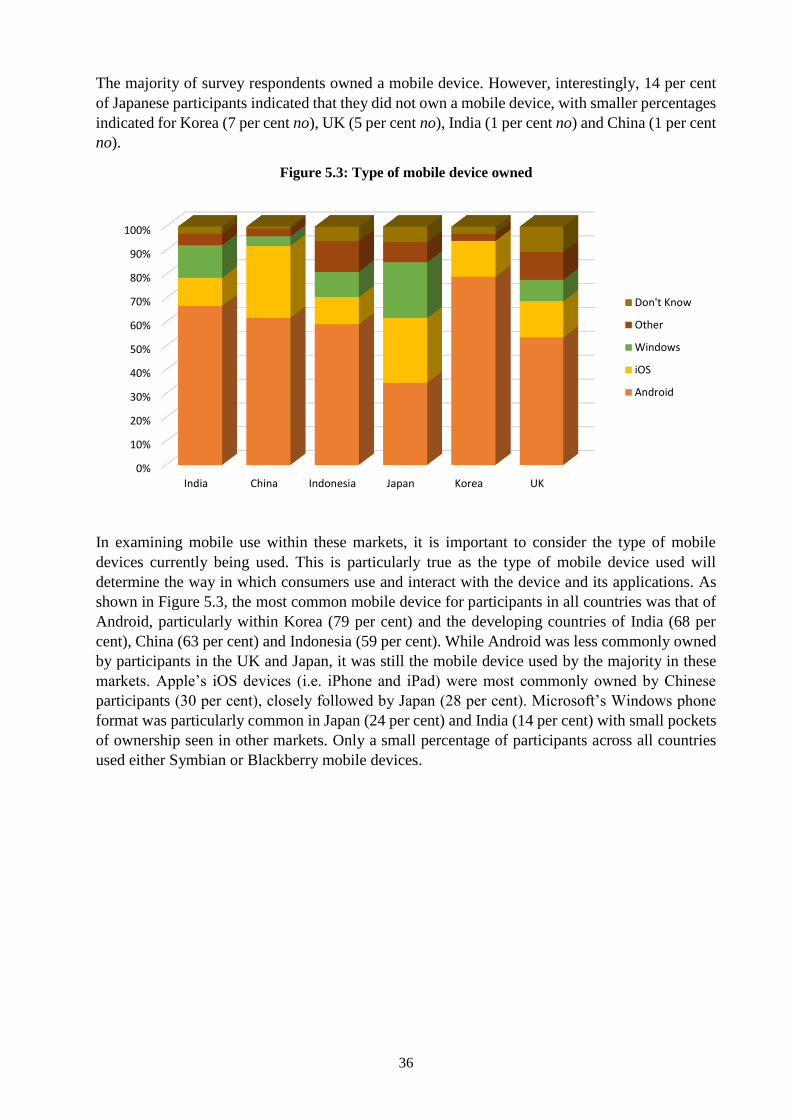
36
The majority of survey respondents owned a mobile device. However, interestingly, 14 per cent
of Japanese participants indicated that they did not own a mobile device, with smaller percentages
indicated for Korea (7 per cent no), UK (5 per cent no), India (1 per cent no) and China (1 per cent
no).
Figure 5.3: Type of mobile device owned
In examining mobile use within these markets, it is important to consider the type of mobile
devices currently being used. This is particularly true as the type of mobile device used will
determine the way in which consumers use and interact with the device and its applications. As
shown in Figure 5.3, the most common mobile device for participants in all countries was that of
Android, particularly within Korea (79 per cent) and the developing countries of India (68 per
cent), China (63 per cent) and Indonesia (59 per cent). While Android was less commonly owned
by participants in the UK and Japan, it was still the mobile device used by the majority in these
markets. Apple’s iOS devices (i.e. iPhone and iPad) were most commonly owned by Chinese
participants (30 per cent), closely followed by Japan (28 per cent). Microsoft’s Windows phone
format was particularly common in Japan (24 per cent) and India (14 per cent) with small pockets
of ownership seen in other markets. Only a small percentage of participants across all countries
used either Symbian or Blackberry mobile devices.
0%
10%
20%
30%
40%
50%
60%
70%
80%
90%
100%
India China Indonesia Japan Korea UK
Don't Know
Other
Windows
iOS
Android
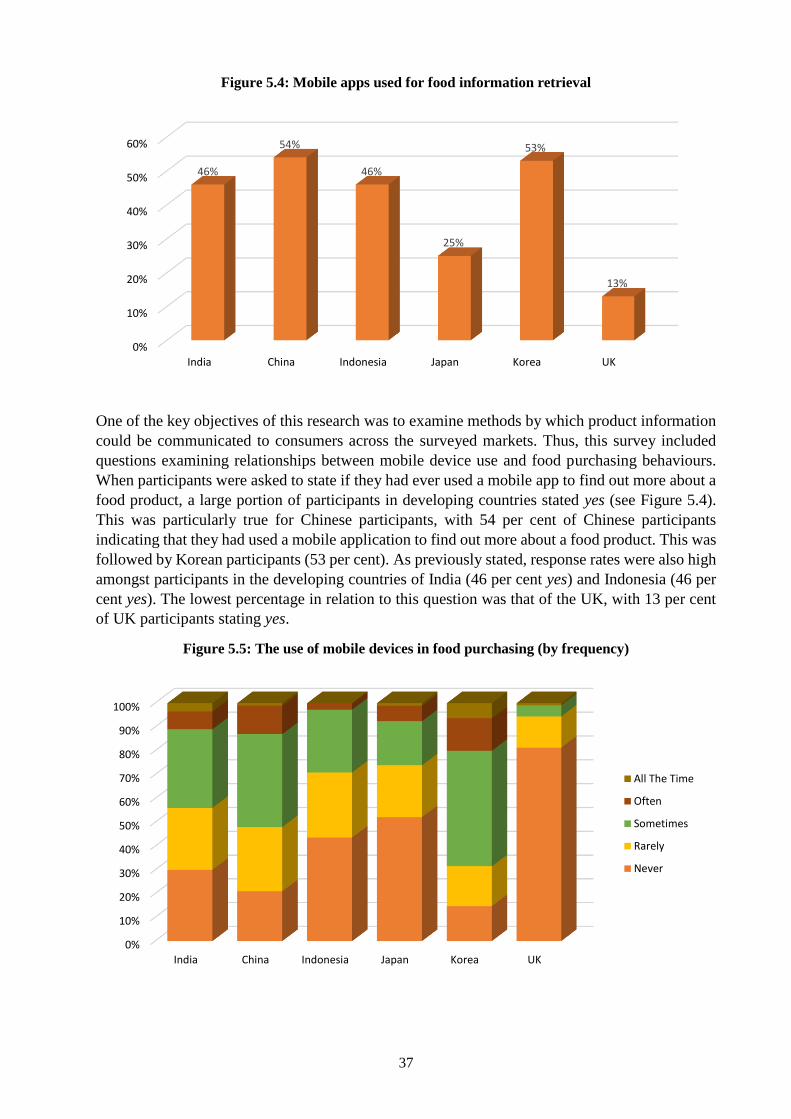
37
Figure 5.4: Mobile apps used for food information retrieval
One of the key objectives of this research was to examine methods by which product information
could be communicated to consumers across the surveyed markets. Thus, this survey included
questions examining relationships between mobile device use and food purchasing behaviours.
When participants were asked to state if they had ever used a mobile app to find out more about a
food product, a large portion of participants in developing countries stated yes (see Figure 5.4).
This was particularly true for Chinese participants, with 54 per cent of Chinese participants
indicating that they had used a mobile application to find out more about a food product. This was
followed by Korean participants (53 per cent). As previously stated, response rates were also high
amongst participants in the developing countries of India (46 per cent yes) and Indonesia (46 per
cent yes). The lowest percentage in relation to this question was that of the UK, with 13 per cent
of UK participants stating yes.
Figure 5.5: The use of mobile devices in food purchasing (by frequency)
0%
10%
20%
30%
40%
50%
60%
India China Indonesia Japan Korea UK
46%
54%
46%
25%
53%
13%
0%
10%
20%
30%
40%
50%
60%
70%
80%
90%
100%
India China Indonesia Japan Korea UK
All The Time
Often
Sometimes
Rarely
Never
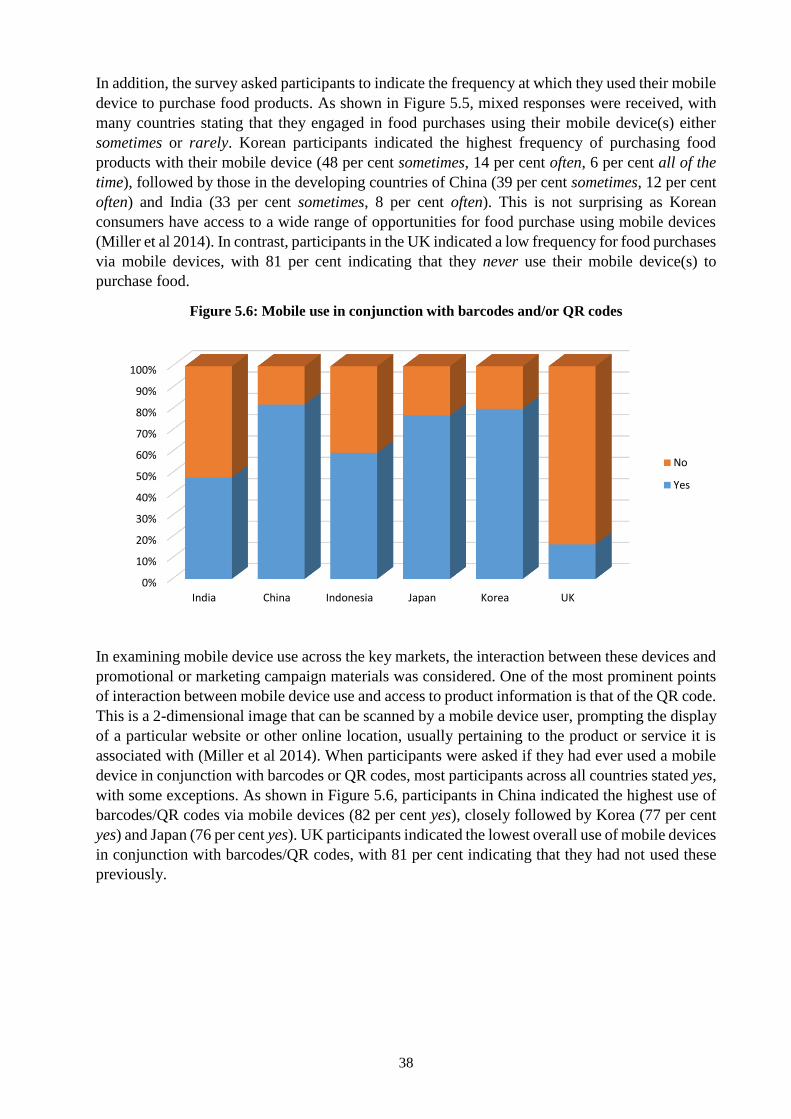
38
In addition, the survey asked participants to indicate the frequency at which they used their mobile
device to purchase food products. As shown in Figure 5.5, mixed responses were received, with
many countries stating that they engaged in food purchases using their mobile device(s) either
sometimes or rarely. Korean participants indicated the highest frequency of purchasing food
products with their mobile device (48 per cent sometimes, 14 per cent often, 6 per cent all of the
time), followed by those in the developing countries of China (39 per cent sometimes, 12 per cent
often) and India (33 per cent sometimes, 8 per cent often). This is not surprising as Korean
consumers have access to a wide range of opportunities for food purchase using mobile devices
(Miller et al 2014). In contrast, participants in the UK indicated a low frequency for food purchases
via mobile devices, with 81 per cent indicating that they never use their mobile device(s) to
purchase food.
Figure 5.6: Mobile use in conjunction with barcodes and/or QR codes
In examining mobile device use across the key markets, the interaction between these devices and
promotional or marketing campaign materials was considered. One of the most prominent points
of interaction between mobile device use and access to product information is that of the QR code.
This is a 2-dimensional image that can be scanned by a mobile device user, prompting the display
of a particular website or other online location, usually pertaining to the product or service it is
associated with (Miller et al 2014). When participants were asked if they had ever used a mobile
device in conjunction with barcodes or QR codes, most participants across all countries stated yes,
with some exceptions. As shown in Figure 5.6, participants in China indicated the highest use of
barcodes/QR codes via mobile devices (82 per cent yes), closely followed by Korea (77 per cent
yes) and Japan (76 per cent yes). UK participants indicated the lowest overall use of mobile devices
in conjunction with barcodes/QR codes, with 81 per cent indicating that they had not used these
previously.
0%
10%
20%
30%
40%
50%
60%
70%
80%
90%
100%
India China Indonesia Japan Korea UK
No
Yes
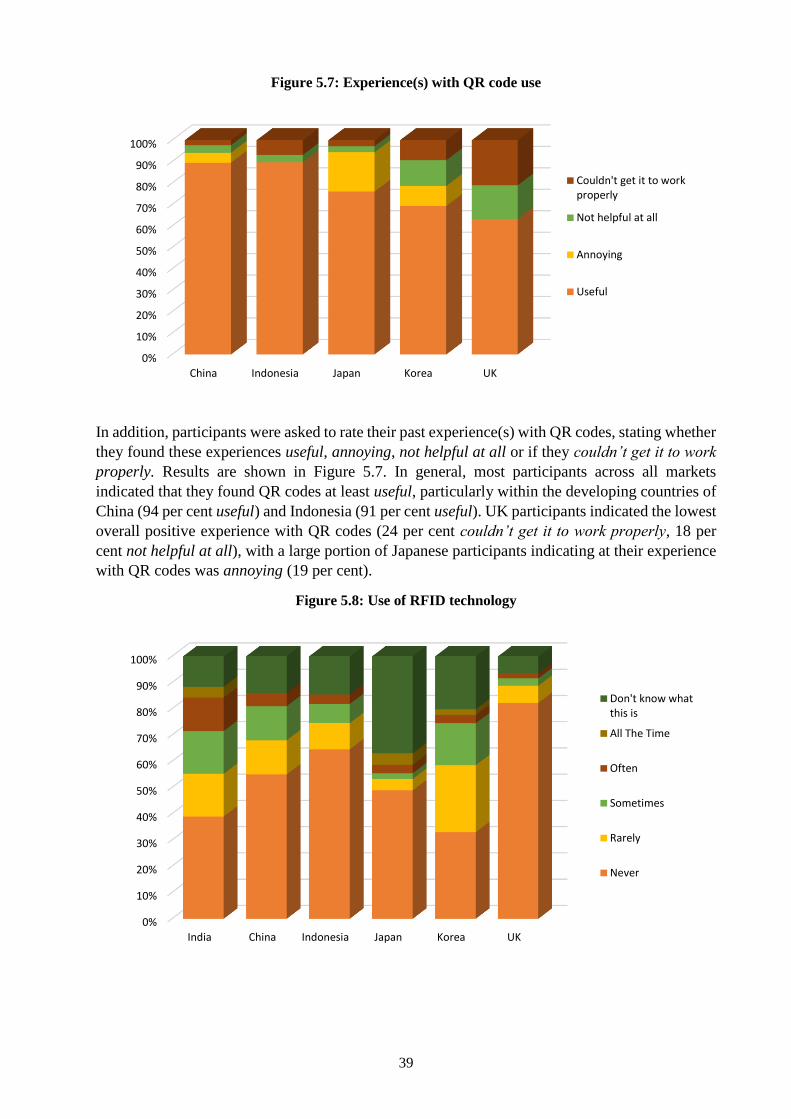
39
Figure 5.7: Experience(s) with QR code use
In addition, participants were asked to rate their past experience(s) with QR codes, stating whether
they found these experiences useful, annoying, not helpful at all or if they couldn’t get it to work
properly. Results are shown in Figure 5.7. In general, most participants across all markets
indicated that they found QR codes at least useful, particularly within the developing countries of
China (94 per cent useful) and Indonesia (91 per cent useful). UK participants indicated the lowest
overall positive experience with QR codes (24 per cent couldn’t get it to work properly, 18 per
cent not helpful at all), with a large portion of Japanese participants indicating at their experience
with QR codes was annoying (19 per cent).
Figure 5.8: Use of RFID technology
0%
10%
20%
30%
40%
50%
60%
70%
80%
90%
100%
China Indonesia Japan Korea UK
Couldn't get it to workproperly
Not helpful at all
Annoying
Useful
0%
10%
20%
30%
40%
50%
60%
70%
80%
90%
100%
India China Indonesia Japan Korea UK
Don't know whatthis is
All The Time
Often
Sometimes
Rarely
Never
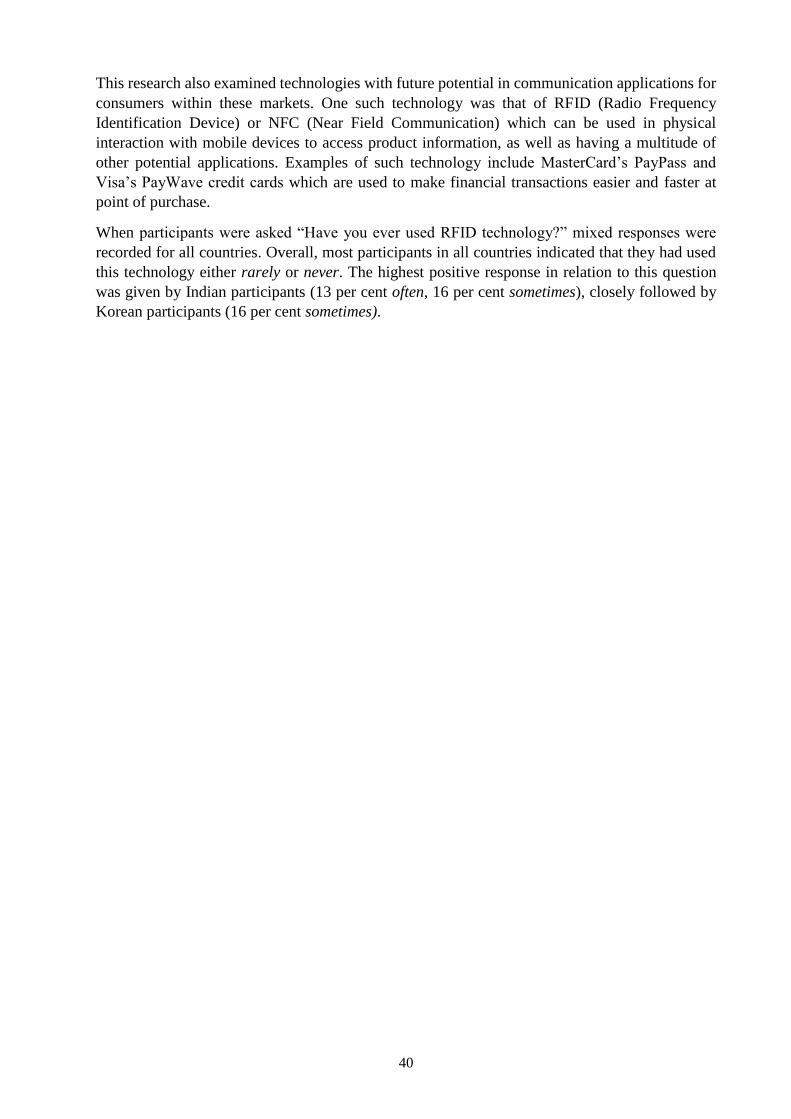
40
This research also examined technologies with future potential in communication applications for
consumers within these markets. One such technology was that of RFID (Radio Frequency
Identification Device) or NFC (Near Field Communication) which can be used in physical
interaction with mobile devices to access product information, as well as having a multitude of
other potential applications. Examples of such technology include MasterCard’s PayPass and
Visa’s PayWave credit cards which are used to make financial transactions easier and faster at
point of purchase.
When participants were asked “Have you ever used RFID technology?” mixed responses were
recorded for all countries. Overall, most participants in all countries indicated that they had used
this technology either rarely or never. The highest positive response in relation to this question
was given by Indian participants (13 per cent often, 16 per cent sometimes), closely followed by
Korean participants (16 per cent sometimes).
41
Conclusion
This study is part of a wider research programme “Maximising Export Returns (MER)” which
aims to explore how export firms can capture price premiums by including and communicating
credence attributes in products for overseas markets. Previous research has shown that consumers
in the developing countries of China and India placed a higher importance on environmental and
ethnical attributes of food products than those in the United Kingdom (UK).
Following on from this work, this study was a pilot survey with 100 participants in each of China,
India, Indonesia, Japan, Korea and the UK in order to assess consumer attitudes towards a variety
of food attributes, as well as their perceptions of factors in relation to New Zealand, and current
and potential technology use concerning food information and purchase behaviour in these
markets.
Initially, seven key attributes in food products were selected (quality, price, fair trade, animal
welfare, environmental quality, health food and food safety) with participants indicating the
importance of each attribute. Results showed that in relation to quality and price, most participants
in all countries stated that these were either very important or important, particularly India and
Indonesia. Similarly, in relation to animal welfare, environmental quality, health food and food
safety, developing countries indicated an overall higher rating of importance than developed
countries, particularly Indonesian, Indian and Korean participants.
From these seven key attributes, four were selected for analysis in more detail; these were food
safety, environmental quality, animal welfare and health food. For each of these attributes,
participants were asked to rate the importance of a range of factors underpinning these attributes.
Firstly, the survey asked participants to consider the importance of factors affecting food safety,
including hygiene standards, rates of contamination, traceability, private and government
certification, country of origin, barn-raised animals, type of feed, animal welfare, reduced use of
pesticides, organic production, GM-free, number of additives, environmental quality, low input
agriculture, freshness and brand. Participants in developing countries tended to rate factors
attributed to food safety higher than participants within developed countries. The most important
factors within all countries were freshness, labelling of “use by date”, hygiene standards and rates
of contamination. In addition, environmental quality was listed as one of the top five factors
affecting food safety amongst developing countries, signalling its importance in these markets.
Animal welfare was also listed by Indian, Indonesian and UK participants as an important factor
affecting food safety.
Following this, participants were asked to rate the importance of factors related to environmental
quality; these included water quality, the protection of species and environments (such as
wetlands, coastal and sea-life, endangered plants and animals, and native and non-native
biodiversity), air quality, greenhouse gas (GHG) emissions, organic production, low input
agriculture, recycling, open spaces and wilderness. Almost consistently, participants in developing
countries considered all factors to be more important to environmental quality than developed
countries. The most important factors overall in relation to environmental quality were water and
air quality, protecting endangered animals, organic production and recycling.
42
The survey then asked participants to consider the importance of factors related to animal welfare,
including good quality of life, good shelter and living conditions, certification, adequate diets, type
of feed, no cruelty, humane slaughter, free range, natural conditions and barn-raised animals.
Overall, all of these factors were considered to be at least important by participants in all countries,
particularly in Indonesia, India and the UK. The factors of good quality of life, natural conditions,
type of feed and no cruelty were identified as the most important factors, and barn raised identified
as the least important factor across all countries.
Finally, participants were asked to rate the importance of factors relating to health foods, including
digestive health, detoxification, beauty and skin benefits, heart, blood and bone/joint health,
pregnancy, child/baby health, energy and endurance, weight management, cholesterol, memory,
immune system, country of origin and brand. Overall, the highest importance for each factor was
indicated by participants in developing countries, particularly from Indonesia and India.
Differences across countries were shown for the importance of brand, country of origin and beauty
benefits in relation to health food with participants from all countries rating these as the least
important factors.
In the survey, participants were also asked to rate the importance of factors in relation to New
Zealand; these were open spaces and wilderness, not crowded, clean environment, integrity,
innovative, friendly, and safe. For all countries, the most important factors were shown to be a
clean environment and safety. However, participants in all countries rated each factor as being at
least important. In addition, participants in developing countries, particularly India and Indonesia,
placed higher importance on all of the above factors than participants in developed countries.
An additional objective of this research was to examine means by which product information may
be communicated within these markets. This specifically referred to digital media and smart
technology that are currently used internationally for communication or information sharing
purposes. The questionnaire included several questions on consumers’ use of these technologies
both for obtaining information and purchasing of food products within the six markets.
Survey results showed that the frequency of internet shopping was highest for Korean participants
(37 per cent shopping for food products and 54 per cent shopping for “other” products), followed
by the developing countries of India (35 per cent food shopping, 51 per cent other shopping) and
China (32 per cent food shopping, 49 per cent other shopping). Interestingly, Indonesian
participants indicated the lowest overall percentage of online shopping for “other” products, which
was shown to be equal with the frequency of online food shopping (36 per cent food shopping, 37
per cent other shopping). This is also interesting considering that overall rates of online shopping
(or “e-commerce”) are expected to increase in Indonesia with a slight decrease in the percentage
of food shopping carried out online in Indonesia. For the majority of survey respondents, the main
reason for online shopping was that they liked the convenience of having products delivered to
their homes, particularly amongst UK participants (59 per cent), but the ability to access products
outside of the domestic market was also significant.
This study also examined modern technology-based means of communication, including social
media, across the six key international markets of India, China, Indonesia, Japan, Korea and the
UK. In general, Facebook was the most popular website across all countries surveyed, closely
followed by YouTube. In addition, while access to particular social media sites (including
Facebook and Twitter) is restricted in China, the most popular sites as identified in this study were
QQ, Weixen QQ and Qzone.
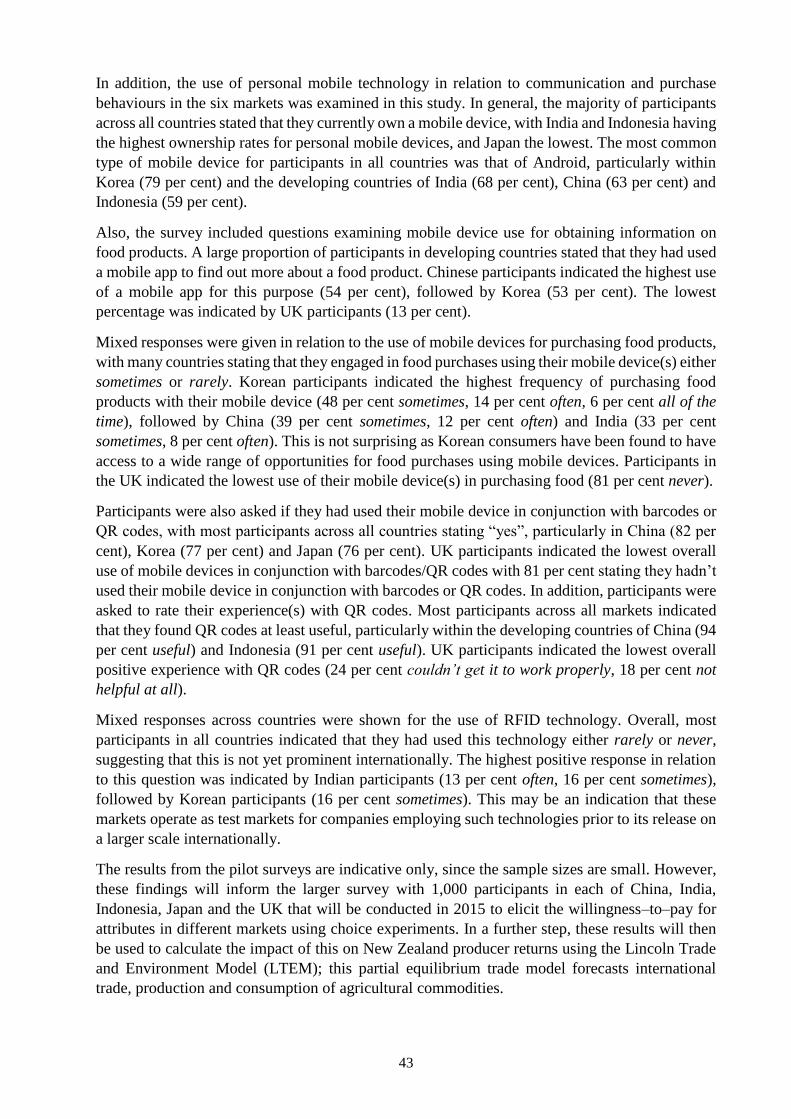
43
In addition, the use of personal mobile technology in relation to communication and purchase
behaviours in the six markets was examined in this study. In general, the majority of participants
across all countries stated that they currently own a mobile device, with India and Indonesia having
the highest ownership rates for personal mobile devices, and Japan the lowest. The most common
type of mobile device for participants in all countries was that of Android, particularly within
Korea (79 per cent) and the developing countries of India (68 per cent), China (63 per cent) and
Indonesia (59 per cent).
Also, the survey included questions examining mobile device use for obtaining information on
food products. A large proportion of participants in developing countries stated that they had used
a mobile app to find out more about a food product. Chinese participants indicated the highest use
of a mobile app for this purpose (54 per cent), followed by Korea (53 per cent). The lowest
percentage was indicated by UK participants (13 per cent).
Mixed responses were given in relation to the use of mobile devices for purchasing food products,
with many countries stating that they engaged in food purchases using their mobile device(s) either
sometimes or rarely. Korean participants indicated the highest frequency of purchasing food
products with their mobile device (48 per cent sometimes, 14 per cent often, 6 per cent all of the
time), followed by China (39 per cent sometimes, 12 per cent often) and India (33 per cent
sometimes, 8 per cent often). This is not surprising as Korean consumers have been found to have
access to a wide range of opportunities for food purchases using mobile devices. Participants in
the UK indicated the lowest use of their mobile device(s) in purchasing food (81 per cent never).
Participants were also asked if they had used their mobile device in conjunction with barcodes or
QR codes, with most participants across all countries stating “yes”, particularly in China (82 per
cent), Korea (77 per cent) and Japan (76 per cent). UK participants indicated the lowest overall
use of mobile devices in conjunction with barcodes/QR codes with 81 per cent stating they hadn’t
used their mobile device in conjunction with barcodes or QR codes. In addition, participants were
asked to rate their experience(s) with QR codes. Most participants across all markets indicated
that they found QR codes at least useful, particularly within the developing countries of China (94
per cent useful) and Indonesia (91 per cent useful). UK participants indicated the lowest overall
positive experience with QR codes (24 per cent couldn’t get it to work properly, 18 per cent not
helpful at all).
Mixed responses across countries were shown for the use of RFID technology. Overall, most
participants in all countries indicated that they had used this technology either rarely or never,
suggesting that this is not yet prominent internationally. The highest positive response in relation
to this question was indicated by Indian participants (13 per cent often, 16 per cent sometimes),
followed by Korean participants (16 per cent sometimes). This may be an indication that these
markets operate as test markets for companies employing such technologies prior to its release on
a larger scale internationally.
The results from the pilot surveys are indicative only, since the sample sizes are small. However,
these findings will inform the larger survey with 1,000 participants in each of China, India,
Indonesia, Japan and the UK that will be conducted in 2015 to elicit the willingness–to–pay for
attributes in different markets using choice experiments. In a further step, these results will then
be used to calculate the impact of this on New Zealand producer returns using the Lincoln Trade
and Environment Model (LTEM); this partial equilibrium trade model forecasts international
trade, production and consumption of agricultural commodities.

44
45
References
Baker, R. and Göritz, A.S. (2014). Introduction to Part VI: Special domains. In M. Callegaro, R.
Baker, J. Bethlehem, A.S. Göritz, J.A. Krosnick and P.J. Lavrakas (Eds.) Online Panel
Research: A Data Quality Perspective (1st Ed.) (pp. 363-365).
Callegaro, M., Baker, R., Bethlehem, J., Göritz, A.S., Krosnick, J.A. and Lavrakas, P.J. (2014a).
Online panel research History, concepts, applications and a look at the future. In M.
Callegaro, R. Baker, J. Bethlehem, A.S. Göritz, J.A. Krosnick and P.J. Lavrakas (Eds.)
Online Panel Research: A Data Quality Perspective (1st Ed.) (pp. 1-22). DOI:
10.1002/9781118763520.ch1
Callegaro, M., Villar, A., Yeager, D. and Krosnick, J.A. (2014b). A critical review of studies
investigating the quality of data obtained with online panels based on probability and
nonprobability samples. In M. Callegaro, R. Baker, J. Bethlehem, A.S. Göritz, J.A.
Krosnick and P.J. Lavrakas (Eds.) Online Panel Research: A Data Quality Perspective (1st
Ed.) (pp. 23-53). DOI: 10.1002/9781118763520.ch2
Callegaro, M. and Krosnick, J.A. (2014). Introduction to Part I: Coverage. In M. Callegaro, R.
Baker, J. Bethlehem, A.S. Göritz, J.A. Krosnick and P.J. Lavrakas (Eds.) Online Panel
Research: A Data Quality Perspective (1st Ed.) (pp. 55-60). DOI:
10.1002/9781118763520.part1
Canadean (2013). Online Retailers in Indonesia: Market Snapshot to 2017.
Dillman, D.A., Smyth, J.D. and Christian, L.M. (2009). Internet, mail, and mixed-mode surveys:
The tailored design method (3rd ed.). Hoboken NJ: John Wiley & Sons, Inc.
Driver, T., Saunders, C. and Guenther, M. (2011). Sustainability Trends in Emerging Markets:
Market Drivers for Sustainable Consumption in China and India. ARGOS Research Report
11/05, December 2011. Available from
http://www.argos.org.nz/uploads/2/3/7/3/23730248/research_report_11_05_argos_econom
ic_sustainability_trends.pdf.
Hillygus, D.S., Jackson, N. and Young, M. (2014). Professional respondents in nonprobability
online panels. In M. Callegaro, R. Baker, J. Bethlehem, A.S. Göritz, J.A. Krosnick and P.J.
Lavrakas (Eds.) Online Panel Research: A Data Quality Perspective (1st Ed.) (pp. 219-
237). DOI: 10.1002/9781118763520.ch10
Miller, S., Driver, T., Velasquez, N. and Saunders, C. (2014). Maximising Export Returns:
Consumer behaviour and trends for credence attributes in key markets and a review of how
these may be communicated. AERU Research Report No. 332. Agribusiness & Economics
Research Unit (AERU): Lincoln University, New Zealand. Available from
https://researcharchive.lincoln.ac.nz/bitstream/10182/6349/1/Maximising%20Exports%20
Returns%20report%20July%202014.pdf
Saunders, C., Guenther, M. and Driver, T. (2010). Sustainability trends in key overseas markets:
Market drivers and implications to increase value for New Zealand exports. AERU
Research Report No. 319. Agribusiness & Economics Research Unit (AERU): Lincoln
University, New Zealand. Available from
https://researcharchive.lincoln.ac.nz/bitstream/10182/3338/1/aeru_rr_319.pdf
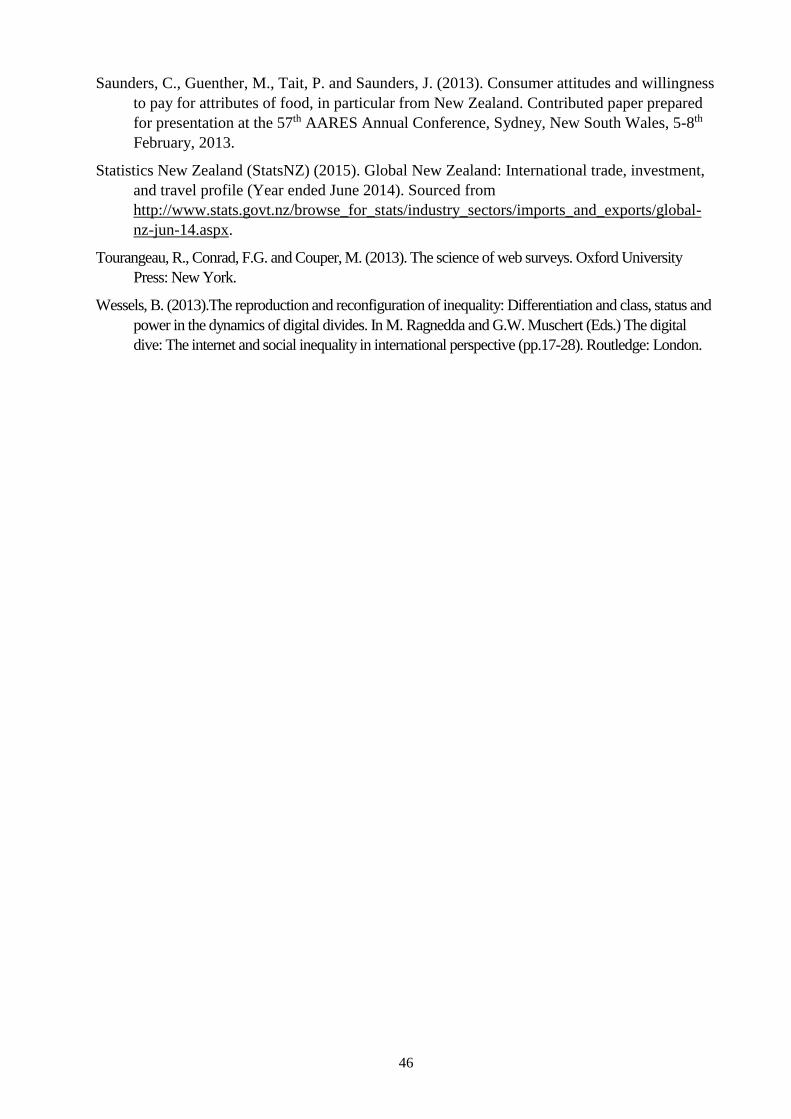
46
Saunders, C., Guenther, M., Tait, P. and Saunders, J. (2013). Consumer attitudes and willingness
to pay for attributes of food, in particular from New Zealand. Contributed paper prepared
for presentation at the 57th AARES Annual Conference, Sydney, New South Wales, 5-8th
February, 2013.
Statistics New Zealand (StatsNZ) (2015). Global New Zealand: International trade, investment,
and travel profile (Year ended June 2014). Sourced from
http://www.stats.govt.nz/browse_for_stats/industry_sectors/imports_and_exports/global-
nz-jun-14.aspx.
Tourangeau, R., Conrad, F.G. and Couper, M. (2013). The science of web surveys. Oxford University
Press: New York.
Wessels, B. (2013).The reproduction and reconfiguration of inequality: Differentiation and class, status and
power in the dynamics of digital divides. In M. Ragnedda and G.W. Muschert (Eds.) The digital
dive: The internet and social inequality in international perspective (pp.17-28). Routledge: London.
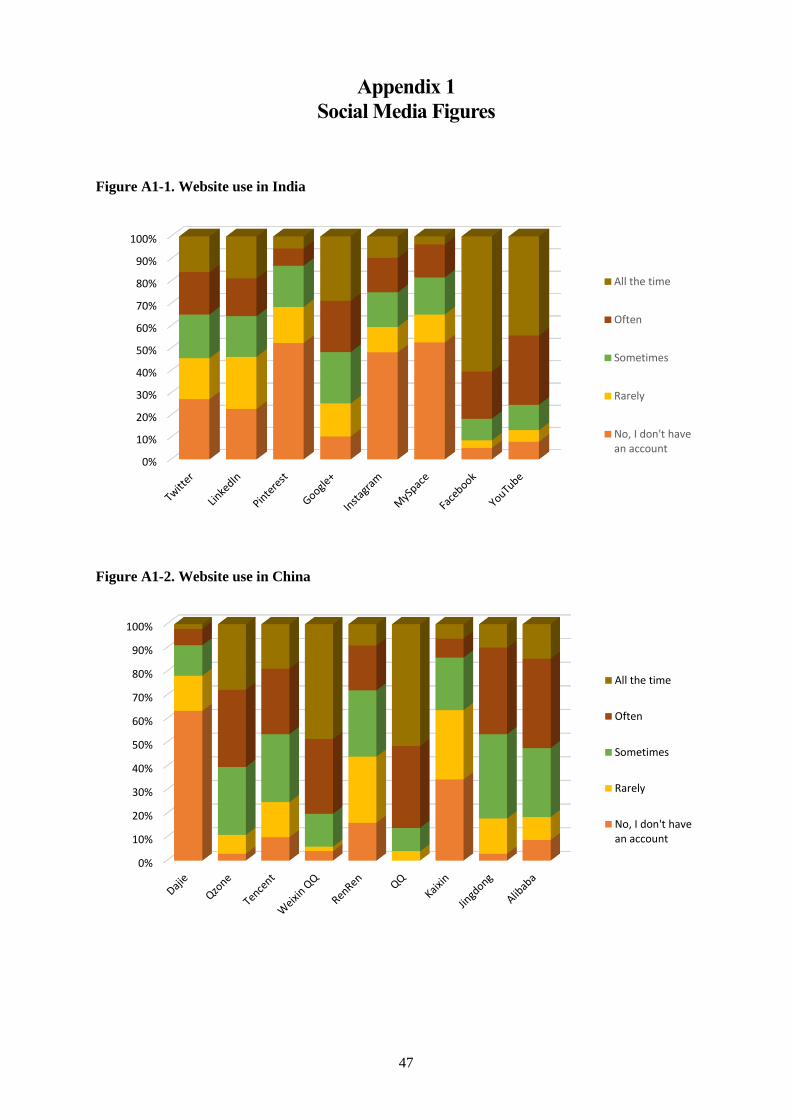
47
Appendix 1
Social Media Figures
Figure A1-1. Website use in India
Figure A1-2. Website use in China
0%
10%
20%
30%
40%
50%
60%
70%
80%
90%
100%
All the time
Often
Sometimes
Rarely
No, I don't havean account
0%
10%
20%
30%
40%
50%
60%
70%
80%
90%
100%
All the time
Often
Sometimes
Rarely
No, I don't havean account
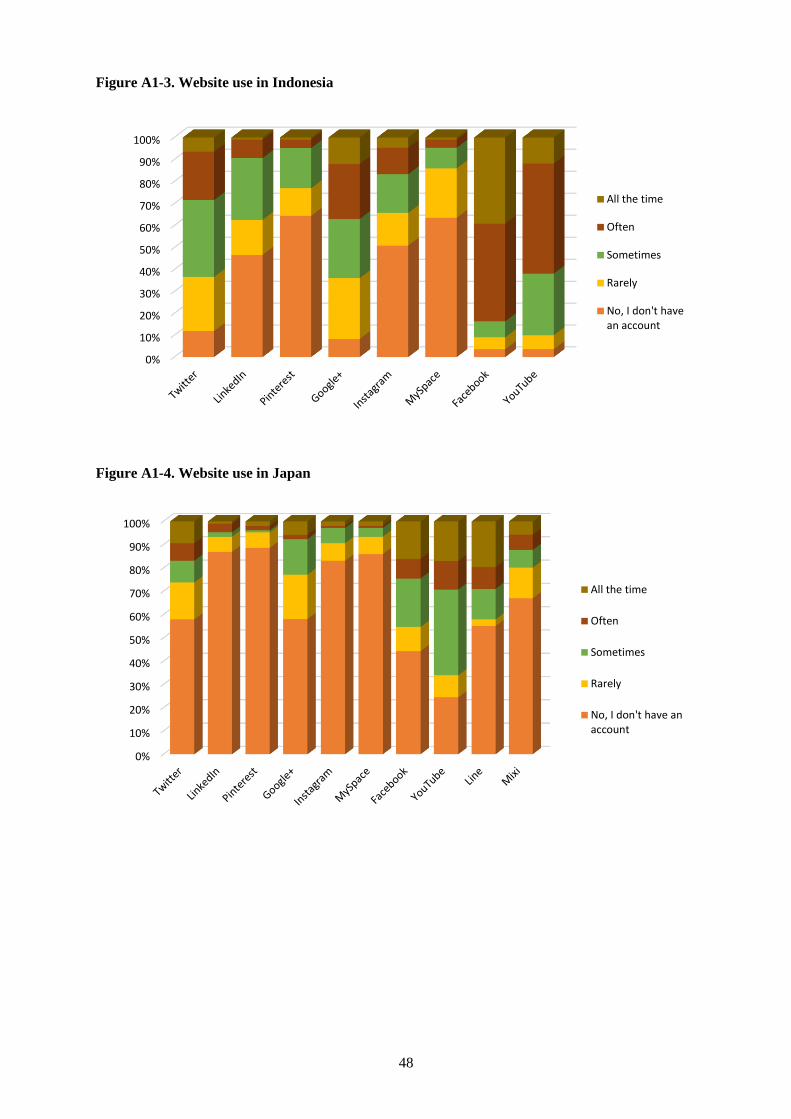
48
Figure A1-3. Website use in Indonesia
Figure A1-4. Website use in Japan
0%
10%
20%
30%
40%
50%
60%
70%
80%
90%
100%
All the time
Often
Sometimes
Rarely
No, I don't havean account
0%
10%
20%
30%
40%
50%
60%
70%
80%
90%
100%
All the time
Often
Sometimes
Rarely
No, I don't have anaccount
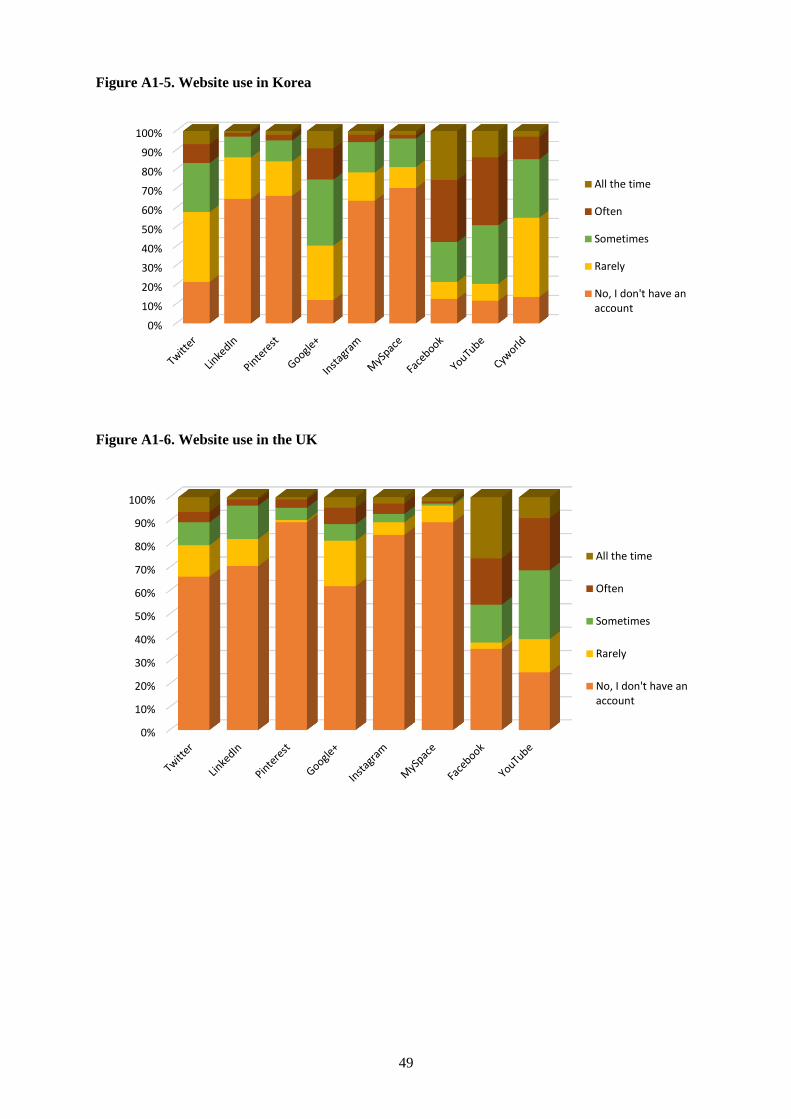
49
Figure A1-5. Website use in Korea
Figure A1-6. Website use in the UK
0%
10%
20%
30%
40%
50%
60%
70%
80%
90%
100%
All the time
Often
Sometimes
Rarely
No, I don't have anaccount
0%
10%
20%
30%
40%
50%
60%
70%
80%
90%
100%
All the time
Often
Sometimes
Rarely
No, I don't have anaccount

50
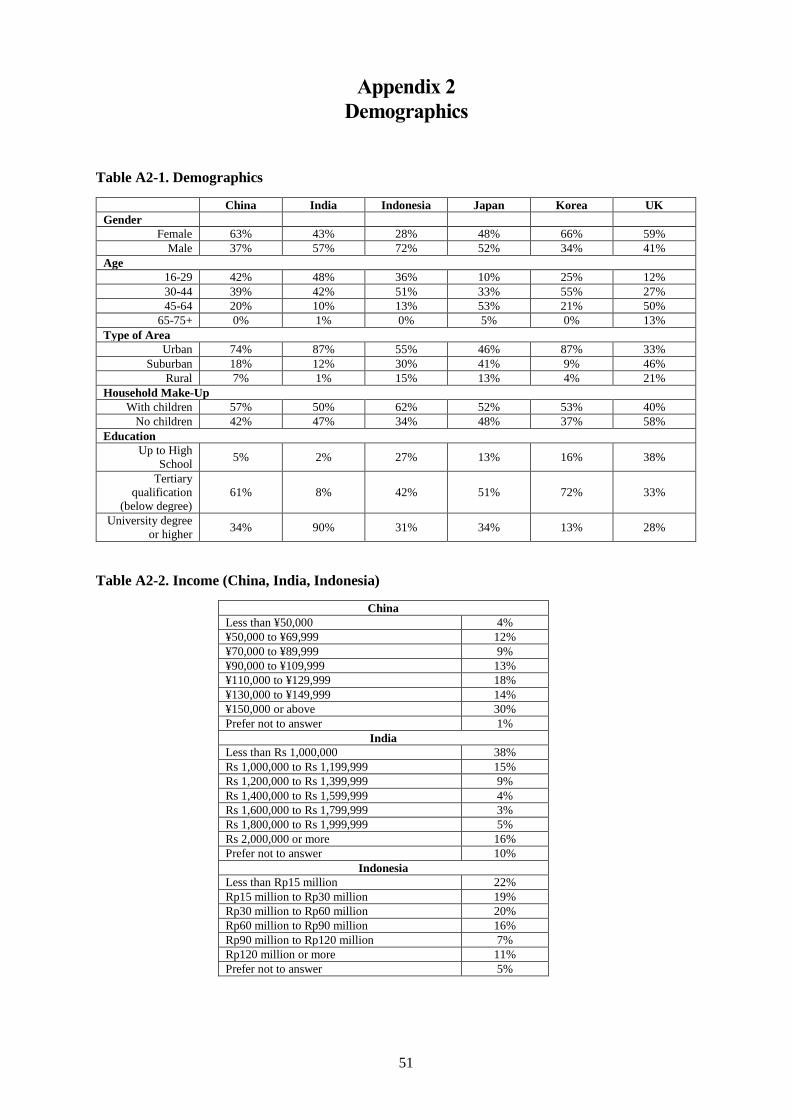
51
Appendix 2
Demographics
Table A2-1. Demographics
China India Indonesia Japan Korea UK
Gender
Female 63% 43% 28% 48% 66% 59%
Male 37% 57% 72% 52% 34% 41%
Age
16-29 42% 48% 36% 10% 25% 12%
30-44 39% 42% 51% 33% 55% 27%
45-64 20% 10% 13% 53% 21% 50%
65-75+ 0% 1% 0% 5% 0% 13%
Type of Area
Urban 74% 87% 55% 46% 87% 33%
Suburban 18% 12% 30% 41% 9% 46%
Rural 7% 1% 15% 13% 4% 21%
Household Make-Up
With children 57% 50% 62% 52% 53% 40%
No children 42% 47% 34% 48% 37% 58%
Education
Up to High
School 5% 2% 27% 13% 16% 38%
Tertiary
qualification
(below degree)
61% 8% 42% 51% 72% 33%
University degree
or higher 34% 90% 31% 34% 13% 28%
Table A2-2. Income (China, India, Indonesia)
China
Less than ¥50,000 4%
¥50,000 to ¥69,999 12%
¥70,000 to ¥89,999 9%
¥90,000 to ¥109,999 13%
¥110,000 to ¥129,999 18%
¥130,000 to ¥149,999 14%
¥150,000 or above 30%
Prefer not to answer 1%
India
Less than Rs 1,000,000 38%
Rs 1,000,000 to Rs 1,199,999 15%
Rs 1,200,000 to Rs 1,399,999 9%
Rs 1,400,000 to Rs 1,599,999 4%
Rs 1,600,000 to Rs 1,799,999 3%
Rs 1,800,000 to Rs 1,999,999 5%
Rs 2,000,000 or more 16%
Prefer not to answer 10%
Indonesia
Less than Rp15 million 22%
Rp15 million to Rp30 million 19%
Rp30 million to Rp60 million 20%
Rp60 million to Rp90 million 16%
Rp90 million to Rp120 million 7%
Rp120 million or more 11%
Prefer not to answer 5%
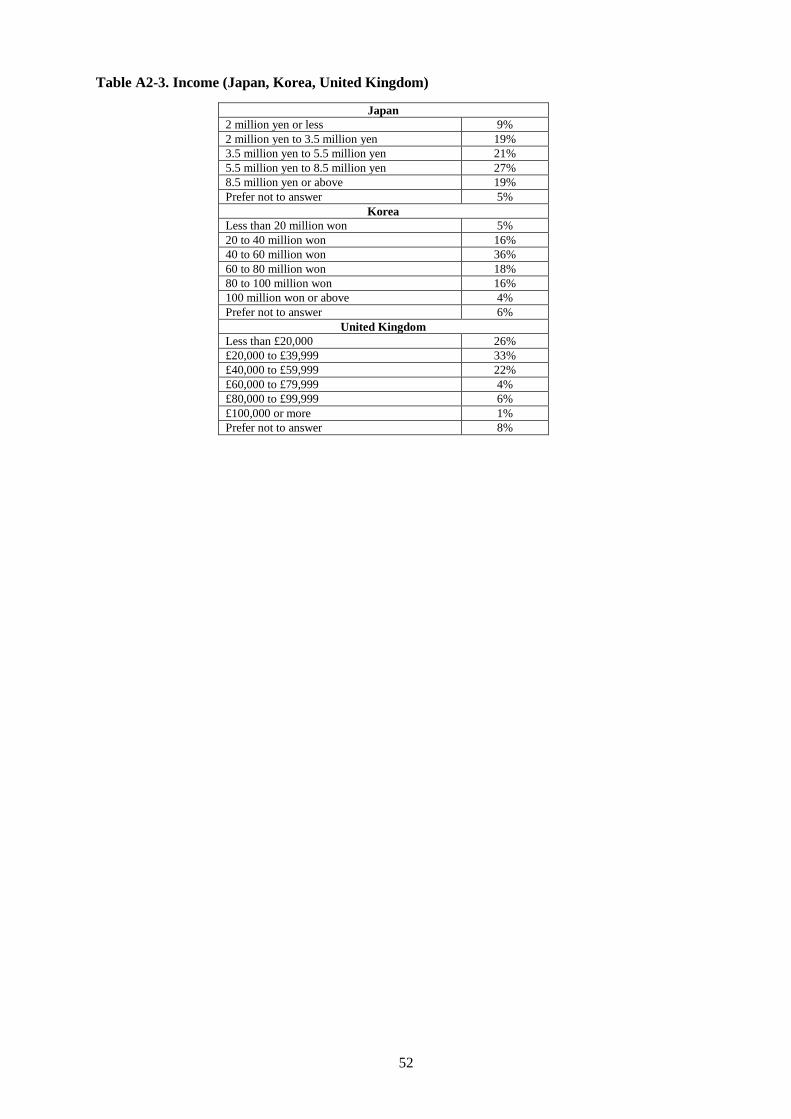
52
Table A2-3. Income (Japan, Korea, United Kingdom)
Japan
2 million yen or less 9%
2 million yen to 3.5 million yen 19%
3.5 million yen to 5.5 million yen 21%
5.5 million yen to 8.5 million yen 27%
8.5 million yen or above 19%
Prefer not to answer 5%
Korea
Less than 20 million won 5%
20 to 40 million won 16%
40 to 60 million won 36%
60 to 80 million won 18%
80 to 100 million won 16%
100 million won or above 4%
Prefer not to answer 6%
United Kingdom
Less than £20,000 26%
£20,000 to £39,999 33%
£40,000 to £59,999 22%
£60,000 to £79,999 4%
£80,000 to £99,999 6%
£100,000 or more 1%
Prefer not to answer 8%
RESEARCH REPORT
304 Cultural Models of GE Agriculture in the United
States (Georgia) and New Zealand (Canterbury)
Rinne, T. 2008
305 Farmer Level Marketing: Case Studies in the
South Island, of New Zealand
Bowmar, Ross K. 2008
306 The Socio Economic Status of the South Island
High country
Greer, Glen 2008
307 Potential Impacts of Biopharming on New
Zealand: Results from the Lincoln Trade and
Environment Model
Kaye-Blake, W., Saunders, C., de Arãgao Pereira, M.
2008
308 The Key Elements of Success and Failure in the
NZ Sheep Meat Industry from 1980 - 2007
McDermott, A., Saunders, C., Zellman, E., Hope, T.
and Fisher, A. 2008
309 Public Opinion on Freshwater Issues and
Management in Canterbury
Cook, A. 2008
310 Biodiversity Management: Lake Rotoiti Choice
Modelling Study Kerr, G. N. and Sharp, B.N.H. 2008
311 The Key Elements of Success and Failure in the
NZ Kiwifruit Industry
Kilgour, M., Saunders, C., Scrimgeour, F. and
Zellman, E. 2008
312 The Key Elements of Success and Failure in the
NZ Venison Industry
Shadbolt, N.M., McDermott, A., Williams, C., Payne,
T., Walters, D. and Xu, Y. 2008
313 The Key Elements of Success and Failure in the
NZ Dairy Industry
Conforte, D., Garnevska, E., Kilgour, M., Locke, S.
and Scrimgeour, F. 2008
314 A Review of Research on Economic Impacts of
Climate Change
Kaye-Blake, W., Greenhalgh, S., Turner, J., Holbek,
E., Sinclair, R., Matunga, T. and Saunders, C. 2009
315 Managerial Factors in Primary Production: Data
from a sample of New Zealand Farmers with an
Emphasis on Experience as a Factor in Success
Nuthall, P. 2009
316 Modelling Climate Change Impacts on
Agriculture and Forestry with the extended
LTEM (Lincoln Trade and Environment Model)
Saunders, C., Kaye-Blake, W. and Turner, J. 2009
317 Economic Strategy Issues for the New Zealand
Region in the Global Economy
Saunders, C., Dalziel, P. and Kaye-Blake, W. 2009
318 Multi-agent Simulation Models in Agriculture: A
Review of their Construction and Uses
Kaye-Blake, W., Li, F. Y., Martin, A. M.,
McDermott, A., Rains, S., Sinclair, S. and Kira, A.
2010
319 Sustainability Trends in Key Overseas Markets:
Market Drivers and Implications to Increase
Value for New Zealand Exports
Saunders, C., Guenther, M. and Driver, T. 2010
320 The Socio-technical Networks of Technology
Users’ Innovation in New Zealand: A Fuzzy-set
Qualitative Comparative Analysis
Lambert, S. and Fairweather, J.R. 2010
321 Comparison of Innovation Policies in selected
European, Asian, and Pacific Rim Countries: How
to best to optimise Innovation Governance in New
Zealand
Fairweather, J., Wintjes, R, Williams, J., Rinne, T.
and Nauwelaers, C. 2011
322 The Economic and Social Value of Sport and
Recreation to New Zealand
Dalziel, D. 2011
323 An International Comparison of Models of
Innovation and their Implications of New Zealand
Rinne, T. A. and Fairweather J. 2011
324 Enhancing Value for New Zealand Farmers by
Improving the Value Chain
Saunders, C., McDonald, H. and Driver, T. 2011
325 An International Comparison of Models and
Cultural and National Identity and their
Implications for New Zealand Innovation
Rinne, T. and Fairweather, J. 2011
326 Publication cancelled.
327 The Cost of Psa-V to the New Zealand Kiwifruit
Industry and the Wider Community
Greer, G. and Saunders, C. 2012
328 50 Years of the AERU: An Examination and
Summary of Past Research
Driver, T. and Saunders, C. 2012
329 Perceptions of Sustainability of Dairy Support
Land Farmers Bennett, M.R., Pangborn. M.C. and Bywater, A.C.
2012
330 Modelling Alternative Dryland Sheep Systems
Gicheha, M.G., Edwards, G.R., Bell, S.T. and Burtt,
E.S. 2012
331 Report on a Succession and Governance Survey of
a Random Stratified Sample of NZ Farmers
Nuthall, P.L. and Old, K.M. 2014
332 Maximising Export Returns (MER): Consumer
behaviour and trends for credence attributes in
key markets and a review of how these may be
communicated
Miller, S., Driver, T., Velasquez, N., and Saunders,
C. 2014