consumer and food safety costs of offshoring animal...
TRANSCRIPT

Consumer and Food Safety Costs of Offshoring Animal Agriculture
A report prepared for
United Soybean Board
September 29, 2011
Promar International 333 N. Fairfax Street, Suite 202
Alexandria, VA 22314 USA Tel: (703) 739-9090 Fax: (703) 739-9098
E-mail: [email protected]


i
Consumer and Food Safety Costs of Offshoring Animal Agriculture
A report prepared for
United Soybean Board
CONTENTS
EXECUTIVE SUMMARY 1
SECTION 1: INTRODUCTION 2
1.1 The focus of this report 2 1.2 Animal agriculture in the United States 3 1.3 Current role of imports 3 1.4 Issues and methodology 5 1.5 Structure of the report 5
SECTION 2: CASE STUDY: THE UK PORK INDUSTRY EXPERIENCE 7
SECTION 3: SUPPLY, DEMAND, AND COST OF PRODUCTION 12
3.1 United States production context 12 3.2 Pork 12
3.2.1 Imports by source 14 3.2.2 Production cost breakdown 15
3.3 Broilers 17 3.3.1 Imports by source 18 3.3.2 Production cost breakdown 19
3.4 Eggs 19 3.4.1 Supply-demand balance 20 3.4.2 Imports by source 21 3.4.3 Production cost breakdown 21
3.5 Beef 21 3.5.1 Supply-demand balance 21 3.5.2 Imports by source 23
3.6 US production and trade in the global context 23 3.7 Mexico: production, trade, and regulation 24
3.7.1 Pork 24 3.7.2 Broilers 28 3.7.3 Eggs 30 3.7.4 Beef 30 3.7.5 Mexico summary 33
3.8 Brazil: production, trade, and regulation 34 3.8.1 Pork 35 3.8.2 Broilers 37

ii
3.8.3 Eggs 39 3.8.4 Beef 40 3.8.5 Brazil summary 41
3.9 The growth and competition is in export markets 42
SECTION 4: POTENTIAL IMPACT OF NEW REGULATIONS 44
4.1 Potential areas of regulation 44 4.1.1 Animal (group) housing 44 4.1.2 Environmental regulations 48 4.1.3 Subtherapeutic antimicrobial use and other dietary agents 51 4.1.4 Labor issues / regulation enforcement 55 4.1.5 Livestock contracting and marketing regulations 56 4.1.6 Regulations: summary 58
4.2 Analysis and potential impact: regulations 60
SECTION 5: FOOD SAFETY 65
5.1 The United States – Animal agriculture and food safety regulations 65 5.1.1 The US food safety regulatory regime 65 5.1.2 Foodborne illness 65 5.1.3 Food imports and US inspections 69
5.2 Brazil – Animal agriculture regulations and food safety 70 5.2.1 Food safety regulations 70 5.2.2 Foodborne illness 71 5.2.3 FSIS audit of Brazil’s meat inspection system - summary findings 73
5.3 Mexico – Animal agriculture regulations and food safety 73 5.3.1 Food safety regulations 73 5.3.2 Foodborne illness 73 5.3.3 FSIS audit of Mexico’s meat inspection system - summary findings 74
5.4 Analysis: Food safety impact of increased animal agriculture imports 75 5.4.1 US import requirements for meat and poultry 75 5.4.2 Domestic vs. imported 75 5.4.3 Trend toward safety 76
SECTION 6: CONCLUSIONS 78
6.1 Added regulations increase costs and reduce demand 78 6.2 Jurisdictions that are early to adopt constraints / costs show decline 79 6.3 Production for the domestic market is unlikely to move overseas, short term 79 6.4 An increase in animal agriculture imports would not likely impose safety costs 79 6.5 The primary threat is to exports 80 6.6 Consumer (and foreign) markets may dictate change, regulation or no 80
APPENDICES 81
A1 – US regulatory authorities 81 A2 - Links 82
Consumer and Food Safety Costs of Offshoring Animal Agriculture
Executive summary
1
EXECUTIVE SUMMARY
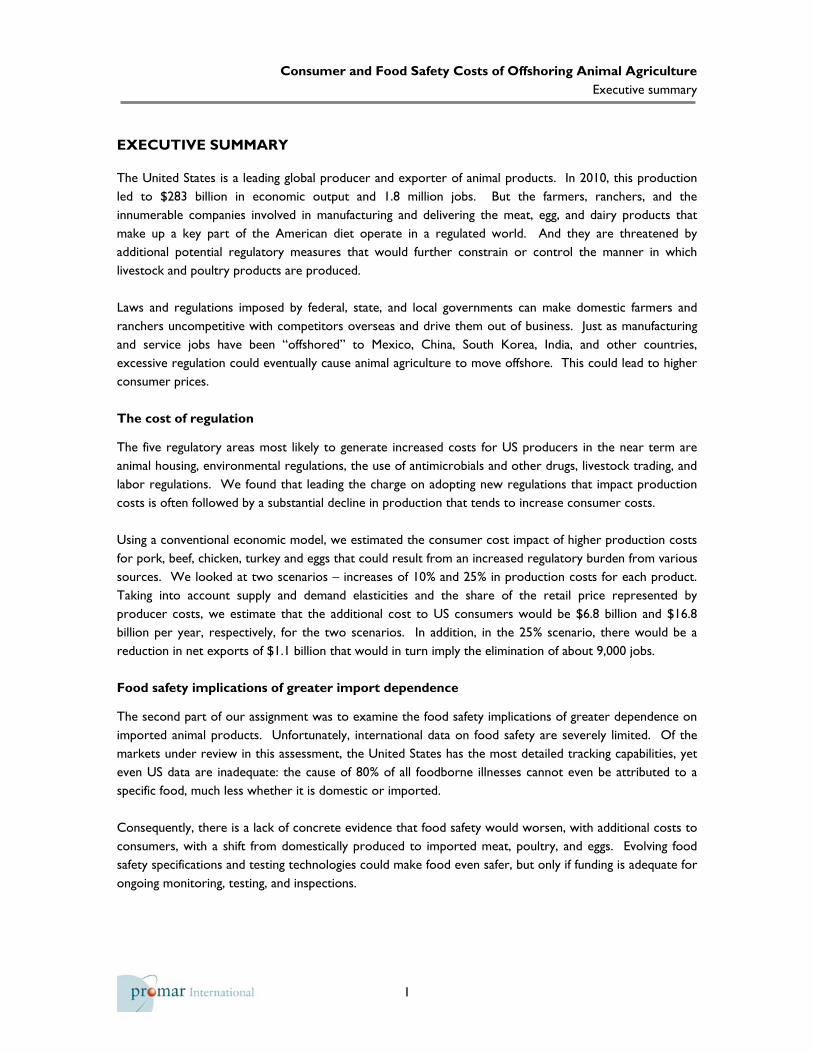
The United States is a leading global producer and exporter of animal products. In 2010, this production led to $283 billion in economic output and 1.8 million jobs. But the farmers, ranchers, and the innumerable companies involved in manufacturing and delivering the meat, egg, and dairy products that make up a key part of the American diet operate in a regulated world. And they are threatened by additional potential regulatory measures that would further constrain or control the manner in which livestock and poultry products are produced. Laws and regulations imposed by federal, state, and local governments can make domestic farmers and ranchers uncompetitive with competitors overseas and drive them out of business. Just as manufacturing and service jobs have been “offshored” to Mexico, China, South Korea, India, and other countries, excessive regulation could eventually cause animal agriculture to move offshore. This could lead to higher consumer prices. The cost of regulation
The five regulatory areas most likely to generate increased costs for US producers in the near term are animal housing, environmental regulations, the use of antimicrobials and other drugs, livestock trading, and labor regulations. We found that leading the charge on adopting new regulations that impact production costs is often followed by a substantial decline in production that tends to increase consumer costs. Using a conventional economic model, we estimated the consumer cost impact of higher production costs for pork, beef, chicken, turkey and eggs that could result from an increased regulatory burden from various sources. We looked at two scenarios – increases of 10% and 25% in production costs for each product. Taking into account supply and demand elasticities and the share of the retail price represented by producer costs, we estimate that the additional cost to US consumers would be $6.8 billion and $16.8 billion per year, respectively, for the two scenarios. In addition, in the 25% scenario, there would be a reduction in net exports of $1.1 billion that would in turn imply the elimination of about 9,000 jobs. Food safety implications of greater import dependence
The second part of our assignment was to examine the food safety implications of greater dependence on imported animal products. Unfortunately, international data on food safety are severely limited. Of the markets under review in this assessment, the United States has the most detailed tracking capabilities, yet even US data are inadequate: the cause of 80% of all foodborne illnesses cannot even be attributed to a specific food, much less whether it is domestic or imported. Consequently, there is a lack of concrete evidence that food safety would worsen, with additional costs to consumers, with a shift from domestically produced to imported meat, poultry, and eggs. Evolving food safety specifications and testing technologies could make food even safer, but only if funding is adequate for ongoing monitoring, testing, and inspections.

Consumer and Food Safety Costs of Offshoring Animal Agriculture
Introduction
2
SECTION 1: INTRODUCTION
This report, prepared by Promar International for the United Soybean Board, focuses on the potential consumer cost of additional regulation of animal agriculture, and on food safety issues associated with greater reliance on imported meat, poultry and egg products if domestic production were to decline.
1.1 The focus of this report
Animal agriculture in the United States plays a critical role in meeting not only this country’s food requirements but the needs of foreign consumers as well. The United States is blessed with rich natural resources for agricultural production, whether in the form of crops (fruit, vegetables, grain, oilseeds, fiber) or animal products (meat, eggs, or milk). In addition to meeting US consumers’ food needs, the food and agriculture sector racked up net exports of $34 billion in 2010. Livestock, poultry and dairy products account for about 20% of US agricultural exports. One thing that worries the agricultural community is that increased regulation of animal agriculture will make it less competitive with production in other countries. This could lead to a decline in domestic production, a decline in exports, and an increase in reliance on imported animal products. This is of concern to the livestock and poultry producers that supply the meat, egg and dairy products, to the farmers that provide the feed these animals consume, and to those who view a certain level of food self-sufficiency as a national security issue. The largest market for the corn and soybeans grown in the United States is feed for animals raised in this country. Consumers could also be adversely affected by this outsourcing or offshoring of animal agriculture, either as a result of higher prices or reduced food safety. The popular media have recently become sensitized to various issues that have been prominent in other mature economies. In particular, there is growing focus on how food is produced, although this is largely restricted to a small, yet vocal, minority of consumers, primarily better-off consumers located in coastal regions: individuals whose daily routines leave them far-removed from food production. To illustrate the point that it is still a minority of consumers that have concerns, it is worth noting that despite the furor about caged hens in some circles, 96% of all eggs bought by consumers are from caged hens and only 1% are free range. But production method issues are steadily gaining traction in the minds of consumers. In response, some states and localities have implemented regulations that are intended to address animal welfare, environmental issues, location issues, or other aspects of production methods, but tend to have unanticipated consequences that constrain farmers and ranchers that raise livestock and poultry. Legislative proposals at the federal level with similar intentions often have similar consequences. This regulation and legislation concerns those that depend on animal agriculture in the United States, from high value feed additive companies to basic commodity suppliers, since trends could gather pace, as they already have in Europe. The additional costs incurred can reduce competitiveness for US meat products both here and in export markets abroad. The US has been a powerhouse in commodity agriculture and it has been in a position of strength historically with the only significant incursions into the domestic meat market comprising ground beef and specialty products such as pork ribs to the East Coast from Denmark. In domestic and export markets, US animal agriculture has grown on the basis of its underlying economic

Consumer and Food Safety Costs of Offshoring Animal Agriculture
Introduction
3
strength and its ability to battle competitors on price and quality. American farmers and ranchers expect to compete on a level playing field, and excessive domestic regulation can be injurious.
1.2 Animal agriculture in the United States
US livestock and poultry industries are in a state of flux. Globalization, trade liberalization, and environmental regulation have increased competitive pressures on the farmers and ranchers that supply meat, milk, eggs, and other animal products in many parts of the country. Awareness of animal welfare and food safety issues is growing among consumers, but not necessarily accompanied by knowledge of modern animal agriculture production methods. Domestic animal agriculture is by far the major source of demand for US corn and soybean meal, and future demand for these crops is tightly linked to the health of the livestock and poultry industries. In 2009/10, animals consumed 27 million metric tons of soybean meal, 137 million tons of corn and other feed grains, and 39 million tons of corn by-products like distillers dried grains and corn gluten feed and meal. In the case of soybean meal, this was the principal driver of soybean processing, which also produces the soybean oil that is essential for the US food industry. Actions to maintain and expand animal agriculture in the United States by supporting its long-term competitiveness are of critical importance to US crop farmers and the health of rural America. Animal agriculture encompasses mainly beef cattle, hogs, broilers, turkeys, eggs, sheep, dairy, and aquaculture. The most recent complete calendar year data on livestock, poultry and aquaculture output covers 2010. In that year, it had the following positive national economic impacts:
1,853,013 » Job impact throughout the economy $289 billion » Impact on total output in the economy $51 billion » Impact on household incomes $13 billion » Impact on income taxes paid $6 billion » Impact on property taxes paid.
Table 1 shows these impacts at the state level. The impacts on output, incomes and jobs were calculated using the Department of Commerce’s RIMS-II multipliers from their national input-output model. The income tax estimates are our own, based on federal and state tax rates on household incomes. The property tax estimates are from the 2007 Census of Agriculture.
1.3 Current role of imports
The United States imports $86 billion of foodstuffs from other countries. These account for about 7% of the national food bill of $1.2 trillion, as estimated by USDA. Some of the imports are products we do not produce in any quantity, like coffee, cocoa, bananas and palm oil, while others are specialty products like cheeses and foreign wines. Another part is comprised of counter-seasonal imports of fresh fruits and vegetables from the Southern Hemisphere during the Northern Hemisphere winter. And the rest includes a range of products that are also produced domestically. Table 2 below shows exports and imports in the broad animal agriculture categories on which we will be focusing. Overall, in 2010 the United States exported almost twice as much as it imported, resulting in net exports of $10.7 billion of animal products.

Consumer and Food Safety Costs of Offshoring Animal Agriculture
Introduction
4
Table 1: Economic impact of 2010 Animal Agriculture
StateOutput ($000)
Earnings ($000)
Employment (jobs)
Income Tax ($000)
2007 Property Taxes ($000)
Alabama 9,016,269 1,578,113 58,942 399,736 43,059Alaska 6,720 986 42 200 1,312Arizona 2,181,362 400,055 12,587 99,494 32,745Arkansas 12,056,084 2,020,128 69,023 552,101 76,778California 17,578,200 3,348,307 93,775 1,000,474 638,682Colorado 6,998,117 1,269,672 55,303 316,910 89,405Connecticut 230,571 38,435 1,690 9,736 23,053Delaware 1,610,574 232,600 6,307 63,453 4,524Florida 2,100,666 381,579 14,621 77,575 180,155Georgia 11,736,940 2,137,288 58,584 562,748 139,812Hawaii 84,183 14,229 611 4,067 10,873Idaho 6,724,751 1,148,528 38,843 323,081 62,915Illinois 4,470,220 811,550 24,236 189,335 245,586Indiana 5,788,767 1,001,691 38,854 237,701 207,559Iowa 19,207,642 3,200,268 101,305 937,998 353,029Kansas 11,570,180 1,853,114 99,251 496,264 191,132Kentucky 5,171,592 880,197 32,688 229,996 102,439Louisiana 583,017 100,623 4,242 26,494 26,956Maine 347,947 62,788 3,139 17,066 24,156Maryland 1,864,031 308,829 11,223 77,454 41,361Massachusetts 83,747 14,747 559 3,780 32,509Michigan 4,468,828 819,501 37,629 202,253 188,916Minnesota 11,714,323 2,086,258 71,233 571,217 241,383Mississippi 8,144,450 1,361,768 55,498 344,936 78,158Missouri 6,724,703 1,129,789 43,172 297,473 172,858Montana 3,198,792 541,942 28,605 147,571 115,971Nebraska 13,169,276 2,101,570 68,510 570,996 316,430Nevada 500,012 81,272 4,116 16,523 13,189New Hampshire 94,950 16,208 664 4,105 19,974New Jersey 48,412 8,428 406 2,179 54,754New Mexico 4,265,578 732,313 27,668 184,763 29,117New York 4,066,656 686,232 24,675 186,518 188,015North Carolina 13,886,535 2,483,950 75,118 697,493 127,148North Dakota 2,020,340 321,645 10,334 76,455 110,963Ohio 6,883,235 1,240,526 55,066 303,172 164,687Oklahoma 10,433,120 1,795,094 70,557 463,673 106,592Oregon 2,384,754 417,556 17,595 122,469 101,411Pennsylvania 8,349,546 1,514,757 59,683 354,453 211,603Rhode Island 5,929 985 42 269 6,421South Carolina 2,204,297 380,784 14,426 104,068 37,423South Dakota 5,648,266 904,959 28,706 183,978 148,940Tennessee 2,672,627 458,691 16,291 120,773 97,014Texas 28,831,676 5,318,826 214,147 1,081,317 489,194Utah 1,889,154 345,879 14,305 87,611 28,431Vermont 1,589,617 266,127 9,378 77,922 30,579Virginia 2,549,662 432,715 15,047 112,852 96,068Washington 3,806,664 689,831 20,988 140,243 161,799West Virginia 670,475 105,798 4,243 27,857 19,612Wisconsin 12,079,534 2,196,134 97,069 589,223 307,453Wyoming 1,389,170 206,386 8,664 41,958 30,904National 283,102,163 49,449,651 1,819,662 12,739,984 6,223,047

Consumer and Food Safety Costs of Offshoring Animal Agriculture
Introduction
5
Table 2: US Animal Product Trade in 2010 ($billion) Exports Imports Net Exports Livestock and products 14.4 9.2 5.2 Poultry and products 4.8 0.5 4.3 Dairy products 3.7 2.5 1.2 Total 22.9 12.2 10.7
1.4 Issues and methodology
The first issue we will address is the potential effect of growing regulation on supplies and production costs and the impact this would have on consumer food costs. Increased regulation can result in higher consumer costs by either requiring capital investment or specific production methods that involve higher ongoing expenditures for labor or other inputs, or by causing firms to exit the industry, reducing supply. The second issue is with regard to the safety of imported food or food ingredients. The United States has comparatively high food safety standards, as do other developed economies like Canada, Japan, and the Western European countries. Standards in some developing economies can be lower or may just not be enforced. Thus, greater reliance on imported animal products could in theory expose consumers to greater risk of food related illness. It is well documented that the rate of inspection of imported foods is lower than that for domestic production. Our methodology is built upon comparative studies and basic economic analysis. We compare the implications of different regulatory environments for hog, cattle, poultry and egg production in two countries with different institutional structures to our own. The two countries we have chosen are Brazil and Mexico. Brazil is an obvious choice given its growth in production and exports of animal products in recent years. Mexico is both an important customer and competitor. It is particularly well placed geographically to exploit any disadvantages that develop for US producers. But we will start in Section 2 with a good example of what happens when the ambitions of regulators get ahead of what the marketplace will accommodate: the case of sow stall regulations in the United Kingdom.
1.5 Structure of the report
The remainder of this report is structured as follows:
• Section 2 presents the instructive experience of the United Kingdom, following its self-imposed ban on sow stalls;
• Section 3 provides the background context on animal agriculture in the United States, followed by details on two important markets, Mexico and Brazil;
• Section 4 provides detail on potential regulations that may be brought to bear on the US animal agriculture industry, along with available evidence regarding the type of impact these

Consumer and Food Safety Costs of Offshoring Animal Agriculture
Introduction
6
changes may have. At the end of Section 4, we provide an analysis of the potential consumer cost impact of such additional regulations;
• Section 5 covers the food safety angle, with background on the food safety context in the United States and how we manage the safety of both domestic and foreign foods. It also provides details on the relevant systems in Mexico and Brazil. The section concludes with findings on the potential impact on food safety in the US that might result from increased imports of meat and poultry products.
• Section 6 summarizes our conclusions.
Appendices are included with additional supporting detail and references.

Consumer and Food Safety Costs of Offshoring Animal Agriculture
Case study: The UK pork industry experience
7
SECTION 2: CASE STUDY: THE UK PORK INDUSTRY EXPERIENCE
The United Kingdom case is instructive because it shows the consequence of a jurisdiction adopting, unilaterally, legislation that increases producer costs. We share additional such examples later in this report, but the UK case is unique in that it represents the consequence for an entire country’s consumers and agricultural community. Imposing regulations
While the European Union agricultural sector operates a common agricultural policy, there are substantial opportunities for member state governments to modify regulations affecting their industry, as long as they do not conflict with the rules of a single (European) market. Consequently, each member state has some autonomy and can introduce its own regulations that may influence the competitive position of industries within its boundaries. There are many examples of this throughout the European Union as member state regulations, and taxes and fees, affect a wide range of local conditions, such as for example, those affecting labor, food safety, environmental impact, animal welfare, and food costs. In many ways, this is similar to the arrangements within the United States as individual states can implement regulations that distort incentives (e.g. through local taxes, incentives for investment, employment policies, environmental rules, etc.). Such rules, however, cannot be applied to farmers and ranchers outside the jurisdiction, or used to prevent trade. As a result, adoption of rules can put local producers at a competitive disadvantage and result in higher consumer costs. The United Kingdom at the (self) cutting edge
In a unilateral gesture intended to improve animal welfare, the United Kingdom adopted a ban on tethering and stalls for breeding sows in 1999. Hog organizations observe that this measure seriously undermined the UK hog industry competitiveness because producers in neighboring countries with strong hog production sectors were not subject to the same restrictions. A parliamentary inquiry in 1999 concluded that the prohibition of tethers and stalls would have a serious impact on UK hog farmers. Pig World magazine estimated that housing pigs in loose housing, instead of close confinement stalls, cost farmers £323m in conversion costs (approximately $70 per hog). A government established Farm Animal Welfare Council, an independent advisory body, estimated the additional capital costs of feeding systems and buildings at £400 to £700 per sow ($660-1,150), which at the 1999 sow herd of 600,000 animals represented industry-wide capital costs of $396m-$690m. BPEX agreed with these figures. As for annual operating costs, the British Pig Executive (BPEX) estimated compliance costs at £0.064 per kilo (about $0.05 per pound at the current exchange rate); Danish counterparts estimated a similar £0.05-£0.06 per Kg, which approximates to $0.04-$0.05 per pound or around $10 per 220 lb animal.

Consumer and Food Safety Costs of Offshoring Animal Agriculture
Case study: The UK pork industry experience
8
Applying these fixed and operating costs to US production, all else equal, would imply one-time capital costs to US producers of $5.8 billion (65 million animals at an inflation adjusted cost of $90/animal), plus increased operating costs of $1.1 billion annually. The consequences
The size of the English hog herd has fallen by more than 40% since 1999 and the level of imports rose rapidly to meet the UK’s pork and bacon demand. The relative decline in the UK hog herd is shown in the following chart, with 1999 (the year the regulations passed) serving as the reference year (production for all countries set to 100). The production level in the UK was already in decline, but dropped precipitously between 1999 and 2003: from the baseline of 100 to less than 70 in just four years. It has continued to decline, though more gradually, since.
Source: Eurostat A parliamentary inquiry set up in 2008 reported in January 2009 (with emphasis) that:
…there can be no doubt that the early introduction of a ban on stalls and tethers ahead of most of the EU, and without the assistance from the Government, placed a heavy financial burden on the industry. Many farmers are still recovering from the capital cost of the outlay necessary to comply with the welfare standards. It appears that the analysis of the cost on businesses likely to be imposed by the animal welfare measures introduced in 1999 significantly underestimated the capital costs to the pig industry. The Government must accept that its decision to introduce welfare legislation many years ahead of most of the EU was a significant factor in driving many farms out of business. The decision has placed English producers at a serious disadvantage to their EU counterparts, as our predecessor the Agriculture Committee predicted in 1999.1
1 House of Commons Environment, Food, and Rural Affairs Committee, The English Pig Industry: First Report of Session 2008-09, p. 18.

Consumer and Food Safety Costs of Offshoring Animal Agriculture
Case study: The UK pork industry experience
9
Various strategies were adopted for breeding herds, including the use of larger sow housing space (in effect doubling the space allowed for sows) and managing group housing. This involved higher capital investment:
• in buildings,
• in additional facilities for the storage of straw, and
• in new feeding systems.
Farmers incurred higher operating costs because of
• higher feed usage,
• additional labor required to manage the animals, and
• reduced productivity due to less efficient feeding, lower farrowing rates and smaller litter sizes.
It is widely accepted that by mid-decade the UK had the highest costs of production for hogs in the European Union. Research undertaken in 2006 suggested that the cost was £1.082 per kg compared with £0.913 for Denmark and £0.872 for the Netherlands, a 19% and 21% disadvantage, respectively. Not surprisingly, the decline in UK pork production was offset by imports from these and other countries. The Department of Environment, Food, and Rural Affairs (DEFRA) reported to a parliamentary committee in 2009 that UK production costs were 12% higher than the European Union average. There was also an impact on efficiency of operations as DEFRA noted that the average daily live weight gain of UK hogs was in the lower half of the European Union rankings, and that the average number of pigs weaned per year was 21.4 compared with 25.9 in Denmark and 25.1 in the Netherlands. These lower levels of efficiency reflect a move to more inefficient systems because of the regulations intended to improve animal welfare. Other factors affecting the industry
The UK hog industry had already been subject to intense competitive pressure since the late 1990s. A number of factors contributed to this, including several serious outbreaks of disease that led to restrictions on movement of animals and closing of export markets. The resulting reductions in productivity, and the introduction of the 1999 regulations, tipped the balance toward rapid contraction. Hog farmers in the UK have also commented on the implementation of a nitrates directive which laid down special provisions for storage of hog and poultry manure. The UK hog farmers’ representative organization insisted that these regulations led to higher implementation costs than those in other parts of the European Union where financial aid and assistance was available. In addition, to ensure compliance with the 1999 legislation, virtually the whole of the British pig production sector voluntarily participates in a pig farm assurance scheme. Under this scheme, farms are inspected quarterly by a veterinarian and annually by an independent inspector. This scheme implements standards for hog husbandry, welfare, traceability, and food safety, standards that exceed those required by legislation.

Consumer and Food Safety Costs of Offshoring Animal Agriculture
Case study: The UK pork industry experience
10
UK retailers, who exert substantial power in the country’s food chain, were reportedly the driving force behind the introduction of the standards. They were criticized, however, for adopting (weaker) EU standards once the tighter UK standards went into place, thus allowing them to import cheaper EU pork (at the expense of domestic producers facing the tougher new standards). Leveling the playing field?
The UK bans on tethers and close confinement stalls were introduced in advance of EU legislation. The EU eventually banned tethers in 2006 and it is anticipated that sow stalls will be banned from 2013.2 Consequently in 2013, all EU members should have similar animal welfare legislation. The disadvantage suffered by the UK industry may reverse to a limited extent when the EU legislation is implemented in 2013, but irreparable damage has already been done. Several EU member states are in the process of adjusting to the new regulations, often with the assistance of government programs to help with the adjustments. Both Ireland and France, for example, provide a grant to offset a percentage of the capital conversion costs (though capped at an absolute amount). By contrast, the UK government provided no adjustment assistance indicating its choice was not to use public money to pay people to meet their legal obligations. Cost to consumers
For British consumers, the regulations had a significant negative impact. The price of pork increased by about 25% between 1999 and 2004 after the ban was imposed and drove up farm level pigmeat costs and prices by a third. (In recent years there was another jump due to a combination of increased feed prices and currency fluctuations.) From 1999 to 2010, the pork Consumer Price Index (CPI) rose three times as much as the overall CPI, and more than twice as much as food inflation. Bacon prices also rose by more than the food CPI, but not by as much. The additional cost of the regulatory change to British consumers between 1999 and 2004 was approximately £250 million per year, or the equivalent of about $7 per person per year.
2 Although keeping sows in close-confinement stalls for four weeks after service will still be allowed.

Consumer and Food Safety Costs of Offshoring Animal Agriculture
Case study: The UK pork industry experience
11
Sources: BPEX, OECD
Lessons Self-imposed regulations can increase costs and reduce competitiveness. In the end, the UK legislation caused less pork to be produced domestically, and more had to be imported from competing producers with systems that did not face the same regulations. The goal of promoting animal welfare was not achieved. The 2008 parliamentary inquiry also concluded that a very high proportion of imported pig meat does not meet UK welfare standards, and reported that two thirds of imported pig meat may have been raised in conditions prohibited in the United Kingdom. There are also serious questions by animal welfare scientists as to whether the legislation improved animal welfare in the UK. Consumers pay the price of any regulation that is excessive or ahead of its time.

Consumer and Food Safety Costs of Offshoring Animal Agriculture
Supply, demand and cost of production
12
SECTION 3: SUPPLY, DEMAND, AND COST OF PRODUCTION
In this section, we begin by providing detail on the US production situation for pork, broilers, eggs, and beef. We then provide information on production and regulation in other key markets – Brazil and Mexico – to provide context on what major import and export markets for animal agriculture products are doing.
• Mexico is instructive because it is one of our largest export markets, yet is also advancing as an exporter of niche products, leveraging its low cost labor and access to low-cost US feed.
• Brazil is important as it is the United States’ most significant international agricultural competitor, with its soybean and corn harvests fueling its exports.
In Section 4 we then identify the key regulatory areas that may impact US production costs in the short to medium term, along with the potential magnitude of their impact, by sharing empirical results from states and/or foreign countries that have implemented such changes, as well as studies covering these issues. We conclude that section with our assessment of the likely cost impact on US consumers.
3.1 United States production context
The United States is one of the world’s largest producers of meat and eggs, ranking first in beef, chicken and turkey, second in eggs, and third in pork. The country is also a major exporter, ranking first for turkey and eggs, second for pork (behind the 27-country EU bloc), second for chicken (just behind Brazil), and third for beef (after Brazil and Australia). For corn and soybean farmers concerned about the future of animal agriculture in the United States, the key species are the pork and poultry that consume most of the prepared feed. Beef and dairy cattle are ruminants that obtain the largest portion of their nutrition from grazing on pastures and consuming harvested forage, although beef cattle also spend their final months before slaughter in feedlots consuming prepared feed.
3.2 Pork
The United States has a vibrant pork sector due primarily to the growth in exports over the past decade. Since 2000, domestic consumption of pork has varied between 8.5 and 9.0 million metric tons, with a slight uptrend. As recently as the mid-1990s, the United States was a net importer of pork, as shown in the next chart. Production, however, has grown by almost 20% over the period because of rising foreign demand for US pork. Annual exports of about 2 million tons are about five times the volume of imports. In April 2011, USDA published its semiannual “Livestock and Poultry: World Markets and Trade” report. This report forecasts that US exports will grow by more than 10% to 2.1 million tons in 2011. Brazilian and Mexican exports are up by lesser percentages. Meanwhile, EU domestic supplies and exports are forecast to fall because of smaller margins as a result of increased feed prices and additional costs associated with EU legislation intended to improve animal welfare.

Consumer and Food Safety Costs of Offshoring Animal Agriculture
Supply, demand and cost of production
13
United States: Pork (1,000 MT)
2006 2007 2008 2009 2010 2011
Beginning Stocks 218 224 224 235 238 238
Production 9,559 9,962 9,962 10,599 10,187 10,187
Imports 449 439 439 377 390 390
Total Supply 10,226 10,625 10,625 11,211 10,815 10,815
Exports 1,359 1,425 2,117 1,857 1,917 2,121
Domestic Consumption 8,643 8,965 8,806 9,013 8,653 8,547
Total Disappearance 10,002 10,390 10,923 10,870 10,570 10,668
Ending Stocks 224 235 -298 341 245 147 Source: USDA
As shown in the map on the next page, pork production has generally shifted from the periphery of the country, particularly from coastal states, and moved toward the Midwest where most of the corn and soybeans are produced and where feed is cheaper.

Consumer and Food Safety Costs of Offshoring Animal Agriculture
Supply, demand and cost of production
14
3.2.1 Imports by source
The table below shows US pork imports the last five years, ranked by the top 10 suppliers in 2010. Canada is by far the largest supplier, accounting for 83% of US imports in most years. This is not surprising given geographical proximity, and the efficiency and competitiveness of the Canadian pork industry. The rise of the Canadian dollar versus the US currency will make it more challenging for their exporters in the future, but Canada will certainly maintain its preeminent position as a supplier to the US market and as a competitor overseas. The second largest supplier is Denmark. Pork producers in that country have taken advantage of the insatiable demand for pork ribs in the United States to carve out a very successful niche. These figures are lower than in the supply demand table because they reflect actual product weight rather than carcass weight equivalent (CWE).

Consumer and Food Safety Costs of Offshoring Animal Agriculture
Supply, demand and cost of production
15
Pork: US imports by source, in MTs
Partner 2006 2007 2008 2009 2010 Canada 345,820 333,844 280,379 296,187 304,971 Denmark(*) 41,945 41,285 36,837 34,528 33,304 Poland 7,321 8,487 8,609 8,478 9,748 Italy(*) 3,614 4,147 4,023 3,694 4,467 Mexico 8,786 11,176 8,923 4,560 4,207 Netherlands 2,751 762 2,067 2,130 2,773 Ireland 1,778 2,366 1,866 1,642 2,211 United Kingdom 1,412 1,528 1,507 1,654 1,839 Chile 625 1,764 2,676 1,133 1,399 Finland 1,291 1,186 1,485 951 794 Other 2,788 2,205 1,873 1,737 1,609 Total 418,130 408,751 350,244 356,693 367,321
After these two leading suppliers, the remaining ones are mostly European Union countries. In fact, 98% of imports come from either Canada or the EU. US imports from Mexico have been only in the 5-11,000 ton range, i.e. rather negligible thus far. Their export capabilities are improving, however, as discussed below.
3.2.2 Production cost breakdown
Hogs are the one livestock type for which USDA still does production cost estimates. The latest available are for 2009 and 2010 and are reproduced on the next page. The costs are in dollars per hundredweight of gain after the feeder pig stage. Operating costs were $60.73/cwt in 2010, up from a year earlier when feed and feeder pig costs were lower. Feed represented 53% of operating costs in 2010. When overhead costs are included, total costs rose to $77.49/cwt and the percentage accounted for by feed falls to 41%. This is a liveweight cost and does not mean that the production cost for pork is $0.77 per pound. USDA does not explicitly report the cost of producing pork. However, in their food cost analysis they do examine margins along the meat value chain, and the starting point is necessarily the producer value. In 2008, the calendar year average of the monthly net farm value for pork was $0.83 per pound, after adjusting for byproduct values. This fell to $0.72 in 2009 and then jumped to $0.96 in 2010. But as shown in the following table, the farm value is only 25-30% of the retail value. So a 10% increase in production costs at the farm level, for example, typically contributes to a 3% increase by the time the consumer sees the product. This assumes that 100% of the cost increase is passed through. If in the future domestic supplies were smaller, due to excessive regulations and other factors that decrease supply, the price impact may be larger.

Consumer and Food Safety Costs of Offshoring Animal Agriculture
Supply, demand and cost of production
16
Retail versus Farm Value of Pork Net farm value Retail value Farm share of retail $/pound $/pound percent 2008 0.83 3.01 31.8 2009 0.72 2.82 25.5 2010 0.96 3.19 30.1
Hog production costs and returns per hundredweight gain, 2009-2010 Item United States Heartland Northern Crescent Prairie Gateway Eastern Uplands Southern Seaboard
2009 2010 2009 2010 2009 2010 2009 2010 2009 2010 2009 2010______
dollars per cwt gain
Gross value of production
Market hogs 41.30 53.64 41.49 53.38 39.16 51.17 37.82 51.40 29.97 40.93 44.90 58.55
Feeder pigs 11.82 18.56 11.04 17.34 10.36 16.48 8.15 12.80 29.31 46.11 14.86 23.18
Cull stock 0.74 0.99 0.69 0.93 1.10 1.47 1.20 1.59 2.54 3.45 0.24 0.31
Breeding stock 3.25 4.37 3.70 5.00 0.90 1.24 6.09 8.24 6.67 8.92 0.75 0.92
Inventory change -0.07 -0.13 -0.37 -0.01 1.40 0.18 -0.52 -0.28 0.33 1.02 0.92 -0.76
Other income 3.38 3.01 3.78 3.36 4.26 3.80 2.30 2.04 2.52 2.24 2.30 2.05
Total, gross value of production 60.42 80.44 60.33 80.00 57.18 74.34 55.04 75.79 71.34 102.67 63.97 84.25
Operating costs:
Feed --
Grain 4.75 4.77 5.55 5.59 5.86 5.75 5.66 5.81 2.70 2.69 0.48 0.48
Protein sources 2.73 2.67 2.95 2.99 2.93 2.45 5.10 4.70 1.97 1.79 0.30 0.26
Complete mixes 20.93 24.36 17.55 21.01 28.88 34.14 21.48 23.81 24.92 26.15 31.17 34.86
Other feed items 0.14 0.17 0.14 0.16 0.41 0.49 0.18 0.21 0.17 0.19 0.00 0.00
Total feed cost 28.55 31.97 26.19 29.75 38.08 42.83 32.42 34.53 29.76 30.82 31.95 35.60
Other --
Feeder pigs 15.09 23.61 14.38 22.45 12.31 19.40 9.93 15.57 11.42 17.98 22.62 35.29
Veterinary and medicine 1.13 1.15 1.20 1.22 1.06 1.07 1.40 1.41 1.27 1.27 0.69 0.70
Bedding and litter 0.03 0.03 0.03 0.03 0.06 0.05 0.09 0.09 0.07 0.07 0.00 0.00
Marketing 0.96 0.98 0.87 0.89 0.87 0.88 0.94 0.96 1.90 1.93 1.18 1.20
Custom services 0.37 0.37 0.38 0.38 0.99 1.01 0.09 0.09 0.95 0.97 0.20 0.20
Fuel, lube, and electricity 1.34 1.66 1.23 1.52 1.61 1.96 1.79 2.19 2.74 3.39 1.28 1.58
Repairs 0.89 0.90 0.85 0.86 0.99 0.99 0.86 0.87 1.78 1.81 0.84 0.85
Interest on operating capital 0.07 0.06 0.07 0.06 0.08 0.07 0.07 0.06 0.07 0.06 0.09 0.08
Total, operating costs 48.43 60.73 45.20 57.16 56.05 68.26 47.59 55.77 49.96 58.30 58.85 75.50
Allocated overhead:
Hired labor 2.01 2.06 1.97 2.05 2.36 2.41 3.08 3.25 3.78 3.77 1.32 1.25
Opportunity cost of unpaid labor 3.82 3.66 3.24 3.13 5.93 5.63 6.17 5.66 11.12 10.60 1.85 1.84
Capital recovery of machinery/equipment 8.67 8.75 8.52 8.64 10.89 10.72 9.28 9.30 16.61 16.83 7.03 7.16
Opportunity cost of land (rental rate) 0.04 0.03 0.03 0.03 0.05 0.04 0.02 0.02 0.05 0.05 0.02 0.02
Taxes and insurance 0.67 0.68 0.62 0.62 0.85 0.84 0.66 0.65 0.88 0.89 0.57 0.58
General farm overhead 1.56 1.58 1.36 1.37 2.66 2.71 1.21 1.21 2.08 2.10 1.51 1.54
Total, allocated overhead 16.77 16.76 15.74 15.84 22.74 22.35 20.42 20.09 34.52 34.24 12.30 12.39
Total costs listed 65.20 77.49 60.94 73.00 78.79 90.61 68.01 75.86 84.48 92.54 71.15 87.89
Value of production less total costs listed -4.78 2.95 -0.61 7.00 -21.61 -16.27 -12.97 -0.07 -13.14 10.13 -7.18 -3.64
Value of production less operating costs 11.99 19.71 15.13 22.84 1.13 6.08 7.45 20.02 21.38 44.37 5.12 8.75______
Supporting information:
Production arrangement (percent of production)
Independent 42 41 50 50 41 41 48 47 34 34 3 3
Under contract 58 59 50 50 59 59 52 53 66 66 97 97
Size of operation (head sold/removed)
Market hogs 2,748 2,942 3,156 3,345 1,350 1,473 1,944 2,111 1,235 1,312 7,231 7,399
Feeder pigs 2,481 2,679 2,677 2,863 922 1,023 1,503 1,649 4,024 4,319 7,127 7,294

Consumer and Food Safety Costs of Offshoring Animal Agriculture
Supply, demand and cost of production
17
3.3 Broilers
The United States is the world’s largest chicken grower. The country is also a major exporter, ranking second, just behind Brazil. US consumption has remained level over the last 6 years. A small consumption increase is forecast for 2011 to almost 14 million MT. Over the same timeframe exports grew by 25%.
United States: Broiler meat (1,000 MT)
2006 2007 2008 2009 2010 2011
Beginning Stocks 413 332 326 338 279 351
Production 15,930 16,226 16,561 15,935 16,563 16,792
Imports 21 28 36 39 44 44
Total Supply 16,364 16,586 16,923 16,312 16,886 17,187
Exports 2,361 2,678 3,157 3,093 3,072 2,971
Domestic Consumption 13,671 13,582 13,428 12,940 13,463 13,930
Total Disappearance 16,032 16,260 16,585 16,033 16,535 16,901
Ending Stocks 332 326 338 279 351 286 Source: USDA

Consumer and Food Safety Costs of Offshoring Animal Agriculture
Supply, demand and cost of production
18
Looked at over a longer timeframe, broiler production has grown strongly in many parts of the country, as illustrated in the figure above. This map is slightly more complex…states in white do not process broilers in volume; blue indicates states that have broiler production – possibly large, possibly increasing – but because there are so few producers, production data is withheld to avoid disclosing individual operations. For the states that report data, one can see particularly large growth in Texas, the Carolinas, and across a band running southwest from Lake Erie down to Mississippi. States showing declines are Florida, Virginia, and West Virginia.
3.3.1 Imports by source
The following table shows that Canada is consistently the United States’ largest source of imported poultry meat and further processed items like prepared chicken dinners. In 2010, 67,000 MT of poultry meat, mostly chicken, was imported from Canada. While this is a fraction of a percent of the total United States supply of poultry meat, it is still almost five times the size of the next largest supplier, Chile. The amount of poultry meat imported by the United States has grown from less than 60,000 MT in 2006 to 85,000 MT in 2010 but it is still insignificant in terms of total supply. These figures are lower than in the supply demand table because they reflect actual product weight rather than carcass weight equivalent (CWE).

Consumer and Food Safety Costs of Offshoring Animal Agriculture
Supply, demand and cost of production
19
Poultry meat: US imports by source, in MT Partner 2006 2007 2008 2009 2010 Canada 53,023 61,942 68,416 64,497 66,944 Chile - - 1,062 8,321 13,869 Mexico 5,474 7,004 6,699 3,517 3,356 Israel 252 842 952 1,006 1,040 Thailand 1 1 1 1 1 Ecuador - - - - 1 France 389 121 71 41 1 Peru 12 13 9 2 0 Other 95 30 0 0 0 Total 59,245 69,953 77,211 77,384 85,211
3.3.2 Production cost breakdown
The USDA does not publish production cost estimates for broilers. Calculation is complicated by the contract grower system under which the broiler company provides the chick and the feed, and the grower makes the investment in the grow-out house and pays for electricity, fuel, water, labor, and manure handling. From 2008-2010 the 12-city average broiler price was mostly in the $0.75-0.85 per pound range or about $1,765 per metric ton at the midpoint. Calculated processing margins ranged from plus $0.10 to minus $0.05 per pound and averaged less than $0.05 over the period, so one can consider wholesale prices as representative of production costs.
3.4 Eggs
In 2009, United States egg production totaled 90.4 billion eggs. The 2010 estimated per capita egg consumption in the United States was 246. This number has continuously declined since its peak in 2006 at 258 eggs. The United States exported 3% of its eggs in 2009. In 1970 the US was not in the top 10 egg exporting countries. By 2004, the United States exported 72,000 MT of eggs, which accounted for almost 7% of global trade. Today only about 2% of world egg production enters international trade, but the United States is the leading exporter with a 45% share of shell egg exports and a 34% share of egg product exports, by volume in both cases. Despite overall growth in national egg production, there have been declines across the south and east, and along most of the west coast, as shown in the chart below. Egg production has shifted much closer to the corn and soybean producing regions; the most prominent growth has been in the Midwest.

Consumer and Food Safety Costs of Offshoring Animal Agriculture
Supply, demand and cost of production
20
3.4.1 Supply-demand balance
The table below shows the supply-demand balance for table eggs in shell egg equivalent. America’s egg farmers provide roughly 6.5 billion dozen table eggs that we consume as food. In addition, breeder hens deliver about 1.1 billion dozen hatching eggs for broiler production and layer replacement. Imports are a fraction of a percent of total supply, while about 3.5% are currently exported.
United States: Table Eggs (shell egg equiv., million dozen)
2006 2007 2008 2009 2010 2011
Beginning Stocks 16 13 11 17 18 19
Production 6,551 6,465 6,395 6,485 6,550 6,550
Imports 9 14 15 11 12 12
Total Supply 6,576 6,492 6,421 6,513 6,580 6,581
Exports 202 250 206 242 258 242
Domestic Disappearance 6,361 6,231 6,198 6,253 6,303 6,320
Total Disappearance 6,563 6,481 6,404 6,495 6,561 6,562
Ending Stocks 13 11 17 18 19 19

Consumer and Food Safety Costs of Offshoring Animal Agriculture
Supply, demand and cost of production
21
3.4.2 Imports by source
Canada is the largest exporter of eggs to the United States, followed closely by China. Together they accounted for 80% of eggs that are imported. The number of eggs imported in 2009 declined by almost 20% over the previous year, however egg imports rebounded in 2010. Taiwan is also a significant supplier, averaging about 600,000 dozen annually. In addition to the egg imports in this table, there is a roughly equivalent quantity that is imported in the form of dried, liquid or frozen egg products.
Eggs: US imports by source, in dozens Partner 2006 2007 2008 2009 2010 Canada 1,830,125 1,948,639 1,771,656 1,421,143 2,072,320 China 2,562,037 1,623,176 2,134,504 1,716,376 2,006,754 Taiwan 447,653 785,856 598,469 596,176 584,180 Thailand 405,144 317,253 243,234 277,330 186,430 France 126,193 138,540 140,557 95,552 112,270 New Zealand 54,024 42,751 31,680 31,506 44,296 Australia 11,664 5,497 6,951 8,765 22,353 Hungary - - 3,360 - 8,280 United Kingdom - - 20,044 92 7,020 Germany 7,307 1,915 562 1,860 1,020 Other 9,571 43,772 28,857 73 - Total 5,453,718 4,907,399 4,979,874 4,148,873 5,044,923
3.4.3 Production cost breakdown
Egg production costs were $0.82 per dozen eggs in 2009 compared to $1.09 in 2008 when feed costs were much higher. Feed typically accounts for at least half of production costs, and since feed costs in the US are normally lower than in other countries, US egg farmers have competitive production costs that enable the United States to be the largest world exporter of eggs, although trade is still small relative to production.
3.5 Beef
3.5.1 Supply-demand balance
The United States is the world’s largest producer of beef and the third largest exporter of beef, behind Brazil and Australia. In 2004, the bovine spongiform encephalopathy (BSE) outbreak caused exports to drop to 209,000 tons from 1,142,000 tons in 2003 and imports to rise to 1.7 million tons. In 2010 the United States consumed 12 million tons of beef (CWE). Exports have been growing steadily in recent years and by 2010 exceeded one million tons, about the same as the quantity imported, and accounted for 8% of beef production. This year USDA projects net exports of about 100,000 tons. This will be the first year that the US has been a net exporter of beef and veal since the 1945-47 post-war period, the only other time in modern history when the United States exported more than it imported.

Consumer and Food Safety Costs of Offshoring Animal Agriculture
Supply, demand and cost of production
22
Much of the country has seen either moderate losses or small gains in cattle production over the past decade, i.e. less than 20 percent growth or decline. The main exceptions are states with small herds such as Alaska, Hawaii, West Virginia and most of the Northeastern states.
United States: Meat - Beef and Veal (1,000 MT)
2006 2007 2008 2009 2010 2011
Beginning Stocks 261 288 289 295 260 267
Production 11,980 12,097 12,163 11,891 12,048 11,946
Imports 1,399 1,384 1,151 1,191 1,042 1,014
Total Supply 13,640 13,769 13,603 13,377 13,350 13,227
Exports 519 650 856 878 1,043 1,123
Domestic Consumption 12,833 12,830 12,452 12,239 12,040 11,869
Total Disappearance 13,352 13,480 13,308 13,117 13,083 12,992
Ending Stocks 288 289 295 260 267 235

Consumer and Food Safety Costs of Offshoring Animal Agriculture
Supply, demand and cost of production
23
3.5.2 Imports by source
Total US beef imports have dropped from over 1 million MT in 2006 to 768,000 MT in 2010. These figures are lower than in the supply demand table because they reflect actual product weight rather than carcass weight equivalent (CWE). Of this total, almost 300,000 MT (40%) comes from Canada. Other large suppliers are Australia (189,000 MT) and New Zealand (157,000 MT).
Beef and veal: US imports by source, in MT Partner 2006 2007 2008 2009 2010 Canada 288,872 271,802 287,088 277,809 295,580 Australia 296,356 296,292 221,235 264,078 188,822 New Zealand 187,785 169,129 175,379 171,846 156,725 Mexico 15,715 18,208 15,925 25,272 39,696 Nicaragua 20,843 29,350 33,097 29,692 33,426 Uruguay 99,119 114,594 21,237 24,669 17,268 Brazil 66,928 69,970 53,476 49,690 15,074 Argentina 20,553 16,534 13,498 10,673 10,514 Costa Rica 6,463 5,999 6,433 7,686 7,880 Honduras 391 152 2,202 1,578 1,504 Other 360 1,857 1,036 1,099 1,525 Total 1,003,385 993,886 830,606 864,092 768,013
3.6 US production and trade in the global context
The United States remains an important source of meat, poultry and eggs, ranking in the global top three for both production and exports of pork, beef, broilers, and eggs.
• The US is the world’s third largest pork producer, after China and the EU as a whole. It is also the world’s leading pork exporter: nearly 2 million MT in 2010.
• The US is the largest producer of chicken meat in the world, producing 16.8 million MT in 2010. It is also the second largest exporter of chicken meat, second only to Brazil.
• The US is the second largest producer of eggs, and the world’s largest exporter.
• Beef production in the US ranks first in the world with 26.6 billion pounds in 2010. Exports of beef have recovered significantly since 2004. The US is the third largest exporter of beef.
We have reviewed the production and trade environment for the US. Next, we share details on the production systems and international trade for two major international producers, Mexico and Brazil.
Consumer and Food Safety Costs of Offshoring Animal Agriculture
Supply, demand and cost of production
24
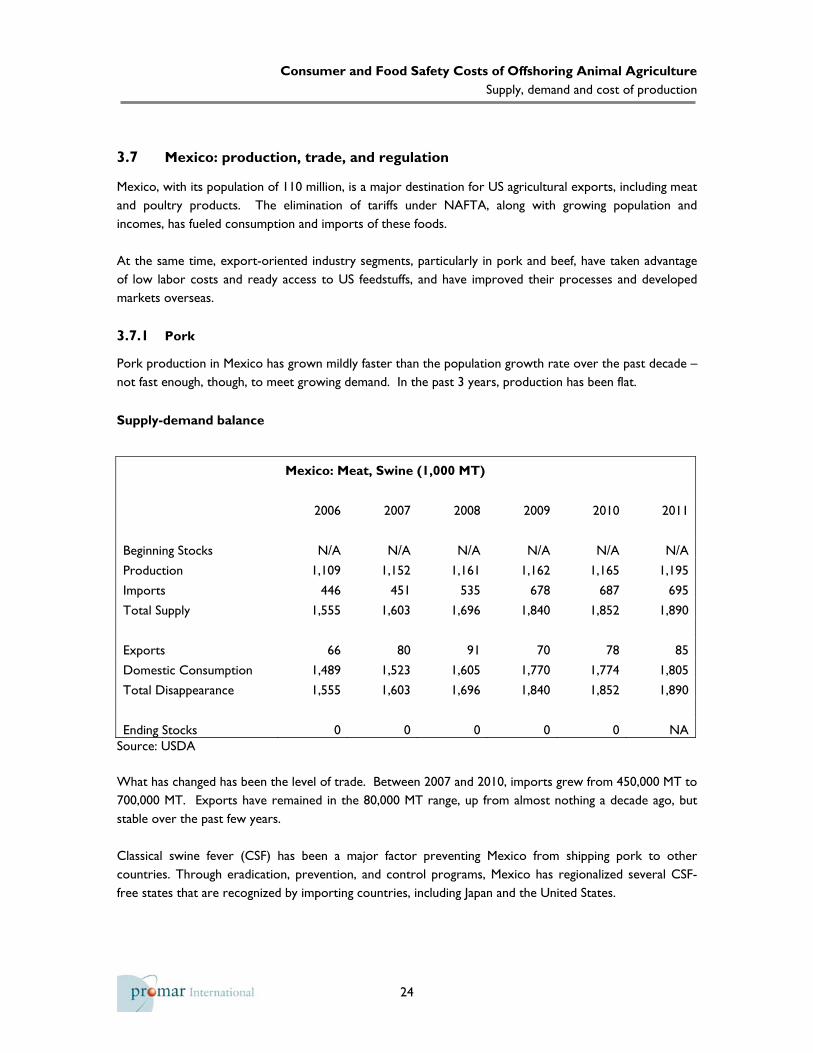
3.7 Mexico: production, trade, and regulation
Mexico, with its population of 110 million, is a major destination for US agricultural exports, including meat and poultry products. The elimination of tariffs under NAFTA, along with growing population and incomes, has fueled consumption and imports of these foods. At the same time, export-oriented industry segments, particularly in pork and beef, have taken advantage of low labor costs and ready access to US feedstuffs, and have improved their processes and developed markets overseas.
3.7.1 Pork
Pork production in Mexico has grown mildly faster than the population growth rate over the past decade – not fast enough, though, to meet growing demand. In the past 3 years, production has been flat.
Supply-demand balance
Mexico: Meat, Swine (1,000 MT)
2006 2007 2008 2009 2010 2011
Beginning Stocks N/A N/A N/A N/A N/A N/A
Production 1,109 1,152 1,161 1,162 1,165 1,195
Imports 446 451 535 678 687 695
Total Supply 1,555 1,603 1,696 1,840 1,852 1,890
Exports 66 80 91 70 78 85
Domestic Consumption 1,489 1,523 1,605 1,770 1,774 1,805
Total Disappearance 1,555 1,603 1,696 1,840 1,852 1,890
Ending Stocks 0 0 0 0 0 NA Source: USDA What has changed has been the level of trade. Between 2007 and 2010, imports grew from 450,000 MT to 700,000 MT. Exports have remained in the 80,000 MT range, up from almost nothing a decade ago, but stable over the past few years. Classical swine fever (CSF) has been a major factor preventing Mexico from shipping pork to other countries. Through eradication, prevention, and control programs, Mexico has regionalized several CSF-free states that are recognized by importing countries, including Japan and the United States.
Consumer and Food Safety Costs of Offshoring Animal Agriculture
Supply, demand and cost of production
25
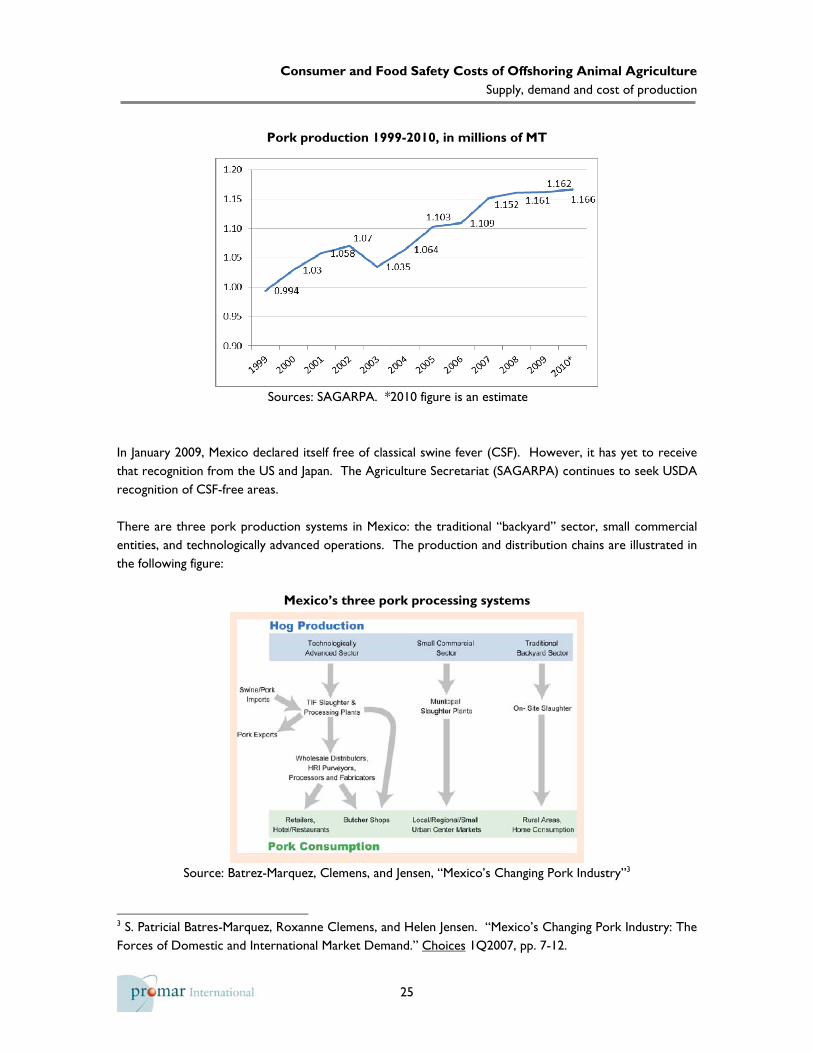
Pork production 1999-2010, in millions of MT
Sources: SAGARPA. *2010 figure is an estimate
In January 2009, Mexico declared itself free of classical swine fever (CSF). However, it has yet to receive that recognition from the US and Japan. The Agriculture Secretariat (SAGARPA) continues to seek USDA recognition of CSF-free areas.
There are three pork production systems in Mexico: the traditional “backyard” sector, small commercial entities, and technologically advanced operations. The production and distribution chains are illustrated in the following figure:
Mexico’s three pork processing systems
Source: Batrez-Marquez, Clemens, and Jensen, “Mexico’s Changing Pork Industry”3
3 S. Patricial Batres-Marquez, Roxanne Clemens, and Helen Jensen. “Mexico’s Changing Pork Industry: The Forces of Domestic and International Market Demand.” Choices 1Q2007, pp. 7-12.

Consumer and Food Safety Costs of Offshoring Animal Agriculture
Supply, demand and cost of production
26
The technologically advanced sector serves medium to large hog producers in specific regions and uses strict hygiene and processing standards, advanced breeding methods, and balanced rations. Pork from these systems commands a premium price either in the domestic market or for export overseas. Increasingly, small commercial processing has given way to the integrated, technologically advanced production. The number of (small) producers has been shrinking, while a small number of very large producers expand their output – effectively leading to increased concentration in production. Federal-type inspection (TIF, for Tipo Inspección Federal) facilities – Mexico provides TIF certification to plants that meet stringent sanitary standards. TIF facilities are inspected by the SENASICA division of the agriculture secretariat SAGARPA. TIF certification began expanding significantly in 1994 when new rules required all new facilities to meet TIF standards. In 1991, 11% of slaughter volume was processed in TIF facilities; by 2000, this share had grown to 30.3%. By 2008, it was 41.1%. TIF plants are the processing facilities of choice for producers focusing on export markets or on serving retail chains catering to demanding urban buyers. The small commercial sector typically involves small operations, which may use advanced breeding stock, but they may have limited hygiene controls and rely less on tailored diets and balanced rations. These small producers rely on municipal abattoirs for slaughter and processing. Municipal plants offer fewer services than TIF plants. Though they are the primary processors of hogs outside metropolitan areas, they lack the strict sanitary controls of the TIF plants. There are an estimated 800-900 municipal slaughter plants in Mexico. The traditional sector is comprised of small, rural producers who do not use slaughterhouses. Slaughter in this sector is on-site, and hygiene and processing standards are limited/non-existent. Most of the pork harvested under the traditional sector is used for subsistence consumption or sold locally. Combined, the small commercial sector and traditional backyard sector accounted for 59% of processing in 2008, down from 65%-70% a decade ago.
Imports and exports
Mexico’s pork tariffs and safeguards for trade with the US were eliminated completely under NAFTA in 2003, and as a result, imports have continued to expand, in absolute volume and value and as a share of consumption (37% in 2009).

Consumer and Food Safety Costs of Offshoring Animal Agriculture
Supply, demand and cost of production
27
Imports, share of consumption, 1998-2008
Sources: SAGARPA, INEGI
According to Mexican official trade data, pork exports by volume expanded to over 58,000 MT (ready-to-eat weight) in 2010, worth $307 million – an increase of 11% over 2009. Imports remained flat at just under 500,000 MT, worth over $970 million.
Source: USDA Most recently, the biggest change in imports has been the increase in leg cuts, which in 2010 increased 24% by volume to 100,334 tons and 45% by value to $195 million dollars, compared with the corresponding totals in 2009.

Consumer and Food Safety Costs of Offshoring Animal Agriculture
Supply, demand and cost of production
28
Production cost breakdown4
In the accompanying charts, one can see the distribution of production costs (at year-end 2008) for a) non-integrated (but technologically “advanced”) pork producers, b) integrated producers, and c) US producers. Feed (56%), financing (22%), and medicine accounted for 90% of the costs of non-integrated producers. By contrast, feed costs for integrated producers more closely matched the share in the
US (41%). Between January 2006 and January 2009, animal feed costs in Mexico expanded from $110/MT to $170/MT. Labor in both systems in Mexico was substantially lower than in the US, and medical costs substantially higher. The most important item to note is not visible in these cost graphs, however: the non-integrated Mexican producers had much smaller margins than the integrated producers. In fact, the profit margin for integrated producers was approximately 20% in 2008, compared to only 4% for non-integrated producers. In practice, this was about $0.23/lb for integrated producers, compared to $0.05/lb for non-integrated ones. Non-integrated producers had negative margins for 23 of the 36 months between the beginning of 2006 and the end of 2008. This helps to explain the exit of small producers from the market in recent years.
3.7.2 Broilers
Poultry production in Mexico is concentrated, and though it has expanded steadily, it has failed to keep up with market needs. As a result, Mexico is also a significant importer of poultry; almost all imports come from the US.
4 Sources: SAGARPA: Situación actual y perspectiva de la producción de carne de porcino en México 2009 and the Center on Globalization Governance & Competitiveness: A Value Chain Analysis of the U.S. Pork Industry.

Consumer and Food Safety Costs of Offshoring Animal Agriculture
Supply, demand and cost of production
29
Supply-demand balance
Mexico: Poultry, Broiler (1,000 MT)
2006 2007 2008 2009 2010 2011
Beginning Stocks N/A N/A N/A N/A N/A N/A
Production 2,592 2,683 2,853 2,781 2,809 2,850
Imports 419 380 433 492 549 580
Total Supply 3,011 3,063 3,286 3,273 3,358 3,430
Exports 1 2 5 9 14 16
Domestic Consumption 3,010 3,061 3,281 3,264 3,344 3,414
Total Disappearance 3,011 3,063 3,286 3,273 3,358 3,430
Ending Stocks 0 0 0 0 0 0 Source: USDA Broiler trade
Imports have more than doubled over the past decade, to almost 600,000 MT. Exports are negligible.
Source: USDA Imports in 2010 (according to official Mexican data) were 690,000 MT, up 10.5% over 2009. By value, imports grew 17% in 2010, to $811 million. Exports were just 10,600 MT worth $10 million.

Consumer and Food Safety Costs of Offshoring Animal Agriculture
Supply, demand and cost of production
30
3.7.3 Eggs
Mexicans are the world’s largest consumers of eggs on a per capita basis. Depending on the source, they are estimated to consume between 350 and 440 eggs per person, per year. The country’s large producers rely on conventional cage systems. Production has grown over the past decade, and was 2.36 million MT in 2009
Source: SAGARPA Mexico’s egg trade, relative to the size of the market, is miniscule. Imports are just over 7,000 MT, worth just over $25 million per year. Over 99% of imports come from the US. Exports in 2010 were 2,900 MT, worth $3 million, and were sold primarily to Angola and Liberia; Mexico does not export eggs to the United States.
3.7.4 Beef
Mexico is a prominent player in the world beef market. In 2009, it accounted for 3.1% of world production and 3.6% of consumption. Over the past five years, this gap between production and consumption has expanded, dropping Mexico one rank in production (from 6th to 7th) and increasing by one rank its role as an importer (from 5th to 4th). In other words, Mexico's import dependence continues to grow. Supply-demand balance
In recent years (2004-2009), the shifts in the overall beef market, expressed in annual averages rates, have been as follows:

Consumer and Food Safety Costs of Offshoring Animal Agriculture
Supply, demand and cost of production
31
Production: -2.2% / year to 1,700,000 MT Consumption: -2.0% / year to 1,971,000 MT Imports: +1.7% / year to 322,000 MT Exports: +23.7% / year to 51,000 MT While production and consumption have both dropped, the role of trade has increased: imports continue to fill an important market need (keeping pace with population), while the only area showing substantial growth has been exports, though this growth has come off a limited base.
While both Mexico's pork and poultry production have grown increasingly concentrated over the past 15 years, cattle and beef production have remained much less so. Production is widespread across the country, with production throughout all 31 states and the federal district.
Mexico: Meat, Beef and Veal (1,000 MT)
2006 2007 2008 2009 2010 2011
Beginning Stocks N/A N/A N/A N/A N/A N/A
Production 1,550 1,600 1,667 1,700 1,751 1,775
Imports 383 403 408 322 296 300
Total Supply 1,933 2,003 2,075 2,022 2,047 2,075
Exports 39 42 42 51 103 120
Domestic Consumption 1,894 1,961 2,033 1,971 1,944 1,955
Total Disappearance 1,933 2,003 2,075 2,022 2,047 2,075
Ending Stocks 0 0 0 0 0 0 Source: USDA Beef processing in Mexico, as with pork, can be divided into three segments: federally inspected “TIF” facilities, municipal slaughterhouses, and in-situ slaughter facilities. TIF facilities are the federally inspected, larger, generally modern slaughterhouses that are required to meet federal health and safety standards. All facilities approved for export would have to qualify as TIF facilities. The government tracks cattle slaughter through all three facility types, but the data appear to be substantially more reliable for TIF facilities; figures on in-situ slaughter show evidence of being unreliable in the extreme. Over the past five years, estimates of in-situ slaughter numbers have twice been lowered significantly.

Consumer and Food Safety Costs of Offshoring Animal Agriculture
Supply, demand and cost of production
32
Cattle slaughter in Mexico by facility type, 2000-2008 2000 2001 2002 2003 2004 2005 2006 2007 2008
TIF facilities 1,139,236 1,245,000 1,059,212 1,270,911 1,535,565 1,675,789 1,794,374 1,867,045 1,874,513
Municipal slaughterhouses 3,045,316 3,075,865 2,922,776 3,066,503 2,830,388 3,092,494 2,533,478 2,684,407 2,750,608
In‐situ slaughter* 4,000,000 4,000,000 4,328,012 1,858,892 1,871,123 1,589,427 2,170,000 1,137,813 1,156,280
Total 8,184,552 8,320,865 8,310,000 6,196,306 6,237,076 6,357,710 6,497,852 5,689,265 5,781,401 Source: SAGARPA, collated by Promar * Official estimates of in-situ slaughter were slashed by 60% in 2003, then again by an additional 44% in 2007.
The most reliably documented trend is the strong shift toward the use of TIF facilities: TIF slaughter grew by an annual average of 6.4% between 2000 and 2008, and now accounts for 1/3 of all slaughter and processing. By contrast, slaughter in municipal and in-situ facilities both declined. Concentration of Mexico's beef processing industry is very low, particularly in comparison with the United States. In the US, the four leading packers account for over two-thirds of beef processing. In Mexico, by contrast, we estimate that the four leading packers account for less than 20% of total volume. The US has the relative advantage of lower feed costs, which drives Mexico to export over a million cattle to the US each year, where they can be fed more cheaply and finished for slaughter. At the same time, low labor costs in Mexico have provided a number of companies (especially in disease-free areas in the north) with a solid business of processing beef cuts for the high-end domestic retail markets, and for markets overseas. Imports by source; exports by destination
Trade represents a modest fraction of the Mexican beef market: imports represent roughly one-sixth of overall consumption, a share that has remained relatively steady. Exports play a much smaller role. However, in contrast with imports, they have grown significantly in the past five years, from almost nothing to over 50,000 metric tons CWE (3% of production). The US accounts for roughly two-thirds of Mexico's beef exports, and almost 80% of its imports.
Mexican beef export destinations by value and volume, 2009
Exports by country, in US $ millions Exports, by country, in metric tons
Source: SIAVI

Consumer and Food Safety Costs of Offshoring Animal Agriculture
Supply, demand and cost of production
33
The vast majority of beef imports come from the United States. In 2009, US shipments to Mexico were 184,000 metric tons worth almost $700 million. Canada accounted for almost all the rest: 37,500 metric tons worth $130 million.
Mexican beef export destinations and import origins, by volume, 2009, in MT
Imports by country, in US $ millions Imports, by country, in metric tons
Source: SIAVI Imports from the US have consistently been estimated at 70% rounds and chucks, and 30% higher quality cuts. 3.7.5 Mexico summary
The Mexican market continues to grow and demand for animal agriculture products continues to expand. Though the country’s animal agriculture industries have grown more concentrated and more sophisticated, and increased their output, for the most part they have been unable to satisfy this growing demand. Most product areas have seen growth in production and consumption, save beef. A sizeable share of production has modernized. The share of production processed through federally certified (TIF) facilities has grown, and these facilities are becoming certified for export in increasing numbers. At the same time, economies of scale are driving industry concentration, particularly for pork and poultry. Financing difficulties and lack of scale advantages have been driving small producers from the market. Organized, modern processors have emerged to service export markets, and along with the Mexican government, they have worked aggressively to obtain export approval by the United States and nations in Asia interested in buying their products. Expansion of international recognition of disease-free regions in Mexico, particularly for beef, could open up further export opportunities and lead to step-wise increases in exports in the years ahead.

Consumer and Food Safety Costs of Offshoring Animal Agriculture
Supply, demand and cost of production
34
3.8 Brazil: production, trade, and regulation
Brazil is among the 10 largest economies in the world, with a GDP of $2 trillion, and a growth rate last year of 7.5%. The country had a $10 billion trade surplus in 2010, with total exports of $200 billion. Brazil is currently the leader in chicken and beef exports and has the potential to become the world’s largest pork exporter as well. In 2010 it exported 5.55 million metric tons of meat. Of that, 3.82 million metric tons was chicken, 1.23 million metric tons was beef, and 540,000 MT was pork. In 2010, export revenue from pork, poultry, and beef was $13 billion. The country also exports turkey and eggs, though in much smaller quantities. Production and exports of animal products have expanded aggressively over the past few decades, but so has consumption.
Brazil: Per capita consumption of selected animal products (in lbs)
Product 2005 2010 Growth % Pork 25 31 24% Poultry 78 96 23% Beef 88 82 -7% Eggs (units) 120 105 -12%
Source: CONAB Declines in beef consumption have been offset by an increase in pork consumption. Meanwhile, poultry consumption has grown at a tremendous rate, increasing by 18 pounds per person in just the past five years. Internal demand has been so strong recently that it has exerted upward pressure on domestic prices, which in turn has had a slowing effect on exports. Consumption of meat and poultry products will continue to expand with incomes, but is already fairly high. A substantial share of production growth in the future, therefore, will be sold overseas. The Brazilian meat and poultry sectors are led by companies that operate on a global scale. The largest meat company in Brazil is JBS. It is the world’s largest beef company and third largest pork company. JBS has facilities globally, including in the United States. It purchased Swift & Company in 2007. acquired 64% of Pilgrim’s Pride (poultry) in 2009, and in 2010 it acquired Smithfield Beef. It has processing plants in the four largest beef producing countries in the world: Brazil, Argentina, the US and Australia. The second largest meat company in Brazil and the 10th largest in the world is Brasil Foods S.A. (BRF), which resulted from the merger of processors Sadia and Perdigão. The resulting company has more than 60 plants in Brazil and a presence in over 110 countries around the world. The third biggest meat processing company in Brazil is Marfrig Alimentos S.A. Marfrig has plants or offices in South America, North America, Asia, Africa and Europe, and it exports to over 100 locations around

Consumer and Food Safety Costs of Offshoring Animal Agriculture
Supply, demand and cost of production
35
the world. While it is significantly smaller than JBS, it has made 37 acquisitions over the last three years, mostly abroad. Its exports grew from 430,000 metric tons in 2008 to almost 700,000 metric tons in 2009.
3.8.1 Pork
Brazil produced 2.6 million metric tons of pork in 2004. That number increased to 3.2 million metric tons by 2009, for a 22% increase in domestic production over five years. There has also been a huge shift in Brazil’s pork production. In the past five years, large-scale hog production has increased 37% while traditional production has dropped 34%. This reflects a decrease in hog production for personal consumption and an increase in production for export. Large-scale pig farmers have higher slaughter weights and higher productivity than their traditional counterparts. In 2002, the productivity for large-scale farms was 18.2 finished pigs per sow; that number grew by over three pigs to 21.4 finished pigs per sow in 2008. Over 80% of all Brazilian pork is now inspected by the Federal Inspection Service. This is supposed to lead to a reduction in health risks, which is important for exported products: the main barriers that Brazilian exports face are sanitary barriers. In terms of industry production costs, Brazil is reasonably competitive. Management practices and additional workers have greatly reduced pre-weaning mortality rates. The cost to produce an early weaned pig was under $25 and the cost from farrow to finish was $0.45 per pound, live weight. Thus far, in Brazil there is also a focus on improving feed conversion ratios. However, very little work has been done with improving the genetics of the animals. The intensity of the management is therefore responsible for feed conversion ratios of 2.35, according to industry analysts. Pork production has the potential to become even more efficient if and when hog farmers combine their management practices with improved genetics.

Consumer and Food Safety Costs of Offshoring Animal Agriculture
Supply, demand and cost of production
36
Supply-demand balance
Pork production in Brazil has grown steadily in recent years, from 2.83 million MT in 2006 to a projected 3.28 million MT for this year. Most of this increase has been absorbed by the domestic market, however.
Brazil: Meat - Meat, Swine (1,000 MT)
2006 2007 2008 2009 2010 2011
Beginning Stocks N/A N/A N/A N/A N/A N/A
Production 2,830 2,990 3,015 3,130 3,195 3,275
Imports 0 0 0 0 1 1
Total Supply 2,830 2,990 3,015 3,130 3,196 3,276
Exports 639 730 625 707 619 630
Domestic Consumption 2,191 2,260 2,390 2,423 2,577 2,646
Total Disappearance 2,830 2,990 3,015 3,130 3,196 3,276
Ending Stocks 0 0 0 0 0 0 Source: USDA Imports and exports
Brazil is the world’s fourth largest exporter of pork, following the EU, Canada and the US. Brazil’s share of the global export market grew from 4% in 2000 to 11% by 2009. In 2010, Brazilian pork exports were valued at $2.5 billion. The largest importers of Brazilian pork are Japan, Russia, Mexico, and South Korea.

Consumer and Food Safety Costs of Offshoring Animal Agriculture
Supply, demand and cost of production
37
Source: USDA Production cost breakdown
Two-thirds of the cost of pork production in Brazil is feed. The following chart reflects average production costs, by category, for Brazil’s largest pork producing states.
Source: EMBRAPA
3.8.2 Broilers
In 2010, Brazil was the third largest chicken meat producer with 12.3 million metric tons, behind the US (16.6 million metric tons) and China (12.6 million metric tons). Much of the growth in production between 1970 and 2000 was driven by a massive expansion in internal demand (both from population growth, and a surge in per capita consumption, from under 5kg to almost 40 Kg per capita). Over the past decade, however, exports have been driving the expansion.

Consumer and Food Safety Costs of Offshoring Animal Agriculture
Supply, demand and cost of production
38
Supply-demand balance
Brazil: Meat - Poultry, Broilers (1,000 MT)
2006 2007 2008 2009 2010 2011
Beginning Stocks N/A N/A N/A N/A N/A N/A
Production 9,355 10,305 11,033 11,023 12,312 12,925
Imports 0 1 1 1 1 1
Total Supply 9,355 10,306 11,034 11,024 12,313 12,926
Exports 2,502 2,922 3,242 2,992 3,181 3,310
Domestic Consumption 6,853 7,384 7,792 8,032 9,132 9,616
Total Disappearance 9,355 10,306 11,034 11,024 12,313 12,926
Ending Stocks 0 0 0 0 0 0 Source: USDA Imports and exports
Brazil is the largest exporter of chicken meat in the world. Its exports have grown from less than 300,000 metric tons in 1990 to 3.8 million MT in 2010, worth $6.8 billion (according to Brazilian figures, which differ from USDA estimates). The US exported 3.4 million MT worth $3.6 billion last year.
Source: USDA

Consumer and Food Safety Costs of Offshoring Animal Agriculture
Supply, demand and cost of production
39
3.8.3 Eggs
Brazilian egg production has been in decline over the past five years, as has consumption. Production since 2006 has dropped an estimated 12% and per capita consumption has dropped 18% (from 125 to 102 eggs per capita) as consumers with rising incomes switched to pork and poultry. Supply-demand balance
Brazil: Poultry, Eggs (millions)
2006 2007 2008 2009 2010 2011
Production 23,575 24,251 22,670 22,180 21,269 20,844
Imports 5 6 8 4 3 3
Total Supply 23,580 24,257 22,678 22,184 21,272 20,847
Exports 382 524 905 931 897 879
Domestic Consumption 23,198 23,733 21,773 21,253 20,375 19,968
Consumption pc (eggs) 125 127 115 111 105 102
Sources: São Paulo Poultry Association (production), SECEX (trade), IBGE (population)
Trade
Brazilian imports of eggs are negligible – approximately 150 metric tons. Exports, by contrast, have expanded substantially, from 382 million to approximately 900 million eggs (just over 52,500 MT). Brazil exports eggs throughout the world.
Source: SECEX
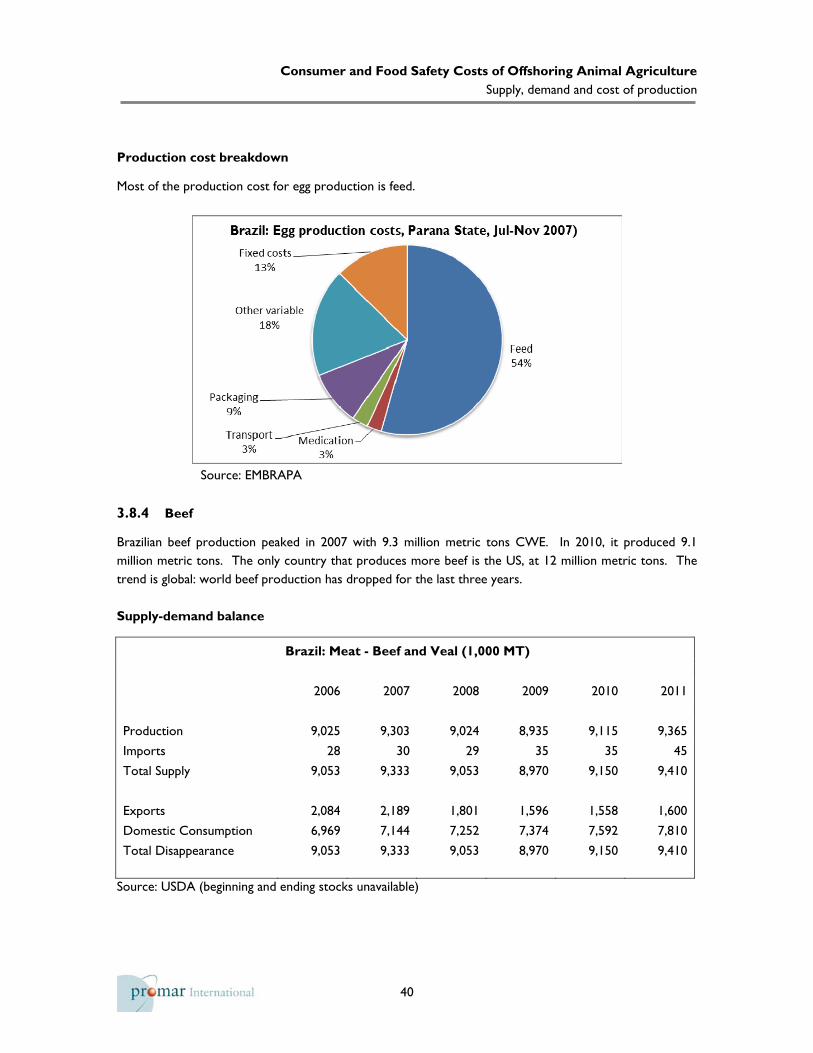
Consumer and Food Safety Costs of Offshoring Animal Agriculture
Supply, demand and cost of production
40
Production cost breakdown
Most of the production cost for egg production is feed.
Source: EMBRAPA
3.8.4 Beef
Brazilian beef production peaked in 2007 with 9.3 million metric tons CWE. In 2010, it produced 9.1 million metric tons. The only country that produces more beef is the US, at 12 million metric tons. The trend is global: world beef production has dropped for the last three years. Supply-demand balance
Brazil: Meat - Beef and Veal (1,000 MT)
2006 2007 2008 2009 2010 2011
Production 9,025 9,303 9,024 8,935 9,115 9,365
Imports 28 30 29 35 35 45
Total Supply 9,053 9,333 9,053 8,970 9,150 9,410
Exports 2,084 2,189 1,801 1,596 1,558 1,600
Domestic Consumption 6,969 7,144 7,252 7,374 7,592 7,810
Total Disappearance 9,053 9,333 9,053 8,970 9,150 9,410
Source: USDA (beginning and ending stocks unavailable)

Consumer and Food Safety Costs of Offshoring Animal Agriculture
Supply, demand and cost of production
41
Imports by source; exports by destination
Brazil is currently the world leader in beef exports. It exported 1.6 million MT (CWE) of beef in 2010, worth $5 billion. Australia is the second largest exporter; the US is third with just over 1 million MT of exports. Together these three countries account for over 55% of the world’s beef exports. Russia is the most important beef market for Brazil. In 2008, Russia accounted for 30% of Brazil’s exports. After Russia, the EU is the second largest importer. Venezuela and Iran are third and fourth. Brazil is looking to new markets, especially after recent decreases in exports to Russia and the EU. The Chilean market has reopened to Brazilian beef, after revoking its 2005 ban on beef imports. Brazil has also been investing in promoting its beef exports to China, Indonesia, Malaysia, South Africa and Morocco.
3.8.5 Brazil summary
Of all international competitors, Brazil’s agricultural market is the one that most closely matches our own. The country’s output of corn and soybeans has helped fuel a boom in animal agriculture. Though economic growth has recently driven increases in internal demand for pork and poultry, slowing the pace of exports, population growth has also slowed (now under 0.9% per year) and meat and poultry consumption is relatively high. Consequently, expanding production in the years ahead is likely to fuel exports. Large Brazilian producers have built modern facilities that can serve demanding global markets, and have pursued large-scale production. Moreover, some of the largest beef and poultry processors in the US belong to Brazilian corporations.

Consumer and Food Safety Costs of Offshoring Animal Agriculture
Supply, demand and cost of production
42
3.9 The growth and competition is in export markets
The US domestic market is currently not at high risk for incursion from competitors. US feed costs are low; the US is a net and growing exporter of meat and poultry products, and domestic consumption has been flat. The true competition US producers face is in export markets.
US consumption vs. global production and trade, 2007-2011*
2007 2008 2009 2010 2011* Average growth rate
Pork million metric tons percent
US consumption 8.9 8.8 9.0 8.7 8.5 -1.1%
Global production 94.0 97.7 100.4 103.2 103.4 2.4%
Global trade 5.2 6.1 5.6 6.0 6.1 4.1%
Beef
US consumption 12.8 12.5 12.2 12.0 11.7 -2.2%
Global production 58.6 58.6 57.3 57.3 56.7 -0.8%
Global trade 7.6 7.5 7.3 7.6 7.4 -0.7%
Broilers
US consumption 13.6 13.4 12.9 13.5 13.7 0.2%
Global production 68.5 71.7 72.3 76.0 76.2 2.7%
Global trade 7.4 8.4 8.2 8.8 9.0 5.0% Source: USDA; * estimates The strongest growth opportunities are overseas. Pork and broilers have been the growth markets, with global production rising by an annual average of 2%; trade in these products has expanded at twice that rate. Though global beef markets have been in decline, they have not dropped as sharply as in the US. Brazil and Mexico, two countries we have focused on in this study, have been able to obtain high prices in international markets. Specifically, Brazil gets a premium for its poultry exports ($0.81/lb on average in 2010, compared to just under $0.50/lb for the US and Mexico), while Mexico benefits from high value pork sales ($2.39/lb, compared to approximately $1.10/lb that the US and Brazil receive). All three nations exported beef at an average of $1.75/lb. Average prices will of course be influenced by the types of cuts being exported, as well as the level of processing and packaging, among other factors. Overall, for these three products combined, the US sells the largest volumes, while Brazil brings slightly higher revenue.

Consumer and Food Safety Costs of Offshoring Animal Agriculture
Supply, demand and cost of production
43
Prices obtained by exports from the US, Brazil, and Mexico, 2010
United States Brazil Mexico
Poultry
Volume (1,000 MT) 3,379 3,819 11
Value ($ millions) 3,595 6,808 10
Price / MT $1,064 $1,782 $944
Pork
Volume (1,000 MT) 1,940 540 58
Value ($ millions) 4,780 1,340 307
Price / MT $2,463 $2,479 $5,280
Beef
Volume (1,000 MT) 1,066 1,231 72
Value ($ millions) 4,080 4,795 289
Price / MT $3,827 $3,897 $4,001
Total exports ($ billions) 12,455 12,943 606 Sources: Various Although the US still sells higher volumes of these meat and poultry products overall, Brazil is bringing in more money for these three products, largely because its poultry exports bring in a 70% higher price per ton.

Consumer and Food Safety Costs of Offshoring Animal Agriculture
Potential impact of new regulations
44
SECTION 4: POTENTIAL IMPACT OF NEW REGULATIONS
Regulations govern many aspects of our lives and our work, and agricultural production is no different. There are building codes, safety codes, rules on animal feed, slaughter, culling, processing, storage temperatures, disposal, marketing…and so on. Most regulations, whatever their objectives, impose costs. We focus here on the regulations we consider to be “in play” – those that are currently being implemented or considered. Where available, we provide the evidence we have uncovered regarding the impact of the different types of regulations. We conclude this section with several scenarios of what the impact of these regulations may look like for production and consumption of animal products in the United States.
4.1 Potential areas of regulation
The five regulatory trends most likely to generate increased costs for US consumers in the near term are animal housing, environmental regulations, the use of antimicrobials and other drugs, labor regulations, and livestock contracting rules. Details on the key regulatory authorities covering these issues are provided in the Appendices. For the most part, they fall to the Environmental Protection Agency (EPA), the Animal and Plant Health Inspection Service (APHIS), the Grain Inspection, Packers and Stockyards Administration (GIPSA), and state regulatory authorities.
4.1.1 Animal (group) housing
Regulations on animal housing are at the forefront of industry discussion. The Humane Society of the United States (HSUS) and other animal rights activists have been pushing legislation in state legislatures and nationally to put rules in place that would expand the space available to animals raised for human consumption. The groups claim that their goal is to regulate giving animals more space to express natural individual and social behaviors, but many doubt their intentions. Several states have issued bans on sow-gestation crates, veal stalls, and/or conventional cage systems for layer hens, including Florida (law passed in 2002), Arizona (2006) Oregon (2007), California (2008), Colorado (2008), Maine (2008), and Michigan (2009). Related legislation is being introduced in other states, and when it fails, it is frequently reintroduced. The phase-in dates vary for each of the different states, ranging from 2008 (Florida) to 2019 (Michigan). The primary costs associated with these bans are expected to result from capital infrastructure requirements, potential decreases in production, and higher variable costs of production. Infrastructural changes, though generally a one-time expenditure, can be significant. J.S. West, one of the largest egg producers in California, spent $3.2 million upgrading housing in one of their 15 hen houses.5 Infrastructure changes for all the company’s facilities would total about $50 million for uniform conversion to Enriched Colony Systems, but it is still not at all clear that such systems even fulfill the new law’s requirements.
5 Guerrero, J., Cracking California’s Egg Rules. Aug. 19, 2010. Wall Street Journal. Pg.1

Consumer and Food Safety Costs of Offshoring Animal Agriculture
Potential impact of new regulations
45
Smithfield Foods, the largest pork producer in the United States, estimated that its group housing transition will cost approximately $300 million.6 Production cost concerns are also significant, with one study estimating potential production costs for cage-free eggs in California under Proposition 2 to be 41-70% higher than costs to produce in conventional cage systems.7 A case study below on the impact of a national transition to cage-free egg production shows dramatic economic impacts.8 Cost increases of this magnitude could not be offset by efficiency gains and would, to some extent, be paid for by consumers. Another study which investigated the cost of converting to group housing for sows projects capital costs of $1.8 to $3.2 billion, and decreased productivity on the order of $1.5 billion per year industry-wide9. In every example, legislative actions are accompanied by the need for increased investment to meet the new regulations as well as higher costs to produce the same product, leading to higher costs to consumers. The UK case study presented earlier showed that the consumer cost of pork rose 25% between 1999 and 2004 due primarily to new regulations. It is doubtful that certain elements of the costs associated with regulatory compliance may be recovered, as they generally entail housing fewer animals per infrastructure unit. This results in less profit per animal due to increased overhead costs. Unlike other potential industry impediments, managerial talent and other similar contributing factors cannot make up for increased overhead dispersed over fewer animals.
Based on the available evidence, our estimate is that the increased costs of retrofitting and complying with pig housing regulations would increase costs by 5%-10%. The cost differential would be smaller in the context of new facilities, which would be designed to meet the regulations from the outset. These might cost 1-2% more per year to build and operate. In some instances, these increased costs would be placed upon industries that have lost significant amounts of money over the past three years, paving the way for further decreased supplies and increased costs to consumers over the long term. The impact on the egg and poultry breeding segments, based on our analysis, would be larger. Requiring conversion to cage-free egg production would raise consumer costs by 25%; the price of a dozen eggs would rise by $0.42, from $1.68 to $2.10. The overall cost to consumers would be $2.66 billion annually, primarily due to significantly higher feed requirements, labor requirements, and lower egg yields.
6 Vansickle, J., Smithfield Postpones Sow Stall Phaseout. July 15, 2009. National Hog Farmer. Pg. 1 7 Sumner, D. A. et al. Economic Effects of Proposed Restrictions on Egg-laying Hen Housing in California. University of California Agricultural Issues Center. Pg. 3. 8 Promar International, Impacts of Banning Cage Egg Production in the United States, August 2009 9 Buhr, B. L. Economic Impact of Transitioning from Swine Gestation Stalls to Group Pen Housing. University of Minnesota. Pg. 69.
Consumer and Food Safety Costs of Offshoring Animal Agriculture
Potential impact of new regulations
46
A few states have established Livestock Care Standards Boards, consisting of a diverse group of representatives from industry, small farmers, consumers, and others. These boards have the authority to establish, regulate, and enforce animal welfare standards for livestock and poultry. They can help preserve the interests of local producers. In a recent dispute between the Ohio Care Standards Board and HSUS over veal calf tethering, a proposal was made to condition the transition on broader national adoption (“representing 60% of national production”), so as not to adversely impact the state’s veal farmers. This proposal reflected the threat that early imposition of regulations might put a select group of producers out of business.
Consumer and Food Safety Costs of Offshoring Animal Agriculture
Potential impact of new regulations
47
Case study: National Egg Production Transition to Cage-Free
The US egg industry plays an important role in contributing to national employment and economic activity. In 2008, table egg production generated $6.2 billion at the farm level (or before eggs are cleaned, processed, and ultimately consumed), resulted in $14.7 billion of final demand within the national economy, earned $2.4 billion at the individual and firm level, and created 97,600 jobs. Chickens are very efficient at converting feed energy into eggs, enabling eggs to be comparatively inexpensive and thus an important low-cost source of protein for many American families. It is estimated that 96% of current domestic production is generated from layer houses with conventional cage systems. These systems provide multiple reasons for farmers to adopt them including:
Safe and sanitary environments for flocks; Standardized managed care activities for flocks including food, water and animal health Efficient waste removal for disease reduction and air quality improvement; and Enhanced sanitation and reduced breakage for egg collection.
The superior efficiencies of these systems create savings for consumers. By contrast, cage-free systems are much less efficient, and requiring this production method would have a variety of negative impacts on the national economy if adopted on an aggregate level. While cage-free systems do provide hens with extra room, they result in higher feed costs, increased labor requirements, lower egg production per bird, and increased feather pecking, cannibalism, and mortality. In addition, birds housed in systems that permit outdoor access increase the risk of transmission of diseases from wild birds, like Highly Pathenogenic Avian Influenza. Based on our research, a ban on cages would increase feed costs by 15-25%, as reduced feed efficiency will require additional inputs to realize current levels of production. This will increase demand for land for growing feed inputs such as soybeans and corn, and will increase environmental impacts as well. The total estimated cost of industry conversion from layer and pullet (broiler) caged-housing systems, to cage-free systems, is $7.5 billion. This takes into account the number of houses viable to renovate, new houses that must be constructed in order to house current and additional production capacity requirements (since production efficiency is estimated to decrease), the acquisition of additional land and related infrastructure (building of roads, wells, etc.) and utilities. Due to increased inputs and decreased production efficiency, production costs are reasonably anticipated to increase. Domestic eggs produced under cage-free constraints will likely cost 25% more than eggs produced under the current system; this would increase the price of eggs by $0.42/dozen, from $1.68 to $2.10, and elevate consumer costs by $2.66 billion annually. In summary, conversion of current production systems to cage-free systems on a national scale would: require massive investment in converting and constructing necessary infrastructure, force some domestic egg production to countries like Mexico where such a ban is not in place, raise production and consumer prices, have adverse implications for the environment, and would require additional land to be planted in corn and soybeans to compensate for decreased feed efficiency.

Consumer and Food Safety Costs of Offshoring Animal Agriculture
Potential impact of new regulations
48
4.1.2 Environmental regulations
The main regulations regarding environmental standards involve the Safe Drinking Water Act (SDWA), Clean Water Act (CWA), Clean Air Act (CAA), The Superfund Act (CERCLA), and Emergency Planning and Community Right-to-Know Act (EPCRA). Actual cost implications are difficult to quantify, as regulatory authority is delegated to each state to enforce and regulate. Certain fines associated with non-compliance can range from immaterial to $100,000 and possible jail time. These initiatives are not market driven. It may be possible to avoid compliance costs by utilizing economies of scale or by restructuring firm sizes. This can be seen by a 4.6% increase in national average size of farms just below the size cut-off for regulation, following the 2003 CAFO Rule.10 It has been estimated that approximately 23.3-27.9% of a slowing of growth within the industry can be attributed to compliance with regulation11. This percentage increases substantially for larger farms, with the largest CAFOs experiencing a 40% decline in growth12. Concentrated Animal Feeding Operations (CAFOs) Mounting interest in CAFOs and their impacts on environmental and community health has sparked initiatives to scale back the size of animal feeding operations. Communities are now beginning to use methods at the county level to locally regulate livestock feeding operations, and in some cases, regulation at the county level is much stricter than at the national or state level. Iowa has implemented a Master Matrix, which is used to score CAFOs on potential water, air, and community impact. Colorado is also an interesting case, because it imposed very restrictive regulations well before other states. The consequences are described in the case study below. Various forms of county regulation exist such as health, zoning, and planning ordinances, all with the potential to impact animal agriculture. Local ordinances are being used as tools by communities in an effort to slow the expansion of existing CAFOs or the addition of new ones. For instance, in Missouri, several counties have adopted similar ordinances with the following requirements:
• lower the number of animal units needed to qualify as a CAFO (from 1,000 animal units at the state level to 300);
• increase the setback requirement from the CAFO to residents or other establishments around them;
• increase land requirements for manure application; and
• require annual fees and financial surety bonds.
10 Sneeringer, S. and Key, N. Effect of Clean Water Act Regulations on Firm-Level Decisions in Agriculture.” 2010. Pg. 19. 11 Ibid, 21 12 Ibid, 21

Consumer and Food Safety Costs of Offshoring Animal Agriculture
Potential impact of new regulations
49
Case study: Colorado’s environmental regulations
Colorado was an early adopter of CAFO rules, issuing requirements regarding the following in 1999:
Obtaining a state-issued permit and a state approved waste management plan
Regular monitoring of soil and water conditions for areas surrounding waste storage and for land receiving manure application
Covering of liquid lagoons
A minimum of a one mile setback standard for land application or waste storage areas from residents, schools, or municipalities
Provision of evidence of financial capacity to clean up any potential waste spills, or soil/water contamination
Per-animal fees levied against producers to support regulatory enforcement
Provision made for civil suits to be brought against CAFOs
Local governments were allowed to impose even stricter regulations if they deemed it appropriate. We can see what has happened to production since the regulations were put in place. The following charts show what happened with cattle/beef and hog/pork production.
0
100,000
200,000
300,000
400,000
500,000
600,000
700,000
0
100
200
300
400
500
600
700
800
900
1000
1990
1991
1992
1993
1994
1995
1996
1997
1998
1999
2000
2001
2002
2003
2004
2005
2006
2007
2008
2009
1,000 lbs
1,000 head
Colorado hog inventory and production
Inventory Production
0
500
1000
1500
2000
2500
3000
3500
0
500,000
1,000,000
1,500,000
2,000,000
2,500,000
1990
1991
1992
1993
1994
1995
1996
1997
1998
1999
2000
2001
2002
2003
2004
2005
2006
2007
2008
2009
1,000 lbs
1,000 head
Colorado cattle inventory and production
Production Inventory
During the period 1999-2009, cattle inventories dropped 18% and beef production, 13%. Even steeper declines were registered on the pig side: hog inventories dropped over 20%, and production dropped by more than 50%.

Consumer and Food Safety Costs of Offshoring Animal Agriculture
Potential impact of new regulations
50
Particulate matter regulations
On April 22, 2011 the EPA announced its final Policy Assessment for the Review of the Particulate Matter National Ambient Air Quality Standards. These recommendations have yet to be reviewed by the EPA Administrator, at which point a final determination will be made and announced. Suggestions within this assessment call for either retaining current standards, or for a reduction in the acceptable amount of particulate matter. Current standards allow for an average daily total of 150 micrograms per cubic meter (μ/m³), and accept only one exceedance during the three year compliance period. The new suggested ranges would effectively halve this limit to between 65-85 μ/m³, but would increase the exceedance acceptance to 21 days out of the three year compliance period. The concern is that these stricter regulations will bring everyday agricultural production activities under increased scrutiny, or even put them in direct violation of the rule. Activities like tillage, harvesting of grains, operating feedlots, and (on the more restrictive end of the spectrum) even driving a car down a dirt road, could in theory all become regulated. Nevertheless, the EPA’s advisory panel and health advocates criticize the stricter recommendations as being too broad and inffective at protecting public health. They argue that the increased allowance for exceedance during the regulatory period significantly mitigates any positive effects gained from more stringent average control. Impending greenhouse gas emission control
Greenhouse gas regulations are on the horizon for agricultural producers. The main greenhouse gases that are produced by livestock (with cattle, sheep and other ruminant animals being the main contributors) are methane and nitrous oxide. The main agricultural sources of methane and nitrous oxide production are cattle and hog farms. Methane emissions are broken down into three main source categories: enteric fermentation (produced as part of normal digestive processes in animals), manure management, and crop and soil management. Based on a study conducted last year, total swine contribution to greenhouse gas emissions was 9% of aggregate agricultural emissions; this represents less than 1% of total U.S. emissions. To date, regulators have been more focused on the large scale emissions from power plants, refineries and automobiles. Experiments with ruminant feed alterations have shown potential as a cost effective method for methane emission reduction. However, in the swine sector, waste management is generally viewed as the most promising area to realize decreased greenhouse gas emissions. A potential emerging solution for hog farmers is methane digesters. Currently there are 24 digesters being used on hog farms throughout the country. These systems capture and convert methane from lagoon or pit waste storage facilities into heat and electricity. Several factors are important in evaluating potential cost implications of methane digester implementation:
• Capital costs of building the digester, storage facility, and other related buildings;
Consumer and Food Safety Costs of Offshoring Animal Agriculture
Potential impact of new regulations
51
• Maintenance of the additional infrastructure (such as the generator, storage facility, etc); and
• Fixed transaction costs such as selling surplus electricity and certifying/marketing carbon offsets.
Economies of scale allow for these costs to be spread over a larger number of productive units, therefore foreseeably making methane digesters more attractive to larger-scale production facilities. A study13 modeling methane digester use under a nationwide cap-and-trade program (with a carbon price of $13/metric ton) projected that the following would result:
• Approximately 62% of current greenhouse gas emissions produced from manure management would be sold as supply offsets, and
• Dairy and hog producers would earn up to $1.8 billion in additional revenues over a 15 year period from installing the digesters.
This same study also estimates that within the states of North Carolina, Indiana, Illinois, Oklahoma, and Missiouri there are 100 swine production facilities that would benefit from methane digesters. Suggestions have been made for policies that encourage medium to smaller-sized production facilities to utilize methane digesters as a viable abatement method, including tax exemptions and cost-share subsidies. In March 2011, the EPA announced its interest in regulating farms and other agricultural sources of greenhouse gases. Some EPA regulations could go into effect as early as 2013. Some legistlation already in place protects producers from potential litigation, such as right-to-farm laws (existing in all 50 states) and more recent Livestock Friendly Programs (Minnesota and Nebraska).
Based on the available evidence, our estimate is that the environmental regulations designed to reduce emissions and/or other forms of pollution could increase costs substantially. How much depends on the type(s) of regulation enacted. Some of these costs may be partly offset through energy sales and offset subsidies. But existing environmental regulations have clearly impaired agriculture’s ability to increase supply to meet growing global demand, leading to higher consumer prices than would otherwise have prevailed.
4.1.3 Subtherapeutic antimicrobial use and other dietary agents
Animal agriculture in the United States utilizes antimicrobials for both subtherapeutic and therapeutic purposes. The majority of current use is subtheraputic, with antimicrobials provided in daily feed and
13 Key, Nigel and Stacy Sneeringer, “Climate Change Policy and the Adoption of Methane Digesters on Livestock Operations”, ERS, USDA, Economic Research Report Number 111, February 2011

Consumer and Food Safety Costs of Offshoring Animal Agriculture
Potential impact of new regulations
52
water sources at dosage levels below those used for therapeutic applications. This is done to increase growth rates, improve feed efficiency, and in some cases improve reproductive performance. Pressure has emerged, however, both nationally and internationally, to reduce the use of subtherapeutic antimicrobials in animal agriculture. These initiatives began mostly in Europe – specifically in Sweden, Denmark, the United Kingdom, and finally the EU as a whole. The rationale most aggressively pushed is that sustained use of antimicrobials in animal production could lead to resistant organisms that might render antibiotics less effective for treatment of human disease. Sweden was the first to implement a ban; in 1986, it banned the use of antimicrobials as growth promoters. An analysis found that slaughter hogs, eggs, and specialized turkey and beef production exhibited no negative long-term effects associated with the ban.14 Broiler chicken and piglet production, however, did experience significant short-term impacts. In piglet producing units, increased disease rates required an increase of therapeutic antibiotics. Post-weaning mortality rates during the first year post-ban increased by 1.5%, and the time to reach 55 pounds was increased by 5 to 6 days.15 Adjustments were then made to feed and herd management. In addition, zinc-oxide was used to prevent and cure diarrhea. “By September 1998 approximately 85% of piglets reached the age of delivery to fattening units without having been given either antibiotics or zinc-oxide.”16 In broiler production, necrotic enteritis surfaced as a major problem after the ban, and required virtually all chickens to be prescribed virginiamycin in 1987 to prevent the disease. A shift was later made to instead treat outbreaks by giving a two-day treatment of phenoxy methyl penicillin in drinking water to affected flocks. Adjustments were also made to reduce the protein content in chicken feed and increase fiber and coarse grains, and add enyzmes. Combined, the measures reduced antibiotic usage from two tons of virginiamycin in 1987 to 100 Kg of phenoxy methyl penicillin in 1988, and to a “negligible level” thereafter.17 Denmark was the second European country to adopt antimicrobial legislation. Denmark has progressively tightened the rules regarding the use of antibiotics in food animals, both through bans on subtherapeutic usage, as well as regulation of veterinarians and prescription requirements. At the same time, the country has since 2000 collected substantial data on antibiotic resistance in food animals, humans, and meat. Initially, the country eliminated the use of subtherapeutics at the finishing stage (1998). Producers adjusted their operations to cope with the consequences, and yields stabilized. A ban on usage at the weaning stage, however, led to substantial repercussions, both in terms of a drop in efficiency (few piglets, higher mortality, slower growth) as well as an increase in costs. The increased incidence of disease led to an increase in the volume of therapeutic antimicrobials.
14 Wierup, M. The Swedish Experience of Limiting Antimicrobial Use. Proceedings of Agriculture's Role in Managing Antimicrobial Resistance Conference, Toronto, Canada, Oct 24–26, 1999. Pg. 1. 15 Ibid, 3 16 Swedish Ministry of Agriculture, Forestry, and Fisheries. “Swedish experience of Banning the Use of Anti-microbial Growth Promoters,” 2002, http://www.fao.org/docrep/meeting/004/ab457e.htm 17 Ibid.

Consumer and Food Safety Costs of Offshoring Animal Agriculture
Potential impact of new regulations
53
Danish use of animal antibiotics, 1990-2010 (in metric tons)
Source: DANMAP In terms of the key objective of reducing antibiotic resistance, the results of restricting antibiotic usage have been mixed. For a number of pathogens in animals, resistance to several major classes of antibiotics has decreased (e.g., particularly resistance levels for enterococcus and campylobacter); for others, resistance remains largely unchanged or has increased. As far as changes in pathogen resistance in humans goes, resistance is in most cases the same or higher, with few exceptions, such as vancomycin resistant enteroccus (VRE), which has dropped since avoparcin was banned for use in animals in 1995. Danish authorities have found that resistance levels in imported meat and poultry are considerably higher than resistance levels found in domestic meats. The source attribution model used by Denmark to estimate the contribution of animal food sources to human Salmonella infections attributed only one outbreak and five sporadic cases to domestic pork, while attributing 41 cases to imported pork and one to imported turkey meat.18 The Animal Health Institute estimates that if subtherapeutic antimicrobial usage were eliminated, the United States would need an additional 452 million chickens, 23 million additional cattle, and 12 million additional hogs to reach current production levels. Use of antimicrobials is thought by some to be a major factor contributing to healthy large-scale animal agriculture in the United States. Because young pigs are particularly susceptible to disease, pig farmers are arguably the largest consumer of antimicrobials. Though these antimicrobials are considered by the government as being used for growth 18 DANMAP 2010 (Collaboration of the National Food Institute, National Veterinary Institute, Danish Medicines Agency, and Statens Serum Institute), p. 16.

Consumer and Food Safety Costs of Offshoring Animal Agriculture
Potential impact of new regulations
54
enhancement, the reason these products are effective is because they treat incidents of disease in the piglets that occur at subclinical levels. A summary of 1,194 experiments designed to evaluate growth rate increases in hogs from antimicrobial use discovered the following:
Weanling pigs (15-55 lbs) showed increased growth rates of 16.4% and improved feed efficiency of 6.9%
Growing pigs (37-108 lbs) had increased growth rates of 10.6% and improved feed efficiency of 4.5%
Growing finishing pigs (50-195 lbs) increased growth rates by 4.2%, and increased feed efficiency by 2.2%
In addition to these responses, a separate study found that an observation of 1,951 sows showed an increased reproductive efficiency (measured in terms of increased conception rates) of 7% and increased average litter sizes by one half piglet. In addition, broiler chickens have similarly seen the benefit of about 10% improved feed efficiency through the use of subtherapeutic antimicrobials. Other reasons for growth enhancement include breeding advances, feed ration advances, and better understanding of optimal environments for raising birds. The combined result of these advances has resulted in average growth performance increasing four-fold, from 25 g/day to 100 g/day, in the past 50 years. The push against subtherapeutic antimicrobials has moved from Europe to the United States. A bill on the subject was submitted to Congress in March of 2010 – and was given backing by the FDA, despite the fact that the agency does not collect the data with which to support its claims. Moreover, certain market initiatives have also taken place, the most notable of which has perhaps been McDonald’s’ voluntary issuance of strict guidelines for animal food suppliers in reference to their antimicrobial usage.19 The policy, which went into effect in 2004, requires that suppliers defined to be in a “direct relationship” (those facilities dedicated to producing products for McDonald’s) with the company must certify in writing their compliance with antimicrobial use guidelines and document compliance through regular audits and internal assurance programs. Specific guidelines include:
all antimicrobial usage must be done under the oversight of a veterinarian;
all use of antimicrobials also used in the treatment of humans may only be administered after other treatment alternatives have been exhausted;
all treatments should be limited to the specific treatment of disease control and prevention in animals that are at risk of a specific disease. This includes administering treatment only for as long as it takes to elicit the desired clinical response. Use of antimicrobials should only be used in the correct application for clinical indications; and
accurate and thorough records must be maintained of all antimicrobial administrations.
19 McDonald’s Global Policy on Antibiotic Use in Food Animals.

Consumer and Food Safety Costs of Offshoring Animal Agriculture
Potential impact of new regulations
55
In addition, the McDonald’s policy also forbids the use of antimicrobials that are used explicitly for increasing growth rates. Suppliers who are not considered to be in “direct relationships” with McDonalds have incentives to adhere to the same guidelines in order to be considered more favorably in supply decisions.
Available evidence suggests that restrictions or a ban on the subtherapeutic use of antimicrobials would have a long term impact on production costs. The impact varies substantially, depending on the type of antibiotic, its purpose, and other factors. For instance, in the case of hog farming, the impact is more significant during the piglet stage than during finishing. US herds and flocks face challenges that are not factors in Denmark, for instance, salmonella and brucellosis, and thus may have higher costs; at the same time, Danish farmers have developed some techniques to help offset the reduced use of antibiotics. Finally, some medications that are not antimicrobial also help US farmers provide large amounts of food – Ractopamine (Paylean), a beta agonist used in the finishing of pigs, for example, is estimated to increase lean growth by 34% and decrease feed intake by 5.5%.20 Its elimination could thus have a more substantial impact on supplies, costs and consumer prices.
4.1.4 Labor issues / regulation enforcement
Consolidation of livestock production facilities, increased vertical integration in processing, and technological advances that have decreased the amount of labor needed, have had profound effects on agriculture and its operation. At the same time, farm family labor resources have significantly dwindled. This leaves more opportunity, and need, for hired workers, whether seasonal or full-time. In 2006, 44.2% of all farm workers were employeed by livestock operations for both extensive and intensive production systems. Hired workers are also significant labor input resources for meatpacking and processing industries as well. Consolidation has also led to the relocation of many meatpacking and processing facilities, situating them closer to farms and feedlots and away from highly-organized and more expensive labor resources often found in urban settings with well-developed employment characteristics for supporting large-scale facilities. In recent years, particularly with the economic downturn, there has been expanding public concern over illegal immigration; segments of the public view the government as unable or unwilling to effectively manage the issue.
20 Schinckel, Alan P. “Ractopamine, Response, Economics, and Issues. Purdue University: slide presentation. http://www.ansc.purdue.edu/swine/porkpage/nutrient/paylean/ractopamine/sld005.htm

Consumer and Food Safety Costs of Offshoring Animal Agriculture
Potential impact of new regulations
56
Over half of the labor resources utilized by US animal agriculture reportedly come from immigrant workers, so it is critical that policy is effective at addressing immigration concerns while still providing a stable and cost-effective labor supply. Additional restructuring centered around labor standards and working conditions may be necessary compromises in order to realize continued access to affordable labor. Post-9/11 security concerns and the economic downturn have led to increased pressure for action on immigration, both legal and illegal. New laws are being passed and agencies have been targeting companies that have hired illegal immigrants. Temporary visas are available for hiring crop workers, but the H-2A cap is 50,000 visas per year, while the needs are estimated at 500,000 – ten times that many. States are beginning to pass restrictive laws related to illegal immigration. Both Arizona and Alabama have passed such laws; though the laws are being reviewed by the court system, if these states prevail, the laws would reduce the supply of labor to all sectors, including agriculture. This would raise labor costs, in turn driving up consumer prices.
Given the a) high cost of other inputs in the production process (relative to labor) and b) the industry’s demonstrated need for affordable labor, we believe that the impact of immigration issues on production costs will be limited in the short-term. However, if structural unemployment remains high, political demands and budgetary concerns could lead to tighter monitoring and enforcement of both immigration status and working conditions in the increasingly concentrated animal agriculture industries. If the emerging state-based anti-immigration laws prevail in the court system and spread, the supply of labor would tighten, raising labor costs and ultimately, consumer prices.
4.1.5 Livestock contracting and marketing regulations
In June of 2010, Tom Vilsack, the Secretary of Agriculture, announced that the USDA’s Grain Inspection, Packers and Stockyards Administration (GIPSA) proposed a new rule, which was required by the 2008 Farm Bill. The proposed regulation was intended to provide new protections for farmers and ranchers against unfair, fraudulent or retaliatory practices, though many in the agricultural community dispute its ability to accomplish its goal. It intends to redefine key terms in the Packers and Stockyards Act and restate that the USDA does not believe that farmers and ranchers should have the burden of proof of competitive harm or potential competitive harm. Packers, swine contractors, and live poultry dealers would be required to maintain written records that explain why different prices were paid to different livestock producers. Packers would not be allowed to discuss prices with other packers or purchase livestock from them. And finally the proposed rule would increase transparency by making sample contracts available on GIPSA’s website.

Consumer and Food Safety Costs of Offshoring Animal Agriculture
Potential impact of new regulations
57
Since these rules were proposed by GIPSA, the National Cattlemen’s Beef Association, National Pork Producers, National Chicken Council and the National Turkey Federation have all spoken out against the new rule. The National Pork Producers Council stated that that the proposed regulation “overreached its congressional intent”. The National Chicken Council believes that the proposed rule is not in accordance with court rulings. The Farm Bureau, on the other hand, supports the proposed rule. These organizations have pointed out various weaknesses in the proposed rule. The USDA has responded to each of these points. The criticisms and USDA responses are as follows:
Defining competitive injury and harm will make it easier to sue. o The lack of clear definition has increased the number of lawsuits. Some situations will
require proof and others, such as retaliatory conduct, using inaccurate scales or providing the grower with sick birds will not require proof.
The rule is in violation of federal court rulings – eight different US circuit courts of appeal have ruled that the Packers and Stockyards Act requires showing of harm to competition.
o Seven of the circuit courts have not made clear rulings that affirmatively require proof of harm to competition or likely harm to competition for violation of the Packers and Stockyards Act.
Contract growers will be guaranteed a return of 80% of their capital investments. o This rule does not affect provisions for termination due to poor performance. It
requires that producers are offered production contracts that would enable them to recoup up to 80% of their capital investment.
Companies cannot pay premiums to producers. o This rule does not prevent companies from paying premiums to reward producers for
quantity or quality of livestock. The rule requires that the company keep records of the arrangements.
Contracts will be posted on the GIPSA website. o GIPSA will review all of the documents and post sample contracts on their website. No
confidential business information will be posted.
Following the announcement of this proposed rule, the American Meat Institute commissioned three studies to assess the economic impact of the rule on the industry.21 The first study determined that the new regulations would increase retail meat prices by 3.3%. That could result in a 2% reduction in meat consumption, which would cost the industry 104,000 jobs. The overall impact on the GDP would be $14 billion. The second study reported job losses of 22,800 in the livestock sector and a $1.56 billion drop in GDP. The final study only looked at the chicken meat industry and it found that the rule would result in $1 billion over five years in reduced efficiency, higher costs for feed and housing and increased administrative expenses. The conclusion by AMI was that the economic impact of this rule would be more than $100 million and therefore a comprehensive economic impact assessment should have been completed prior to its proposal.
21 Studies by John Dunham and Associates, Informa Economics, Inc., and FarmEcon LLC, respectively

Consumer and Food Safety Costs of Offshoring Animal Agriculture
Potential impact of new regulations
58
Therefore, AMI argued that the rule should be withdrawn and an economic impact assessment should be conducted. In February 2011, Secretary Vilsack met great opposition in a House agriculture subcommittee hearing and agreed to conduct an economic analysis. The analysis is still underway. The Department of Agriculture received 60,000 comments on the proposed rule and is currently reviewing them. On May 18, 2011, 147 members of the House of Representatives signed a letter to Secretary Vilsack urging the Department of Agriculture to withdraw the current proposed rule and re-propose a revised rule when review of the public comments and results of the pending economic analysis are completed. The letter went on to state that Congress hopes the Department of Agriculture will adopt a law more consistent with the goals of the 2008 Farm Bill and not use this rule as a chance to “accomplish objectives specifically rejected by Congress.” Congress is currently awaiting a response from the Department of Agriculture.
4.1.6 Regulations: summary
The following table summarizes potential areas of regulation of US animal agriculture, for likelihood and impact; it also summarizes the source of pressure for regulation, as well as whether the added costs might be partially offset through improved market pricing. The areas where we are most likely to see regulations put in place are those where activist groups are pushing for change, i.e. animal housing and subtherapeutic drug usage. Animal housing requirement changes, particularly for poultry, could add significantly to producer costs. If undertaken in combination, however, changes in both these areas may create opportunities for higher pricing in the marketplace. Because they are costly, environmental regulations must be implemented carefully, since they carry substantial costs that will negatively impact farmers, ranchers, and consumers who rely on their ability to provide food. Reduced availability and increased cost of labor due to tighter immigration rules and enforcement is the least likely area of short-term change; we include it, however, because it would be an issue with widespread impact. Finally, and perhaps more imminently, the tighter regulations covering livestock contracting and marketing that were required by the 2008 farm bill could yet be implemented in 2011 unless more recent Congressional efforts to block them in the context of the broader federal budget battle succeed.

Consumer and Food Safety Costs of Offshoring Animal Agriculture
Potential impact of new regulations
59
Regulations: Summary table Likelihood /
pace of change Impact on
production costs
Regulatory or market/consumer
driven
Opportunities for better
pricing
Animal (group) housing
Moderate Moderate
(higher for poultry products)
Market/consumer Yes
Environmental regulations
Low Moderate to high Regulatory No
Subtherapeutic drug usage
Moderate Low to moderate Both Yes
Labor rules & enforcement
Unknown Low to moderate Regulatory No
Livestock marketing rules
Moderate to high Low to moderate Regulatory No

Consumer and Food Safety Costs of Offshoring Animal Agriculture
Potential impact of new regulations
60
4.2 Analysis and potential impact: regulations
As discussed above, additional regulation of animal agriculture could have varying impacts on production costs, from as little as a one percent increase to well over 10%. A Promar study cited earlier of a requirement for all US egg production to be cage free concluded it could result in a 41-70% increase in production cost, resulting in average retail prices 25% higher. Here we use two scenarios – a 10% and 25% increase at the producer level to develop an approximation of the potential costs that consumers could experience as a consequence of any additional regulatory burden. The evidence is clear that both producers and consumers respond to price changes, but in opposite ways. Producers offer a bigger supply in response to higher prices, but consumers buy less. At lower prices, consumers buy more but producers will cut production. The chart on the next page illustrates that conventional relationship in exaggerated form. The actual price elasticities of supply and demand are complicated to estimate. The elasticity is the percent change in supply or demand in response to a percentage change in price. For example, a supply elasticity of 0.3 means that for each one percent increase in price, the quantity supplied increases 0.3%. Time is also an important consideration. Over a short time period, neither supply nor demand change greatly, but with time to adjust, both producers and consumers change behavior, i.e. long-term elasticities are higher than short term. There are two other complicating factors. First, producers respond to prices at the first point of sale for the animal or animal product (i.e., the price they are paid), while consumers respond to the retail price at the end of the supply chain. Second, it makes a difference whether only one price is changing or all are changing together. Most of the elasticities reported in the literature are “own price” elasticities. There are also “cross price” demand elasticities that measure how the demand for one product changes in response to a change in the price of another product. For example, a rise in the price of pork may increase consumer demand for chicken. We examined elasticities compiled by both FAPRI and USDA’s Economic Research Service (ERS). The FAPRI model has own-price demand elasticities of 0.67 – 0.75 for the principal meats, and a short-run own-price supply elasticity of 0.01 for cattle and hogs. It also has a long-run elasticity of 0.13 for broilers. The ERS demand elasticities are similar to FAPRI’s. We could not find any long-run ERS supply elasticities. To simplify things, we will assume for Scenario 1 that the aggregate effect of additional regulation is to increase costs at the producer level by 10% for all animal products. That cost increase is represented in the figure below by an upward (or leftward) shift in the supply curve. Depending on the share of the retail price that the producer price represents, the increase at retail is less than 10% – typically 3-5%. The increase at retail is also further reduced to the degree that demand is elastic, i.e. the demand curve slopes downward rather than being vertical, which would represent a situation where demand is totally unresponsive to price. For our purposes we will use a domestic demand elasticity of 0.1, an export demand elasticity of 0.2, and a supply elasticity of 0.2 for all products. We use a low domestic demand elasticity because with costs of all
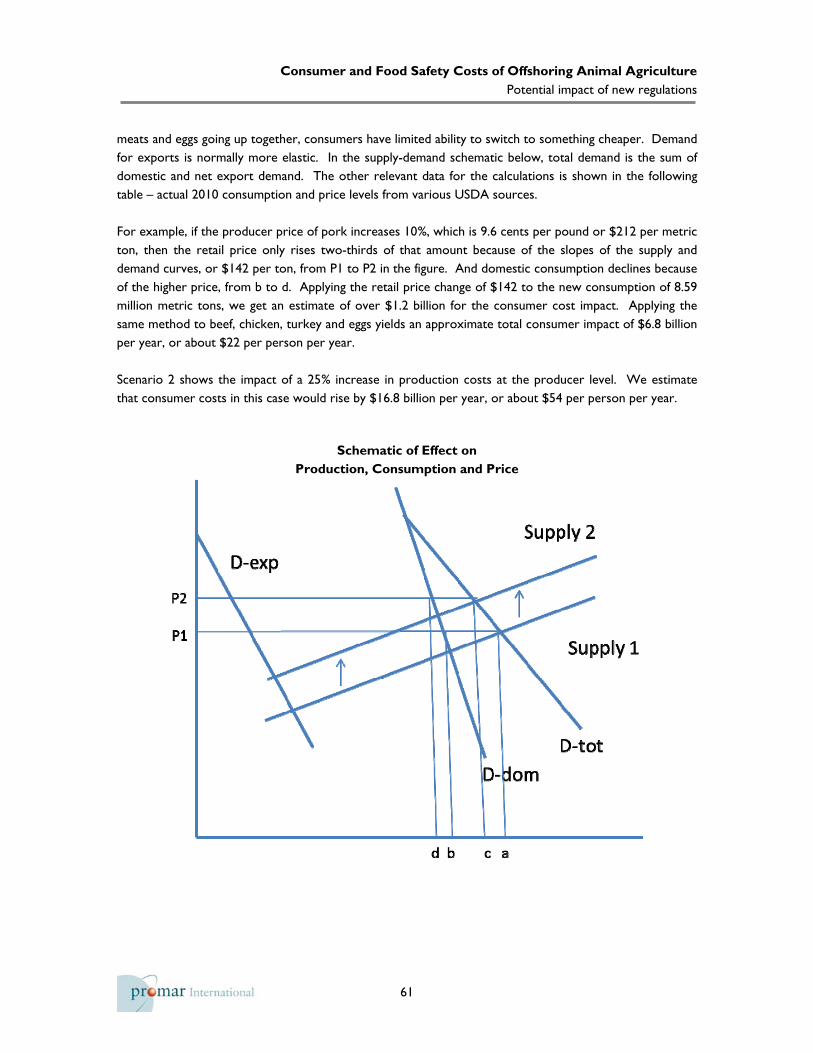
Consumer and Food Safety Costs of Offshoring Animal Agriculture
Potential impact of new regulations
61
meats and eggs going up together, consumers have limited ability to switch to something cheaper. Demand for exports is normally more elastic. In the supply-demand schematic below, total demand is the sum of domestic and net export demand. The other relevant data for the calculations is shown in the following table – actual 2010 consumption and price levels from various USDA sources. For example, if the producer price of pork increases 10%, which is 9.6 cents per pound or $212 per metric ton, then the retail price only rises two-thirds of that amount because of the slopes of the supply and demand curves, or $142 per ton, from P1 to P2 in the figure. And domestic consumption declines because of the higher price, from b to d. Applying the retail price change of $142 to the new consumption of 8.59 million metric tons, we get an estimate of over $1.2 billion for the consumer cost impact. Applying the same method to beef, chicken, turkey and eggs yields an approximate total consumer impact of $6.8 billion per year, or about $22 per person per year. Scenario 2 shows the impact of a 25% increase in production costs at the producer level. We estimate that consumer costs in this case would rise by $16.8 billion per year, or about $54 per person per year.
Schematic of Effect on Production, Consumption and Price

Consumer and Food Safety Costs of Offshoring Animal Agriculture
Potential impact of new regulations
62
Pork Beef Chicken Turkey Eggs Total$/dozen
Retail price 3.19 4.39 1.75 1.65 1.66 -Producer price 0.96 2.04 0.74 0.61 0.70 -
Cost increase: 10% 212 450 163 134 103 -Change in retail price 142 301 109 90 69 -
Original consumpton 8.65 12.04 13.46 2.30 4.35 -New consumption 8.59 11.96 13.37 2.28 4.32 -
Cost increase on new consumption 1,218 3,603 1,461 206 298 6,785
$/pound
$/mt
million mt
Calculation of Potential Consumer Cost: Scenario 1 - 10%
$ million
Pork Beef Chicken Turkey Eggs Total$/dozen
Retail price 3.19 4.39 1.75 1.65 1.66 -Producer price 0.96 2.04 0.74 0.61 0.70 -
Cost increase: 25% 529 1,124 408 336 257 -Change in retail price 354 753 273 225 172 -
Original consumpton 8.65 12.04 13.46 2.30 4.35 -New consumption 8.50 11.84 13.23 2.26 4.28 -
Cost increase on new consumption 3,014 8,916 3,616 509 737 16,792
Calculation of Potential Consumer Cost: Scenario 2 - 25%
$/pound
$/mt
million mt
$ million
In addition to the domestic consumer cost impact, there is a significant negative impact on exports. In the figure above, total disappearance on the horizontal axis is “a” (equal to production) and domestic consumption is “b”. Exports are equal to “a-b”. With the leftward shift in the supply curve due to the cost increase, total production and disappearance is “c” and domestic consumption is “d”. Exports contract to “c-d”. There is a proportionately greater impact on exports because export demand is more elastic. USDA estimates that every $1 billion of agricultural exports creates 8,000 jobs throughout the economy. What would the job impact be from a reduction in exports due to a 10% or 25% increase in production

Consumer and Food Safety Costs of Offshoring Animal Agriculture
Potential impact of new regulations
63
costs for animal agriculture due to increased regulation? The tables below show our calculations of the change in the volume and value of net exports given our assumed supply and demand elasticities. For example, in the 25% scenario, pork production declines by 250,000 tons, domestic pork consumption falls 150,000 tons (as shown in the table above), and exports fall by the remaining 100,000 tons. Total meat and egg exports would fall by 440,000 tons. Applying the 2010 average unit export value for these products results in an estimated $1.1 billion decline in exports, which in turn implies elimination of about 9,000 jobs. In Scenario 1, with a 10% cost increase, exports fall by $440 million, resulting in the elimination of about 3,500 jobs.
Calculation of Potential Impact on Net Exports: Scenario 1 - 10%
Pork Beef Chicken Turkey Eggs Totalmillion mt
Change in production -0.10 -0.12 -0.17 -0.03 -0.04 -0.46Change in domestic consumption -0.06 -0.08 -0.09 -0.02 -0.03 -0.28Change in exports -0.04 -0.04 -0.08 -0.01 -0.01 -0.18
$/mtUnit export value in 2010 2,841 4,661 984 1,671 4,409
$ millionChange in exports -114 -186 -79 -17 -44 -440
Calculation of Potential Impact on Net Exports: Scenario 2 - 25%
Pork Beef Chicken Turkey Eggs Totalmillion mt
Change in production -0.25 -0.30 -0.41 -0.06 -0.11 -1.13Change in domestic consumption -0.15 -0.20 -0.23 -0.04 -0.07 -0.69Change in exports -0.10 -0.10 -0.18 -0.02 -0.04 -0.44
$/mtUnit export value in 2010 2,841 4,661 984 1,671 4,409
$ millionChange in exports -284 -466 -177 -33 -176 -1,137 These figures are all approximations of potential impact, and involve a lot of simplifying assumptions. There would be other fallout besides the direct consumer cost impact on meat and eggs. Markets for leather, hides, variety meats, and other co-products would also be affected. As total US exports of animal products fall, imports would also rise as foreign suppliers are more strongly attracted by a higher price in this market. Ultimately those lines could cross and the United States could become a net importer.

Consumer and Food Safety Costs of Offshoring Animal Agriculture
Potential impact of new regulations
64

Consumer and Food Safety Costs of Offshoring Animal Agriculture
Food safety
65
SECTION 5: FOOD SAFETY
In this section, we review the food safety regimes and foodborne illness data for the United States, Brazil, and Mexico, identifying data on cases and costs, where available. We conclude with our assessment of the potential impact of imports on food safety.
5.1 The United States – Animal agriculture and food safety regulations
5.1.1 The US food safety regulatory regime
The US food safety system utilizes 15 federal agencies and 2,700 state and local health agencies to administer the monitoring, surveillance, inspection, enforcement, outbreak response, research, and education responsibilities defined by more than 30 food safety laws. Most of the products covered in this report are regulated by the US Department of Agriculture. The USDA, through its Food Safety and Inspection Service (FSIS), is charged with ensuring the safety, wholesomeness, and proper labeling of most commercial domestic and foreign meat and poultry products, overseeing their safety, and inspecting and certifying that foreign imports are free of pathogens, pests and disease. Responsibility for eggs is shared between FSIS and the Food and Drug Administration (FDA). The FSIS is responsible for the safety of liquid, frozen, and dried egg products, domestic and imported, and for the safe use or disposition of damaged and dirty eggs. FDA has jurisdiction over establishments that produce, sell and/or serve shell eggs or use them as an ingredient in their products. FDA and FSIS also share responsibility for dairy: FSIS is responsible for dairy farms, while FDA is responsible for milk pasteurization. The FSIS currently manages around 9,400 staff, of which approximately 8,000 are posted in 6,300 meat slaughtering or processing facilities nationwide. About 5,300 of the plants are slaughtering and processing facilities, and about 1,000 are warehouses and distribution facilities. Law requires that FSIS personnel be present in all slaughtering facilities during hours of operation. FSIS also has independent responsibility for foreign imported meat and poultry products. The FSIS first requires other nations to demonstrate their food safety system is equivalent to our own, and that it follows key food safety best practices. The FSIS, in cooperation with the US Bureau of Customs and Border Protection, also conducts statistical sampling and reinspection of imported meat, poultry, and egg products at all US ports of entry. The agency conducts enhanced inspections of documentation, sampling, and preparation and cooking regulations of imports from countries that harbor livestock and poultry diseases.
5.1.2 Foodborne illness
On the whole, foods in the US are remarkably safe. However, the massive scale of food production and distribution leads to less frequent but larger scale outbreaks which increasingly improving surveillance systems are able to detect, identify, and report. The CDC recently revised its figures (in January 2011) and

Consumer and Food Safety Costs of Offshoring Animal Agriculture
Food safety
66
estimates that foodborne pathogens cause 48 million illnesses, 128,000 hospitalizations, and 3,000 deaths per year. These are tracked by pathogen, but are not linked back to food categories.
a) Pathogens and costs
A 2010 analysis calculated national costs of $152 billion due to foodborne illness, but the analysis relied on case number estimates that were over a decade old. We have taken the newly published case number estimates and combined them with the calculated costs per case (from 2010) to provide an updated estimate of the cost impact of foodborne illness: $86 billion.
Estimated foodborne illness costs in the United States
Illness Cost
per case Number of cases
Cost estimate ($ millions)
Bacteria Campylobacter $8,901 845,024 $7,522
Clostridium $510 965,958 $493
E. coli O157:H7 $14,838 63,153 $937
Listeria monocytogenes $1,695,143 1,591 $2,697
Salmonella, typhi $62,509 1,821 $114
Salmonella, non-typhoidal $9,146 1,027,561 $9,398
Shigella $7,092 131,254 $931
Parasites
Cryptosporidium $4,424 57,616 $255
Giardia $3,675 76,840 $282
Viral
Norovirus $586 5,461,731 $3,201 Major known agents 8,632,549 $25,830
Other known bacteria / parasites / viruses 755,592 $5,273
Unknown agents $1,430 38,400,000 $54,912
Total cost of foodborne illness 47,788,141 $86,015 Sources: For case number estimates: Emerging Infectious Diseases (Jan 2011, Vol 17., No.1) For per-case cost estimates: Produce Safety Project, Georgetown University (March 2010)
Of this $86 billion, almost $26 billion is due to major known pathogens and over $5 billion is due to other known agents. The majority of the costs, $55 billion (64%), however, are due to unknown agents. As the population ages, the public’s overall risk exposure to foodborne illness increases.

Consumer and Food Safety Costs of Offshoring Animal Agriculture
Food safety
67
b) Data challenges
Of the 48 million estimated foodborne illness cases in the US each year, only 9.4 million are caused by known pathogens. A full 38 million of them - roughly 80% - are the result of unknown causes. Of the 9.4 million caused by known pathogens, 5.5 million (i.e., the majority) are caused by norovirus. Only 3.6 million are known to be caused by known bacteria (seven types account for 90% of these cases), but these account for 30% of all the costs associated with foodborne illness. The challenges involved in estimating the extent of foodborne illness are well described by the authors of a recent overview article:
“Accurately estimating hospitalizations and deaths caused by foodborne pathogens is particularly challenging ... for diagnoses to be recorded health care providers must order the appropriate diagnostic tests and coding must be accurate…Data used in the current study come from a variety of sources and were of variable quality and representativeness…Our assumptions about the proportion of illnesses transmitted by food profoundly affect our estimates, but data on which to base these estimates were often lacking.”22
c) Illnesses by food type
Not all foods carry the same level of risk of foodborne illness. The categories connected with the largest numbers of foodborne illness outbreaks are multi-ingredient foods, seafood, produce, poultry, beef, and multi-ingredient products with meat, pork, and dairy goods. Poultry products are commonly associated with Salmonella contamination. The regulation of poultry meat and poultry products is under the authority of FSIS and the Poultry Products Inspection Act of 1957. Beef products have been associated with E. Coli 0157:H7 and Salmonella contamination in recent years, and are commonly associated with large and widespread recalls, as beef products are commonly ground and mixed to produce hamburger meat. Beef products are also regulated under the authority of the USDA, Food Safety and Inspection Service, and the Federal Meat Inspection Act of 1906. A 2009 study published by the Center for Science in the Public Interest, which maintains a database of foodborne illness outbreaks, presented the data provided in the following chart.
22 E. Scallan, R. Hoekstra, F. Angulo, R. Tauxe, M. Widdowson, S. Roy, J. Jones, and P. Griffin, “Foodborne Illness Acquired in the United States – Major Pathogens,” Emerging Infectious Diseases, Vol. 17, No. 1 (Jan 2011), pp. 13-14.

Consumer and Food Safety Costs of Offshoring Animal Agriculture
Food safety
68
Outbreaks and Illnesses in Food Commodities, 1998-200723
Source: Center for Science in the Public Interest According to the study, for the 10 year period from 1998 to 2007, the total number of outbreaks and illnesses for categories covered in this report were:
• Pork: 200 outbreaks, 4,934 illnesses
• Poultry: 538 outbreaks, 13,498 illnesses
• Eggs: 124 outbreaks, 3,396 illnesses
• Beef: 428 outbreaks, 9,824 illnesses
• Other meats: 143 outbreaks, 3,080 illnesses
Outbreaks represent cases where multiple illnesses were recorded and traced to the same food/pathogen. Over the course of the decade, the general trend was for the number of outbreaks in each category to remain stable or decline slightly – despite population growth and ongoing advances in detection and reporting. One should note, however, that this study only captured a fraction of one percent of the CDC’s estimate of 48 million foodborne illnesses annually, so it may be indicative of the mix of sources of illness but it is not authoritative.
23 “Outbreak Alert!: Analyzing Foodborne Outbreaks 1998 to 2007, Closing Gaps in Our Federal Food-Safety Net,” Center for Science in the Public Interest.

Consumer and Food Safety Costs of Offshoring Animal Agriculture
Food safety
69
5.1.3 Food imports and US inspections
In 2010, imported food products accounted for 15%-20% of the US food supply. An even greater share of fresh fruits and vegetables (35%) and seafood products (75%) are imported. Each day the US receives approximately 25,000 food shipments from more than 100 countries at more than 300 ports of entry. Import entry lines increased from 4.9 million in 2002 to more than 9.5 million entry lines in 2007.24 Likewise, the amount of food imported in the US has increased substantially over the past decade, from $41 billion in 1999 to over $86 billion in 2010, more than doubling in value and nearly doubling in volume. The US imports 4 billion pounds – 1.82 million metric tons – of meat, poultry, and processed egg products on an annual basis. Both FDA and FSIS are leveraging electronic information and analytics systems to more accurately monitor their inspections. FDA’s system is the Predictive Risk-based Evaluation for Dynamic Import Compliance Targeting (PREDICT); FSIS has its Public Health Information System (PHIS).
a) Inspection of meat and poultry product imports at point of entry
In order for a company to export to the United States, FSIS must deem a foreign country’s food safety system equivalent to that of the US through a review of that country’s laws and regulations, and an initial on-site country audit. This equivalence is maintained through recurring reviews of laws, recurring on-site audits, and continuous port-of-entry product reinspections. Countries are assigned risk scores, which in turn determine to which of three level-of-risk (LOR) categories they will be assigned. Brazil and Mexico, for instance, are assigned to the higher of the three risk categories, and are therefore subject to higher scope of on-site audits. FSIS then uses a risk-based approach to foreign country audits and port-of-entry reinspections and sampling. This risk based approach focuses resources on imported products that are expected to pose the greatest threat to public health Other factors that play into reinspection frequency are the inherent risk of the products in question, the volume exported, and the track record (i.e., establishment performance: the number of previous positive results). Foreign country audits target higher risk establishments, based on larger volumes and/or “riskier” products.
b) FSIS inspections of foreign meat and poultry product processing systems
There are more than 130,000 importers of record, who are authorized to import from more than 300,000 foreign facilities. Given their resources, the best that FSIS and FDA can do is inspect a tiny fraction of the number of facilities that can ship to the US. For this reason, both use risk-based systems to determine in which countries, and on which facilities, they need to focus their audits. 24 Becker, Geoffrey (2009), “Federal Food Safety System: A Primer,” Congressional Research Service, April 8.. Note that each entry line represents individual tariff lines included in a shipment.

Consumer and Food Safety Costs of Offshoring Animal Agriculture
Food safety
70
The FDA inspects approximately 150 international facilities per year, During the period from 2001-2008, it conducted 1,186 such inspections. Of these, 133 were in Mexico (11.2% of the total, and the #1 country with the most inspections), and 53 in Brazil (4.5%, #6 on FDA’s list). FSIS conducts periodic audits of other countries’ meat and poultry product processing and food safety inspection systems. FSIS audits are based on five areas of risk:
(1) Sanitation controls – including establishment of Sanitation Standard Operating Procedures (SSOP);
(2) Animal disease controls;
(3) Slaughter/processing controls, including Hazard Analysis Critical Control Point (HAACP) programs and E. coli testing;
(4) Residue controls; and
(5) Enforcement controls, including Salmonella testing. Both Brazil’s and Mexico’s meat and poultry processing inspection systems have been audited by FSIS in recent years. We present summary findings of these audits in the individual country subsections that follow. The complete FSIS reports are available through links provided in the Appendices.
5.2 Brazil – Animal agriculture regulations and food safety
Brazil has official regulations governing animal agriculture, a reporting and tracking system for foodborne illness, and a formal consumer protection agency. However, the country’s ability to track and reduce foodborne illness is less than that of the United States. Currently, for animal health reasons, Brazil is not eligible to ship raw meat and poultry products to the US. It is only eligible to export beef, lamb, goat, and pork products that have been processed (with kill steps sufficient to inactivate bacteria and viruses).
5.2.1 Food safety regulations
In Brazil, government responsibility for animal agriculture falls to the Ministry of Agriculture and Supply (Ministério da Agricultura, Pecuária, e Abastecimento), the Secretariat of Agricultural Defense (SDA),the Department of Inspection of Products of Animal Origin (DIPOA), and the Federal Inspection Service (SIF). Brazil publishes regulations and best practices regarding meat and poultry production, but like Mexico, has parts of its production complex that are not officially inspected (these do not export). Independent analyses by both the poultry industry and the national statistics agency reported that 87% of the country’s poultry output is inspected, mostly by federal authorities, but in some cases state or municipal ones.

Consumer and Food Safety Costs of Offshoring Animal Agriculture
Food safety
71
5.2.2 Foodborne illness
The Brazilian Ministry of Health tracks foodborne illness outbreaks, and has recorded an average of just over 600 outbreaks per year through its national database, SINITOX (Sistema Nacional de Informações Toxico Farmacológicas). The database was set up in 1980 to provide country-wide information on toxicological events. SINITOX data were first published in 1985 and the system is fed by data from 37 Centers of Information and Toxicological Assistance (CIATs) throughout Brazil. The following graph shows recorded annual foodborne illness outbreaks.
Brazil: Foodborne illness outbreaks, 2004-2009
Source: SINITOX Almost three-quarters of the outbreaks recorded by Brazil were recorded in the country’s four southern (and wealthiest) states; surveillance elsewhere is far more limited (there are three states for which no outbreaks at all are recorded from 1999 to 2009). Brazil also tracks, where available, data on the pathogens responsible for the outbreaks. The following table provides average yearly data for the time period from 1999 through the first quarter of 2009.

Consumer and Food Safety Costs of Offshoring Animal Agriculture
Food safety
72
Brazil: Food outbreak source pathogens, 1999-2009*
Agent Outbreaks Staphylococcus 128 Bacillus Cereus 62 Clostridium 21 Salmonella Enteriditis 15 Salmonella 13 Shigella 8 Other 54 Known 301 Unknown 318 Average per year 619
Source: Ministry of Health *through March 2009 As with the US, the majority of pathogens in cases of foodborne illness remain unknown. Eggs and red meat are among the most common culprits in recorded foodborne illness outbreaks in Brazil. But in more than one-third of cases in recorded outbreaks, authorities do not know the type of food that caused the illnesses.
Brazil: Food outbreaks by food type, 1999-2009
Food Outbreaks Egg products 91 Mixed foods 65 Red meat and products 47 Desserts 43 Water 35 Dairy products 29 Others 89 Unknown 220 Average per year 619
Source: Ministry of Health *through March 2009

Consumer and Food Safety Costs of Offshoring Animal Agriculture
Food safety
73
5.2.3 FSIS audit of Brazil’s meat inspection system - summary findings
FSIS recently audited Brazil’s meat inspection system.25 The main purposes of the audit were a) to check on corrective actions it had proffered following the previous audit (2009), and b) a response to violations detected in the US, where FSIS found Ivermectin-tainted meat in multiple export shipments from Brazil. The Ivermectin violations and shipment rejections led to Brazil’s self-suspension of beef exports to the United States. In the previous (2009) audit, Brazil’s system had been found to meet FSIS standards, with few exceptions:
“The review of previous corrective actions indicated that through the documentation, implementation, verification, and the analysis of those corrective actions and preventive measures by the CCA [Central Competent Authority] that the CCA has demonstrated ongoing process control.”
However, the report did note that the CCA was not able to demonstrate national regulatory oversight of the verification of the effectiveness of the product recall system. The report also noted that there were few strategies in place by the CCA to address the adulteration of raw ground beef (or beef components) by E.coli. Brazil is currently constrained by APHIS’s foot-and-mouth disease regulations and is thus not allowed to export raw meat to the US, but the report noted that should this situation change, FSIS would expect the CCA to develop a control program for E.coli prior to approaching the US for export approval. For the most part, the FSIS audit found the system was compliant with US standards in the key areas of sanitation, animal disease, slaughter/processing, residue, and enforcement controls, aside from the Ivermectin violations.
5.3 Mexico – Animal agriculture regulations and food safety
5.3.1 Food safety regulations
SAGARPA is Mexico’s secretariat with responsibility over livestock and animal health issues. Within SAGARPA, the agency SENASICA is responsible for regulating Mexico’s meat and processed poultry inspection system and animal health requirements. Mexico has a detailed set of over 50 norms governing animal agriculture. A listing of some of the key norms, along with a link to the complete set, is provided in the Appendices.
5.3.2 Foodborne illness
Tracking of foodborne illness in Mexico is much less adequate than it is in the United States. Estimates of illness vary widely, depending on the source. We provide a couple here.
25 “Final report of an audit conducted in Brazil, August 31 through September 22, 2010” (FSIS, USDA, March 8, 2011)

Consumer and Food Safety Costs of Offshoring Animal Agriculture
Food safety
74
According to the Pan American Health Organization (PAHO), there were approximately 200 reported deaths per year due to food poisoning (1997-1999) in Mexico, though estimates from a PAHO-sponsored conference claimed there were 192 million cases and 60,000 deaths (roughly ten times the figure in the United States – and given the population differential, approximately 30 times the US rate). Official estimates suggest smaller numbers.
Foodborne illness estimates, Mexico
Illness Annual estimate of cases Typhoid fever 44,000 Paratyphoid and other salmonellosis 135,000 Shigellosis 13,500 Intestinal viruses and other organisms 4,500,000 Hepatitis A 17,500 Bacterial food poisoning 36,000 Intestinal bacterial illness 5,500,000 Brucellosis 2,000
Source: CENAVECE, National Center for Epidemiological Vigilance and Illness Control SSA epidemiological bulletin (numbers are a rounded average of the estimates for 2007, 2008) The data above suggest fewer illnesses and in most cases even lower rates than in the US. Given the relative sanitary conditions in Mexico, this is unlikely to be the case. Rather, it probably reflects weaker data collection systems. Unfortunately, neither data set is particularly helpful when considering whether future imports from Mexico will be less safe than US domestically processed foods. From the perspective of evaluating Mexico as a competing supplier, and for the purposes of evaluating the food safety of its exported products, the only relevant segment of production is the portion of output that goes through certified, federally-inspected (TIF) processing plants. Of these, many are certified for export by the US and by other countries with high food safety standards. Despite the ongoing expansion of the TIF system, and of Mexico’s sales to niche export markets, the country continues to deepen its dependence on meat imports from the United States.
5.3.3 FSIS audit of Mexico’s meat inspection system - summary findings
Just as in the case of Brazil, FSIS periodically conducts audits of Mexico’s meat processing and inspection systems. The most recently published report was released on February 12, 2009 for three series of audits conducted in 2008.
• The first audit (June 22 – July 20, 2008) uncovered systematic deficiencies which resulted in Mexico temporarily suspending its exports to the US.

Consumer and Food Safety Costs of Offshoring Animal Agriculture
Food safety
75
• The second audit (September 8-19, 2008) continued to show deficiencies – corrections were not sufficiently implemented, and three risk areas continued to show deficiencies: sanitation, slaughter/processing, and oversight.
• In the third audit (Oct 20-24, 2008), problems continued to be identified in the same 3 risk areas as before, though the report recognized that progress continued to be made.
Despite the identified deficiencies, and issues at specific facilities, the FSIS audit said most areas and most facilities were in compliance with US standards.
5.4 Analysis: Food safety impact of increased animal agriculture imports
5.4.1 US import requirements for meat and poultry
In order to export meat and poultry to the US, foreign facilities must have their national governments apply for an equivalence certification for their food safety systems; separate applications are required for meat, poultry, and eggs. They must demonstrate that they have a food safety regime in place that yields the same safety outcomes/levels as those required in the US. This process requires an extensive system review, including a comprehensive in-country food safety system audit, by US experts. The review also includes a review of animal disease in the country (by FSIS) and of animal health (by APHIS). If the US determines that equivalency exists, then the country is declared eligible to export to the US. Regular audits take place to ensure that countries and their facilities maintain compliance. The US does not certify individual facilities (these must be approved for export by their own government), although it does track export shipments by facilities, and can thus monitor exporter performance. All shipments of meat and poultry are reinspected upon arrival in the US (they are first inspected by the system in their country of origin). However, only a small fraction is tested. FSIS uses a system that is both predictive and random to select shipments for testing; this ensures no coverage gaps in sampling, while focusing on the highest risk shipments.
5.4.2 Domestic vs. imported
There is no consensus on the relative risks of imported vs. domestic meat and poultry: the data do not exist. Moreover, there also appears to be no prevailing pattern among major foodborne illness outbreaks. Outbreaks caused by imported products are represented in the mix, but the majority of major outbreaks are connected with domestic products and the US food supply chain. Given that imports represent only 15%-20% of food consumed in the US, and a smaller fraction of meat and poultry, this would be expected. We have uncovered no definitive evidence that imported meat, poultry, and/or egg products are any less safe than those produced and distributed domestically. Given the fact that the vast majority of foodborne illness has no attribution (both the pathogen and contaminated food is unknown), this is not surprising. A summary26 of a 1998 Economic Research Service article on the subject concluded, “...there is no clear evidence that health risk due to pesticide residues or microbial bacterial contamination is greater with 26 Bruhn, Christine M., PhD. “Imported vs. domestically produced fruits and vegetables, is there a difference in food safety?” University of California, Davis, Center for Consumer Research, 1998.

Consumer and Food Safety Costs of Offshoring Animal Agriculture
Food safety
76
imported produce than with domestically grown.” Though the article focused on produce, we believe the same is true of meat and poultry. Like the US, other countries are working to improve their safety standards. FSIS inspections of both Mexico’s and Brazil’s food safety regimes for animal processing have found (by-and-large) that they meet our safety requirements. On most issues, audits have surfaced only a limited number of issues. Foreign countries are being driven to improve their food safety standards to meet the needs of export markets. Mexico, for instance, is unwilling to import bovine meat and bone meal from the US (even for purposes recognized scientifically as being safe), despite domestic demand, because it wants nothing to jeopardize its pursuit of an “insignificant BSE risk” classification from the World Organization for Animal Health (OIE), which the government hopes will open up substantial export opportunities. Japan, Korea, China, and other markets require a high standard in exchange for market access. Given FSIS’s comprehensive and detailed audit system to certify equivalence, and the high costs of selling products to the US and other international markets, foreign exporters have strong incentives to comply with US and international food safety standards.
5.4.3 Trend toward safety
Even if a) some production shifted overseas, b) imported meat and poultry products are less safe, and c) better data were available, making the case that consumers will be hurt by expanded imports would likely prove extremely difficult, unless foreign exporters were unable to compensate for lost US production while maintaining appropriate food safety standards. This reason for the difficulty would be that any resulting disparities in food safety levels (and thus number of cases and costs) would likely be addressed by serious steps being taken toward improved food safety.
1. Increased international trade (increased volumes, increasing trade as a percentage of production, the expansion of the number of import markets, and the increasing complexity of trade requirements) will drive international exporters to enact high standards to ensure access to these foreign markets. This will tend to reduce food safety dangers going forward, though significant portions of these markets are not currently meeting US food safety standards.
2. International trade is driven by large corporations with a vested interest in food safety. Increased consolidation in processing industries domestically and globally increases the potential financial consequences to individual processors, i.e., they have more at stake and are thus more likely to spend to prevent food safety problems that could disrupt their operations and investments.
3. Problems that surface should become self-correcting. Any identified deficiencies in food safety systems, whether international or domestic, or identified problems with import shipments, will lead to disruptions, consequences to the company/exporter, and ultimately, improvements. Individual companies have incentives to avoid problems (and to fix them quickly when they happen). And as we showed in both the case of Mexico (system deficiencies) and Brazil (Ivermectin-laced meat), the surfacing of problems led to self-imposed export bans until they were corrected.

Consumer and Food Safety Costs of Offshoring Animal Agriculture
Food safety
77
4. Our ability to develop better food safety systems, and a greater emphasis on prevention, will
increase the safety of both domestic and imported foods. Greater emphasis is being placed on basic controls, HAACP plans, and holding importers in the US accountable for their supply chains.
5. The recently passed Food Safety and Modernization Act (FSMA) calls for a reduction in trade delays for those willing to set the bar high. The legislation calls for voluntary programs whereby exporters willing to meet higher standards will be able to expedite their shipments into the United States. These programs reward participants with faster access and may encourage efforts to meet higher standards.
The US government’s ability to identify and block unsafe food imports at point of entry, though far from foolproof, is improving and will continue to do so. Both FSIS and the FDA are using risk-based predictive systems to target shipments for inspection according to inherent risk based on food type, company history, country history, weather and climate patterns during transport, etc. Also, better and faster detection methods continue to be developed, which will increase our system’s ability to detect problems and react more quickly to them, reducing the impact of foodborne illness.
Even under the assumption that some offshoring of animal agriculture will take place, it is difficult to identify any persistent increase in food safety problems or costs. Over the next few decades, advances in safety systems, prevention, and detection – along with self-interest – will likely make imports safer.
That said, some potential areas of concern remain.
1. Improvements in food safety are dependent upon funding. Both FSIS’s and FDA’s budgets face potential cuts in the current environment.
2. The number of inspections is also dependent upon funding.
3. Regardless of the safety level of imports, it remains the case that only a very small fraction of imports are tested for contaminants.

Consumer and Food Safety Costs of Offshoring Animal Agriculture
Conclusions
78
SECTION 6: CONCLUSIONS
6.1 Added regulations increase costs and reduce demand
In the five areas we reviewed (animal housing, environmental mandates, subtherapeutic antimicrobial and other drug use, labor supply, and livestock marketing), studies and evidence show that increased regulation will lead to higher producer and consumer costs.
• Animal housing regulations would require both one-time capital costs, as well as ongoing operational costs due to lower production density. Capital costs may range from as low as 1% more for new pork production facilities, to 5%-10 for retrofits. Cost increases to poultry and egg farmers (e.g., banning caged systems) could be much higher, driving the consumer price of eggs, for instance, up by as much as 25%, or $2.66 billion on an annual basis.
• The cost of environmental regulations is likely to be high, where enacted. Potential costs would be greatest where regulations are placed on waste disposal and emissions. Colorado’s experience regulating CAFOs is telling: pork production there has declined by 50% since 1999, when the rules were put in place.
• Limits or bans on the usage of subtherapeutic antimicrobials would have varying levels of impact. Studies on consequences of these regulations in the EU show a modest increase in production costs, and an overall increase in the usage of therapeutic antibiotics as more animals become sick. In addition, given their widespread international usage despite the added cost, antimicrobials most likely provide efficiency gains that are understated in these studies – in which case regulations in this area might drive production costs higher than the studies suggest.
• Increased costs to farmers and ranchers from a tightening and enforcement of legal and/or illegal immigrant labor rules would, in turn, be passed on to consumers. Some states are already passing their own laws to burden employers with requirements and restrictions in an effort to fight illegal immigration. These efforts, if upheld in the courts and/or expanded, would adversely impact production costs and consumer prices.
• New rules on livestock marketing would have an impact on meat prices – as much as a 3.3% increase according to one study financed by the American Meat Institute. USDA’s economic impact study will provide further evidence on the effect on consumers.
The aggregate impact of more regulation would be greater than the impact of any single measure or type of regulation. We evaluated two different scenarios – 10% and 25% increases in production costs due to excessive regulation. The consumer cost impacts would be $6.8 billion and $16.8 billion, respectively, for the two scenarios. In addition, under the 25% scenario, a reduction in exports would cost 9,000 jobs.
Consumer and Food Safety Costs of Offshoring Animal Agriculture
Conclusions
79
6.2 Jurisdictions that are early to adopt constraints / costs show decline
Whether a UK or Florida shift on sow stalls, or Colorado imposing strict environmental rules, we found that leading the charge on adopting new regulations that impact production costs is often followed by a substantial decline in production. This impact appears to be magnified when nearby jurisdictions with no/low additional market access costs are not so constrained (and are thus able to step in and fulfill demand). The causal effect between the regulations and drop in production is not well documented, but we simply note that from our research, where we have data, the two coincide more often than not. This leads to the conclusion that regulations should be adopted no faster than a) absolutely necessary or b) dictated by the market.
6.3 Production for the domestic market is unlikely to move overseas, short term
Feed is the primary cost in animal agriculture, and the US is a leading producer of feed. Moreover, in the past decade, animal agriculture within the US has become more concentrated, moving away from the periphery toward major centers of crop production….often to areas where feed grains and soybean meal are most plentiful. Because of the availability of these normally low-cost feed inputs, production for domestic consumption is unlikely to shift to foreign countries in substantial volumes, though it may continue to relocate domestically. In the past five years, US exports of meat and poultry have been growing, not shrinking. Given the availability of economically priced feed in the US, and rapidly growing demand in overseas markets that lack access to low-cost inputs (e.g. China, Japan), net export growth is likely to continue.
6.4 An increase in animal agriculture imports would not likely impose safety costs
There is no clear evidence that food safety would worsen with a shift from domestically produced to imported meat, poultry, and eggs. Data on food safety are poor. Of the markets reviewed in this assessment, the US has the most detailed tracking, yet even the US data are inadequate: the cause of 80% of all foodborne illnesses cannot be attributed to a specific food, much less whether it is imported. An ERS study commissioned on produce safety concluded that there is no reason to believe imported produce (not meat) is any less safe than domestic produce. There is no evidence to suggest this situation is different for meat, poultry and eggs. Consequently, there is a lack of concrete evidence that food safety would worsen, with additional costs to consumers, with a shift from domestically produced to imported meat, poultry, and eggs. Evolving food safety specifications and testing technologies could make food even safer, but only if funding is adequate for ongoing monitoring, testing, and inspections. As it stands, however, although all US plants have on-site inspectors, only a fraction of import shipments are tested.

Consumer and Food Safety Costs of Offshoring Animal Agriculture
Conclusions
80
6.5 The primary threat is to exports
The more likely threat for US farmers and ranchers from excess regulation comes from reduced competitiveness in export markets. As we have indicated, the US domestic market in current conditions does not appear to be at high risk for incursion from foreign competitors. US animal agriculture has access to lower-cost feed and much of the growth in output is driving exports rather than fueling internal demand, which has flattened on a per capita basis. The strongest growth opportunities are overseas. Pork and broilers have been true growth markets: global trade is expanding at 4% per year, twice as fast as production. As for beef, though the global market has been in decline, it has not dropped as sharply as in the US. Increased costs are a clear negative to farmers and ranchers, but there may be some small benefit from certain changes in production methods. Many overseas markets have different standards from our own, standards that may require production changes in exchange for market access. To the extent that changes increase market access overseas, US animal agriculture may benefit both from access and potentially higher pricing. In some cases, US competitors are exporting at a premium, taking steps to alter production methods to meet the requirements of overseas markets. These price premiums are inconsistent with the notion that foreign products are inferior (or less safe). Many of the markets they sell to have food safety systems the US considers equivalent to our own. Failure to meet standards in overseas markets – however burdensome or disruptive to current production methods – could limit US export opportunities, and opportunities for improved pricing and US industry growth.
6.6 Consumer (and foreign) markets may dictate change, regulation or no
This study focuses primarily on the impacts on consumers of higher regulation, higher prices, and the possibility of increased food safety costs. US farmers and ranchers are correct to be wary of imposed regulations and attendant costs, particularly in the environmental, labor, and marketing areas, as they may serve to make US products less competitive. However, market participation requires both profitable production and product demand. Some (though not all) of the potential costs that may be imposed upon farmers and ranchers may be consumer-driven. There may be a competitive risk in deflecting or delaying regulatory costs that are truly driven by consumer concerns. Also, new regulations or market requirements overseas could render US production unsuitable for export to those markets, eroding US opportunities and its competitive position in international markets.

Consumer and Food Safety Costs of Offshoring Animal Agriculture
Appendices
81
APPENDICES
A1 – US regulatory authorities
Regulatory Authorities:
Animal Plant and Health Inspection Service (APHIS) 1. 28 Hour Law: This regulation stipulates that all animals being transported for longer
than 28 consecutive hours must be removed from the shipment container and allowed to walk, rest, and drink.
2. Farm Animals Anti-Cruelty Act: Since the Animal Welfare Act does not specify the proper or improper treatment of farm animals, this initative seeks to prevent the mistreatment of animals used for commercial purposes and levies significant financial liabilities upon violators (up to $100,000) and/or up to one year of jail time.
Food Safety and Inspection Service (FSIS), US Department of Agriculture
Food and Drug Administration (FDA)
Environmental Protection Agency (EPA) 1. Safe Drinking Water Act (SDWA): Requires farms to sample any on-site water
source that is used for drinking water for more than 25 people for microbiologicals and nitrates. Class V agricultural drainage wells are also required to provide inventory information to the state. These wells are defined as any hole that is deeper than it is wide into which liquid waste or waste water is injected. In addition to inventory information, farms may also be required to obtain a permit in some states.
2. Clean Water Act (CWA): One of the most significant regulations on animal agriculture, the CWA is intended to provide assistance to improve the management of wastewater, control point and non-point source pollution, and maintain wetland integrity. Requirements include the obtainment of a National Pollution Discharge Elimination System (NPDES) permits for Concentrated Animal Feeding Operations (CAFOs), which are defined by the number of animal units. This process requires the submission of a Notice of Intent, a Nutrient Management Plan, and may require infrastructural adjustments, updates, and construction. It is estimated that 14,100 producers are now classified as CAFOs and are under its regulation27.
3. Clean Air Act: The main purpose of this act is to monitor and regulate various forms of air pollution. Two of the six criteria pollutants identified by the EPA relate directly to Animal Feeding Operations: particulate matter (PM) and nitrogen dioxide. Two additional pollutants, ammonia and hydrogen sulfide increasingly bring certain large-scale producers under regulation. States are allowed to monitor, regulate, and enforce self-determined compliance levels which understandably vary in severity from state to state. The regulations main include permit obtainment for air pollutants largely generated by animal waste removal and management.
4. Comprehensive Environmental Response, Compensation, and Liability Act (CERCLA/Superfund): Designed to require reporting of potentially hazardous materials into the environment, ammonia and hydrogen sulfide related specifically to
27 Copeland, C. Air Quality Issues and Animal Agriculture: A Primer. 2007. Cong. Res. Serv. 10.

Consumer and Food Safety Costs of Offshoring Animal Agriculture
Appendices
82
animal agriculture. Any release or discharge of 100 lbs/day or 18.3 tons/year must be reported. Failure to report could elicit civil penalties of up to $27,500/day.
5. Emergency Planning and Community Right-to-know Act: This regulation is similar to CERCLA, with the major difference being potential civil penalties that could be levied against producers of $27,500 per violation.
Grain Inspection, Packers and Stockyards Administration 1. Packers and Stockyards Act, 1921, As Amended: This act and associated
regulations govern the marketing of livestock, poultry and meat with the objective of promoting fair and competitive trading practices.
A2 - Links
United States For food safety illness, case study estimates Emerging Infectious Diseases, Vol 17, No. 1. CDC. http://www.cdc.gov/eid/content/17/1/pdfs/EID_Vol17No1.pdf For estimates of foodborne illness costs Scharff, Robert L. “Health-Related Costs from Foodborne Illness in the United States. Produce Safety Project, Georgetown University, 3 March 2010. http://www.producesafetyproject.org/admin/assets/files/Health-Related-Foodborne-Illness-Costs-Report.pdf-1.pdf Food Safety Modernization Act (2011), full text http://www.fda.gov/Food/FoodSafety/FSMA/ucm247548.htm Outbreak Alert!: Analyzing Foodborne Outbreaks, 1998 to 2007 Center for Science in the Public Interest http://www.cspinet.org/new/pdf/outbreakalertreport09.pdf FSIS evaluation of Brazil’s inspection system for meat processing and export (8 March 2011) http://www.fsis.usda.gov/OPPDE/FAR/Brazil/Brazil2010.pdf FSIS evaluation of Mexico’s inspection system for meat processing and export (12 February 2009) http://www.fsis.usda.gov/OPPDE/FAR/Mexico/Mexico2009.pdf US Government Accountability Office (GAO): Antibiotic Resistance: Federal Agencies Need to Better Focus Efforts to Address Risk to Humans from Animal Antibiotic Use in Animals (April 2004) http://www.gao.gov/new.items/d04490.pdf
US Government Accountability Office (GAO): Antibiotic Resistance: Agencies Have Made Limited Progress Addressing Antibiotic Use in Animals (7 September 2011) http://www.gao.gov/new.items/d11801.pdf

Consumer and Food Safety Costs of Offshoring Animal Agriculture
Appendices
83
Mexico Mexico has over 50 norms that govern its animal agriculture industry. A comprehensive listing of these is available at National Service for Agroalimentary Health, Safety, and Quality (SENASICA). http://www.senasica.gob.mx/?id=787. Some of the key norms include the following:
NOM-012-ZOO-1993 – Specification for the use of chemical, pharmaceutical, and biological and alimentary products for use in or consumption by animals.
NOM-022-ZOO-1995 – Characteristics and zoosanitary specifications for the installations, equipment, and operation of establishments that market chemical, pharmaceutical, biological, and alimentary products for use in or consumption by animals.
NOM-024-ZOO-1995 – Specifications and zoosanitary characteristics for the transport of animals, their products and byproducts, and chemical, pharmaceutical, biological, and alimentary products for use in or consumption by animals.
NOM-030-ZOO-1995 – Specifications and procedures for the inspection of meat, carcasses, viscera, and waste of imports at zoosanitary inspections locations.
NOM-033-ZOO-1995 – Humane slaughter of domesticated and wild animals
NOM-040-ZOO-1995 – Specifications for the marketing of pure antimicrobial salts for use in or consumption by animals.
NOM-051-ZOO-1995 – Humane treatment in the transport of animals.
NOM-0538-ZOO-1999 – Specifications for installations and operations of locations of zoosanitary verification and inspection
NOM-063 – Specifications for drugs used in the prevention and control of illnesses that affect animals.
Brazil Legislation affecting pork production http://www.sebrae.com.br/setor/carne/o-setor/suinos2/legislacao Legislation affecting poultry production http://www.sebrae.com.br/setor/carne/o-setor/aves/legislacao