consumer analyst group of new york february 16, 2016...
TRANSCRIPT

Consumer AnalystGroup of New YorkAnnual Conference
February 16, 2016

Donnie Smith
President &CEO
Andy CallahanPresident,Retail PackagedBrands
Sally GrimesPresident,International & ChiefGlobal Growth Officer
Jon KatholVice President,Investor Relations

Tom Hayes
Chief Commercial Officer & President, Food Service
Donnie KingPresident, North American Operations
Dennis LeatherbyExecutive Vice President & CFO
Certain information contained in this presentation may constitute forward-looking statements, such as statements relating to expected performance. These forward-looking statements are subject to a number of factors and uncertainties which could cause our actual results and experiences to differ materially from the anticipated results and expectations expressed in such forward-looking statements. We wish to caution readers not to place undue reliance on any forward-looking statements, which speak only as of the date made. Among the factors that may cause actual results and experiences to differ from anticipated results and expectations expressed in such forward-looking statements are the following: (i) the effect of, or changes in, general economic conditions; (ii) fluctuations in the cost and availability of inputs and raw materials, such as live cattle, live swine, feed grains (including corn and soybean meal) and energy; (iii) market conditions for finished products, including competition from other global and domestic food processors, supply and pricing of competing products and alternative proteins and demand for alternative proteins; (iv) successful rationalization of existing facilities and operating efficiencies of the facilities; (v) risks associated with our commodity purchasing activities; (vi) access to foreign markets together with foreign economic conditions, including currency fluctuations, import/export restrictions and foreign politics; (vii) outbreak of a livestock disease (such as avian influenza (AI) or bovine spongiform encephalopathy (BSE)), which could have an adverse effect on livestock we own, the availability of livestock we purchase, consumer perception of certain protein products or our ability to access certain domestic and foreign markets; (viii) changes in availability and relative costs of labor and contract growers and our ability to maintain good relationships with employees, labor unions, contract growers and independent producers providing us livestock; (ix) issues related to food safety, including costs resulting from product recalls, regulatory compliance and any related claims or litigation; (x) changes in consumer preference and diets and our ability to identify and react to consumer trends; (xi) significant marketing plan changes by large customers or loss of one or more large customers; (xii) adverse results from litigation; (xiii) impacts on our operations caused by factors and forces beyond our control, such as natural disasters, fire, bioterrorism, pandemic or extreme weather; (xiv) risks associated with leverage, including cost increases due to rising interest rates or changes in debt ratings or outlook; (xv) compliance with and changes to regulations and laws (both domestic and foreign), including changes in accounting standards, tax laws, environmental laws, agricultural laws and occupational, health and safety laws; (xvi) our ability to make effective acquisitions or joint ventures and successfully integrate newly acquired businesses into existing operations; (xvii) failures or security breaches of our information technology systems; (xviii) effectiveness of advertising and marketing programs; and (xix) those factors listed under Item 1A. “Risk Factors” included in our Annual Report filed on Form 10-K for the period ended October 3, 2015.
FO RWARD-LOOKING STAT EMENT S


I CO NIC BRANDS
Tyson, Jimmy Dean,Hillshire Farm – Billion $ Brands

T YSO N FO ODS I S O NE O F T HE W ORL D ’S L ARG EST F O O D CO MPANI ES
Chicken27%
Beef41%
Prepared Foods19%
Pork11%
Other2%
Other4%
Consumer Products52%
Foodservice31%
Int’l13%
Salesby Segment
Sales byDistribution Channel
*Represents a non-GAAP financial measure, which is explained and reconciled to a comparable GAAP measure in the Appendix.
$40.6 billion in FY15 adjusted sales*

ADJ UST ED EPS* G ROW TH
*Represents a non-GAAP financial measure. Adjusted EPS is explained and reconciled to a comparable GAAP measure in the Appendix.** Projected EPS guidance as of 02/05/16
FY12 FY13 FY14 FY15 FY16 proj.
$2.94
$1.97$2.26
$3.15
$3.85-3.95**

T YSO N FOODS F I NANCI AL T RENDS
**Represents a non-GAAP financial measure. EBITDA is explained and reconciled in the Appendix.
Sales (Bn) EBITDA** (MM)
$32.0 $33.1 $34.4 $37.3*
$40.6*
FY11 FY12 FY13 FY14 FY15
$1,767 $1,731 $1,818 $1,897
$2,906
FY11 FY12 FY13 FY14 FY15
*Adjusted sales represents a non-GAAP financial measure, which is explained and reconciled in the Appendix.

PRI O RIT IES FO R CASH
Growing Existing Businesses
Strategic Acquisitions
Returning Cash to Shareholders

T SN PERF O RMANCE VS . S&P 5 0 0 AND PEER G RO UP*
$0
$50
$100
$150
$200
$250
$300
$350
10/2/10 10/1/11 9/29/12 9/28/13 9/27/14 10/3/15
Tyson Foods S&P 500 Index Peer Group
*The total cumulative return on investment (change in the year-end stock price plus reinvested dividends), which is based on the stock price or composite index at the end of fiscal 2010, is presented for each of the periods for Tyson Foods, the S&P 500 Index and the peer group. The graph compares the performance of the Company's Class A common stock with that of the S&P 500 Index and the peer group, with the return of each company in the peer group weighted on market capitalization. The information in the Performance Graph shall not be deemed to be "soliciting material" or to be "filed" with the Securities and Exchange Commission or subject to Regulation 14A or 14C, or to the liabilities of Section 18 of the Securities Exchange Act of 1934. See the Appendix for a full list of the peer group.
FYE
comparison of 5-year cumulative total returns

Andy Callahan President,Retail Packaged Brands


DI FFERENT PO RT FOLIO. D I F FERENT BUSI NESS MO DEL / /
today’s takeaways
Advantaged categories
We play in attractive, high-growth protein categories
Leading brands
We leverage our portfolio of leading brands and scale to drive growth
Differentiated approach
Our business model uniquely positions us to drive value creation
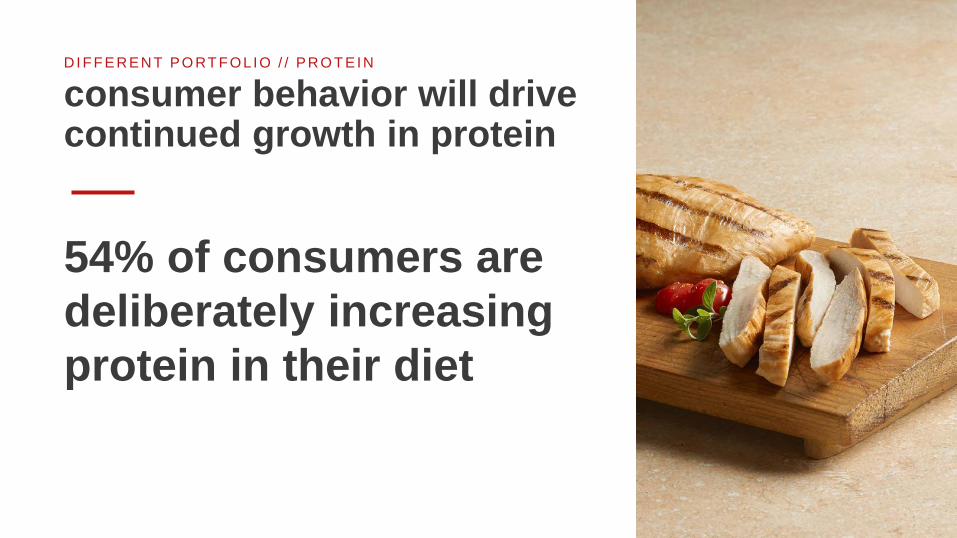
DI FFERENT PO RT FOLIO / / PRO T EIN
consumer behavior will drive continued growth in protein
54% of consumers are deliberately increasing protein in their diet
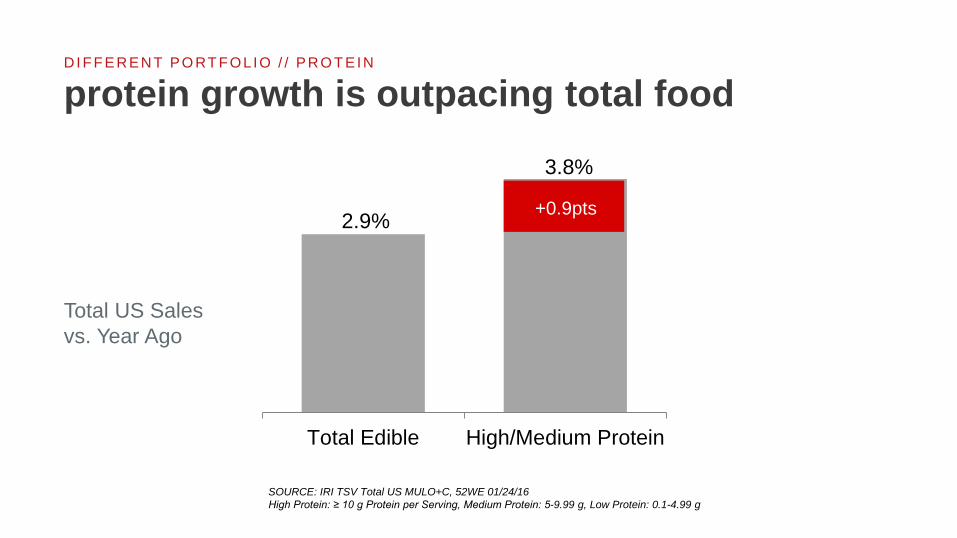
DI FFERENT PO RT FOLIO / / PRO T EIN
protein growth is outpacing total food
2.9%
3.8%
Total Edible High/Medium Protein
Total US Salesvs. Year Ago
+0.9pts
SOURCE: IRI TSV Total US MULO+C, 52WE 01/24/16High Protein: ≥ 10 g Protein per Serving, Medium Protein: 5-9.99 g, Low Protein: 0.1-4.99 g
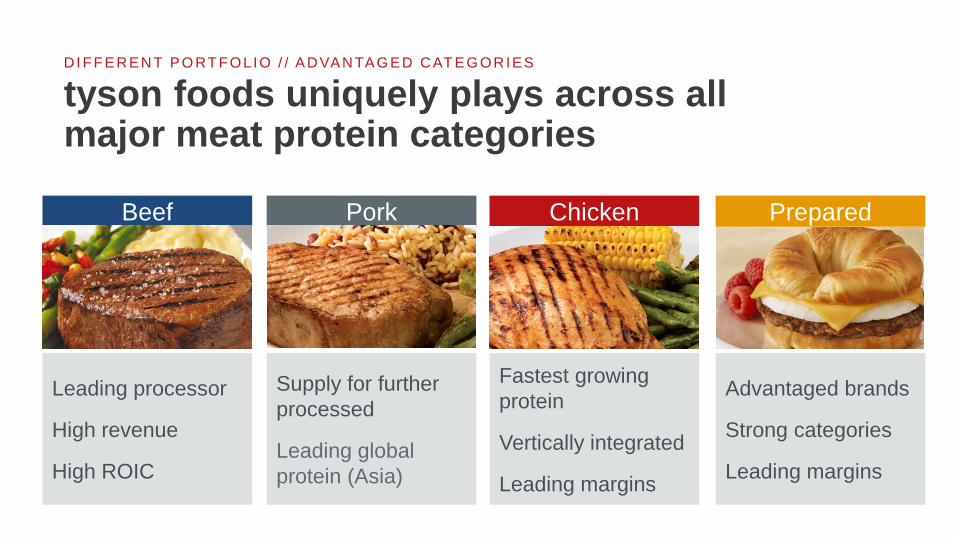
DI FFERENT PO RT FOLIO / / ADVANTAG ED CAT EG ORIES
tyson foods uniquely plays across all major meat protein categories
Beef
Leading processor
High revenue
High ROIC
Pork
Supply for further processed
Leading global protein (Asia)
Chicken
Fastest growing protein
Vertically integrated
Leading margins
Prepared
Advantaged brands
Strong categories
Leading margins

DI FFERENT PO RT FOLIO / / ADVANTAG ED CAT EG ORIES
we are driving growth in advantaged protein segments
High growth
High margin
Sustained advantage
Chicken
$11.1Bn
15% commodity sales
Prepared Foods
$7.7Bn
0% commodity sales

DI FFERENT PO RT FOLIO / / ADVANTAG ED CAT EG ORIES
our mix is shifting to value-added segments
Consumer/Retail
Foodservice
Pure Commodity
Chicken Growth and Profitability
Retail 'Core 9'
Prepared Foods
Emerging/Other Brands
Foodservice

DI FFERENT PO RT FOLIO / / L EADI NG BRANDS
our brands have leading share and growth across categories
Frozen PreparedChicken1 Hot Dogs1 Branded Stack
Pack Bacon1
Corn Dogs1 Super PremiumSausage1Smoked
Sausage1 Branded Lunchmeat2
Frozen Breakfast Sandwiches1 Breakfast
Sausage1

DI FFERENT PO RT FOLIO / / L EADI NG BRANDS
emerging brands drive incremental sales in high-growth categories
Portfolio of ‘start up’ businesses > $225MM todaySales growth rate > 50% vs. 2014


DI FFERENT BUSI NESS MO DEL / / VAL UE CREAT I ON
we are investing in our customers
Tyson distribution growth rate FY2015 vs. year ago
Tyson FoodsCompetitors
+2.0pts
-0.01pts
SOURCE: TDPs, latest MULO 4 Weeks September 13, 2015

DI FFERENT BUSI NESS MO DEL / / VAL UE CREAT I ON
we are investing in our brands

VIDEO
TYSON BRAND INVESTMENT
DI FFERENT BUSI NESS MO DEL / / VAL UE CREAT I ON

DI FFERENT BUSI NESS MO DEL / / VAL UE CREAT I ON
we are building consumer advocates
SOURCE: Tyson Foods Brand Health Tracker, data through September 2015, Base: Aware of Brand
Brand Advocacy: % Recommend
Breaded Chicken Strips
Hot Dogs
Frozen Breakfast Sandwich
Fresh Breakfast Sausage
Cooked Breakfast Sausage
Corn Dogs
Smoked Rope Sausage
Lunchmeat
Chicken Nuggets
Tyson Foods vs. Next Branded Competitor
0% 50% 100%||
DI FFERENT BUSI NESS MO DEL / / VAL UE CREAT I ON
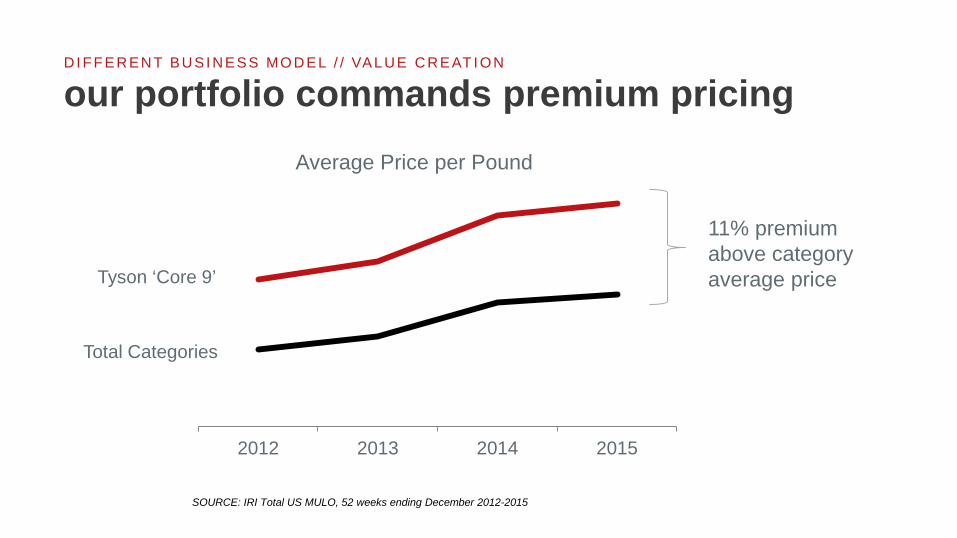
our portfolio commands premium pricing
$3.20
$3.40
$3.60
$3.80
$4.00
$4.20
$4.40
2012 2013 2014 2015
Average Price per Pound
SOURCE: IRI Total US MULO, 52 weeks ending December 2012-2015
Tyson ‘Core 9’
Total Categories
11% premium above category average price

DI FFERENT BUSI NESS MO DEL / / VAL UE CREAT I ON
our brands successfully extend into new categories

DI FFERENT BUSI NESS MO DEL / / VAL UE CREAT I ON
our brand strength enables us to win in channels beyond retailConsumer Perceptions: C-store Breakfast Sandwiches
Jimmy Dean® Brand vs. Next Branded Competitor
SOURCE: Vision Critical C-Store Research, 2012
Likelihood to purchase +24pts
High quality +34pts
Great tasting +33pts
For someone like me +25pts

DI FFERENT PO RT FOLIO. D I FFERENT BUSI NESS MO DEL / / VAL UE CREAT I ON
tyson is uniquely positioned to lead growth and value creation over time
• Growth above food & beverage
• Portfolio mix driving margin expansion
• Brand advocates• Investing to grow
value creation


Sally Grimes President, International &Chief Global Growth Officer


DI FFERENT TO DAY. D I FFERENT TO MORROW / /
TYSON GROWTH VIDEO

DI FFERENT TO DAY. D I FFERENT TO MORROW / /
today’s takeaways
Supply
Expertise at scale that enables Tyson Foods to capitalize on modern food opportunity
Demand
Deep insight that is translated into innovative food experiences
Today
Continuous ‘Core 9’ innovation
Iconic brands into adjacent categories
Differentiated protein snacking portfolio
Tomorrow
Committed to global growth markets
Playing to win in new growth channels
Expansive opportunity for Tyson® brand
Differentiated Capabilities Position Tyson for Growth
DI FFERENT TO DAY. D I FFERENT TO MORROW / / SUPPLY
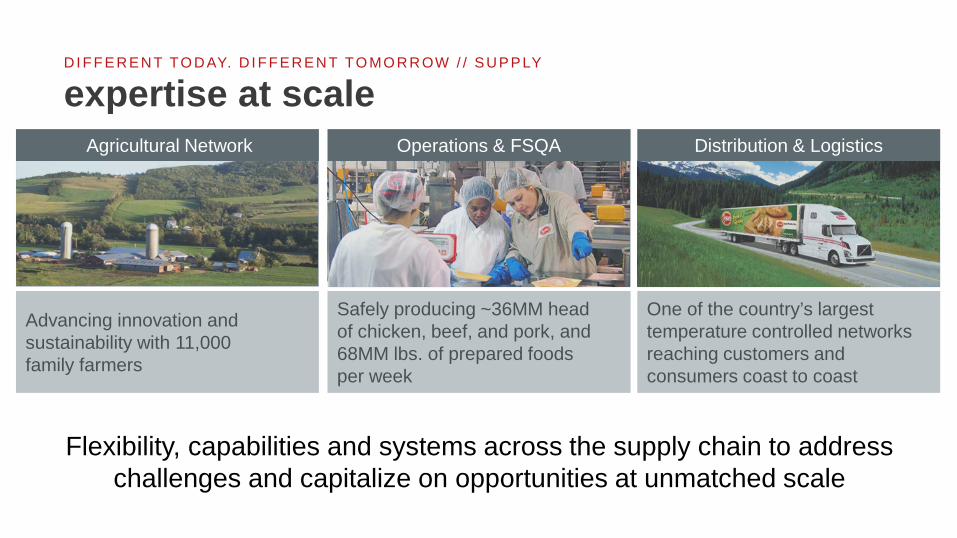
expertise at scale
Flexibility, capabilities and systems across the supply chain to address challenges and capitalize on opportunities at unmatched scale
Agricultural Network Operations & FSQA Distribution & Logistics
Advancing innovation and sustainability with 11,000 family farmers
Safely producing ~36MM headof chicken, beef, and pork, and 68MM lbs. of prepared foodsper week
One of the country’s largest temperature controlled networks reaching customers and consumers coast to coast

DI FFERENT TO DAY / / DEMAND
insight to innovation
Growth opportunities defined by our consumer and strategically connected to core development & commercialization capabilities
Insights Innovation Research & Development
Extensive examination of the forces shaping food & proprietary tools to prioritize, optimize and quantify opportunities
Extending the spark and spirit of an entrepreneurial branded food company
State of the art R&D centers, sophisticated sensory tools & world class culinary

Branded Retail Food Companies 2015 Comparison
innovation vitality1
DI FFERENT TO DAY / /
top tier innovation performance insights
innovation
research &development
12.9%
12.5%
10.8%
8.6%8.4%
1SOURCE: Nielsen total US XAOC – Expanded all outlet channel and includes Walmart

DI FFERENT TO DAY / /
inspired innovation

Launch continuous innovation in ‘Core 9’
Extend iconic brands into adjacencies
Build a differentiated protein snacking portfolio
focused innovation ovation momentum
12 major launches in ‘Core 9’ categories over next 12mos
2016 innovation in adjacent categories for Jimmy Dean, Hillshire Farm, Ball Park & Tyson
Differentiated platforms in high growth categories of meat snacks (+7.5%) and snack combos (+ 14.0%)
DI FFERENT TO DAY / /

The InsightAll natural products usually don’t taste as good
The InnovationAn all natural lunchmeat that requires no sacrifice in taste
The AdvantageExpertise in delivery of superior protein taste, texture and appearance
The ImpactHighly incremental launch, drawing in new consumers to grow the brand AND the category
success story: hillshire farm naturals™DI FFERENT TO DAY / /
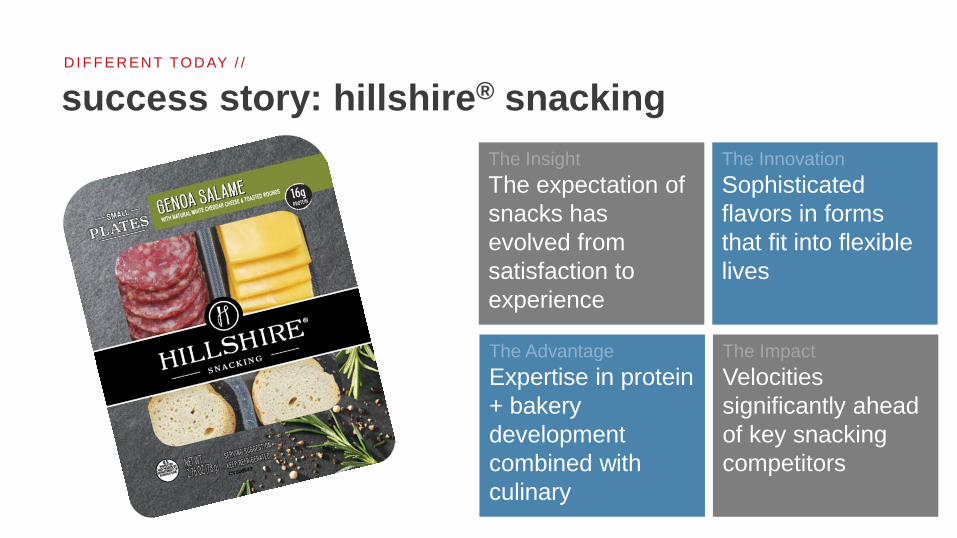
The InsightThe expectation of snacks has evolved from satisfaction to experience
The InnovationSophisticated flavors in forms that fit into flexible lives
The AdvantageExpertise in protein + bakery development combined with culinary
The ImpactVelocities significantly ahead of key snacking competitors
success story: hillshire® snackingDI FFERENT TO DAY / /

The InsightMeat from the grill just tastes better
The InnovationFlame grilled taste with unique tender texture
The AdvantageProprietary flame-grilledmanufacturing process
The ImpactLargest brand launch in the category in the last 5 years
success story: ballpark® jerkyDI FFERENT TO DAY / /
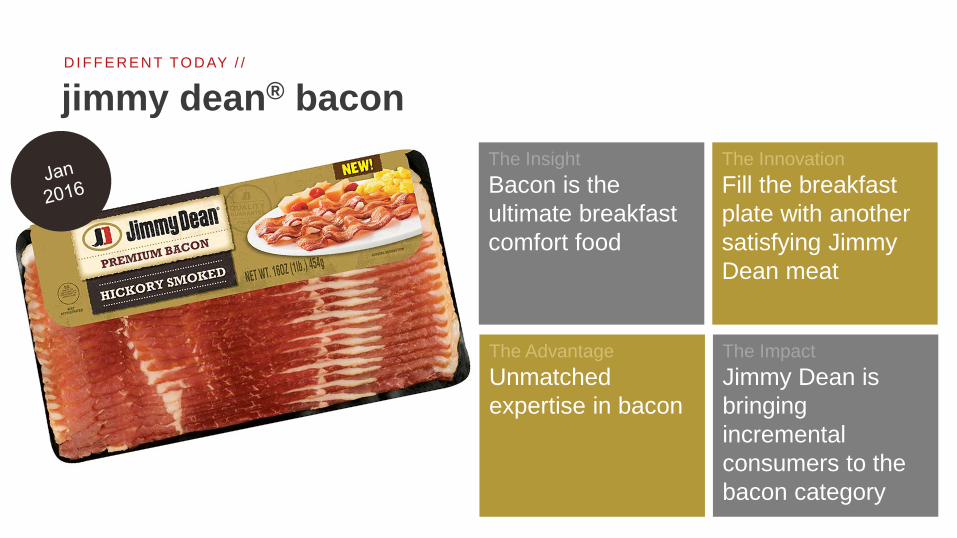
The InsightBacon is the ultimate breakfast comfort food
The InnovationFill the breakfast plate with another satisfying Jimmy Dean meat
The AdvantageUnmatched expertise in bacon
The ImpactJimmy Dean is bringing incremental consumers to the bacon category
jimmy dean® baconDI FFERENT TO DAY / /

The InsightMorning snacking is on the rise with consumers seeking unique handheld offerings
The InnovationCrispy hashbrownout of the microwave with warm cheese and meat fillings
jimmy dean® stuffed hash brownsDI FFERENT TO DAY / /

The InsightA healthier start in a convenient handheld form
The InnovationBread-free, low calorie, warm breakfast in a unique form
jimmy dean delights® frittataDI FFERENT TO DAY / /
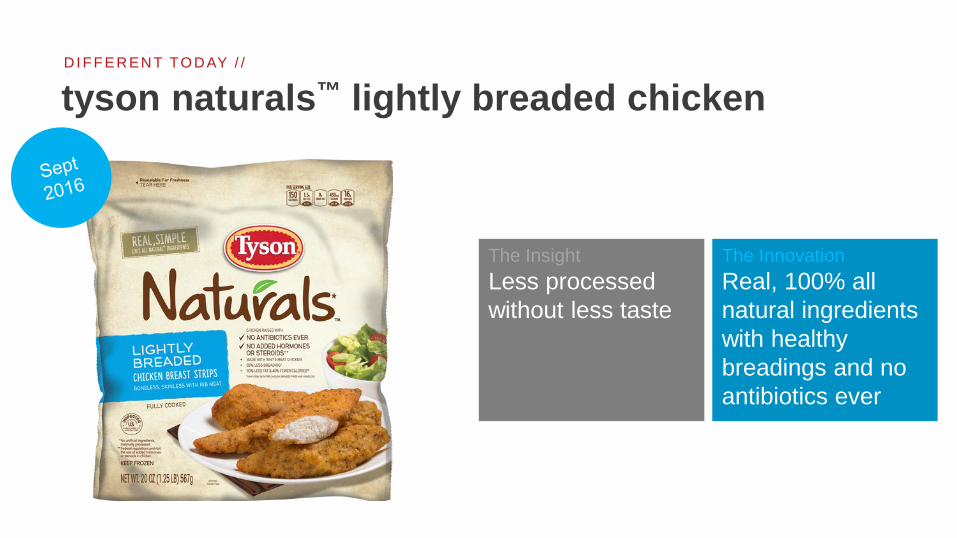
The InsightLess processed without less taste
The InnovationReal, 100% all natural ingredients with healthy breadings and no antibiotics ever
tyson naturals™ lightly breaded chickenDI FFERENT TO DAY / /

The InsightHealthier alternative chicken nugget that the whole family can enjoy
The InnovationUnbreaded grilled chicken nuggets with 50% fewer calories & no antibiotics ever
tyson naturals™ grilled nuggetsDI FFERENT TO DAY / /

The InsightExperience a snacking adventure with the goodness of protein
The InnovationFoodie-worthy snacking with 3 protein-packed components
hillshire® snacking extensionsDI FFERENT TO DAY / /

The InsightGuys want bold flavor with minimal prep
The InnovationOn-trend forms and flavors that can go from freezer to table in 3 minutes
ballpark® frozen expansionDI FFERENT TO DAY / /
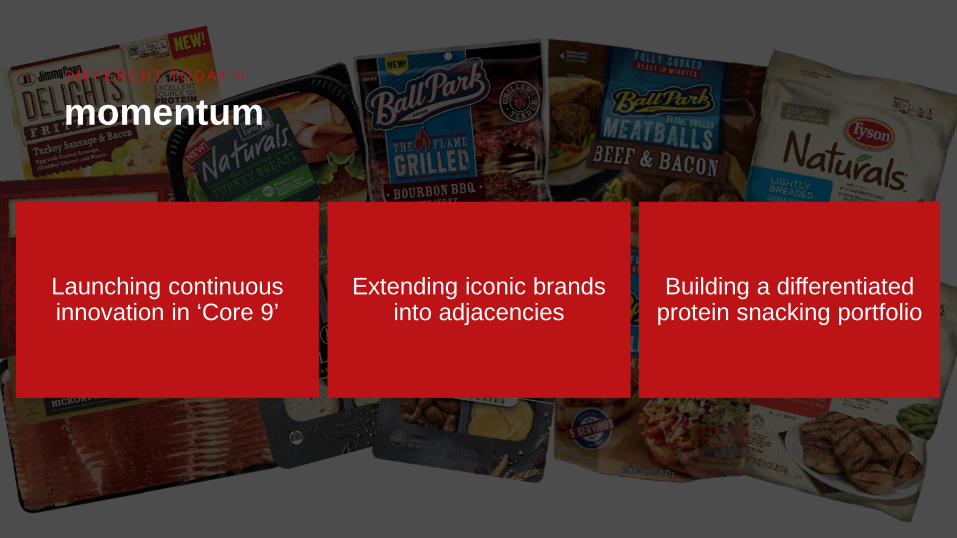
Launching continuous innovation in ‘Core 9’
Extending iconic brands into adjacencies
Building a differentiated protein snacking portfolio
DI FFERENT TO DAY / /
momentum

tomorrow

Selling more branded, protein centric food than any other company in the world
The global innovative leader of food experiences
DI FFERENT TO MO RROW / /
vision

The worldis changing…
Emerging economies and the rise of the global middle class
Technological innovation and increased connectivity
Population increase and resource scarcity
Consumer value shifts: health, sustainability, transparency

The worldis changing,and so are we.
Growth Markets
Growth Channels
Growth Brands

food expenditure
88%
DI FFERENT TO MO RROW / / G ROW T H MARKET S
new consumers in new markets represent significant growth potential
population
96%
fresh poultry, pork & beef
89%
processed meat & seafood
85%
Macro Opportunity Market Opportunity
USA Rest of World Source: Population / Food Expenditure - Euromonitor International from national statistics/Eurostat/UN/OECD, Fresh / Processed Food - Euromonitor from trade sources/national statistics

the world is urbanizing
> 50% of people in developing markets will live in urban areas by 2020
a new middle class is rising
75MM new middle class HHs added to the developing world by 2020
our strategy has evolved to capitalize on massive market and consumer shifts
Supplying customers
Meeting consumer needs
United States out
Developing markets in
Commodity portfolio
Proprietary food experiences
from to
the
fact
s
our e
volu
tion
Source: Euromonitor International from national statistics/Eurostat/UN/OECD,
D I FFERENT TO MO RROW / / G ROW T H MARKET S

DI FFERENT TO MO RROW / / G ROW T H MARKET S
the opportunity is big, our focus is clear and progress has begun
• Fastest growth in disposable income of any nation over next 15yrs
• Packaged food growth 3X global rate between now and 2020
• 5th largest poultry market & growing
• World’s largest pork & poultry market• 2nd largest packaged food market• World’s largest foodservice market
locally relevant brands &products
CHINA INDIA
locally relevant brands &products
Source: Population / Food Expenditure - Euromonitor International from national statistics/Eurostat/UN/OECDFresh / Processed Food - Euromonitor from trade sources/national statistics

grow where the growth is
Traditional channel growth is slowing
In the next 5 years, the majority of retail growth will come from non-traditional channels
Ecommerce is coming to food and bev
Non-store retail is projected to grow over FIVE times faster than rest of market over next 5yrsthe
fact
s
our f
ocus
Dedicated Growth Channels Innovation Experts
Customized Product Offerings
Retailer Partnerships
Source: Retailing: 2015-2020 projected CAGR of store based and non-store retail Euromonitor from trade sources/national statistics
D I FFERENT TO MO RROW / / G ROW T H CHANNEL S


DI FFERENT TO MO RROW / / G ROW T H BRANDS
Keep it real. Keep it Tyson.

DI FFERENT TO MO RROW / / G ROW T H BRANDS
EMBED TYSON VIDEO
TYSON BRAND VIDEO

DI FFERENT TO MO RROW / / G ROW T H BRANDS
a brand to come back to time and again

DI FFERENT TO MO RROW / / G ROW T H BRANDS
tyson is uniquely positioned to capitalize on the opportunity of ‘CFG’ (consumer fresh goods)
Dollar Growth, 3 YR CAGR
Source: Nielsen, Perishables Group FreshFacts® Total U.S.3 yr CAGR based on 2011- 2015 data
Fresh unbranded
Addedvalue
Branded added value
MARGINSD
IFFE
REN
TIAT
ION
1.4%
2.3%
4.0%
SITUATIONConsumer demand drives a sharp increase in fresh food growth
OPPORTUNITYCreate more value for fresh sales

DI FFERENT TO MO RROW / / G ROW T H BRANDS
tyson ‘CFG’ will value up one of food’s largest categories
$33BThe fresh meat category… is ripe for consumer value creation
Source: Nielsen Perishables Group, 52 weeks ending 12/26/15

The purveyors of the better food experience

DI FFERENT TO MO RROW / / G ROW T H BRANDS
to empower the at home chef

DI FFERENT TO MO RROW / / G ROW T H BRANDS
adding value beyond the productKn
owle
dge
Prep
arat
ion
Expl
orat
ion

DI FFERENT TO MO RROW / / G ROW T H BRANDS
a curated line of dinners made fresh at home

DI FFERENT TO DAY. D I FFERENT TO MORROW / / SUMMARY
a different kind of food company
Supply
Expertise at scale thatenables Tyson to capitalize on modern food opportunity
Demand
Deep insight that is translated into innovative food experiences
Today
Continuous ‘Core 9’ innovation
Iconic brands into adjacent categories
Differentiated protein snacking portfolio
Tomorrow
Committed to global growth markets
Playing to win in newgrowth channels
Expansive opportunity for Tyson brand
Differentiated Capabilities Position Tyson Foods for Growth


Donnie Smith President &Chief Executive Officer

Consumer AnalystGroup of New YorkAnnual Conference
February 16, 2016

Appendix
TS N P E R FORMA NCE V S . S & P 500 A N D P E E R GR OU P
The peer group includes: Archer-Daniels-Midland Company, Bunge Limited, Campbell Soup Company, ConAgra Foods, Inc., Dean Foods Company, General Mills, Inc., Hormel Foods Corp., Kellogg Co., McCormick & Co., Mondelez International Inc., PepsiCo, Inc., Pilgrim's Pride Corporation, Sanderson Farms, Inc., The Hershey Company, and The J.M. Smucker Company.

EPS EPS EPS EPSReported from Continuing Operations 2.95$ 2.37$ 2.31$ 1.68$ Less:
Recognition of previously unrecognized tax benefit (0.06) (0.15) - -Insurance proceeds (net of costs) related to a legacy Hillshire Brands plant fire (0.02) - - -
Gain on sale of equity securities (0.03) - - -Gain on sale of Mexico operation (0.24) - - -Esimated Impact of additional week (0.06) - - -Gain from currency translation adjustment - - (0.05) -Gain on sale of interest in an equity method investment - - - -Reversal of reserves for foreign uncertain tax positions - - - -
Add:China Impairment 0.41 - - -Merger and integration costs 0.09 - - -Prepared Foods network optimization charges 0.09 - - -Dension plant closure 0.02 - - -Loss related to early extinguishment of debt - - - 0.29Brazil impairment/Mexico undistributed earnings tax - 0.16 - -Hillshire Brands acquisition, integration and costs associated with our Prepared Foods improvement plan - 0.37 - -
Hillshire Brands post-closing results, purchase price accounting and costs related to a legacy Hillshire Brands plant fire
- 0.07 - -
Hillshire Brands acquisition financing incremental interest costs and share dilution - 0.12 - -
Adjusted from Continuing Operations 3.15$ 2.94$ 2.26$ 1.97$
12 Months Ended
October 3, 2015 September 27, 2014 September 28, 2013 September 29, 2012
E P S R E C ON CIL IAT IONSUnaudited
Adjusted net income from continuing operations per share attributable to Tyson (adjusted EPS) is presented as a supplementary financial measurement in the evaluation of our business. We believethe presentation of adjusted EPS helps investors assess our financial performance from period to period and enhance understanding of our financial performance; however, adjusted EPS may not becomparable to those of other companies in our industry, which limits the usefulness as comparative measures. Adjusted EPS is not a measure required by or calculated in accordance with GAAP andshould not be considered as a substitute for any measure of financial performance reported in accordance with GAAP. Investors should rely primarily on our GAAP results and use non-GAAPfinancial measures only supplementally in making investment decisions.

2015 2014 2013 2012 2011
Net income 1,224$ 856$ 778$ 576$ 733$ Less: Interest income (9) (7) (7) (12) (11)Add: Interest expense 293 132 145 356 242Add: Income tax expense (a) 697 396 411 351 341Add: Depreciation 609 494 474 443 433Add: Amortization (b) 92 26 17 17 29EBITDA 2,906$ 1,897$ 1,818$ 1,731$ 1,767$
12 Months Ended
E B ITDA R E C ONCIL IAT IONS$ in millionsUnaudited
(a) Includes income tax expense of discontinued operation.
(b) Excludes the amortization of debt discount expense of $10 million, $10 million, $28 million, $39 million and $44 million for fiscal 2015, 2014, 2013, 2012 and 2011, respectively, as it is included in Interest expense.
EBITDA represents net income, net of interest, income tax and depreciation and amortization. We believe the presentation of this financial measure helps investors to assess our operating performance from period to period, including our ability to generate earnings sufficient to service our debt, and enhances understanding of our financial performance and highlights operational trends. This measure is widely used by investors and rating agencies in the valuation, comparison, rating and investment recommendations of companies; however, the measurement of EBITDA may not be comparable to those of other companies, which limits their usefulness as comparative measures. EBITDA is not a measure required by or calculated in accordance with generally accepted accounting principles (GAAP) and should not be considered as a substitute for net income or any other measure of financial performance reported in accordance with GAAP or as a measure of operating cash flow or liquidity. EBITDA is a useful tool for assessing, but is not a reliable indicator of, our ability to generate cash to service our debt obligations because certain of the items added to net income to determine EBITDA involve outlays of cash. As a result, actual cash available to service our debt obligations will be different from EBITDA. Investors should rely primarily on our GAAP results and use non-GAAP financial measures only supplementally in making investment decisions.

2015 2014
Reported sales 41,373$ 37,580$ Less: Interest income (750) -Add: Interest expense - (325)EBITDA 40,623$ 37,255$
Fiscal Year
S A LE S R E C ONCIL IAT IONS$ in millionsUnaudited
(a) The estimated impact of the additional week in fiscal 2015 was calculated by dividing unadjusted sales for the fourth quarter of fiscal 2015 by 14 weeks.
Adjusted sales is presented as a supplementary financial measurement in the evaluation of our business. We believe the presentation of adjusted sales helps investors assess our financial performance from period to period and enhances understanding of our financial performance; however, adjusted sales may not be comparable to those of other companies in our industry, which limits the usefulness as comparative measures. Adjusted sales is not a measure required by or calculated in accordance with GAAP and should not be considered as a substitute for any measure of financial performance reported in accordance with GAAP. Investors should rely primarily on our GAAP results and use non-GAAP financial measures only supplementally in making investment decisions.

A D JU STED S A LE S, A D JU STED OP E R ATING IN C OME (LOS S ) ,A D JU STED OP E R ATIN G MA R GIN R E C ONCIL IAT IONS$ in millionsUnaudited
Chicken Beef PorkPrepared
Foods OtherIntersegment
Sales TotalReported sales 11,390$ 17,236$ 5,262$ 7,822$ 879$ (1,216)$ 41,373$
Less: Estimated impact of additional week (a) (216) (315) (93) (143) (8) 25 (750)
Adjusted sales 11,174$ 16,921$ 5,169$ 7,679$ 871$ (1,191)$ 40,623$
Reported operating income (loss) 1,366$ (66)$ 380$ 588$ (99)$ -$ 2,169$
Add: China impairment - - - - 169 - 169Add: Merger and integration costs - - - 10 47 - 57Add: Prepared Foods network optimization charges - - - 59 - - 59Add: Denison plant closure - 12 - - - - 12Less: Insurance proceeds (net of costs) related to a legacy Hillshire Brands plant fire - - - (8) - - (8)Less: Gain on sale of the Mexico operation - - - - (161) - (161)Adjusted operating income prior to adjustment for additional week 1,366 (54) 380 649 (44) - 2,297Less: Estimated impact of additional week (b) (26) 1 (7) (13) 1 - (44)Adjusted operating income (loss) 1,340$ (53)$ 373$ 636$ (43)$ -$ 2,253$ Adjusted operating margin % 12.0% -0.3% 7.2% 8.3% n/a n/a 5.5%
(for the 12 months ended October 3, 2015)Adjusted Sales, Adjusted Operating Income (Loss) and Adjusted Operating Margin
(a) The estimated impact of the additional week in the 12 months of fiscal 2015 was calculated by dividing unadjusted sales for the fourth quarter of fiscal 2015 by 14 weeks.
(b) Impact of additional week was calculated by using the fourth quarter of fiscal 2015 adjusted operating income (prior to the additional week impact) divided by 14 weeks.
Adjusted sales, adjusted operating income and adjusted operating margin are presented as supplementary financial measurements in the evaluation of our business. We believe the presentation of adjusted sales, adjusted operating income and adjusted operating margin helps investors assess our financial performance from period to period and enhances understanding of our financial performance; however, adjusted sales, adjusted operating income and adjusted operating margin may not be comparable to those of other companies in our industry, which limits the usefulness as comparative measures. Adjusted sales, adjusted operating income and adjusted operating margin are not measures required by or calculated in accordance with GAAP and should not be considered as substitutes for any measures of financial performance reported in accordance with GAAP. Investors should rely primarily on our GAAP results and use non-GAAP financial measures only supplementally in making investment decisions.