consulting expenditure in public administration · source: estimates on data base “operazione...
TRANSCRIPT
Consulting Expenditure
in Public Administration
Giovanni Colucci
Public Sector Coordinator
Rome, 20 June 2013
Rome, 20 June 2013
Consulting Expenditure in Public Administration
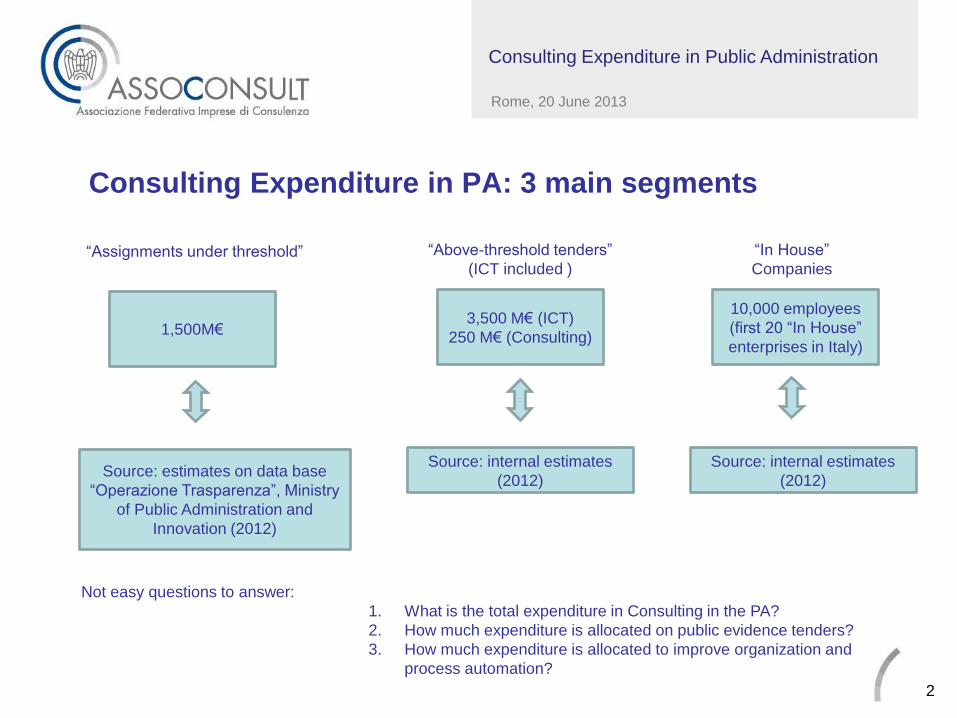
Consulting Expenditure in PA: 3 main segments
“Above-threshold tenders”
(ICT included )
“In House”
Companies
“Assignments under threshold”
3,500 M€ (ICT)
250 M€ (Consulting)
10,000 employees
(first 20 “In House”
enterprises in Italy) 1,500M€
Source: internal estimates
(2012)
Source: internal estimates
(2012) Source: estimates on data base
“Operazione Trasparenza”, Ministry
of Public Administration and
Innovation (2012)
Not easy questions to answer:
1. What is the total expenditure in Consulting in the PA?
2. How much expenditure is allocated on public evidence tenders?
3. How much expenditure is allocated to improve organization and
process automation?
2

Rome, 20 June 2013
Consulting Expenditure in Public Administration
Period: Year 2010 Year 2011
Total amounts € 1,238,561,127 € 689,643,008
“Active” assignments 363,937 209,995
Beneficiaries
(individuals and enterprises) 205,039 133,361
Type of represented information: Assignments by national and local Public Administration to consultants
Data sources:
Estimates of Assoconsult on database “Operazione Trasparenza”, Department of Public
Administration and Innovation (2011).
http://www.innovazionepa.gov.it/lazione-del-ministro/operazione-
trasparenza/presentazione.aspx
Assignments as from “Operazione Trasparenza” (source: Department of Public Administration and Innovation)
3

Rome, 20 June 2013
Consulting Expenditure in Public Administration
Mandates assigned to individuals (2010 and 2011) count around 85% in value of the total expenditure
Assignments as from “Operazione Trasparenza”
Individuals vs Enterprises – Total Amount
€/Mln 583
84.6%
€/Mln 106
15.4%
Values in €/Mln
689
Total in €/Mln
Values in €/Mln
1,238
Total in €/Mln
€/Mln 1,049
84.7%
€/Mln 189
15.3%
Year 2010 Year 2011
4
Individuals Enterprises Individuals Enterprises
Rome, 20 June 2013
Consulting Expenditure in Public Administration
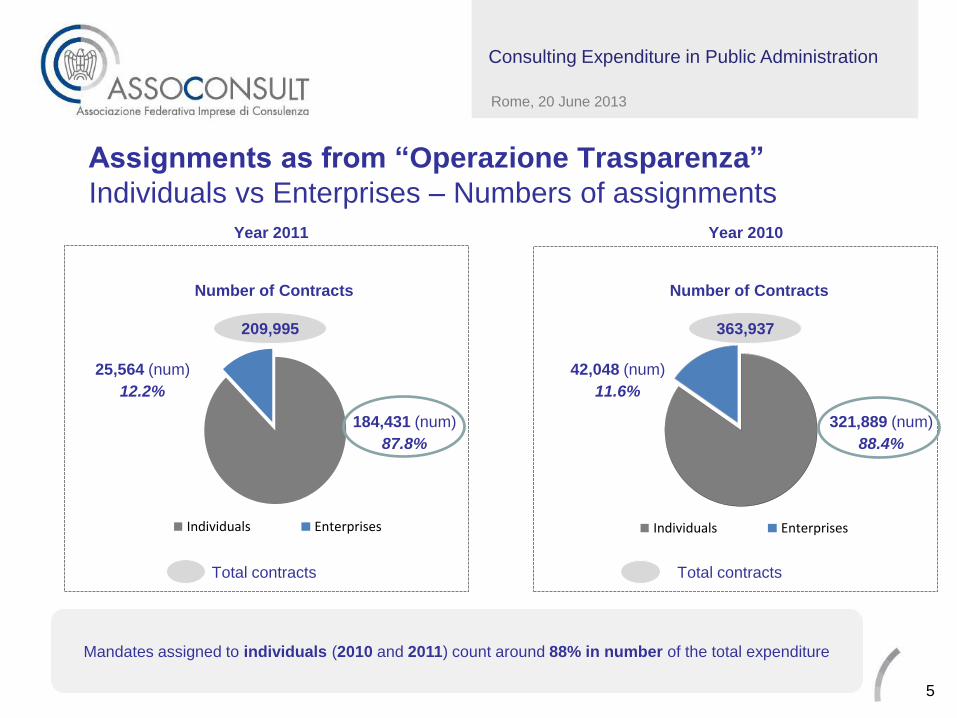
Assignments as from “Operazione Trasparenza”
Individuals vs Enterprises – Numbers of assignments
Mandates assigned to individuals (2010 and 2011) count around 88% in number of the total expenditure
Persone fisiche Società
184,431 (num)
87.8%
25,564 (num)
12.2%
Number of Contracts
209,995
Total contracts
Number of Contracts
363,937
321,889 (num)
88.4%
42,048 (num)
11.6%
Total contracts
Year 2010 Year 2011
5
Individuals Enterprises Individuals Enterprises
Rome, 20 June 2013
Consulting Expenditure in Public Administration
189
322
547618 646 662 690
0
100
200
300
400
500
600
700
800
<5 <10 <25 <50 <100 <500 Totale
€M
ln
Soglie importi erogati (valori €/000)
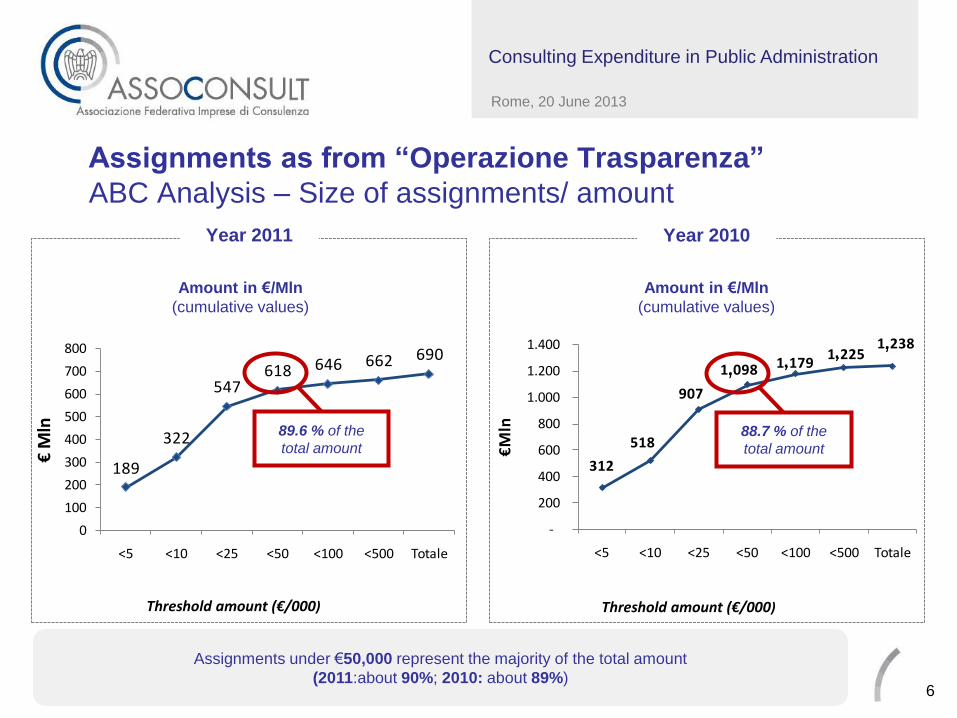
Amount in €/Mln
(cumulative values)
89.6 % of the
total amount
Assignments as from “Operazione Trasparenza”
ABC Analysis – Size of assignments/ amount
Assignments under €50,000 represent the majority of the total amount
(2011:about 90%; 2010: about 89%)
Amount in €/Mln
(cumulative values)
312
518
907
1.098 1.179 1.225
1.238
-
200
400
600
800
1.000
1.200
1.400
<5 <10 <25 <50 <100 <500 Totale
€M
ln
Soglie importi erogati (€/000)
88.7 % of the
total amount
Year 2010 Year 2011
312
518
907
1.098 1.179 1.225
1.238
-
200
400
600
800
1.000
1.200
1.400
<5 <10 <25 <50 <100 <500 Totale
€M
ln
Soglie importi erogati (€/000)
88,7 % del totale
importo erogato
312
518
907
1.098 1.179 1.225
1.238
-
200
400
600
800
1.000
1.200
1.400
<5 <10 <25 <50 <100 <500 Totale
€M
ln
Soglie importi erogati (€/000)
88,7 % del totale
importo erogato
6
Threshold amount (€/000) Threshold amount (€/000)
, , , ,

Rome, 20 June 2013
Consulting Expenditure in Public Administration
Assignments as from “Operazione Trasparenza”
ABC Analysis – Size of assignments/ numbers
Assignments under €5,000 are the main way to engage consultants
302.254
29.247 25.204
5.680 1.246 290 16 -
50.000
100.000
150.000
200.000
250.000
300.000
350.000
<5 5-10 10-25 25-50 50-100 100-500 >500N
umIntervalli importi erogati (valori in €/000)
N° of Contracts
173.411
18.944 14.950
2.161 430 93 6 -
50.000
100.000
150.000
200.000
<5 5-10 10-25 25-50 50-100 100-500 >500
Num
Intervalli importi erogati (valori €/000)
N° of Contracts
Year 2010 Year 2011
173.411
18.944 14.950
2.161 430 93 6 -
50.000
100.000
150.000
200.000
<5 5-10 10-25 25-50 50-100 100-500 >500
Num
Intervalli importi erogati (valori €/000)
173.411
18.944 14.950
2.161 430 93 6 -
50.000
100.000
150.000
200.000
<5 5-10 10-25 25-50 50-100 100-500 >500
Num
Intervalli importi erogati (valori €/000)
7
Threshold amount (value €/000) Threshold amount (value €/000)
,
, ,
,
,
, , , ,

Rome, 20 June 2013
Consulting Expenditure in Public Administration
Assignments as from “Operazione Trasparenza”
Analysis of Expenditure – Type of Consultancy
80.7% of the assignments refers to health-medical services, technical consultancy,
teaching and training, design/engineering/maintenance consultancy,
study & research activities, legal advice and assistance
17.8% 14.0% 12.9% 11.6% 5.3% 3.9% 3.8% 2.6% 1.8% 1.2% 1.0% 5.0% 19.1%
% on total amount
294260
233
200 195
83
49 48 4730 23
73
24
81%
96%
73%
88% 88%
80%87% 85%
78%
87%95%
85%80%
92%
0%
20%
40%
60%
80%
100%
0
50
100
150
200
250
300
350
400
%
€/M
ln
Importo erogato in €/Mln
Incidenza % Persone fisiche su totale soggetti incaricati
139
123
114
80 78
33
24 24 16
11 8 7
32
92%95%
81%77%
94%
78%
89%
84% 86%
94%
67%
97%
85%
0%
20%
40%
60%
80%
100%
-
20
40
60
80
100
120
140
160
%
€/M
ln
%
131
123
96 89
80
37
27 26 18
12 9 7
34
95%
81%
94%
77%
94%
77%
89%84% 85%
94%
67%
97%
84%
0%
20%
40%
60%
80%
100%
-
20
40
60
80
100
120
140
80.7% of mandates in value
8
Amount in €/Mln
% Individuals vs enterprises

Rome, 20 June 2013
Consulting Expenditure in Public Administration
The analysis refers to calls for tenders published by the Public Administration (Central Public Administration and Local
Public Administration) in 2011 and 2012
Note:
─ Monitoring on public tenders at national level has been recently established by AVCP
─ All Public Administrations must cooperate with AVCP by transferring all the relevant infos
─ Cat. 11 refers to consulting services
─ Cat. 7 refers to ICT services as the main object even if it includes some consulting services
9
Market analysis on tenders (source: estimates from AVCP - Authority for the Supervision of Public Contracts)

Rome, 20 June 2013
Consulting Expenditure in Public Administration
10
Market analysis on tenders
Trend 2011-2012
Amount Average amount
4.876.260
440.171
5.316.431
3.964.728
285.161
4.249.889
- 19%
- 35%
- 20%
- 40%
- 35%
- 30%
- 25%
- 20%
- 15%
- 10%
- 5%
0%
-
1.000.000
2.000.000
3.000.000
4.000.000
5.000.000
6.000.000
Cat. 7 Cat. 11 Total
To
tal am
ount (
K/e
uro
)
2011 2012 Delta
724
400
678 694
322
644 - 4%
- 19%
- 5%
- 25%
- 20%
- 15%
- 10%
- 5%
0%
-
100
200
300
400
500
600
700
800
Cat. 7 Cat. 11 Average amount
Avera
ge a
mount (
K/e
uro
)
2011 2012 Delta
Both ICT and Consulting markets experienced a strong decrease in volume from 2011 to 2012
(around 20% for ICT; 35% for Consulting)
Contracts > 40k Euro

Rome, 20 June 2013
Consulting Expenditure in Public Administration
Market analysis on tenders
Trend 2011-2012 – Size of tenders for Cat. 7 (ICT)
Amount
2011 2012 Delta
445.227 303.795 262.680
800.137 941.585
2.122.836
385.318 260.999 225.443
694.572 821.582
1.576.814
- 13% - 14% - 14% -13% -13%
-26%
- 30%
- 25%
- 20%
- 15%
- 10%
- 5%
0%
-
500.000
1.000.000
1.500.000
2.000.000
2.500.000
To
tal am
ount (K
/euro
)
>= 40.000 <
200.000
>= 200.000 <
500.000 >= 500.000 <
1.000.000
>= 1.000.000 <
5.000.000
>= 5.000.000 <
20.000.000
>= 20.000.000
11
Relevant decrease can be seen in all ICT tenders in every range of amount

Rome, 20 June 2013
Consulting Expenditure in Public Administration
Market analysis on tenders
Trend 2011-2012 – Size of tenders for Cat. 11 (Consulting)
12
Tenders in the small-medium range (between 200kE and 1ME) experienced a strong reduction.
Also tenders above 1ME count relevant decrease in the total amount (-43%, -120 MEuro)
Amount
2011 2012 Delta
76.104
40.974 35.669
115.902
75.597
95.925
61.103
38.531
20.987
117.481
26.859 20.200
- 20% - 6%
- 41%
1%
- 64%
- 79%
- 90%
- 80%
- 70%
- 60%
- 50%
- 40%
- 30%
- 20%
- 10%
0%
10%
-
20.000
40.000
60.000
80.000
100.000
120.000
140.000
To
tal am
ount (K
/euro
)
>= 40.000 <
200.000
>= 200.000 <
500.000 >= 500.000 <
1.000.000
>= 1.000.000 <
5.000.000
>= 5.000.000 <
20.000.000
>= 20.000.000

Rome, 20 June 2013
Consulting Expenditure in Public Administration
Market analysis on tenders
Trend 2011-2012 – Type of contracting authority (cat. 7 and 11)
13
Some subsectors are stable (utilities, local gov.), some others are suffering strong reduction (central
administration, healthcare, public companies, central procurement agencies, welfare entity, …)
1.109.828
321.219 447.978
693.753
616.133
68.285
565.287
41.576
524.401
67.019 146.369
615.297
99.287
1.084.590
270.599
487.433
676.107
463.624
52.714
225.325 303.772
243.804
74.407 8.239
244.053 115.223
- 2%
- 16%
9%
- 3%
- 25%
- 23%
- 60%
631%
- 54%
11%
- 94%
- 60%
16%
- 200%
- 100%
0%
100%
200%
300%
400%
500%
600%
700%
-
200.000
400.000
600.000
800.000
1.000.000
1.200.000
To
tal am
ount (K
/euro
)
UTILITIES HEALTH-CARE
REGION /MUNICIPALITY PROVINCE…
MUNICIP./ REGIONAL/ IN HOUSE COMPANY
CENTRAL ADMINISTRAT.
EDUCATION/ RESEARCH...
PUBLIC COMPANY
TRANSPOR TATION
CENTRAL PROCUREMENT
AGENCY
TELEC. AGRICOLT. ENTITY
WELFARE ENTITY
OTHERS
2011
2012
Delta
Amount
Rome, 20 June 2013
Consulting Expenditure in Public Administration
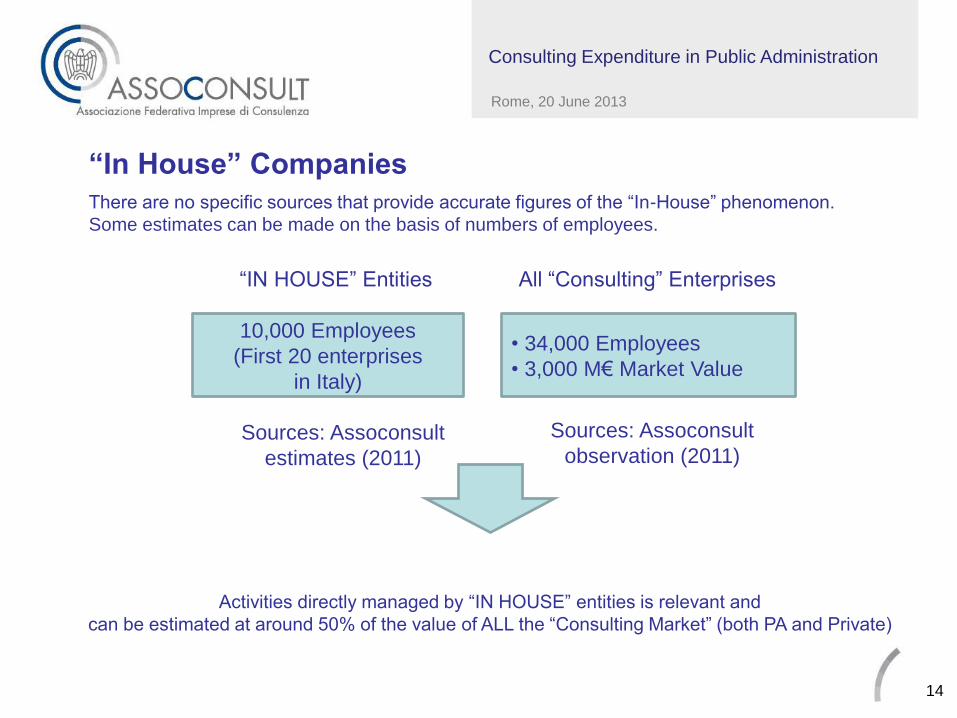
“In House” Companies
There are no specific sources that provide accurate figures of the “In-House” phenomenon.
Some estimates can be made on the basis of numbers of employees.
“IN HOUSE” Entities All “Consulting” Enterprises
10,000 Employees
(First 20 enterprises
in Italy)
• 34,000 Employees
• 3,000 M€ Market Value
Sources: Assoconsult
estimates (2011)
Sources: Assoconsult
observation (2011)
Activities directly managed by “IN HOUSE” entities is relevant and
can be estimated at around 50% of the value of ALL the “Consulting Market” (both PA and Private)
14

Rome, 20 June 2013
Consulting Expenditure in Public Administration
Final remarks
1. At a glance: the public demand is rapidly decreasing due to the spending review
2. A key issue is about reputation of “consulting” services
3. There is an issue on quality of spending (spending too fragmented, consultancy fees even more
lower, poor result-based initiative, etc.)
4. There is still a very large quota of demand (“IN HOUSE” and assignments under threshold) not
expressed through public tenders
5. Rates are experimenting an even stronger competition due to the large offer at disposal
6. To boost the public demand (together with new ideas and innovative projects) European
Commission structural funds could represent an opportunity
15

Rome, 20 June 2013
Consulting Expenditure in Public Administration
Trend 2007-2011
Tender amount (Mln €) Year
Service Category 2007 2008 2009 2010 2011 Gross total
ICT Services 1,432.29 591.11 641.63 537.57 299.16 3,501.76
Consulting 104.09 316.03 390.83 260.47 119.19 1,190.62
Advertising Services 237.13 67.81 108.00 110.82 174.45 698.22
Training 51.13 19.04 20.15 18.69 60.95 169.97
Architecture & Engineering 7.51 14.88 2.30 4.02 0.00 28.72
Gross Total 1,832.16 1,008.87 1,162.92 931.58 653.75 5,589.28
Tender Amount (Mln €) Year
Category 11 - Consulting 2007 2008 2009 2010 2011 Gross Total
Technical Assistance 32.99 234.92 191.61 128.26 55.68 643.46
Management Consulting 64.07 68.98 131.19 118.66 61.55 444.45
Other 7.03 12.13 68.03 13.56 1.95 102.71
Total 104.09 316.03 390.83 260.47 119.19 1,190.62
16

Rome, 20 June 2013
Consulting Expenditure in Public Administration
Index Chart: Consulting Market Trend (Year 2009=100)
17
140.00%
120.00%
100.00%
80.00%
60.00%
40.00%
20.00%
0.00%
Technical assistance
Management consulting
Other
Total