construction validation national survey on recreation ... · pdf file6556; email:...
TRANSCRIPT
Construction and Validation of the National Survey on Recreation and the Environment's Lifestyles Scale
Gary T. Green Warnell School of Forestry and Natural Resources
University of Georgia H. Ken Cordell Carter J. B ~ Q
USDA Forest Service Southern Research Station
Christine DiStefano University of South Carolina
This study sought to cons~uct and validate a lifestyle scale that would capture for Ieisure professionals a more holistic picture of people's interests. A broader profile of their customen would allow recreation professionals to tailor infor- mation of their services. Public sector recreation manaeers could orovide better services by learning about how customers spend their lgisure timi With general lifestyle information, public sector recreation managers may better identify what services they should be providing or expanding. this k ~ . ~ d ~ . 36 items were identified that capture people's major activities. Replicated exploratory factor analyses across these items showed them grouping under nine hctors. These factors could help recreation managers gain a deeper understanding of how people's lifestyles relate to their choice of recreation and leisure activities.
Introduction
Wherever there is a need to design more effective outreach, commu- nication, education, marketing, advertising or sales strategies, lifestyle infor- mation can be helpful. Lifestyle scales, if well designed and executed, identify activities that reflect activities of borh necessity and activities of leisure (Hor- ley, 1992; Peter & Olson, 1994; Veal, 1993; Vyncke, 2002). Because they cap ture both necessities and "niceties," lifestyle scales used in designing contact or delivery strategies are more likely to be successful (Vyncke). This is e pecially true when the information provided, about the services and pro- grams being offered, is targeted to match people's routine activities, interests, and needs (Gobster, 2002).Within the recreation and leisure field, people's activities and interests started to be examined in earnest in the late 1970's under the mantle of "specialization" (Bryan, 2000). Since that time research into specialization (and lifestyles) has broadened from looking at differences
&klre-~ correspondence to: Dr. Gary T. Green. University of Georgia. Warnell School oCForesUy and Namral. b u r c e s , RM 4145, D.W. B r m b Drive, Athens, CA 30605, Phone: (706) 542- 6556; Email: [email protected].
514 GREEN, CORDELL. BET2 AND DISTFXANO
within a specific group (e.g., bird-watchers, immigrants, mamed couples, golfers) (Bryan; Kalmijn & Bemasco, 2001; Pemck, Backman. Bixler, & Nor- man, 2001; Scott & Thigpen, 2003; Stodolska, 2000) to diierences between specific groups (e.g., Af;-can-~merican versus Latino urban park wen, skiers versus snowboiirders, blind versus low vision or sighted youths) (Gobster, 2002; Vaske, Carothers, Donnelly, & Baird, 2000; Wolffe & Sacks, 1997).
Today, as recreation and leisure service providers become increasingly more competitive over existing and potential customers, research that helps to identify different lifestyles within and between specific group continues to grow in its complexity and scope (McChesney, 1997). For instance, where earlier research mostly focused on differentiating groups by their recrea- tional activities, setting preferences and demographic information, today's research now includes other more salient lifatyle information such as peo- ple's interests, attitudes, and opinions (Moore & Driver, 2005; Pemck, 2002). Similarly, earlier research that also looked at larger general populations often focused on people's recreational activities, their preferences, and standard Census demographic characteristics (Cordell, Betz, Green, Mou, Leeworthy, Wiley, et al., 2004; Cushman, Veal & Zuzanek. 2005; Morgan & Levy. 2002; PenningtonGray, Fridgen & Stynes, 2003). Although this type of research was often significant and helpful (Cordell, Bern.. Bowker, English, Johnson. Mou, et al., 1999), the usefulness of this information by recreational profes- sionals in predicting people's choices and nee& was somewhat limited as it did not include other salient 'lifestylen facton (Moore & Driver, 2005; Mur- dock, Backman, Hoque, & Ellis, 1991). However, as some recent studies have shown, by adding more diverse lifestyle information, recreational profession- als are able to better tailor their programs to the needs, wants and demands of their customers (Gilbert & Warren, 1995; Vyncke, 2002).
Knowing more about people's lifestyles, in addition to describing them across an army of socio-demographic factors, increases the capability of rec- reation and leisure professionals to focus their recreation. park, education, and related leisure programs to an increasingly diverse American public. This information also benefits private product manufacturers, wholesaiers, retail- ers and service deliverers by better describing their customers and by iden- tdjing better pathways for advertising (Francese, 1996; Gilbert & Warren, 1995; Morgan & Levy, 2002: Rice, 1988).
Subsequently, the aim of this study was to add to the present body of knowledge by constructing and validating a lifestyle scale that would help recreation and leisure professionals better design, inform, and deliver their programs and services to their customers. The term lifestyle has been defined as "the distinctive behavioral expression of a characteristic pattern of values and beliefs" (Horley, p. 206, 1992) and as 'the distinctive pattern of personal and social behavior characteristics of an individual or a group" (Veal, p. 247, 1993). It has been suggested that an acceptable definition of lifestyle should also incorporate "intentional behavior or purposive activity" (Hodey, p. 206). With this in mind, the term lifestyle was operationalized as a broadly defined pattern of intentional behaviors, both personal and social, as represented by a set of purposeful activities.
THE LIFESTYLE SCALE 515
Therefore, this study sought to capture a holistic picture of the general public's hobbies, interests, recreational and cultural activities, and work, or in other words their "lifestyle" (Gladwell, 1990, Reimer, 1995; Stockdale, Wells, & Rall, 1996; Stodolska, 2000; Veal, 1993). Subsequently, an original lifestyle scale was conceptualized, reduced, and pretested for use within the National Survey on Recreation and the Environment (NSRE) (Cordell, Green, Leeworthy, Stephens, Fly, & Betz, 2005; Veal, 1993). Data from the NSRE was then used to test the construction and validity of the lifestyle scale.
Past Research
Early recreation and leisure lifestyle or activity preference research has tended to focus on people's choices of recreational activities and how these choices correlated to sociodemographic characteristics, e.g., race, gender, age, income (Veal, 1993). For example, in regard to race, considerable re- search has established that different proportions of whites, African Ameri- cans, Hispanics and other races chose different recreational activities (Cor- dell et al., 1999; Dwyer & Hutchinson, 1990; Floyd & Shinew, 1999: McDonald & McAvoy, 1997; Phillip, 1995). Other research has examined how recreational and leisure activity preferences differ within the same racial group (Floyd, Gramann, & Saenz, 1993; Floyd, Shinew, McGuire, & Noe, 1994; Outley, Floyd, & Shinew, 1997; Shinew, Floyd, McGuire. & Noe, 1995, 1996; Woodard, 1988). Research regarding gender and preference of rec- reational activities has found that both between (firestone & Shelton, 1994; Henderson, 1994; Shaw 1994) and within (Dattilo, Dattilo, Sarndahi, & Klei- ber, 1994; Hanington & Dawson, 1995; Hendenon, 1996, Cutler Riddick & Stewart, 1994) gender groups, significant differences exist in activity prefer- ence and participation rates. In a similar vein, researchers have also explored the effects that age, level of education, and level of income have on prefer- ence for recreational- activities (Cordell et al., 1999; bAhola, Jackson, Sc Dunn, 1994; Lawton, 1994; Shinew et al., 1996).
One area of research that relates closely to lifestyles and that has also received considerable attention is that of recreational specialization (Bryan, 2000, Kuentzel & McDonald, 1992; Scott & Shafer, 2001). However, while the specidization concept has demonstrated i s utility as a typology for un- derstanding levels of involvement within and between particular recreation groups (e.g., anglers, boaters, skiers), more research is needed to improve a framework for understanding participant differences and how these differ- ences tie more directly to an individual's lifestyle (Bryan, 2000, Fedler, 2000).
Until fairly recentiy, only a few studies actually explored activities beyond recreation which were " l i ty len oriented, such as going to church, playing with children or grandchildren, drinking wine, visiting a theater, gardening, eating out (Morgan & Levy, 2002; Reimer, 1995; Veal, 199.3; Vyncke, 2002). Yet, these studies were often used as a basis upon which to draw implications about the liestyles of different groups. However, recreation participation and demographic data alone do not allow the richness and depth needed to provide comprehensive descriptions of overall lifestyle patterns, or for mar-
k
516 GREEN, CORDELL, BETZ AND DISTEFANO
ket segmentation (Morgan & Levy, 2002; Vyncke). Growing consensus no indicates that recreational pursuits or lifestyles should be characterized I the "full range of day to day activities" (Veal. 1993, p. 241). Few would argt that activities related to personal consumption (e.g., home cooking, dinin out), leisure (e.g., reading, playing sports, going to the theater), domest practices (e.g., home maintenance, playing with children, shopping), or pa work (e.g., commuting to work, using the internet) do not influence an shape lifestyles or choice of recreational pursuits.
Of the recreation and leisure lifestyles studies that have been publishi (Allison & Geiger. 199% Floyd & Shinew, 1999, Furlong, Campbell, & Ro erts, 1990; Hawkins & Freeman, 1993; Iso-Ahola et al., 1994; Scott & Willi~ 1998; Stodolska, 2000) only a few come close to research that approximat the activity, interest, and opinion (AIO) or lifestyle research prevalent in tl marketing literature (Vyncke, 2002). One of the early authors involved "lifestyles" research was Demby (1974), who coined the term psychographic Demby felt that adding social and behavioral data to purely demograph data was akin to putting flesh on bones, and that it would result in mui stronger marketing strategies through a deeper understanding of peop (Vyncke, 2002). Unfortunately, in earlier studies the social or behavioral da were often drawn purely from personality tests, which were developed clinical (i.e., for medical diagnostics) or academic (i.e., based on stude populations) environments (Gunter & Furnham, 1992). Results of these stu ies were often plagued with inconsistent findings and low correlations (Gu ter & Furnham, 1992).
In later studies, personality data were replaced with 'lifestyle" data. Lid style data often employed sets of A10 (e.g.. activities, interests, and opinion items or scales (Peter & Olson, 1994). Studies concerning people's activiti (e.g., work, hobbies, social events, vacation, & community), interests (e.1 family, recreation, food, media. & home) and opinions (e-g., education, ci ture, social issues, & business) often involved as many as 250-300 items (Vy cke. 2002). Other studies also used values, attitudes, and lifestyle scales their research (VALS) (Reece, 1989; Shih, 1986). These studies typically ul ized 300 or more items (Veal, 1993). Although studies using the A10 or VAI approaches have produced insightful and meaningful data, the large batte of items were diicult to use as they required extensive surveying, analy and resources (Veal, 1993; Vyncke 2002).
Mitchell (1984) introduced a more efficient instrument to measure Ih styles containing only 55 items. But this instrument included only items pc raining to people's values (Horley, Carroll, & Little, 1988). Wlth this in min Little (1983) and Horley et al. (1988) sought to study lifestyles through tl use of the Personal Project Matrix (PPM), which incorporated aspects people's attitudes and behaviors. The PPM asked respondents to list persor projects, normally about ten, that they were currently engaged in, and thl
THE LIFEStYLE SCALE 517
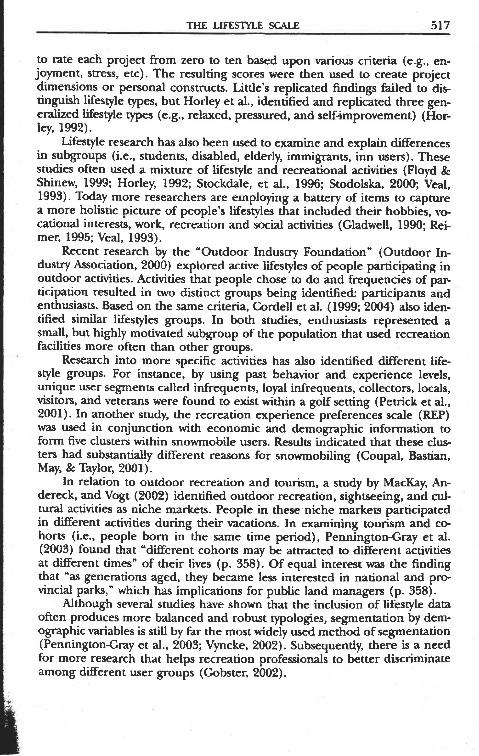
to rate each project from zero to ten based upon various criteria (e.g., en- joyment, stress. etc). The resulting scores were then used to create project dimensions or personal constructs. Little's replicated findings failed to dis tinguish lifestyle types, but Horley et al., identified and replicated three gem eralized lifestyle types (e-g., relaxed, pressured, and selfimprovement) (Hor- ley, 1992).
Lifestyle research has also been used to examine and explain differences in subgroups (i.e., students, disabled, elderly, immigrants, inn users). These studies often used a mixture of lifestyle and recreational activities (Floyd & Shinew. 1999; Horley, 1992; Stockdale, et al., 1996; Stodolska, 2000; Veal, 1993). Today more researchers are employing a battery of items to capture a more holistic picture of people's lifestyles that included their hobbies. \*e cational interests, work. recreation and social activities (Gladwell, 1990; Rei- mer. 1995; Veal, 1993).
Recent research by the "Outdoor Industry Foundation" (Outdoor In- dustry Association, 2000) explored active lifestyles of people participating in outdoor activities. Activities that people chose to do and frequencies of par- ticipation resulted in two distinct groups being identified. participants and enthusiasts. Based on the same criteria, Cordell et al. (1999; 2004) also iden- tified similar lifestyles groups. In both studies, enthusiasts represented a small, but highly motivated subgroup of the population that used recreation . .
facilities more often than other Research into more specific activities has also identified different life-
style groups. For instance, by using past behavior and experience levels, unique user segments called infrequents, loyal infrequents, collectors, locals, visitors, and veterans were found to exist within a golf setting (Petrick et al., 2001). In another study, the recreation experience preferences scale (REP) was used in conjunction with economic and demographic information to form five clusters within snowmobile users. Results indicated that these clus- ters had substantially different reasons for snowmobiling (Coupal, Bastian, May, & Taylor, 2001).
In relation to outdoor recreation and tourism, a study by MacKay, An- dereck, and Vogt (2002) identified outdoor recreation, sightseeing, and cul- tural activities as niche markets. People in these niche markets participated in different activities during their vacations. In examining tourism and co- horts (i.e., people born in the same time period), Pennington-Gray et al. (2003) found that "different cohorts may be attracted to different activities at diierent times" of their lives (p. 358). Of equal interest was the finding that "as generations aged, they became less interested in national and pro- vincial parks," which has implications for public land managers (p. 358).
Although several studies have shown that the inclusion of lifestyle data often produces more balanced and robust typologies, segmentation by dem- ographic variables is still by far the most widely used method of segmentation (PenningtonCray et al., 2003; Vyncke, 2002). Subsequently, there is a need for more research that helps recreation professionals to better discriminate among different user groups (Gobster, 2002).
518 GREEN. CORDEU, BET2 AND DISTEFANO
Me thodology
The st*
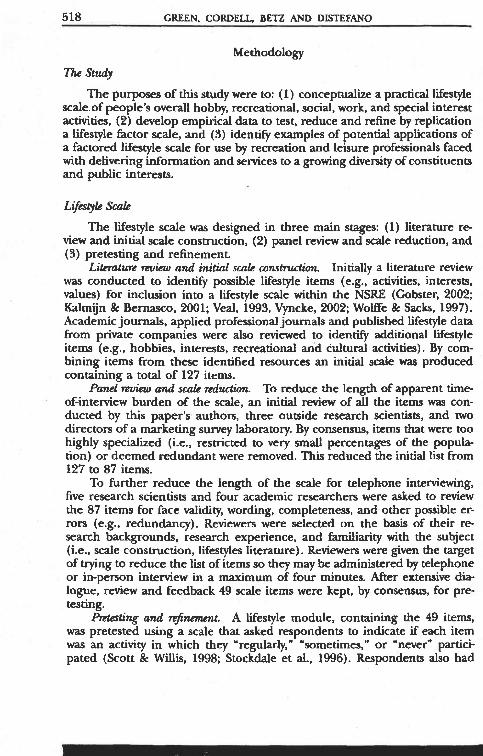
The purposes of hiis study were to: ( I ) conceptualize a pmctical lifestyle scale.of people's overall hobby, recreational, social, work, and special interest activities, (2) develop empirical data to test, reduce and refine by replication a lifestyle factor scale, and (3) identify examples of potential applications of a factored lifestyle scale for use by recreation and le~sure professionals faced with delivering information and services to a growing diversity of constituents and public interests.
The lifestyle scale was designed in three main stages: (1) literature re- view and initial scale construction, (2) panel review and solie reduction, and (3) pretesting and refinement.
Litemtu~c rruiecrr and indial scale mnshuctim. Initially a literature review was conducted to identify possible lifestyle items (e.g., activities, interests. values) for inclusion into a lifestyle scale within the NSRE (Cobster. 2002; Kalmijn 8c Bernasco, 2001; Veal, 1993, Vyncke, 2002; Wolffe & Sacks, 1997). Academic journals, applied professional journals and published lifestyle data from private companies were also reviewed to identify additional lifestyle items (e.g., hobbies, interests, recreational and cultural activities). By com- bining items from these identified resources an initial scale was produced containing a total of 127 items.
Panel teuinu and scab reduction. To reduce the length of apparent time of-interview burden of the scale, an initial review of all the items was con- ducted by this paper's authors, three outside research scientists, and two directors of a marketing survey laboratory. By consensus, items that were too highly specialized (i.e., restricted to very small percentages of the popuiit- tion) or deemed redundant were removed. This reduced the initial list from 127 to 87 items.
To further reduce the length of the scale for telephone interviewing, five research scientists and four academic researchers were asked to review the 87 items for face validity, wording, completeness, and other possible er- rors (e.g., redundancy). Reviewers were selected on the basis of their r e search backgrounds, research experience, and familiarity with the subject (i.e., scale construction, lifestyles literature). Reviewers were given the target of trying to reduce the list of items so they may be administered by telephone or in-person interview in a maximum of four minutes. After extensive dia- logue, review and feedback 49 scale items were kept, by consensus, for pre- testing.
Retesting a d n$nm.mr. A lifestyle module, containing the 49 items, was pretested using a scale that asked respondents to indicate if each item was an activity in which they "regularly," 'sometimes," or 'never" partici- pated (Scott & Willis, 1998; Stockdale et al.. 1996). Respondents also had
THE LIFESIYLE SCALE 519
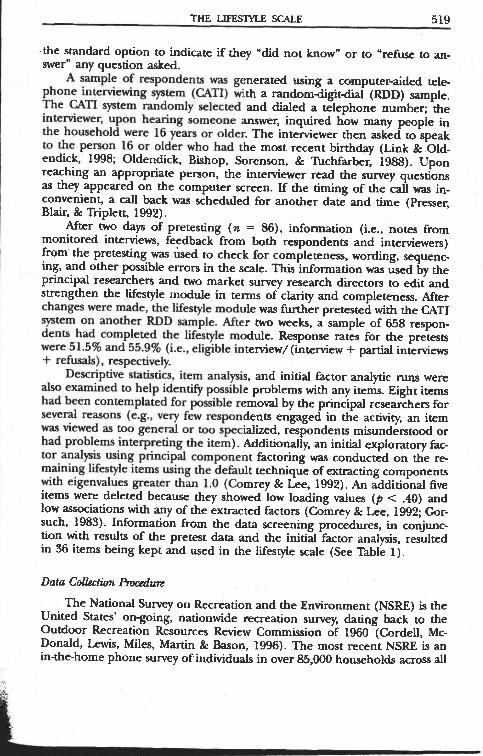
.the standard option to indicate if they "did not knoww or to 'refuse to an- swer" any question asked.
A sample of respondents was generated using a computer-aided tele- phone intenriewing system (CATI) with a randomdigitdial (RDD) sample. The CATI system randomly selected and dialed a telephone number; the interviewer, upon hearing someone answer, inquired how many people in the household were 16 years or older. The interviewer then asked to speak to the person 16 or older who had the most recent birthday (Link & Old- endick, 1998; Oldendick, Bishop, Sorenson, & Tbchfarber, 1988). Upon reaching an appropriate person, the interviewer read the survey questions as they appeared on the computer screen. If the timing of the call was in- convenient, a call back was scheduled for another date and time (Presser, Blair, & Triplett, 1992).
After two days of pretesting ( n = 86), information (i.e., notes from monitored interviews, feedbackfrom both respondents and interviewers) from the pretesting was used to check for completeness, wording, sequenc- ing, and other possible errors in the scale. This information was used by the principal researchers and two market survey research directors to edit and strengthen the lifestyle module in terms of clarity and completeness. After changes were made, the lifestyle module was further pretested with the CAT1 system on another RDD sample. After two weeks, a sample of 658 respon- dents had completed the lifestyle module. Response rates for the pretests were 51.5% and 55.9% (i.e., eligible interview/(interview + partial interviews + refusals), respectively.
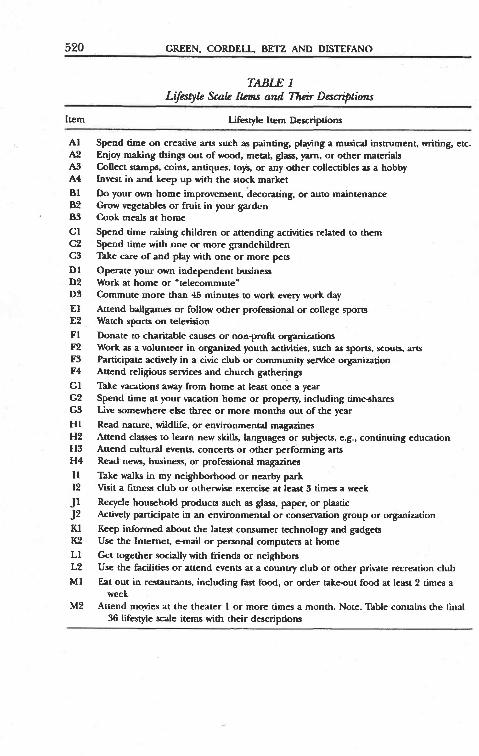
Descriptive statistics, item analysis, and initial factor analytic runs were also examined to help identify possible problems with any items. Eight items had been contemplated for possible removal by the principal researchers for several reasons (e.g., very few respondents engaged in the activity, an item was viewed as too general or too specialized, respondents misunderstood or had problems interpreting the item). Additionally, an initial exploratory hc- tor analysis using principal component factoring was conducted on the re- maining lifestyle items using the default technique of extracting components with eigenvalues greater than 1.0 (Comrey & Lee, 1992). An additional five items were deleted because they showed low loading values ( p C .40) and low associations with any of the extracted factors (Comrey & Lee, 1992; Gor- such, 1983). Information from the data screening procedures, in conjunc- tion with results of the pretest data and the initial factor analysis, resulted in 36 items being kept and used in the lifestyle scale (See Table I).
Data Cdkdkm h w d 2 6 7 ~
The National Su~vey on Recreation and the Environment (NSRE) is the United States' ongoing, nationwide recreation survey, dating back to the Outdoor Recreation Resources Review Commission of 1960 (Cordell, MC- Donald, Lewis, Miles, Martin & Bason, 1996). The most recent NSRE is an in-the-home phone survey of. individuals in over 85,000 households across all
520 GREEN, CORDELL, BEIZ AND DISTEFANO
TtLBLE 1 Lifstyk Scak Items and Their Desniptiorrc
Item
- ~p
Lifestyle Item Descriptions
Spend time on creative arts such as painting, playing a musical imuument, writing, etc. Enjoy making things out of wood, metal, glasc, yarn. or other materials Collect stamps. coins, antiques, toys or any other dlectibles as a hobby Invest in and keep up with the stock market
Do your own home improvement, decorating, or auto maintenance Grow vegetables or fruit in your garden Cook meah at home Spend time raii~ng children or attending acrivities related to hem Spend time with one or more grandchild~n Take care of and play with one or more peu Operate your own independent business Work at home or 'telecommute" Commute more than 45 minutes to work every work day Attend ballgames or follow other professional or college sports Watch spow on television Donate to charitable causes or nonprofit or8anizauons Work as a volunuer in organized youth activities. such as spom. scouts. ans Participate actively in a civic club or communiry service organbadon Attend religious services and church gatherings
Take vacations away fmm home at Least once a year Spend time at your vacation home or property, including time-shares Live somewhere else three or more months out of the year Read nature, wildlife, or environmental magazines Attend classes to learn new skills, languages or subjects, e.g., continuing education Attend cultural events, concern or other performing a m Read news, business, or professional magazines Take walL in my neighborhood or nearby park Viit a fitness club or otherwise exercise at least 3 times a week
Recycle household products such as glass, paper, or plvtic Actively participate in an environmental or conservation group or organization Keep informed about the latest consumer technology and gadgets Use the Internet, e-mail or pemnal cornputen at home Get together socially with friends or neighbors Use the facilities or attend events at a counuy club or other pmate recreation club
Eat out in resraurants, including fast food, or order take-out food at least 2 times a week
Attend movies at the theater 1 or more times a month. Note. Table contains the Rnal 36 lifestyle s d e items with their descriptions
THE LEESTYLE SCALE 521
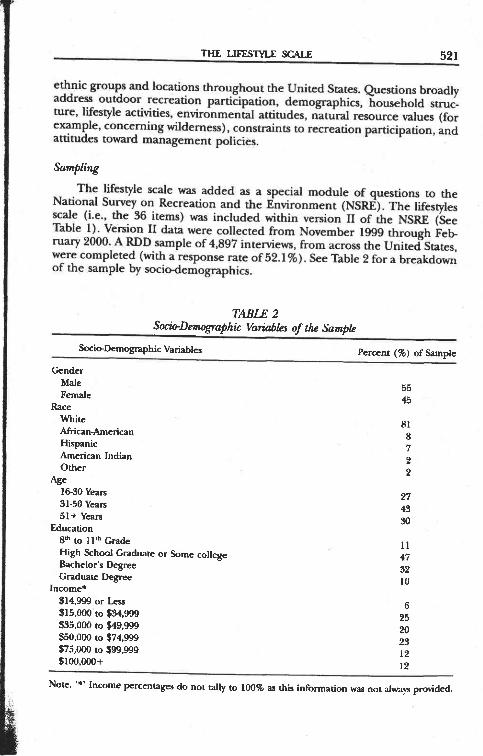
ethnic groups and locations throughout the United States. Questions broadly address outdoor recreation participation, demographics, household struc- ture, lifestyle activities, environmental attitudes, natural resource values (for example, concerning wilderness), constraints to recreation participation, and attitudes toward management policies.
The lifestyle scale was added as a special module of questions to the National Survey on Recreation and the Environment (NSRE). The lifestyles scale (i.e.. the 36 items) was included within version I1 of the NSRE (See Table 1). Version II data were collected from November 1999 through Feb ruary 2000. A RDD sample of 4,897 interviews, from across the United States, were completed (with a response rate of 52.1 %). See Table 2 for a breakdown of the sample by sociodemographics.
TABLE 2 Soc&Denwgraphu Variables of the Sample
Socio-Demographic Variables Percent (%) of Sample
Gender Male 55 Female 45
Race White 81 African-American 8 Hispanic 7 American l n d i i 2 Other 2
*gc 1630 Yean 27 3150 Yean 43 51+ Yean 90
Education V" w 11" Grade 11 High School Graduate or Some college 47 Bachelor's Degree 32 Graduate Degree 10
Income* $1 4.999 or Less 6 $15,000 to $34.999 25 $35.000 to $49,999 20 w.Oo0 to $74,999 23 $75,000 to $99,999 12 $100.000+ 12
Note. '*' Income percentages do not tally to 100% as this infonnation was not ahvays provided.
522 GREEN, CORDELL. BET2 AND DISTEFANO
Random-digitdialing reaches a random sample of household telephone numbers (the NSRE does not contact cell or mobile phone numbers), rathe than of people. Afnuent families are virtually certain to have a telephonl number (97%). often more than one. At the other end of the scale, man lowincome households do not have a telephone (ranvng from 8% to 23% depending on geographic area). As a result, affluent people are likely to b somewhat over represented in the survey sample (Bowen, 1994; Groves, 199( Tucker, Lepkowski, Casady, & Groves, 1992). To compensate for these type of sampling biases, the NSRE data set was weighted. Weighting was achieve using a combination of multivariate and multiplicative weights to accour for age, race, sex, education, and urban/rural differences between the san pie and the U.S. Census. This weighting adjustment helps adjust estimatf of recreation participation and other NSRE variable estimates to better re1 resent the proportionate distribution of the U.S. population across sock strata
Response rates for this study varied from 51% to 55%. However, in con paring 33 studies, Krosnick (1999) found that response rates for govern me^ agencies ranged from 19% to 64%. In examining the demographic repr sentativeness of the studies data, to determine if lower response rates implie lower quality data, Krosnick found that surveys with relatively low respon: rates often have excellent demographic representativeness. Similarly, ~ e e t i Miller, Kohut, Groves, and Presser (2000) discovered no significant difft ences between identical survey questions conducted in separate studies, or achieving a response rate of 36% and the other a response rate of 61 %. TI Council for Marketing & Opinion Research (CMOR) collected similar infc mation from various organizations and found RDD phone studies often ha a 10% to 13% response rate (Council for Marketing and Opinion Researc 2001).
Another source of bias comes bom language barriers through the u desirable but unavoidable exclusion of people who cannot speak either Er lish or Spanish. According to the 2000 Census, 12.5% of the is Hispanic. For the non-English speaking segment of the tion, the NSRE was conducted in Spanish. The most process was getting the translation generic enough for overall compreht sion by all the various Hispanic dialects. The complexity of the translati and interviewing processes made interviewing in all languages, except EI lish or Spanish, prohibitively costly. Therefore, other non-English speaki U.S. residents were excluded from the survey.
Analysis of Data
For the analyses, cases with incomplete profiles were deleted. Furth responses to individual items of "Don't Know" or 'Refused" were recod as missing data. The statistical program, SPSS for Windows (version 11 Scientific Software, 2003). was used for all analyses.
THE I5ESlYLE SCALE 523
An exploratory factor analysis using the principle components method with varimax rotation was run to determine the number of dimensions un- derlying the 36 item lifestyle scale. Principal components analysis refers to a family of exploratory multivariate procedures which aims to provide a re- duced structure from a larger listing of variables (Gotsuch, 1983; Comrey & Lee, 1992). Exploratory factor analysis (EFA) assumes that the exact number of dimensions underlying a set of data is unknown.
The principal components extraction method has many advantages. Its primary advantage is that each component extracted from the data set ac- counts for the maximum amount of variance among the set of variables under study (Gonuch, 1983). Additionally, the principal components method assumes that all the variance underlying the data set is relevant and it seeks an optimal solution that best explains the relationships among items in the data set. A criticism of the principal components e x a t i o n method is that it does not allow for measurement error in responses (i.e. the diagonal of the correlation matrix is set to 1.0, implying no measurement errors in responses). However, the impact of the diagonal elements on the off diag- onal elements is minimized as the number of items under study increases (Comrey & Lee, 1992). In this study, the sizeable number of items, 36, tends to lessen substantially the impact of the diagonal elements. Finally, the prin- cipal commnents method tries to distribute the variance accounted for by each comionent in a somewhat uniform manner across the set of extracted components. This procedure helps create components of relative equality, in terms of the amount of variance accounted for, alleviating the tendency for one dominate component to emerge.
Once an extraction method is chosen, the EFA researcher may choose a rotation method. Rotation helps to mathematically redistribute the rela- tionships among the components, without changing the relationships be- tween items and components and is conducted to aid in interpretability of the final solution (Gotsuch, 1983). In this study, a varimax rotation was used, which is a type of orthogonal rotation that tends toward producing unrelated components. Orthogod solutions are easier to interpret because the item loadings are correlations between the item and the component (Comrey & Lee, 1992). Further, an examination of the component correlations showed that intercorrelations among components were mostly low ( p < .15).
EFA has been criticized as an internally driven analysis method with few criteria to evaluate its results. Replicating the analysis using a comparable, independent sample of the same population is an optimal technique to MI- idate an EFA solution (Crocker & Algina, 1986; Horley, 1992). Following this protocol, the NSRE Lifestyles data were randomly divided into two indepen- dent samples using the SPSS Random Selection Procedure. Sample 1 (n = 2,448) was used as the development sample and Sample 2 (n = 2,449) was used as the replication sample. The EFA procedures described were con- ducted upon both samples. For each sample, the exact same series of analysis steps were independently executed and compared. Comparison of the two EFA solutions helps determine whether the final solution is an adequate
524 GREEN. CORDELL, BET2 AND DIZXEFANO
representation of the number of dimensions underlying the responses or is simply the product of chance.
Each of the EFA principal component solutions were evaluated based on four criteria (Comrey & Lee, 1992; Crocker & Algina, 1986; Gorsuch, 1983). First, percent of variance explained by the overall set of components and by each individual component was assessed. Solutions that explain the underlying relationships will account for a greater amount of underlying variance in the data set Also, considering the amount of variance accounted for by each component helps to determine if the component is significantly contributing to the solution. The second evaluative criterion considered was the occurrence of simple structure. Simple structure states that each item should associate with one component Cross-loading items, where an item has strong relationships with more than one component, may cause prob- lems when interpreting the EFA solution. Items were considered markers of a component if their loading Value was at least .40. Lower item-tocomponent correlations were considered if an item did not associate as highly with any other component. Third, the solution was evaluated for the absence of spe- cific factors. Specific facton are components consisting of one item and are often an indication that the data set has been 'over factored" (Gorsuch). Finally, the solution was judged upon its interpretability. This criterion is arguably the most important because for the solution to be useful, it needs to be substantively important based upon the researcher's knowledge of the content area.
Results
Development Sample
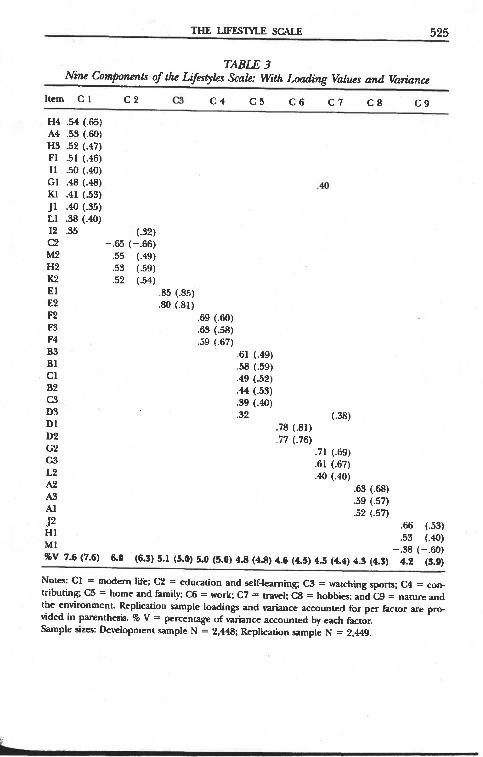
The initial scree plot suggested seven to eleven components underlying the development sample, Sample 1. Each of the EFA solutions from seven through eleven were run and examined according to the four evaluative criteria. A ninecomponent solution was considered to have the optimal s e lution across the four criteria (See Table 3). This ninecomponent solution accounted for 5 2 1 of the variance across the 36item lifestyle scale and the 2,448 observations in the development sample data. There did not appear to be one dominant component and the rotation converged in 11 iterations. Goodness of Fit statistics, X' (df 342, n = 2,448) = 939.42, #J 5 .001), also indicated a 'good fit." Further, the solution had very few items cross loading on more than one component. There were no components with only one lifestyle activity, indicating that the nine-component solution had not over factored the 36 activities. Finally, the nine-component solution was inter- pretable, logical, and meaningful in explaining the lifestyles of Sample 1 respondents. Table 3 presents the loading values and the percent of variance accounted for by each of the nine factors.
Rgblicatwn Sample
The exact same series of analyses performed on the development sample were run using the replication sample to determine if the nine component
THE LIFESTYLE SCALE 525
TABLE 3 Niw COrnp0nmt-s of the LifesrpEcs Scak With Loading Values and Varianc~
Item C 1 C 2 C3 C4 C 5 C 6 C7 C 8 C 9
H4 .54 (.65) A4 .53 (.a) H3 .52 (.47) F1 .51 (46) 11 .50 (.40) GI .48 (.48) K1 .41 (.53) Jl .40 (.35) L1 .38 (.M) I2 .35 (.92) C2 -.G (-.66) M2 .55 (.49) HP .53 (.59) K2 .52 (.54) El .85 (.85) E2 .80 (.81) F2 .69 (50) F3 .63 (.58) F4 .59 (.67) B3 .61 (.49) B1 .58 (39) C1 .49 (.52) 82 .44 (.53) C3 39 (.M) D3 .32 (-58) Dl .78 (.81) D2 .77 (.76) C2 .71 (.69) G3 .61 (-67) L2 .a (.a) A2 .63 C.68) AS .59 (.57) A1 .52 (.57)
J2 .66 (53) HI .53 (.a) M 1 -3 (-.60) %V 7.6 (7.6) 6.0 (66) 5.1 (5.0) 5.0 (5.0) 4.8 (48) 4.6 (4.5) 45 (4.4) 4.3 (4.3) 4.2 (3.9)
Notes: C1 = modem l i k C2 = education and self-learning; CS = watching spom: C4 = con- tributing, C5 = home and family; C6 = work: C7 = travel; C8 = hobbies; and C9 = nature and h e environment Replication sample Loadings and MMnce accounted for per bcwr are pro- vided in parenthesis. % V = percentage of variance accounted by each hctor. Sample sizes: Development sample N = 2,448. Replication sample N = 2,449.
526 GREEN, CORDELL. BE= AND DISlTFANO
solution could be considered viable. The scree plot run on the replicati1 sample also suggested that seven to eleven components could best expla the replication sample data set As with the development sample, the ni component soiuticn for the replication sample satisfied all of the criter percent of d a n c e accounted for, simple structure, a k n c e of specific E tors, and interpretability. The ninecomponent solution accounted for 53 of the variance in the replication sample and did not possess a domina component. Also, the ninecomponent solution provided a simple structul with very few items cross loading on more than one component. No 01
activity components were present and the rotation converged in 10 iterati01 Goodness of Fit statistics, x2 (df 342, n = 2.449) = 993.61. p .001). al indicated a 'good fit.' Equally as important, the nine-component solution f Sample 2 was felt to be interpretable, logical, and meaningful. Table 3 pi vides the component solution for the replication sample, where the ref cation sample values are shown in parenthesis to allow for comparison acrc the two solutions. As shown in Table 3, there was considerable overlap 1 tween solutions from the two random samples. The vast majority of itel loaded similarly on the same components, showing that the nine-compone solution was replicated. It appears that the solution with nine groups p formed well in accounting for the relationships underlying the 36-item NSI lifestyles scale. In addition, reliability of these components, using Cronbacl alpha, ranged from .60 to -85.
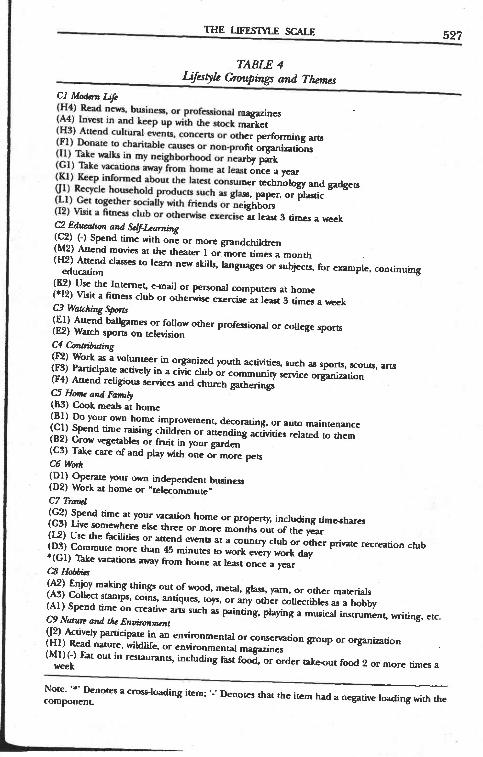
The lifestyle items grouped under nine distinct components. These E tors represented nine lifestyles and were labeled by nine descriptive them modem life, education and self-learning, watching sports, contributi~ home and family, work, travel, hobbies, and nature and the environme (See Table 4). Each of these nine themes attempted to capture the relatic ship of the items within their groupings and the diierent lifestyles they p tlayed.
Mcniern kfe. The modem life factor expresses the tendency to stay c rent with contemporary culture, health trends, and upto-date technolc and information. This Factor consisted of the following lifestyle items: Re news, business, or professional magazines; invest in and keep up with-t stock market; attend cultural events, concerts or other performing arts: (
nate to charitable causes or non-profit organizations; take walks in my neil borhood or nearby park; take vacations away from home at least once a ye keep informed about the latest consumer technology and gadgets; recy household products such as glass, paper, or plastic; get together socially w friends or neighbors: and visit a fitness club or otherwise exercise at le three times a week.
Education and s.@&-ng. The education and self-learning factor dicates a desire for knowledge, new experiences, and skills, and for spendi time with family members. This factor included the following lifestyle iter
TMLE 4 Lij2sfyk G9vupin.p and Thenur
C l Modem L.$ (H4) Read new, business, or professional magazines (A4) lnvest in and keep up with the stock market (HS) Attend cultural evenu. concert, or other performing ans (Fl) Donate to charitable causes or non-profit organizations (11) Take walks in my neighborhood or nearby @ (GI) Take vacations away from home at lea* once a year (Kt) Keep informed about the latest consumer technology and gadgers (Il) Recycle howhold products such as glass, paper, or phtic (Ll) Get together socially with fiends or neighbors (12) V I I ~ a fitness club or otherwise exercise. at leas 3 times a week C2 Ed- and SclfLrmning (C2) (-) Spend time with one or more grandchildren (M2) Attend movies at the theater 1 or more times a month (HZ) Attend clarses to lean new skills, languages or subjects, for example, continuing
education (K2) Use the Internet, e-mail or personal cornputen at home (*I3 Vsit a fimess club or otherwise exercise at least 3 times a week c3 waluhiagw (El) Attend ballgmws or follow other professional or college sports (E2) Watch spom on television c4 Conbibuting (F2) Work as a volunteer in organized youth activities, such w sports, scouts, aru (FS) Panicipatc actively in a civic club or community service organization (F4) Attcnd reliiour services and church gatherin@ C5 Homc md Family (B9) Cook meals at home (Bl) Do your own home improvement, decanting, or auto maintenance (C1) Spend time raising children or attending activities related to them (52) Crow vegetables or fruit in your garden (CS) Take care of and play with one or more pets C6 W& (Dl) Operate your own independent business (D2) Work at home or 'tdecommure" c7 T d (G2) Spend dmc at your vacation home or property, including time-rhares (GS) Live mewhere else three or more months out of the year (l.2) Use the facilities or attend events at a country club or other private recreation club (DS) Commute more than 45 minutes to work every work day *(GI) TAe vlcations away from hame at least once a year CB H& (A?) Enjoy malting thing out of wood, metal, glass, yam, or other materials (AS) Collect stamps, coins, antiques. toys. or any other coIlectibkr as a hobby (Al) Spend time on creative ans such as painting, playing a musical instrument, writing, etc. C9 Nahm and he Envirallvnr u2) Actively participate in an environmental or consenation group or organization (Hl) Read nature, wildlife. or environmental magazines (Ml) (-1 Eat out in restaurants, including fast food, or order take-out food 2 or more t ima a
wef?k - p p p p p
Note. '*' Denotes a cro~.-loding item; '-' Denotes that the item had a negative loading with the component.
528 GREEN. CORDELL, BETZ AiiD DISTEFANO
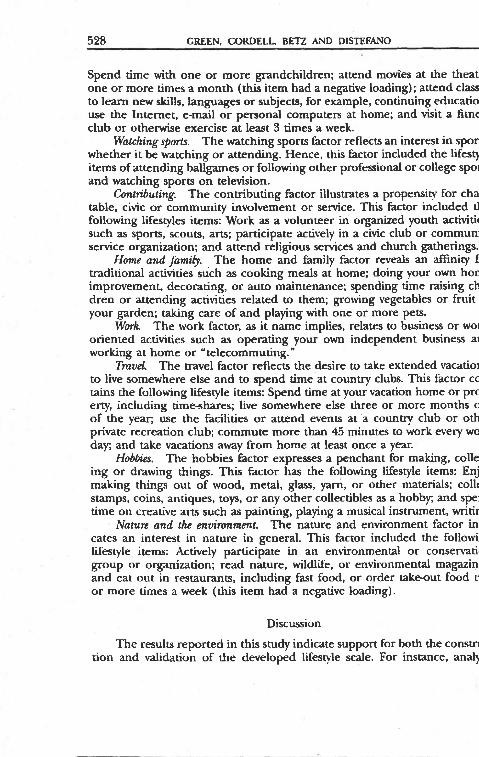
Spend time with one or more grandchildren; attend mob4es at the theat one or more times a month (thii item had a negative loading) ; attend class to learn new skills. languages or subjects, for example, continuing educatio use the Internet, e-mail or personal computers at home; and visit a fitnt club or otherwise exercise at least 3 times a week.
Watchingsports. The watching sports factor reflects an interest in spot whether it be watching or attending. Hence, this factor included the lifest) items of attending ballgames or following other professional or college spo and watching sports on television.
CmtriMing. The contributing factor illustrates a propensity for cha table, civic or community involvement or service. This factor included t! following lifestyles items: Work as a volunteer in organized youth activitil such as sports. scouts, arts: participate actively in a civic club or commun service organization; and attend religious services and church gatherings.
Home and family. The home and family factor reveals an affinity f traditional activities such as cooking meals at home; doing your own hot improvement, decotating, or auto maintenance; spending time raising ck dren or attending activities related to them; growing vegetables or fruit your garden; taking care of and playing with one or more pets.
Wok The work factor, as it name implies, relates to business or wo oriented activities such as operating your-own independent business a1 working at home or "telecommuting."
TmveZ. The travel factor reflects the desire to take extended vacatio~ to live somewhere else and to spend time at counuy clubs. This factor cc tains the following lifestyle items: Spend time at your vacation home or prc erty, including time-shares; live somewhere else three or more months c of the year; use the facilities or attend events at a country club or otk private recreation club; commute more than 45 minutes to work every wc day, and take vacations away from home at least once a year.
Hobbies. The hobbies fictor expresses a penchant h r making, colle ing or drawing things. This factor has the following lifestyle items: Enj making things out of wood, metal, glass, yam, or other materials; collc stamps, coins, antiques, toys, or any other collectibles as a hobby, and spe time on creative arts such as painting, playing a musical instrument, writit
Nature and the mvinmmnt. The nature and environment factor in cates an interest in nature in general. This factor included the followi Lifestyle items: Actively participate in an environmental or consenati group or organization; read nature, wildlife, or environmental magazin and eat out in restaurants, including fast food, or order take-out food t or more times a week (this item had a negative loading).
Discussion
The results reported in this study indicate support for both the constr tion and validation of the developed lifestyle scale. For instance, anal)
THE LIFESTYLE SCALE 529
revealed considerable overlap between the two solutions with the *ast rna- jority of items loading on the same nine principal factors. These nine factors also accounted, both logically and statistically, for the relationships under- lying the 36item lifestyles scale. Replication and further analysis also sug- gested that the scale was robust with strong internal consistency.
By encompassing different aspects of a person's lifestyle the scale also helps to make clearer the multi-faceted picture of Americans' lives-or in this case, the lives of a crosssection of Americans aged 16 and over. Being able to distinguish between different recreation participants and different lifestyle groups has been a major goal both for researchers and recreational professionals for many years (Petrick et al., 2001). This scale is a step towards achieving that goal. In fact, in combination with recreation and demographic data, the lifestyle scale has already helped to increase what we know about people's lives by producing distinctly different lifestyle profiles (Cordell et al., 2004). For instance, Cordell et al. identified and distinguished two life- style groups called "the enthusiasts" and "the ultra enthusiasts." These groups, by far, spent more time participating in recreation activities than most people and spend far more on equipment and services. Hence, for these reasons, recreation and leisure professionals want and need to know all about them, and what they are doing in their leisure hours (Cordell et al.) .
An additional aspect of the developed lifesryle scale is that although the items were initially selected to represent different and multiple facets of a person's lifestyle, with the intent of maximizing content validity, the results revealed a simple structure of nine factors. The fact that the scale encom passes many items yet still reduces to just nine factors speaks to the potential usability and interpretation of the scale by recreation professionals.
In comparison to existing scales (e.g., AIO, VALS, PPM) that mostly utilize large numben of items to create robust factors, this scale uses far fewer items. By using fewer items this scale is better suited, than some pre- viously longer scales, for telephone surveys or site studies that have limited contact time with respondents. The fact that the scale has already been used in conjunction with other data (i.e., recreation participation, socie demographic) to produce distinct l i i tyle groups also speaks to its versatility (Cordell et al., 2004).
Implications
Dramatic changes are occurring in the composition of the populations of almost all communities and regions of this country, Without doubt these unprecedented population changes will herald significant increases in the diversity of people's use and preferences for recreation and leisure activities (Cordell. Green, & Betz. 2002; Murdock et al.. 1991). Effective and respon- sive program designs to address growing diversity must be based on as much indepth knowledge as can be obtained across social groups composing the

530 GREEN. CORDELL. BET2 AND DISTEFANO
population. No longer is it acceptable to assume "one size" fits all. Thi axiom applies equally to people within a group, as it does to the entire popt lation.
For instance, the population age 65 and older of this country has beel growing very rapidly in the last two decades, and projections show continue1 growth (Cordell & Overdevest, 2001). Numerous studies have also show that recreation participation typically slows down and activity choices shift a people grow older (Cordell et al., 1999; Iso-Ahola et al., 1994; Powell. 1994: Therefore older people have lifestyles as diverse as any other groups in ou society and as diverse as the population generally. One itinerary of recreatio~ activities will no more fit the diversity within the growing senior populatio' than it would fit the growing diversity of the population at large. Hencc recreation and leisure professionals need to recognize that their lands, fi cilities, and services can't be everything to everyone, and so they shouldn be targeting everyone for everything. serefore, designing edudation, ma keting. recreation or other ~romams based on lifestyle differences of senio~ for Gerent senior groups' in "this case, is likely to2greatly increase deliver effectiveness.
In working with liiestyle data, the public sector can learn from the grov ing experienceof the prikte, for-profit sector. Commercial product ana se vice marketine in the ~rivate sector often aims to o~timize effe~tiveness t diierentiatin~potent.& customer bases according to'dominant liiestyle cha acteristics or profiles (Francese, 1996; Heath, 1996; Vyncke, 2002). Adverti ing and other promotions are tailored to match lifestyle interests, as well i demographics (GiIbert & Warren, 1995; Rice, 1988). Numerous commerci; lifestyle scales have been developed and are widely used by successful bus nesses (for a high price) to plan and better target marketing strategies (Cla itas Express. 2002; Kamakura & Wedel, 1995; Morgan & Levy, 2002). Con mercial scales focus on identlfjing people's interests and hobbies, such i
attending church. having pets, using the internet, playing with grandchi dren, collecting stamps, and also upon recreation activities people enjoy suc as walking, tennis, swimming, and skiing (Claritas Express, 2002). This i~ formation is then used to create customer profiles. These profiles are use to help organizations match their services to their customer's existing c potential needs. If recreation and leisure professionals and their agencic would utilize similar information and scales, they would also be able to creal customer profiles.
These profiles could then be used to match their own programs an services to their customer's existing and potential needs. These profiles coul also help recreation and leisure professionals to make better decisions r~ garding their management operations (e-g., hours of operation, reservatio procedures); resource allocations (e.g., targeting programs, hiring and usin of staff); new services, facilities or program development (e.g., type, size, an location); pricing policies (e.g., based on people's desired level of service and targeted goals (e.g., based on people's desired benefits or experience: (Petrick et al., 2001).
THE LiFESlYLE SCALE 531
Due to the fact that this scale was used on a broad national sample, it is recommended that future researchers endeavor to use the scale on a p o p ulation related to a specific site (i.e.. park, forest) or catchment area (i.e.. all counties within a certain distance from a site). It is also suggested that the scale be used on different activity cohorts (e.g.. kayakers, hunters, golf- ers), and on different age cohorts (e.g., seniors, middle-aged) to see what more can be learned about particular group's lifestyles.
Conclusion
The United States' population is rapidly increasing, while at the same time becoming more socially diverse. With greater diversity come many new challenges for recreation managen and planners, such as trying to identify new ways of reaching their constituents to learn about their wants and needs. At the same time, recreation managers are trying to educate the public about the existing recreation opportunities, benefits, and services already available to them. Changes in the composition of the population have also led to Mlying values being placed on different recreational resources, and to the growth of new or alternative forms of recreational activities (e.g.. base jump ing, geo-caching, bull-fragging, etc). An evolving challenge for recreation managers is to better understand the changes and provide appropriate ser- vices and facilities for their diverse customer base.
For many Americans recreation and leisure are a key or fundamental, although everchanging, part of their lifestyle. However, in all likelihood, the growing diversification of this country's population will make obsolete many of the approaches successfully used in the past to reach, understand, and address people's changing recreational needs. For these reasons research on people's lifestyles is both important and needed. Therefore, recreation and leisure managers need to develop more sophisticated and comprehensive tools that will enable them to 1) better serve existing users; 2) idenufy po- tential users; 3) more Fully understand and address people's changing rec- reation and leisure needs and preferences; and 4) successfully market their facilities and services. Gaining a deeper understanding of people's lifestyles is not an option for recreation professionals, but a necessity for the future growth of the profession as a whole.
References
dlison, M., & Geiger, C. (1993). Nature of leiwre activities among the Chinescherican elderly. Lrirun .'&ienm, 15,509519.
Bowen, G. L. (19941. Estimating the reduction in nonrespone bias Emm using a mail surrey as a backup for nonrespandene to a telephone interview sumey. &-smmh on Social 1Vod Pmctice,
' 4. 115148. Bryan, H. (2000). Recreation specialization revisited. J o u d o j l r i rwr R c r ~ d . 31, 18-21. Claritas Express (2002). Rizm Lifityk qnmtahon, advancing the hc and art of mawng.
[Brochure]. Arlington, VA: Author. Comrey. A, & Lee, H. (1992). Ajrst rmcm in faclor +. Hillsdale, NJ: L. Erlbaum M a w .
532 GREEN. CORDELL, BE= AND DISTEFANO
CodeU, H. K. Bea, C. J.. Bowker. J. M.. English. D. B. K, Johnson, C. Y.. Mou, S. H.. et al. (1999). Outdwr cia in American we: A Ralional w s m d oj demand and &a&. Champagne, IL: Sagamore Publishing.
Cordell, H. K, Bea, C. J.. Green, G. T., Mou, S.. Leeworthy, V., Wiley, P.. et al. (2004). Outdwr mm&m in America in fhe 21d Cahuy. A npmr to the N o h : The National Survsy on Ramdim and fhe E m i r a d State College. PA: Venture Publishing, Inc.
Cordell, H. K. Green, G. T.. & B e e C J. (2002). Cultural dimensions of mreation. and the environment. Lsiswc Schuss 24, 13-41.
Cordell, H. K.. Green, G. T., Leeworthy, V R, Stephens. R, Fly. M.. & Betz. C (2005). The United States of America: Outdoor recreation. In G. Cushman. A Veal, & J. Zuzanek (Eds.), Fm tinu and lcinvspadtipation: Intmndkid p m w (pp. 245264). Wallingford. UR: CAB International.
Cordell. H. K., McDonald, B. L, Lewis, 8.. Miles, M.! Martin. J., & Bason, J. (1996). United Statts of America. In C. Cushman. A. J. Veal, & J. Zuzanek (Eds.). W d Lisunpmrk@Wionr F m Linv in the glo6al v i m (pp. 215235). Walliingford, UK: CAB International.
Cordell, H. K, & Overdevest. C. (2001). Faopine a the l a d An assessment of donogmphic mndr and Lhrjkture of mural rwmrnrr in the Uni&d Slolls. Champaign, IL: Sagamore Publishing.
Council for Marketing and Opinion Reumh. (2001). Highlights from CMOR's Coopention Tracking System Data. Retreived July 3,2005, from hftp: / /wvwmmg/rnpcmpn~sO505.km
Coupal, R. Bastian, C., May, J., & Taylor, D. (2001). The economic benefits of snowmobiling to Wyoming residents: A uavel cost approach with Market Segmentation. Journal of Lsisw Rrwo~h , 33, 492-510.
Crocker, L. & Algina, J. (1986). Inkodwtk 0 c k & d und rnodmr &sl lhmy Xew York: Holt Rinehan & Winston Publications.
Curhman, G.. Veal, A, & Zuzanek. J. (Eds.). (2005). Frsl time and kisurepwikipdm: In&rnulionaI pnspsaiuar. Cambridge, M CAB1 Publishing.
Cutler Riddick, C., & Stewan, D. C. (1994). An examination of the l i e satisfaction and impor- tance of leisure in the lives of older women reti-. A comparison of blacks and whites. journal of lcinns Rcrsmch. 26,7587.
Daitilo, J., Dattilo, A, Sam&hl. D.. & Kleiber. D. (1994). Leiiure orientations and self esteem in women with low incomes who are overweight Jwd of Lhm Raamh, 26, 23-38.
Dernby, E. (1974). Psychographics and from where it came. In W. D. Well. (Ed.). Li/r rtyb rmd p@ogmphiw (pp. 9-30). Chicago, n: American Marketing Amciation.
Dmpr, J. E., & Hutchinson. R (1990). Outdoor mreation participation and preferences by black and white Chicago households. In J. Wning (Ed.), Sainl sc imn a d natural mource ranration m n q m m t (pp. 4467). Boulder. CO: WcJtview Press.
Fedler, A. J. (2000). Pmficwng in bonring andfihing: A litemtun minu. Abxandria, Vk Recm- ationd Boating and Fishing Foundation.
Fireslone. J., & Shelton, B. (1994). A comparison of women's and men's leisure time: Subtle effects of the double day. Lrirun ScLnm, 16, 45-60.
Floyd, M., E. Cramann. J. H.. & Saenr, R (1993). Ethnic lactors and the use of public outdoor recreation areas: The c a ~ e of Mexican America-. Lcisura Scinms, 15.8598.
Floyd, M. F., & Shinew, K J. (1999). Convergence and divergence in leisure style among Whim and African Americans: Toward an interracial contact hypothesis. Jd of Leisure h r h , . . 31.35W84.
Floyd, M. F., Shinew. K J.. McCuire, F., & Nac, F. (1994). Race, c& and leisure activity pref- erences: Marginality and ethnicity revisited. Jwd of hisun fheamh, 26, 158-173.
Franc-, P. (1996). Marketing know-how. Annican ~~ 18(3 , 50-59. Furlong, A. Campbell, R, & Roberts, K (1990). The effects of p t - 1 6 experiences and social
class on the leisure pattern of young adults. Lcinen Studirs, 9, 21S224.
THE L1FF.S'M.E SCALE 533
Gilbert, E.. & h n , W. (1995). Psychographic consvucw and demographic segments. Pqc- €9 Markding, 12, 223-237.
Cladwell, N. J. (1990). A psychographic and sociodernographic analysis of state park inn uscn. /Ournos of T d Rcrsmdr 28, 1520.
Gobter. P. (2002). Managing urban parks for a racially and ethnically diveme clienak. Linrn Scimcn, 24, 145159.
Gonuch. R (1983). Factor adjs i t Hillsdale, NJ: L Erlbaum Associates. Gmws, R M. (1990). Theories and methods of telephone surveys. AnnualRrvicu, of-, 16,
221-40. Gunter, B.. & Furnham. A (1992). Caruwm ptvjk An iuhuducfion to pqchographics. London:
Routledge. Harrington, M.. & Damn, D. (1995). Who has it b e d Women's labor forre participation.
perceptions of leisure and constrainu to enjoyment of leisure. j a m d ofhun Rcsentrh 27. 4-24.
Hawkins. B., & Freeman, P. (1993). Correlates of self-reported leisure among adults with mental rerardation. h w r ScLnns, 15, 131-147.
Heah. R P. (1996). The frontiers of psychographi. Atmican Dcmpphicr, 18(7). 38-43. Henderson, K. (1994). Broadening an understanding of women, gender, and leisure. Journal of
k n &search, 26, 1-7. Henderson. R (1996). One size doesn't fit all: The meaning ofwomen's l e i s u r e . ~ a l o f ~
Rumnh 28,139-154. Horley, J. (1992). A longitudinal examination of lifestyles. Socid Indicota Racearch, 26,20M19. Harley, J.. Carroll. B., & Little. B. (1988). A (ypotogy of lifestyles. S o k t Indicolarr h u m h , 20,
383-398. b A h o l o S. E., Jackson. E., & Dunn. E. (1994). Starting, ceasing, and replacing leisure activities
over the life-span. Jowrral of Lcirwr Rmad, 26, 227-249. Kahija, M., & Bernasco. W. (2001). Joint and separated lifestyks in couple relationships. Jounral
of Mamamap @ tha P a w 63, 639-655. Kamakura, W.. & Wedel, M. (1995). Lifestyle segmentation with tailored intelviewing.&cmd of
Madding Rwad, 32, 2,317. Keetcr, S., Miller. C.. Kohut, A., Groves, R, & F'resser, S. (2000). Consequences of reducing non-
response in a national telephone survey. +nkm @arm$ f4. 12548. Krmnick, Jon. A. (1999). Survcy research. Annual Rcvirw Pqddogy, 50.537567. Kuenael, W., & McDonald, C. (1992). DiEerential effects of pt experience, commitments, and
lifestyle dimensions on river usc specialization. J o u d ofl;cinm Resad, 24, 269287. Lawton, M. P. (1994). Personality and affective correlates of leisure activity panidpation by dder
people. Joumal o f h m Ihemrh, 26, 13858. Link, M. W., & Oldendick. R W. (1998, May). Ci&jId. Doa it help or hinder suny -h. Paper
presented at the Annual meeting of the American hocii t ion for hblic -nion Rcsca~~h. St. Louis, NO.
Liule, 8. (1983). Personal projects: A rational and method for investigation. EnviwnMnr and lkhavh~ 15,273-309.
MacKay, K. Andemk, R, & Vogt, C. (2009). U n d e m d i n g vacationing mocoris~ niche markets. Jmrnral of T r d Rarsarcli, 40,356363.
McChesney, J. (1997). Applying the marketing concept to recreation. Pm*F &&maf~rn. 32( 7). 82-86.
McDonald, D., & McAvoy, L (1997). Native Americans and k'iure: State of the research and future directions. Joaunnl of Lcirwr Rcswrclr, 29. 145166.
Mitchell J. (1984). Personality correlates of life nlues.&mal ofRessmC in Pcrsonably, 18, 1-14.
534 GREEN. C O R D U BElZ AND DBTEFANO
Moore, R. L, & Driver, B. L (2005). I- lo c n ~ & ~ A: Awiding and managing M t d n v n ~ b a d opprlunicio. State CaUegc, PA: Venture Publishing. Inc
M o p , C, & Ley, D. (2002). Psychographic segmentation. Conaunuaria Wald, 20(1), 22- 46. Murdock. S. H.. Backman. K. Hoque. H.. & Ellii. D. (1991). The implications of change in
population size and composition on futurc partiripation in outdoor recreational activities. ]A of Jktm hearch, 23,2982!i9.
Oldendicls R W., Bishop. G. F.. Sorcnson. S W.. & Tuchhrber. A J. (1968). A comparison of the kish and last birthday methods of respondent selection in telephone surveys.jowd of O@&d Sbztistics, 4. 307-318.
Outdoor Mwtry Awciation. (2000). Ow&r mm&m pamapma . . . sfu@Ju br U n M !jfah:
Hzghhghtrhting IRc rmh-t (3* ed.). Boulder. CO: Lei- Trends Croup. Outky, (1. Floyd. M, E. & Shinew, K J. (1997 October). E&d socioava~nric sCohLc.
and rue on sabclsd lrirwc activity pe&mas among A+n A&nc IMammyfi*. Papzr presented at the 1997 Leiire Research Symposium, National Recreation and Parks Asw dadon. Salt Lake City, UT.
PenninsonGray, L., Fridgen, J., & Styncs, D. (2003). Cohort segmentation: An application to tourism. LsMna Sricncw. 25. 341-361.
Peter, J.. & Olson. J. (1994). Undnstudng corrncmn khank Burr Ridge. IL IIrwin. Peuick, J. (2002). Lifmtyle segmentation. Evmpsanjoud of Cmanunicoria, 17,445464. Petrick. J., Backman. S., Bider, R, & Norman. W. (4001). Analysls of golfer motivations and
conscrainn by experience use hiitory. Jhrnol o j Ldnm 33,5670. Phillip, S. E (1995). Race and leisure constninfa k Scimm, 17, 104120. Powell, L. M. (1994). Personality and aEcctiw correlates of leisure activity panicipation by older
people. j o w d ojl+inn+ Reed 26,13842. P m , S. Blair, J., & Tripleu, T. (1992). Survey sponsorship, mponse rates. and response
effects. Social Scicma Qua&$, 73, 698-77. Reece. C. (1989). Psycho+elling. &nm4 9(8). 14-15. Reimer. B. (1995). Maasunig l i jkt~llb ar &re pradcu. h the rhmdcal and snrpmcol p m b h a w
o f l i f ~ Q k rrrsmch. %Jose. CA: American S&iological Asrodacion, San Jose State University, Department of Communication Studies.
Rice, B. (1988). The selling of lifestyles. &chobgy T* 17(3), 4650. Scott. D., & Shafer, S. (2001). Recreational specialition: A critical look at the C O I I S I I U C L ~
o/- W h , 33,314343. Scan. D., & Ihigpen, J. (2003). Underatanding the birder as tourist: Segmenting visiton to the
Texas Hummer/Bird Celebration. Human Dinvardmrr of W#, 8, 199-909. Scott, D., & Willits, E (1998). Adolescent and adult leisure patterns: A m a z * u m e n r . ~ of
Licure Ramrrh, 30.31%330. Sh% S. M. (1994). Gender. leisure, md constnintr: Toward a framework for the analysis of
women's kisure. Journal of h t z hemc4 26. 522. Shih, D. (1986). VALS as a tool of tourism market research: The Pennsylvania erperimce.Jwnal
of T d h a m h , M(4), 2-11. Shinm, K J., Floyd, M. F., McCuirc. E A, & Noe, E P. (1995). Gender. nee, and subjective
s o d class and their association with leisure preferences. Lcirutz Scisncq 17, 75-69. Shinew. K J.. Floyd, M. E. McGuke. F. A, & Noc, F. P. (1996). The impact of claa p o b t i o n
on the leisure preferences of African Americans: hag roup comparisons. J o u d ojlsinm kamh 28,219232.
Stockdale. J., Wells. A, & Rall. M. (1996). f'articipation in free-time actinties: A comparison of London and Nm York. Lcinm Stadia, 15, 1-16.
Stodolsb, M. (2000). Changes in l e i partidparion patterns after immigntion. LaisunScimm, 22.3943.
THE llFESlYLE SCALE 535
Tucker, C.. Lcpkawski, J., Gsady, R, & Groves, R (1992). Commercial residential telephone li: Their characteristics and uses in sumy design. S4ciol Scisncr CmpuW RNicry 10,158 173.
Vaske, J.. Carothcn. P.. DonneUy, M.. & Bai4 P. (2000). Recreation continct among Sicn and anowboardem tcinrm Scimos, 22297913. .
Veal, A. J. (1993). Thc concept of lifaryle: A Review. LEirrur St&, 12,239252. Vyncke, P. (2002). Lifestyle segmentation. Europnrrr Jd of Coamunlolion. 17, W. Wolffe, K, & Sacks. S. 2 (1997). The lifcsryla of blind, law vision. and sighted youths A quan-
titative comparison. Journal of V d Iapainnrnf 6' Biiwins, 91.245-58. Wmdard, M. D. (1988). Class, qionality, and leirum among wban black Americatlk- The poet
civil rights era jam1 o / f A u w Raronh. 20, 87-105.