construction of average weekly hours for supervisory … · august 26, 2005 construction of average...
TRANSCRIPT

August 26, 2005
Construction of Average Weekly Hours for Supervisory and Nonproduction Wage and Salary Workers in Detailed Industries
In measuring output per hour for detailed industries, the Division of Industry Productivity Studies (DIPS) in the Bureau of Labor Statistics (BLS) constructs annual total hours series for each industry. To construct these series, the Bureau relies primarily on data collected in the BLS monthly Current Employment Statistics (CES) survey of U.S. establishments. The CES provides monthly and annual data on total employment, as well as data on employment and average weekly hours of production and nonsupervisory workers, by detailed industry. However, the CES does not collect data on the hours of nonproduction and supervisory workers, and therefore the hours must be estimated. This report describes the construction of these estimates for detailed industries.1
Average weekly hours of supervisory and nonproduction workers in each industry
are derived using data from the BLS-sponsored Current Population Survey (CPS), a monthly household survey, and data from the CES establishment survey. Annual ratios of supervisory worker average weekly hours to nonsupervisory worker average weekly hours for each service-providing industry are calculated from the CPS data. Similarly, ratios of nonproduction worker average weekly hours to production worker average weekly hours for each manufacturing and mining industry are also calculated. These ratios are applied to the CES nonsupervisory or production worker average weekly hours, respectively, for the industry to estimate the nonproduction or supervisory worker average weekly hours by industry.
In this effort, the Division of Industry Productivity Studies (DIPS) uses data
sources and methods similar to those used by the Bureau’s Division of Major Sector Productivity (DMSP), described in a report on this website at www.bls.gov/lpc/lprswawhtech.pdf, and in “Alternative measures of supervisory employee hours and productivity growth" in the October 2004 Monthly Labor Review, available at https://www.bls.gov/opub/mlr/2004/04/art2full.pdf. While the methods and data are similar, some differences occur in constructing industry-specific estimates. This report will discuss those differences. The Methodology
Productivity and cost measures for detailed industries are maintained back to 1987. The adjusted hours series discussed here were developed for the period 1987
1 The hours of self-employed and unpaid family workers also are included in industries where those workers tend to be relatively large. Estimates for self employed and unpaid family workers are not available from the CES establishment survey and are separately constructed using CPS data. This report does not discuss the estimation of self-employed and unpaid family worker hours, however.

through 2002. They have since been extended to 2003 and will be updated to current years in future updates of the industry productivity measures. Defining nonproduction and supervisory workers in the establishment survey Estimates of nonproduction or supervisory worker employment in each industry are derived from the CES establishment survey by subtracting the estimate of production workers, construction workers, or nonsupervisory workers from the total employees in that industry. In the CES, production workers in manufacturing and natural resources and mining refer to employees who engage directly in the production of the establishment’s products; production workers include working supervisors and group leaders who may be in charge of a group of employees, but whose supervisory function is only incidental to their regular work. In construction industries CES data refer to construction workers, while in utilities industries and in service-providing industries, CES data refer to nonsupervisory workers.2 Nonsupervisory workers are defined to include most employees except those whose major responsibility is to supervise, plan, or direct the work of others, such as top executive and managerial positions, officers of corporations, department heads, and superintendents. Defining nonproduction and supervisory workers in the household survey In the CPS, respondents are not asked to classify themselves as production, nonproduction, nonsupervisory or supervisory workers. They are asked, however, to report on their occupation and employment status. Using this information, we constructed employment counts and worker categories in a manner that is highly consistent with the way employers report on workers for the CES. The CPS microdata that were used cover all private wage and salary workers who were employed and at work beginning with data for January 1987. We sorted these data into categories of nonproduction (supervisory) or production (nonsupervisory) workers based on industry and occupation codes. For data prior to 2000, we define nonproduction workers in goods-producing industries as those in the following occupational groups: Executive, administrative, and managerial occupations Professional specialty occupations Technical, sales and administrative support occupations In nongoods-producing industries, supervisory workers are defined as persons in: Executive, administrative, and managerial occupations Beginning with data for 2000, the CPS occupation codes are consistent with the 2000 population census. We define nonproduction workers in goods-producing industries to include the following: 2 The Bureau does not currently maintain productivity measures for construction industries.
2

Management occupations Business and financial operations occupations Computer and mathematical occupations Architecture and engineering occupations Life, physical, and social science occupations Community and social service occupations Legal occupations Education, training, and library occupations Arts, design, entertainment, sports, and media occupations Healthcare practitioners and technical occupations Sales and related occupations Office and administrative support occupations In nongoods-producing industries, supervisory workers include: Management occupations Business and financial operations occupations Using this information, employment and hours of relevant occupational categories in each industry were grouped to arrive at estimates for production, nonproduction, supervisory, and nonsupervisory workers consistent with the CES data. Calculating Average Weekly Hours of Supervisory and Nonproduction Workers Annual estimates of employment and average weekly hours from the CPS household survey were constructed as annual averages of the estimates derived from the monthly survey data. CPS estimates of annual average weekly hours for each industry were constructed by dividing the sum of average weekly hours for each month in a given year by the sum of monthly employment in that industry during the year.
Hours data for production and nonsupervisory workers in detailed industries from the establishment survey are hours paid. At the major sector level, data on the relationship between hours worked and hours paid from other establishment surveys are available to convert hours paid to hours worked. This information is not available for detailed industries. The CPS, however, collects information on hours worked. Because the estimates of hours obtained from respondents in the CPS reflect hours worked rather than hours paid, the measure of the employed used in estimating employment and hours for individual industries from the CPS data was constructed to include those employed and at work during the survey period, rather than all employees paid. The estimates of average weekly hours for detailed industries constructed from the CPS data thus use the ratio of hours worked to employees at work as a proxy for the ratio of hours paid to employees paid.
3

Adjustments to Historical CPS Data Multiple Jobholding A major redesign of the CPS survey occurred in 1994, causing inconsistencies between CPS data collected before and after 1994. In particular, prior to 1994 the monthly CPS household survey data classified individuals only according to the industry and occupation of his or her primary job. In contrast, from 1994 forward the CPS data also provide information on the industry and occupation of secondary jobs, and information on hours worked at both the primary and the secondary job. Beginning in 1994, the CPS data can be combined to be more consistent with the data from the CES establishment survey, which measures jobs, counting a person who is employed by two or more establishments at each place of employment. BLS adjusted the CPS data prior to 1994 for multiple jobholding to be consistent with the data for 1994 forward. Adjustment ratios were constructed from the 1994 CPS data, where employment and hours of multiple jobholders in all twelve months were classified according to both the old and the new method. (Additional information was also available from the May 1985, 1989, and 1991 supplements to the CPS, but too few observations were available at the industry level from these monthly supplements to construct reliable adjustment ratios.) The industry-specific adjustment ratios based on 1994 employment and hours data were applied to the pre-1994 data to make them consistent with the later data. Industry Coding Industry employment and hours data from the CES establishment survey are identified with codes pertaining to the North American Industry Classification System (NAICS). In contrast, the Current Population Survey (CPS) uses the Census Bureau’s Industry Classification System (ICS) for coding industries. Depending on the year, an ICS code may represent a detailed industry as classified in the Standard Industrial Classification (SIC) system or the NAICS system, or a combination of several industries. CPS data classified at the most detailed ICS industry level were used wherever possible. From 1987 to 2002, each ICS code corresponds roughly to a 3-digit SIC code, although in some instances it corresponds to a 2-, 3-, or 4-digit SIC code or combination of several SIC codes. The ICS industry codes are updated in every decennial Census of Population to take into account SIC changes that introduce new industries and eliminate obsolete ones. The period studied, 1987-2002, includes two different SIC-based classification systems. For the years 1987-1991, the ICS is based on the 1980 Census, which uses the 1972 SIC classification, as modified in 1977. The ICS for the years 1992-2002 is based on the 1990 Census which uses the 1987 SIC classification. As a result of the changes made in the SIC and the ICS, some changes to coding were necessary to keep industries consistent throughout the period of the study. The recoding was done as the datasets were created. In recent years NAICS has replaced the SIC system for reporting U.S. data by industry. In 2003 the CES data were published on a NAICS basis for the first time, and
4
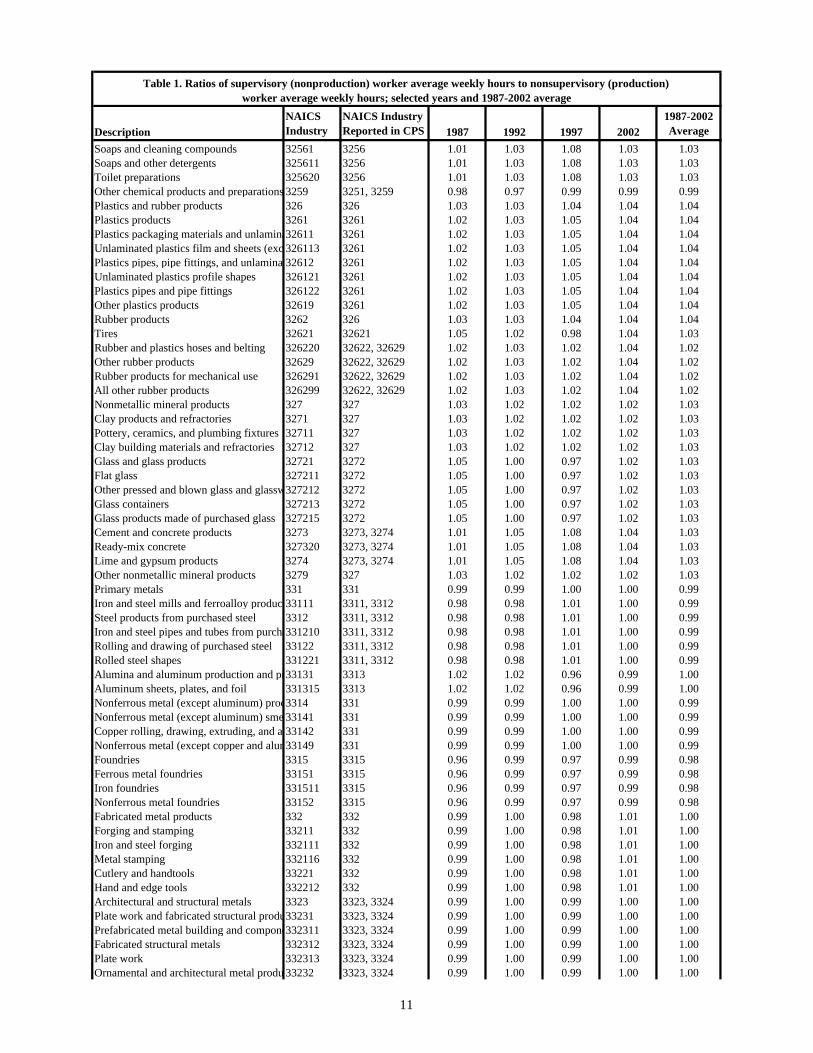
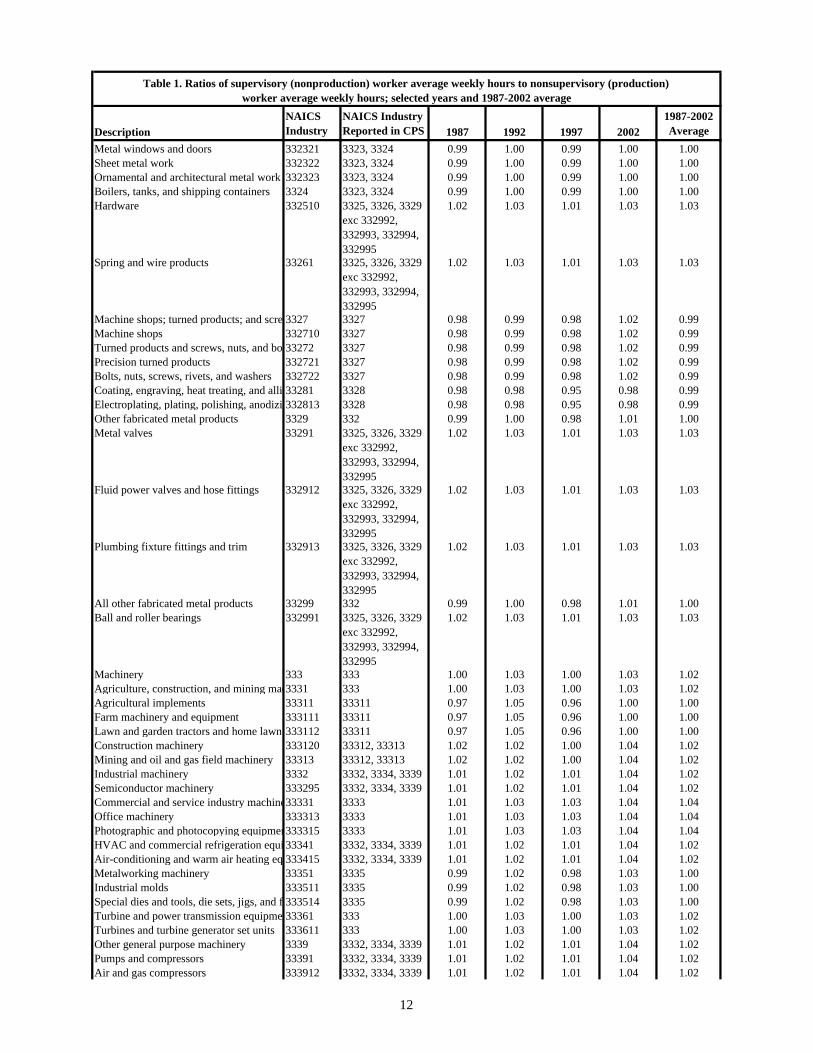
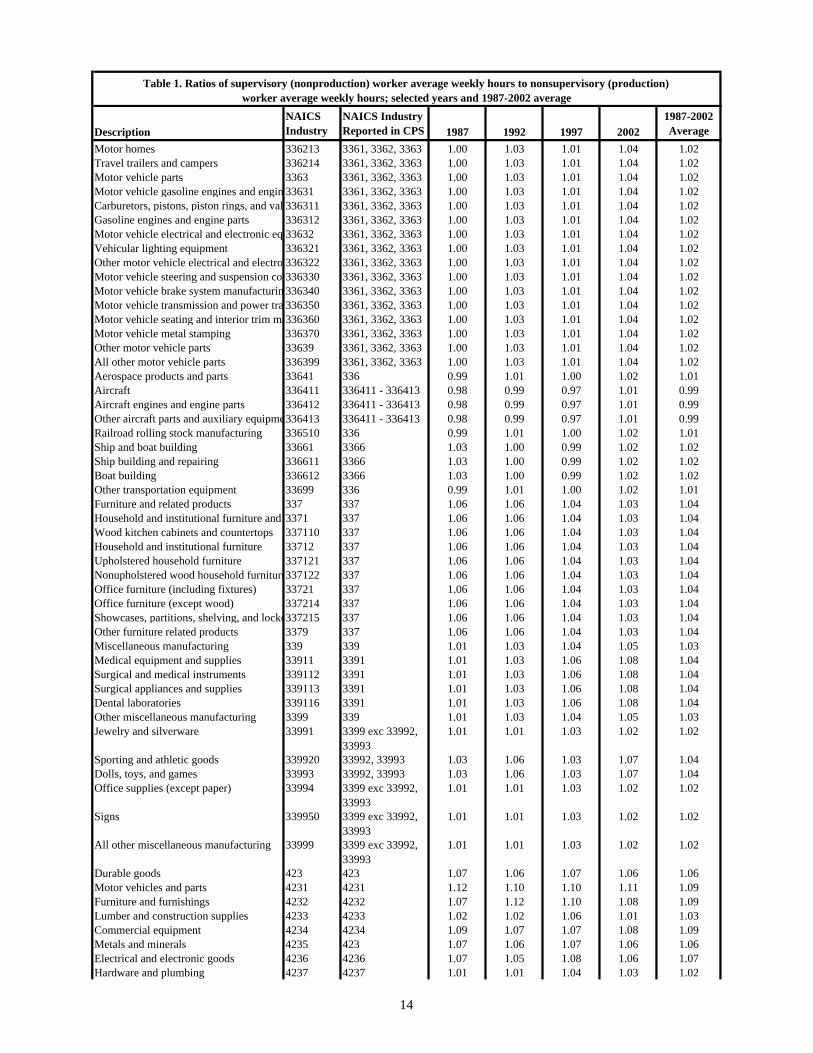
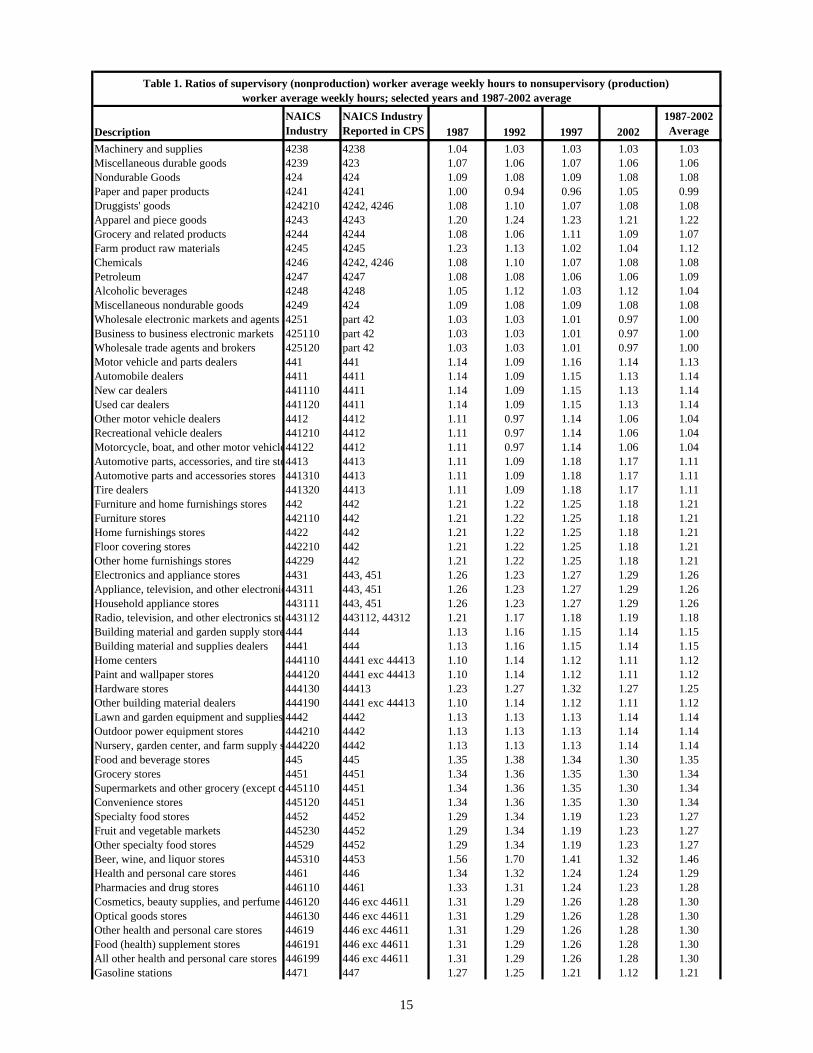
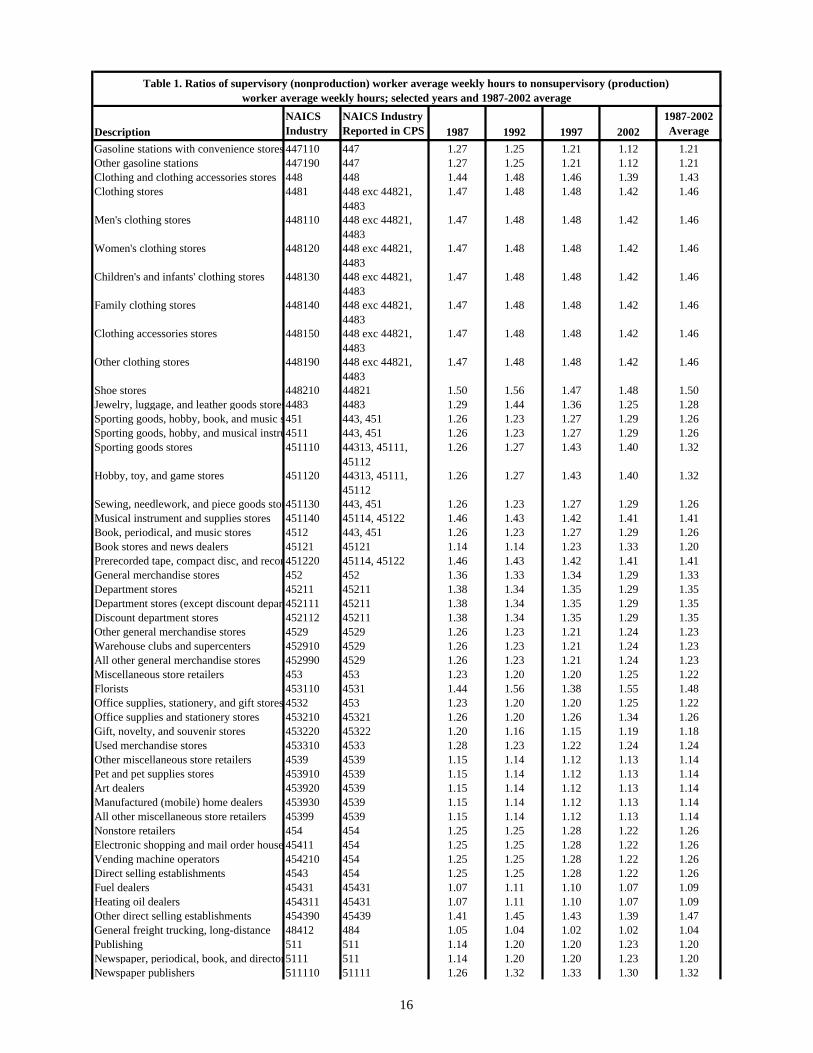
historical series were reconstructed to reflect the new industry structure. The NAICS system was also officially introduced into the CPS data in 2003, and CPS data for 2000-02 are available on both an SIC and a NAICS basis. In order to have consistent historical NAICS CPS series back to 1987 for estimating supervisory and nonproduction worker average weekly hours by industry, the Industry Productivity Studies staff used a multi-step process to convert the historical CPS data from SIC-based ICS codes to NAICS-based codes. Using the dual-coded CPS data for 2000-02, SIC to NAICS conversion ratios were calculated to reflect the percentage of SIC industry employment accounted for by the employment in each NAICS industry. Adjustments to the initial conversion ratios were later made based on a comparison of the NAICS industry employment levels for 2000-02 generated by applying this ratio with the employment estimates from the CPS data provided on a NAICS basis. NAICS final employment and hours estimates for 1987-2002 were derived by applying the adjusted conversion ratios to the historical SIC-based employment and hours series. Construction of Adjusted Hours Series Employment, total hours, and average weekly hours series were constructed separately for supervisory (nonproduction) workers and for nonsupervisory (production) workers for each ICS industry for the years 1987-2002 using CPS data. Using these series, the ratios of supervisory worker average weekly hours to nonsupervisory worker average weekly hours and nonproduction worker average weekly hours to production worker average weekly hours were calculated for each of 301 ICS industries at the greatest level of detail available, representing industries at the 3-, 4-, 5-, or 6-digit NAICS level, as well as combinations of industries. Included were 52 industries that were created by combining data for detailed ICS industries to more closely represent a 3-digit NAICS industry.
In using CPS microdata classified by detailed industry, the number of responses collected for each industry in the household survey was an important factor in assessing the reliability of the estimates. The employment size of the industry and the volatility of the constructed annual ratios were also considered. For some industries, the number of observations was insufficient to produce reliable estimates of employment and hours. The level of industry detail to be used in calculating the average weekly hours ratios was based on the number of responses for that industry in the CPS survey. Data for the most detailed industries classified in the CPS were used wherever possible, as long as the average number of responses for the industry was 492 or greater per year. For detailed industries where there were insufficient responses, the average weekly hours ratios were calculated using data for a more highly aggregated industry.
Once the level of industry detail to be used was determined, ratios of supervisory
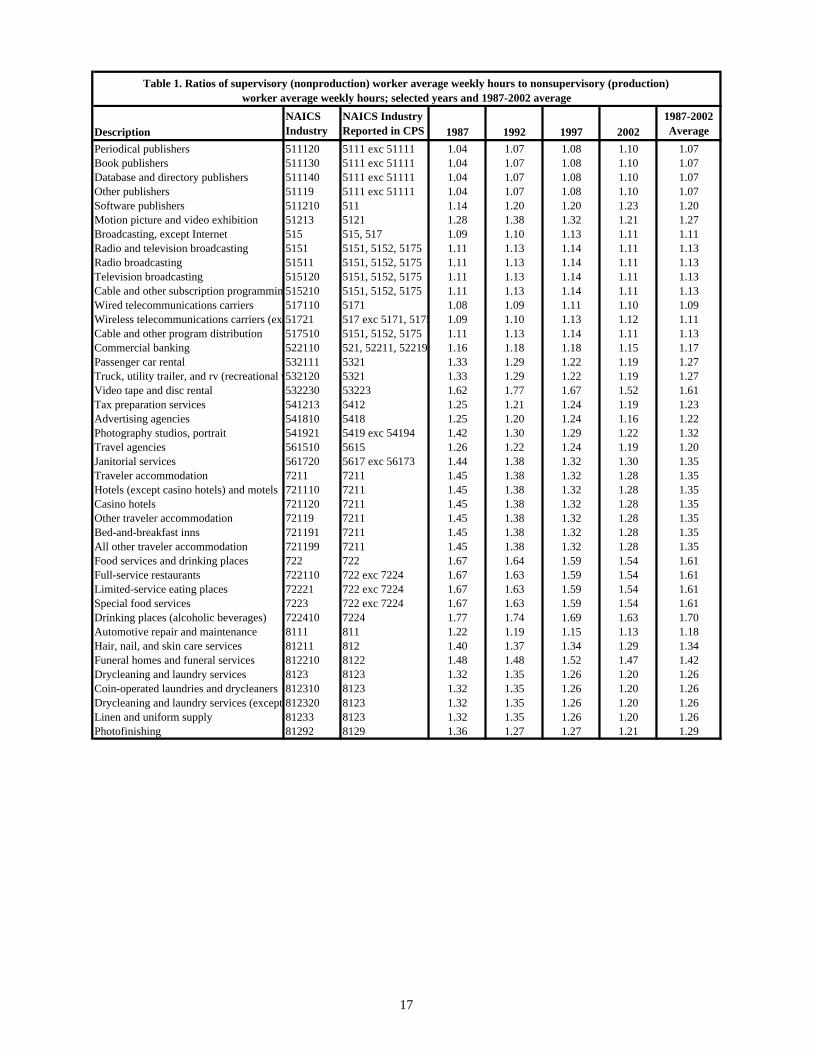
(nonproduction) worker average weekly hours to nonsupervisory (production) worker average weekly hours were calculated from the CPS data. Table 1 shows the level of CPS industry detail used, as well as the ratios for selected years, for each of the industries for which BLS maintains output per hour measures. The ratios were then multiplied by the number of nonsupervisory (production) worker average weekly hours from the
5
establishment survey to create supervisory (nonproduction) worker average weekly hours for each industry. The supervisory (nonproduction) average weekly hours are then multiplied by the number of supervisory (nonproduction) workers from the establishment survey to create total supervisory (nonproduction) worker hours for each industry. These hours were later combined with the hours of nonsupervisory (production) workers from the CES and self-employed and unpaid family workers from the CPS to create revised total hours for each industry. Results
Previous estimates of supervisory and nonproduction worker average weekly hours used in most industry productivity measures published prior to the completion of this research were held constant at levels derived from the discontinued BLS Employer Expenditures for Employee Compensation (EEEC) survey of 1977 (for manufacturing) or from the 1980 Census of Population (for non-manufacturing industries). Effect on Levels of Supervisory and Nonproduction Worker Average Weekly Hours by Industry
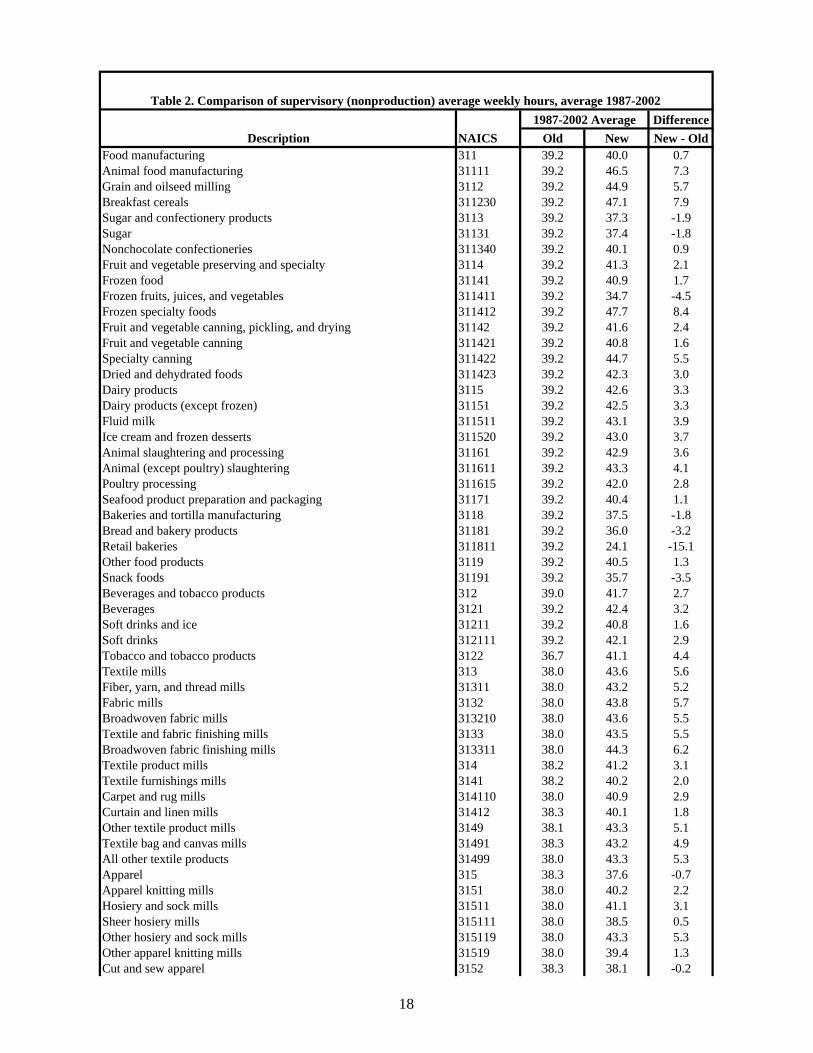
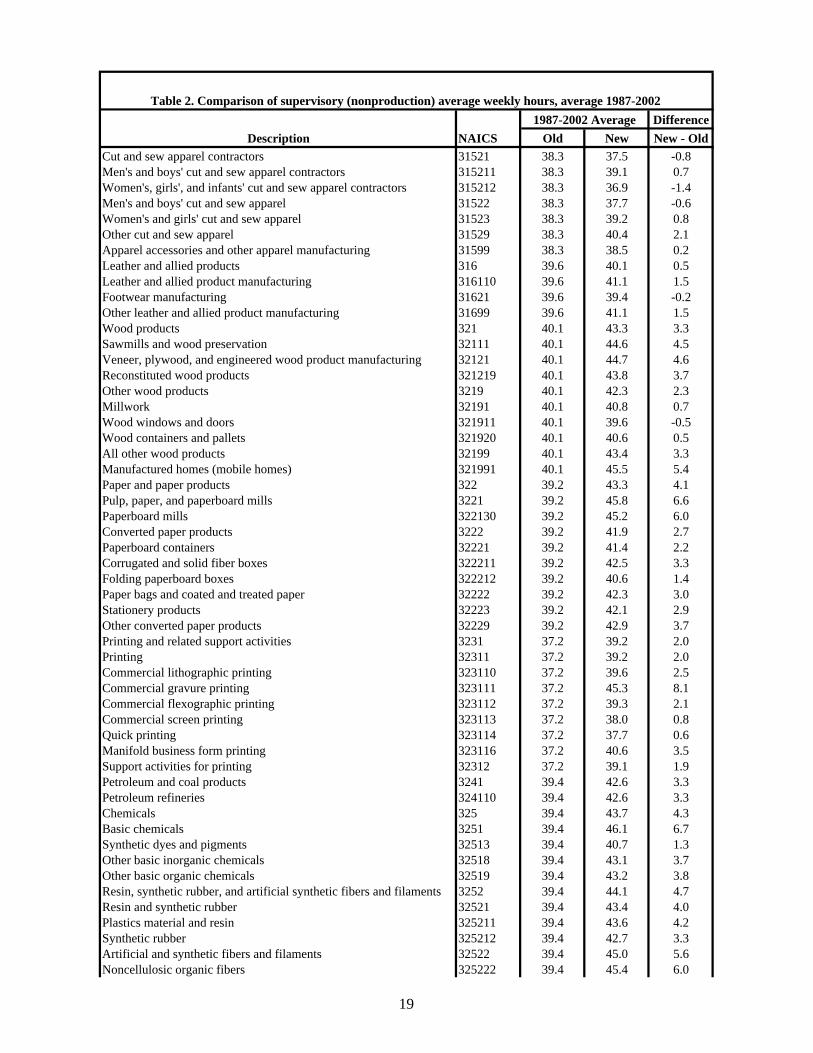
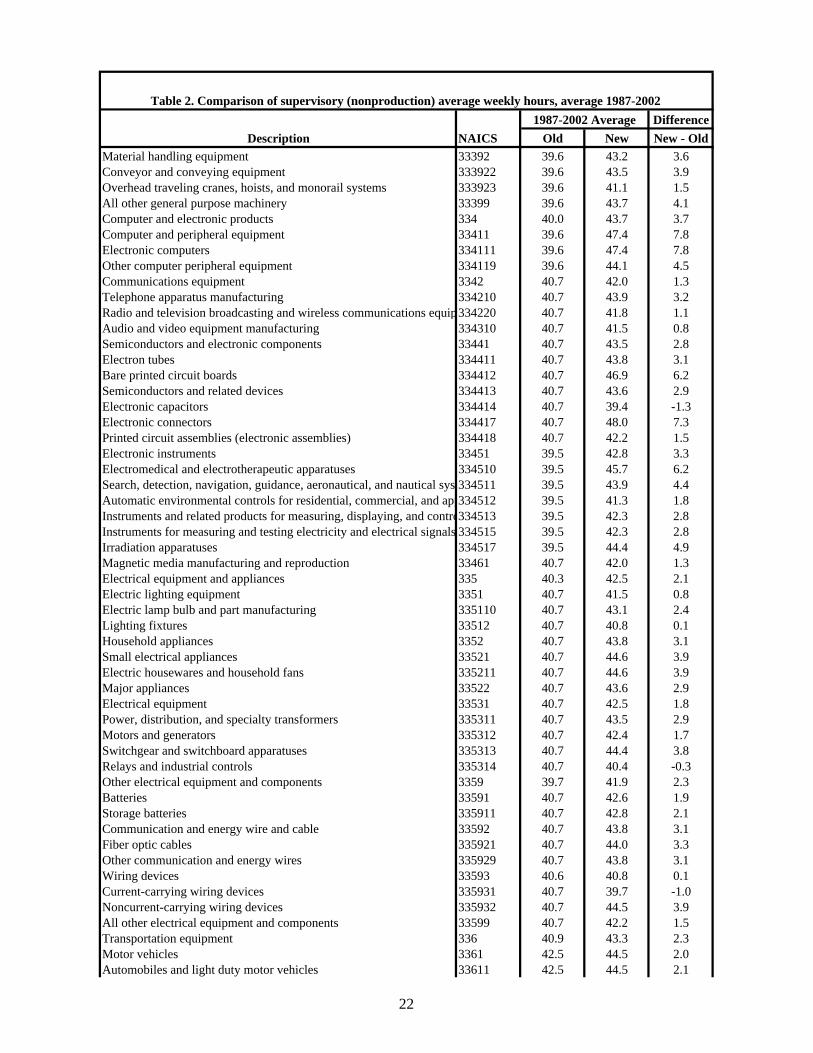
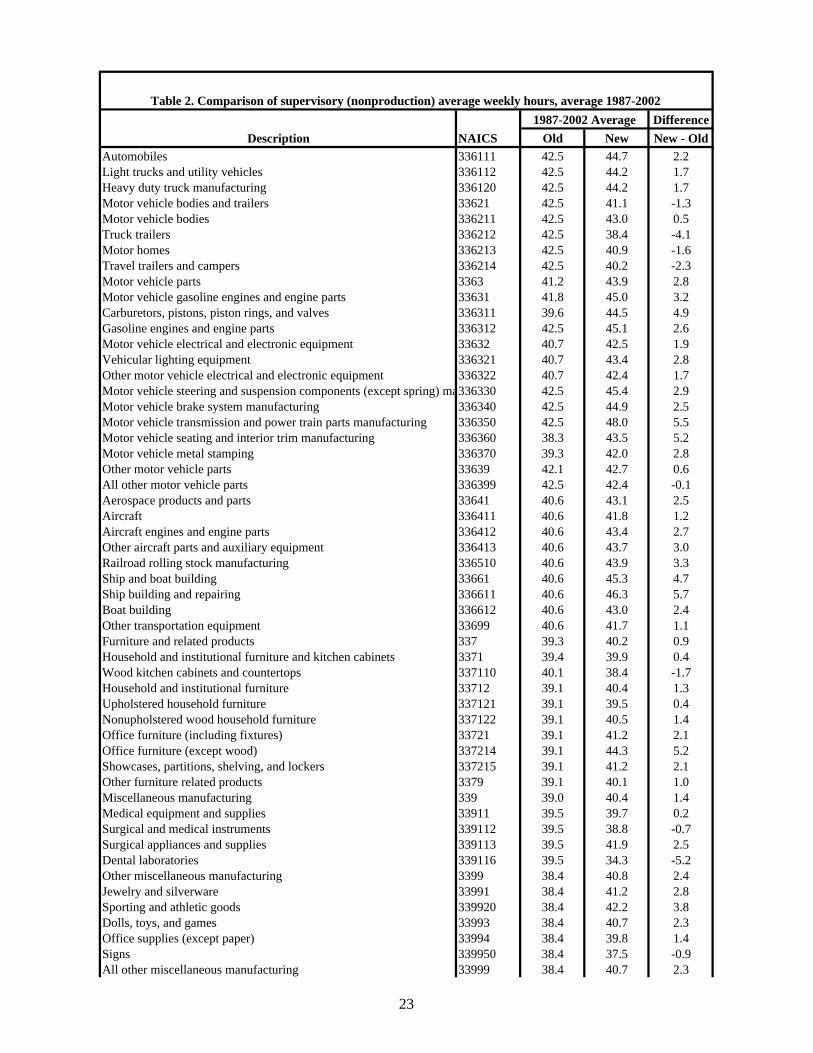
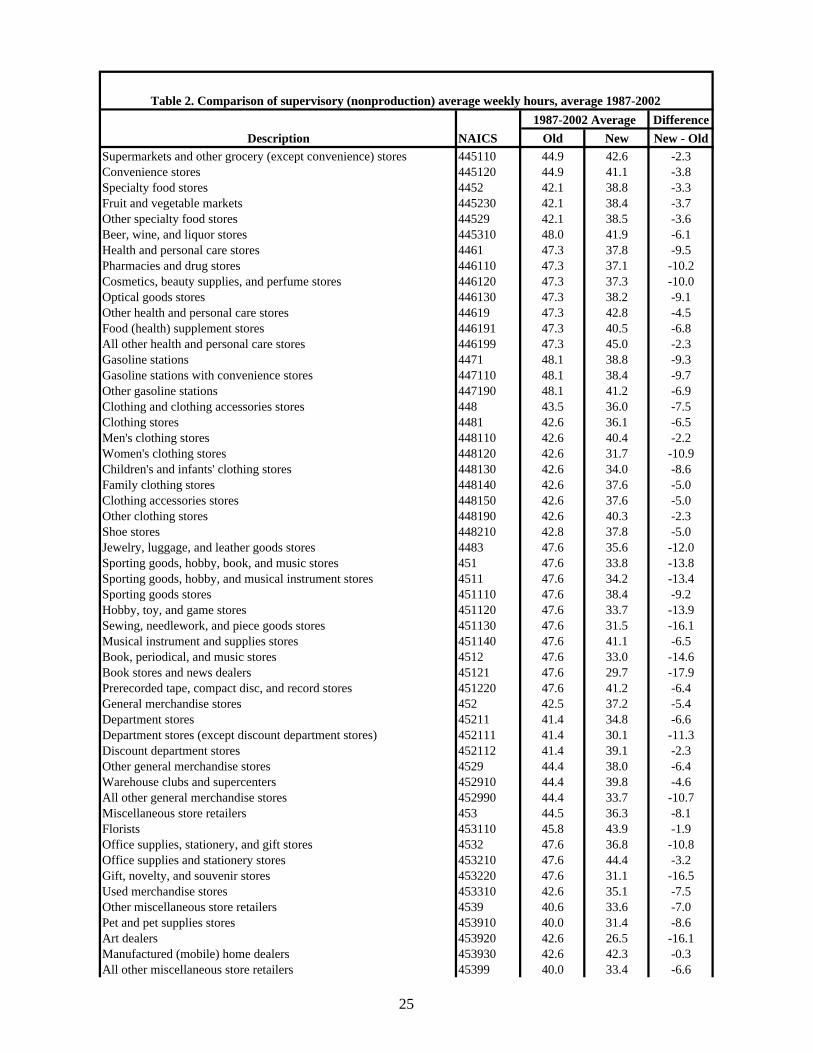
Using the new method for estimating supervisory and nonproduction worker hours changed the average weekly hours levels of these workers in many industries. Table 2 compares the 1987-2002 mean supervisory (nonproduction) worker average weekly hours on the old and new basis for each of 477 unique industries in this study for which the Bureau maintains output per hour measures.3
In general, the new levels of nonproduction worker average weekly hours tend to
be higher than the old levels for goods-producing industries. The new levels of supervisory worker average weekly hours tend to be lower than the old levels for service-providing industries, particularly for industries in retail trade and accommodation and food services. Many of the large revisions in supervisory worker average weekly hours also occurred in service-providing industries, in retail trade in particular. Of the 477 industries, the mean supervisory (nonproduction) worker average weekly hours were revised by 10 hours or more in 27 industries. Of those, 25 (93 percent) were in the service-providing industries and 20 industries (74 percent) were in retail trade.
Effect on Trends in Supervisory and Nonproduction Worker Hours by Industry
The revised supervisory and nonproduction worker average weekly hours also affected the trends in total hours of supervisory and nonproduction workers for many industries.4 Table 3 compares the 1987-2002 average annual percent change in
3 The industries included in this study are those for which estimates of nonproduction or supervisory worker hours previously had been based on the 1977 EEEC survey or the 1980 Census of Population. Industries for which productivity measures were recently developed or that use hours data from an alternate source are excluded from this study. 4 Changes were expected. Since average weekly hours of these workers were previously assumed to be constant, previous trends in the hours of these workers reflected only their employment trends.
6
supervisory and nonproduction worker hours using the old and new average weekly hours estimates. Chart 1 shows the distribution of these changes among the industries for which BLS maintains labor productivity measures. Of the 477 industries in this study for which labor productivity measures are maintained, the impact of the new measures on the trend in the hours of these workers was minor (a difference of plus or minus 0.1 percent or less in the average annual change between 1987 and 2002) for 148 industries (31 percent). For 195 other industries (41 percent), the average annual change in supervisory and nonproduction worker hours was revised from (±) 0.2 to 0.4 percentage points per year. In 134 industries (28 percent) the trend in hours of supervisory and nonproduction workers was revised by (±) 0.5 percentage points per year or more. In 28 of these industries, the average annual percent change in hours of those workers was revised by one percentage point per year or more. Five of the 28 most affected industries were in the retail trade sector (NAICS 44-45), while five were in the information sector (NAICS 51) and another 11 were in the manufacturing sector (NAICS 31-33). Concentration of Supervisory and Nonproduction Workers by Industry The extent to which changes in supervisory and nonproduction worker hours affect total labor hours depends in part on the concentration of supervisory and nonproduction workers in the industry. Table 4 below shows the 1987-2002 average concentration of supervisory and nonproduction workers by industry, based on CES data. In general, the concentration of nonproduction workers in manufacturing industries tends to be higher than the concentration of supervisory workers in service industries. Of the 22 industries where nonproduction or supervisory workers exceeded 50 percent of all workers, twenty-one were in manufacturing. Effect on Trends in Total Labor Hours by Industry
Table 5 below shows the 1987-2002 trend in total hours on a new and old basis, by industry. Because supervisory and nonproduction workers are only a portion of all workers in each industry, trends in total industry hours were less affected than the trends in supervisory or nonproduction worker hours. The average annual percent change in total labor hours for 1987-2002 was revised up or down by 0.2 percentage points or more in 95 of the 477 industries examined. However, changes of 0.5 percentage points per year or more occurred in only 8 industries. The largest revision in total hours growth from 1987 to 2002 was in other electrical equipment and components, NAICS 3359, where average annual hours growth increased by almost 0.9 percentage points. Of the 8 industries where trends in total hours were most impacted, 5 are in the manufacturing sector.
Chart 2 shows the distribution of the revisions to the 1987-2002 average annual percent change in hours that resulted from the adjustment of the supervisory and nonproduction worker average weekly hours series.
7

Conclusions With the construction of new supervisory and nonproduction worker average weekly hours estimates for detailed industries, both the levels and the1987-2002 trends of these series changed for many industries. These changes affected the levels and trends in total supervisory and nonproduction worker hours, which in turn induced changes over the period in total hours of all workers. Change was expected since the previous estimates were based on the assumption that supervisory and nonproduction worker average weekly hours were constant over time.
The trend in hours of supervisory and nonproduction workers was revised by more than half a percentage point per year in about a third of all the industries examined. However, for many industries the new measures did not have a major effect on the trends in total hours. The 1987-2002 average annual percent change in total labor hours was revised up or down by more than 0.5 percentage points in only 8 industries. The impact of the revisions to supervisory or nonproduction worker average weekly hours on the trends in total hours for an industry depended on a variety of factors, including the magnitude of the revisions to supervisory (nonproduction) worker average weekly hours levels, the concentration of supervisory or nonproduction workers in the industry, and the trends in the CPS-based adjustment ratios.
8

DescriptionNAICS Industry
NAICS Industry Reported in CPS 1987 1992 1997 2002
1987-2002 Average
Food manufacturing 311 311 1.01 1.00 1.03 1.03 1.01Animal food manufacturing 31111 3111, 3112 1.01 1.00 1.00 0.98 1.00Grain and oilseed milling 3112 3111, 3112 1.01 1.00 1.00 0.98 1.00Breakfast cereals 311230 3111, 3112 1.01 1.00 1.00 0.98 1.00Sugar and confectionery products 3113 3113 0.99 1.04 0.95 1.03 1.02Sugar 31131 3113 0.99 1.04 0.95 1.03 1.02Nonchocolate confectioneries 311340 3113 0.99 1.04 0.95 1.03 1.02Fruit and vegetable preserving and specia 3114 3114 1.05 1.05 1.13 1.09 1.07Frozen food 31141 3114 1.05 1.05 1.13 1.09 1.07Frozen fruits, juices, and vegetables 311411 3114 1.05 1.05 1.13 1.09 1.07Frozen specialty foods 311412 3114 1.05 1.05 1.13 1.09 1.07Fruit and vegetable canning, pickling, and31142 3114 1.05 1.05 1.13 1.09 1.07Fruit and vegetable canning 311421 3114 1.05 1.05 1.13 1.09 1.07Specialty canning 311422 3114 1.05 1.05 1.13 1.09 1.07Dried and dehydrated foods 311423 3114 1.05 1.05 1.13 1.09 1.07Dairy products 3115 3115 1.01 1.02 1.01 1.10 1.02Dairy products (except frozen) 31151 3115 1.01 1.02 1.01 1.10 1.02Fluid milk 311511 3115 1.01 1.02 1.01 1.10 1.02Ice cream and frozen desserts 311520 3115 1.01 1.02 1.01 1.10 1.02Animal slaughtering and processing 31161 3116 1.11 1.06 1.07 1.07 1.06Animal (except poultry) slaughtering 311611 3116 1.11 1.06 1.07 1.07 1.06Poultry processing 311615 3116 1.11 1.06 1.07 1.07 1.06Seafood product preparation and packagin31171 3117, 3119 1.04 1.04 1.09 1.05 1.05Bakeries and tortilla manufacturing 3118 311 1.01 1.00 1.03 1.03 1.01Bread and bakery products 31181 311 1.01 1.00 1.03 1.03 1.01Retail bakeries 311811 311811 0.89 0.88 0.93 0.88 0.88Other food products 3119 3117, 3119 1.04 1.04 1.09 1.05 1.05Snack foods 31191 3117, 3119 1.04 1.04 1.09 1.05 1.05Beverages and tobacco products 312 312 1.06 1.07 1.05 1.02 1.05Beverages 3121 3121 1.08 1.09 1.08 1.03 1.07Soft drinks and ice 31211 3121 1.08 1.09 1.08 1.03 1.07Soft drinks 312111 3121 1.08 1.09 1.08 1.03 1.07Tobacco and tobacco products 3122 312 1.06 1.07 1.05 1.02 1.05Textile mills 313 313, 315 1.05 1.08 1.06 1.05 1.06Fiber, yarn, and thread mills 31311 313, 315 1.05 1.08 1.06 1.05 1.06Fabric mills 3132 313, 315 1.05 1.08 1.06 1.05 1.06Broadwoven fabric mills 313210 3132 exc 31324 0.99 1.03 1.02 1.02 1.02Textile and fabric finishing mills 3133 313, 315 1.05 1.08 1.06 1.05 1.06Broadwoven fabric finishing mills 313311 313, 315 1.05 1.08 1.06 1.05 1.06Textile product mills 314 314 1.04 1.06 1.06 1.03 1.05Textile furnishings mills 3141 314 1.04 1.06 1.06 1.03 1.05Carpet and rug mills 314110 314 1.04 1.06 1.06 1.03 1.05Curtain and linen mills 31412 314 exc 31411 1.05 1.08 1.06 1.02 1.06Other textile product mills 3149 314 exc 31411 1.05 1.08 1.06 1.02 1.06Textile bag and canvas mills 31491 314 exc 31411 1.05 1.08 1.06 1.02 1.06All other textile products 31499 314 exc 31411 1.05 1.08 1.06 1.02 1.06Apparel 315 313, 315 1.05 1.08 1.06 1.05 1.06Apparel knitting mills 3151 313, 315 1.05 1.08 1.06 1.05 1.06Hosiery and sock mills 31511 313, 315 1.05 1.08 1.06 1.05 1.06Sheer hosiery mills 315111 313, 315 1.05 1.08 1.06 1.05 1.06Other hosiery and sock mills 315119 313, 315 1.05 1.08 1.06 1.05 1.06Other apparel knitting mills 31519 313, 315 1.05 1.08 1.06 1.05 1.06Cut and sew apparel 3152 3152 1.07 1.11 1.08 1.08 1.09Cut and sew apparel contractors 31521 3152 1.07 1.11 1.08 1.08 1.09Men's and boys' cut and sew apparel contr315211 3152 1.07 1.11 1.08 1.08 1.09Women's, girls', and infants' cut and sew a315212 3152 1.07 1.11 1.08 1.08 1.09Men's and boys' cut and sew apparel 31522 3152 1.07 1.11 1.08 1.08 1.09Women's and girls' cut and sew apparel 31523 3152 1.07 1.11 1.08 1.08 1.09Other cut and sew apparel 31529 3152 1.07 1.11 1.08 1.08 1.09
Table 1. Ratios of supervisory (nonproduction) worker average weekly hours to nonsupervisory (production) worker average weekly hours; selected years and 1987-2002 average
9

DescriptionNAICS Industry
NAICS Industry Reported in CPS 1987 1992 1997 2002
1987-2002 Average
Table 1. Ratios of supervisory (nonproduction) worker average weekly hours to nonsupervisory (production) worker average weekly hours; selected years and 1987-2002 average
Apparel accessories and other apparel man31599 313, 315 1.05 1.08 1.06 1.05 1.06Leather and allied products 316 316 1.05 1.06 1.13 0.99 1.06Leather and allied product manufacturing 316110 316 1.05 1.06 1.13 0.99 1.06Footwear manufacturing 31621 316 1.05 1.06 1.13 0.99 1.06Other leather and allied product manufact 31699 316 1.05 1.06 1.13 0.99 1.06Wood products 321 321 1.05 1.08 1.04 1.04 1.06Sawmills and wood preservation 32111 3211 1.03 1.08 1.03 1.06 1.06Veneer, plywood, and engineered wood p 32121 321 1.05 1.08 1.04 1.04 1.06Reconstituted wood products 321219 321 1.05 1.08 1.04 1.04 1.06Other wood products 3219 321 1.05 1.08 1.04 1.04 1.06Millwork 32191 3219 exc 321991,
3219921.03 1.04 1.00 1.02 1.03
Wood windows and doors 321911 3219 exc 321991, 321992
1.03 1.04 1.00 1.02 1.03
Wood containers and pallets 321920 3219 exc 321991, 321992
1.03 1.04 1.00 1.02 1.03
All other wood products 32199 321 1.05 1.08 1.04 1.04 1.06Manufactured homes (mobile homes) 321991 321 1.05 1.08 1.04 1.04 1.06Paper and paper products 322 322 0.99 0.98 0.97 1.03 1.00Pulp, paper, and paperboard mills 3221 3221 0.98 0.98 0.96 1.03 0.99Paperboard mills 322130 3221 0.98 0.98 0.96 1.03 0.99Converted paper products 3222 322 0.99 0.98 0.97 1.03 1.00Paperboard containers 32221 32221 0.96 0.94 0.96 1.01 0.98Corrugated and solid fiber boxes 322211 32221 0.96 0.94 0.96 1.01 0.98Folding paperboard boxes 322212 32221 0.96 0.94 0.96 1.01 0.98Paper bags and coated and treated paper 32222 32222, 32223,
322291.02 1.01 0.99 1.03 1.01
Stationery products 32223 32222, 32223, 32229
1.02 1.01 0.99 1.03 1.01
Other converted paper products 32229 32222, 32223, 32229
1.02 1.01 0.99 1.03 1.01
Printing and related support activities 3231 3231 0.98 1.01 1.01 1.03 1.00Printing 32311 3231 0.98 1.01 1.01 1.03 1.00Commercial lithographic printing 323110 3231 0.98 1.01 1.01 1.03 1.00Commercial gravure printing 323111 3231 0.98 1.01 1.01 1.03 1.00Commercial flexographic printing 323112 3231 0.98 1.01 1.01 1.03 1.00Commercial screen printing 323113 3231 0.98 1.01 1.01 1.03 1.00Quick printing 323114 3231 0.98 1.01 1.01 1.03 1.00Manifold business form printing 323116 3231 0.98 1.01 1.01 1.03 1.00Support activities for printing 32312 3231 0.98 1.01 1.01 1.03 1.00Petroleum and coal products 3241 324 0.98 0.96 0.98 0.96 0.98Petroleum refineries 324110 32411 0.98 0.96 0.97 0.96 0.98Chemicals 325 325 1.00 1.01 1.03 1.03 1.02Basic chemicals 3251 3251, 3259 0.98 0.97 0.99 0.99 0.99Synthetic dyes and pigments 32513 3251, 3259 0.98 0.97 0.99 0.99 0.99Other basic inorganic chemicals 32518 3251, 3259 0.98 0.97 0.99 0.99 0.99Other basic organic chemicals 32519 3251, 3259 0.98 0.97 0.99 0.99 0.99Resin, synthetic rubber, and artificial synt 3252 325 1.00 1.01 1.03 1.03 1.02Resin and synthetic rubber 32521 325 1.00 1.01 1.03 1.03 1.02Plastics material and resin 325211 325 1.00 1.01 1.03 1.03 1.02Synthetic rubber 325212 325 1.00 1.01 1.03 1.03 1.02Artificial and synthetic fibers and filamen 32522 325 1.00 1.01 1.03 1.03 1.02Noncellulosic organic fibers 325222 325 1.00 1.01 1.03 1.03 1.02Pesticides, fertilizers, and other agricultur 3253 325 1.00 1.01 1.03 1.03 1.02Pharmaceuticals and medicine 32541 3254 1.04 1.06 1.06 1.07 1.06Pharmaceutical preparations 325412 3254 1.04 1.06 1.06 1.07 1.06Paint, coatings, and adhesives 3255 325 1.00 1.01 1.03 1.03 1.02Paint and coatings 325510 325 1.00 1.01 1.03 1.03 1.02Soaps, cleaning compounds, and toilet pre3256 3256 1.01 1.03 1.08 1.03 1.03
10
DescriptionNAICS Industry
NAICS Industry Reported in CPS 1987 1992 1997 2002
1987-2002 Average
Table 1. Ratios of supervisory (nonproduction) worker average weekly hours to nonsupervisory (production) worker average weekly hours; selected years and 1987-2002 average
Soaps and cleaning compounds 32561 3256 1.01 1.03 1.08 1.03 1.03Soaps and other detergents 325611 3256 1.01 1.03 1.08 1.03 1.03Toilet preparations 325620 3256 1.01 1.03 1.08 1.03 1.03Other chemical products and preparations 3259 3251, 3259 0.98 0.97 0.99 0.99 0.99Plastics and rubber products 326 326 1.03 1.03 1.04 1.04 1.04Plastics products 3261 3261 1.02 1.03 1.05 1.04 1.04Plastics packaging materials and unlamina32611 3261 1.02 1.03 1.05 1.04 1.04Unlaminated plastics film and sheets (exc 326113 3261 1.02 1.03 1.05 1.04 1.04Plastics pipes, pipe fittings, and unlaminat32612 3261 1.02 1.03 1.05 1.04 1.04Unlaminated plastics profile shapes 326121 3261 1.02 1.03 1.05 1.04 1.04Plastics pipes and pipe fittings 326122 3261 1.02 1.03 1.05 1.04 1.04Other plastics products 32619 3261 1.02 1.03 1.05 1.04 1.04Rubber products 3262 326 1.03 1.03 1.04 1.04 1.04Tires 32621 32621 1.05 1.02 0.98 1.04 1.03Rubber and plastics hoses and belting 326220 32622, 32629 1.02 1.03 1.02 1.04 1.02Other rubber products 32629 32622, 32629 1.02 1.03 1.02 1.04 1.02Rubber products for mechanical use 326291 32622, 32629 1.02 1.03 1.02 1.04 1.02All other rubber products 326299 32622, 32629 1.02 1.03 1.02 1.04 1.02Nonmetallic mineral products 327 327 1.03 1.02 1.02 1.02 1.03Clay products and refractories 3271 327 1.03 1.02 1.02 1.02 1.03Pottery, ceramics, and plumbing fixtures 32711 327 1.03 1.02 1.02 1.02 1.03Clay building materials and refractories 32712 327 1.03 1.02 1.02 1.02 1.03Glass and glass products 32721 3272 1.05 1.00 0.97 1.02 1.03Flat glass 327211 3272 1.05 1.00 0.97 1.02 1.03Other pressed and blown glass and glassw327212 3272 1.05 1.00 0.97 1.02 1.03Glass containers 327213 3272 1.05 1.00 0.97 1.02 1.03Glass products made of purchased glass 327215 3272 1.05 1.00 0.97 1.02 1.03Cement and concrete products 3273 3273, 3274 1.01 1.05 1.08 1.04 1.03Ready-mix concrete 327320 3273, 3274 1.01 1.05 1.08 1.04 1.03Lime and gypsum products 3274 3273, 3274 1.01 1.05 1.08 1.04 1.03Other nonmetallic mineral products 3279 327 1.03 1.02 1.02 1.02 1.03Primary metals 331 331 0.99 0.99 1.00 1.00 0.99Iron and steel mills and ferroalloy product33111 3311, 3312 0.98 0.98 1.01 1.00 0.99Steel products from purchased steel 3312 3311, 3312 0.98 0.98 1.01 1.00 0.99Iron and steel pipes and tubes from purcha331210 3311, 3312 0.98 0.98 1.01 1.00 0.99Rolling and drawing of purchased steel 33122 3311, 3312 0.98 0.98 1.01 1.00 0.99Rolled steel shapes 331221 3311, 3312 0.98 0.98 1.01 1.00 0.99Alumina and aluminum production and pr33131 3313 1.02 1.02 0.96 0.99 1.00Aluminum sheets, plates, and foil 331315 3313 1.02 1.02 0.96 0.99 1.00Nonferrous metal (except aluminum) prod3314 331 0.99 0.99 1.00 1.00 0.99Nonferrous metal (except aluminum) sme 33141 331 0.99 0.99 1.00 1.00 0.99Copper rolling, drawing, extruding, and al33142 331 0.99 0.99 1.00 1.00 0.99Nonferrous metal (except copper and alum33149 331 0.99 0.99 1.00 1.00 0.99Foundries 3315 3315 0.96 0.99 0.97 0.99 0.98Ferrous metal foundries 33151 3315 0.96 0.99 0.97 0.99 0.98Iron foundries 331511 3315 0.96 0.99 0.97 0.99 0.98Nonferrous metal foundries 33152 3315 0.96 0.99 0.97 0.99 0.98Fabricated metal products 332 332 0.99 1.00 0.98 1.01 1.00Forging and stamping 33211 332 0.99 1.00 0.98 1.01 1.00Iron and steel forging 332111 332 0.99 1.00 0.98 1.01 1.00Metal stamping 332116 332 0.99 1.00 0.98 1.01 1.00Cutlery and handtools 33221 332 0.99 1.00 0.98 1.01 1.00Hand and edge tools 332212 332 0.99 1.00 0.98 1.01 1.00Architectural and structural metals 3323 3323, 3324 0.99 1.00 0.99 1.00 1.00Plate work and fabricated structural produ33231 3323, 3324 0.99 1.00 0.99 1.00 1.00Prefabricated metal building and compone332311 3323, 3324 0.99 1.00 0.99 1.00 1.00Fabricated structural metals 332312 3323, 3324 0.99 1.00 0.99 1.00 1.00Plate work 332313 3323, 3324 0.99 1.00 0.99 1.00 1.00Ornamental and architectural metal produ 33232 3323, 3324 0.99 1.00 0.99 1.00 1.00
11
DescriptionNAICS Industry
NAICS Industry Reported in CPS 1987 1992 1997 2002
1987-2002 Average
Table 1. Ratios of supervisory (nonproduction) worker average weekly hours to nonsupervisory (production) worker average weekly hours; selected years and 1987-2002 average
Metal windows and doors 332321 3323, 3324 0.99 1.00 0.99 1.00 1.00Sheet metal work 332322 3323, 3324 0.99 1.00 0.99 1.00 1.00Ornamental and architectural metal work 332323 3323, 3324 0.99 1.00 0.99 1.00 1.00Boilers, tanks, and shipping containers 3324 3323, 3324 0.99 1.00 0.99 1.00 1.00Hardware 332510 3325, 3326, 3329
exc 332992, 332993, 332994, 332995
1.02 1.03 1.01 1.03 1.03
Spring and wire products 33261 3325, 3326, 3329 exc 332992, 332993, 332994, 332995
1.02 1.03 1.01 1.03 1.03
Machine shops; turned products; and screw3327 3327 0.98 0.99 0.98 1.02 0.99Machine shops 332710 3327 0.98 0.99 0.98 1.02 0.99Turned products and screws, nuts, and bol33272 3327 0.98 0.99 0.98 1.02 0.99Precision turned products 332721 3327 0.98 0.99 0.98 1.02 0.99Bolts, nuts, screws, rivets, and washers 332722 3327 0.98 0.99 0.98 1.02 0.99Coating, engraving, heat treating, and allie33281 3328 0.98 0.98 0.95 0.98 0.99Electroplating, plating, polishing, anodizin332813 3328 0.98 0.98 0.95 0.98 0.99Other fabricated metal products 3329 332 0.99 1.00 0.98 1.01 1.00Metal valves 33291 3325, 3326, 3329
exc 332992, 332993, 332994, 332995
1.02 1.03 1.01 1.03 1.03
Fluid power valves and hose fittings 332912 3325, 3326, 3329 exc 332992, 332993, 332994, 332995
1.02 1.03 1.01 1.03 1.03
Plumbing fixture fittings and trim 332913 3325, 3326, 3329 exc 332992, 332993, 332994, 332995
1.02 1.03 1.01 1.03 1.03
All other fabricated metal products 33299 332 0.99 1.00 0.98 1.01 1.00Ball and roller bearings 332991 3325, 3326, 3329
exc 332992, 332993, 332994, 332995
1.02 1.03 1.01 1.03 1.03
Machinery 333 333 1.00 1.03 1.00 1.03 1.02Agriculture, construction, and mining mac3331 333 1.00 1.03 1.00 1.03 1.02Agricultural implements 33311 33311 0.97 1.05 0.96 1.00 1.00Farm machinery and equipment 333111 33311 0.97 1.05 0.96 1.00 1.00Lawn and garden tractors and home lawn 333112 33311 0.97 1.05 0.96 1.00 1.00Construction machinery 333120 33312, 33313 1.02 1.02 1.00 1.04 1.02Mining and oil and gas field machinery 33313 33312, 33313 1.02 1.02 1.00 1.04 1.02Industrial machinery 3332 3332, 3334, 3339 1.01 1.02 1.01 1.04 1.02Semiconductor machinery 333295 3332, 3334, 3339 1.01 1.02 1.01 1.04 1.02Commercial and service industry machine33331 3333 1.01 1.03 1.03 1.04 1.04Office machinery 333313 3333 1.01 1.03 1.03 1.04 1.04Photographic and photocopying equipmen333315 3333 1.01 1.03 1.03 1.04 1.04HVAC and commercial refrigeration equi 33341 3332, 3334, 3339 1.01 1.02 1.01 1.04 1.02Air-conditioning and warm air heating equ333415 3332, 3334, 3339 1.01 1.02 1.01 1.04 1.02Metalworking machinery 33351 3335 0.99 1.02 0.98 1.03 1.00Industrial molds 333511 3335 0.99 1.02 0.98 1.03 1.00Special dies and tools, die sets, jigs, and f 333514 3335 0.99 1.02 0.98 1.03 1.00Turbine and power transmission equipmen33361 333 1.00 1.03 1.00 1.03 1.02Turbines and turbine generator set units 333611 333 1.00 1.03 1.00 1.03 1.02Other general purpose machinery 3339 3332, 3334, 3339 1.01 1.02 1.01 1.04 1.02Pumps and compressors 33391 3332, 3334, 3339 1.01 1.02 1.01 1.04 1.02Air and gas compressors 333912 3332, 3334, 3339 1.01 1.02 1.01 1.04 1.02
12

DescriptionNAICS Industry
NAICS Industry Reported in CPS 1987 1992 1997 2002
1987-2002 Average
Table 1. Ratios of supervisory (nonproduction) worker average weekly hours to nonsupervisory (production) worker average weekly hours; selected years and 1987-2002 average
Material handling equipment 33392 3332, 3334, 3339 1.01 1.02 1.01 1.04 1.02Conveyor and conveying equipment 333922 3332, 3334, 3339 1.01 1.02 1.01 1.04 1.02Overhead traveling cranes, hoists, and mo333923 3332, 3334, 3339 1.01 1.02 1.01 1.04 1.02All other general purpose machinery 33399 3332, 3334, 3339 1.01 1.02 1.01 1.04 1.02Computer and electronic products 334 334 1.04 1.05 1.06 1.06 1.06Computer and peripheral equipment 33411 3341 1.05 1.06 1.08 1.08 1.07Electronic computers 334111 3341 1.05 1.06 1.08 1.08 1.07Other computer peripheral equipment 334119 3341 1.05 1.06 1.08 1.08 1.07Communications equipment 3342 3342, 3343 1.01 1.03 1.05 1.05 1.03Telephone apparatus manufacturing 334210 3342, 3343 1.01 1.03 1.05 1.05 1.03Radio and television broadcasting and wir334220 3342, 3343 1.01 1.03 1.05 1.05 1.03Audio and video equipment manufacturin 334310 3342, 3343 1.01 1.03 1.05 1.05 1.03Semiconductors and electronic componen 33441 3344, 3346 1.04 1.05 1.06 1.06 1.06Electron tubes 334411 3344, 3346 1.04 1.05 1.06 1.06 1.06Bare printed circuit boards 334412 3344, 3346 1.04 1.05 1.06 1.06 1.06Semiconductors and related devices 334413 3344, 3346 1.04 1.05 1.06 1.06 1.06Electronic capacitors 334414 3344, 3346 1.04 1.05 1.06 1.06 1.06Electronic connectors 334417 3344, 3346 1.04 1.05 1.06 1.06 1.06Printed circuit assemblies (electronic asse 334418 3344, 3346 1.04 1.05 1.06 1.06 1.06Electronic instruments 33451 3345 1.02 1.03 1.05 1.03 1.04Electromedical and electrotherapeutic app334510 3345 1.02 1.03 1.05 1.03 1.04Search, detection, navigation, guidance, a 334511 3345 1.02 1.03 1.05 1.03 1.04Automatic environmental controls for resi334512 3345 1.02 1.03 1.05 1.03 1.04Instruments and related products for meas334513 3345 1.02 1.03 1.05 1.03 1.04Instruments for measuring and testing elec334515 3345 1.02 1.03 1.05 1.03 1.04Irradiation apparatuses 334517 3345 1.02 1.03 1.05 1.03 1.04Magnetic media manufacturing and reprod33461 3344, 3346 1.04 1.05 1.06 1.06 1.06Electrical equipment and appliances 335 335 1.00 1.02 1.02 1.03 1.02Electric lighting equipment 3351 3351, 3353, 3359 1.00 1.01 1.02 1.03 1.02Electric lamp bulb and part manufacturing335110 3351, 3353, 3359 1.00 1.01 1.02 1.03 1.02Lighting fixtures 33512 3351, 3353, 3359 1.00 1.01 1.02 1.03 1.02Household appliances 3352 3352 1.01 1.03 1.01 1.05 1.04Small electrical appliances 33521 3352 1.01 1.03 1.01 1.05 1.04Electric housewares and household fans 335211 3352 1.01 1.03 1.01 1.05 1.04Major appliances 33522 3352 1.01 1.03 1.01 1.05 1.04Electrical equipment 33531 3351, 3353, 3359 1.00 1.01 1.02 1.03 1.02Power, distribution, and specialty transfor335311 3351, 3353, 3359 1.00 1.01 1.02 1.03 1.02Motors and generators 335312 3351, 3353, 3359 1.00 1.01 1.02 1.03 1.02Switchgear and switchboard apparatuses 335313 3351, 3353, 3359 1.00 1.01 1.02 1.03 1.02Relays and industrial controls 335314 3351, 3353, 3359 1.00 1.01 1.02 1.03 1.02Other electrical equipment and componen3359 3351, 3353, 3359 1.00 1.01 1.02 1.03 1.02Batteries 33591 3351, 3353, 3359 1.00 1.01 1.02 1.03 1.02Storage batteries 335911 3351, 3353, 3359 1.00 1.01 1.02 1.03 1.02Communication and energy wire and cabl 33592 3351, 3353, 3359 1.00 1.01 1.02 1.03 1.02Fiber optic cables 335921 3351, 3353, 3359 1.00 1.01 1.02 1.03 1.02Other communication and energy wires 335929 3351, 3353, 3359 1.00 1.01 1.02 1.03 1.02Wiring devices 33593 3351, 3353, 3359 1.00 1.01 1.02 1.03 1.02Current-carrying wiring devices 335931 3351, 3353, 3359 1.00 1.01 1.02 1.03 1.02Noncurrent-carrying wiring devices 335932 3351, 3353, 3359 1.00 1.01 1.02 1.03 1.02All other electrical equipment and compon33599 3351, 3353, 3359 1.00 1.01 1.02 1.03 1.02Transportation equipment 336 336 0.99 1.01 1.00 1.02 1.01Motor vehicles 3361 3361, 3362, 3363 1.00 1.03 1.01 1.04 1.02Automobiles and light duty motor vehicle 33611 3361, 3362, 3363 1.00 1.03 1.01 1.04 1.02Automobiles 336111 3361, 3362, 3363 1.00 1.03 1.01 1.04 1.02Light trucks and utility vehicles 336112 3361, 3362, 3363 1.00 1.03 1.01 1.04 1.02Heavy duty truck manufacturing 336120 3361, 3362, 3363 1.00 1.03 1.01 1.04 1.02Motor vehicle bodies and trailers 33621 3361, 3362, 3363 1.00 1.03 1.01 1.04 1.02Motor vehicle bodies 336211 3361, 3362, 3363 1.00 1.03 1.01 1.04 1.02Truck trailers 336212 3361, 3362, 3363 1.00 1.03 1.01 1.04 1.02
13
DescriptionNAICS Industry
NAICS Industry Reported in CPS 1987 1992 1997 2002
1987-2002 Average
Table 1. Ratios of supervisory (nonproduction) worker average weekly hours to nonsupervisory (production) worker average weekly hours; selected years and 1987-2002 average
Motor homes 336213 3361, 3362, 3363 1.00 1.03 1.01 1.04 1.02Travel trailers and campers 336214 3361, 3362, 3363 1.00 1.03 1.01 1.04 1.02Motor vehicle parts 3363 3361, 3362, 3363 1.00 1.03 1.01 1.04 1.02Motor vehicle gasoline engines and engin 33631 3361, 3362, 3363 1.00 1.03 1.01 1.04 1.02Carburetors, pistons, piston rings, and val 336311 3361, 3362, 3363 1.00 1.03 1.01 1.04 1.02Gasoline engines and engine parts 336312 3361, 3362, 3363 1.00 1.03 1.01 1.04 1.02Motor vehicle electrical and electronic equ33632 3361, 3362, 3363 1.00 1.03 1.01 1.04 1.02Vehicular lighting equipment 336321 3361, 3362, 3363 1.00 1.03 1.01 1.04 1.02Other motor vehicle electrical and electron336322 3361, 3362, 3363 1.00 1.03 1.01 1.04 1.02Motor vehicle steering and suspension com336330 3361, 3362, 3363 1.00 1.03 1.01 1.04 1.02Motor vehicle brake system manufacturin 336340 3361, 3362, 3363 1.00 1.03 1.01 1.04 1.02Motor vehicle transmission and power tra 336350 3361, 3362, 3363 1.00 1.03 1.01 1.04 1.02Motor vehicle seating and interior trim ma336360 3361, 3362, 3363 1.00 1.03 1.01 1.04 1.02Motor vehicle metal stamping 336370 3361, 3362, 3363 1.00 1.03 1.01 1.04 1.02Other motor vehicle parts 33639 3361, 3362, 3363 1.00 1.03 1.01 1.04 1.02All other motor vehicle parts 336399 3361, 3362, 3363 1.00 1.03 1.01 1.04 1.02Aerospace products and parts 33641 336 0.99 1.01 1.00 1.02 1.01Aircraft 336411 336411 - 336413 0.98 0.99 0.97 1.01 0.99Aircraft engines and engine parts 336412 336411 - 336413 0.98 0.99 0.97 1.01 0.99Other aircraft parts and auxiliary equipme336413 336411 - 336413 0.98 0.99 0.97 1.01 0.99Railroad rolling stock manufacturing 336510 336 0.99 1.01 1.00 1.02 1.01Ship and boat building 33661 3366 1.03 1.00 0.99 1.02 1.02Ship building and repairing 336611 3366 1.03 1.00 0.99 1.02 1.02Boat building 336612 3366 1.03 1.00 0.99 1.02 1.02Other transportation equipment 33699 336 0.99 1.01 1.00 1.02 1.01Furniture and related products 337 337 1.06 1.06 1.04 1.03 1.04Household and institutional furniture and 3371 337 1.06 1.06 1.04 1.03 1.04Wood kitchen cabinets and countertops 337110 337 1.06 1.06 1.04 1.03 1.04Household and institutional furniture 33712 337 1.06 1.06 1.04 1.03 1.04Upholstered household furniture 337121 337 1.06 1.06 1.04 1.03 1.04Nonupholstered wood household furniture337122 337 1.06 1.06 1.04 1.03 1.04Office furniture (including fixtures) 33721 337 1.06 1.06 1.04 1.03 1.04Office furniture (except wood) 337214 337 1.06 1.06 1.04 1.03 1.04Showcases, partitions, shelving, and locke337215 337 1.06 1.06 1.04 1.03 1.04Other furniture related products 3379 337 1.06 1.06 1.04 1.03 1.04Miscellaneous manufacturing 339 339 1.01 1.03 1.04 1.05 1.03Medical equipment and supplies 33911 3391 1.01 1.03 1.06 1.08 1.04Surgical and medical instruments 339112 3391 1.01 1.03 1.06 1.08 1.04Surgical appliances and supplies 339113 3391 1.01 1.03 1.06 1.08 1.04Dental laboratories 339116 3391 1.01 1.03 1.06 1.08 1.04Other miscellaneous manufacturing 3399 339 1.01 1.03 1.04 1.05 1.03Jewelry and silverware 33991 3399 exc 33992,
339931.01 1.01 1.03 1.02 1.02
Sporting and athletic goods 339920 33992, 33993 1.03 1.06 1.03 1.07 1.04Dolls, toys, and games 33993 33992, 33993 1.03 1.06 1.03 1.07 1.04Office supplies (except paper) 33994 3399 exc 33992,
339931.01 1.01 1.03 1.02 1.02
Signs 339950 3399 exc 33992, 33993
1.01 1.01 1.03 1.02 1.02
All other miscellaneous manufacturing 33999 3399 exc 33992, 33993
1.01 1.01 1.03 1.02 1.02
Durable goods 423 423 1.07 1.06 1.07 1.06 1.06Motor vehicles and parts 4231 4231 1.12 1.10 1.10 1.11 1.09Furniture and furnishings 4232 4232 1.07 1.12 1.10 1.08 1.09Lumber and construction supplies 4233 4233 1.02 1.02 1.06 1.01 1.03Commercial equipment 4234 4234 1.09 1.07 1.07 1.08 1.09Metals and minerals 4235 423 1.07 1.06 1.07 1.06 1.06Electrical and electronic goods 4236 4236 1.07 1.05 1.08 1.06 1.07Hardware and plumbing 4237 4237 1.01 1.01 1.04 1.03 1.02
14
DescriptionNAICS Industry
NAICS Industry Reported in CPS 1987 1992 1997 2002
1987-2002 Average
Table 1. Ratios of supervisory (nonproduction) worker average weekly hours to nonsupervisory (production) worker average weekly hours; selected years and 1987-2002 average
Machinery and supplies 4238 4238 1.04 1.03 1.03 1.03 1.03Miscellaneous durable goods 4239 423 1.07 1.06 1.07 1.06 1.06Nondurable Goods 424 424 1.09 1.08 1.09 1.08 1.08Paper and paper products 4241 4241 1.00 0.94 0.96 1.05 0.99Druggists' goods 424210 4242, 4246 1.08 1.10 1.07 1.08 1.08Apparel and piece goods 4243 4243 1.20 1.24 1.23 1.21 1.22Grocery and related products 4244 4244 1.08 1.06 1.11 1.09 1.07Farm product raw materials 4245 4245 1.23 1.13 1.02 1.04 1.12Chemicals 4246 4242, 4246 1.08 1.10 1.07 1.08 1.08Petroleum 4247 4247 1.08 1.08 1.06 1.06 1.09Alcoholic beverages 4248 4248 1.05 1.12 1.03 1.12 1.04Miscellaneous nondurable goods 4249 424 1.09 1.08 1.09 1.08 1.08Wholesale electronic markets and agents a4251 part 42 1.03 1.03 1.01 0.97 1.00Business to business electronic markets 425110 part 42 1.03 1.03 1.01 0.97 1.00Wholesale trade agents and brokers 425120 part 42 1.03 1.03 1.01 0.97 1.00Motor vehicle and parts dealers 441 441 1.14 1.09 1.16 1.14 1.13Automobile dealers 4411 4411 1.14 1.09 1.15 1.13 1.14New car dealers 441110 4411 1.14 1.09 1.15 1.13 1.14Used car dealers 441120 4411 1.14 1.09 1.15 1.13 1.14Other motor vehicle dealers 4412 4412 1.11 0.97 1.14 1.06 1.04Recreational vehicle dealers 441210 4412 1.11 0.97 1.14 1.06 1.04Motorcycle, boat, and other motor vehicle44122 4412 1.11 0.97 1.14 1.06 1.04Automotive parts, accessories, and tire sto4413 4413 1.11 1.09 1.18 1.17 1.11Automotive parts and accessories stores 441310 4413 1.11 1.09 1.18 1.17 1.11Tire dealers 441320 4413 1.11 1.09 1.18 1.17 1.11Furniture and home furnishings stores 442 442 1.21 1.22 1.25 1.18 1.21Furniture stores 442110 442 1.21 1.22 1.25 1.18 1.21Home furnishings stores 4422 442 1.21 1.22 1.25 1.18 1.21Floor covering stores 442210 442 1.21 1.22 1.25 1.18 1.21Other home furnishings stores 44229 442 1.21 1.22 1.25 1.18 1.21Electronics and appliance stores 4431 443, 451 1.26 1.23 1.27 1.29 1.26Appliance, television, and other electronic44311 443, 451 1.26 1.23 1.27 1.29 1.26Household appliance stores 443111 443, 451 1.26 1.23 1.27 1.29 1.26Radio, television, and other electronics sto443112 443112, 44312 1.21 1.17 1.18 1.19 1.18Building material and garden supply store444 444 1.13 1.16 1.15 1.14 1.15Building material and supplies dealers 4441 444 1.13 1.16 1.15 1.14 1.15Home centers 444110 4441 exc 44413 1.10 1.14 1.12 1.11 1.12Paint and wallpaper stores 444120 4441 exc 44413 1.10 1.14 1.12 1.11 1.12Hardware stores 444130 44413 1.23 1.27 1.32 1.27 1.25Other building material dealers 444190 4441 exc 44413 1.10 1.14 1.12 1.11 1.12Lawn and garden equipment and supplies 4442 4442 1.13 1.13 1.13 1.14 1.14Outdoor power equipment stores 444210 4442 1.13 1.13 1.13 1.14 1.14Nursery, garden center, and farm supply s444220 4442 1.13 1.13 1.13 1.14 1.14Food and beverage stores 445 445 1.35 1.38 1.34 1.30 1.35Grocery stores 4451 4451 1.34 1.36 1.35 1.30 1.34Supermarkets and other grocery (except c 445110 4451 1.34 1.36 1.35 1.30 1.34Convenience stores 445120 4451 1.34 1.36 1.35 1.30 1.34Specialty food stores 4452 4452 1.29 1.34 1.19 1.23 1.27Fruit and vegetable markets 445230 4452 1.29 1.34 1.19 1.23 1.27Other specialty food stores 44529 4452 1.29 1.34 1.19 1.23 1.27Beer, wine, and liquor stores 445310 4453 1.56 1.70 1.41 1.32 1.46Health and personal care stores 4461 446 1.34 1.32 1.24 1.24 1.29Pharmacies and drug stores 446110 4461 1.33 1.31 1.24 1.23 1.28Cosmetics, beauty supplies, and perfume 446120 446 exc 44611 1.31 1.29 1.26 1.28 1.30Optical goods stores 446130 446 exc 44611 1.31 1.29 1.26 1.28 1.30Other health and personal care stores 44619 446 exc 44611 1.31 1.29 1.26 1.28 1.30Food (health) supplement stores 446191 446 exc 44611 1.31 1.29 1.26 1.28 1.30All other health and personal care stores 446199 446 exc 44611 1.31 1.29 1.26 1.28 1.30Gasoline stations 4471 447 1.27 1.25 1.21 1.12 1.21
15
DescriptionNAICS Industry
NAICS Industry Reported in CPS 1987 1992 1997 2002
1987-2002 Average
Table 1. Ratios of supervisory (nonproduction) worker average weekly hours to nonsupervisory (production) worker average weekly hours; selected years and 1987-2002 average
Gasoline stations with convenience stores 447110 447 1.27 1.25 1.21 1.12 1.21Other gasoline stations 447190 447 1.27 1.25 1.21 1.12 1.21Clothing and clothing accessories stores 448 448 1.44 1.48 1.46 1.39 1.43Clothing stores 4481 448 exc 44821,
44831.47 1.48 1.48 1.42 1.46
Men's clothing stores 448110 448 exc 44821, 4483
1.47 1.48 1.48 1.42 1.46
Women's clothing stores 448120 448 exc 44821, 4483
1.47 1.48 1.48 1.42 1.46
Children's and infants' clothing stores 448130 448 exc 44821, 4483
1.47 1.48 1.48 1.42 1.46
Family clothing stores 448140 448 exc 44821, 4483
1.47 1.48 1.48 1.42 1.46
Clothing accessories stores 448150 448 exc 44821, 4483
1.47 1.48 1.48 1.42 1.46
Other clothing stores 448190 448 exc 44821, 4483
1.47 1.48 1.48 1.42 1.46
Shoe stores 448210 44821 1.50 1.56 1.47 1.48 1.50Jewelry, luggage, and leather goods stores4483 4483 1.29 1.44 1.36 1.25 1.28Sporting goods, hobby, book, and music s451 443, 451 1.26 1.23 1.27 1.29 1.26Sporting goods, hobby, and musical instru4511 443, 451 1.26 1.23 1.27 1.29 1.26Sporting goods stores 451110 44313, 45111,
451121.26 1.27 1.43 1.40 1.32
Hobby, toy, and game stores 451120 44313, 45111, 45112
1.26 1.27 1.43 1.40 1.32
Sewing, needlework, and piece goods stor451130 443, 451 1.26 1.23 1.27 1.29 1.26Musical instrument and supplies stores 451140 45114, 45122 1.46 1.43 1.42 1.41 1.41Book, periodical, and music stores 4512 443, 451 1.26 1.23 1.27 1.29 1.26Book stores and news dealers 45121 45121 1.14 1.14 1.23 1.33 1.20Prerecorded tape, compact disc, and recor 451220 45114, 45122 1.46 1.43 1.42 1.41 1.41General merchandise stores 452 452 1.36 1.33 1.34 1.29 1.33Department stores 45211 45211 1.38 1.34 1.35 1.29 1.35Department stores (except discount depart452111 45211 1.38 1.34 1.35 1.29 1.35Discount department stores 452112 45211 1.38 1.34 1.35 1.29 1.35Other general merchandise stores 4529 4529 1.26 1.23 1.21 1.24 1.23Warehouse clubs and supercenters 452910 4529 1.26 1.23 1.21 1.24 1.23All other general merchandise stores 452990 4529 1.26 1.23 1.21 1.24 1.23Miscellaneous store retailers 453 453 1.23 1.20 1.20 1.25 1.22Florists 453110 4531 1.44 1.56 1.38 1.55 1.48Office supplies, stationery, and gift stores 4532 453 1.23 1.20 1.20 1.25 1.22Office supplies and stationery stores 453210 45321 1.26 1.20 1.26 1.34 1.26Gift, novelty, and souvenir stores 453220 45322 1.20 1.16 1.15 1.19 1.18Used merchandise stores 453310 4533 1.28 1.23 1.22 1.24 1.24Other miscellaneous store retailers 4539 4539 1.15 1.14 1.12 1.13 1.14Pet and pet supplies stores 453910 4539 1.15 1.14 1.12 1.13 1.14Art dealers 453920 4539 1.15 1.14 1.12 1.13 1.14Manufactured (mobile) home dealers 453930 4539 1.15 1.14 1.12 1.13 1.14All other miscellaneous store retailers 45399 4539 1.15 1.14 1.12 1.13 1.14Nonstore retailers 454 454 1.25 1.25 1.28 1.22 1.26Electronic shopping and mail order house 45411 454 1.25 1.25 1.28 1.22 1.26Vending machine operators 454210 454 1.25 1.25 1.28 1.22 1.26Direct selling establishments 4543 454 1.25 1.25 1.28 1.22 1.26Fuel dealers 45431 45431 1.07 1.11 1.10 1.07 1.09Heating oil dealers 454311 45431 1.07 1.11 1.10 1.07 1.09Other direct selling establishments 454390 45439 1.41 1.45 1.43 1.39 1.47General freight trucking, long-distance 48412 484 1.05 1.04 1.02 1.02 1.04Publishing 511 511 1.14 1.20 1.20 1.23 1.20Newspaper, periodical, book, and director5111 511 1.14 1.20 1.20 1.23 1.20Newspaper publishers 511110 51111 1.26 1.32 1.33 1.30 1.32
16
DescriptionNAICS Industry
NAICS Industry Reported in CPS 1987 1992 1997 2002
1987-2002 Average
Table 1. Ratios of supervisory (nonproduction) worker average weekly hours to nonsupervisory (production) worker average weekly hours; selected years and 1987-2002 average
Periodical publishers 511120 5111 exc 51111 1.04 1.07 1.08 1.10 1.07Book publishers 511130 5111 exc 51111 1.04 1.07 1.08 1.10 1.07Database and directory publishers 511140 5111 exc 51111 1.04 1.07 1.08 1.10 1.07Other publishers 51119 5111 exc 51111 1.04 1.07 1.08 1.10 1.07Software publishers 511210 511 1.14 1.20 1.20 1.23 1.20Motion picture and video exhibition 51213 5121 1.28 1.38 1.32 1.21 1.27Broadcasting, except Internet 515 515, 517 1.09 1.10 1.13 1.11 1.11Radio and television broadcasting 5151 5151, 5152, 5175 1.11 1.13 1.14 1.11 1.13Radio broadcasting 51511 5151, 5152, 5175 1.11 1.13 1.14 1.11 1.13Television broadcasting 515120 5151, 5152, 5175 1.11 1.13 1.14 1.11 1.13Cable and other subscription programmin 515210 5151, 5152, 5175 1.11 1.13 1.14 1.11 1.13Wired telecommunications carriers 517110 5171 1.08 1.09 1.11 1.10 1.09Wireless telecommunications carriers (exc51721 517 exc 5171, 5175 1.09 1.10 1.13 1.12 1.11Cable and other program distribution 517510 5151, 5152, 5175 1.11 1.13 1.14 1.11 1.13Commercial banking 522110 521, 52211, 52219 1.16 1.18 1.18 1.15 1.17Passenger car rental 532111 5321 1.33 1.29 1.22 1.19 1.27Truck, utility trailer, and rv (recreational v532120 5321 1.33 1.29 1.22 1.19 1.27Video tape and disc rental 532230 53223 1.62 1.77 1.67 1.52 1.61Tax preparation services 541213 5412 1.25 1.21 1.24 1.19 1.23Advertising agencies 541810 5418 1.25 1.20 1.24 1.16 1.22Photography studios, portrait 541921 5419 exc 54194 1.42 1.30 1.29 1.22 1.32Travel agencies 561510 5615 1.26 1.22 1.24 1.19 1.20Janitorial services 561720 5617 exc 56173 1.44 1.38 1.32 1.30 1.35Traveler accommodation 7211 7211 1.45 1.38 1.32 1.28 1.35Hotels (except casino hotels) and motels 721110 7211 1.45 1.38 1.32 1.28 1.35Casino hotels 721120 7211 1.45 1.38 1.32 1.28 1.35Other traveler accommodation 72119 7211 1.45 1.38 1.32 1.28 1.35Bed-and-breakfast inns 721191 7211 1.45 1.38 1.32 1.28 1.35All other traveler accommodation 721199 7211 1.45 1.38 1.32 1.28 1.35Food services and drinking places 722 722 1.67 1.64 1.59 1.54 1.61Full-service restaurants 722110 722 exc 7224 1.67 1.63 1.59 1.54 1.61Limited-service eating places 72221 722 exc 7224 1.67 1.63 1.59 1.54 1.61Special food services 7223 722 exc 7224 1.67 1.63 1.59 1.54 1.61Drinking places (alcoholic beverages) 722410 7224 1.77 1.74 1.69 1.63 1.70Automotive repair and maintenance 8111 811 1.22 1.19 1.15 1.13 1.18Hair, nail, and skin care services 81211 812 1.40 1.37 1.34 1.29 1.34Funeral homes and funeral services 812210 8122 1.48 1.48 1.52 1.47 1.42Drycleaning and laundry services 8123 8123 1.32 1.35 1.26 1.20 1.26Coin-operated laundries and drycleaners 812310 8123 1.32 1.35 1.26 1.20 1.26Drycleaning and laundry services (except 812320 8123 1.32 1.35 1.26 1.20 1.26Linen and uniform supply 81233 8123 1.32 1.35 1.26 1.20 1.26Photofinishing 81292 8129 1.36 1.27 1.27 1.21 1.29
17
DifferenceOld New New - Old
Food manufacturing 311 39.2 40.0 0.7Animal food manufacturing 31111 39.2 46.5 7.3Grain and oilseed milling 3112 39.2 44.9 5.7Breakfast cereals 311230 39.2 47.1 7.9Sugar and confectionery products 3113 39.2 37.3 -1.9Sugar 31131 39.2 37.4 -1.8Nonchocolate confectioneries 311340 39.2 40.1 0.9Fruit and vegetable preserving and specialty 3114 39.2 41.3 2.1Frozen food 31141 39.2 40.9 1.7Frozen fruits, juices, and vegetables 311411 39.2 34.7 -4.5Frozen specialty foods 311412 39.2 47.7 8.4Fruit and vegetable canning, pickling, and drying 31142 39.2 41.6 2.4Fruit and vegetable canning 311421 39.2 40.8 1.6Specialty canning 311422 39.2 44.7 5.5Dried and dehydrated foods 311423 39.2 42.3 3.0Dairy products 3115 39.2 42.6 3.3Dairy products (except frozen) 31151 39.2 42.5 3.3Fluid milk 311511 39.2 43.1 3.9Ice cream and frozen desserts 311520 39.2 43.0 3.7Animal slaughtering and processing 31161 39.2 42.9 3.6Animal (except poultry) slaughtering 311611 39.2 43.3 4.1Poultry processing 311615 39.2 42.0 2.8Seafood product preparation and packaging 31171 39.2 40.4 1.1Bakeries and tortilla manufacturing 3118 39.2 37.5 -1.8Bread and bakery products 31181 39.2 36.0 -3.2Retail bakeries 311811 39.2 24.1 -15.1Other food products 3119 39.2 40.5 1.3Snack foods 31191 39.2 35.7 -3.5Beverages and tobacco products 312 39.0 41.7 2.7Beverages 3121 39.2 42.4 3.2Soft drinks and ice 31211 39.2 40.8 1.6Soft drinks 312111 39.2 42.1 2.9Tobacco and tobacco products 3122 36.7 41.1 4.4Textile mills 313 38.0 43.6 5.6Fiber, yarn, and thread mills 31311 38.0 43.2 5.2Fabric mills 3132 38.0 43.8 5.7Broadwoven fabric mills 313210 38.0 43.6 5.5Textile and fabric finishing mills 3133 38.0 43.5 5.5Broadwoven fabric finishing mills 313311 38.0 44.3 6.2Textile product mills 314 38.2 41.2 3.1Textile furnishings mills 3141 38.2 40.2 2.0Carpet and rug mills 314110 38.0 40.9 2.9Curtain and linen mills 31412 38.3 40.1 1.8Other textile product mills 3149 38.1 43.3 5.1Textile bag and canvas mills 31491 38.3 43.2 4.9All other textile products 31499 38.0 43.3 5.3Apparel 315 38.3 37.6 -0.7Apparel knitting mills 3151 38.0 40.2 2.2Hosiery and sock mills 31511 38.0 41.1 3.1Sheer hosiery mills 315111 38.0 38.5 0.5Other hosiery and sock mills 315119 38.0 43.3 5.3Other apparel knitting mills 31519 38.0 39.4 1.3Cut and sew apparel 3152 38.3 38.1 -0.2
Table 2. Comparison of supervisory (nonproduction) average weekly hours, average 1987-2002
Description NAICS1987-2002 Average
18
DifferenceOld New New - Old
Table 2. Comparison of supervisory (nonproduction) average weekly hours, average 1987-2002
Description NAICS1987-2002 Average
Cut and sew apparel contractors 31521 38.3 37.5 -0.8Men's and boys' cut and sew apparel contractors 315211 38.3 39.1 0.7Women's, girls', and infants' cut and sew apparel contractors 315212 38.3 36.9 -1.4Men's and boys' cut and sew apparel 31522 38.3 37.7 -0.6Women's and girls' cut and sew apparel 31523 38.3 39.2 0.8Other cut and sew apparel 31529 38.3 40.4 2.1Apparel accessories and other apparel manufacturing 31599 38.3 38.5 0.2Leather and allied products 316 39.6 40.1 0.5Leather and allied product manufacturing 316110 39.6 41.1 1.5Footwear manufacturing 31621 39.6 39.4 -0.2Other leather and allied product manufacturing 31699 39.6 41.1 1.5Wood products 321 40.1 43.3 3.3Sawmills and wood preservation 32111 40.1 44.6 4.5Veneer, plywood, and engineered wood product manufacturing 32121 40.1 44.7 4.6Reconstituted wood products 321219 40.1 43.8 3.7Other wood products 3219 40.1 42.3 2.3Millwork 32191 40.1 40.8 0.7Wood windows and doors 321911 40.1 39.6 -0.5Wood containers and pallets 321920 40.1 40.6 0.5All other wood products 32199 40.1 43.4 3.3Manufactured homes (mobile homes) 321991 40.1 45.5 5.4Paper and paper products 322 39.2 43.3 4.1Pulp, paper, and paperboard mills 3221 39.2 45.8 6.6Paperboard mills 322130 39.2 45.2 6.0Converted paper products 3222 39.2 41.9 2.7Paperboard containers 32221 39.2 41.4 2.2Corrugated and solid fiber boxes 322211 39.2 42.5 3.3Folding paperboard boxes 322212 39.2 40.6 1.4Paper bags and coated and treated paper 32222 39.2 42.3 3.0Stationery products 32223 39.2 42.1 2.9Other converted paper products 32229 39.2 42.9 3.7Printing and related support activities 3231 37.2 39.2 2.0Printing 32311 37.2 39.2 2.0Commercial lithographic printing 323110 37.2 39.6 2.5Commercial gravure printing 323111 37.2 45.3 8.1Commercial flexographic printing 323112 37.2 39.3 2.1Commercial screen printing 323113 37.2 38.0 0.8Quick printing 323114 37.2 37.7 0.6Manifold business form printing 323116 37.2 40.6 3.5Support activities for printing 32312 37.2 39.1 1.9Petroleum and coal products 3241 39.4 42.6 3.3Petroleum refineries 324110 39.4 42.6 3.3Chemicals 325 39.4 43.7 4.3Basic chemicals 3251 39.4 46.1 6.7Synthetic dyes and pigments 32513 39.4 40.7 1.3Other basic inorganic chemicals 32518 39.4 43.1 3.7Other basic organic chemicals 32519 39.4 43.2 3.8Resin, synthetic rubber, and artificial synthetic fibers and filaments 3252 39.4 44.1 4.7Resin and synthetic rubber 32521 39.4 43.4 4.0Plastics material and resin 325211 39.4 43.6 4.2Synthetic rubber 325212 39.4 42.7 3.3Artificial and synthetic fibers and filaments 32522 39.4 45.0 5.6Noncellulosic organic fibers 325222 39.4 45.4 6.0
19

DifferenceOld New New - Old
Table 2. Comparison of supervisory (nonproduction) average weekly hours, average 1987-2002
Description NAICS1987-2002 Average
Pesticides, fertilizers, and other agricultural chemicals 3253 39.4 49.5 10.1Pharmaceuticals and medicine 32541 39.4 41.7 2.3Pharmaceutical preparations 325412 39.4 41.9 2.5Paint, coatings, and adhesives 3255 39.4 43.0 3.6Paint and coatings 325510 39.4 43.0 3.6Soaps, cleaning compounds, and toilet preparations 3256 39.4 41.8 2.4Soaps and cleaning compounds 32561 39.4 41.9 2.5Soaps and other detergents 325611 39.4 42.3 2.9Toilet preparations 325620 39.4 41.6 2.2Other chemical products and preparations 3259 39.4 40.9 1.5Plastics and rubber products 326 40.1 42.5 2.4Plastics products 3261 40.1 42.3 2.2Plastics packaging materials and unlaminated film and sheets 32611 40.1 44.2 4.1Unlaminated plastics film and sheets (except packaging) 326113 40.1 42.1 2.0Plastics pipes, pipe fittings, and unlaminated profile shapes 32612 40.1 41.1 1.0Unlaminated plastics profile shapes 326121 40.1 39.9 -0.2Plastics pipes and pipe fittings 326122 40.1 42.6 2.5Other plastics products 32619 40.1 42.2 2.0Rubber products 3262 40.1 43.4 3.3Tires 32621 40.1 43.7 3.6Rubber and plastics hoses and belting 326220 40.1 42.3 2.2Other rubber products 32629 40.1 42.5 2.3Rubber products for mechanical use 326291 40.1 45.9 5.8All other rubber products 326299 40.1 38.7 -1.4Nonmetallic mineral products 327 40.4 42.6 2.2Clay products and refractories 3271 40.4 42.6 2.2Pottery, ceramics, and plumbing fixtures 32711 40.4 40.8 0.4Clay building materials and refractories 32712 40.4 44.6 4.2Glass and glass products 32721 40.4 42.0 1.6Flat glass 327211 40.4 48.4 8.0Other pressed and blown glass and glassware 327212 40.4 38.5 -1.9Glass containers 327213 40.4 43.7 3.3Glass products made of purchased glass 327215 40.4 41.7 1.3Cement and concrete products 3273 40.4 41.9 1.5Ready-mix concrete 327320 40.4 40.0 -0.4Lime and gypsum products 3274 40.4 46.5 6.1Other nonmetallic mineral products 3279 40.4 46.1 5.7Primary metals 331 41.8 42.8 1.0Iron and steel mills and ferroalloy production 33111 43.8 42.3 -1.4Steel products from purchased steel 3312 43.8 43.2 -0.6Iron and steel pipes and tubes from purchased steel 331210 43.8 43.2 -0.5Rolling and drawing of purchased steel 33122 43.8 43.2 -0.6Rolled steel shapes 331221 43.8 43.5 -0.3Alumina and aluminum production and processing 33131 40.7 43.9 3.2Aluminum sheets, plates, and foil 331315 40.7 48.6 7.9Nonferrous metal (except aluminum) production and processing 3314 40.7 42.8 2.1Nonferrous metal (except aluminum) smelting and refining 33141 40.7 40.2 -0.5Copper rolling, drawing, extruding, and alloying 33142 40.7 43.0 2.3Nonferrous metal (except copper and aluminum) rolling, drawing, extr33149 40.7 43.8 3.1Foundries 3315 40.7 41.9 1.2Ferrous metal foundries 33151 40.7 42.5 1.8Iron foundries 331511 40.7 43.5 2.8Nonferrous metal foundries 33152 40.7 41.2 0.5
20

DifferenceOld New New - Old
Table 2. Comparison of supervisory (nonproduction) average weekly hours, average 1987-2002
Description NAICS1987-2002 Average
Fabricated metal products 332 39.3 41.5 2.2Forging and stamping 33211 39.3 42.1 2.8Iron and steel forging 332111 39.3 42.7 3.5Metal stamping 332116 39.3 43.7 4.5Cutlery and handtools 33221 39.3 40.4 1.2Hand and edge tools 332212 39.3 40.8 1.6Architectural and structural metals 3323 39.3 40.9 1.6Plate work and fabricated structural products 33231 39.3 42.3 3.0Prefabricated metal building and components 332311 39.3 42.4 3.1Fabricated structural metals 332312 39.3 42.0 2.7Plate work 332313 39.3 42.7 3.4Ornamental and architectural metal products 33232 39.3 39.8 0.6Metal windows and doors 332321 39.3 40.5 1.3Sheet metal work 332322 39.3 38.9 -0.3Ornamental and architectural metal work 332323 39.3 40.7 1.5Boilers, tanks, and shipping containers 3324 39.3 41.1 1.9Hardware 332510 39.3 44.3 5.0Spring and wire products 33261 39.3 43.0 3.8Machine shops; turned products; and screws, nuts, and bolts 3327 39.5 41.6 2.1Machine shops 332710 39.6 41.1 1.5Turned products and screws, nuts, and bolts 33272 39.3 42.6 3.3Precision turned products 332721 39.3 42.4 3.2Bolts, nuts, screws, rivets, and washers 332722 39.3 42.7 3.5Coating, engraving, heat treating, and allied activities 33281 39.3 40.8 1.5Electroplating, plating, polishing, anodizing and coloring 332813 39.3 40.3 1.0Other fabricated metal products 3329 39.3 41.9 2.6Metal valves 33291 39.3 43.3 4.1Fluid power valves and hose fittings 332912 39.3 42.7 3.4Plumbing fixture fittings and trim 332913 39.3 40.1 0.9All other fabricated metal products 33299 39.3 41.8 2.5Ball and roller bearings 332991 39.6 45.7 6.1Machinery 333 39.6 43.3 3.7Agriculture, construction, and mining machinery 3331 39.3 43.9 4.6Agricultural implements 33311 39.6 41.7 2.1Farm machinery and equipment 333111 39.6 43.3 3.7Lawn and garden tractors and home lawn and garden equipment 333112 39.6 37.7 -1.9Construction machinery 333120 39.6 43.3 3.7Mining and oil and gas field machinery 33313 39.6 47.3 7.7Industrial machinery 3332 39.6 42.5 2.9Semiconductor machinery 333295 39.6 42.7 3.1Commercial and service industry machinery 33331 39.6 43.8 4.3Office machinery 333313 39.6 43.1 3.5Photographic and photocopying equipment 333315 39.5 46.0 6.5HVAC and commercial refrigeration equipment 33341 39.6 42.0 2.4Air-conditioning and warm air heating equipment and commercial and333415 39.6 42.0 2.4Metalworking machinery 33351 39.6 44.1 4.5Industrial molds 333511 39.6 43.1 3.5Special dies and tools, die sets, jigs, and fixtures 333514 39.6 44.4 4.8Turbine and power transmission equipment 33361 39.6 42.9 3.3Turbines and turbine generator set units 333611 39.6 39.1 -0.5Other general purpose machinery 3339 39.6 43.3 3.7Pumps and compressors 33391 39.6 41.9 2.3Air and gas compressors 333912 39.6 41.0 1.4
21
DifferenceOld New New - Old
Table 2. Comparison of supervisory (nonproduction) average weekly hours, average 1987-2002
Description NAICS1987-2002 Average
Material handling equipment 33392 39.6 43.2 3.6Conveyor and conveying equipment 333922 39.6 43.5 3.9Overhead traveling cranes, hoists, and monorail systems 333923 39.6 41.1 1.5All other general purpose machinery 33399 39.6 43.7 4.1Computer and electronic products 334 40.0 43.7 3.7Computer and peripheral equipment 33411 39.6 47.4 7.8Electronic computers 334111 39.6 47.4 7.8Other computer peripheral equipment 334119 39.6 44.1 4.5Communications equipment 3342 40.7 42.0 1.3Telephone apparatus manufacturing 334210 40.7 43.9 3.2Radio and television broadcasting and wireless communications equip334220 40.7 41.8 1.1Audio and video equipment manufacturing 334310 40.7 41.5 0.8Semiconductors and electronic components 33441 40.7 43.5 2.8Electron tubes 334411 40.7 43.8 3.1Bare printed circuit boards 334412 40.7 46.9 6.2Semiconductors and related devices 334413 40.7 43.6 2.9Electronic capacitors 334414 40.7 39.4 -1.3Electronic connectors 334417 40.7 48.0 7.3Printed circuit assemblies (electronic assemblies) 334418 40.7 42.2 1.5Electronic instruments 33451 39.5 42.8 3.3Electromedical and electrotherapeutic apparatuses 334510 39.5 45.7 6.2Search, detection, navigation, guidance, aeronautical, and nautical syst334511 39.5 43.9 4.4Automatic environmental controls for residential, commercial, and app334512 39.5 41.3 1.8Instruments and related products for measuring, displaying, and contro334513 39.5 42.3 2.8Instruments for measuring and testing electricity and electrical signals 334515 39.5 42.3 2.8Irradiation apparatuses 334517 39.5 44.4 4.9Magnetic media manufacturing and reproduction 33461 40.7 42.0 1.3Electrical equipment and appliances 335 40.3 42.5 2.1Electric lighting equipment 3351 40.7 41.5 0.8Electric lamp bulb and part manufacturing 335110 40.7 43.1 2.4Lighting fixtures 33512 40.7 40.8 0.1Household appliances 3352 40.7 43.8 3.1Small electrical appliances 33521 40.7 44.6 3.9Electric housewares and household fans 335211 40.7 44.6 3.9Major appliances 33522 40.7 43.6 2.9Electrical equipment 33531 40.7 42.5 1.8Power, distribution, and specialty transformers 335311 40.7 43.5 2.9Motors and generators 335312 40.7 42.4 1.7Switchgear and switchboard apparatuses 335313 40.7 44.4 3.8Relays and industrial controls 335314 40.7 40.4 -0.3Other electrical equipment and components 3359 39.7 41.9 2.3Batteries 33591 40.7 42.6 1.9Storage batteries 335911 40.7 42.8 2.1Communication and energy wire and cable 33592 40.7 43.8 3.1Fiber optic cables 335921 40.7 44.0 3.3Other communication and energy wires 335929 40.7 43.8 3.1Wiring devices 33593 40.6 40.8 0.1Current-carrying wiring devices 335931 40.7 39.7 -1.0Noncurrent-carrying wiring devices 335932 40.7 44.5 3.9All other electrical equipment and components 33599 40.7 42.2 1.5Transportation equipment 336 40.9 43.3 2.3Motor vehicles 3361 42.5 44.5 2.0Automobiles and light duty motor vehicles 33611 42.5 44.5 2.1
22
DifferenceOld New New - Old
Table 2. Comparison of supervisory (nonproduction) average weekly hours, average 1987-2002
Description NAICS1987-2002 Average
Automobiles 336111 42.5 44.7 2.2Light trucks and utility vehicles 336112 42.5 44.2 1.7Heavy duty truck manufacturing 336120 42.5 44.2 1.7Motor vehicle bodies and trailers 33621 42.5 41.1 -1.3Motor vehicle bodies 336211 42.5 43.0 0.5Truck trailers 336212 42.5 38.4 -4.1Motor homes 336213 42.5 40.9 -1.6Travel trailers and campers 336214 42.5 40.2 -2.3Motor vehicle parts 3363 41.2 43.9 2.8Motor vehicle gasoline engines and engine parts 33631 41.8 45.0 3.2Carburetors, pistons, piston rings, and valves 336311 39.6 44.5 4.9Gasoline engines and engine parts 336312 42.5 45.1 2.6Motor vehicle electrical and electronic equipment 33632 40.7 42.5 1.9Vehicular lighting equipment 336321 40.7 43.4 2.8Other motor vehicle electrical and electronic equipment 336322 40.7 42.4 1.7Motor vehicle steering and suspension components (except spring) ma336330 42.5 45.4 2.9Motor vehicle brake system manufacturing 336340 42.5 44.9 2.5Motor vehicle transmission and power train parts manufacturing 336350 42.5 48.0 5.5Motor vehicle seating and interior trim manufacturing 336360 38.3 43.5 5.2Motor vehicle metal stamping 336370 39.3 42.0 2.8Other motor vehicle parts 33639 42.1 42.7 0.6All other motor vehicle parts 336399 42.5 42.4 -0.1Aerospace products and parts 33641 40.6 43.1 2.5Aircraft 336411 40.6 41.8 1.2Aircraft engines and engine parts 336412 40.6 43.4 2.7Other aircraft parts and auxiliary equipment 336413 40.6 43.7 3.0Railroad rolling stock manufacturing 336510 40.6 43.9 3.3Ship and boat building 33661 40.6 45.3 4.7Ship building and repairing 336611 40.6 46.3 5.7Boat building 336612 40.6 43.0 2.4Other transportation equipment 33699 40.6 41.7 1.1Furniture and related products 337 39.3 40.2 0.9Household and institutional furniture and kitchen cabinets 3371 39.4 39.9 0.4Wood kitchen cabinets and countertops 337110 40.1 38.4 -1.7Household and institutional furniture 33712 39.1 40.4 1.3Upholstered household furniture 337121 39.1 39.5 0.4Nonupholstered wood household furniture 337122 39.1 40.5 1.4Office furniture (including fixtures) 33721 39.1 41.2 2.1Office furniture (except wood) 337214 39.1 44.3 5.2Showcases, partitions, shelving, and lockers 337215 39.1 41.2 2.1Other furniture related products 3379 39.1 40.1 1.0Miscellaneous manufacturing 339 39.0 40.4 1.4Medical equipment and supplies 33911 39.5 39.7 0.2Surgical and medical instruments 339112 39.5 38.8 -0.7Surgical appliances and supplies 339113 39.5 41.9 2.5Dental laboratories 339116 39.5 34.3 -5.2Other miscellaneous manufacturing 3399 38.4 40.8 2.4Jewelry and silverware 33991 38.4 41.2 2.8Sporting and athletic goods 339920 38.4 42.2 3.8Dolls, toys, and games 33993 38.4 40.7 2.3Office supplies (except paper) 33994 38.4 39.8 1.4Signs 339950 38.4 37.5 -0.9All other miscellaneous manufacturing 33999 38.4 40.7 2.3
23

DifferenceOld New New - Old
Table 2. Comparison of supervisory (nonproduction) average weekly hours, average 1987-2002
Description NAICS1987-2002 Average
Durable goods 423 40.0 41.8 1.8Motor vehicles and parts 4231 40.0 44.2 4.2Furniture and furnishings 4232 40.0 42.8 2.8Lumber and construction supplies 4233 40.0 42.4 2.4Commercial equipment 4234 40.0 43.8 3.8Metals and minerals 4235 40.0 43.1 3.1Electrical and electronic goods 4236 40.0 41.6 1.6Hardware and plumbing 4237 40.0 38.1 -1.9Machinery and supplies 4238 40.0 40.0 0.0Miscellaneous durable goods 4239 40.0 39.7 -0.3Nondurable Goods 424 40.0 41.2 1.2Paper and paper products 4241 40.0 38.7 -1.3Druggists' goods 424210 40.0 42.6 2.6Apparel and piece goods 4243 40.0 42.9 2.9Grocery and related products 4244 40.0 41.2 1.2Farm product raw materials 4245 40.0 44.0 4.0Chemicals 4246 40.0 43.2 3.2Petroleum 4247 40.0 39.7 -0.3Alcoholic beverages 4248 40.0 37.6 -2.4Miscellaneous nondurable goods 4249 40.0 41.1 1.1Wholesale electronic markets and agents and brokers 4251 40.0 35.7 -4.3Business to business electronic markets 425110 40.0 33.2 -6.8Wholesale trade agents and brokers 425120 40.0 36.2 -3.8Motor vehicle and parts dealers 441 41.3 40.8 -0.5Automobile dealers 4411 38.6 40.1 1.5New car dealers 441110 37.0 40.0 3.0Used car dealers 441120 48.2 42.0 -6.2Other motor vehicle dealers 4412 39.0 36.2 -2.8Recreational vehicle dealers 441210 39.0 36.4 -2.6Motorcycle, boat, and other motor vehicle dealers 44122 39.0 36.1 -2.9Automotive parts, accessories, and tire stores 4413 48.1 42.2 -5.9Automotive parts and accessories stores 441310 48.1 42.6 -5.5Tire dealers 441320 48.1 41.2 -6.9Furniture and home furnishings stores 442 50.0 38.0 -12.0Furniture stores 442110 50.0 37.8 -12.2Home furnishings stores 4422 50.0 38.3 -11.7Floor covering stores 442210 50.0 43.3 -6.7Other home furnishings stores 44229 50.0 34.5 -15.5Electronics and appliance stores 4431 49.1 40.4 -8.7Appliance, television, and other electronics stores 44311 50.0 41.9 -8.1Household appliance stores 443111 50.0 43.2 -6.8Radio, television, and other electronics stores 443112 50.0 38.9 -11.1Building material and garden supply stores 444 45.4 41.4 -4.1Building material and supplies dealers 4441 46.8 41.9 -4.9Home centers 444110 46.8 41.3 -5.5Paint and wallpaper stores 444120 46.8 41.3 -5.5Hardware stores 444130 46.8 41.0 -5.8Other building material dealers 444190 46.8 43.6 -3.2Lawn and garden equipment and supplies stores 4442 37.1 37.8 0.7Outdoor power equipment stores 444210 37.1 37.7 0.6Nursery, garden center, and farm supply stores 444220 37.1 37.8 0.7Food and beverage stores 445 44.8 42.3 -2.5Grocery stores 4451 44.9 42.5 -2.4
24
DifferenceOld New New - Old
Table 2. Comparison of supervisory (nonproduction) average weekly hours, average 1987-2002
Description NAICS1987-2002 Average
Supermarkets and other grocery (except convenience) stores 445110 44.9 42.6 -2.3Convenience stores 445120 44.9 41.1 -3.8Specialty food stores 4452 42.1 38.8 -3.3Fruit and vegetable markets 445230 42.1 38.4 -3.7Other specialty food stores 44529 42.1 38.5 -3.6Beer, wine, and liquor stores 445310 48.0 41.9 -6.1Health and personal care stores 4461 47.3 37.8 -9.5Pharmacies and drug stores 446110 47.3 37.1 -10.2Cosmetics, beauty supplies, and perfume stores 446120 47.3 37.3 -10.0Optical goods stores 446130 47.3 38.2 -9.1Other health and personal care stores 44619 47.3 42.8 -4.5Food (health) supplement stores 446191 47.3 40.5 -6.8All other health and personal care stores 446199 47.3 45.0 -2.3Gasoline stations 4471 48.1 38.8 -9.3Gasoline stations with convenience stores 447110 48.1 38.4 -9.7Other gasoline stations 447190 48.1 41.2 -6.9Clothing and clothing accessories stores 448 43.5 36.0 -7.5Clothing stores 4481 42.6 36.1 -6.5Men's clothing stores 448110 42.6 40.4 -2.2Women's clothing stores 448120 42.6 31.7 -10.9Children's and infants' clothing stores 448130 42.6 34.0 -8.6Family clothing stores 448140 42.6 37.6 -5.0Clothing accessories stores 448150 42.6 37.6 -5.0Other clothing stores 448190 42.6 40.3 -2.3Shoe stores 448210 42.8 37.8 -5.0Jewelry, luggage, and leather goods stores 4483 47.6 35.6 -12.0Sporting goods, hobby, book, and music stores 451 47.6 33.8 -13.8Sporting goods, hobby, and musical instrument stores 4511 47.6 34.2 -13.4Sporting goods stores 451110 47.6 38.4 -9.2Hobby, toy, and game stores 451120 47.6 33.7 -13.9Sewing, needlework, and piece goods stores 451130 47.6 31.5 -16.1Musical instrument and supplies stores 451140 47.6 41.1 -6.5Book, periodical, and music stores 4512 47.6 33.0 -14.6Book stores and news dealers 45121 47.6 29.7 -17.9Prerecorded tape, compact disc, and record stores 451220 47.6 41.2 -6.4General merchandise stores 452 42.5 37.2 -5.4Department stores 45211 41.4 34.8 -6.6Department stores (except discount department stores) 452111 41.4 30.1 -11.3Discount department stores 452112 41.4 39.1 -2.3Other general merchandise stores 4529 44.4 38.0 -6.4Warehouse clubs and supercenters 452910 44.4 39.8 -4.6All other general merchandise stores 452990 44.4 33.7 -10.7Miscellaneous store retailers 453 44.5 36.3 -8.1Florists 453110 45.8 43.9 -1.9Office supplies, stationery, and gift stores 4532 47.6 36.8 -10.8Office supplies and stationery stores 453210 47.6 44.4 -3.2Gift, novelty, and souvenir stores 453220 47.6 31.1 -16.5Used merchandise stores 453310 42.6 35.1 -7.5Other miscellaneous store retailers 4539 40.6 33.6 -7.0Pet and pet supplies stores 453910 40.0 31.4 -8.6Art dealers 453920 42.6 26.5 -16.1Manufactured (mobile) home dealers 453930 42.6 42.3 -0.3All other miscellaneous store retailers 45399 40.0 33.4 -6.6
25

DifferenceOld New New - Old
Table 2. Comparison of supervisory (nonproduction) average weekly hours, average 1987-2002
Description NAICS1987-2002 Average
Nonstore retailers 454 41.9 43.9 1.9Electronic shopping and mail order houses 45411 42.3 43.3 1.0Vending machine operators 454210 46.3 44.7 -1.6Direct selling establishments 4543 40.0 44.0 4.0Fuel dealers 45431 40.0 42.4 2.4Heating oil dealers 454311 40.0 42.2 2.2Other direct selling establishments 454390 40.0 40.8 0.8General freight trucking, long-distance 48412 39.1 40.7 1.6Publishing 511 37.7 42.0 4.3Newspaper, periodical, book, and directory publishers 5111 37.2 40.5 3.3Newspaper publishers 511110 37.2 42.6 5.4Periodical publishers 511120 37.2 36.2 -0.9Book publishers 511130 37.2 38.5 1.4Database and directory publishers 511140 37.2 38.5 1.3Other publishers 51119 37.2 40.8 3.6Software publishers 511210 42.9 46.6 3.7Motion picture and video exhibition 51213 41.7 24.9 -16.8Broadcasting, except Internet 515 43.3 37.5 -5.7Radio and television broadcasting 5151 43.3 38.5 -4.7Radio broadcasting 51511 43.3 33.6 -9.7Television broadcasting 515120 43.3 43.3 0.0Cable and other subscription programming 515210 43.3 37.3 -6.0Wired telecommunications carriers 517110 40.0 45.1 5.1Wireless telecommunications carriers (except satellite) 51721 40.0 41.6 1.6Cable and other program distribution 517510 43.3 40.5 -2.8Commercial banking 522110 40.0 41.4 1.4Passenger car rental 532111 46.0 42.6 -3.4Truck, utility trailer, and rv (recreational vehicle) rental and leasing 532120 45.3 44.0 -1.3Video tape and disc rental 532230 45.3 30.5 -14.8Tax preparation services 541213 37.9 33.3 -4.6Advertising agencies 541810 43.4 42.7 -0.6Photography studios, portrait 541921 37.9 30.7 -7.2Travel agencies 561510 42.8 40.6 -2.1Janitorial services 561720 55.0 36.2 -18.8Traveler accommodation 7211 47.4 41.4 -6.0Hotels (except casino hotels) and motels 721110 47.4 40.5 -6.9Casino hotels 721120 47.4 47.8 0.4Other traveler accommodation 72119 47.4 31.4 -16.0Bed-and-breakfast inns 721191 47.4 27.1 -20.3All other traveler accommodation 721199 47.4 42.0 -5.4Food services and drinking places 722 46.8 40.1 -6.7Full-service restaurants 722110 46.8 40.7 -6.1Limited-service eating places 72221 46.8 39.3 -7.5Special food services 7223 46.8 43.2 -3.6Drinking places (alcoholic beverages) 722410 46.8 38.5 -8.3Automotive repair and maintenance 8111 50.0 43.2 -6.8Hair, nail, and skin care services 81211 28.6 38.1 9.5Funeral homes and funeral services 812210 48.5 45.3 -3.2Drycleaning and laundry services 8123 43.0 43.7 0.7Coin-operated laundries and drycleaners 812310 43.0 43.3 0.3Drycleaning and laundry services (except coin-operated) 812320 43.0 42.1 -0.9Linen and uniform supply 81233 43.0 46.6 3.6Photofinishing 81292 47.6 45.0 -2.6
26
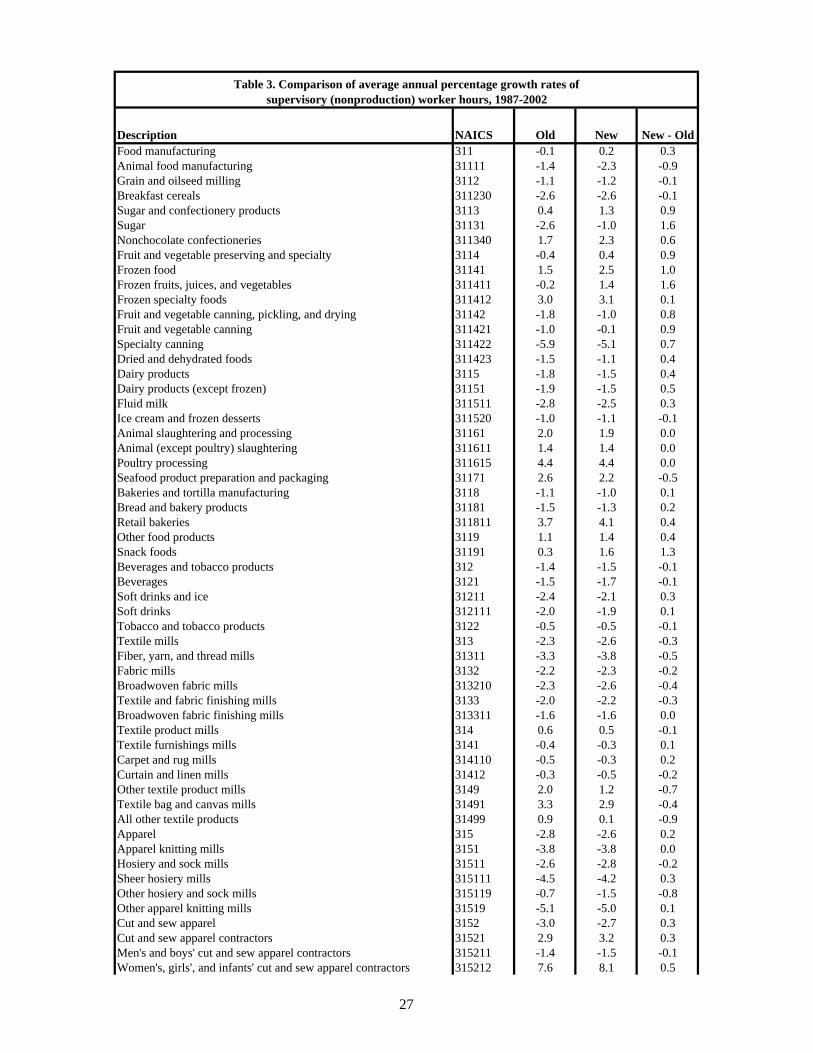
Description NAICS Old New New - OldFood manufacturing 311 -0.1 0.2 0.3Animal food manufacturing 31111 -1.4 -2.3 -0.9Grain and oilseed milling 3112 -1.1 -1.2 -0.1Breakfast cereals 311230 -2.6 -2.6 -0.1Sugar and confectionery products 3113 0.4 1.3 0.9Sugar 31131 -2.6 -1.0 1.6Nonchocolate confectioneries 311340 1.7 2.3 0.6Fruit and vegetable preserving and specialty 3114 -0.4 0.4 0.9Frozen food 31141 1.5 2.5 1.0Frozen fruits, juices, and vegetables 311411 -0.2 1.4 1.6Frozen specialty foods 311412 3.0 3.1 0.1Fruit and vegetable canning, pickling, and drying 31142 -1.8 -1.0 0.8Fruit and vegetable canning 311421 -1.0 -0.1 0.9Specialty canning 311422 -5.9 -5.1 0.7Dried and dehydrated foods 311423 -1.5 -1.1 0.4Dairy products 3115 -1.8 -1.5 0.4Dairy products (except frozen) 31151 -1.9 -1.5 0.5Fluid milk 311511 -2.8 -2.5 0.3Ice cream and frozen desserts 311520 -1.0 -1.1 -0.1Animal slaughtering and processing 31161 2.0 1.9 0.0Animal (except poultry) slaughtering 311611 1.4 1.4 0.0Poultry processing 311615 4.4 4.4 0.0Seafood product preparation and packaging 31171 2.6 2.2 -0.5Bakeries and tortilla manufacturing 3118 -1.1 -1.0 0.1Bread and bakery products 31181 -1.5 -1.3 0.2Retail bakeries 311811 3.7 4.1 0.4Other food products 3119 1.1 1.4 0.4Snack foods 31191 0.3 1.6 1.3Beverages and tobacco products 312 -1.4 -1.5 -0.1Beverages 3121 -1.5 -1.7 -0.1Soft drinks and ice 31211 -2.4 -2.1 0.3Soft drinks 312111 -2.0 -1.9 0.1Tobacco and tobacco products 3122 -0.5 -0.5 -0.1Textile mills 313 -2.3 -2.6 -0.3Fiber, yarn, and thread mills 31311 -3.3 -3.8 -0.5Fabric mills 3132 -2.2 -2.3 -0.2Broadwoven fabric mills 313210 -2.3 -2.6 -0.4Textile and fabric finishing mills 3133 -2.0 -2.2 -0.3Broadwoven fabric finishing mills 313311 -1.6 -1.6 0.0Textile product mills 314 0.6 0.5 -0.1Textile furnishings mills 3141 -0.4 -0.3 0.1Carpet and rug mills 314110 -0.5 -0.3 0.2Curtain and linen mills 31412 -0.3 -0.5 -0.2Other textile product mills 3149 2.0 1.2 -0.7Textile bag and canvas mills 31491 3.3 2.9 -0.4All other textile products 31499 0.9 0.1 -0.9Apparel 315 -2.8 -2.6 0.2Apparel knitting mills 3151 -3.8 -3.8 0.0Hosiery and sock mills 31511 -2.6 -2.8 -0.2Sheer hosiery mills 315111 -4.5 -4.2 0.3Other hosiery and sock mills 315119 -0.7 -1.5 -0.8Other apparel knitting mills 31519 -5.1 -5.0 0.1Cut and sew apparel 3152 -3.0 -2.7 0.3Cut and sew apparel contractors 31521 2.9 3.2 0.3Men's and boys' cut and sew apparel contractors 315211 -1.4 -1.5 -0.1Women's, girls', and infants' cut and sew apparel contractors 315212 7.6 8.1 0.5
Table 3. Comparison of average annual percentage growth rates of supervisory (nonproduction) worker hours, 1987-2002
27

Description NAICS Old New New - Old
Table 3. Comparison of average annual percentage growth rates of supervisory (nonproduction) worker hours, 1987-2002
Men's and boys' cut and sew apparel 31522 -4.8 -4.4 0.4Women's and girls' cut and sew apparel 31523 -4.5 -4.3 0.2Other cut and sew apparel 31529 -0.8 -0.9 -0.1Apparel accessories and other apparel manufacturing 31599 0.3 0.4 0.1Leather and allied products 316 -2.9 -3.4 -0.5Leather and allied product manufacturing 316110 -1.3 -1.9 -0.7Footwear manufacturing 31621 -4.8 -5.2 -0.4Other leather and allied product manufacturing 31699 -1.5 -2.2 -0.7Wood products 321 0.4 0.2 -0.2Sawmills and wood preservation 32111 -1.0 -0.8 0.1Veneer, plywood, and engineered wood product manufacturing 32121 2.5 2.2 -0.2Reconstituted wood products 321219 1.7 1.9 0.3Other wood products 3219 0.2 -0.1 -0.3Millwork 32191 1.0 0.7 -0.2Wood windows and doors 321911 1.5 1.6 0.1Wood containers and pallets 321920 0.3 0.4 0.1All other wood products 32199 -0.7 -1.3 -0.6Manufactured homes (mobile homes) 321991 -0.4 -1.5 -1.2Paper and paper products 322 -0.9 -0.9 0.0Pulp, paper, and paperboard mills 3221 -2.9 -3.2 -0.2Paperboard mills 322130 -2.5 -2.7 -0.3Converted paper products 3222 0.2 0.4 0.2Paperboard containers 32221 0.3 0.6 0.2Corrugated and solid fiber boxes 322211 1.4 1.5 0.1Folding paperboard boxes 322212 -1.0 -0.6 0.4Paper bags and coated and treated paper 32222 1.4 1.4 -0.1Stationery products 32223 -0.5 -0.6 -0.1Other converted paper products 32229 -1.3 -1.3 0.1Printing and related support activities 3231 0.6 0.9 0.3Printing 32311 0.6 0.9 0.3Commercial lithographic printing 323110 0.4 0.7 0.3Commercial gravure printing 323111 15.6¹ 14.6¹ -1.0Commercial flexographic printing 323112 -0.5 0.0 0.5Commercial screen printing 323113 1.4 1.8 0.4Quick printing 323114 2.1 2.3 0.2Manifold business form printing 323116 -1.7 -2.0 -0.2Support activities for printing 32312 0.4 0.8 0.3Petroleum and coal products 3241 -2.2 -2.5 -0.2Petroleum refineries 324110 -3.1 -3.2 -0.1Chemicals 325 0.3 0.4 0.1Basic chemicals 3251 -1.6 -1.6 0.0Synthetic dyes and pigments 32513 1.0 1.5 0.5Other basic inorganic chemicals 32518 -3.0 -2.8 0.3Other basic organic chemicals 32519 -2.4 -2.2 0.2Resin, synthetic rubber, and artificial synthetic fibers and filaments 3252 -1.7 -1.8 -0.1Resin and synthetic rubber 32521 -0.4 -0.3 0.1Plastics material and resin 325211 -1.1 -0.9 0.2Synthetic rubber 325212 3.7 3.5 -0.2Artificial and synthetic fibers and filaments 32522 -4.9 -5.3 -0.4Noncellulosic organic fibers 325222 -6.7 -7.1 -0.4Pesticides, fertilizers, and other agricultural chemicals 3253 0.8 0.4 -0.3Pharmaceuticals and medicine 32541 3.8 4.7 0.8Pharmaceutical preparations 325412 3.4 4.3 0.9Paint, coatings, and adhesives 3255 -1.5 -1.4 0.1Paint and coatings 325510 -2.7 -2.6 0.1Soaps, cleaning compounds, and toilet preparations 3256 0.2 0.1 0.0
28

Description NAICS Old New New - Old
Table 3. Comparison of average annual percentage growth rates of supervisory (nonproduction) worker hours, 1987-2002
Soaps and cleaning compounds 32561 -0.7 -1.1 -0.3Soaps and other detergents 325611 0.1 -0.1 -0.2Toilet preparations 325620 1.7 2.1 0.3Other chemical products and preparations 3259 -2.8 -2.7 0.0Plastics and rubber products 326 0.6 0.6 0.0Plastics products 3261 1.3 1.3 0.0Plastics packaging materials and unlaminated film and sheets 32611 1.7 1.5 -0.1Unlaminated plastics film and sheets (except packaging) 326113 1.0 1.4 0.4Plastics pipes, pipe fittings, and unlaminated profile shapes 32612 0.2 0.6 0.4Unlaminated plastics profile shapes 326121 -0.3 0.5 0.8Plastics pipes and pipe fittings 326122 0.9 0.8 -0.1Other plastics products 32619 1.0 0.9 -0.1Rubber products 3262 -1.3 -1.3 0.0Tires 32621 -1.4 -1.5 -0.1Rubber and plastics hoses and belting 326220 -3.1 -3.3 -0.2Other rubber products 32629 -0.4 -0.5 -0.1Rubber products for mechanical use 326291 0.8 0.4 -0.4All other rubber products 326299 -2.1 -1.8 0.3Nonmetallic mineral products 327 0.4 0.4 0.1Clay products and refractories 3271 0.3 0.1 -0.2Pottery, ceramics, and plumbing fixtures 32711 0.9 0.9 0.0Clay building materials and refractories 32712 -0.1 -0.6 -0.4Glass and glass products 32721 -0.7 -0.6 0.1Flat glass 327211 -1.8 -3.0 -1.2Other pressed and blown glass and glassware 327212 1.8 2.1 0.3Glass containers 327213 -5.0 -4.6 0.4Glass products made of purchased glass 327215 -0.6 -0.3 0.2Cement and concrete products 3273 1.6 2.1 0.5Ready-mix concrete 327320 2.8 3.7 0.9Lime and gypsum products 3274 -0.3 -0.6 -0.3Other nonmetallic mineral products 3279 -1.0 -1.4 -0.4Primary metals 331 -3.1 -3.0 0.1Iron and steel mills and ferroalloy production 33111 -4.7 -4.3 0.4Steel products from purchased steel 3312 -1.1 -1.1 0.0Iron and steel pipes and tubes from purchased steel 331210 0.4 0.4 0.0Rolling and drawing of purchased steel 33122 -2.0 -2.0 0.1Rolled steel shapes 331221 -1.8 -1.9 -0.1Alumina and aluminum production and processing 33131 -4.0 -4.4 -0.4Aluminum sheets, plates, and foil 331315 -3.5 -4.7 -1.1Nonferrous metal (except aluminum) production and processing 3314 -2.5 -2.5 0.0Nonferrous metal (except aluminum) smelting and refining 33141 -3.2 -2.5 0.7Copper rolling, drawing, extruding, and alloying 33142 -2.9 -2.9 0.0Nonferrous metal (except copper and aluminum) rolling, drawing, ex 33149 -1.4 -1.8 -0.4Foundries 3315 -2.3 -2.2 0.1Ferrous metal foundries 33151 -3.6 -3.5 0.0Iron foundries 331511 -4.0 -4.0 0.0Nonferrous metal foundries 33152 -0.4 -0.2 0.2Fabricated metal products 332 -0.6 -0.6 0.0Forging and stamping 33211 -1.5 -1.4 0.1Iron and steel forging 332111 -0.4 -0.4 0.0Metal stamping 332116 -2.5 -2.7 -0.2Cutlery and handtools 33221 -2.2 -2.1 0.1Hand and edge tools 332212 -3.0 -2.9 0.1Architectural and structural metals 3323 0.3 0.4 0.1Plate work and fabricated structural products 33231 0.4 0.4 0.0Prefabricated metal building and components 332311 3.7 3.0 -0.7
29

Description NAICS Old New New - Old
Table 3. Comparison of average annual percentage growth rates of supervisory (nonproduction) worker hours, 1987-2002
Fabricated structural metals 332312 0.6 0.8 0.1Plate work 332313 -2.4 -2.4 0.0Ornamental and architectural metal products 33232 0.3 0.5 0.1Metal windows and doors 332321 -0.5 -0.3 0.2Sheet metal work 332322 0.8 1.1 0.2Ornamental and architectural metal work 332323 1.0 0.8 -0.2Boilers, tanks, and shipping containers 3324 -2.8 -2.7 0.1Hardware 332510 -2.9 -2.9 0.0Spring and wire products 33261 -0.3 -0.5 -0.2Machine shops; turned products; and screws, nuts, and bolts 3327 0.2 0.2 0.0Machine shops 332710 0.6 0.8 0.2Turned products and screws, nuts, and bolts 33272 -0.8 -1.0 -0.2Precision turned products 332721 -0.3 -0.4 -0.1Bolts, nuts, screws, rivets, and washers 332722 -1.2 -1.5 -0.3Coating, engraving, heat treating, and allied activities 33281 0.3 0.1 -0.2Electroplating, plating, polishing, anodizing and coloring 332813 -1.2 -1.3 -0.2Other fabricated metal products 3329 -1.1 -1.1 0.0Metal valves 33291 -0.9 -1.2 -0.3Fluid power valves and hose fittings 332912 -0.3 -0.2 0.1Plumbing fixture fittings and trim 332913 -1.2 -1.1 0.0All other fabricated metal products 33299 -1.2 -1.1 0.1Ball and roller bearings 332991 -0.3 -0.5 -0.2Machinery 333 -0.6 -0.6 0.0Agriculture, construction, and mining machinery 3331 -1.4 -0.8 0.6Agricultural implements 33311 -0.5 -0.6 -0.1Farm machinery and equipment 333111 -1.8 -2.2 -0.4Lawn and garden tractors and home lawn and garden equipment 333112 4.3 4.7 0.5Construction machinery 333120 -1.9 -2.6 -0.7Mining and oil and gas field machinery 33313 0.7 1.1 0.3Industrial machinery 3332 1.4 1.5 0.0Semiconductor machinery 333295 0.5 0.7 0.1Commercial and service industry machinery 33331 -0.8 -1.0 -0.2Office machinery 333313 -3.7 -4.0 -0.3Photographic and photocopying equipment 333315 -5.1 -5.6 -0.6HVAC and commercial refrigeration equipment 33341 -0.2 -0.1 0.1Air-conditioning and warm air heating equipment and commercial an333415 0.4 0.4 0.1Metalworking machinery 33351 -1.1 -1.3 -0.2Industrial molds 333511 -0.2 -0.3 -0.1Special dies and tools, die sets, jigs, and fixtures 333514 -0.9 -1.2 -0.3Turbine and power transmission equipment 33361 -1.2 -1.1 0.0Turbines and turbine generator set units 333611 0.3 1.6 1.3Other general purpose machinery 3339 -0.7 -0.9 -0.3Pumps and compressors 33391 1.0 1.4 0.5Air and gas compressors 333912 1.5 2.2 0.7Material handling equipment 33392 -0.9 -1.0 -0.1Conveyor and conveying equipment 333922 0.0 0.1 0.0Overhead traveling cranes, hoists, and monorail systems 333923 -1.7 -1.3 0.3All other general purpose machinery 33399 -1.1 -1.7 -0.5Computer and electronic products 334 -1.6 -1.7 -0.1Computer and peripheral equipment 33411 -3.5 -3.9 -0.4Electronic computers 334111 -4.9 -5.4 -0.5Other computer peripheral equipment 334119 -0.5 -0.2 0.3Communications equipment 3342 -1.2 -1.3 -0.1Telephone apparatus manufacturing 334210 -2.3 -2.8 -0.5Radio and television broadcasting and wireless communications equip334220 -1.2 -1.3 -0.1Audio and video equipment manufacturing 334310 -1.1 -1.3 -0.1
30
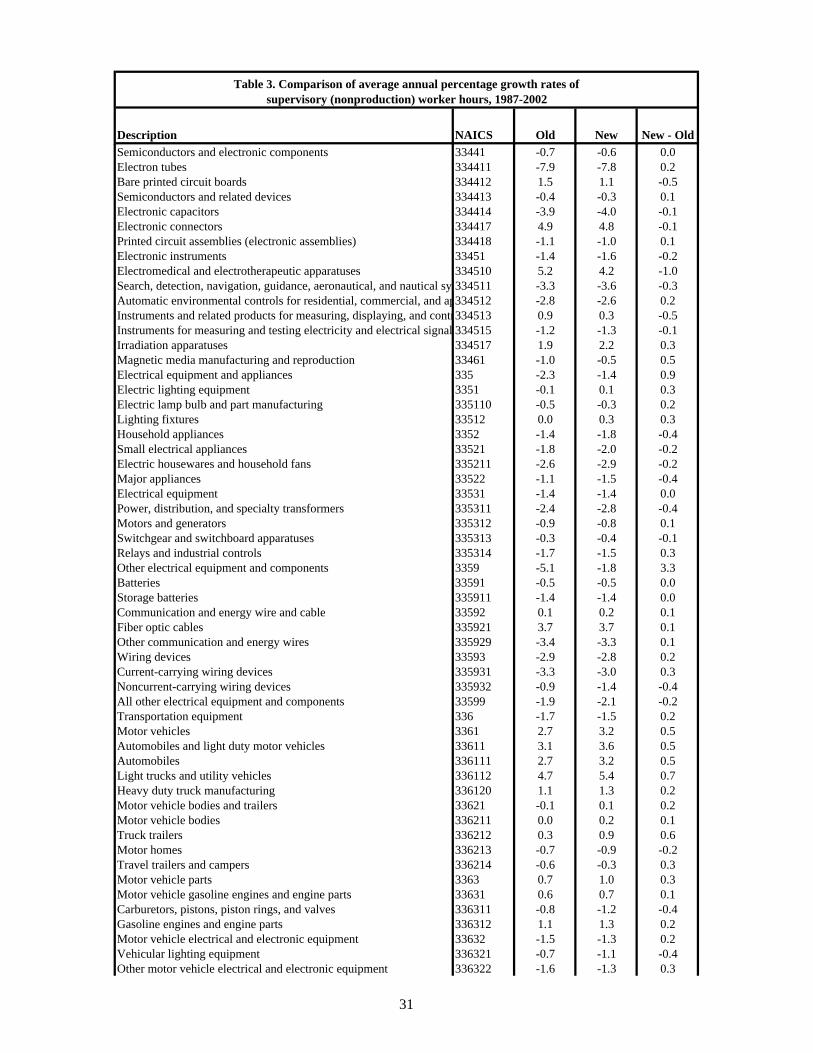
Description NAICS Old New New - Old
Table 3. Comparison of average annual percentage growth rates of supervisory (nonproduction) worker hours, 1987-2002
Semiconductors and electronic components 33441 -0.7 -0.6 0.0Electron tubes 334411 -7.9 -7.8 0.2Bare printed circuit boards 334412 1.5 1.1 -0.5Semiconductors and related devices 334413 -0.4 -0.3 0.1Electronic capacitors 334414 -3.9 -4.0 -0.1Electronic connectors 334417 4.9 4.8 -0.1Printed circuit assemblies (electronic assemblies) 334418 -1.1 -1.0 0.1Electronic instruments 33451 -1.4 -1.6 -0.2Electromedical and electrotherapeutic apparatuses 334510 5.2 4.2 -1.0Search, detection, navigation, guidance, aeronautical, and nautical sy 334511 -3.3 -3.6 -0.3Automatic environmental controls for residential, commercial, and ap334512 -2.8 -2.6 0.2Instruments and related products for measuring, displaying, and contr334513 0.9 0.3 -0.5Instruments for measuring and testing electricity and electrical signal 334515 -1.2 -1.3 -0.1Irradiation apparatuses 334517 1.9 2.2 0.3Magnetic media manufacturing and reproduction 33461 -1.0 -0.5 0.5Electrical equipment and appliances 335 -2.3 -1.4 0.9Electric lighting equipment 3351 -0.1 0.1 0.3Electric lamp bulb and part manufacturing 335110 -0.5 -0.3 0.2Lighting fixtures 33512 0.0 0.3 0.3Household appliances 3352 -1.4 -1.8 -0.4Small electrical appliances 33521 -1.8 -2.0 -0.2Electric housewares and household fans 335211 -2.6 -2.9 -0.2Major appliances 33522 -1.1 -1.5 -0.4Electrical equipment 33531 -1.4 -1.4 0.0Power, distribution, and specialty transformers 335311 -2.4 -2.8 -0.4Motors and generators 335312 -0.9 -0.8 0.1Switchgear and switchboard apparatuses 335313 -0.3 -0.4 -0.1Relays and industrial controls 335314 -1.7 -1.5 0.3Other electrical equipment and components 3359 -5.1 -1.8 3.3Batteries 33591 -0.5 -0.5 0.0Storage batteries 335911 -1.4 -1.4 0.0Communication and energy wire and cable 33592 0.1 0.2 0.1Fiber optic cables 335921 3.7 3.7 0.1Other communication and energy wires 335929 -3.4 -3.3 0.1Wiring devices 33593 -2.9 -2.8 0.2Current-carrying wiring devices 335931 -3.3 -3.0 0.3Noncurrent-carrying wiring devices 335932 -0.9 -1.4 -0.4All other electrical equipment and components 33599 -1.9 -2.1 -0.2Transportation equipment 336 -1.7 -1.5 0.2Motor vehicles 3361 2.7 3.2 0.5Automobiles and light duty motor vehicles 33611 3.1 3.6 0.5Automobiles 336111 2.7 3.2 0.5Light trucks and utility vehicles 336112 4.7 5.4 0.7Heavy duty truck manufacturing 336120 1.1 1.3 0.2Motor vehicle bodies and trailers 33621 -0.1 0.1 0.2Motor vehicle bodies 336211 0.0 0.2 0.1Truck trailers 336212 0.3 0.9 0.6Motor homes 336213 -0.7 -0.9 -0.2Travel trailers and campers 336214 -0.6 -0.3 0.3Motor vehicle parts 3363 0.7 1.0 0.3Motor vehicle gasoline engines and engine parts 33631 0.6 0.7 0.1Carburetors, pistons, piston rings, and valves 336311 -0.8 -1.2 -0.4Gasoline engines and engine parts 336312 1.1 1.3 0.2Motor vehicle electrical and electronic equipment 33632 -1.5 -1.3 0.2Vehicular lighting equipment 336321 -0.7 -1.1 -0.4Other motor vehicle electrical and electronic equipment 336322 -1.6 -1.3 0.3
31

Description NAICS Old New New - Old
Table 3. Comparison of average annual percentage growth rates of supervisory (nonproduction) worker hours, 1987-2002
Motor vehicle steering and suspension components (except spring) m336330 1.2 1.8 0.7Motor vehicle brake system manufacturing 336340 2.3 2.6 0.3Motor vehicle transmission and power train parts manufacturing 336350 1.6 2.0 0.5Motor vehicle seating and interior trim manufacturing 336360 1.4 1.2 -0.2Motor vehicle metal stamping 336370 1.7 2.5 0.8Other motor vehicle parts 33639 0.9 1.1 0.2All other motor vehicle parts 336399 1.3 1.5 0.2Aerospace products and parts 33641 -3.5 -3.4 0.1Aircraft 336411 -2.6 -2.6 0.0Aircraft engines and engine parts 336412 -3.4 -3.0 0.4Other aircraft parts and auxiliary equipment 336413 -3.0 -2.9 0.0Railroad rolling stock manufacturing 336510 0.7 0.7 0.0Ship and boat building 33661 -0.7 -1.0 -0.3Ship building and repairing 336611 -1.0 -1.1 -0.1Boat building 336612 0.0 -0.5 -0.5Other transportation equipment 33699 -0.3 -0.1 0.1Furniture and related products 337 -0.3 -0.4 -0.1Household and institutional furniture and kitchen cabinets 3371 -0.7 -0.8 -0.1Wood kitchen cabinets and countertops 337110 1.5 1.8 0.4Household and institutional furniture 33712 -1.9 -2.1 -0.3Upholstered household furniture 337121 -1.8 -2.1 -0.3Nonupholstered wood household furniture 337122 -2.0 -2.3 -0.3Office furniture (including fixtures) 33721 0.0 -0.2 -0.2Office furniture (except wood) 337214 1.8 0.9 -0.8Showcases, partitions, shelving, and lockers 337215 -0.9 -1.1 -0.1Other furniture related products 3379 1.0 0.9 0.0Miscellaneous manufacturing 339 0.4 0.6 0.2Medical equipment and supplies 33911 0.3 0.7 0.4Surgical and medical instruments 339112 0.1 0.7 0.7Surgical appliances and supplies 339113 1.6 1.8 0.2Dental laboratories 339116 2.0 2.8 0.8Other miscellaneous manufacturing 3399 0.5 0.8 0.2Jewelry and silverware 33991 -1.5 -1.8 -0.3Sporting and athletic goods 339920 4.5 4.7 0.2Dolls, toys, and games 33993 -1.3 -1.1 0.2Office supplies (except paper) 33994 -1.2 -1.3 -0.1Signs 339950 2.9 3.5 0.7All other miscellaneous manufacturing 33999 -0.1 -0.2 -0.1Durable goods 423 1.1 0.9 -0.2Motor vehicles and parts 4231 1.1 0.4 -0.7Furniture and furnishings 4232 1.8 1.7 -0.1Lumber and construction supplies 4233 0.8 0.6 -0.2Commercial equipment 4234 3.5 3.0 -0.5Metals and minerals 4235 -0.6 -0.7 -0.1Electrical and electronic goods 4236 0.8 0.9 0.1Hardware and plumbing 4237 0.5 1.0 0.5Machinery and supplies 4238 -0.3 -0.3 -0.1Miscellaneous durable goods 4239 2.9 2.8 -0.1Nondurable Goods 424 0.5 0.5 0.0Paper and paper products 4241 -0.8 -1.3 -0.4Druggists' goods 424210 2.1 1.9 -0.3Apparel and piece goods 4243 -0.9 -0.5 0.5Grocery and related products 4244 1.3 1.6 0.3Farm product raw materials 4245 -2.0 -3.7 -1.7Chemicals 4246 2.1 2.2 0.1Petroleum 4247 -4.1 -4.4 -0.3
32

Description NAICS Old New New - Old
Table 3. Comparison of average annual percentage growth rates of supervisory (nonproduction) worker hours, 1987-2002
Alcoholic beverages 4248 1.8 2.6 0.8Miscellaneous nondurable goods 4249 1.3 1.1 -0.3Wholesale electronic markets and agents and brokers 4251 2.2 1.7 -0.5Business to business electronic markets 425110 2.9 2.5 -0.5Wholesale trade agents and brokers 425120 2.1 1.6 -0.5Motor vehicle and parts dealers 441 1.8 1.5 -0.3Automobile dealers 4411 1.3 1.0 -0.3New car dealers 441110 0.8 0.6 -0.1Used car dealers 441120 4.0 3.1 -0.9Other motor vehicle dealers 4412 3.8 3.4 -0.4Recreational vehicle dealers 441210 6.7 6.2 -0.5Motorcycle, boat, and other motor vehicle dealers 44122 3.3 2.9 -0.4Automotive parts, accessories, and tire stores 4413 2.5 2.4 -0.1Automotive parts and accessories stores 441310 2.9 2.6 -0.3Tire dealers 441320 1.9 2.2 0.4Furniture and home furnishings stores 442 2.6 2.4 -0.2Furniture stores 442110 2.6 2.6 0.1Home furnishings stores 4422 2.7 2.2 -0.5Floor covering stores 442210 1.6 1.5 -0.1Other home furnishings stores 44229 3.8 3.3 -0.5Electronics and appliance stores 4431 5.1 5.0 0.0Appliance, television, and other electronics stores 44311 4.2 4.0 -0.2Household appliance stores 443111 2.8 2.8 0.1Radio, television, and other electronics stores 443112 4.8 4.2 -0.6Building material and garden supply stores 444 3.3 3.3 0.0Building material and supplies dealers 4441 3.4 3.5 0.1Home centers 444110 4.9 5.1 0.1Paint and wallpaper stores 444120 0.3 0.0 -0.3Hardware stores 444130 1.0 0.6 -0.4Other building material dealers 444190 3.4 3.5 0.1Lawn and garden equipment and supplies stores 4442 1.9 1.6 -0.3Outdoor power equipment stores 444210 2.2 1.7 -0.6Nursery, garden center, and farm supply stores 444220 1.8 1.6 -0.2Food and beverage stores 445 4.4 4.2 -0.2Grocery stores 4451 5.3 5.1 -0.2Supermarkets and other grocery (except convenience) stores 445110 5.3 5.1 -0.2Convenience stores 445120 5.0 4.2 -0.8Specialty food stores 4452 3.3 3.5 0.2Fruit and vegetable markets 445230 5.6 6.0 0.5Other specialty food stores 44529 3.7 4.1 0.3Beer, wine, and liquor stores 445310 0.2 -0.8 -1.0Health and personal care stores 4461 1.4 1.1 -0.3Pharmacies and drug stores 446110 0.4 -0.1 -0.5Cosmetics, beauty supplies, and perfume stores 446120 4.8 5.4 0.5Optical goods stores 446130 2.3 2.5 0.2Other health and personal care stores 44619 5.4 5.6 0.2Food (health) supplement stores 446191 4.3 4.0 -0.3All other health and personal care stores 446199 6.6 7.2 0.6Gasoline stations 4471 2.2 0.8 -1.4Gasoline stations with convenience stores 447110 2.4 1.0 -1.4Other gasoline stations 447190 1.3 0.0 -1.4Clothing and clothing accessories stores 448 1.2 0.9 -0.3Clothing stores 4481 1.9 1.4 -0.5Men's clothing stores 448110 -2.1 -2.5 -0.5Women's clothing stores 448120 -0.3 -1.1 -0.9Children's and infants' clothing stores 448130 9.8 9.3 -0.5
33
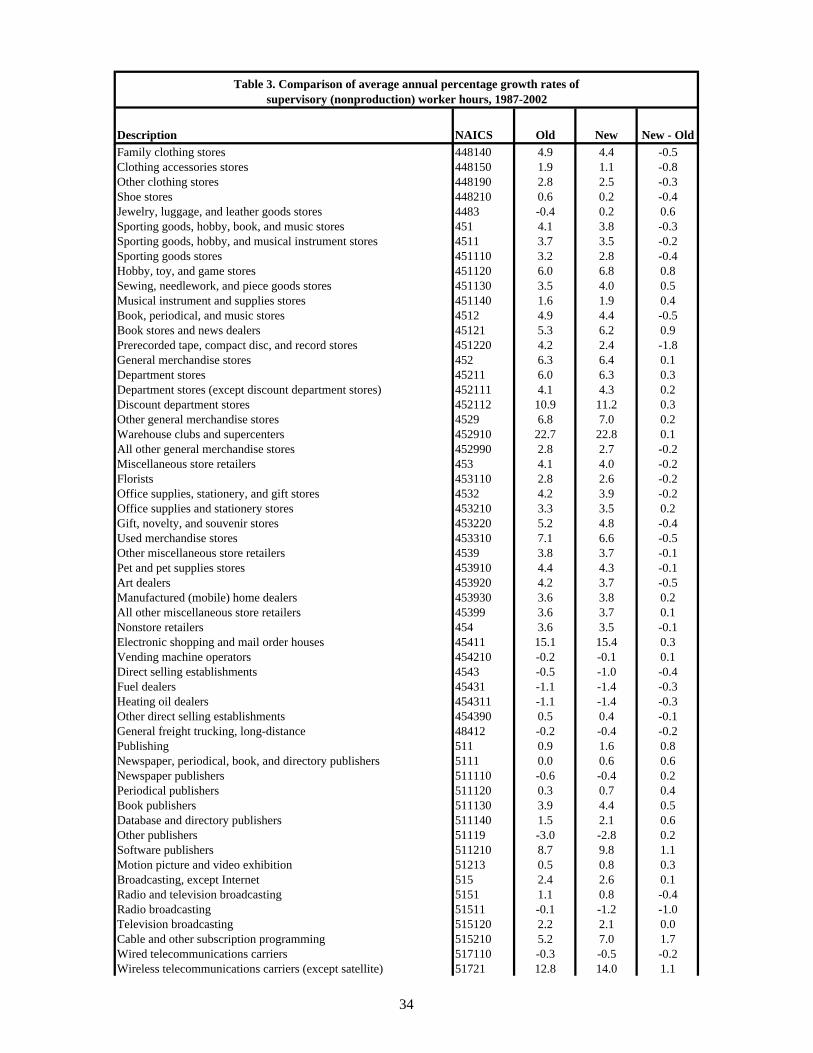
Description NAICS Old New New - Old
Table 3. Comparison of average annual percentage growth rates of supervisory (nonproduction) worker hours, 1987-2002
Family clothing stores 448140 4.9 4.4 -0.5Clothing accessories stores 448150 1.9 1.1 -0.8Other clothing stores 448190 2.8 2.5 -0.3Shoe stores 448210 0.6 0.2 -0.4Jewelry, luggage, and leather goods stores 4483 -0.4 0.2 0.6Sporting goods, hobby, book, and music stores 451 4.1 3.8 -0.3Sporting goods, hobby, and musical instrument stores 4511 3.7 3.5 -0.2Sporting goods stores 451110 3.2 2.8 -0.4Hobby, toy, and game stores 451120 6.0 6.8 0.8Sewing, needlework, and piece goods stores 451130 3.5 4.0 0.5Musical instrument and supplies stores 451140 1.6 1.9 0.4Book, periodical, and music stores 4512 4.9 4.4 -0.5Book stores and news dealers 45121 5.3 6.2 0.9Prerecorded tape, compact disc, and record stores 451220 4.2 2.4 -1.8General merchandise stores 452 6.3 6.4 0.1Department stores 45211 6.0 6.3 0.3Department stores (except discount department stores) 452111 4.1 4.3 0.2Discount department stores 452112 10.9 11.2 0.3Other general merchandise stores 4529 6.8 7.0 0.2Warehouse clubs and supercenters 452910 22.7 22.8 0.1All other general merchandise stores 452990 2.8 2.7 -0.2Miscellaneous store retailers 453 4.1 4.0 -0.2Florists 453110 2.8 2.6 -0.2Office supplies, stationery, and gift stores 4532 4.2 3.9 -0.2Office supplies and stationery stores 453210 3.3 3.5 0.2Gift, novelty, and souvenir stores 453220 5.2 4.8 -0.4Used merchandise stores 453310 7.1 6.6 -0.5Other miscellaneous store retailers 4539 3.8 3.7 -0.1Pet and pet supplies stores 453910 4.4 4.3 -0.1Art dealers 453920 4.2 3.7 -0.5Manufactured (mobile) home dealers 453930 3.6 3.8 0.2All other miscellaneous store retailers 45399 3.6 3.7 0.1Nonstore retailers 454 3.6 3.5 -0.1Electronic shopping and mail order houses 45411 15.1 15.4 0.3Vending machine operators 454210 -0.2 -0.1 0.1Direct selling establishments 4543 -0.5 -1.0 -0.4Fuel dealers 45431 -1.1 -1.4 -0.3Heating oil dealers 454311 -1.1 -1.4 -0.3Other direct selling establishments 454390 0.5 0.4 -0.1General freight trucking, long-distance 48412 -0.2 -0.4 -0.2Publishing 511 0.9 1.6 0.8Newspaper, periodical, book, and directory publishers 5111 0.0 0.6 0.6Newspaper publishers 511110 -0.6 -0.4 0.2Periodical publishers 511120 0.3 0.7 0.4Book publishers 511130 3.9 4.4 0.5Database and directory publishers 511140 1.5 2.1 0.6Other publishers 51119 -3.0 -2.8 0.2Software publishers 511210 8.7 9.8 1.1Motion picture and video exhibition 51213 0.5 0.8 0.3Broadcasting, except Internet 515 2.4 2.6 0.1Radio and television broadcasting 5151 1.1 0.8 -0.4Radio broadcasting 51511 -0.1 -1.2 -1.0Television broadcasting 515120 2.2 2.1 0.0Cable and other subscription programming 515210 5.2 7.0 1.7Wired telecommunications carriers 517110 -0.3 -0.5 -0.2Wireless telecommunications carriers (except satellite) 51721 12.8 14.0 1.1
34
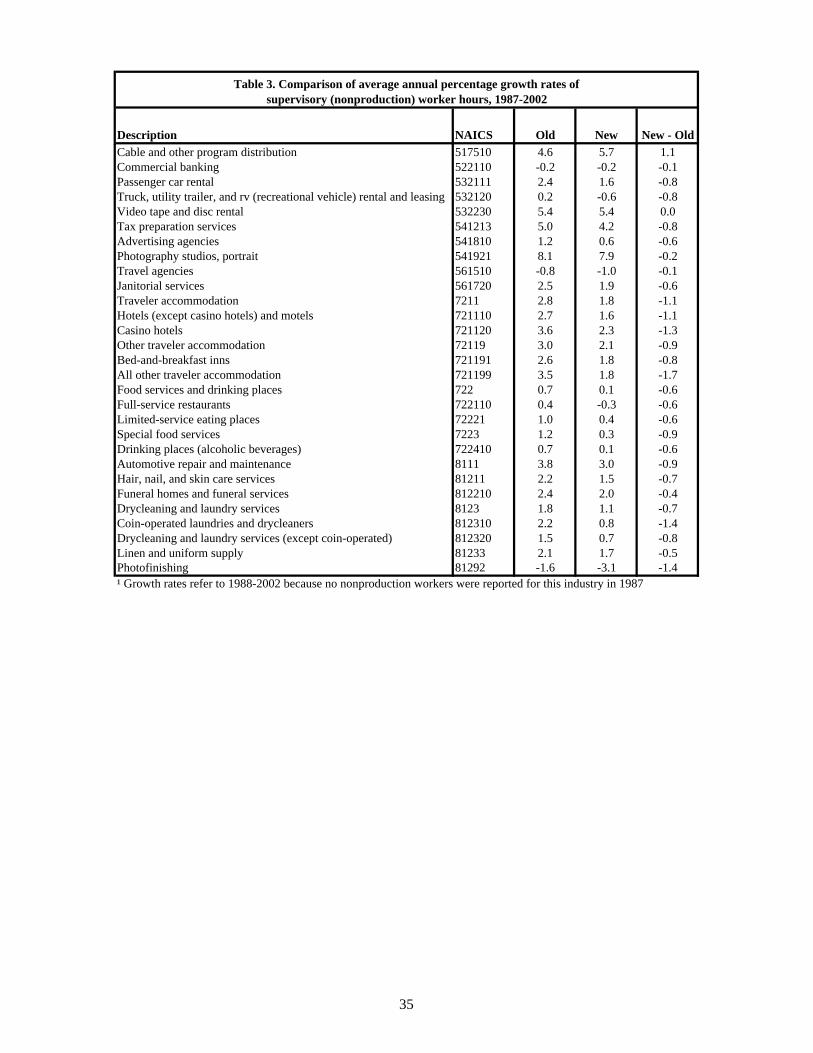
Description NAICS Old New New - Old
Table 3. Comparison of average annual percentage growth rates of supervisory (nonproduction) worker hours, 1987-2002
Cable and other program distribution 517510 4.6 5.7 1.1Commercial banking 522110 -0.2 -0.2 -0.1Passenger car rental 532111 2.4 1.6 -0.8Truck, utility trailer, and rv (recreational vehicle) rental and leasing 532120 0.2 -0.6 -0.8Video tape and disc rental 532230 5.4 5.4 0.0Tax preparation services 541213 5.0 4.2 -0.8Advertising agencies 541810 1.2 0.6 -0.6Photography studios, portrait 541921 8.1 7.9 -0.2Travel agencies 561510 -0.8 -1.0 -0.1Janitorial services 561720 2.5 1.9 -0.6Traveler accommodation 7211 2.8 1.8 -1.1Hotels (except casino hotels) and motels 721110 2.7 1.6 -1.1Casino hotels 721120 3.6 2.3 -1.3Other traveler accommodation 72119 3.0 2.1 -0.9Bed-and-breakfast inns 721191 2.6 1.8 -0.8All other traveler accommodation 721199 3.5 1.8 -1.7Food services and drinking places 722 0.7 0.1 -0.6Full-service restaurants 722110 0.4 -0.3 -0.6Limited-service eating places 72221 1.0 0.4 -0.6Special food services 7223 1.2 0.3 -0.9Drinking places (alcoholic beverages) 722410 0.7 0.1 -0.6Automotive repair and maintenance 8111 3.8 3.0 -0.9Hair, nail, and skin care services 81211 2.2 1.5 -0.7Funeral homes and funeral services 812210 2.4 2.0 -0.4Drycleaning and laundry services 8123 1.8 1.1 -0.7Coin-operated laundries and drycleaners 812310 2.2 0.8 -1.4Drycleaning and laundry services (except coin-operated) 812320 1.5 0.7 -0.8Linen and uniform supply 81233 2.1 1.7 -0.5Photofinishing 81292 -1.6 -3.1 -1.4¹ Growth rates refer to 1988-2002 because no nonproduction workers were reported for this industry in 1987
35

Description NAICS1987-2002
Average PercentFood manufacturing 311 22Animal food manufacturing 31111 35Grain and oilseed milling 3112 28Breakfast cereals 311230 15Sugar and confectionery products 3113 19Sugar 31131 20Nonchocolate confectioneries 311340 20Fruit and vegetable preserving and specialty 3114 17Frozen food 31141 15Frozen fruits, juices, and vegetables 311411 13Frozen specialty foods 311412 17Fruit and vegetable canning, pickling, and drying 31142 19Fruit and vegetable canning 311421 20Specialty canning 311422 15Dried and dehydrated foods 311423 18Dairy products 3115 33Dairy products (except frozen) 31151 35Fluid milk 311511 42Ice cream and frozen desserts 311520 24Animal slaughtering and processing 31161 14Animal (except poultry) slaughtering 311611 13Poultry processing 311615 10Seafood product preparation and packaging 31171 17Bakeries and tortilla manufacturing 3118 26Bread and bakery products 31181 28Retail bakeries 311811 13Other food products 3119 31Snack foods 31191 25Beverages and tobacco products 312 44Beverages 3121 48Soft drinks and ice 31211 51Soft drinks 312111 55Tobacco and tobacco products 3122 25Textile mills 313 16Fiber, yarn, and thread mills 31311 14Fabric mills 3132 15Broadwoven fabric mills 313210 11Textile and fabric finishing mills 3133 19Broadwoven fabric finishing mills 313311 21Textile product mills 314 19Textile furnishings mills 3141 18Carpet and rug mills 314110 22Curtain and linen mills 31412 15Other textile product mills 3149 21Textile bag and canvas mills 31491 24All other textile products 31499 19Apparel 315 13Apparel knitting mills 3151 14Hosiery and sock mills 31511 14Sheer hosiery mills 315111 14Other hosiery and sock mills 315119 13Other apparel knitting mills 31519 15Cut and sew apparel 3152 12
Table 4. Average concentration of supervisory (nonproduction) workers by industry, 1987-2002
36
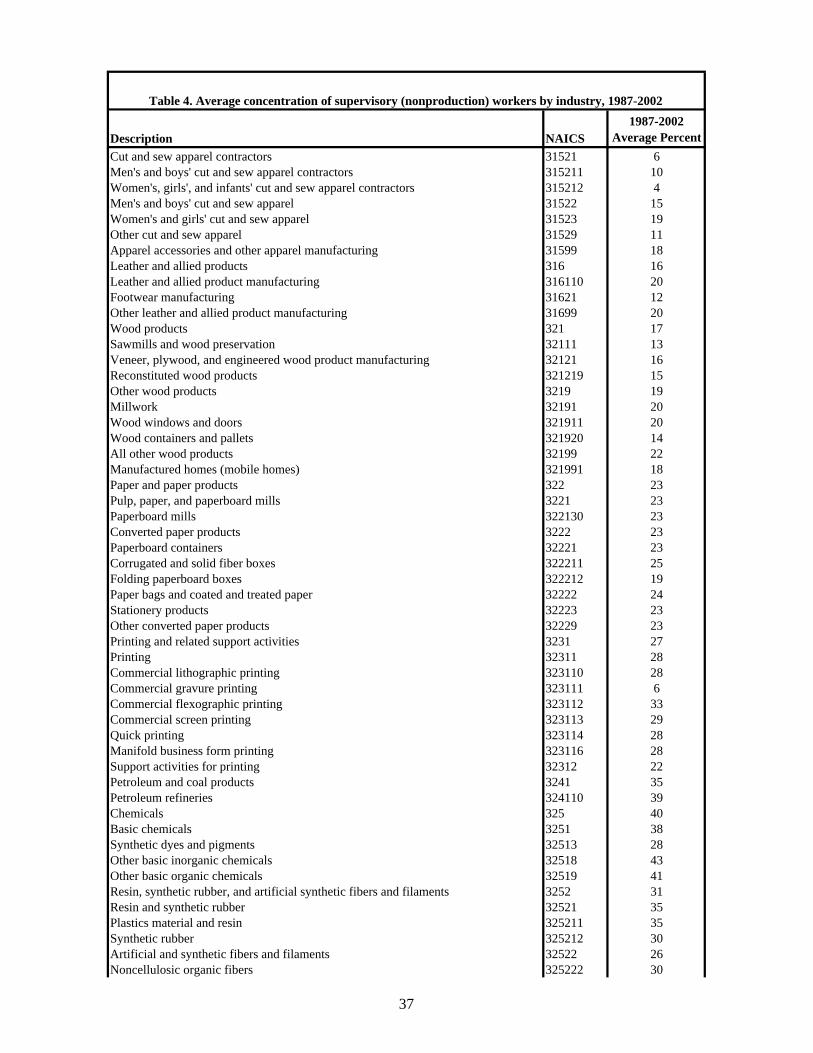
Description NAICS1987-2002
Average Percent
Table 4. Average concentration of supervisory (nonproduction) workers by industry, 1987-2002
Cut and sew apparel contractors 31521 6Men's and boys' cut and sew apparel contractors 315211 10Women's, girls', and infants' cut and sew apparel contractors 315212 4Men's and boys' cut and sew apparel 31522 15Women's and girls' cut and sew apparel 31523 19Other cut and sew apparel 31529 11Apparel accessories and other apparel manufacturing 31599 18Leather and allied products 316 16Leather and allied product manufacturing 316110 20Footwear manufacturing 31621 12Other leather and allied product manufacturing 31699 20Wood products 321 17Sawmills and wood preservation 32111 13Veneer, plywood, and engineered wood product manufacturing 32121 16Reconstituted wood products 321219 15Other wood products 3219 19Millwork 32191 20Wood windows and doors 321911 20Wood containers and pallets 321920 14All other wood products 32199 22Manufactured homes (mobile homes) 321991 18Paper and paper products 322 23Pulp, paper, and paperboard mills 3221 23Paperboard mills 322130 23Converted paper products 3222 23Paperboard containers 32221 23Corrugated and solid fiber boxes 322211 25Folding paperboard boxes 322212 19Paper bags and coated and treated paper 32222 24Stationery products 32223 23Other converted paper products 32229 23Printing and related support activities 3231 27Printing 32311 28Commercial lithographic printing 323110 28Commercial gravure printing 323111 6Commercial flexographic printing 323112 33Commercial screen printing 323113 29Quick printing 323114 28Manifold business form printing 323116 28Support activities for printing 32312 22Petroleum and coal products 3241 35Petroleum refineries 324110 39Chemicals 325 40Basic chemicals 3251 38Synthetic dyes and pigments 32513 28Other basic inorganic chemicals 32518 43Other basic organic chemicals 32519 41Resin, synthetic rubber, and artificial synthetic fibers and filaments 3252 31Resin and synthetic rubber 32521 35Plastics material and resin 325211 35Synthetic rubber 325212 30Artificial and synthetic fibers and filaments 32522 26Noncellulosic organic fibers 325222 30
37
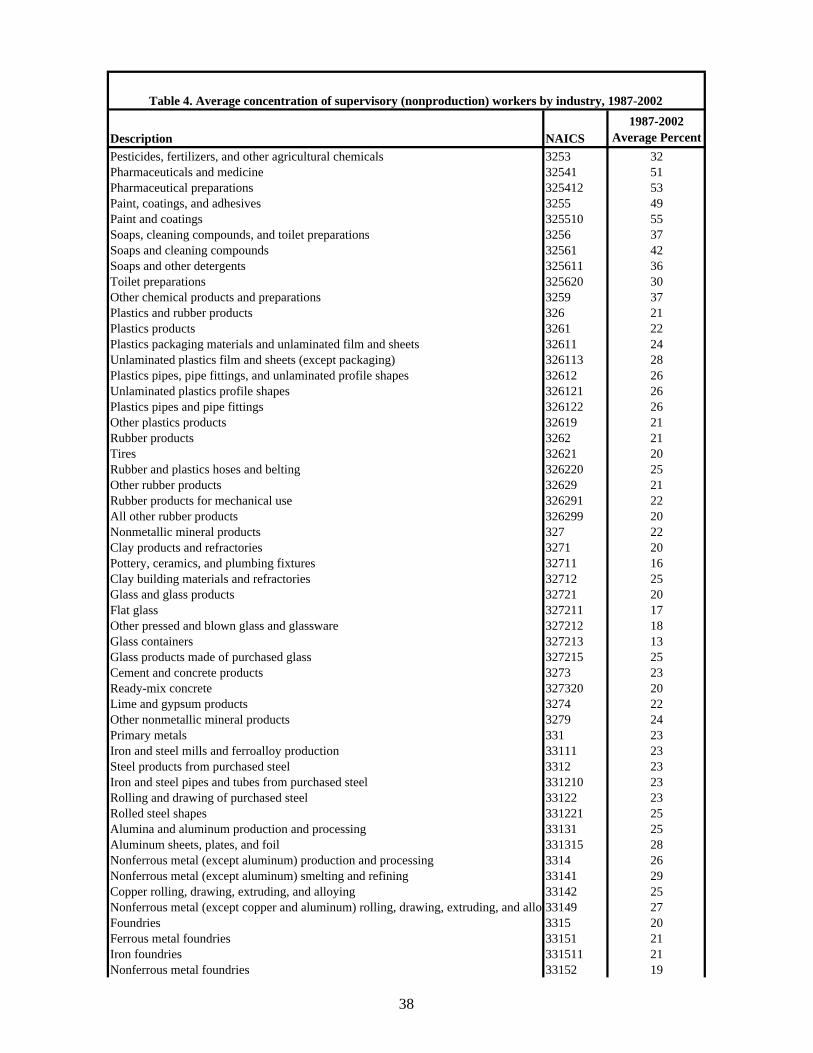
Description NAICS1987-2002
Average Percent
Table 4. Average concentration of supervisory (nonproduction) workers by industry, 1987-2002
Pesticides, fertilizers, and other agricultural chemicals 3253 32Pharmaceuticals and medicine 32541 51Pharmaceutical preparations 325412 53Paint, coatings, and adhesives 3255 49Paint and coatings 325510 55Soaps, cleaning compounds, and toilet preparations 3256 37Soaps and cleaning compounds 32561 42Soaps and other detergents 325611 36Toilet preparations 325620 30Other chemical products and preparations 3259 37Plastics and rubber products 326 21Plastics products 3261 22Plastics packaging materials and unlaminated film and sheets 32611 24Unlaminated plastics film and sheets (except packaging) 326113 28Plastics pipes, pipe fittings, and unlaminated profile shapes 32612 26Unlaminated plastics profile shapes 326121 26Plastics pipes and pipe fittings 326122 26Other plastics products 32619 21Rubber products 3262 21Tires 32621 20Rubber and plastics hoses and belting 326220 25Other rubber products 32629 21Rubber products for mechanical use 326291 22All other rubber products 326299 20Nonmetallic mineral products 327 22Clay products and refractories 3271 20Pottery, ceramics, and plumbing fixtures 32711 16Clay building materials and refractories 32712 25Glass and glass products 32721 20Flat glass 327211 17Other pressed and blown glass and glassware 327212 18Glass containers 327213 13Glass products made of purchased glass 327215 25Cement and concrete products 3273 23Ready-mix concrete 327320 20Lime and gypsum products 3274 22Other nonmetallic mineral products 3279 24Primary metals 331 23Iron and steel mills and ferroalloy production 33111 23Steel products from purchased steel 3312 23Iron and steel pipes and tubes from purchased steel 331210 23Rolling and drawing of purchased steel 33122 23Rolled steel shapes 331221 25Alumina and aluminum production and processing 33131 25Aluminum sheets, plates, and foil 331315 28Nonferrous metal (except aluminum) production and processing 3314 26Nonferrous metal (except aluminum) smelting and refining 33141 29Copper rolling, drawing, extruding, and alloying 33142 25Nonferrous metal (except copper and aluminum) rolling, drawing, extruding, and alloy33149 27Foundries 3315 20Ferrous metal foundries 33151 21Iron foundries 331511 21Nonferrous metal foundries 33152 19
38

Description NAICS1987-2002
Average Percent
Table 4. Average concentration of supervisory (nonproduction) workers by industry, 1987-2002
Fabricated metal products 332 26Forging and stamping 33211 25Iron and steel forging 332111 24Metal stamping 332116 25Cutlery and handtools 33221 25Hand and edge tools 332212 26Architectural and structural metals 3323 27Plate work and fabricated structural products 33231 27Prefabricated metal building and components 332311 32Fabricated structural metals 332312 26Plate work 332313 26Ornamental and architectural metal products 33232 27Metal windows and doors 332321 30Sheet metal work 332322 24Ornamental and architectural metal work 332323 29Boilers, tanks, and shipping containers 3324 24Hardware 332510 26Spring and wire products 33261 19Machine shops; turned products; and screws, nuts, and bolts 3327 24Machine shops 332710 25Turned products and screws, nuts, and bolts 33272 24Precision turned products 332721 21Bolts, nuts, screws, rivets, and washers 332722 26Coating, engraving, heat treating, and allied activities 33281 21Electroplating, plating, polishing, anodizing and coloring 332813 21Other fabricated metal products 3329 30Metal valves 33291 30Fluid power valves and hose fittings 332912 32Plumbing fixture fittings and trim 332913 23All other fabricated metal products 33299 30Ball and roller bearings 332991 20Machinery 333 34Agriculture, construction, and mining machinery 3331 31Agricultural implements 33311 26Farm machinery and equipment 333111 29Lawn and garden tractors and home lawn and garden equipment 333112 18Construction machinery 333120 37Mining and oil and gas field machinery 33313 30Industrial machinery 3332 38Semiconductor machinery 333295 53Commercial and service industry machinery 33331 41Office machinery 333313 58Photographic and photocopying equipment 333315 34HVAC and commercial refrigeration equipment 33341 28Air-conditioning and warm air heating equipment and commercial and industrial refrig333415 25Metalworking machinery 33351 29Industrial molds 333511 24Special dies and tools, die sets, jigs, and fixtures 333514 24Turbine and power transmission equipment 33361 32Turbines and turbine generator set units 333611 39Other general purpose machinery 3339 39Pumps and compressors 33391 43Air and gas compressors 333912 44
39
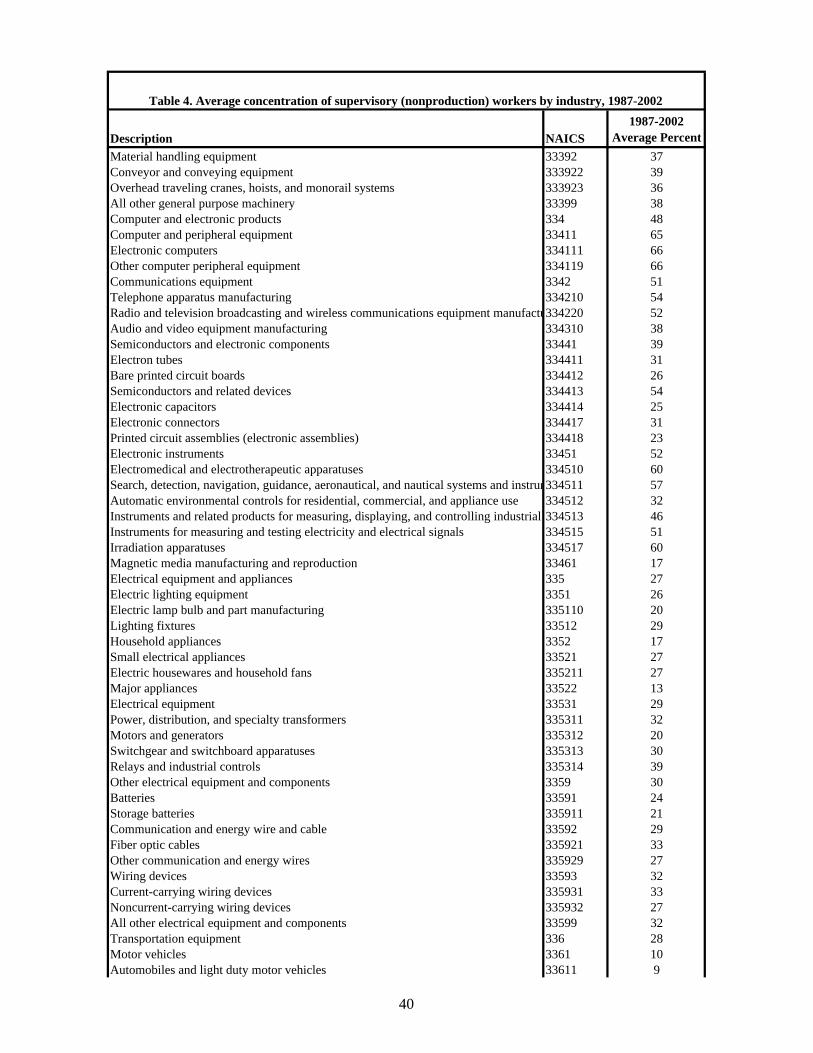
Description NAICS1987-2002
Average Percent
Table 4. Average concentration of supervisory (nonproduction) workers by industry, 1987-2002
Material handling equipment 33392 37Conveyor and conveying equipment 333922 39Overhead traveling cranes, hoists, and monorail systems 333923 36All other general purpose machinery 33399 38Computer and electronic products 334 48Computer and peripheral equipment 33411 65Electronic computers 334111 66Other computer peripheral equipment 334119 66Communications equipment 3342 51Telephone apparatus manufacturing 334210 54Radio and television broadcasting and wireless communications equipment manufactu334220 52Audio and video equipment manufacturing 334310 38Semiconductors and electronic components 33441 39Electron tubes 334411 31Bare printed circuit boards 334412 26Semiconductors and related devices 334413 54Electronic capacitors 334414 25Electronic connectors 334417 31Printed circuit assemblies (electronic assemblies) 334418 23Electronic instruments 33451 52Electromedical and electrotherapeutic apparatuses 334510 60Search, detection, navigation, guidance, aeronautical, and nautical systems and instrum334511 57Automatic environmental controls for residential, commercial, and appliance use 334512 32Instruments and related products for measuring, displaying, and controlling industrial 334513 46Instruments for measuring and testing electricity and electrical signals 334515 51Irradiation apparatuses 334517 60Magnetic media manufacturing and reproduction 33461 17Electrical equipment and appliances 335 27Electric lighting equipment 3351 26Electric lamp bulb and part manufacturing 335110 20Lighting fixtures 33512 29Household appliances 3352 17Small electrical appliances 33521 27Electric housewares and household fans 335211 27Major appliances 33522 13Electrical equipment 33531 29Power, distribution, and specialty transformers 335311 32Motors and generators 335312 20Switchgear and switchboard apparatuses 335313 30Relays and industrial controls 335314 39Other electrical equipment and components 3359 30Batteries 33591 24Storage batteries 335911 21Communication and energy wire and cable 33592 29Fiber optic cables 335921 33Other communication and energy wires 335929 27Wiring devices 33593 32Current-carrying wiring devices 335931 33Noncurrent-carrying wiring devices 335932 27All other electrical equipment and components 33599 32Transportation equipment 336 28Motor vehicles 3361 10Automobiles and light duty motor vehicles 33611 9
40

Description NAICS1987-2002
Average Percent
Table 4. Average concentration of supervisory (nonproduction) workers by industry, 1987-2002
Automobiles 336111 11Light trucks and utility vehicles 336112 6Heavy duty truck manufacturing 336120 15Motor vehicle bodies and trailers 33621 22Motor vehicle bodies 336211 23Truck trailers 336212 21Motor homes 336213 20Travel trailers and campers 336214 22Motor vehicle parts 3363 19Motor vehicle gasoline engines and engine parts 33631 21Carburetors, pistons, piston rings, and valves 336311 20Gasoline engines and engine parts 336312 21Motor vehicle electrical and electronic equipment 33632 22Vehicular lighting equipment 336321 24Other motor vehicle electrical and electronic equipment 336322 22Motor vehicle steering and suspension components (except spring) manufacturing 336330 17Motor vehicle brake system manufacturing 336340 19Motor vehicle transmission and power train parts manufacturing 336350 14Motor vehicle seating and interior trim manufacturing 336360 20Motor vehicle metal stamping 336370 17Other motor vehicle parts 33639 20All other motor vehicle parts 336399 19Aerospace products and parts 33641 52Aircraft 336411 53Aircraft engines and engine parts 336412 42Other aircraft parts and auxiliary equipment 336413 38Railroad rolling stock manufacturing 336510 19Ship and boat building 33661 18Ship building and repairing 336611 19Boat building 336612 18Other transportation equipment 33699 30Furniture and related products 337 21Household and institutional furniture and kitchen cabinets 3371 18Wood kitchen cabinets and countertops 337110 20Household and institutional furniture 33712 17Upholstered household furniture 337121 16Nonupholstered wood household furniture 337122 15Office furniture (including fixtures) 33721 27Office furniture (except wood) 337214 30Showcases, partitions, shelving, and lockers 337215 26Other furniture related products 3379 24Miscellaneous manufacturing 339 30Medical equipment and supplies 33911 35Surgical and medical instruments 339112 44Surgical appliances and supplies 339113 30Dental laboratories 339116 17Other miscellaneous manufacturing 3399 26Jewelry and silverware 33991 26Sporting and athletic goods 339920 20Dolls, toys, and games 33993 30Office supplies (except paper) 33994 30Signs 339950 32All other miscellaneous manufacturing 33999 26
41

Description NAICS1987-2002
Average Percent
Table 4. Average concentration of supervisory (nonproduction) workers by industry, 1987-2002
Durable goods 423 19Motor vehicles and parts 4231 17Furniture and furnishings 4232 17Lumber and construction supplies 4233 19Commercial equipment 4234 16Metals and minerals 4235 20Electrical and electronic goods 4236 25Hardware and plumbing 4237 21Machinery and supplies 4238 21Miscellaneous durable goods 4239 15Nondurable Goods 424 19Paper and paper products 4241 25Druggists' goods 424210 25Apparel and piece goods 4243 24Grocery and related products 4244 16Farm product raw materials 4245 17Chemicals 4246 24Petroleum 4247 21Alcoholic beverages 4248 16Miscellaneous nondurable goods 4249 17Wholesale electronic markets and agents and brokers 4251 20Business to business electronic markets 425110 12Wholesale trade agents and brokers 425120 21Motor vehicle and parts dealers 441 18Automobile dealers 4411 18New car dealers 441110 17Used car dealers 441120 23Other motor vehicle dealers 4412 20Recreational vehicle dealers 441210 17Motorcycle, boat, and other motor vehicle dealers 44122 20Automotive parts, accessories, and tire stores 4413 17Automotive parts and accessories stores 441310 16Tire dealers 441320 21Furniture and home furnishings stores 442 17Furniture stores 442110 16Home furnishings stores 4422 17Floor covering stores 442210 19Other home furnishings stores 44229 16Electronics and appliance stores 4431 16Appliance, television, and other electronics stores 44311 16Household appliance stores 443111 14Radio, television, and other electronics stores 443112 17Building material and garden supply stores 444 18Building material and supplies dealers 4441 19Home centers 444110 19Paint and wallpaper stores 444120 26Hardware stores 444130 17Other building material dealers 444190 18Lawn and garden equipment and supplies stores 4442 17Outdoor power equipment stores 444210 16Nursery, garden center, and farm supply stores 444220 17Food and beverage stores 445 9Grocery stores 4451 8
42

Description NAICS1987-2002
Average Percent
Table 4. Average concentration of supervisory (nonproduction) workers by industry, 1987-2002
Supermarkets and other grocery (except convenience) stores 445110 8Convenience stores 445120 8Specialty food stores 4452 14Fruit and vegetable markets 445230 10Other specialty food stores 44529 15Beer, wine, and liquor stores 445310 15Health and personal care stores 4461 18Pharmacies and drug stores 446110 18Cosmetics, beauty supplies, and perfume stores 446120 15Optical goods stores 446130 23Other health and personal care stores 44619 15Food (health) supplement stores 446191 16All other health and personal care stores 446199 13Gasoline stations 4471 13Gasoline stations with convenience stores 447110 13Other gasoline stations 447190 14Clothing and clothing accessories stores 448 18Clothing stores 4481 17Men's clothing stores 448110 22Women's clothing stores 448120 18Children's and infants' clothing stores 448130 11Family clothing stores 448140 14Clothing accessories stores 448150 23Other clothing stores 448190 19Shoe stores 448210 20Jewelry, luggage, and leather goods stores 4483 23Sporting goods, hobby, book, and music stores 451 16Sporting goods, hobby, and musical instrument stores 4511 15Sporting goods stores 451110 16Hobby, toy, and game stores 451120 11Sewing, needlework, and piece goods stores 451130 12Musical instrument and supplies stores 451140 23Book, periodical, and music stores 4512 18Book stores and news dealers 45121 16Prerecorded tape, compact disc, and record stores 451220 20General merchandise stores 452 6Department stores 45211 7Department stores (except discount department stores) 452111 9Discount department stores 452112 4Other general merchandise stores 4529 6Warehouse clubs and supercenters 452910 3All other general merchandise stores 452990 11Miscellaneous store retailers 453 14Florists 453110 11Office supplies, stationery, and gift stores 4532 14Office supplies and stationery stores 453210 18Gift, novelty, and souvenir stores 453220 12Used merchandise stores 453310 12Other miscellaneous store retailers 4539 16Pet and pet supplies stores 453910 15Art dealers 453920 15Manufactured (mobile) home dealers 453930 18All other miscellaneous store retailers 45399 15
43

Description NAICS1987-2002
Average Percent
Table 4. Average concentration of supervisory (nonproduction) workers by industry, 1987-2002
Nonstore retailers 454 10Electronic shopping and mail order houses 45411 11Vending machine operators 454210 15Direct selling establishments 4543 8Fuel dealers 45431 15Heating oil dealers 454311 16Other direct selling establishments 454390 5General freight trucking, long-distance 48412 17Publishing 511 41Newspaper, periodical, book, and directory publishers 5111 46Newspaper publishers 511110 49Periodical publishers 511120 53Book publishers 511130 33Database and directory publishers 511140 26Other publishers 51119 32Software publishers 511210 21Motion picture and video exhibition 51213 13Broadcasting, except Internet 515 21Radio and television broadcasting 5151 18Radio broadcasting 51511 18Television broadcasting 515120 19Cable and other subscription programming 515210 29Wired telecommunications carriers 517110 26Wireless telecommunications carriers (except satellite) 51721 37Cable and other program distribution 517510 20Commercial banking 522110 28Passenger car rental 532111 16Truck, utility trailer, and rv (recreational vehicle) rental and leasing 532120 20Video tape and disc rental 532230 17Tax preparation services 541213 9Advertising agencies 541810 31Photography studios, portrait 541921 5Travel agencies 561510 24Janitorial services 561720 8Traveler accommodation 7211 12Hotels (except casino hotels) and motels 721110 12Casino hotels 721120 12Other traveler accommodation 72119 14Bed-and-breakfast inns 721191 10All other traveler accommodation 721199 22Food services and drinking places 722 11Full-service restaurants 722110 10Limited-service eating places 72221 11Special food services 7223 12Drinking places (alcoholic beverages) 722410 13Automotive repair and maintenance 8111 15Hair, nail, and skin care services 81211 6Funeral homes and funeral services 812210 20Drycleaning and laundry services 8123 11Coin-operated laundries and drycleaners 812310 9Drycleaning and laundry services (except coin-operated) 812320 10Linen and uniform supply 81233 12Photofinishing 81292 12
44
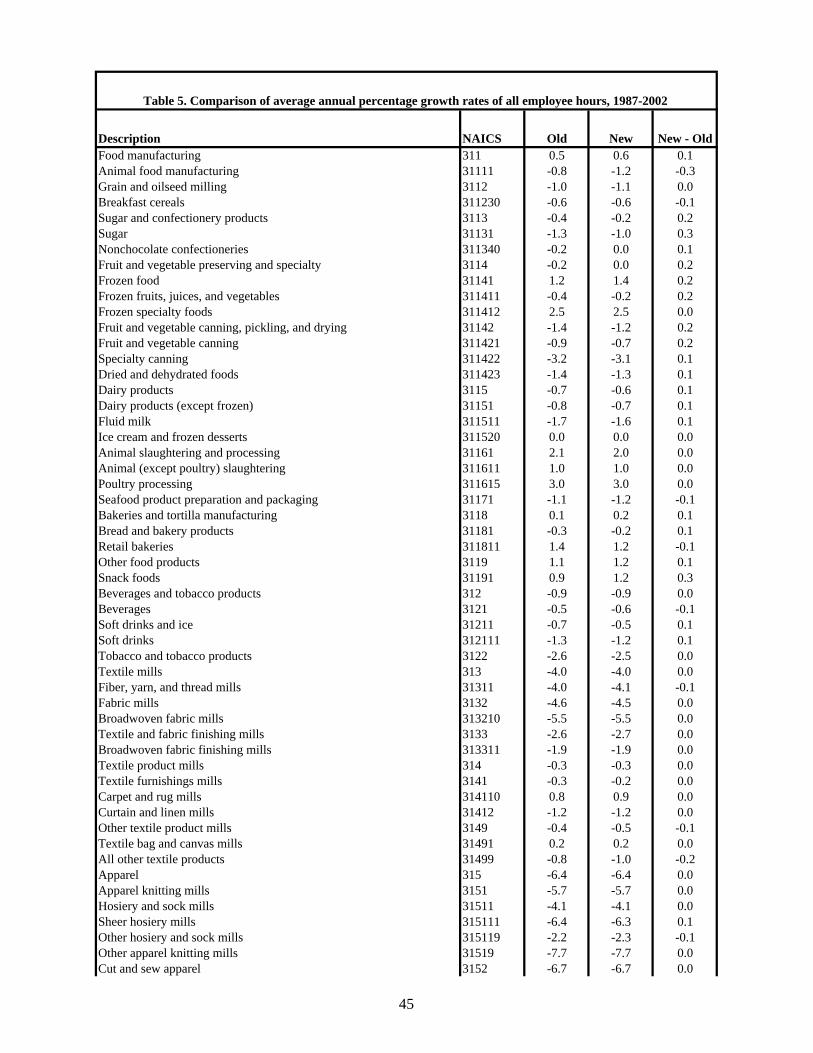
Description NAICS Old New New - OldFood manufacturing 311 0.5 0.6 0.1Animal food manufacturing 31111 -0.8 -1.2 -0.3Grain and oilseed milling 3112 -1.0 -1.1 0.0Breakfast cereals 311230 -0.6 -0.6 -0.1Sugar and confectionery products 3113 -0.4 -0.2 0.2Sugar 31131 -1.3 -1.0 0.3Nonchocolate confectioneries 311340 -0.2 0.0 0.1Fruit and vegetable preserving and specialty 3114 -0.2 0.0 0.2Frozen food 31141 1.2 1.4 0.2Frozen fruits, juices, and vegetables 311411 -0.4 -0.2 0.2Frozen specialty foods 311412 2.5 2.5 0.0Fruit and vegetable canning, pickling, and drying 31142 -1.4 -1.2 0.2Fruit and vegetable canning 311421 -0.9 -0.7 0.2Specialty canning 311422 -3.2 -3.1 0.1Dried and dehydrated foods 311423 -1.4 -1.3 0.1Dairy products 3115 -0.7 -0.6 0.1Dairy products (except frozen) 31151 -0.8 -0.7 0.1Fluid milk 311511 -1.7 -1.6 0.1Ice cream and frozen desserts 311520 0.0 0.0 0.0Animal slaughtering and processing 31161 2.1 2.0 0.0Animal (except poultry) slaughtering 311611 1.0 1.0 0.0Poultry processing 311615 3.0 3.0 0.0Seafood product preparation and packaging 31171 -1.1 -1.2 -0.1Bakeries and tortilla manufacturing 3118 0.1 0.2 0.1Bread and bakery products 31181 -0.3 -0.2 0.1Retail bakeries 311811 1.4 1.2 -0.1Other food products 3119 1.1 1.2 0.1Snack foods 31191 0.9 1.2 0.3Beverages and tobacco products 312 -0.9 -0.9 0.0Beverages 3121 -0.5 -0.6 -0.1Soft drinks and ice 31211 -0.7 -0.5 0.1Soft drinks 312111 -1.3 -1.2 0.1Tobacco and tobacco products 3122 -2.6 -2.5 0.0Textile mills 313 -4.0 -4.0 0.0Fiber, yarn, and thread mills 31311 -4.0 -4.1 -0.1Fabric mills 3132 -4.6 -4.5 0.0Broadwoven fabric mills 313210 -5.5 -5.5 0.0Textile and fabric finishing mills 3133 -2.6 -2.7 0.0Broadwoven fabric finishing mills 313311 -1.9 -1.9 0.0Textile product mills 314 -0.3 -0.3 0.0Textile furnishings mills 3141 -0.3 -0.2 0.0Carpet and rug mills 314110 0.8 0.9 0.0Curtain and linen mills 31412 -1.2 -1.2 0.0Other textile product mills 3149 -0.4 -0.5 -0.1Textile bag and canvas mills 31491 0.2 0.2 0.0All other textile products 31499 -0.8 -1.0 -0.2Apparel 315 -6.4 -6.4 0.0Apparel knitting mills 3151 -5.7 -5.7 0.0Hosiery and sock mills 31511 -4.1 -4.1 0.0Sheer hosiery mills 315111 -6.4 -6.3 0.1Other hosiery and sock mills 315119 -2.2 -2.3 -0.1Other apparel knitting mills 31519 -7.7 -7.7 0.0Cut and sew apparel 3152 -6.7 -6.7 0.0
Table 5. Comparison of average annual percentage growth rates of all employee hours, 1987-2002
45

Description NAICS Old New New - Old
Table 5. Comparison of average annual percentage growth rates of all employee hours, 1987-2002
Cut and sew apparel contractors 31521 -6.2 -6.1 0.0Men's and boys' cut and sew apparel contractors 315211 -7.4 -7.4 0.0Women's, girls', and infants' cut and sew apparel contractors 315212 -5.6 -5.6 0.0Men's and boys' cut and sew apparel 31522 -7.7 -7.6 0.1Women's and girls' cut and sew apparel 31523 -7.0 -7.0 0.1Other cut and sew apparel 31529 -5.5 -5.5 0.0Apparel accessories and other apparel manufacturing 31599 -2.6 -2.6 0.0Leather and allied products 316 -6.8 -6.9 -0.1Leather and allied product manufacturing 316110 -3.5 -3.7 -0.1Footwear manufacturing 31621 -9.1 -9.1 -0.1Other leather and allied product manufacturing 31699 -4.2 -4.3 -0.1Wood products 321 -0.3 -0.3 0.0Sawmills and wood preservation 32111 -1.6 -1.5 0.0Veneer, plywood, and engineered wood product manufacturing 32121 0.8 0.8 0.0Reconstituted wood products 321219 1.6 1.6 0.0Other wood products 3219 0.0 -0.1 -0.1Millwork 32191 0.3 0.2 0.0Wood windows and doors 321911 0.9 0.9 0.0Wood containers and pallets 321920 0.8 0.8 0.0All other wood products 32199 -0.8 -1.0 -0.2Manufactured homes (mobile homes) 321991 -0.1 -0.4 -0.2Paper and paper products 322 -1.1 -1.1 0.0Pulp, paper, and paperboard mills 3221 -2.7 -2.7 -0.1Paperboard mills 322130 -2.2 -2.3 -0.1Converted paper products 3222 -0.3 -0.2 0.0Paperboard containers 32221 0.0 0.0 0.1Corrugated and solid fiber boxes 322211 0.6 0.7 0.0Folding paperboard boxes 322212 -1.3 -1.2 0.1Paper bags and coated and treated paper 32222 -0.1 -0.1 0.0Stationery products 32223 -1.5 -1.5 0.0Other converted paper products 32229 -0.4 -0.4 0.0Printing and related support activities 3231 -0.5 -0.4 0.1Printing 32311 -0.3 -0.2 0.1Commercial lithographic printing 323110 -0.3 -0.2 0.1Commercial gravure printing 323111 0.9 1.0 0.1Commercial flexographic printing 323112 -0.8 -0.6 0.2Commercial screen printing 323113 0.6 0.7 0.1Quick printing 323114 0.7 0.7 0.1Manifold business form printing 323116 -3.0 -3.0 0.0Support activities for printing 32312 -2.1 -2.0 0.1Petroleum and coal products 3241 -2.0 -2.1 -0.1Petroleum refineries 324110 -2.8 -2.8 0.0Chemicals 325 -0.4 -0.3 0.1Basic chemicals 3251 -2.1 -2.1 0.0Synthetic dyes and pigments 32513 -1.9 -1.7 0.1Other basic inorganic chemicals 32518 -3.2 -3.1 0.1Other basic organic chemicals 32519 -1.6 -1.6 0.0Resin, synthetic rubber, and artificial synthetic fibers and filaments 3252 -1.8 -1.8 0.0Resin and synthetic rubber 32521 -0.6 -0.5 0.0Plastics material and resin 325211 -0.6 -0.6 0.1Synthetic rubber 325212 -0.4 -0.4 0.0Artificial and synthetic fibers and filaments 32522 -3.6 -3.8 -0.1Noncellulosic organic fibers 325222 -4.5 -4.7 -0.2
46

Description NAICS Old New New - Old
Table 5. Comparison of average annual percentage growth rates of all employee hours, 1987-2002
Pesticides, fertilizers, and other agricultural chemicals 3253 -0.9 -1.0 0.0Pharmaceuticals and medicine 32541 3.3 3.7 0.5Pharmaceutical preparations 325412 3.1 3.6 0.5Paint, coatings, and adhesives 3255 -1.0 -1.0 0.0Paint and coatings 325510 -1.8 -1.7 0.0Soaps, cleaning compounds, and toilet preparations 3256 -0.3 -0.3 0.0Soaps and cleaning compounds 32561 -0.9 -1.1 -0.1Soaps and other detergents 325611 -1.0 -1.0 0.0Toilet preparations 325620 0.5 0.6 0.1Other chemical products and preparations 3259 -2.1 -2.1 0.0Plastics and rubber products 326 0.5 0.5 0.0Plastics products 3261 0.9 0.9 0.0Plastics packaging materials and unlaminated film and sheets 32611 0.9 0.9 0.0Unlaminated plastics film and sheets (except packaging) 326113 1.1 1.2 0.1Plastics pipes, pipe fittings, and unlaminated profile shapes 32612 0.4 0.5 0.1Unlaminated plastics profile shapes 326121 -0.4 -0.2 0.2Plastics pipes and pipe fittings 326122 1.3 1.3 0.0Other plastics products 32619 0.7 0.7 0.0Rubber products 3262 -0.9 -0.9 0.0Tires 32621 -1.1 -1.2 0.0Rubber and plastics hoses and belting 326220 0.4 0.3 -0.1Other rubber products 32629 -1.0 -1.0 0.0Rubber products for mechanical use 326291 -0.4 -0.5 -0.1All other rubber products 326299 -1.9 -1.8 0.1Nonmetallic mineral products 327 0.0 0.0 0.0Clay products and refractories 3271 -1.1 -1.2 0.0Pottery, ceramics, and plumbing fixtures 32711 -0.9 -0.9 0.0Clay building materials and refractories 32712 -1.3 -1.4 -0.1Glass and glass products 32721 -0.8 -0.8 0.0Flat glass 327211 -1.8 -2.0 -0.2Other pressed and blown glass and glassware 327212 -0.2 -0.2 0.1Glass containers 327213 -4.5 -4.4 0.0Glass products made of purchased glass 327215 1.3 1.4 0.1Cement and concrete products 3273 1.2 1.3 0.1Ready-mix concrete 327320 1.8 2.0 0.2Lime and gypsum products 3274 -0.9 -1.0 -0.1Other nonmetallic mineral products 3279 -0.6 -0.7 -0.1Primary metals 331 -1.9 -1.9 0.0Iron and steel mills and ferroalloy production 33111 -3.3 -3.2 0.1Steel products from purchased steel 3312 -0.5 -0.5 0.0Iron and steel pipes and tubes from purchased steel 331210 0.8 0.8 0.0Rolling and drawing of purchased steel 33122 -1.3 -1.3 0.0Rolled steel shapes 331221 -1.5 -1.5 0.0Alumina and aluminum production and processing 33131 -2.2 -2.3 -0.1Aluminum sheets, plates, and foil 331315 -3.2 -3.5 -0.3Nonferrous metal (except aluminum) production and processing 3314 -1.9 -1.9 0.0Nonferrous metal (except aluminum) smelting and refining 33141 -2.0 -1.8 0.2Copper rolling, drawing, extruding, and alloying 33142 -2.1 -2.1 0.0Nonferrous metal (except copper and aluminum) rolling, drawing, extru33149 -1.6 -1.7 -0.1Foundries 3315 -1.2 -1.2 0.0Ferrous metal foundries 33151 -1.7 -1.7 0.0Iron foundries 331511 -2.0 -2.0 0.0Nonferrous metal foundries 33152 -0.5 -0.5 0.0
47
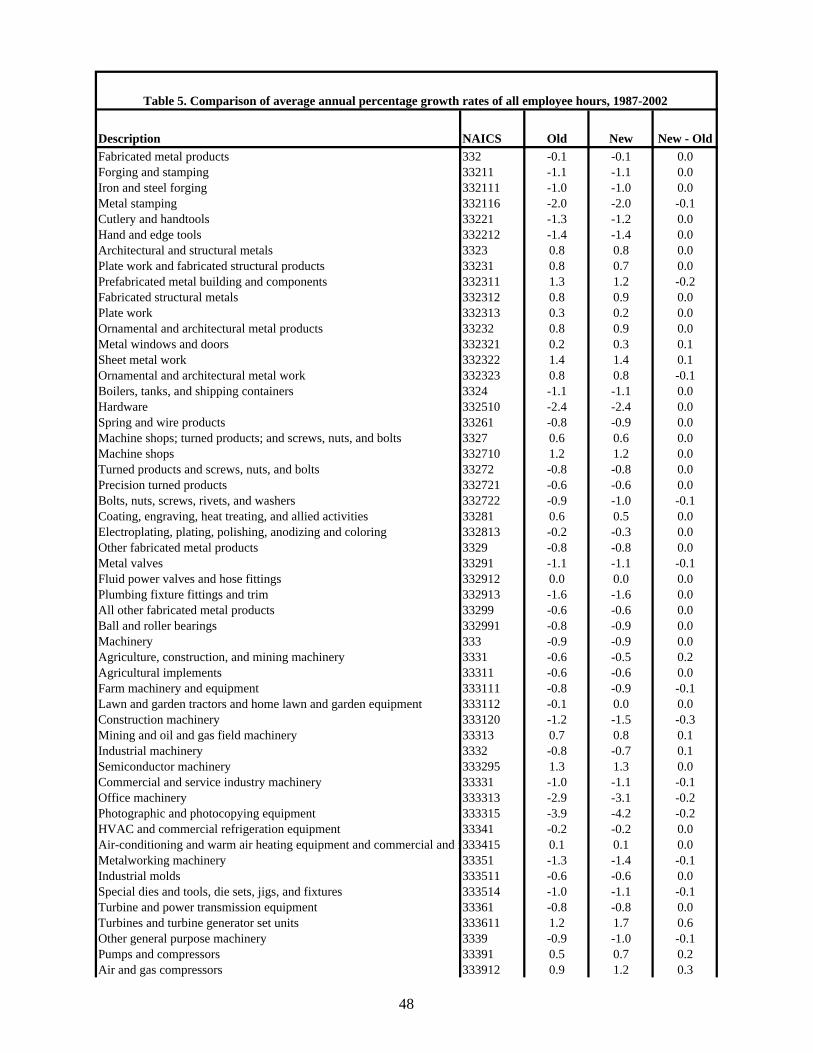
Description NAICS Old New New - Old
Table 5. Comparison of average annual percentage growth rates of all employee hours, 1987-2002
Fabricated metal products 332 -0.1 -0.1 0.0Forging and stamping 33211 -1.1 -1.1 0.0Iron and steel forging 332111 -1.0 -1.0 0.0Metal stamping 332116 -2.0 -2.0 -0.1Cutlery and handtools 33221 -1.3 -1.2 0.0Hand and edge tools 332212 -1.4 -1.4 0.0Architectural and structural metals 3323 0.8 0.8 0.0Plate work and fabricated structural products 33231 0.8 0.7 0.0Prefabricated metal building and components 332311 1.3 1.2 -0.2Fabricated structural metals 332312 0.8 0.9 0.0Plate work 332313 0.3 0.2 0.0Ornamental and architectural metal products 33232 0.8 0.9 0.0Metal windows and doors 332321 0.2 0.3 0.1Sheet metal work 332322 1.4 1.4 0.1Ornamental and architectural metal work 332323 0.8 0.8 -0.1Boilers, tanks, and shipping containers 3324 -1.1 -1.1 0.0Hardware 332510 -2.4 -2.4 0.0Spring and wire products 33261 -0.8 -0.9 0.0Machine shops; turned products; and screws, nuts, and bolts 3327 0.6 0.6 0.0Machine shops 332710 1.2 1.2 0.0Turned products and screws, nuts, and bolts 33272 -0.8 -0.8 0.0Precision turned products 332721 -0.6 -0.6 0.0Bolts, nuts, screws, rivets, and washers 332722 -0.9 -1.0 -0.1Coating, engraving, heat treating, and allied activities 33281 0.6 0.5 0.0Electroplating, plating, polishing, anodizing and coloring 332813 -0.2 -0.3 0.0Other fabricated metal products 3329 -0.8 -0.8 0.0Metal valves 33291 -1.1 -1.1 -0.1Fluid power valves and hose fittings 332912 0.0 0.0 0.0Plumbing fixture fittings and trim 332913 -1.6 -1.6 0.0All other fabricated metal products 33299 -0.6 -0.6 0.0Ball and roller bearings 332991 -0.8 -0.9 0.0Machinery 333 -0.9 -0.9 0.0Agriculture, construction, and mining machinery 3331 -0.6 -0.5 0.2Agricultural implements 33311 -0.6 -0.6 0.0Farm machinery and equipment 333111 -0.8 -0.9 -0.1Lawn and garden tractors and home lawn and garden equipment 333112 -0.1 0.0 0.0Construction machinery 333120 -1.2 -1.5 -0.3Mining and oil and gas field machinery 33313 0.7 0.8 0.1Industrial machinery 3332 -0.8 -0.7 0.1Semiconductor machinery 333295 1.3 1.3 0.0Commercial and service industry machinery 33331 -1.0 -1.1 -0.1Office machinery 333313 -2.9 -3.1 -0.2Photographic and photocopying equipment 333315 -3.9 -4.2 -0.2HVAC and commercial refrigeration equipment 33341 -0.2 -0.2 0.0Air-conditioning and warm air heating equipment and commercial and i333415 0.1 0.1 0.0Metalworking machinery 33351 -1.3 -1.4 -0.1Industrial molds 333511 -0.6 -0.6 0.0Special dies and tools, die sets, jigs, and fixtures 333514 -1.0 -1.1 -0.1Turbine and power transmission equipment 33361 -0.8 -0.8 0.0Turbines and turbine generator set units 333611 1.2 1.7 0.6Other general purpose machinery 3339 -0.9 -1.0 -0.1Pumps and compressors 33391 0.5 0.7 0.2Air and gas compressors 333912 0.9 1.2 0.3
48

Description NAICS Old New New - Old
Table 5. Comparison of average annual percentage growth rates of all employee hours, 1987-2002
Material handling equipment 33392 -0.7 -0.8 -0.1Conveyor and conveying equipment 333922 -0.2 -0.2 0.0Overhead traveling cranes, hoists, and monorail systems 333923 -1.3 -1.2 0.1All other general purpose machinery 33399 -1.5 -1.7 -0.2Computer and electronic products 334 -2.0 -2.0 0.0Computer and peripheral equipment 33411 -3.1 -3.4 -0.3Electronic computers 334111 -4.4 -4.7 -0.4Other computer peripheral equipment 334119 -0.8 -0.6 0.2Communications equipment 3342 -2.0 -2.0 0.0Telephone apparatus manufacturing 334210 -4.0 -4.3 -0.3Radio and television broadcasting and wireless communications equipm334220 -1.3 -1.3 0.0Audio and video equipment manufacturing 334310 -2.6 -2.6 -0.1Semiconductors and electronic components 33441 -0.9 -0.9 0.0Electron tubes 334411 -7.2 -7.2 0.0Bare printed circuit boards 334412 -0.7 -0.7 -0.1Semiconductors and related devices 334413 0.2 0.2 0.0Electronic capacitors 334414 -4.3 -4.3 0.0Electronic connectors 334417 1.8 2.0 0.1Printed circuit assemblies (electronic assemblies) 334418 -1.2 -1.2 0.0Electronic instruments 33451 -2.7 -2.8 -0.1Electromedical and electrotherapeutic apparatuses 334510 4.3 3.8 -0.5Search, detection, navigation, guidance, aeronautical, and nautical syste 334511 -5.4 -5.5 -0.1Automatic environmental controls for residential, commercial, and appl 334512 -1.3 -1.3 0.0Instruments and related products for measuring, displaying, and controll334513 0.5 0.3 -0.2Instruments for measuring and testing electricity and electrical signals 334515 -4.0 -4.0 0.0Irradiation apparatuses 334517 1.0 1.2 0.2Magnetic media manufacturing and reproduction 33461 0.9 1.0 0.1Electrical equipment and appliances 335 -2.4 -2.1 0.2Electric lighting equipment 3351 -1.0 -1.0 0.1Electric lamp bulb and part manufacturing 335110 -3.1 -3.1 0.1Lighting fixtures 33512 -0.2 -0.1 0.1Household appliances 3352 -2.1 -2.2 -0.1Small electrical appliances 33521 -3.4 -3.4 0.0Electric housewares and household fans 335211 -4.2 -4.2 0.0Major appliances 33522 -1.6 -1.6 0.0Electrical equipment 33531 -2.7 -2.6 0.0Power, distribution, and specialty transformers 335311 -3.8 -3.9 -0.1Motors and generators 335312 -2.8 -2.8 0.0Switchgear and switchboard apparatuses 335313 -2.0 -2.0 0.0Relays and industrial controls 335314 -2.2 -2.1 0.1Other electrical equipment and components 3359 -2.8 -1.9 0.9Batteries 33591 -1.6 -1.6 0.0Storage batteries 335911 -3.0 -3.0 0.0Communication and energy wire and cable 33592 -0.3 -0.2 0.0Fiber optic cables 335921 2.8 2.8 0.0Other communication and energy wires 335929 -2.5 -2.5 0.0Wiring devices 33593 -2.2 -2.2 0.1Current-carrying wiring devices 335931 -2.6 -2.5 0.1Noncurrent-carrying wiring devices 335932 -0.5 -0.6 -0.1All other electrical equipment and components 33599 -2.6 -2.7 -0.1Transportation equipment 336 -1.1 -1.0 0.0Motor vehicles 3361 -0.9 -0.8 0.1Automobiles and light duty motor vehicles 33611 -0.9 -0.8 0.1
49
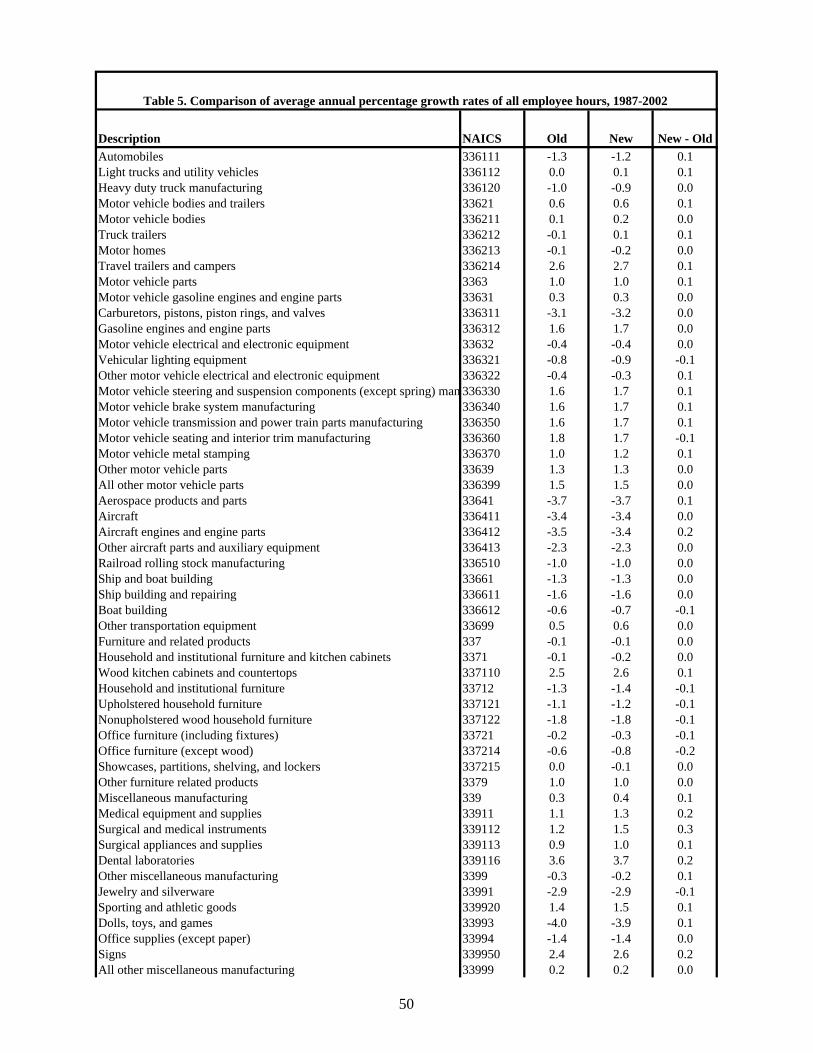
Description NAICS Old New New - Old
Table 5. Comparison of average annual percentage growth rates of all employee hours, 1987-2002
Automobiles 336111 -1.3 -1.2 0.1Light trucks and utility vehicles 336112 0.0 0.1 0.1Heavy duty truck manufacturing 336120 -1.0 -0.9 0.0Motor vehicle bodies and trailers 33621 0.6 0.6 0.1Motor vehicle bodies 336211 0.1 0.2 0.0Truck trailers 336212 -0.1 0.1 0.1Motor homes 336213 -0.1 -0.2 0.0Travel trailers and campers 336214 2.6 2.7 0.1Motor vehicle parts 3363 1.0 1.0 0.1Motor vehicle gasoline engines and engine parts 33631 0.3 0.3 0.0Carburetors, pistons, piston rings, and valves 336311 -3.1 -3.2 0.0Gasoline engines and engine parts 336312 1.6 1.7 0.0Motor vehicle electrical and electronic equipment 33632 -0.4 -0.4 0.0Vehicular lighting equipment 336321 -0.8 -0.9 -0.1Other motor vehicle electrical and electronic equipment 336322 -0.4 -0.3 0.1Motor vehicle steering and suspension components (except spring) man 336330 1.6 1.7 0.1Motor vehicle brake system manufacturing 336340 1.6 1.7 0.1Motor vehicle transmission and power train parts manufacturing 336350 1.6 1.7 0.1Motor vehicle seating and interior trim manufacturing 336360 1.8 1.7 -0.1Motor vehicle metal stamping 336370 1.0 1.2 0.1Other motor vehicle parts 33639 1.3 1.3 0.0All other motor vehicle parts 336399 1.5 1.5 0.0Aerospace products and parts 33641 -3.7 -3.7 0.1Aircraft 336411 -3.4 -3.4 0.0Aircraft engines and engine parts 336412 -3.5 -3.4 0.2Other aircraft parts and auxiliary equipment 336413 -2.3 -2.3 0.0Railroad rolling stock manufacturing 336510 -1.0 -1.0 0.0Ship and boat building 33661 -1.3 -1.3 0.0Ship building and repairing 336611 -1.6 -1.6 0.0Boat building 336612 -0.6 -0.7 -0.1Other transportation equipment 33699 0.5 0.6 0.0Furniture and related products 337 -0.1 -0.1 0.0Household and institutional furniture and kitchen cabinets 3371 -0.1 -0.2 0.0Wood kitchen cabinets and countertops 337110 2.5 2.6 0.1Household and institutional furniture 33712 -1.3 -1.4 -0.1Upholstered household furniture 337121 -1.1 -1.2 -0.1Nonupholstered wood household furniture 337122 -1.8 -1.8 -0.1Office furniture (including fixtures) 33721 -0.2 -0.3 -0.1Office furniture (except wood) 337214 -0.6 -0.8 -0.2Showcases, partitions, shelving, and lockers 337215 0.0 -0.1 0.0Other furniture related products 3379 1.0 1.0 0.0Miscellaneous manufacturing 339 0.3 0.4 0.1Medical equipment and supplies 33911 1.1 1.3 0.2Surgical and medical instruments 339112 1.2 1.5 0.3Surgical appliances and supplies 339113 0.9 1.0 0.1Dental laboratories 339116 3.6 3.7 0.2Other miscellaneous manufacturing 3399 -0.3 -0.2 0.1Jewelry and silverware 33991 -2.9 -2.9 -0.1Sporting and athletic goods 339920 1.4 1.5 0.1Dolls, toys, and games 33993 -4.0 -3.9 0.1Office supplies (except paper) 33994 -1.4 -1.4 0.0Signs 339950 2.4 2.6 0.2All other miscellaneous manufacturing 33999 0.2 0.2 0.0
50
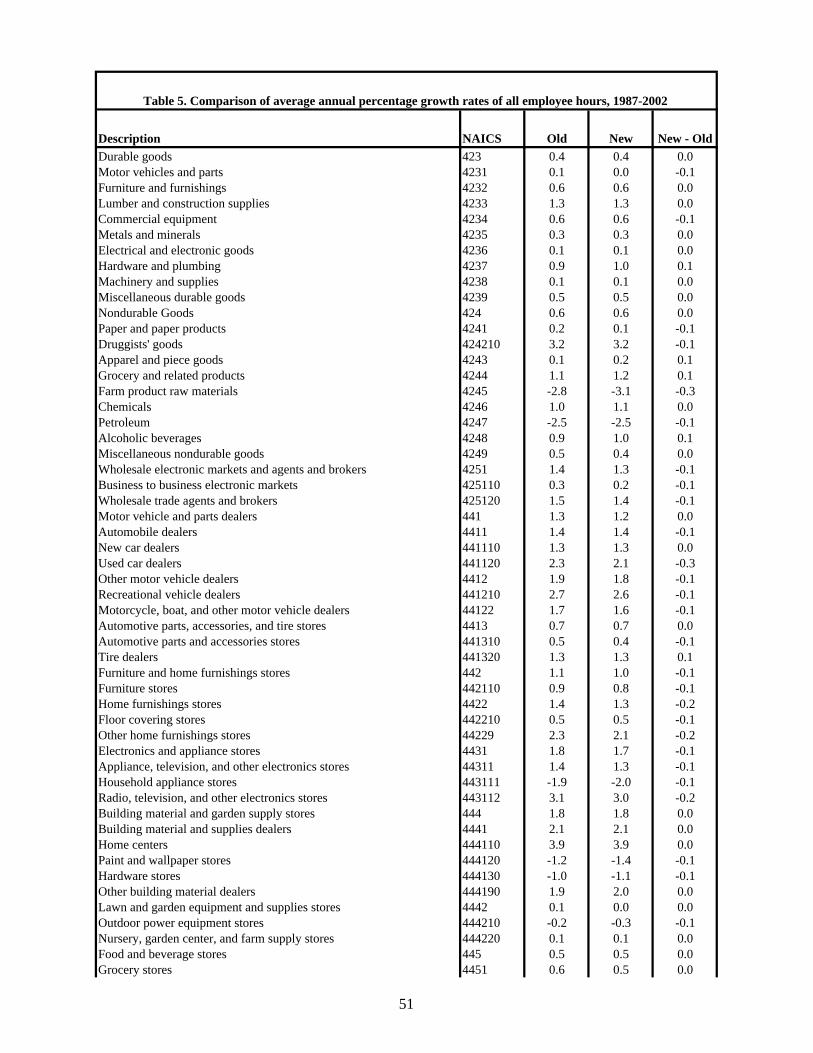
Description NAICS Old New New - Old
Table 5. Comparison of average annual percentage growth rates of all employee hours, 1987-2002
Durable goods 423 0.4 0.4 0.0Motor vehicles and parts 4231 0.1 0.0 -0.1Furniture and furnishings 4232 0.6 0.6 0.0Lumber and construction supplies 4233 1.3 1.3 0.0Commercial equipment 4234 0.6 0.6 -0.1Metals and minerals 4235 0.3 0.3 0.0Electrical and electronic goods 4236 0.1 0.1 0.0Hardware and plumbing 4237 0.9 1.0 0.1Machinery and supplies 4238 0.1 0.1 0.0Miscellaneous durable goods 4239 0.5 0.5 0.0Nondurable Goods 424 0.6 0.6 0.0Paper and paper products 4241 0.2 0.1 -0.1Druggists' goods 424210 3.2 3.2 -0.1Apparel and piece goods 4243 0.1 0.2 0.1Grocery and related products 4244 1.1 1.2 0.1Farm product raw materials 4245 -2.8 -3.1 -0.3Chemicals 4246 1.0 1.1 0.0Petroleum 4247 -2.5 -2.5 -0.1Alcoholic beverages 4248 0.9 1.0 0.1Miscellaneous nondurable goods 4249 0.5 0.4 0.0Wholesale electronic markets and agents and brokers 4251 1.4 1.3 -0.1Business to business electronic markets 425110 0.3 0.2 -0.1Wholesale trade agents and brokers 425120 1.5 1.4 -0.1Motor vehicle and parts dealers 441 1.3 1.2 0.0Automobile dealers 4411 1.4 1.4 -0.1New car dealers 441110 1.3 1.3 0.0Used car dealers 441120 2.3 2.1 -0.3Other motor vehicle dealers 4412 1.9 1.8 -0.1Recreational vehicle dealers 441210 2.7 2.6 -0.1Motorcycle, boat, and other motor vehicle dealers 44122 1.7 1.6 -0.1Automotive parts, accessories, and tire stores 4413 0.7 0.7 0.0Automotive parts and accessories stores 441310 0.5 0.4 -0.1Tire dealers 441320 1.3 1.3 0.1Furniture and home furnishings stores 442 1.1 1.0 -0.1Furniture stores 442110 0.9 0.8 -0.1Home furnishings stores 4422 1.4 1.3 -0.2Floor covering stores 442210 0.5 0.5 -0.1Other home furnishings stores 44229 2.3 2.1 -0.2Electronics and appliance stores 4431 1.8 1.7 -0.1Appliance, television, and other electronics stores 44311 1.4 1.3 -0.1Household appliance stores 443111 -1.9 -2.0 -0.1Radio, television, and other electronics stores 443112 3.1 3.0 -0.2Building material and garden supply stores 444 1.8 1.8 0.0Building material and supplies dealers 4441 2.1 2.1 0.0Home centers 444110 3.9 3.9 0.0Paint and wallpaper stores 444120 -1.2 -1.4 -0.1Hardware stores 444130 -1.0 -1.1 -0.1Other building material dealers 444190 1.9 2.0 0.0Lawn and garden equipment and supplies stores 4442 0.1 0.0 0.0Outdoor power equipment stores 444210 -0.2 -0.3 -0.1Nursery, garden center, and farm supply stores 444220 0.1 0.1 0.0Food and beverage stores 445 0.5 0.5 0.0Grocery stores 4451 0.6 0.5 0.0
51
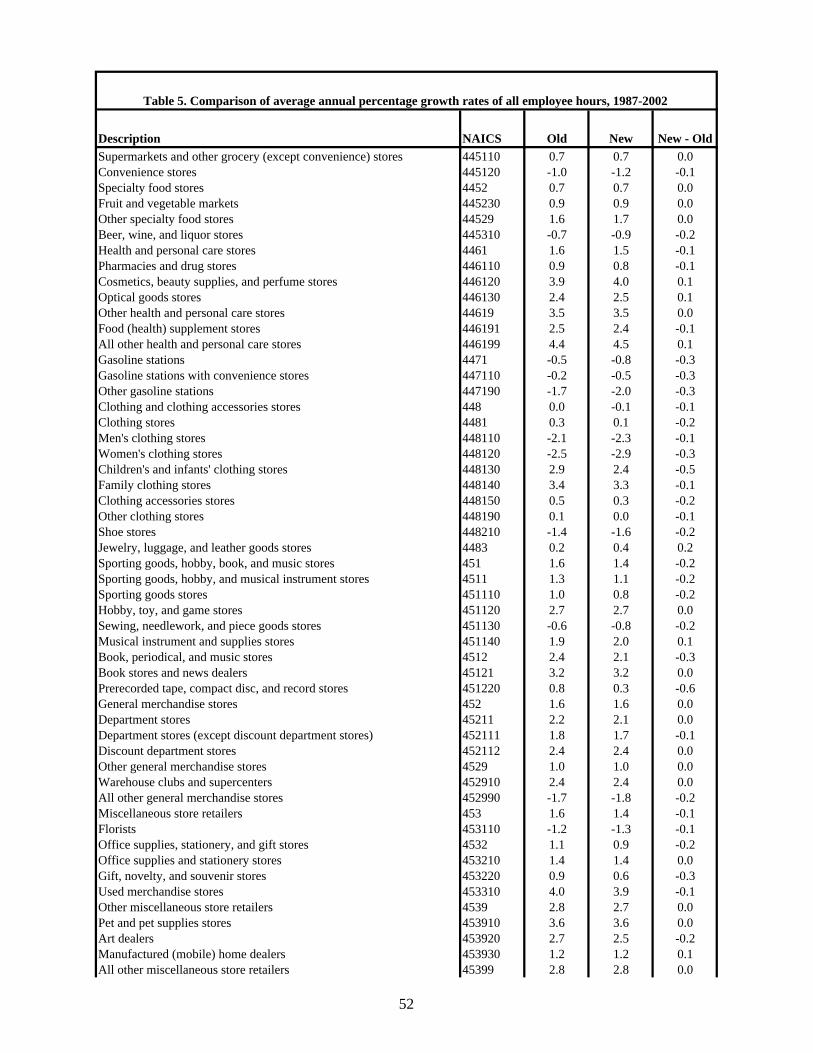
Description NAICS Old New New - Old
Table 5. Comparison of average annual percentage growth rates of all employee hours, 1987-2002
Supermarkets and other grocery (except convenience) stores 445110 0.7 0.7 0.0Convenience stores 445120 -1.0 -1.2 -0.1Specialty food stores 4452 0.7 0.7 0.0Fruit and vegetable markets 445230 0.9 0.9 0.0Other specialty food stores 44529 1.6 1.7 0.0Beer, wine, and liquor stores 445310 -0.7 -0.9 -0.2Health and personal care stores 4461 1.6 1.5 -0.1Pharmacies and drug stores 446110 0.9 0.8 -0.1Cosmetics, beauty supplies, and perfume stores 446120 3.9 4.0 0.1Optical goods stores 446130 2.4 2.5 0.1Other health and personal care stores 44619 3.5 3.5 0.0Food (health) supplement stores 446191 2.5 2.4 -0.1All other health and personal care stores 446199 4.4 4.5 0.1Gasoline stations 4471 -0.5 -0.8 -0.3Gasoline stations with convenience stores 447110 -0.2 -0.5 -0.3Other gasoline stations 447190 -1.7 -2.0 -0.3Clothing and clothing accessories stores 448 0.0 -0.1 -0.1Clothing stores 4481 0.3 0.1 -0.2Men's clothing stores 448110 -2.1 -2.3 -0.1Women's clothing stores 448120 -2.5 -2.9 -0.3Children's and infants' clothing stores 448130 2.9 2.4 -0.5Family clothing stores 448140 3.4 3.3 -0.1Clothing accessories stores 448150 0.5 0.3 -0.2Other clothing stores 448190 0.1 0.0 -0.1Shoe stores 448210 -1.4 -1.6 -0.2Jewelry, luggage, and leather goods stores 4483 0.2 0.4 0.2Sporting goods, hobby, book, and music stores 451 1.6 1.4 -0.2Sporting goods, hobby, and musical instrument stores 4511 1.3 1.1 -0.2Sporting goods stores 451110 1.0 0.8 -0.2Hobby, toy, and game stores 451120 2.7 2.7 0.0Sewing, needlework, and piece goods stores 451130 -0.6 -0.8 -0.2Musical instrument and supplies stores 451140 1.9 2.0 0.1Book, periodical, and music stores 4512 2.4 2.1 -0.3Book stores and news dealers 45121 3.2 3.2 0.0Prerecorded tape, compact disc, and record stores 451220 0.8 0.3 -0.6General merchandise stores 452 1.6 1.6 0.0Department stores 45211 2.2 2.1 0.0Department stores (except discount department stores) 452111 1.8 1.7 -0.1Discount department stores 452112 2.4 2.4 0.0Other general merchandise stores 4529 1.0 1.0 0.0Warehouse clubs and supercenters 452910 2.4 2.4 0.0All other general merchandise stores 452990 -1.7 -1.8 -0.2Miscellaneous store retailers 453 1.6 1.4 -0.1Florists 453110 -1.2 -1.3 -0.1Office supplies, stationery, and gift stores 4532 1.1 0.9 -0.2Office supplies and stationery stores 453210 1.4 1.4 0.0Gift, novelty, and souvenir stores 453220 0.9 0.6 -0.3Used merchandise stores 453310 4.0 3.9 -0.1Other miscellaneous store retailers 4539 2.8 2.7 0.0Pet and pet supplies stores 453910 3.6 3.6 0.0Art dealers 453920 2.7 2.5 -0.2Manufactured (mobile) home dealers 453930 1.2 1.2 0.1All other miscellaneous store retailers 45399 2.8 2.8 0.0
52

Description NAICS Old New New - Old
Table 5. Comparison of average annual percentage growth rates of all employee hours, 1987-2002
Nonstore retailers 454 0.6 0.6 0.0Electronic shopping and mail order houses 45411 4.7 4.7 0.1Vending machine operators 454210 -1.0 -1.0 0.0Direct selling establishments 4543 -1.5 -1.5 0.0Fuel dealers 45431 -2.0 -2.0 0.0Heating oil dealers 454311 -1.9 -1.9 0.0Other direct selling establishments 454390 -1.1 -1.1 0.0General freight trucking, long-distance 48412 1.9 1.8 0.0Publishing 511 1.4 1.7 0.3Newspaper, periodical, book, and directory publishers 5111 -0.3 0.0 0.3Newspaper publishers 511110 -0.9 -0.8 0.1Periodical publishers 511120 0.8 1.0 0.2Book publishers 511130 0.3 0.5 0.2Database and directory publishers 511140 1.0 1.2 0.2Other publishers 51119 0.2 0.2 0.0Software publishers 511210 9.5 9.8 0.3Motion picture and video exhibition 51213 2.3 2.5 0.2Broadcasting, except Internet 515 1.6 1.6 0.0Radio and television broadcasting 5151 0.3 0.2 -0.1Radio broadcasting 51511 -1.0 -1.2 -0.3Television broadcasting 515120 1.2 1.2 0.0Cable and other subscription programming 515210 6.1 6.7 0.6Wired telecommunications carriers 517110 -0.4 -0.4 0.0Wireless telecommunications carriers (except satellite) 51721 16.9 17.3 0.4Cable and other program distribution 517510 6.0 6.3 0.3Commercial banking 522110 -0.3 -0.4 0.0Passenger car rental 532111 2.4 2.2 -0.2Truck, utility trailer, and rv (recreational vehicle) rental and leasing 532120 0.2 0.0 -0.2Video tape and disc rental 532230 2.9 2.7 -0.2Tax preparation services 541213 4.1 4.0 -0.1Advertising agencies 541810 0.0 -0.2 -0.2Photography studios, portrait 541921 3.0 2.9 -0.1Travel agencies 561510 0.1 0.1 0.0Janitorial services 561720 1.8 1.7 -0.1Traveler accommodation 7211 1.2 1.0 -0.2Hotels (except casino hotels) and motels 721110 0.9 0.7 -0.2Casino hotels 721120 2.3 2.1 -0.2Other traveler accommodation 72119 1.6 1.3 -0.2Bed-and-breakfast inns 721191 0.8 0.6 -0.2All other traveler accommodation 721199 2.9 2.5 -0.4Food services and drinking places 722 1.8 1.7 -0.1Full-service restaurants 722110 1.8 1.8 -0.1Limited-service eating places 72221 1.7 1.6 -0.1Special food services 7223 1.9 1.7 -0.2Drinking places (alcoholic beverages) 722410 1.1 1.0 -0.1Automotive repair and maintenance 8111 1.7 1.5 -0.2Hair, nail, and skin care services 81211 1.3 1.3 0.0Funeral homes and funeral services 812210 1.1 1.0 -0.1Drycleaning and laundry services 8123 -0.1 -0.2 -0.1Coin-operated laundries and drycleaners 812310 -1.7 -1.8 -0.2Drycleaning and laundry services (except coin-operated) 812320 -0.7 -0.8 -0.1Linen and uniform supply 81233 1.6 1.5 -0.1Photofinishing 81292 -2.4 -2.7 -0.2
53

Chart 1. Distribution of Differences Between New and Old Trends in Supervisory Hours, 1987-2002
77
106
148
89
57
0
50
100
150
200
250
300
350
400
-0.5% or less -0.4% to -0.2% -0.1% to 0.1% 0.2% to 0.4% 0.5% or greater
Percentage Point Revision in Average Annual Compound Rates of Change
Num
ber o
fIn
dust
ries
Chart 2. Distribution of Differences Between New and Old Trends in Total Labor Hours, 1987-2002
3
54
382
33
50
50
100
150
200
250
300
350
400
-0.5% or less -0.4% to -0.2% -0.1% to 0.1% 0.2% to 0.4% 0.5% or greater
Percentage Point Revision in Average Annual Compound Rates of Change
Num
ber o
fIn
dust
ries
54