construction of adenoviral vectors for cancer...
TRANSCRIPT
UNIVERSITÀ DEGLI STUDI DI PADOVA Dipartimento di Istologia, Microbiologia e Biotecnologie Mediche
Tesi di Dottorato di Ricerca in Virologia e Biotechnologie Microbiche XX Ciclo
CONSTRUCTION OF ADENOVIRAL VECTORS FOR CANCER GENE THERAPY AND EVALUATION OF TOXIC EFFECTS OF ADENOVIRAL INFECTION
ON ADRENOCORTICAL CELLS
Coordinatore: Ch.mo Prof. Giorgio Palù Supervisore: Ch.mo Prof. Giorgio Palù Co-Supervisore: Dott.ssa Luisa Barzon Dottorando: Urška Matkovič
31 gennaio 2008


UNIVERSITÀ DEGLI STUDI DI PADOVA
Sede Amministrativa: UNIVERSITÀ DEGLI STUDI DI PADOVA
DIPARTIMENTO DI ISTOLOGIA, MICROBIOLOGIA E BIOTECNOLOGIE MEDICHE
DOTTORATO DI RICERCA IN: VIROLOGIA E BIOTECHNOLOGIE MICROBICHE - CICLO XX
CONSTRUCTION OF ADENOVIRAL VECTORS FOR CANCER GENE THERAPY AND EVALUATION OF TOXIC EFFECTS OF ADENOVIRAL INFECTION
ON ADRENOCORTICAL CELLS
Coordinatore: Ch.mo Prof. Giorgio Palù Supervisore: Ch.mo Prof. Giorgio Palù Co-Supervisore: Dott.ssa Luisa Barzon Dottorando: Urška Matkovič
31 gennaio 2008


Department of Histology, Microbiology
and Medical Biotechnologies University of Padova
PhD Thesis Urška Matkovič XX Cycle 7
TABLE OF CONTEXT 1 ABSTRACT.................................................................................................................................................. 9 2 INTRODUCTION ..................................................................................................................................... 12 3 ADENOVIRUSES [8] ................................................................................................................................ 14
3.1 Classification...................................................................................................................................... 14 3.2 Virion structure .................................................................................................................................. 15 3.3 Replicative cycle ................................................................................................................................ 17
3.3.1 Adsorption and entry ..................................................................................................................... 18 3.3.2 Activation of early adenoviral genes and their modulation of host cell responses........................ 20 3.3.3 Adenovirus late gene expression, viral assembly and cell death ................................................... 21 3.3.4 Adenovirus interactions with host defence mechanisms ................................................................ 22
4 ADENOVIRAL VECTORS...................................................................................................................... 24 4.1 General properties of adenoviral vectors............................................................................................ 24 4.2 Techniques for constructing recombinant adenoviruses..................................................................... 25
4.2.1 AdEasy vector system for rapid generation of recombinant adenoviral vectors ........................... 28 4.3 Overcoming host immune responses against adenoviral vectors ....................................................... 30
4.3.1 Minimizing immune and apoptotic responses................................................................................ 30 4.4 Engineering targeted adenoviral vectors for gene therapy ................................................................. 31
4.4.1 Adapter-based adenovirus targeting ............................................................................................. 32 4.4.2 Adenovirus targeting via genetic modification of fiber and other capsid components.................. 32
5 ADENOVIRUS AND ADRENAL GLAND............................................................................................. 35 6 AIMS OF THE THESIS............................................................................................................................ 40 7 MATERIAL AND METHODS ................................................................................................................ 41
7.1 Cell cultures........................................................................................................................................ 41 7.2 Primary cultures ................................................................................................................................. 41 7.3 Construction of recombinant adenovirus............................................................................................ 42 7.4 Production of adenovirus.................................................................................................................... 42 7.5 Adenovirus preparation and viral infection ........................................................................................ 43 7.6 Adenovirus titer determination by quantitative real-time PCR .......................................................... 43 7.7 Adenovirus infectivity test ................................................................................................................. 43 7.8 MTT assay of GCV citotoxicity ......................................................................................................... 43 7.9 Evaluation of HSV-TK30 expression by quantitative real-time RT-PCR ........................................... 44 7.10 Adenovirus replication ....................................................................................................................... 44 7.11 Optical and Fluorescent Microscopy.................................................................................................. 44 7.12 Immuno-fluorescence staining ........................................................................................................... 44 7.13 Cell cycle analysis .............................................................................................................................. 45 7.14 Apoptosis detection ............................................................................................................................ 45 7.15 Cell survival ....................................................................................................................................... 45 7.16 BrdU proliferation assay .................................................................................................................... 45

Table of Context
8
7.17 Steroid Measurements ........................................................................................................................45 7.18 Quantitative real-time RT-PCR for CAR expression .........................................................................46 7.19 Quantitative real-time RT-PCR for steroidogenic enzymes expression .............................................46 7.20 Microarray analysis of gene expression profile in ACC cell infected with adenoviral vector............47
7.20.1 Virus infection and RNA preparation ............................................................................................49 7.20.2 RNA labeling and microarray hybridization..................................................................................50 7.20.3 Data analysis .................................................................................................................................51
7.21 In vivo adenoviral infection................................................................................................................52 8 RESULTS ...................................................................................................................................................53
8.1 Construction and Production of Recombinant Adenoviral Vectors....................................................53 8.2 Susceptibility of human adrenocortical carcinoma cells to adenoviral infection................................57
8.2.1 Wild-type adenovirus has a natural tropism for human adrenocortical cells................................57 8.2.2 Expression of primary adenoviral receptor CAR in human adrenocortical cells..........................58 8.2.3 First-generation adenoviral vectors efficiently transduce human adrenocortical cells ................59 8.2.4 Demonstration of efficient adenovirus replication in human adrenocortical carcinoma cells......67
8.3 Evaluation of therapeutic efficiency in human ACC, HCC and esophageal (EAC) carcinomas mediated by adenoviral transfer ........................................................................................................................70
8.3.1 GCV sensitivity assay.....................................................................................................................70 8.3.2 Expression of HSV-TK30 mRNA in transduced target cells............................................................73 8.3.3 In vivo studies of adenoviral vector-mediated gene transfer in mice.............................................74
8.4 Effect of adenovirus infection on human adrenocortical carcinoma cell proliferation .......................76 8.5 Cell cycle modification provoked by wild-type and recombinant adenovirus....................................79
8.5.1 Adenovirus induces S-phase of cell cycle in ACC cells .................................................................79 8.5.2 Adenoviral vectors induce G2/M arrest in ACC cells ....................................................................80
8.6 The effect of adenoviral infection on ACCs cell death.......................................................................85 8.6.1 Adenovirus replication results in cell death of ACC......................................................................85 8.6.2 Adenoviral vectors affect cell death at high multiplicity of infection.............................................87
8.7 Adenoviral infection induce steroid hormone production in human adenocortical cells....................89 8.7.1 Evaluation of adenoviral infection on steroid production in NCI-H295R in vitro model..............89 8.7.2 Effect of adenoviral infection on steroid function in human primary ACC cells ...........................95
8.8 Modulation of gene expression induced by recombinant adenoviral vector in human ACC cells .....96 8.8.1 Differential Regulation Analysis....................................................................................................96 8.8.2 2D-SOM analysis...........................................................................................................................97
9 DISCUSSION ...........................................................................................................................................101 10 REFERENCES.........................................................................................................................................106 11 ACKNOWLEDGEMENTS.....................................................................................................................111

Department of Histology, Microbiology
and Medical Biotechnologies University of Padova
PhD Thesis Urška Matkovič XX Cycle 9
1 ABSTRACT Recombinant adenoviruses are widely used in gene therapy clinical trials due to their efficient gene transfer into broad range of tissues. However, the systemic use of adenoviral vectors might be associated with side effects owing to their natural infection of different organs, particularly liver and adrenal gland. First, our task was the construction and evaluation of E1/E3-deleted replication incompetent adenoviral vectors for gene therapy of esophageal (EAC), hepatocellular (HCC) and adrenocortical (ACC) carcinomas. Recombinant adenoviral vectors were generated by cloning therapeutic gene for mutant herpes simplex virus thymidine kinase (HSV-TK30) and reporter gene for green fluorescent protein (EGFP) into shuttle vectors followed by homologous recombination with adenoviral genome in bacteria E.coli. Viral stocks were prepared by transfection and expansion in HEK 293 cells. AdEGFP demonstrated efficient transduction of tested ACC, HCC and some of EAC cell lines as analyzed by flow cytometry and fluorescent microscopy. Consistently, high levels of primary adenovirus receptor CAR was demonstrated in HCC and ACC cell lines, including normal and neoplastic tissues. Furthermore, cells transduced with AdHSV-TK30 showed prominent therapeutic efficiency of HSV-TK30/GCV treatment in MOI-dependent manner. In vivo experiments in nude mice s.c. inoculated with EAC cells demonstrated efficient AdEGFP transduction of tumor and its growth regression after intratumor injection with AdHSV-TK30 after GCV treatment. In the second part of the work, human ACC cells were used to assess the toxicity of replication competent adenovirus type 5 (Ad5) and replication incompetent E1/E3-deleted adenoviral vectors. In this regard, we investigated the effects of adenoviral infection on ACC gene expression profile, cell proliferation, cell cycle, cell death and steroidogenesis. Productive Ad5 replication was demonstrated in ACC cells, consistent with induced S-phase, consequently resulting in time- and dose-dependent induction of cell death after infection with Ad5 at MOI 2-50. On the contrary, no marked effect on ACC cell proliferation and cell cycle was found after adenoviral transduction with Adnull (Ad vector expressing no transgene), AdEGFP and AdHSV-TK30 at low MOI from 2 to 50, whereas high MOI of 100 and 500 decreased cell survival for about 20% compared to uninfected control and increased G2/M phase. However, no significant induction of apoptosis or necrosis was detected after adenoviral infection at both, low and high MOI. With regard to steroidogenesis, adenoviral vectors and wild-type Ad5 induced cortisol, estradiol and aldosterone production. Consistently, upregulated gene expression of steroidogenic key activators StAR and SF-1, whereas downregulated expression of steroidogenic repressor DAX1 was found after adenoviral infection. Expression of steroidogenic enzymes CYP19, CYP21, CYP11B1 and CYP11B2 at all time points p.i. was upregulated, accordingly. Microarray analysis in time course infection experiments did not show marked alterantions of ACC gene expression profile after infection with AdEGFP. In the early phase of infection, genes involved in innate immune (interferones and proinflammatory cytokines) and stress response were transiently upregulated. In conclusion, adenoviral vectors are efficient tools for gene transfer to ACC, HCC and EAC. Potential adrenal side effects of adenoviral vector administration should be considered, since these vectors induce transient growth arrest and impair cortisol production in ACC cells.

Abstract - Sommario
10
SOMMARIO I vettori adenovirali ricombinanti sono usati ampiamente nei protocolli clinici di terapia genica per la loro notevole efficienza nel trasferimento genico a quasi tutti i tipi di tessuti. La somministrazione di questi vettori per via sistemica potrebbe però provocare effetti collaterali negli organi che rappresentano i bersagli naturali dell’infezione da adenovirus, tra cui, soprattutto, il fegato ed il surrene. Il primo obiettivo di questo studio è stato la costruzione e la valutazione di vettori adenovirali non competenti per la replicazione per la delezione delle regioni E1/E3 da utilizzare per la terapia genica dei carcinomi dell’esofago, del fegato e della corticale del surrene. I vettori adenovirali ricombinanti sono stati costruiti inserendo la sequenza del gene codificante una forma mutata della timidina kinasi del virus dell’herpes simplex (HSV-TK30) e del gene reporter codificante la green fluorescent protein (EGFP) in vettori cosiddetto “shuttle”, perché contenenti solo una porzione del genoma adenovirale. Il costrutto molecolare ottenuto era poi co-trasfettato insieme ad un plasmide contenente la rimanente porzione del genoma adenovirale in cellule di E. coli per generare il genoma dei vettori adenovirali mediante ricombinazione omologa. Gli stock virali erano poi prodotti mediante trasfezione ed espansione in cellule HEK 293. Il vettore AdEGFP ha dimostrato di trasdurre in modo efficiente cellule di linee di carcinoma corticosurrenalico (ACC), epatocarcinoma (HCC) ed alcune linee di carcinoma esofageo (EAC), come dimostrato dall’analisi citofluorimetrica ed al microscopio a fluorescenza. In accordo con questi risultati, le linee cellulari di ACC e HCC e tessuti normali e tumorali di surrene e fegato dimostravano elevati livelli di trascritti del principale recettore adenovirale CAR. Inoltre, quando le cellule tumorali erano trasdotte con il vettore AdHSV-TK30, rispondevano al trattamento con ganciclovir (GCV) in modo dipendente dalla molteplicità di infezione (MOI). Gli esperimenti in vivo sono stati condotti su topi nudi, nei quali erano inoculate sottocute cellule di EAC per generare masse tumorali. L’iniezione intratumorale del vettore AdEGFP ha consentito di dimostrare l’efficienza di traduzione in vivo delle cellule tumorali; la somministrazione intratumorale del vettore AdHSV-TK30, seguito dal trattamento i.p. con GCV, portava ad una marcata regressione delle masse tumorali. Nella seconda parte dello studio sono stati valutati gli effetti citopatici sulle cellule cortico-surrenaliche dell’infezione da adenovirus di sierotipo 5 competente per la replicazione e da vettori adenovirali non competenti per la replicazione E1-/E3-. In particolare, sono stati analizzati gli effetti dell’infezione adenovirale sul profilo di espressione genica, sulla proliferazione, sul ciclo cellulare, sulla morte cellulare e sulla steroidogenesi delle cellule cortico-surrenaliche. Nelle cellule di ACC, Ad5 a MOI 2-50 era in grado di replicare in modo efficiente, inducendo la fase S del ciclo cellulare, alla quale seguiva l’induzione della morte cellulare in modo MOI- e tempo-dipendente. Quando erano utilizzati i vettori non competenti per la replicazione Adnull (vettore adenovirale privo di transgene), AdEGFP e AdHSV-TK a basse MOI (MOI 2-50) non si osservava alcun effetto significativo sulla proliferazione e sul ciclo cellulare, mentre quando si utilizzavano MOI più elevate (MOI 100 e 500), la sopravvivenza cellulare diminuiva del 20% rispetto alle cellule di controllo non infettate ed aumentava la percentuale di cellule in fase G2/M, anche se non si osservava un effetto evidente in termini di necrosi o apoptosi sia a basse che ad alte

Department of Histology, Microbiology
and Medical Biotechnologies University of Padova
PhD Thesis Urška Matkovič XX Cycle 11
MOI. Per quanto riguarda la steroidogenesi, sia i vettori adenovirali che Ad5 wild-type inducevano la produzione di cortisolo, aldosterone e 17β-estradiolo. Questo effetto era accompagnato dall’induzione dell’espressione di StAR e SF-1, fattori chiave nell’attivazione della steroidogenesi, e dalla inibizione dell’espressione del repressore DAX-1, così come dall’induzione dell’espressione dei geni codificanti gli enzimi della steroidogenesi CYP19, CYP21, CYP11B1 e CYP11B2. Infine, è stato condotto uno studio del profilo di espressione genica cellulare nel corso del tempo dopo infezione con i vettori adenovirali. L’analisi non ha dimostrato un marcato effetto dell’infezione adenovirale sul profilo di espressione genica delle cellule di ACC, anche se nelle prime ore post-infezione si notava l’induzione di geni coinvolti nella risposta immunitaria innata (interferoni e citochine proinfiammatorie) e nelle risposta allo stress. In conclusione, i vettori adenovirali sono uno strumento efficiente per il trasferimento genico a cellule di ACC, HCC ed EAC. E’ opportuno valutare in studi clinici eventuali effetti collaterali a livello del surrene dopo somministrazione sistemica di vettori adenovirali per terapia genica, in quanto questi studi in vitro hanno dimostrato che, non solo l’infezione con adenovirus wild-type, ma anche con vettori adenovirali non competenti per la replicazione, ha effetto citopatico ed induce la produzione di cortisolo e di altri ormoni steroidei in cellule cortico-surrenaliche.

Introduction
12
2 INTRODUCTION The idea of gene therapy emerged in the early 1970s with growing understanding of molecular genetics and with discovery that genetic diseases develop due to inherited mutation in single gene, which could be potentially supplemented with its normal copy. It soon became clear, that even most of acquired diseases originate from disorders at genetic level. Gene therapy, therefore, has revealed revolutionary promises for the future treatment of a vast array of diseases, ranging from birth defects to neurological disorders and from cancer to infectious diseases [1, 2]. The sobering fact that the conventional treatment of cancer - surgery, radiation and chemotherapy - cannot deal with this incurable disease has prompted serious efforts to develop new strategies for treating the disease based on attacking it at its source [3]. Indeed, cancer is currently the most important clinical application of gene therapy, accounting for 66.5% of the protocols (The Journal of Gene Medicine; www.wiley.co.uk/genmed/). The current pace of progress in understanding the molecular biology of cancer and the complex interactions between tumor cells and the immune system has expanded the field of cancer gene therapy to a wide range of ideas and technologies, from direct attack on tumor cells to stimulation the immune response against tumor antigens [4]. Most of these approaches are yet in preclinical or early clinical testing, demonstrating their overall safety and efficacy. Although first clinical results have shown poor therapeutic efficiency, it is too early to assess this field conclusively. Crucial obstacles that need to be overcome before including gene therapy as a standard of care in the management of cancer patients are low efficiency of therapeutic genes and lack of selectivity of currently available gene transfer tools. Thus, key issues that need to be addressed are the improvement of vectors to achieve high levels of therapeutic gene expression and selective transduction of a sufficient number of target cancer cells. In order to trigger response in all tumor cells, even in those that might miss transduction, suicide or cytokine genes should be inserted into oncolytic vectors to ameliorate tumor cell killing and antitumor immunity [5]. To achieve successful gene therapy, an appropriate amount of a therapeutic gene must be delivered into target tissue without substantial toxicity. This approach requires a technology capable of gene transfer in a wide variety of cells, tissues and whole organs. Engineering of new, improved delivery vehicles is in continuous progression, embracing various mechanisms of transfer foreign DNA into distinct cells. DNA delivery systems are classified as viral vector-mediated systems and nonviral vector-mediated systems. Non-viral vectors include naked DNA and liposomes. Viral vectors, on the other hand, are produced from viruses, exploiting their natural highly evolved mechanisms for infection and replication in host cells [6]. The level of expression of a therapeutic gene is influenced by many factors, thus a vector should be designed in which all these factors are under control. Ideal gene therapy vector should have a number of following characteristics: (1) easy production of a vector at high titer (up to 1011 VP/ml) allowing commercial production and processing including reasonable shelf-life for transport and distribution; (2) sustained production allowing regulated therapeutic gene expression over required period of

Department of Histology, Microbiology
and Medical Biotechnologies University of Padova
PhD Thesis Urška Matkovič XX Cycle 13
time (short- or long-term expression); (3) immunologically inert to avoid activating host’s immune response and provide repeated administration; (4) tissue targeting of the vector to provide delivery to only certain cell types; (5) size capacity of the vector should not be limited by the size of a therapeutic gene; (6) replication, segregation or integration: the vector should ensure replication of therapeutic gene either by site-specific integration or by maintenance as a episome in the nucleus; (7) infection of dividing and non-dividing cells [1]. At present, not all of these characteristics can be found in any one vector, since each vector type has its advantages and disadvantages. Choice of suitable vectors depends on the basis of the therapeutic goal. In the case of inherited genetic diseases, where long-term expression of defected gene from a relatively small proportion of cells is needed, a viral vector with ability of integrating its genetic material into patient’s chromosomes, such as retrovirus, should be more suitable. Whereas nonintegrating delivery vehicles, such as adenoviral vectors, liposomes or naked DNA should be desirable if only short-term, but high expression of gene is required in order to induce the immune system against cancer cells or an infectious agent [7]. Figure 1 shows currently used vectors for gene therapy trials, leading with adenoviral vectors that account for 24.7% of gene therapy trials, followed by 22.8% of trials using retroviral vectors. Nonviral vectors (liposomes and naked DNA), on the other hand, are accounting for 25% of clinical trials (The Journal of Gene Medicine; www.wiley.co.uk/genmed/).
Figure 1. Current application of viral vectors for gene therapy clinical trials (www.wiley.co.uk, 2007).

Adenoviruses
14
3 ADENOVIRUSES [8] Adenoviruses were first isolated in 1953 from tonsils and adenoidal tissues of children with acute respiratory infections. Culture lines established from these tissues led to observation of degeneration of epithelial-like cells caused by distinct viral agents. Similar viral agents were isolated from military recruits with respiratory illnesses. It was soon realized that besides respiratory disease, adenoviruses cause epidemic conjunctivitis and infantile gastroenteritis. Different etiology indicated that multiple serotypes of these new agents exist, first called adenoid degeneration (AD), adenoid-pharyngeal conjunctival (APC), and acute respiratory disease (ARD) agents. In 1962, it was demonstrated that Ad12 could cause malignant tumors in rodents; this was the first time that a human virus was discovered to be oncogenic, eventhough its oncogenesis has never been observed in humans. Nevertheless, the oncogenic potential of adenoviruses in animals and cultured cells established adenovirus as an important model system for studying mechanisms of oncogenesis. Furthermore, easy adenovirus propagation to high-titer stock and genome manipulation have contributed to understanding of viral and cellular mechanisms, such as gene expression and regulation, DNA replication, cell cycle control, and cellular growth regulation. Today, the intense research is focused on genetic engineering of adenoviruses to construct effective and safe vectors for gene therapy.
3.1 Classification The family Adenoviridae present ubiquitous group of viruses comprising wide variety of types isolated from humans and from other animals. They are grouped into four genera: Mastadenovirus, from mammals, Aviadenovirus, from birds; and Atadenovirus and Siadenovirus, from a broad range of hosts, including fish. Human adenoviruses are divided into six species (A, B, C, D, E, F) subdivided into 51 different serotypes. Serotypes have been distinguished on the basis of neutralization with specific antisera. Neutralization results from antibody binding to epitopes on the virion hexon protein and the terminal knob domain of the fiber protein. Serotype-specificy is determined by hypervariable regions on the hexon, which are responsible for their ability to agglutinate red blood cells. Hence, the hemagglutination reaction of an adenovirus is inhibited by antisera specific for viruses of the same type, but not by antisera for different virus types. Additional classification techniques are used, including oncogenic potential, electrophoretic mobility, or genome sequence homology. Different classification criteria for human adenoviruses are presented in Table 1. Most commonly spread are group-C serotypes 1,2,5,6 and B1 serotypes 3, 7 associated with acute upper respiratory tract (URT) infections in children or common colds in adults. E serotype 4 and B1 serotype 7 cause acute respiratory disease (ARD) in military recruits. These types are most frequently obtained from adenoids and tonsils, where they persist as latent infections for years and are able to reactivate some time later. Other types can occasionally infect eye (species C and Ad3) and gastrointestinal tract (F serotypes 40, 41), but usually do not spread beyond the regional lymph nodes. Species B2 infects the kidney and urinary tract. D serotypes 8, 19, 37 cause epidemic keratoconjunctivitis (EKC).

Department of Histology, Microbiology
and Medical Biotechnologies University of Padova
PhD Thesis Urška Matkovič XX Cycle 15
Table 1. Classification criteria for human adenoviruses (Mastadenovirus H) adopted from Fourth Edition of Fields Virology (Chapter 64).
Oncogenic potential Subgroup (Species)
Hemagglutination groups Serotypes Tumors in
animals Transformation in tissue culture
Percentage of GC in DNA
A IV (little or no agglutination) 12, 18, 31 High
+ 48-49
B I (complete aggl. of
monkey erythrocytes)
3, 7, 11, 14, 16, 21, 34, 35, 50 Moderate + 50-52
C -III (partial aggl. of rat erytrocytes) 1, 2, 5, 6 Low or
none + 57-59
D -II (complete aggl. of rat erytrocytes)
8, 9, 10, 13, 15, 17, 19, 20, 22-30, 32, 33, 36-39, 42-49, 51
Low or none
(mammary tumors)
+ 57-61
E III 4 Low or none + 57-59
F III 40, 41 Unknown + 57-59 On occasion, these viruses can also cause disease in other organs, such as pancreas, myocardium and central nervous system. Most human diseases are associated with only one third of 51 identified serotypes.
3.2 Virion structure Adenoviruses are nonenveloped particles of 80-110 nm in diameter displaying a characteristic morphology, with an icosahedral capsid consisting of 252 capsomeres: 240 hexon and 12 penton capsomeres. Hexon capsomeres (hexons) are composed of a trimer of polypeptide II with a central pore; VI, VIII and IX are minor polypeptides also associated with the hexon and are involved in stabilization and assembly of the particle. Pentons consist of a pentamer of peptide III associated with five molecules of peptide IIIa. IIIa is located at each vertex, under the capsid surface where it stabilizes penton and hexon facets. The pentons have a toxin-like activity that causes rapid appearance of citopathic effects (CPE) and detachment of cells from the surface on which they are growing. A thin glycoprotein fibre IV protudes from the each penton and is responsible for haemagglutination activity. The hexons, pentons and fibers are the major viral surface components presenting the major adenovirus antigens important in viral classification and disease diagnosis. Adenoviral genome is a linear, double-stranded DNA containing about 35-36 kbp with capacity to encode 30-40 genes. The entire DNA sequences of the genomes of several adenovirus types are known. Terminal protein (TP) is covalently attached to inverted terminal repeats (ITRs) of each 5’ end of the genome associated with viral replication. The DNA is condensed in the core of the virion. The core proteins, polypeptide VII and small peptide μ are important in forming the core structure. Another protein, V, is packaged with this DNA-protein complex to provide a structural

Adenoviruses
16
link to the capsid via protein VI. The virus also contains a virus-encoded protease (Pr), which is necessary for processing of some structural viral proteins [9, 10]. Structure of adenovirus particle is demonstrated in Figure 2.
Figure 2. Structure of the adenovirus virion. (A) The virion polypeptides after SDS-PAGE are shown after Coomassie staining and their positions in the virion are indicated. Electron microscopy of adenovirus capsid with the fibers projecting from penton bases (B) and the hexon capsomere with six nearest neighbors and the penton surrounded by five hexon capsomeres are designated (C). The images are adopted from Horwitz, J Gene Medicine, 2004).
Department of Histology, Microbiology
and Medical Biotechnologies University of Padova
PhD Thesis Urška Matkovič XX Cycle 17
3.3 Replicative cycle The adenovirus replication cycle is divided into early and late phase. Early phase includes entry of the virus into the host cell and translocation of viral DNA into the nucleus followed by transcription and translation of the early genes encoding for viral nonstructural proteins needed for viral replication. These early events induce the host cell to favour viral replication and further viral gene expression, induce cell cycle progression, block apoptosis and combat against host antiviral defenses. The late phase of the cycle begins with expression of late viral genes followed by assembly and maturation of infectious virus. The early phase takes about 6-8 h, whereas the late phase takes 4-6 h. The time between infection and the first appearance of progeny virus is the eclipse period. Schematic presentation of adenovirus genome transcription is depicted in Figure 3. Before and independently of genome replication, immediate early and early mRNA are transcribed from the input viral DNA. The early transcribed regions are E1, E2, E3 and E4. The E1 gene products are subdivided into E1A and E1B. E1A gene product is a trans-acting transcriptional regulatory factor necessary for transcriptional activation of early genes. E1A and E1B gene products cooperatively block apoptosis that occurs due to E1A functions and transform infected cells by binding cellular proteins (pRB, p300, p53) that regulate cell cycle progression. The E2 gene products are subdivided into E2A and E2B, which provide the machinery for DNA replication. The E3 genes provide proteins directed against host defense mechanisms. Some of these are E3 19K, E3B and ADP proteins. Adenovirus death protein (ADP) facilitates late cytolysis of the infected cell and thereby releases progeny viruses more efficiently. E3 19K protein is involved in reduction of CTL response, whereas E3B inhibit TNF-α-induced apoptosis. The E4 gene products are involved in inhibition of host mRNA metabolism and host protein synthesis. E4 protein associated with E1B protein inhibits the cytoplasmic accumulation of cellular mRNA and facilitates accumulation of viral mRNA. Another early region encodes small virus-associated RNAs (VA RNAs), which are also involved in viral defense mechanisms against host cell. Viral replication takes place in the nucleus. The virus-encoded, covalently linked terminal protein TP functions as a primer for viral DNA synthesis. In addition, many cellular proteins in the nucleus also participate in genome replication.

Adenoviruses
18
E1A E1B
E3E3 19K, E3B, ADP, ...
MLP
L1 IIIa
L2III, VII, V
L3VI, II, Pr
L4VIII, ...
L5IV
200 40 60 80 100
E2ADBP E4
orfs E2BpTP
Pol
IV
IX
VA RNA
Figure 3. Transcription of adenovirus genome (Russell, J Gen Virol, 2000). Transcription of late genes (L) begins with the onset of viral DNA synthesis. The late genes are transcribed from the major late promotor (MLP) of only newly replicated DNA. From a single large primary transcript at least 18 different late mRNAs are produced by splicing. These mRNAs are grouped from L1 to L5 and encode for viral structural proteins and two scaffold proteins encoded in L4 and L1 genes. The first assists in assembly of hexons, whereas the second facilitates DNA encapsidation. The processed transcripts are transported to the cytoplasm, where the viral proteins are synthesized. Viral assembly occurs in the nucleus, but begins in the cytoplasm where newly synthesized structural proteins form hexon and penton capsomeres. They are then self-assembled into empty capsids in the nucleus followed by entry of naked DNA. Finally, precursor core proteins are cleaved by viral proteinase to form stable core. Although cell metabolism is inhibited in the early stages of infection, infected cells do not lyse. CPE usually displays rounding, enlargement and aggregation of infected cells with intranuclear inclusions. About 10.000 virus particles are produced per infected cell. Most of them remain within the cell exhibiting latent infection. Reactivation can be caused after cell death or by accidental lysis of the cell [9, 10].
3.3.1 Adsorption and entry The virus attaches to cells with the fiber proteins. The fiber is a trimer of three types of monomers (indicated in red, blue and green in the Figure 4) forming a tightly wound shaft and rounded knob. This initial interaction involves a range of distinct cellular receptors. The first characterized primary receptor was coxsackie/adenovirus receptor (CAR). The transmembrane CAR protein belongs to the immunoglobulin superfamily and is a component of epithelial cell tight junctions. It is high-affinity receptor for human adenoviruses from subgroups A, C, D, E and F. It is abundantly expressed in heart, pancreas, the central and peripheral nervous system, prostate, testis, lung, liver, and intestine, whereas poor CAR expression was demonstrated on lymphocytes and adult muscle. It was shown that CAR binds to the fiber knob

Department of Histology, Microbiology
and Medical Biotechnologies University of Padova
PhD Thesis Urška Matkovič XX Cycle 19
through the same surface used by CAR for homotypic interactions. Fiber proteins released from infected cells in excess of progeny virions interfere with CAR oligomerization at tight junctions and promote dissemination of virions to new host cells. This finding suggests that fiber-CAR interaction may thus have two functions: initial attachment of virions to host cells during infection and virion spreading in the host. Recently, heparan sulfate glycosaminoglycans (HS-GAGs) were identified to mediate CAR-independent attachment and infection by Ad2 and Ad5. Further, class I major histocompatibility complex (MHC-I) has been reported to promote high-affinity interaction with Ad5. In the contrast to other subgroups, subgroup B adenovirus bind CD46 plasma membrane protein expressed on hematopoietic and dendritic cells. It is not known yet, which receptor determines the tropism of Ad40 and Ad41 for intestine. Several subgroup D adenoviruses infect cells by sialic acid-mediated attachment. The second step followed by adenovirus attachment to primary receptor CAR, is binding of the penton base protein (III/IIIa) to the cellular αν integrins. This interaction presents 50 times lower affinity and allows internalization via receptor-mediated endocytosis. Most cells express primary receptors for the adenovirus fibre protein, whereas internalization is more selective. Integrins are a family of heterodimeric cell surface receptors responsible for cell adhesion to extracellular matrix and for cell signalling through signal transduction enzymes. The interaction occurs through RGD peptide within the penton base, leading to the detachment of fibers. Pentone-induced integrins activate PI3K kinase and Rho GTPases that are important for rearrangments in the actin cytoskeleton and initiation of fiber-less virus internalisation. Interaction with integrins is also important for virus escape from the endosome. a
b
Figure 4. a) Adenovirus interaction with CAR and integrin mediated by adenovirus fiber and penton base protein. b) Adenovirus fiber structure and receptor binding sites. The figure is adopted from Zhang and Bergelson, J Virol, 2005.

Adenoviruses
20
Uncoating is a sequential process that begins in the cytoplasm and is completed in the nucleus with release of the DNA through nuclear pores. Partial disassembly of the capsid begins with release from endosomes, when peptid IIIa, III, IV and VIII dissociate. Subvirion particles are transported to the nucleous on microtubules. Final disassembly is completed with cleavage of protein VI by viral protease to liberate viral core from the capsid, enabling the delivery of viral DNA to the nucleus. First, subvirion particle associate with nuclear pore complexes (NPCs) and then viral uncoating occurs. Viral DNA and the associated major basic core protein VII enter the nucleus, whereas most hexon and protein IX remain associated with NPCs.
3.3.2 Activation of early adenoviral genes and their modulation of host cell responses
Once efficient entry and translocation of virions to the nucleus is achieved, the primary tasks of early adenovirus gene expression are: (1) to induce the host cell to enter the S phase of the cell cycle, facilitating viral replication, (2) to activate viral genes against antiviral host protection, and (3) to synthesize viral gene products necessary for viral DNA replication. The principal adenoviral proteins needed for activation of the three events are encoded by E1A region. E1A transcripts are processed into two mRNAs, encoding two polypeptides 12S and 13S E1A proteins, called also small and large E1A proteins. E1A proteins of various human serotypes contain five conserved regions: N-terminal end, CR1, CR2, CR3 and CR4. They do not bind DNA, but bind to cellular transcription factors and regulatory proteins modulating their function and increasing the rate of transcription. They are often referred to as trans-activators. CR3 region of the large E1A protein binds to the mediator of transcription complex through MED23 subunit, stimulating the formation of preinitiation complex on promoter DNA. The small E1A protein activates transcription specifically from E2 early promoter. Both, large and small E1A proteins bind the retinoblastoma (Rb) family members trough CR1 and CR2. Rb repress E2F transcription factor. CR2 binds to Rb with stronger affinity and displace the E2F, resulting in constitutive activation through E2F sites: E2 promoter and many cellular genes required for entry into S-phase. CR1 of E1A protein binds to CBP protein, p300 histone acetylases, p400 that are involved in regulation of chromatin structure and to TIP60 complex involved in DNA repair. In addition to Rb binding, E1A blocks CDK inhibitors that target Rb-family proteins. CR4 binds to C-terminal binding protein (CtBP) that functions as corepressor of cellular genes. Abnormal stimulation of cell to enter S phase mediated by E1A proteins induce the level and activity of the tumor suppressor p53, transcription factor that activates genes leading to cell-cycle arrest or apoptosis. Adenovirus encodes for several proteins which function to inhibit p53 function. E1B-55K/E4orf6 protein complex associated with cellular proteins (elongins, cullins) form ubiquitin ligase complex that bind p53 and results in its proteosomal degradation. E1B-55K employs several other mechanisms to inhibit transcription activation of p53 target genes. It binds directly to N-terminal activation domain of p53 converting it from activator to repressor. Bound E1B-55K also interferes with RNA polymerase II general initiation factor. E4orf6 inhibits p53 independently of E1B-55K by binding to p73. Another viral protein, E1B-

Department of Histology, Microbiology
and Medical Biotechnologies University of Padova
PhD Thesis Urška Matkovič XX Cycle 21
19K acts as apoptosis inhibitor. It is homologous to cellular BCL-2 family proteins, which function as proapoptotic factors by binding to BAK and BAX proteins to prevent them from co-oligomerizing and forming pores in the mitochondrial outer membrane. Adenovirus encodes additional proteins that block the induction of apoptosis by cytotoxic T lymphocytes and macrophages. In addition of E1 region, E4 region encodes several important proteins necessary for adenovirus to facilitate its replication and to combat cellular responses against it. Two proteins, encoded in E4, E4orf1 and E4orf4, function to activate translation, leading to high rate of protein synthesis in the absence of mitogens and nutrients, conditions that repress translation in uninfected cells. An important threat to adenovirus is the elimination of its DNA molecule recognized as double-strand break. Adenovirus circumvents the cellular DNA damage response to DNA molecules by E4orf3 and E4orf6-mediated inhibition of MNR complex involved in coordination of DNA double-strand breaks repair. Like in the case of p53 degradation, also subunits of MNR complex are substrates of E1B-55K/E4orf6 complex. The E4orf3 associates with PML nuclear bodies and inhibit their activation involved in assembly of protein complexes necessary for DNA repair and induction of apoptosis in response to DNA damage.
3.3.3 Adenovirus late gene expression, viral assembly and cell death Expression of late adenovirus genes is controlled by major late promoter (MLP), which becomes strongly activated at late times pi. Two components contribute to the delayed activation of MLP: a cis-acting modification of the adenovirus chromosome, and induction of a virus-coded transcription factor. The mechanism for the time-dependant, cis-acting modification might be dissociation of protein VII from viral DNA during its replication. The second factor is coded by adenovirus delayed early gene IVa2, which binds to MLP downstream regions to activate transcription. Adenovirus encodes two other delayed early promoters. One expresses mRNA encoding virion protein IX, which besides being a component of the capsid, activates transcription, but is not specific for MLP. Second promoter is responsible for expression of E2 region to increase synthesis of proteins needed for viral DNA replication. After expression of late mRNAs, the cytoplasmic accumulation, but not synthesis, of cellular mRNA is blocked, suggesting that their nuclear export is inhibited. This activity is blocked by E1B-55/E4orf6 complex that is directly involved in the export of viral late mRNAs through nuclear pores. Both proteins contain nuclear export signals that interact with the exportin and facilitate viral late mRNA export. Ubiquitin-ligase activity of E1B-55/E4orf6 complex enables degradation of produced cellular mRNAs. In addition to their facilitated transport from nucleus, viral mRNAs are preferentially translated when they reach the cytoplasm. The inhibition of host mRNA translation is caused by dephosphorylation of translation initiation factor, eIF4E, involved in assembly of 40S ribosome unit to the translation initiation codon of mRNA. Switch from de- and phosphorylation of eIF4E is regulated by 100K protein. Adenovirus overcomes this translational regulation by alternative form of translation initiation due to presence of the tripartite leader sequence contained in most late viral mRNA. In fact, 40S ribosome unit is directly transferred to initiation codon. Also, tripartite leader
Adenoviruses
22
stimulates translation by binding 100K protein to enhance the binding of eIF4E to viral late mRNA. As a consequence of intensive viral DNA replication and viral mRNA expression large quantities of adenovirus structural polypeptides are synthesised. Hexon and penton capsomeres are rapidly assembled in the cytoplasm and imported into the nucleus where assembly of the virion occurs. The assembly of hexon trimers is mediated by 100K protein that acts as chaperone and as a scaffold protein. The import of capsomeres in nucleus is mediated by protein VI. Adenovirus DNA contains packaging sequence that functions not only as an encapsidation signal, but also is important in virion assembly. It is a binding sequence for viral IVa2 and L1 52/55K proteins that promote viral DNA packaging into procapsids. Deletion in packaging sequence as well as 52/55K mutants assemble empty capsids. Precursors of core proteins associate with viral DNA late in infection and are consequently packaged into capsids. Finally, L3 viral protease cleaves precursors of proteins VI, VII, VIII, μ, and terminal protein and removes 52/55K protein to render the particle infectious. The escape and spread of progeny virus is facilitated by different viral mechanisms. First mechanism involves L3 viral protease that cleaves cellular cytokeratin K18 late in infection. Cleaved cytokeratin cannot polymerise in filaments and accumulates in the cytoplasm. Impairment of the mechanical cell integrity renders infected cell more susceptible to lysis. Second mechanism involves E3 11.6 kd protein or adenovirus death protein (ADP). It is integral membrane glycoprotein that links to the nuclear membrane, endoplasmatic reticulum and Golgi apparatus and interacts with proteins involved in regulation of ubiquitin-protein ligase complex in response to spindle formation during mitosis. Detailed mechanism of ADP action that leads to cell death is not known. The dissemination of viruses is promoted also by free fiber proteins released from infected cells that interact with CAR at tight junctions.
3.3.4 Adenovirus interactions with host defence mechanisms Adenovirus-related diseases usually exhibit common symptoms of mild respiratory infections or pass as asymptomatic infections. The key factor in the suppression of adenovirus dissemination is effective host defense mechanism displaying different strategies directed against foreign particles. Adenoviruses are suppressed either by nonspecific or specific host defenses. Epithelial cells, for instance, release antimicrobial peptides defensins that provide significant protection from adenovirus infection. Some tissues, induced by appropriate signal, start to release chemokines in order to activate inflammatory response. The transcription factor NF-κB is the main regulator of antiviral response and acts as transcription activator of various immune modulators. Viral E1A protein binds to NF-κB in order to suppress early release of interferons from virus infected cells. Interferons induce transcription of wide array of genes involved in antiviral response. E1A and VA RNA inhibit the cellular response to interferon (IFN) -α and -β. VA RNA also inhibits the processing of cellular miRNA and siRNA, but it is not clear to what extent this inhibition contributes to the adenovirus infection. Specific immune response against adenoviruses can be activated by cellular or by humoral immunity. Cellular immunity is provided by cytotoxic CD8+ T cells (CTLs) and CD4+ helper cells. CTLs recognize viral antigen in MHC class I
Department of Histology, Microbiology
and Medical Biotechnologies University of Padova
PhD Thesis Urška Matkovič XX Cycle 23
complex on the cell surface, thereby leading to lysis of infected cells. E3 19K protein blocks movement of the MHC-antigen complex to the cell surface, hence, preventing CTL-mediated lysis. Other E3 proteins inhibit apoptosis induced by death ligands Fas, TNF-α and TRAIL. The mechanism of inhibition is mediated by viral transmembrane receptor internalisation and degradation (RID) complex that causes endocytosis and lysosomal degradation of death ligands. Humoral immunity is mediated by B cells, which produce specific antibodies directed against adenoviral capsid components. Proliferation of B cells is stimulated by IFN-α that is secreted by CD4+ helper T cells. They neutralize virus particles thereby inhibiting their attachment to the cells. Besides viral structural proteins, a range of adenoviral components, such as pTP, Pol, DBP, were examined as target antigens [9].

Adenoviral Vectors
24
4 ADENOVIRAL VECTORS 4.1 General properties of adenoviral vectors The use of adenoviruses as gene delivery vehicles was first realized for treating cystic fibrosis. It soon became clear, that adenoviral vectors can efficiently transduce a great variety of dividing and non-dividing cells, even those associated with highly differentiated tissues such as skeletal muscle, lung, brain, and heart [7, 9]. Current vectors are derived from most common human C-group serotypes 2 and 5. Problems related to reduced efficiency of vector administration due to pre-existing immunity have spurred efforts to exploit less common serotypes or even non-human adenoviruses [7]. Recombinant adenoviruses have gained an extensive use as gene transfer tools, since they exhibit some important characteristics of the suitable vector. In addition to their broad host range and ability to transduce dividing and non-dividing cells, they appeal also because of their low pathogenicity in humans. Furthermore, they replicate efficiently to high titers (up to 1011VP/ml) and are relatively easy to produce and purify on a commercial scale. They do not integrate into host’s chromosomes, but remains epichromosomal. This property is in a part advantageous, because excludes the risk of insertional mutagenesis, but unfortunately accounts for only transient transgene expression. Another desirable feature is large packaging capacity of foreign DNA and possibility to insert multiple genes providing their simultaneous expression in the same cell line or tissue. Although the wild type adenovirus can incorporate only about 2 kb of foreign DNA without significant affects on its stability or its infectivity, the removal of some or all of the virus genes provide room for the introduction of longer sequences up to 8 kb [9]. Adenoviral vectors have been profoundly examined in vitro in cell lines as well as in vivo in animal models over the last 15 years. Their therapeutic application has now moved on to clinical trials, though there is no evidence of significant clinical success yet. Adenoviral vectors can be utilized for: (1) cancer gene therapy; (2) gene therapy for genetic diseases; (3) supplementary therapy and (4) other applications, such as scale-up production of therapeutic agents (growth hormones, interferon, anti-viral and anti-cancer compounds), diagnostic proteins (monoclonal antibodies) and vaccines (attenuated vaccine for adenovirus acute respiratory disease in the military and recombinant vaccines for human immunodeficiency virus and rabies virus) [9]. Treatment of genetic diseases via gene therapy relies on delivery of genes to augment defective genes in certain tissues. Adenoviral vectors have been most widely used to cure cystic fibrosis and muscular dystrophy, though problems related with immune response against vector and transgene product limit their therapeutic efficiency. The principle of supplementary therapy, in contrast, is delivery of therapeutic genes, which products act against development of disease. Attempts to use adenoviral vectors for treatment of neurodegenerative diseases, such as Parkinson’s disease and arthritic diseases, such as rheumatoid arthritis, have shown promising results in ex vivo models [9].

Department of Histology, Microbiology
and Medical Biotechnologies University of Padova
PhD Thesis Urška Matkovič XX Cycle 25
4.2 Techniques for constructing recombinant adenoviruses There are a range of techniques for constructing recombinant adenoviruses based on deletion of early E1, E2, E3 and E4 gene cassettes, which have regulatory functions. These techniques would reduce chances of generating replication-competent adenoviruses (RCA). Nevertheless, even though the frequency of RCA formation is reduced, it is not eliminated. Various E1 complementation systems have been described. The scheme of E1-deleted adenoviruses is shown in Figure 5. The most widely used host cell system for production of E1-deleted adenoviral vectors is 293 cell line, generated by transformation of human embryonic kidney (HEK) cells with Ad5 DNA, containing E1 region and adjacent sequences stably incorporated into chromosomes. Hence, because of extensive sequence homologies between integrated adenoviral sequences in 293 cell and the viral sequences on the both sides of the E1 deletion in the vector, homologous recombination can occur, leading in production of RCA (Figure 5 A). The strategy to prevent RCA formation was to eliminate any sequence overlap between viral sequences in E1-deleted vector and those present in the cell line. PER.C6 cells (Figure 5 B) were developed by transfection of human embryonic retina (HER) cells with plasmid carrying precisely E1A- and E1B-coding sequences under the control of human glycerate kinase promoter. The cells demonstrated no RCA production at more than 40 large-scale Ad preparations [11].
A)
B)
Figure 5. A) Replication of E1-deleted adenoviral vectors in complementary cell line (Kamen, Henry, J Gene Med, 2004). Ba) Complementary 293 cells contain homologous sequence with adenoviral genome that can lead to recombination and produce RCA.; b) Per.C6 cells contain precisely E1 coding region to avoid any sequence overlap, generating no RCA (Lusky, Human Gene Ther, 2005).

Adenoviral Vectors
26
On the basis of deleted genes adenoviral vectors are divided in first-, second- and third-generation vectors. In the first-generation vectors, the E1 and E3 gene cassettes were replaced with therapeutic cassette up to 6,5 kb controlled by a heterologous promoter. ITRs and packaging sequences were retained. Deletion of E1 genes simultaneously suppresses transcription of E2 genes, since they are E1 dependent. Consequently, viral replication and synthesis of viral structural proteins is prohibited. The E1-defective viruses containing the transgene can be propagated by infection of HEK 293 cells (a human embryonic kidney cell line), which have E1 cassette stably incorporated into the chromosomes and are therefore able to provide E1 gene products in trans [2, 7]. In vitro propagation of adenoviral vectors in human cell lines provides the ideal environment for proper folding and exact post-translational modifications of human proteins. However, despite of E1 deletion transgene expression in vivo was only transient because of strong immune response directed against virus capsid proteins as well as against the transgene product. Triggered immune response can be caused by production of replication-competent adenoviruses (RCAs) as a result of E1-complementing cell line allowing the E2 genes to function, though at reduced levels. In order to minimize the production of RCAs further vector refinement has been achieved [9]. Second-generation vectors include either E1, E4-deleted or E1, E2-deleted vector types using suitable complementing cell lines. Despite reduced toxicity of these vectors in animals [7], a number of studies confirmed that the infecting recombinant virus itself was sufficient to induce the immune response [9]. Moreover, factors other than the capsid antigens have been indicated to be involved in eliciting humoral response. E4 gene product, for instance, facilitates antigen presentation and production of IL-6 and IL-8, which are important in B cell maturation. Accordingly, E4-deletion resulted in reduced activity of T helper and B cells. However, it has also been cleared that the retention of some of the E4 genes is important in combating the T cell response. Furthermore, E4-deleted vectors showed reduced transgene expression [9, 12]. Third-generation or so-called ‘gutless’ vectors have been constructed by removal of all viral genes retaining only ITRs and packaging domain. A helper virus and suitable complementing cell lines are required for their propagation. A helper-dependent vector system has been developed in which helper virus contains all the viral genes required for replication but has a defect in packaging domain to prevent packaging into virion. The second vector contains only the ITRs, therapeutic gene and normal packaging domain, which allows this genome to be selectively packaged and released from cells. Characteristics of all three generations of adenoviral vectors are summarized in Table 2. An extension of these strategies involves the construction of hybrid adenoviral vectors with other viruses, such as AAVs, Maloney leukemia virus, Epstein-Barr virus and retroviruses, in order to achieve persistant transgene expression [7, 9].

Department of Histology, Microbiology
and Medical Biotechnologies University of Padova
PhD Thesis Urška Matkovič XX Cycle 27
Engineering adenoviral vectors requires not only deletion of viral genes to obtain replication incompetent particle, but seeks also to ensure effective and persistent transgene expression. Due to low efficiency of endogenous E1A promoter heterologous promoters have been inserted to provide better expression. For example, ubiquitous promoters of viral origin, such as the immediate-early promoter from human cytomegalovirus (HCMV) and the Rous sarcoma virus (RSV) LTR were first used to drive high levels of transgene expression from E1-deleted vectors in many different organs. Other type of heterologous promoters includes cellular promoters specific for certain tissues or cells, such as prostate, muscle and liver. A number of studies suggest that transgene expression is also influenced by the vector backbone structure. It should be noted, that overexpression of transgene can activate host immune response. Therefore, much effort has focused on optimization of the level and duration of transgene expression. Drug-dependent expression achieved by insertion of appropriate ligand-response elements into the vector backbone is one strategy used to provide regulated transgene expression. The most widely used regulation system is based on tetracycline resistance regulation (the Tet system) [1, 9, 12]. Table 2. Characheristics of first-, second- and third-generation of adenoviral vectors
Generation
Deletions of viral genes
Production
Cloning capacity
Features
First: ΔE1
E1,
E1, E3
E1 complementing cell line
4 kb 8 kb
Emergence of RCA, strong immune response, transient transgene expression; easy production
Second: ΔE1ΔE4 ΔE1ΔE2
E1, E3, E4
E1, E2A, E2B, E3
E1 in E4 complementing
cell line
E1 in E2 complementing cell line
10 kb
8-13 kb
Reduced synthesis of viral proteins; inhibition of viral DNA replication and synthesis of viral proteins; reduced immune response and toxicity, higher transgene expression
Third: Gutless
All viral genes
Helper virus +
E1 complementing cell line
37 kb
Helper virus contaminants, viral DNA instability; reduced immune response and toxicity, higher transgene expression

Adenoviral Vectors
28
4.2.1 AdEasy vector system for rapid generation of recombinant adenoviral vectors
The AdEasy vector [13] system was developed in 1998 by He et al. and is used for rapid and simple generation of recombinant adenoviruses. The technology includes three general steps: (1) cloning of therapeutic gene in transfer vector, (2) in vivo homologous recombination in bacteria Escherichia coli, and (3) recombinant adenovirus production in HEK 293 cells. An overview of the AdEasy technology is presented in Figure 6. The cDNA of therapeutic gene is first cloned in the MCS of the transfer vector pShuttle-CMV, between the CMV promoter and poly A sites. The resulting plasmid is then linearized with Pme I and co-transformed into E.coli together with adenoviral vector pAdEasy-1. The pAdEasy-1 is a 33,4 kb plasmid containing adenovirus serotype 5 (Ad5) genome with deletions in the E1 and E3 regions. After homologous recombination in bacteria with a transfer vector (in which a therapeutic gene has been cloned) a new plasmid is generated with the therapeutic gene cassette inserted into E1 region of the adenoviral genome. Its E1 functions are later complemented in HEK 293 cells. Co-transformation and homologous recombination is performed in the E.coli recA+ strain BJ5183 that is highly competent and especially prepared for high transformation and recombination efficiency. The kanamycin resistance gene present in the transfer vector pShuttle-CMV allows for the selection of recombinants. Screening of the recombinants is performed by restriction enzyme analysis. Once recombination is achieved and verified, the adenoviral recombinant DNA is transformed in E.coli strain DH5α. Contrary to BJ5183, the recA, endA strain DH5α does not support recombination and is used only for amplification and preservation of the recombinant viral DNA, since the large pAdEasy is not stable in recA+ strain BJ5183 undergoing rapid deletions or other rearrangements. The new recombinant plasmid is then cleaved with Pac I to obtain original linear form of adenovirus, exposing its ITR, and subsequently transfected into E1-complementing HEK 293 cell line to produce recombinant adenoviral vectors. The produced recombinant virions are then further purified and titered following protocols in the AdEasy application manual. Compared to traditional methods, time course for production of recombinant adenoviral vectors with AdEasy system is much shorter. Whereas direct co-transfection of helper and vector DNA in 293 cells requires time-consuming viral plaque formation and purification followed by restriction-ligation steps, this novel method based on production of recombinant adenoviral plasmids by homologous recombination in bacteria allows more rapid selection of recombinant adenoviral vectors. Additionally, insertion of therapeutic DNA into adenoviral genome using efficient recombinant machinery of E.coli is the most efficient way of introducing a gene into adenoviral vector for two reasons; firstly, adenoviral genome contains sites for almost all restriction enzymes and secondly, it is too large to be easily manipulated. Therefore, adenoviral vector is performed in the form of an intact

Department of Histology, Microbiology
and Medical Biotechnologies University of Padova
PhD Thesis Urška Matkovič XX Cycle 29
supercoiled plasmid to be protected from restriction endonucleases and to preserve its stability critical for efficient recombination [14].
Figure 6. Generation of a recombinant adenovirus using AdEasy vector system (Qbiogene, version 1.4, 2002).
Adenoviral Vectors
30
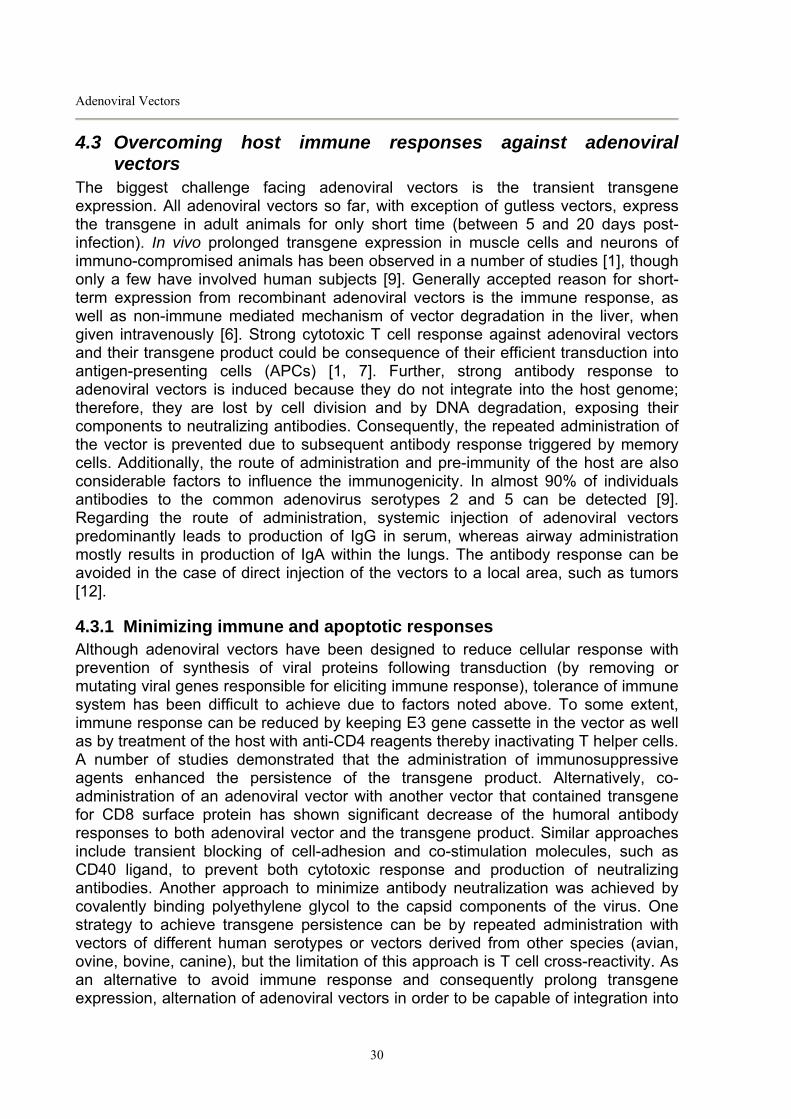
4.3 Overcoming host immune responses against adenoviral vectors
The biggest challenge facing adenoviral vectors is the transient transgene expression. All adenoviral vectors so far, with exception of gutless vectors, express the transgene in adult animals for only short time (between 5 and 20 days post-infection). In vivo prolonged transgene expression in muscle cells and neurons of immuno-compromised animals has been observed in a number of studies [1], though only a few have involved human subjects [9]. Generally accepted reason for short-term expression from recombinant adenoviral vectors is the immune response, as well as non-immune mediated mechanism of vector degradation in the liver, when given intravenously [6]. Strong cytotoxic T cell response against adenoviral vectors and their transgene product could be consequence of their efficient transduction into antigen-presenting cells (APCs) [1, 7]. Further, strong antibody response to adenoviral vectors is induced because they do not integrate into the host genome; therefore, they are lost by cell division and by DNA degradation, exposing their components to neutralizing antibodies. Consequently, the repeated administration of the vector is prevented due to subsequent antibody response triggered by memory cells. Additionally, the route of administration and pre-immunity of the host are also considerable factors to influence the immunogenicity. In almost 90% of individuals antibodies to the common adenovirus serotypes 2 and 5 can be detected [9]. Regarding the route of administration, systemic injection of adenoviral vectors predominantly leads to production of IgG in serum, whereas airway administration mostly results in production of IgA within the lungs. The antibody response can be avoided in the case of direct injection of the vectors to a local area, such as tumors [12].
4.3.1 Minimizing immune and apoptotic responses Although adenoviral vectors have been designed to reduce cellular response with prevention of synthesis of viral proteins following transduction (by removing or mutating viral genes responsible for eliciting immune response), tolerance of immune system has been difficult to achieve due to factors noted above. To some extent, immune response can be reduced by keeping E3 gene cassette in the vector as well as by treatment of the host with anti-CD4 reagents thereby inactivating T helper cells. A number of studies demonstrated that the administration of immunosuppressive agents enhanced the persistence of the transgene product. Alternatively, co-administration of an adenoviral vector with another vector that contained transgene for CD8 surface protein has shown significant decrease of the humoral antibody responses to both adenoviral vector and the transgene product. Similar approaches include transient blocking of cell-adhesion and co-stimulation molecules, such as CD40 ligand, to prevent both cytotoxic response and production of neutralizing antibodies. Another approach to minimize antibody neutralization was achieved by covalently binding polyethylene glycol to the capsid components of the virus. One strategy to achieve transgene persistence can be by repeated administration with vectors of different human serotypes or vectors derived from other species (avian, ovine, bovine, canine), but the limitation of this approach is T cell cross-reactivity. As an alternative to avoid immune response and consequently prolong transgene expression, alternation of adenoviral vectors in order to be capable of integration into

Department of Histology, Microbiology
and Medical Biotechnologies University of Padova
PhD Thesis Urška Matkovič XX Cycle 31
host’s chromosomes has been developed. This can be achieved by constructing hybrid adenoviral vectors with integrating viruses, such as AAVs and retroviruses or viruses capable of epichromosomal persistence in infected cells, such as EBV. Adenoviral-AAV hybrid vectors, in contrast to adenoviral-retroviral hybrid vectors, enable site-specific transgene integration [9, 12]. Beside immune response, apoptosis also play an important role in influencing transgene expression. Attempts to overcome this problem include usage of vectors expressing inhibitors of apoptosis, such as cellular Bcl-2 inhibitor or adenoviral E3B gene products [9]. The latter inhibit TNF-α-induced apoptosis and inflammation. TNF-α plays a key role in anti-adenoviral immune response. Two strategies have been developed to antagonize TNF-α pathway. The exogenous approach is based on the TNF-α inhibition by soluble antagonist to prevent its binding on cellular TNF receptor (TNFR) thereby preventing the further activation of signaling pathways. The endogenous approach, on the other hand, relies on the overexpression of E3B-encoded antagonists, which inhibit different steps subsequent to TNF-α binding [12].
4.4 Engineering targeted adenoviral vectors for gene therapy Adenoviral gene transfer efficiency and selectivity to target cells is significantly dependent on distribution of adenoviral primary cellular receptors including CAR, MHC class I molecule and an integrins. Since wide variety of cells express adenoviral primary receptors, selective transduction only in target cells has been difficult to achieve. On the other hand, some tissues and cells, such as certain tumor cells and smooth muscle cells, express very little or no of these receptors thereby precluding transduction [9, 12, 15]. Importantly, CAR has a role in cell adhesion and its expression may be cell cycle dependant. Consistent with its function, it has been revealed that expression of CAR has a growth-inhibitory effect on some cancer cell lines, whereas tumour progression correlates with the loss of its expression [16, 17]. Therefore, the induction of CAR expression in target tissues could result in increased adenoviral infection. In fact, different chemical agents have been studied as inducers of cell cycle and cell adhesion related to CAR expression in ovarian cancer cells in vitro and in vivo [18]. However, adenovirus vector biodistribution in vivo is not dependant solely by CAR biodistribution [19]. Since the majority of systemically administrated adenoviral particles is accumulated in the liver, initial attempts to “de-target” the liver were based on ablating CAR- and integrin-binding sites in the adenoviral capsid. Unsuccessful results suggest that natural adenoviral tropism does not contribute to its hepatotropism in vivo [20, 21, 22], but as discovered after the fiber protein is a major structural determinant in this case (reviewed by [23]). In particular, shortening or replacement of native Ad5 fiber shaft domain with other Ad serotype attenuated liver uptake in vivo. In addition, heparan sulfate proteoglycan (HSPG)-binding motif in the fiber identified HSPG as another important adenovirus receptor in vivo [24]. Furthermore, identification of fiber sites for binding of coagulation factor IX (FIX) and complement component C4-binding protein (C4BP) revealed the role of these blood factors in crosslinking adenovirus to hepatocellular HSPG and the low-density lipoprotein (LDL)-receptor-related protein, facilitating sequestration of Ad particles by Kupffer cells and hepatocyte transduction [25].
Adenoviral Vectors
32
The efforts to develop adenoviral vectors with selective tropism are directed towards the elimination of native tropism and its replacement by targeting alternative receptors, allowing for maximum vector gene transfer efficiency at the lowest possible dose. Two distinct approaches of transductionally target Ad-based therapeutic vectors are described below.
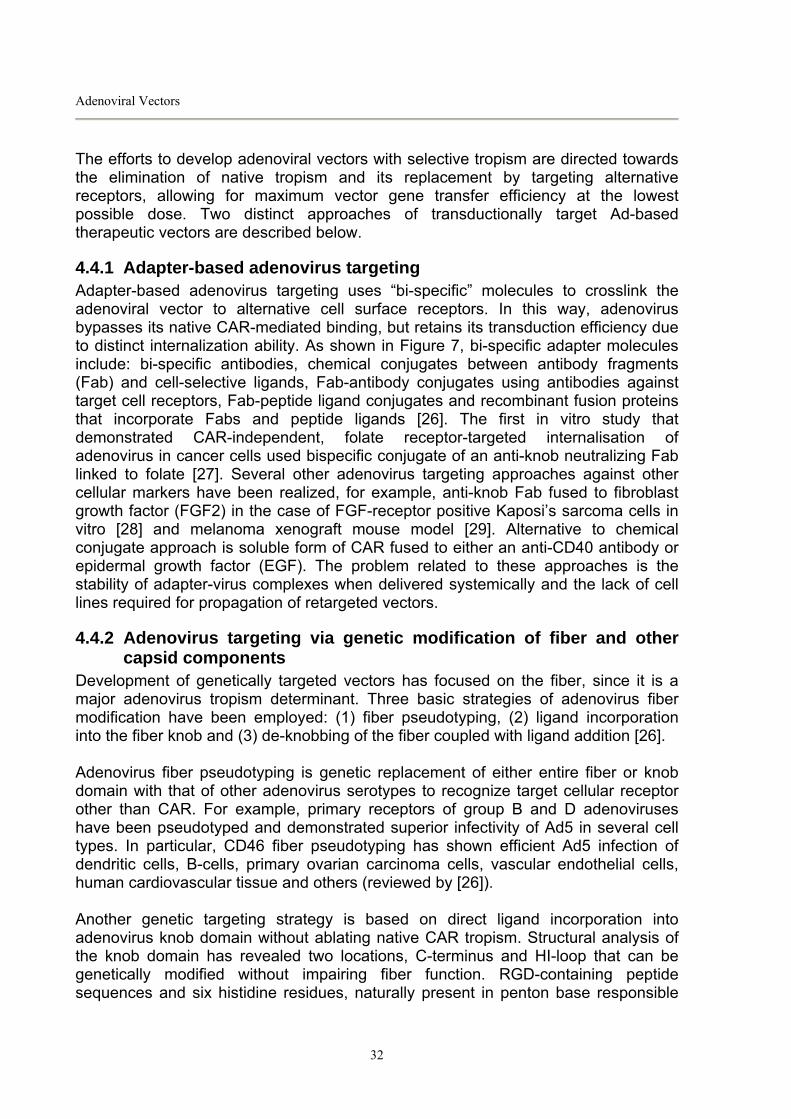
4.4.1 Adapter-based adenovirus targeting Adapter-based adenovirus targeting uses “bi-specific” molecules to crosslink the adenoviral vector to alternative cell surface receptors. In this way, adenovirus bypasses its native CAR-mediated binding, but retains its transduction efficiency due to distinct internalization ability. As shown in Figure 7, bi-specific adapter molecules include: bi-specific antibodies, chemical conjugates between antibody fragments (Fab) and cell-selective ligands, Fab-antibody conjugates using antibodies against target cell receptors, Fab-peptide ligand conjugates and recombinant fusion proteins that incorporate Fabs and peptide ligands [26]. The first in vitro study that demonstrated CAR-independent, folate receptor-targeted internalisation of adenovirus in cancer cells used bispecific conjugate of an anti-knob neutralizing Fab linked to folate [27]. Several other adenovirus targeting approaches against other cellular markers have been realized, for example, anti-knob Fab fused to fibroblast growth factor (FGF2) in the case of FGF-receptor positive Kaposi’s sarcoma cells in vitro [28] and melanoma xenograft mouse model [29]. Alternative to chemical conjugate approach is soluble form of CAR fused to either an anti-CD40 antibody or epidermal growth factor (EGF). The problem related to these approaches is the stability of adapter-virus complexes when delivered systemically and the lack of cell lines required for propagation of retargeted vectors.
4.4.2 Adenovirus targeting via genetic modification of fiber and other capsid components
Development of genetically targeted vectors has focused on the fiber, since it is a major adenovirus tropism determinant. Three basic strategies of adenovirus fiber modification have been employed: (1) fiber pseudotyping, (2) ligand incorporation into the fiber knob and (3) de-knobbing of the fiber coupled with ligand addition [26]. Adenovirus fiber pseudotyping is genetic replacement of either entire fiber or knob domain with that of other adenovirus serotypes to recognize target cellular receptor other than CAR. For example, primary receptors of group B and D adenoviruses have been pseudotyped and demonstrated superior infectivity of Ad5 in several cell types. In particular, CD46 fiber pseudotyping has shown efficient Ad5 infection of dendritic cells, B-cells, primary ovarian carcinoma cells, vascular endothelial cells, human cardiovascular tissue and others (reviewed by [26]). Another genetic targeting strategy is based on direct ligand incorporation into adenovirus knob domain without ablating native CAR tropism. Structural analysis of the knob domain has revealed two locations, C-terminus and HI-loop that can be genetically modified without impairing fiber function. RGD-containing peptide sequences and six histidine residues, naturally present in penton base responsible

Department of Histology, Microbiology
and Medical Biotechnologies University of Padova
PhD Thesis Urška Matkovič XX Cycle 33
for adenovirus internalization by integrin binding, have been incorporated in C-terminus and in the HI-loop of the Ad5 knob. HI-loop has shown better permissiveness to modifications with minimal negative effects on virion integrity compared with C-terminus. The expanded tropism achieved by ligand incorporation in HI-loop site proved efficient in several cancers of the ovary, pancreas, colon, head and neck, displaying highly variable expression of CAR [30]. Alternative approach is to replace entire fiber with artificial fiber in order to ablate CAR binding, for example, with bacteriophage T4 fibritin fused to targeting motif such as integrin-binding RGD motif or CD40 ligand. Adenovirus CD40-specific gene delivery in monocyte-derived dendritic cells in vivo demonstrated possible application in cancer immunotherapy [31]. In addition to fiber modifications, other capsid proteins have been proposed as potential sites for ligand incorporation, allowing for incorporation of an increased number of complex ligands per virion particle. Thus far, incorporation of heterologous peptides in capsid protein hexon, minor capsid proteins polypeptide IX (pIX) and pIIIa have been achieved [26]. In particular, pIX has been used for incorporation of green fluorescent protein (GFP) to enable monitoring of adenovirus localization in vitro and in vivo [32, 33].
Figure 7. Approaches of adenovirus transductional targeting. A) Adapter-based targeting based on interaction between: (I) antiknob monoclonal antibody and whole antibody directed against the target antigen, or, (II) against natural ligands such as folate, (III) recombinant bispecific fusion proteins and (IV) single recombinant fusion molecule such as soluble CAR fused to anti-CD40 antibody. B) Targeting based on genetic modifications: (V) Ad5 knob protein is replaced with that of other serotypes, or (VI) is modified by incorporation of targeting ligands (RGD motifs) in C-terminus or (VII) in HI-loop of the fiber. (VIII) Replacement of entire fiber and knob with artificial fiber and (IX) multiple genetic modifications in single particle. Picture taken from Glasgow et al, Canc Gene Ther, 2006.

Adenoviral Vectors
34
Finally, combinations of multiple genetic modifications in single adenovirus particle are the future challenge in the field of genetic engineering of targeted adenoviral vectors. In addition to targeted transduction and therapeutic effect, these so-called multifunctional particles (MFPs) will provide also the ability to monitor particle localization. The hurdle regarding this approach is the innate biosynthetic incompatibilities between the ligands and adenovirus capsid proteins [34].Furthermore, the access of systemically delivered vectors to the tumor cells is prevented by vascular endothelial wall. Despite the feasibility of genetic manipulation of a variety of adenoviral capsid proteins, the crucial aspect of targeted gene delivery is to discriminate between target and non-target cells. In the context of targeted cancer gene therapy, identification of new tumor-associated antigens (TAAs) as well as new ligands is of paramount importance.

Department of Histology, Microbiology
and Medical Biotechnologies University of Padova
PhD Thesis Urška Matkovič XX Cycle 35
5 ADENOVIRUS AND ADRENAL GLAND As described in the previous chapter, many efforts have been focused on engineering transductional targeted adenoviral vectors. Initial attempts have shown that genetic modifications of adenovirus to alter its tropism are feasible, but have highlighted the complexity of vector/host interplay when adenoviral vectors are delivered systemically. In this context, it is clear that clinical application of adenoviral vectors requires simultaneous employment of both, de-targeted and re-targeted concepts in order to ensure for the maximum vector efficiency at the lowest possible dose. In other words, construction of targeted adenoviruses should eliminate their native tropism and replace it with desired one, while retaining innate adenovirus gene transfer efficiency [26]. Several biodistribution studies using adenoviral vectors have been published thus far, demonstrating broad dissemination of particles in different organs, such as the liver, spleen, heart, lung and kidney. In this context, route of viral delivery is an important factor that contributes to maximal transduction efficiency of target tissue and minimizes potential toxicity to nontargeted organs. Therefore, determining the most effective route of administration to circumvent the liver-dominated distribution and reach other target sites has been relevant challenge. The majority of in vivo studies in mice were carried out via the intravenous route of administration or via local region-directed injection routes such as intravesicular or intratumoral injection route [35]. Johnson et al. [36] gave a very extensive insight into the in vivo adenoviral trafficking and transgene expression. In their study, they examined and compared the accumulation of adenoviral vector in different organs in vivo via different administration routes: intravenous, intraperitoneal, intraprostatic, subcutaneous and footpad injections. They observed that dissemination of adenovirus in different organs was differential and dependant on the route of administration. Intravenous and intraperitoneal injections resulted in greatest adenoviral accumulation in the liver, whereas intraperitoneal injections resulted in greater gene delivery to the prostate. Adenoviral gene delivery after intraprostatic injection dominated in the target site, but spreading to other organs was also detected. Vector injection into the lymphatic-rich paw tissue or the subcutaneous tissue of shoulder or chest led to expected accumulation of viral vectors in the nearest lymph nodes. Figure 8 shows the extent of adenovirus accumulation in the liver, lungs, kidney, spleen and prostate after intravenous delivery of 1x10⁸ PFU of adenovirus vectors, expressing the firefly luciferase reporter gene (fl) 2 days postinjection. The highest level of luciferase gene expression was detected in the liver, followed by lungs, kidneys, prostate and spleen.
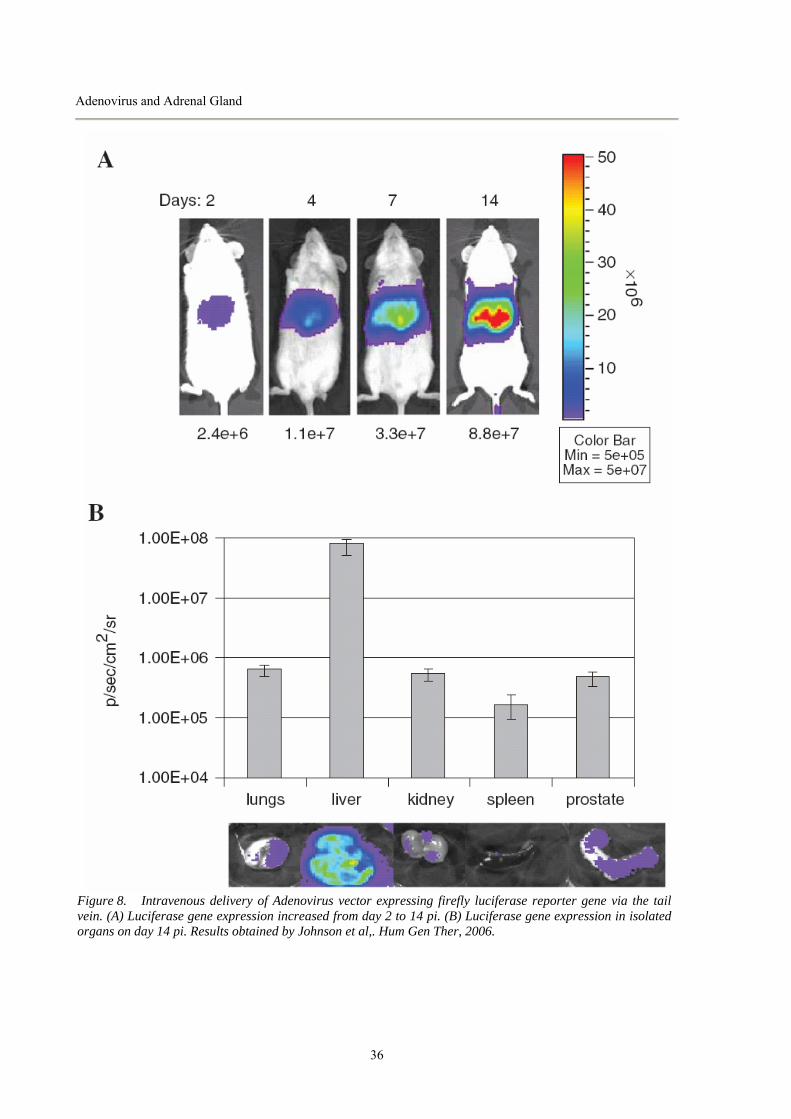
Adenovirus and Adrenal Gland
36
Figure 8. Intravenous delivery of Adenovirus vector expressing firefly luciferase reporter gene via the tail vein. (A) Luciferase gene expression increased from day 2 to 14 pi. (B) Luciferase gene expression in isolated organs on day 14 pi. Results obtained by Johnson et al,. Hum Gen Ther, 2006.
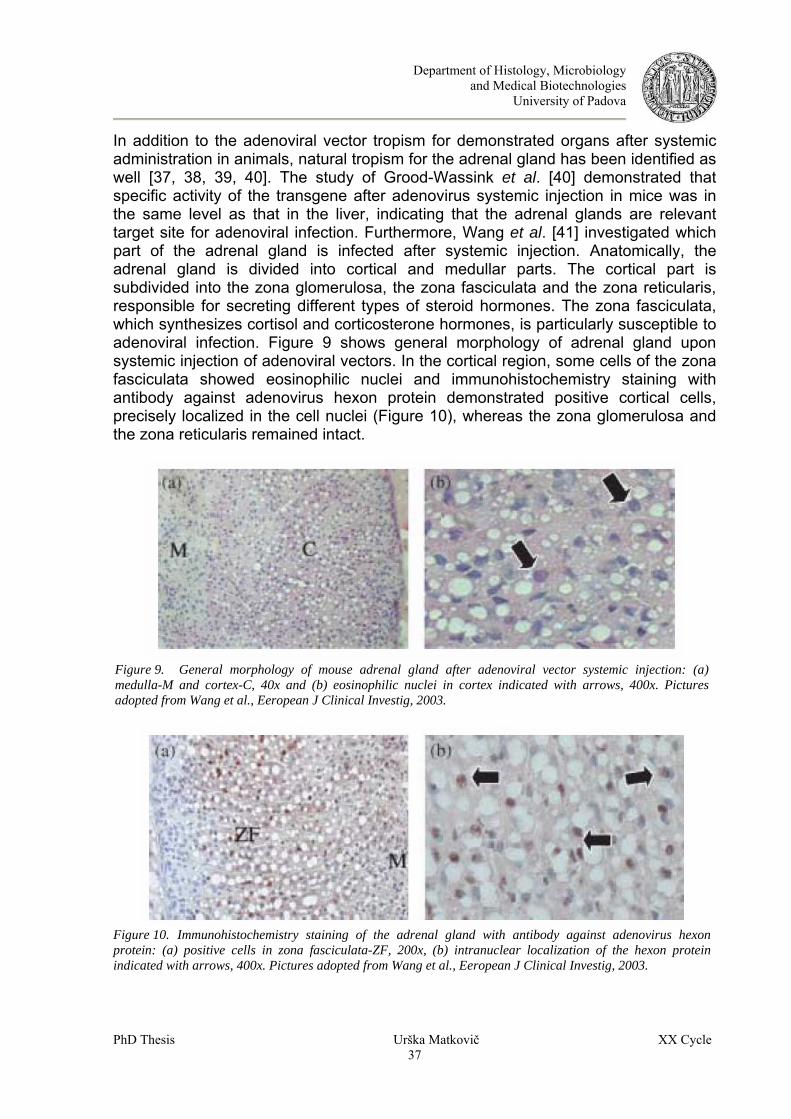
Department of Histology, Microbiology
and Medical Biotechnologies University of Padova
PhD Thesis Urška Matkovič XX Cycle 37
In addition to the adenoviral vector tropism for demonstrated organs after systemic administration in animals, natural tropism for the adrenal gland has been identified as well [37, 38, 39, 40]. The study of Grood-Wassink et al. [40] demonstrated that specific activity of the transgene after adenovirus systemic injection in mice was in the same level as that in the liver, indicating that the adrenal glands are relevant target site for adenoviral infection. Furthermore, Wang et al. [41] investigated which part of the adrenal gland is infected after systemic injection. Anatomically, the adrenal gland is divided into cortical and medullar parts. The cortical part is subdivided into the zona glomerulosa, the zona fasciculata and the zona reticularis, responsible for secreting different types of steroid hormones. The zona fasciculata, which synthesizes cortisol and corticosterone hormones, is particularly susceptible to adenoviral infection. Figure 9 shows general morphology of adrenal gland upon systemic injection of adenoviral vectors. In the cortical region, some cells of the zona fasciculata showed eosinophilic nuclei and immunohistochemistry staining with antibody against adenovirus hexon protein demonstrated positive cortical cells, precisely localized in the cell nuclei (Figure 10), whereas the zona glomerulosa and the zona reticularis remained intact.
Figure 9. General morphology of mouse adrenal gland after adenoviral vector systemic injection: (a) medulla-M and cortex-C, 40x and (b) eosinophilic nuclei in cortex indicated with arrows, 400x. Pictures adopted from Wang et al., Eeropean J Clinical Investig, 2003.
Figure 10. Immunohistochemistry staining of the adrenal gland with antibody against adenovirus hexon protein: (a) positive cells in zona fasciculata-ZF, 200x, (b) intranuclear localization of the hexon protein indicated with arrows, 400x. Pictures adopted from Wang et al., Eeropean J Clinical Investig, 2003.

Adenovirus and Adrenal Gland
38
Several other profound morphological and ultrastructural changes were described in the adrenal glands of calves and rodents after experimental adenovirus infections, [42, 43] as well as in the adrenal glands of infants that died from disseminated adenoviral infections [44]. Moreover, Alesci et al. [45] has shown that adenovirus-mediated gene transfer into bovine adrenal cortical cells impaired the normal adrenal stress response, probably coupled with alternations in cellular ultrastructure. The most significant changes involved mitochondria, in which a significant part of steroidogenesis takes place. In contrast to round and elongated mitochondria with ample tubuvesicular internal membranes in nontransduced cells, mitochondria of adenovirus-transduced cells appeared pleiomorphic with reduced amount of tubular internal membranes and with crystalline structures within the mitochondrial matrix (Figure 11b). It was suggested that these structures might represent aggregates of viral particles. In addition to mitochondrial alternations, fragmentation of cell nucleus, as possible indicator of apoptosis, and presence of intranuclear viral particles has also been described (Figure 11c, d). Selective tropism of adenoviruses for adrenal gland is beneficial for treatment of adrenocortical cancers or other adrenocortical disorders. Indeed, the pre-clinical studies using adenoviral vectors for cancer gene therapy, including the treatment of endocrine cancers have shown promising results [5, 36]. Additionally, a single intraadrenal injection of an adenoviral vector encoding for the cytochrome P450 21-hydroxylase gene demonstrated transient compensation of biochemical, endocrine
Figure 11. Electron microscopy of bovine adrenocortical cells. (a) Round and elongated mitochondria of nontransduced cells (white bar=200 nm). (b) Crystalline structures within mitochondrial matrix of adenovirus-transduced cells (white bar=200 nm). (c) Nuclear membrane segmentation (white bar=1 μm) and (d) viral particles of 60 nm in diameter in the cell nucleus after transduction by adenoviral vector (white bar=200 nm). Photos taken from Alesci et al., PNAS, 2002.

Department of Histology, Microbiology
and Medical Biotechnologies University of Padova
PhD Thesis Urška Matkovič XX Cycle 39
and histological alternations in a mouse model of 21-hydroxylase deficiency, a congenital adrenal disease [46]. However, appropriate modifications of adenoviral vectors, minimizing their effects on intact cell functions are future challenge to make them suitable therapeutic agents.

Aims of the Thesis
40
6 AIMS OF THE THESIS The research program within my Ph.D. work was involved in the development of adenoviral vectors for cancer gene therapy, the evaluation of their efficiency in in vitro and in vivo models of cancer, and investigation of effects on function of target organs, such as the adrenal gland and the liver. In particular, considering both, safety and therapeutic aspects of adenoviral gene therapy, the project was divided into two main parts: (1) construction and evaluation of adenoviral vectors as possible gene transfer vehicles for gene therapy of adrenocortical carcinoma (ACC), hepatocellular carcinoma (HCC) and esophageal carcinoma (EAC). Adenoviral vector carrying EGFP was used to evaluate transduction efficiency of tested cells by fluorescent microscopy and flow cytometry, whereas vector carrying mutant HSV-TK30 was used to assess therapeutic efficiency after ganciclovir treatment of cancer cell lines; in vivo studies were performed for the EAC in xenograft model in nude mice. (2) evaluation of adenovirus infection and toxicity, with particular attention, in human ACC cell lines. More in detail, the objectives dealing with this part were: i) evaluation of the susceptibility of human ACC cells to adenoviral infection. In this regard, expression of coxsackie and adenovirus receptor CAR was evaluated in ACC and HCC cells as well as in normal and neoplastic adrenocortical tissues by quantitative real-time RT-PCR. Wild-type Ad5 replication following infection of ACC cells was measured to confirm its tropism for tested cells. ii) examination of the effect of adenoviral infection (wild-type and recombinant adenoviruses) on cell proliferation, cell cycle, cell death, and steroid hormone production. iii) microarray analysis of cellular gene expression profile after transduction with recombinant adenoviral vectors.

Department of Histology, Microbiology
and Medical Biotechnologies University of Padova
PhD Thesis Urška Matkovič XX Cycle 41
7 MATERIAL AND METHODS 7.1 Cell cultures SW-13 and NCI-H295R cell lines, both derived from a human adrenocortical carcinoma were obtained from the American Type Culture Collection (Rockville, MD, USA). SW-13 cells are unable to produce steroid hormones and were cultured at 37°C in humidified incubator without CO2. The culture medium consisted of Leibovitz’s L-15 medium supplemented with 10% fetal calf serum (FCS) and antibiotics. NCI-H295R cell line retains the ability to produce steroid hormones and was grown at 37°C in humidified incubator containing 5% CO2. The culture medium consisted of RPMI supplemented with 2% FCS, 1% insulin, transferrin, selenium (ITS) and antibiotics. HepG2 and HuH7 cell lines (ATCC: LGC Promochem) of human hepatocellular carcinoma and HEK 293 cell line (F.L.Graham, Hamilton, Ontario, Canada) obtained from human primary embryonal kidney were maintained at 37°C and 5% CO2 in DMEM supplemented with 10% FCS and antibiotics. OE33, OE19 and KYRA esophageal carcinoma cell lines were obtained from the ATCC (Rockville, MD, USA). RPMI supplemented with 2% FCS for KYRA and with 10% FCS for OE33 and OE19, including 1% insulin, transferrin, selenium (ITS) and antibiotics was used as growth medium under standard conditions at 37°C and 5% CO2.
7.2 Primary cultures Primary cultures of human ACC were prepared from fresh biopsies after surgical removal of tumor mass. Biopsy samples were transported to our laboratory on ice to be immediately proceeded for cell isolation and cultivation. Briefly, tumor sample was cut into small pieces and digested in RPMI medium containing 1mg/ml of protease, 67mg/ml of DNAse, 1% of fungizone and 1% of penicillin/streptomycin. The medium was filtered through 0.2mm filter. Tissue was digested for 90 minutes in waterbath at 37°C and shaked every 10 minutes. Cortical cells were then separated by centrifugation at 1600 rpm for 10 minutes and resuspended in DMEM medium containing 2mM of glutamine, 1% of fungizone , 1% of penicillin/streptomycin, 1% of insulin, transferrin, selenium complex and 10% of FCS. For the experiments, cells were seeded on 24-well plates at a density of 2x10⁵ cells per well. The cells were washed gently with PBS and growth medium was replaced every 24 h. After 1-2 days in culture, about 50% confluent cells were infected with Ad5 and AdEGFP to assess the susceptibility for adenoviral infection by fluorescent microscopy and to measure steroid production in growth medium as further described.

Material and Methods
42
7.3 Construction of recombinant adenovirus Replication incompetent adenoviral vectors (AdVs) are based on the Ad5 genome and lack E1 and E3 regions. A cytomegalovirus (CMV) promoter is used to drive the transgene expression. Recombinant adenoviral vectors carrying genes for mutant herpes simplex virus thymidine kinase (AdHSV-TK30) and green fluorescent protein (AdEGFP) have been constructed by first cloning the 1.1-kb NotI/XhoI HSV-TK30 gene and 789-bp BglII/NotI EGFP into NotI/XhoI- and BglII/NotI-digested pShuttle generating pShuttle-HSV-TK30 and pShuttle-EGFP, respectively. These plasmids were digested with PmeI and recombined with pAdEasy-1 by cotransformation in Escherichia coli BJ5183. The resulting plasmids, pAdHSV-TK30 and pAdEGFP, were subsequently transformed E.coli DH5a for large-scale plasmid amplification following digestion with PacI and transfection in HEK2953 cells (see below). Replication incompetent adenoviral vector containing no transgene (Adnull) was purchased from the Qbiogene and wild-type Adenovirus, type 5 (Ad5) was obtained from the ATCC.
7.4 Production of adenovirus PacI-digested and phenol-chloroform purified recombinant adenoviral DNA was transfected in 2x10⁵ HEK293 cells in 6-well plates using lipofectamin method (Invitrogen Life Technologies). HEK293 cells have Ad5 E1A region incorporated into chromosome and are used as an E1-complementing cell line for E1-deleted adenoviral vectors. Transfected cells were monitored in DMEM contained 10% FCS for cytopathic effects (CPE), which were evident by approximately 6 to 10 days posttransfection. Cells were harvested and exposed to three cycles of freezing in dry-ice and thawing in 37°C water bath to release the virions from the cells. Large-scale virus amplification was performed by propagation of freeze-thaw cell lysate in 30x175 cm2 culture flasks of HEK293 cells (1x10⁷ cells/flask) grown in DMEM 5%. Once the cells reached complete CPE, they were harvested, pelleted and resuspended in 20ml of medium. The cell suspension was freeze-thawed for three times followed by centrifugation at 3800 rpm for 5 minutes at 4°C. The supernatant was loaded on discontinuous cesium-chloride gradient to purify viral particle pre-stock and centrifuged in a SW28 rotor at 23.000 rpm for 90 min at 4°C. Discontinuous CsCl gradient was prepared in polyallomer tubes with 8 ml of a 1.4 g/ml CsCl solution in 10 mM Tris-HCl pH 7.9 and 10 ml of a 1.2 g/ml CsCl solution in 10 mM Tris-HCl pH 7.9. The virus band was collected with a 5 ml syringe and an 18-gauge needle and diluted in one volume of 1x 10mM Tris-HCl pH 7.9. Diluted viral suspension was loaded on continuous CsCl gradient with 12 ml of CsCl solution 1.4 g/ml and 14 ml of CsCl solution 1.2 g/ml and centrifuged at 23.000 rpm at 4°C for 16-20 hours. As for the discontinuous gradient, the viral band was collected by side puncture using 20-gauge needle and diluted with 0.5 volume of PBS-3% sucrose buffer. The diluted viral preparation was dialyzed in a 10.000 molecular weight cut-off sterile dialysis membrane in 1 L of PBS-3% sucrose buffer for 1 hour at 4°C. The PBS-3% sucrose buffer was changed once an hour, for total of 3 changes. Purified adenovirus was aliquoted in small volumes and stored at –80°C. Viral titer was determined by TCID50 cpe endpoint assay in HEK293 cells according to the protocol in the AdEasy manual and by quantitative real-time PCR as further described. Correlated titers were determined to be 5x10⁹ p.f.u./ml (Ad5), 3x10⁹ p.f.u./ml (AdHSV-TK30, Adnull) and 5x10⁸ p.f.u./ml (AdEGFP).

Department of Histology, Microbiology
and Medical Biotechnologies University of Padova
PhD Thesis Urška Matkovič XX Cycle 43
7.5 Adenovirus preparation and viral infection Viral infections are given as the multiplicity of infection (MOI) expressed as p.f.u. per cell. In all experiments, cells were infected while they were below confluency at the indicated MOIs in minimal volume of complete culture media containing 5% FBS for HEK 293 and SW-13 and 2% FBS for NCI-H295R, respectively. After 1,5h three volumes of medium were added and incubation at 37°C, 5% CO2 was allowed until cells were harvested at different time points p.i. for further analysis. In all cases, the uninfected controls were treated under the same conditions as for infection containing only culture media.
7.6 Adenovirus titer determination by quantitative real-time PCR Adenoviral DNA was isolated from cell lysates obtained by freeze-thaw cycles using QIAamp DNA Mini Kit (QIAGEN, GmbH). 5 ml of Ad DNA extracts previously prepared as 10-fold viral dilutions was added to 20 ml of PCR reaction mix containing SYBR Green PCR Master Mix (Applied Biosystems, Warrington, UK) and 300 nM of forward and reverse primers specific for 300-bp long sequence encoding for adenovirus hexon protein 5’-GCC GCA GTG GTC TTA CAT GCA CAT C-3’ (forward) and 5’-CAG CAC GCC CCG GAT GTC AAA GT-3’ (reverse). Plasmid AdEGFP was used as a standard for quantification of experimental samples in serial dilutions from 101 to 106copies/ml. Reaction mix with no template was performed as negative control. Thermal cycling conditions were set to 10 min at 95°C followed by 40 cycles of 15 s at 95°C, 30 s at 52°C and 30 s at 72°C. PCR ampification and data analysis were performed by ABI PRISM 7700 Sequence detection system (Applied Biosystems).
7.7 Adenovirus infectivity test AdEGFP was used to test adenovirus infectivity of both adrenocortical cell lines. 5x10⁵ of NCI-H295R and 3x10⁵ of SW-13 cells per well were plated on 6-well plates. A day after the cells were transduced with increasing MOIs of AdEGFP to select appropriate MOI for further experiments. After 48h p.i. infected and mock infected cells were harvested, washed in PBS and analyzed by flow cytometry. In parallel, cells in 24-well plates were transduced with AdEGFP to confirm EGFP production by fluorescent microscopy.
7.8 MTT assay of GCV citotoxicity Drug sensitivity assay determines the cytotoxic effect of GCV in cells infected with recombinant adenoviruses, which express HSV-TK30 therapeutic gene. One 96-well plate for each cell line was disseminated in DMEM 10% to obtain 6x10⁵ cells/well and incubated for 24 hours. The second day the cells were infected with AdHSV-TK30 at MOI 2, 10 and 50. The third day infected cells were treated with increasing concentrations of GCV (0.01, 0.1, 1, 10, 100 μM). After 5 days cell viability was tested with MTT assay. MTT is tetrazolic salt that is metabolized by mitochondrial dechidrogenases into salt formazan. This metabolic conversion occurs only in alive cells and is visualized as colorimetric reaction from yellow to blue. 10 ml (0.1mg/ml) of MTT is added into each well and incubated 4-6 hours at 37°C. After, 100 ml of 10% SDS+0.01 N HCl is added to each well and incubated 3 hours at 37°C. Finally, plates were analyzed by OD550 spectrophotometer readings.

Material and Methods
44
7.9 Evaluation of HSV-TK30 expression by quantitative real-time RT-PCR
Expression of HSV-TK30 therapeutic gene in transduced SW-13 and NCI-H295R cells was evaluated with quantitative real-time RT-PCR method. First, RNA from transduced cells was extracted using reagent OMNIzol (Biotech Laboratories). 3 μg of extracted RNA was retrotranscribed into cDNA by MuLV reverse transcriptase (Applied Biosystems) using random primers (Applied Biosystems). RT-PCR was performed for amplification of HSV-TK30 cDNA using TaqMan PCR Master Mix (Applied Biosystems) and primers specific for HSV-TK30 gene: 5’- CTGCGGGTTTATATAGACGG-3’ (forward), 5’-CATTGTTATCTGGGTGCT-3’ (reverse). As a standard we used retroviral vector MFG that has inserted HSV-TK gene. As internal control we used GAPDH (glyceraldehydes-3-phosphate dehydrogenase) housekeeping gene and GAPDH specific primers and probe. Conditions of amplification performed initial step of denaturation at 95°C for 10 min followed by 45 cycles, each containing denaturation phase at 95°C for 15 sec and annealing/extension phase at 60°C for 30 sec.
7.10 Adenovirus replication 5x10⁵ SW13 and 8x10⁵ NCI-H295R cells/well were plated in 6-well dishes and allowed to attach for 24 h. Cells were infected and mock infected with Ad5 at MOI 5. Media were harvested at described time points p.i. and used to determine viral titer by standard TCID50 plaque assay and real-time PCR titration. In addition, viral replication was evaluated by immuno-fluorescence staining of primary and NCI-H295R and SW-13 cells with specific antibody for adenovirus hexon structural protein.
7.11 Optical and Fluorescent Microscopy To observe the occurrence of citopathic effects upon adenoviral vector transduction NCI-H295R and SW-13 cells were transduced with AdEGFP, AdHSV-TK30 and Adnull at MOI of 50 and photographed 3 days after. Expression of EGFP in AdEGFP-transduced ACC cells was determined by fluorescent microscopy. Primary cultures, NCI-H295R and SW-13 cells were seeded on glass cover slips and then transduced with AdEGFP at MOI of 25 and 50. After 48h cells were visualized with a Leica Microscope using a filter for GFP (excitation/emission maxima 558 nm /583 nm) and photographed with the integrated camera.
7.12 Immuno-fluorescence staining Expression of adenovirus structural protein in Ad5-infected ACC cells was tested with intracellular staining. 2x10⁵ ACC cells were seeded on glass cover slips in 24-well plate and infected 24h later at an MOI of 20 with Ad5. 24h, 48h, 72h and 96h after infection cells were washed with PBS and fixed with 90% acetone for 30 minutes at 4°C. Cells were stained for adenovirus hexon protein with murine monoclonal antibody (The Bartels Identification Kit) for 30 minutes at 37°C. Secondary detection was performed using fluorescein isothiocyanate-labeled rabbit anti-mouse antibody (Celbio) for 30 minutes at 37°C in dark.

Department of Histology, Microbiology
and Medical Biotechnologies University of Padova
PhD Thesis Urška Matkovič XX Cycle 45
7.13 Cell cycle analysis 1x10⁶ SW-13 and NCI-H295R cells were disseminated per 25-cm2 flask. To synchronize the cell population the growth medium was changed with serum-free medium for 24h before the infection. The cells were mock infected and infected with Ad5, Adnull, AdHSV-TK30 and AdEGFP at low MOIs of 15, 25 and 50 and at high MOIs of 100 and 500 as described above. When infected with low MOIs, SW-13 cells were harvested 48h p.i., whereas NCI-H295R cells were harvested 4 and 7 day p.i. When infected with high MOIs SW-13 and NCI-H295R were harvested 1, 2, 3 day p.i. and 2, 3, 5 day p.i., respectively. Longer incubation time for NCI-H295R cells was left due to their longer doubling time. Cells were harvested by trypsinization together with the corresponding supernatants to obtain entire cell population. Subsequently, the cells were washed in PBS and fixed for 30 min in cold 70% EtOH at –20°C. After washing in phosphate citrate buffer and in PBS, fixed cells were treated with 0.1mg/ml RNase in PBS at 37°C for 30 min. Then, the cells were stained with 0.1 mg/ml propidium iodide in PBS at room temperature for 30 min and analyzed by flow cytometry using a Becton-Dickinson FACScan. A percentage of cells in each phase were determined using WinMDI software.
7.14 Apoptosis detection SW-13 cells were plated on 12-well plates at a density of 2x10⁵ cells per well. The same number of NCI-H295R cells per well was plated on 24-well plate. The next day cells were infected with Adnull and AdHSV-TK30 at MOIs of 15, 100 and 500 and with Ad5 at MOIs of 25 and 50. Cells were harvested at 24 and 72h p.i and washed twice in PBS. Unfixed cells were then stained with annexin V according to the instructions of an apoptosis detection kit (Molecular Probes, Invitrogen, Eugene, Oregon, USA). Briefly, cells were resuspended in 100 ml of 1x binding buffer, labeled with 5 ml Annexin V-FITC and 1 ml (100 mg/ml) propidium iodide, and incubated for 15 min at room temperature in the dark. After incubation, 400 ml of 1x binding buffer was added to each sample. Analysis was performed using a Becton-Dickinson FACScan. A percentage of annexin V-positive and PI-positive cells was determined using WinMDI software.
7.15 Cell survival SW-13 and NCI-H295R cell lines were plated on 96-well plates in duplicates at 5x10³ cells/well and infected with Ad5, AdEGFP and AdHSV-TK30 at MOI 2, 10, 50 a day after. Cell proliferation was assayed by MTT assay (Sigma, St.Louis, MO, USA) 24, 48, 72, 96h (including 7 and 8 day for NCI-H295R) after infection and compared to proliferation of uninfected cells.
7.16 BrdU proliferation assay As described for MTT assay, cells were plated on 96-well plates. The next day they were infected with Ad5 at MOI 2, 10, 50 and AdEGFP and Adnull at MOI 50, 100 and 500. After 48h p.i. for SW-13 and 5 days p.i. for NCI-H295R the cells were labeled with BrdU for 18h according to protocol instructions (Calbiochem).
7.17 Steroid Measurements NCI-H295R cells were grown until approximately 90% confluence in 24- and 96-well plate. After one day of incubation in serum-free medium the cells were mock-infected

Material and Methods
46
and infected with different adenoviral vectors (AdEGFP, AdHSV-TK30 and Adnull) and wild-type Ad5. First, to examine the viral dose-related effect on steroid production, we performed the experiment where the cells were infected with increasing MOI values (15, 25, 50, 100 and 500) of AdEGFP and the medium was collected for steroid measurement. Second, on the basis of the results obtained by described experiment, the MOI value of 100 was selected to investigate whether adenoviral vectors and Ad5 effect steroid production. We wondered how this effect varies with time. To this end, we measured steroids in cell culture supernatant at early (6h) and late (24h) time points after infection. With regard to the late time points, simultaneously with culture medium also cell lysates for evaluation of steroidogenic enzymes and regulators mRNAs expression were collected. The harvested material was stored at –80°C until the analysis. Cortisol, aldosterone and estradiol were measured by EIA with a kit from Cayman. Experiments were performed in duplicates.
7.18 Quantitative real-time RT-PCR for CAR expression To evaluate CAR mRNA expression total RNA from the SW-13, NCI-H295R and HEK 293 cell lines and samples of normal (n=5), adenomatous (n=8), and malignant (n=6) human adrenocortical tissues was extracted using RNeasy kit (Qiagen S.p.A., Milan, Italy). Random primed cDNA was synthesized from 3 µg of total RNA using MuLV reverse transcriptase (Applied Biosystems, Foster City, CA). Aliquots of 5 ml of each cDNA reaction mix were taken for real-time RT-PCR using SYBR Green PCR Master Mix (Applied Biosystems, Warrington, UK) under the following thermal cycling conditions: 10 min at 95°C, 45 cycles of 15 s at 95˚C and 30 s at 52˚C performed in an ABI PRISM 7700 sequence detection system. To measure CAR-mRNA samples were amplified using primers 5'-AAA TTT ACG CTT AGT CCC GAA GAC-3' (forward) and 5'- CCT TCT GAT TAT CAG CTG GTG ATA TC-3' (reverse) at a final concentration of 0,1 μM each. Absolute values were determined from a standard curve derived by simultaneously amplifying serial dilutions of the plasmid pGEM-CAR (Promega). Reaction mix with no template was performed as negative control. Normalization of the results was performed by amplifying RPLPO gene using the primers 5’-GGC GAC CTG GAA GTC CAA CT-3’ (forward) and 5’-CCA TCA GCA CCA CAG CCT TC-3’ (reverse).
7.19 Quantitative real-time RT-PCR for steroidogenic enzymes expression
To evaluate expression of steroidogenic enzymes mRNAs of CYP11B1, CYP11B2, CYP19, CYP21 and steroidogenic regulator mRNAs of StAR, DAX-1 and SF-1, total RNA extraction and reverse transcription were performed as described for CAR expression. Likewise, real-time RT-PCR was performed with SYBR Green PCR Master Mix in the ABI PRISM 7900 sequence detection system (Applied Biosystems) under the following thermal cycling conditions: 10 min at 95°C, 45 cycles of 15 s at 95°C, 15 s at Ta (reported in Table 3) and 1 min at 72°C. Primer characteristics specific for each gene of interest are summarized in Table 3.

Department of Histology, Microbiology
and Medical Biotechnologies University of Padova
PhD Thesis Urška Matkovič XX Cycle 47
Table 3. Sequences and annealing temperature of primers for real-time PCR of CYP genes.
Gene Primer sense Primer antisense Lentgh of amplificate
Ta (°C)
DAX1 CCAAGGAGTACGCCTACCTCAA
ACTGGAGTCCCTGAATGTACTTCC 90 bp 60
SF-1 GGAGTTTGTCTGCCTCAAGTTCA
CGTCTTTCACCAGGATGTGGTT 80 bp 60
CYP 19 TCACTGGCCTTTTTCTCTTGGT
GGGTCCAATTCCCATGCA 83 bp 60
CYP11B1*
GGCAGAGGCAGAGATGCTG
TCTTGGGTTAGTGTCTCCACCTG 72 bp 58
CYP11B2*
GGCAGAGGCAGAGATGCTG
CTTGAGTTAGTGTCTCCAGGA 71 bp 68
CYP21 TCAGGTTCTTCCCCAATCCA
TCCACGATGTGATCCCTCTTC 64 bp 60
StAR CCACCCCTAGCACGTGGA TCCTGGTCACTGTAGAGAGTCTCTTC 88bp 60 * For CYP11B1 and CYP11B2 amplification specific probes were used; TGCTGCACCATGTGCTGAAACACCT and CTGCACCACGTGCTGAAGCACT, respectively. Absolute quantification of transcripts was performed against standard curves obtained by amplification of serially diluted solutions of pCR2.1 plasmid (Invitrogen), in which target sequences were subcloned. Normalization of the results was performed by amplifying GAPDH gene (226 bp) using the primers 5’-GAA GGT GAA GGT CGG AGT C-3’ (forward) and 5’-GAA GAT GGT GAT GGG ATT TC-3’ (reverse) and probe CAAGCTTCCCGTTCTCAGCC at the annealing temperature 60°C.
7.20 Microarray analysis of gene expression profile in ACC cell infected with adenoviral vector
DNA microarray technology enables to generate quantitative gene expression information for thousands of genes in a single experiment. DNA microarrays consist of DNA molecules with known nucleotide sequences (probes) representing many genes organized into a matrix and bound onto a solid glass microscopic slide. The deposited DNA sequences hybridize specifically with labeled RNA sample and enable us to detect differences in expression of the targeted genes in different samples. In two-color systems (Figure 12), used in our experiment, two RNA samples are labeled separately with different fluorescent tags, cyanine 3 and cyanine 5 (Cy3, Cy5), hybridized to a single microarray chip and scanned to generate fluorescent images from the two channels. A two-color graphical overlay than can be used to visualize genes that are activated or repressed. In general three different array elements are used in microarray production:
• short oligonucleotides (15-25 nt) are synthesized in situ on the array surface • long oligonucleotides (50-120 nt) are synthesized in a tube and later spotted
on the array surface • PCR-amplified cDNAs (100-3000 base pairs) are synthesized from mRNA and
subsequently deposited to array surface

Material and Methods
48
Figure 12. Microarray expression analysis using two-color system. Picture adopted from www.mun.ca/biology.
Figure 13. Oligonucleotide microarray designed by CRIBI containing 21.329 human oligonucleotides deposited in replicate on MICROMAX glass slide. The array is subdivided in 48 subarrays, arranged in 31 rows per 32 colons with alignment grids. Spot diameter: 70-80 μm, spacing between spots: 135 μm.
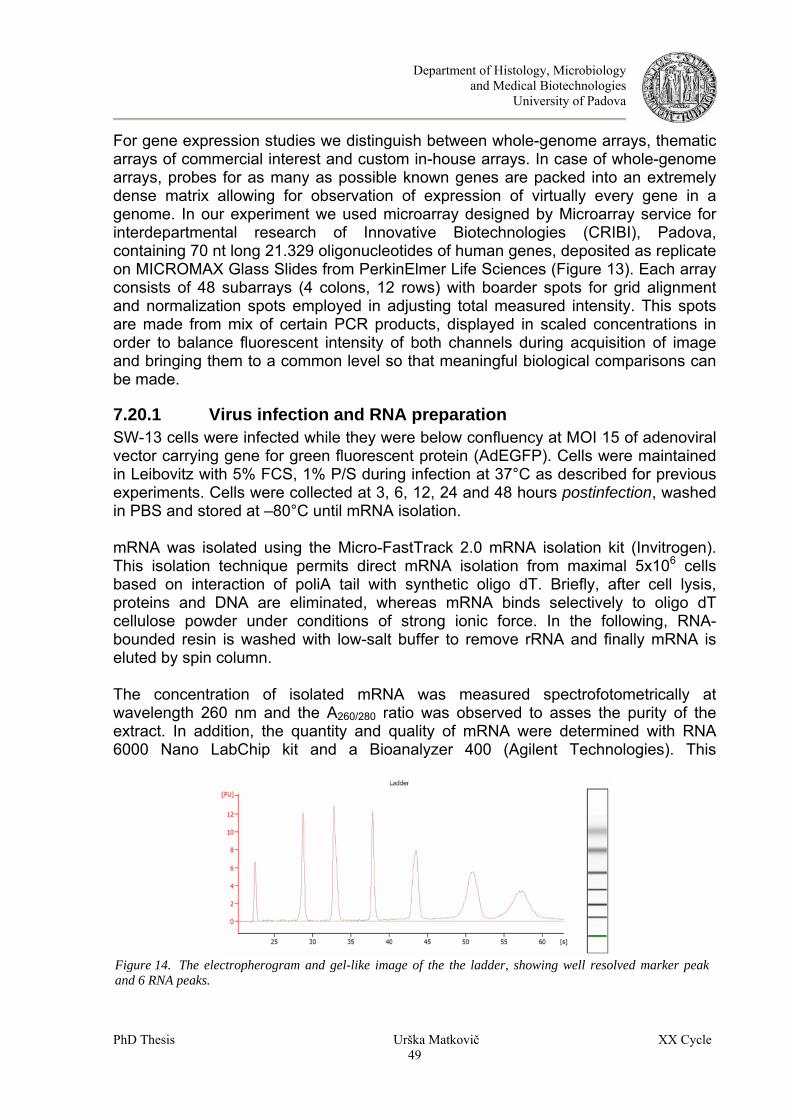
Department of Histology, Microbiology
and Medical Biotechnologies University of Padova
PhD Thesis Urška Matkovič XX Cycle 49
For gene expression studies we distinguish between whole-genome arrays, thematic arrays of commercial interest and custom in-house arrays. In case of whole-genome arrays, probes for as many as possible known genes are packed into an extremely dense matrix allowing for observation of expression of virtually every gene in a genome. In our experiment we used microarray designed by Microarray service for interdepartmental research of Innovative Biotechnologies (CRIBI), Padova, containing 70 nt long 21.329 oligonucleotides of human genes, deposited as replicate on MICROMAX Glass Slides from PerkinElmer Life Sciences (Figure 13). Each array consists of 48 subarrays (4 colons, 12 rows) with boarder spots for grid alignment and normalization spots employed in adjusting total measured intensity. This spots are made from mix of certain PCR products, displayed in scaled concentrations in order to balance fluorescent intensity of both channels during acquisition of image and bringing them to a common level so that meaningful biological comparisons can be made.
7.20.1 Virus infection and RNA preparation SW-13 cells were infected while they were below confluency at MOI 15 of adenoviral vector carrying gene for green fluorescent protein (AdEGFP). Cells were maintained in Leibovitz with 5% FCS, 1% P/S during infection at 37°C as described for previous experiments. Cells were collected at 3, 6, 12, 24 and 48 hours postinfection, washed in PBS and stored at –80°C until mRNA isolation. mRNA was isolated using the Micro-FastTrack 2.0 mRNA isolation kit (Invitrogen). This isolation technique permits direct mRNA isolation from maximal 5x10⁶ cells based on interaction of poliA tail with synthetic oligo dT. Briefly, after cell lysis, proteins and DNA are eliminated, whereas mRNA binds selectively to oligo dT cellulose powder under conditions of strong ionic force. In the following, RNA-bounded resin is washed with low-salt buffer to remove rRNA and finally mRNA is eluted by spin column. The concentration of isolated mRNA was measured spectrofotometrically at wavelength 260 nm and the A260/280 ratio was observed to asses the purity of the extract. In addition, the quantity and quality of mRNA were determined with RNA 6000 Nano LabChip kit and a Bioanalyzer 400 (Agilent Technologies). This
Figure 14. The electropherogram and gel-like image of the the ladder, showing well resolved marker peak and 6 RNA peaks.

Material and Methods
50
Figure 15. Figure 16. The electropherogram of the sample mRNA (100ng/μl) and gel-like image (on the left). microfluidic-based technology enables rapid analysis of small sample volumes loaded on a chip. A series of interconnected microchannels permit migration of nucleic acids fragments according to their molecular weights – a principle similar as for gel electrophoresis. The visualization of electrophoretic run is monitored on the basis of detected fluorescence intensity of the fragments due to dye binding added to the gel matrix. The results can be displayed as electropherogram or gel-like image. Yield of sample mRNA is evaluated in comparison with known quantity of marker fragments, typically seen as six distinct peaks (Figure 14). Contamination with ribosomal RNA is screened as second overlaid peak. An example of one of our samples is shown in Figure 16.
7.20.2 RNA labeling and microarray hybridization First-strand cDNA direct labeling method (Amersham Bioscience) was used for cDNA preparation. In this labeling strategy depicted in Figure 17, dyes are incorporated during first cDNA strand synthesis from initial mRNA. In fact, one part of dCTP nucleotides gets substituted with marked dCTP. The most commonly used are cianine fluorescent dyes, Cy3 and Cy5, emitting green and red fluorescence at wavelength of 532 nm and 635 nm, respectively. 3 μg of isolated mRNA from mock-infected and infected cells was reverse transcribed with a mixture of random nonamers and oligo(dT) primers. First, the mix was incubated at 70°C for 10 minutes to denature mRNA secondary structures, followed by incubation at room temperature for 10 minutes to achieve hybridization of primers with RNA. Retrotranscription was performed using enzyme SupeScript II (200 U/μl), including Cy3-dCTP or Cy5-dCTP in control and infected sample, respectively. Dye Swap (inversion of fluorochromes) labeling was performed on every RNA batch. Reaction was set for 120 minutes at 42°C and was blocked with EDTA 25 mM. The mRNA was degraded in 50mM NaOH for 10 minutes at 65°C and neutralized with 0.1N NaCl. Cy3 and Cy5-labeled cDNA were united and purified utilizing CyScribe GFX kit (Amersham Biosciences) to eliminate unincorporated dNTPs and cianines. Purified CyDye-labeled cDNA was then concentrated with Microcon YM-30 columns (Milipore) and resuspended in hybridization buffer containing 5x SSC, 0.1% SDS, 1% BSA, 25% formamide in H2O miliQ. The hybridization mix was incubated at 95°C for 2 minutes to denature cDNA. The DNA microarray chips were prehybridized in hybridization station (Tecan) in 5x

Department of Histology, Microbiology
and Medical Biotechnologies University of Padova
PhD Thesis Urška Matkovič XX Cycle 51
SSC, 0.1% SDS and 1% BSA for 1 hour at 42°C, rinsed once with distilled H2O and once with isopropanol, followed by N2-flux drying. Hybridization was performed in a humid chamber for 12 to 16 hours at 42°C, followed by stepwise washing with buffer 1 (1x SSC, 0.2% SDS), buffer 2 (0.1x SSC, 0.2% SDS) at 42°C for 10 minutes and buffer 3 (0.2x SSC) at room temperature for 2 minutes with final drying.
7.20.3 Data analysis Hybridized arrays were scanned for fluorescence intensities at wavelength of 532 nm and 635 nm with the PerkinElmer scanner. Each array generated two distinct images, one for each fluorescent dye, that were used for quantification of gene expression data. Scanned images were analyzed using ImaGene 5.0 acquisition software (BioDiscovery), in which composed color images were used to identify spot positions and to classify individual spots according to their fluorescent intensity (e.g. empty spots, negative spots, irregular spots). Raw data was finally exported as .TIFF files and further analyzed with GeneSight 4.0 software (BioDiscovery) and Microsoft Excel. Differential Regulation Analysis was used to identify differentially expressed genes in adenovirus-infected cells compared to mock-infected cells. First, background of submetagrid was subtracted from background of each spot to omit the spots of low quality according to Lowess method. Finally, replicate data was averaged, including dye swap and expressed as logarithms over the base value 2 (log2). Genes were reported to be up- and downregulated when the ratio log2(Cy5/Cy3) was higher and lower than 1 and –1, respectively. 2D-SOM (Bidimensional Self-Organizing Maps) statistical analysis was used to find groups of genes with similar expression profiles at different time points after infection. This type
Figure 17. Overview of first strand cDNA direct labeling. Picture adopted from www.microarray.lu/en.
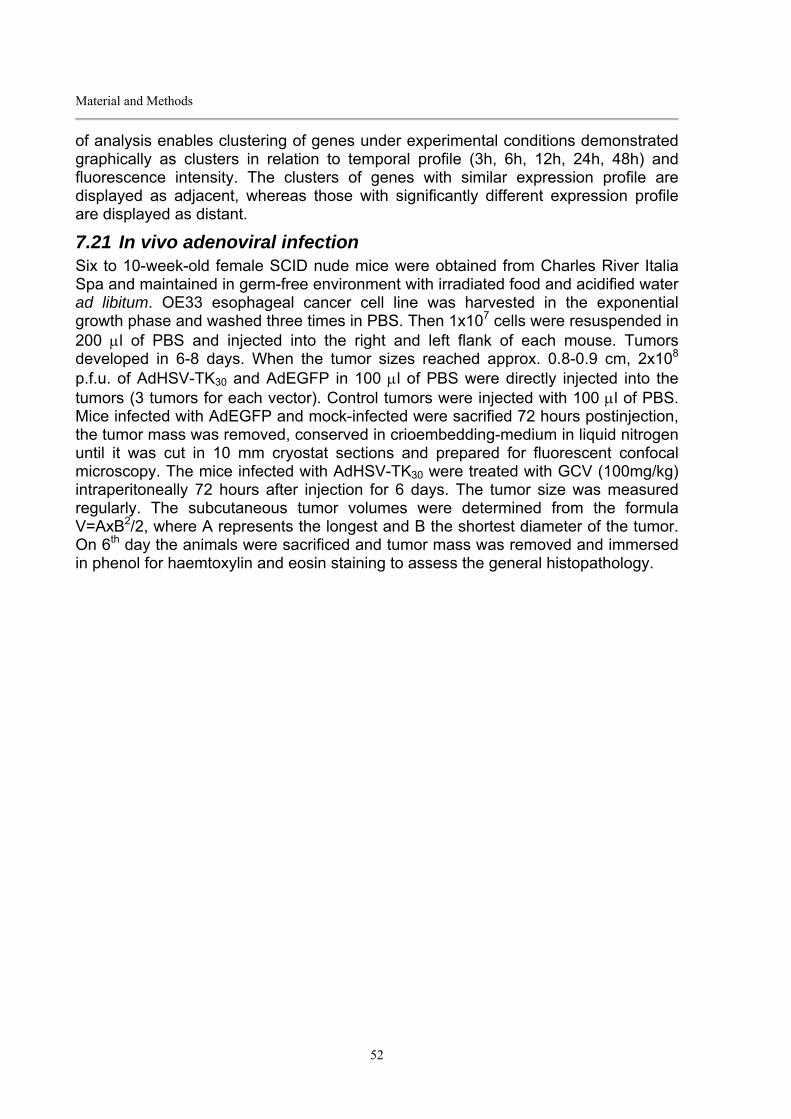
Material and Methods
52
of analysis enables clustering of genes under experimental conditions demonstrated graphically as clusters in relation to temporal profile (3h, 6h, 12h, 24h, 48h) and fluorescence intensity. The clusters of genes with similar expression profile are displayed as adjacent, whereas those with significantly different expression profile are displayed as distant.
7.21 In vivo adenoviral infection Six to 10-week-old female SCID nude mice were obtained from Charles River Italia Spa and maintained in germ-free environment with irradiated food and acidified water ad libitum. OE33 esophageal cancer cell line was harvested in the exponential growth phase and washed three times in PBS. Then 1x10⁷ cells were resuspended in 200 μl of PBS and injected into the right and left flank of each mouse. Tumors developed in 6-8 days. When the tumor sizes reached approx. 0.8-0.9 cm, 2x10⁸ p.f.u. of AdHSV-TK30 and AdEGFP in 100 μl of PBS were directly injected into the tumors (3 tumors for each vector). Control tumors were injected with 100 μl of PBS. Mice infected with AdEGFP and mock-infected were sacrified 72 hours postinjection, the tumor mass was removed, conserved in crioembedding-medium in liquid nitrogen until it was cut in 10 mm cryostat sections and prepared for fluorescent confocal microscopy. The mice infected with AdHSV-TK30 were treated with GCV (100mg/kg) intraperitoneally 72 hours after injection for 6 days. The tumor size was measured regularly. The subcutaneous tumor volumes were determined from the formula V=AxB2/2, where A represents the longest and B the shortest diameter of the tumor. On 6th day the animals were sacrificed and tumor mass was removed and immersed in phenol for haemtoxylin and eosin staining to assess the general histopathology.

Department of Histology, Microbiology
and Medical Biotechnologies University of Padova
PhD Thesis Urška Matkovič XX Cycle 53
8 RESULTS 8.1 Construction and Production of Recombinant Adenoviral
Vectors Recombinant replication-defective adenoviral vectors were produced by insertion of the EGFP and the HSV-TK30 genes into the MCS of the pShuttle-CMV vector, as reported in the Methods section. Subsequently, pShuttle plasmid vectors were transfected together with pAdEasy vectors into E.coli cells to produce the recombinant adenoviral vector genomes. Correct recombination between plasmids was screened by restriction nuclease digestion and agarose gel electrophoresis. Some of the results are shown in Figure 18. In particular, minipreps from pAdEasy-EGFP recombinants were digested by Sal I and Xho I to compare with restriction digest of pAdEasy. Expected fragments of pAdEasy-EGFP Xho I digest (shown in Figure 18a) are 16046 bp, 14500 bp, 2466 bp, 1552 bp, 1445 bp, 800 bp and 595 bp, whereas pAdEasy Xho I digest does not yield the fragment of 800 bp, which is the length of EGFP gene. To check stability of recombinant pAdEasy the Sal I restriction analyses was performed. Expected fragments (27021 bp, 6900 bp, 595 bp) did not differ for both vectors. Figure 18b presents screening of pAdEasyHSV-TK30 by plasmid size and restriction enzyme analysis with Pac I. Approximate size of pAdEasyHSV-TK30 is 40 kbp, whereas Pac I digestion yields two fragments of approx. 35 and 4,5 kbp. Final linear constructs, shown in Figure 19, were further lipofectamine-transfected in HEK293 cells to produce recombinant virions. About 8-10 days after transfection, the typical cytopathic effects (CPE) due to efficient adenoviral replication were observed. The cells were collected and lysed with temperature shock to release virions used as first amplification viral stock to infect next round of cells. Large-scale virus amplification involves a sequential increase of cell number to generate higher viral titers. a
pAdEasy Sal I
pAdEasyXho I
ML
Mλ pAdEasy-EGFP
Sal I Xho I 16046 bp
14500 bp
2466 bp
1552 bp1445 bp 800 bp
595 bp
27021bp
6900 bp
595 bp
b pAdEasy-tk30HSV
pAdEasy- tk30HSV Pac I
ML
Mλ
40 kbp
35 kbp
4,5 kbp
Figure 18. Screening of recombinant adenoviral vectors by gel electrophoresis; a) restriction analysis of pAdEasy-EGFP and pAdEasy with Sal I and Xho I; b) restriction analysis of pAdEasyHSV-TK30 with Pac I.

Results
54
Figure 19. Recombinant Ad5-derived adenoviral genomes, deleted in E1 and E3, carrying different transgenes; a) EGFP, b) HSV-TK30 and c) no transgene - Adnull. HEK 293 cell line is designed for E1-complemention of E1-deleted adenoviral vectors. Therefore, detection of efficient viral infection in HEK 293 is based on observation of CPE in the cell culture as presented in Figure 20. Originally, adenoviruses do not cause lysis of the cell, but persist within them in latent stage. Presence of adenoviral vectors in supernatant is consequence of spontaneous lysis of infected cells due to their enhanced sensitivity and subsequent detachment from the surface on which they are growing.
Figure 20. Cytopathic effects (CPE) in HEK 293: a) confluent monolayers of uninfected HEK 293 cells (negative control) and b) CPE in HEK 293 cells infected with an MOI of 100 of AdHSV-TK30 viral particles.
a
b
c
a b

Department of Histology, Microbiology
and Medical Biotechnologies University of Padova
PhD Thesis Urška Matkovič XX Cycle 55
Considering the possibility of replication competent adenoviruses (RCA) occurrence we did not perform more than 4 passages, although stably incorporated E1-gene cassette into cellular genome minimizes the frequency of homologous recombination between cellular and adenoviral genomes (1 revertant / 107 viruses). After each passage the adenoviral vectors were harvested and purified from supernatant and cell lysate. Release of viruses from infected cells with thaw/freeze cycles and further centrifugation at maximum speed allow minimal waste of produced vectors and decrease of their infectivity. To avoid damaging of viral particles due to temperature changes, viral stock was conserved at -80ºC in aliquots. Aproximate number of viral particles after each amplification step was assessed with MOI test. After fourth round of viral amplification, the viral titer was determined. Viral titer was determined by two methods, TCID50 (Figure 21), based on detection of phenotypic change of infected HEK 293 cells (PFU/ml) and quantitative real-time PCR, which determines the number of viral genomes (VP/ml). For the AdEGFP the titer was estimated also with flow cytometry and expressed as gene transfer units (GTU/ml). Titer values obtained with different techniques are summarized in the Table 4. Comparison of the two methods (TCID50 and real-time PCR) of viral titer determination shows that the PCR method overestimates the number of infectious particles of a 10-100-fold factor. The reason for higher quantitative real-time PCR titers, as reported in the literature, is that like other DNA-based detection techniques, quantitative real-time PCR measures total viral genome copy numbers (VPs/ml), which is generally higher than the number of infectious adenovirus particle numbers (PFU/ml) [47]. The loss of viral infectivity could be the result of either inefficient viral packaging or purification procedures of viral particles from infected cells. a 1 2 3 4 5 6 7 8 9 10 control
10-10 10-9 10-8 10-7
10-6 10-5 10-4 10-3
b 1 2 3 4 5 6 7 8 9 10 control
10-10
10-9
10-8
10-7
10-6
10-5
10-4
10-3
Figure 21. Virus production in HEK 293 cells was assessed by TCID50 assay 10 days after infection. Viable cells were stained with crystal violet. Representative results are shown: a) cells infected with AdEGFP; b) cells infected with AdHSV-TK30. The viral titer was calculated using Karber statistical formula: T=101-d(S-0.5), where d=log10 of dilution, S=the sum of ratios.

Results
56
Table 4. Adenoviral titers determined with TCID50 and quantitavtive real-time PCR
AdV TCID50 (PFU/ml) Q real-time PCR AdEGFP
2x108 *8x108 GTU/ml
1x10⁹
AdHSV-TK30
2.5x10⁸ 1.4x10⁹
Adnull
2x10⁹ 1x10¹⁰
Ad5
5x10⁹ 1x10¹⁰
* The titer of AdEGFP was determined also as gene transfer units (GTU) measuring percentage of EGFP-positive cells after infection with serial dilutions of AdEGFP stock by flow citometry.

Department of Histology, Microbiology
and Medical Biotechnologies University of Padova
PhD Thesis Urška Matkovič XX Cycle 57
8.2 Susceptibility of human adrenocortical carcinoma cells to adenoviral infection
8.2.1 Wild-type adenovirus has a natural tropism for human adrenocortical cells
As reported in the literature, adenoviruses have a natural tropism for the adrenal gland after systemic administration in mice [41, 40]. To test the adenovirus infectivity for human adrenocortical cells in vitro and to compare it with transduction efficiency of recombinant first-generation adenoviral vectors, we first detected Adenovirus type 5 presence in infected cells by immuno-staining for adenovirus capsid protein. NCI-H295R cells were fixed and stained 24h and 48h postinfection. Positive result is intensive green fluorescence due to secondary FITC-labeled antibody. As demonstrated in Figure 22, the fluorescence is found in nucleus and in cytoplasm of infected cell, since the adenoviral capsid proteins are synthesized in nucleus and are then transported in cytoplasm, where assembly in viral capsids occurs. A
B
Figure 22. Immnuno-detection of adenovirus type 5 in infected NCI-H295R cells. Cells were infected with Ad5 at MOI 20 and stained with primary antibody against Ad5 hexon protein and secondary FITC-antibody to be observed 24h (A) and 48h (B) pi at original magnifications, 200x, 400x. a, c: mock-infected , b, d: Ad5-infected cells.
a b
c d

Results
58
A
B
Figure 23. Immnuno-detection of adenovirus type 5 in infected primary cell lines of human adrenocortical carcinomas. Cells were infected with Ad5 at MOI 20 and stained with primary antibody against Ad5 hexon protein and secondary FITC-antibody to be observed 48h pi at original magnifications, 100x, 400x. a: mock-infected, b,c,d: Ad5-infected cells. In addition to cell lines, we performed also the experiments with primary cultures of human adrenocortical carcinomas. Forty-eight hours after infection by wild-type Ad5 with MOI of 20, cells were stained with anti-body against adenoviral protein as previously described and observed by fluorescent microscope. Efficiency of adenovirus infection was comparable with that demonstrated in secondary cell lines. Figure 23 show representative positive results compared with uninfected control.
8.2.2 Expression of primary adenoviral receptor CAR in human adrenocortical cells
The effectiveness of adenovirus-mediated gene transfer into target cell is highly dependant upon expression of the primary adenovirus cellular receptor, CAR. The widespread expression of CAR allows virus attachment to a variety of tissues.
a b
c d

Department of Histology, Microbiology
and Medical Biotechnologies University of Padova
PhD Thesis Urška Matkovič XX Cycle 59
0
1000
2000
3000
4000
5000
6000
7000
8000
SW-13 H295R ACC(n=6)
ACA(n=8)
Normaladrenal(n=5)
HepG2 Hep3B HuH7 HEK293
CA
R m
RN
A ( m
g/ to
tal R
NA
)
Figure 24. CAR mRNA expression in human adrenocortical samples by Q-RT-PCR. Expression of CAR mRNA was calculated as copies per mg of total RNA and normalized by RPLPO expression. Therefore, we sought to determine, whether human adrenocortical cells express CAR on their surface. We evaluated CAR expression in both adrenocortical carcinoma cell lines, NCI-H295R and SW-13, as well as in neoplastic and normal adrenocortical tissues. As presented in Figure 24, adequate expression of CAR was demonstrated in all tested samples at level approximately similar to that of HCC cells (HepG2, Hep3B and HuH7) and HEK293 cells. This result together with direct immuno-detection of adenovirus confirms that human adrenocortical cells are susceptible to adenovirus infection.
8.2.3 First-generation adenoviral vectors efficiently transduce human adrenocortical cells
To determine the susceptibility of SW-13 and NCI-H295R cells to adenoviral infection, cells were transduced with different MOIs of AdEGFP. After 24h, cells were observed by fluorescent microscopy and analyzed by flow cytometry. The efficiency of AdEGFP transduction was relatively high in both cell lines, reaching about 50% of EGFP-positive cells at an MOI of 5 and was increasing with higher MOIs (Table 5). Results obtained by flow-cytometry for SW-13 and NCI-H295R cells are demonstrated in Figure 25 and Figure 26, respectively. Correlated transduction efficiency was observed by fluorescent microscopy as demonstrated in Figure 27. On the basis of this experiment, MOI values for further experiments were defined in order to study the effects of adenoviral vector infection reaching approximately 100% efficiency and 5- to 25-fold higher MOI to simulate the titers received by cells in therapeutic viral delivery in vivo [48].

Results
60
Figure 25. Efficiency of Ad transduction in SW-13 cells. Cells were transduced with AdEGFP at increasing MOI.s (control, 5, 10, 15, 25, 50, 100, 300, 500). After 24 hours, the percentage of EGFP-positive cells (indicated by marker) was detected by flow cytometry.

Department of Histology, Microbiology
and Medical Biotechnologies University of Padova
PhD Thesis Urška Matkovič XX Cycle 61
Figure 26. Efficiency of Ad transduction in NCI-H295R cells. Cells were transduced with AdEGFP at increasing MOIs (control, 5, 10, 15, 25, 50). After 24 hours, the percentage of EGFP-positive cells (indicated by marker) was detected by flow cytometry.

Results
62
Table 5. The percentage of AdEGFP-positive SW-13 and NCI-H295R cells 24h after transduction with increasing MOIs.
MOI 5 10 15 25 50 100 300 500 SW-13 (%) 60 70 75.5 76.6 82 91.3 96 96.6 NCI-H295R (%) 59.5 64.5 72.5 75.6 79.8 / / /
It has been reported that infection with adenoviral vectors deleted in E1 and E3 regions provoked growth retardation of different cell types, microscopically seen as decreased cell confluence with rounded nonadherent cells [49]. Therefore, we wanted to examine, whether human adrenocortical cells as well undergo typical morphological changes upon adenoviral vector transduction. To exclude the possibility that adenovirus-induced phenotypic change of infected cells was specific for transgene cDNA, we used Ad vectors carrying different transgene cDNA encoding green fluorescent protein (AdEGFP) and herpes-simplex virus thymidine kinase (AdHSV-TK30). As a control of transgene toxicity we used adenoviral vector without inserted transgene (Adnull) to see whether phenotypic change is caused by sole adenoviral backbone. Notably, the occurrence of evident changes in monolayer integrity compared with uninfected control was present only in NCI-H295R cells, whereas no marked changes in cellular morphology were observed between infected and uninfected SW-13 cell line (Figure 28). The explanation for this finding can be different cell characteristics of the two tumor cell lines. SW-13 cell line derives from more aggressive form of adrenocortical carcinoma mutated in p53 gene and lacking the capability to produce steroids. On the contrary, in spite of malignant phenotype, NCI-H295R cell line contains wild-type p53 gene, retains its steroidogenic potential and low grow rate, probably rendering itself more sensitive to adenoviral vector toxic effects. With respect to transgene-specific induction of cytopathic effects, we observed a decrease in cell density and increase in cell size 3 days after infection with all three Ad vectors at equal MOI of 50, as documented on the photographs of unstained cells (Figure 28A). This result indicates that this effect is not restricted to the transgene cDNA, consistent with the observation made by others using different cell types [49]. Moreover, experiments with adenovirus empty capsids compared to different recombinant adenoviral particles strongly suggest that cellular response to adenoviral vector infection is most likely provoked by primary step of virion infection, regardless of modifications to the vector genome [48].

Department of Histology, Microbiology
and Medical Biotechnologies University of Padova
PhD Thesis Urška Matkovič XX Cycle 63
A
B
a b
c d
a b
c d

Results
64
Figure 27. Suspectibility of NCI-H295R and SW-13 cells to adenoviral transduction. (A) NCI-H295R and (B) SW-13 cells were transduced with AdEGFP at MOI 50. After 2 days the EGFP fluorescence in AdEGFP-infected live cells was observed by fluorescent microscopy at original magnifications 100x, 200x, 400x. (A: a,b:ctr- ; B: c, d:AdEGFP-infected; B: a:ctr- ; b,c,d: AdEGFP-infected). Figure 28. Observation of morphological changes provoked by adenoviral vectors. Photographs of unstained NCI-H295R (A) and SW-13 (B) cells infected with MOI 50 of Ad vectors (a: control, b: Adnull, c: AdHSV-TK30, d: AdEGFP) were taken after 3 days. Evident morphological changes were observed in NCI-H295R cells. Original magnifications 200x and 400x.

Department of Histology, Microbiology
and Medical Biotechnologies University of Padova
PhD Thesis Urška Matkovič XX Cycle 65
A 200x 400x
a
b
c
d

Results
66
B 200x 400x
a
b
c
d

Department of Histology, Microbiology
and Medical Biotechnologies University of Padova
PhD Thesis Urška Matkovič XX Cycle 67
8.2.4 Demonstration of efficient adenovirus replication in human adrenocortical carcinoma cells
To test wild-type Ad5 propagation in SW13 and NCI-H295R cell lines of human adrenocortical carcinoma, we measured virus production following infection with MOI 5 of Ad5 over different time points. As a positive control we used HEK 293 cell line, which is utilized as a packaging cell line for E1-deleted adenoviral vectors. Media of infected cells was harvested 1, 2, 3 and 4 days p.i. Additional times at day 6 and 9 were included for NCI-H295R cells due to its respectively slower growth rate. Virus production was efficient in all three tested cell lines, though the kinetics of virus replication differed in NCI-H295R cells. As expected, HEK 293 cells showed a maximal increase in virus titer at 72 h p.i. (1.6x10⁸ pfu/ml), following decrease at 96 h. Similar kinetics reaching the peak 72h p.i. (1.3x10⁹ pfu/ml) was observed for SW13 cells. In contrast, virus production proceeded slower in NCI-H295R cells. The maximal virus titer was reached at day 7 p.i. (1.7x10⁸ pfu/ml) and declined at day 9 p.i. The dicrease of viral titer after maximal production can be explained with cell death due to high concentration of newly-produced viruses. The graphs in Figure 29 show a good correspondance of Ad5 replication kinetics in tested cells obtained with two different methods: cpe endpoint assay TCID50 and real-time PCR. However, the minor difference in titer values obtained with these two methods is due to different detection techniques. The real-time PCR measures total viral genome copy numbers (VPs/ml), which is generally higher than the number of infectious adenovirus particle numbers (PFU/ml) detected with TCID50. The loss of viral infectivity could be the result of either inefficient viral packaging or purification procedures of viral particles from infected cells.
1.E+04
1.E+05
1.E+06
1.E+07
1.E+08
1.E+09
1.E+10
0 1 2 3 4 5 6 7 8 9 10days post-infection
titer
yie
ld (P
FU/m
l).
HEK 293SW13NCI-H293R
1.E+04
1.E+05
1.E+06
1.E+07
1.E+08
1.E+09
1.E+10
0 1 2 3 4 5 6 7 8 9 10days post-infection
titer
yie
ld (V
P/m
l)
HEK293SW13NCI-H295R
Figure 29. Kinetics of Ad5 replication in HEK 293, SW13 and NCI-H295R cells. All three cell lines were infected with MOI 5 of Ad5. Infected cells were harvested at the times indicated, and virus production was quantified by plaque assay (a) and real-time PCR method (b).
a b

Results
68
Furthermore, the evident decrease of viral titer is shown after 24 hr p.i. determined with TCID50 assay. Probably, the reason for this manner is internalization of viruses in the cells, followed by early phase or eclipse period of adenovirus replication cycle. Taken together, these data demonstrate that Ad5 replicates efficiently and reaches approximately the same maximal viral titer in both tested cells, but its replication kinetics significantly depends on physiological characheristics of infected cell type.
Figure 30. Adenovirus replication in NCI-H295R cells. Cells were infected with Ad5 at MOI of 15. After 24h (b), 48h (c), 72h (d) and 96h (e) pi, fixed cells were stained with primary antibody against adenovirus hexon protein. A positive and time-dependent immunofluorescent result was observed in infected cells vs. mock-infected cells (a).
a
b
d e
c

Department of Histology, Microbiology
and Medical Biotechnologies University of Padova
PhD Thesis Urška Matkovič XX Cycle 69
In addition to adenovirus titer determination in supernatant of infected cells, we detected adenovirus within cells by intracellular immuno-fluorescence staining for adenovirus structural protein. As depicted in Figure 30, green Ad5-positive NCI-H295R cells were found after secondary labeling by antibody conjugated with flurescein isothiocyanate. The cells were stained 24h, 48h, 72h and 96h postinfection to confirm adenovirus replication. Indeed, the amount of green cells increased with time demonstrating production and spreading of adenovirus. Besides immuno-detection, we wanted to see whether adenovirus replication reduces cell number. Therefore, we counted viable cells at indicated time-points by trypan blue exclusion assay. We found no significant reduction of viable cells at tested time points, suggesting that MOI 15 is probably too low to provoke cell death.

Results
70
8.3 Evaluation of therapeutic efficiency in human ACC, HCC and esophageal (EAC) carcinomas mediated by adenoviral transfer
One of the most extensive examined approaches of direct attack to cancer cells with gene therapy is the viral or non-viral vector-mediated delivery of suicide genes to cancer cells. In this approach, the suicide gene delivered to the target encodes an enzyme that is not toxic per se, but is able to convert a non-toxic compound (prodrug), administered separately, into a potent cytotoxin that can diffuse into neighbouring cells, creating so-called bystander effect. To date, the combination of herpes siplex virus thymidine kinase (HSV-TK) with nucleoside analogue ganciclovir (GCV) is the most well studied enzyme/prodrug strategy [50]. Thus, the mechanism of HSV-TK/GCV therapy is based on specific delivery of vectors, carrying gene for HSV-TK, into tumor cells, followed by separate GCV administration. Once expressed, HSV-TK specifically phosphorylates GCV to gancicloguanosine monophosphate. Subsequently, GCV-monophosphate is converted to the di- and triphosphate forms by cellular kinases. GCV-triphosphate competes with deoxyguanosine triphosphate for incorporation into elongating DNA during cell division, causing inhibition of the DNA polymerase and single strand breaks. Numerous reports demonstrate the effectiveness of adenoviral vectors in transducing antitumor genes for cancer gene therapy, including the treatment of endocrine cancers [5, 51]. Indeed, natural tropism of adenoviruses for adrenal gland makes recombinant adenoviral vectors promising agents for therapy of adrenocortical carcinomas or other adrenocortical disorders. After evaluation of adenovirus infectivity in human adrenocortical cells described in first chapter, we next analyzed both, the HSV-TK30 transcripts expression and functional expression of HSV-TK30 by GCV sensitivity assay in vitro.
8.3.1 GCV sensitivity assay To determine the therapeutic activity of HSV-TK30 gene in target cells, SW-13 and NCI-H295R, cells were transduced with AdHSV-TK30 at various MOI of 2, 10 and 50, and treated with increasing concentration of GCV. The cell survival was assayed with MTT test. Both cell types showed MOI- and GCV dose-dependant cell survival. When infected with an MOI 2, cell survival of NCI-H295R cells was relatively high (42%) at a GCV concentration of 1 μmol/l, compared to 18% and 16% cell survival at the same GCV concentration at MOI 10 and 50, respectively (Figure 31A). SW-13 showed lower sensitivity to GCV. At MOI 2, 10 and 50 and 1 μmol/l of GCV the cell survival was 73%, 48% and 39%, respectively (Figure 31B). The difference in sensitivity to GCV between the two cell lines was consistent with differential expression of the transgene described below.

Department of Histology, Microbiology
and Medical Biotechnologies University of Padova
PhD Thesis Urška Matkovič XX Cycle 71
a b
0
25
50
75
100
0,001 0,01 0,1 1 10 100GCV (mM)
cell
viab
ility
(% o
f con
trol)
MOI 2MOI 10MOI 50
00
25
50
75
100
0,001 0,01 0,1 1 10 100GCV (mM)
cell
viab
ility
(% o
f con
trol)
MOI 2MOI 10MOI 50
0
Figure 31. GCV sensitivity of NCI-H295R (a) and SW-13 (b) cells transduced with AdHSV-TK30 at MOI 2, 10 and 50. In addition to human ACC cells, we assayed GCV sensitivity in several other cancer cell lines of hepatocellular (HCC) and esophageal carcinomas. As observed in the graphs, HCC cell lines, HepG2 and HuH7 seem to demonstrate similar level of sensitivity to GCV compared to ACC cell lines (Figure 33). With regard to esophageal carcinoma cell lines, differential sensitivity to GCV was found. Among three tested esophageal cell lines, OE33 appeared to be most sensitive to GCV, whereas OE19 and KYRA showed only moderate or no response, respectively (Figure 32). As a control of HSV-TK30/GCV specific activity, we simultaneously performed the same experiments using Adnull. There was absolutely no response to GCV tratment (data not shown). Consistent results were found also with flow-cytometric analysis of adenovirus infectivity assay using AdEGFP. The percentages of AdEGFP-positive OE33 and OE19 cells, together with HepG2 and HuH7, are summarized in Table 6. Table 6. The percentage of AdEGFP-positive OE33 and OE19 cells 48h after transduction with increasing MOIs.
MOI 1 10 100 OE33 (%) 31.8 70 81 OE19 (%) 10 12.8 47 HepG2 (%) 15 61.5 90.3 HuH7 (%) 24 68.5 92
Results
72
a b
0
20
40
60
80
100
120
0,001 0,01 0,1 1 10 100GCV (mM)
Cel
l via
bilit
y (%
of c
ontro
l)
MOI 1MOI 10MOI 100
00
20
40
60
80
100
120
140
160
0,001 0,01 0,1 1 10 100GCV (mM)
Cel
l via
bilit
y (%
of c
ontro
l)
MOI 1MOI 10MOI 100
0
c
0
20
40
60
80
100
120
0,001 0,01 0,1 1 10 100GCV (mM)
Cel
l via
bilit
y (%
of c
ontro
l)
MOI 1MOI 10MOI 100
0
Figure 32. GCV sensitivity of OE33 (a), OE19 (b) and KYRA (c) cells transduced with AdHSV-TK30 at MOI 1, 10 and 100.

Department of Histology, Microbiology
and Medical Biotechnologies University of Padova
PhD Thesis Urška Matkovič XX Cycle 73
a b
0
20
40
60
80
100
0,001 0,01 0,1 1 10 100GCV (mM)
Cel
l sur
viva
l (%
)
MOI 100MOI 10
00
20
40
60
80
100
0,001 0,01 0,1 1 10 100GCV (mM)
Cel
l sur
viva
l (%
)
MOI 100MOI 10
0
Figure 33. GCV sensitivity of HepG2 (a) and HuH-7 (b) cells transduced with AdHSV-TK30 at MOI 10 and 100.
8.3.2 Expression of HSV-TK30 mRNA in transduced target cells Expression of HSV-TK30 therapeutic gene in target cells was evaluated by quantitative real-time PCR method. Cells were infected with MOI 50 and harvested 48 hours after infection for total RNA extraction. The HSV-TK30 expression level was higher for NCI-H295R cells, confirming the higher sensitivity to GCV compared to SW-13 cells. The explanation for differential expression level of the delivered gene might be the different physiologic characteristics of the cell types. SW-13 cells in contrast to NCI-H295R cells derive from more aggressive carcinoma and divide rapidly, thereby consuming most of the energy for growth and division processes, whereas minimizing the anabolic pathways. In fact, they are not capable of steroid hormone production. Similar observations were found for HCC cell lines; HepG2 demonstrated higher HSV-TK30 expression compared to HuH7. Expression levels of tested cell lines are showed in Figure 34.
1.0E+00
1.0E+01
1.0E+02
1.0E+03
1.0E+04
1.0E+05
1.0E+06
1.0E+07
1.0E+08
SW-13 H295R HuH7 HepG2
HS
V-T
K30
mR
NA
(cop
ies/
ug to
tal R
NA
)
Figure 34. Expression of HSV-TK30 in transduced ACC and HCC cell lines at MOI 50 48h postinfection.

Results
74
8.3.3 In vivo studies of adenoviral vector-mediated gene transfer in mice Our in vitro experiments showed efficient adenovirus transduction and prominent response to HSV-TK30/GCV treatment in some of the tested cells. In the following study, we evaluated in vivo transduction efficiency and antitumor activity in a human esophageal xenograft animal model, using nude SCID mice (purchased from Charles River Italia Spa). In these experiments we used OE33 cell line, which showed to be adequately susceptible for adenoviral transduction. OE33 tumors were developed in nude mice in 5-6 days after injection of 1x10⁷ cells subcutaneously into the right and left flanks. Three mice were used for infection with each vector, AdEGFP and AdHSV-TK30, including mock-infected mice. Adenoviral vectors were directly injected into the tumors using 2x10⁸ PFU/100 μl of PBS. Mice infected with AdEGFP and mock-infected were sacrified 72 hours postinjection, the tumor mass was removed, cut in 10 μm cryostat sections and prepared for fluorescent confocal microscopy. Intensive green fluorescence was observed in examined tumors, mostly at the injection sites, whereas no fluorescence was present in mock-infected cells. Representative results are shown in Figure 35. The mice infected with AdHSV-TK30 were treated with GCV (100mg/kg) intraperitoneally 72 hours after injection. On 6th day the mice were sacrificed and the tumor size was measured and its volume calculated from equation: V=AxB2/2, where A represents the longest and B the shortest tumor diameter. Cryostat sections were stained with haematoxylin and eosin (H&E) to assess the general tumor histopathology. As expected, tumors injected with only PBS (either treated or not with GCV) increased in size for about 200% with respect to its original mass. On the contrary, the growth of tumors transduced with AdHSV-TK30 was significantly inhibited after treatment with GCV (for about 40%). Figure 36 shows the general morphology of tumor mass after H&E staining of sections prepared from mice intratumorally injected with AdHSV-TK30 and subsequently treated with GCV compared to mock-infected control. In treated tumors, tumor necrosis, including significant infiltration of inflammatory cells and the presence of apoptotic cells was identified, accounting for regressed tumor growth. In the contrast, analysis of mock-infected tumors demonstrated actively dividing tumor cells, without any necrotic features or inflammatory-cell infiltrates, consistent with increased tumor growth.
Figure 35. Cryostatic sections of xenograft esophageal tumors in mice observed with confocal fluorescent microscopy 72h after intratumor injection of AdEGFP (left, middle) and PBS-injected negative control (right).

Department of Histology, Microbiology
and Medical Biotechnologies University of Padova
PhD Thesis Urška Matkovič XX Cycle 75
Figure 36. General morphology of xenograft esophageal tumors in mice after haematoxilyin and eosin staining. Infiltration of inflammatory cells and necrosis is present in tumors injected with AdHSV-TK30 after GCV treatment (left, middle) compared to negative control (right).
CTR-

Results
76
8.4 Effect of adenovirus infection on human adrenocortical carcinoma cell proliferation
We next investigated, whether first-generation adenoviral vectors might have some impact on cell proliferation of target adrenocortical cells. Adenoviral vectors used in our study are deleted in E1 and E3 genes to render them replication-incompetent. However, it has been reported residual replication of first-generation adenoviral vectors, probably due to retained E4 gene region [52]. The occurrence of morphological changes observed in NCI-H295R cells made us wonder, if highly efficient adenoviral transduction influenced cell growth as well. In the terms of natural adenovirus infection, we wanted to study cytotoxic potential of wild-type adenovirus type 5, both, as infectious agent in the case of systemic adrenal gland infection and as an oncolytic agent for therapy of adrenocortical carcinomas. Furthermore, we sought to compare the effects of replication-incompetent adenoviral vectors to replication-competent adenovirus in the context of safety for therapeutic use of adenoviral vectors derived from type 5 adenovirus. In these experiments we used two different proliferation assays. First, we performed biochemical MTT assay, based on metabolic conversion of salt MTT, which occurs only in alive cells and is visualized as colorimetric reaction. For this experiment cells were infected with AdEGFP, AdHSV-TK30 and Ad5 at MOI of 2, 10, 50. Cell survival of infected vs. uninfected cells was evaluated at different time points postinfection considering longer times for NCI-H295R cells. As demonstrated in Figure 37, AdEGFP transduction has shown no effect on SW-13 proliferation compared with uninfected control at different time points postinfection. With regard to NCI-H295R cell line, a slight decrease of cell survival was found from fourth to the seventh day after infection with AdEGFP in dose-dependent manner. However, after the seventh day, AdEGFP-infected cells had apparently regained growth (Figure 37). Similar results were obtained when AdHSV-TK30 was used instead of AdEGFP (data not shown). With regards to wild-type adenovirus, time- and dose-dependant decrease of cell survival was observed. Time necessary for adenovirus to kill 60% of cell population at MOI 50 was 4 days in the case of SW-13 cells and 8 days in the case of NCI-H295R cells. This result is consistent with replication kinetics of adenovirus in both cell types described in previous chapter. To have additional results regarding different effect of adenoviral vectors on cell proliferation of tested cell lines obtained by MTT assay, we performed experiment using more sensitive BrdU proliferation assay. In this assay, bromodeoxyuridine (BrdU), a thymidine analog is incorporated into newly synthesized DNA of actively proliferating cells and detected by immunolabeling with anti-BrdU monoclonal antibody. In this experiment we decided to use higher MOI, since MTT assay had not demonstrated significant effects of adenoviral transduction on cell growth at MOIs not superior 50. Therefore, the cells were infected with higher MOI of 50, 100 and 500 of AdEGFP and Adnull, which served as an control vector of transgene toxicity. Due to different growth characteristics of the two cell lines, cell proliferation was measured 2 and 5 days after infection for SW-13 and NCI-H295R, respectively. Selected time

Department of Histology, Microbiology
and Medical Biotechnologies University of Padova
PhD Thesis Urška Matkovič XX Cycle 77
points represented maximal adenovirus production in previously performed experiment (Chapter 8.2.4). As can be observed in Figure 38, cell survival of both tested cell lines infected with adenoviral vectors were lower, but not MOI-dependant, compared with uninfected control. For the SW-13 cell line, cell survival was decreased for about 20% in both, AdEGFP and Adnull transduced cells. Unlike SW-13, NCI-H295R cells showed more prominent decrease in cell survival when infected with AdEGFP (about 30%) with respect to Adnull (about 20%). Once again, the effect was approximately the same for all three different MOI. These results suggest that MOI at which maximal transduction efficiency has been reached (50-100), decreases cell proliferation at initial phase when vector enters into the cell, but the dosage of higher MOI does not have any additional impact on it. A
AdEGFP
0
20
40
60
80
100
120
0 1 2 3 4 5 6 7 8 9Time [days]
Rel
ativ
e C
ell S
urvi
val
(% o
f Uni
nfec
ted
Con
trols
)
AdEGFP MOI 2
AdEGFP MOI 10
AdEGFP MOI 50
Adenovirus (Ad5)
0
20
40
60
80
100
120
0 1 2 3 4 5 6 7 8 9Time [days]
Rel
ativ
e C
ell S
urvi
val
(% o
f Uni
nfec
ted
Con
trols
)
Ad5 MOI 2
Ad5 MOI 10
Ad5 MOI 50
B
AdEGFP
0
20
40
60
80
100
120
0 1 2 3 4 5Time [days]
Rel
ativ
e C
ell S
urvi
val
(% o
f Uni
nfec
ted
Con
trols
)
AdEGFP MOI 2
AdEGFP MOI 10
AdEGFP MOI 50
Adenovirus (Ad5)
0
20
40
60
80
100
120
0 1 2 3 4 5Time [days]
Rel
ativ
e C
ell S
urvi
val
(% o
f Uni
nfec
ted
Con
trols
)
Ad5 MOI 2
Ad5 MOI 10
Ad5 MOI 50
Figure 37. Evaluation of ACC cell survival after adenoviral infection by MTT assay. (A) NCI-H295R and (B) SW-13 cells were transduced with three different MOIs 2,10,50 of AdEGFP and Ad5 and tested for cell survival different time points pi.

Results
78
A Ad5
0
20
40
60
80
100
50 100 500MOI
Rel
ativ
e C
ell S
urvi
val
(% o
f Uni
nfec
ted
Con
trols
)
Adnull
AdEGFP
0
20
40
60
80
100
2 10 50MOI
Rel
ativ
e C
ell S
urvi
val
(% o
f Uni
nfec
ted
Con
trols
)
B Ad5
0
20
40
60
80
100
50 100 500MOI
Rel
ativ
e C
ell S
urvi
val
(% o
f Uni
nfec
ted
Con
trols
)
Adnull
AdEGFP
0
20
40
60
80
100
2 10 50MOI
Rel
ativ
e C
ell S
urvi
val
(% o
f Uni
nfec
ted
Con
trols
)
Figure 38. Evaluation of ACC cell survival after adenoviral infection by BrdU assay. (A) NCI-H295R and (B) SW-13 cells were transduced with three different MOIs 50, 100, 500 of AdEGFP and Adnull and MOIs 2, 10, 50 of Ad5 and tested for cell survival 2 and 5 day, respectively.

Department of Histology, Microbiology
and Medical Biotechnologies University of Padova
PhD Thesis Urška Matkovič XX Cycle 79
8.5 Cell cycle modification provoked by wild-type and recombinant adenovirus
Our results showed reduced cell proliferation and increased cell size of adrenocortical cells infected with adenoviral vectors. Although infection with wild-type adenovirus resulted in prominent decrease of cellular survival rates and final cell death in dose- and time-dependant manner, cells infected with adenoviral vectors underwent mild decrease of cell growth followed with regained growth after some time postinfection. We hypothesized that these changes caused by adenoviral vectors in infected cells may be related directly to the induction of G2/M arrest in the cell cycle, in contrast to common S-phase induction provoked by wild-type adenovirus infection.
8.5.1 Adenovirus induces S-phase of cell cycle in ACC cells First, we wanted to demonstrate the cytotoxic effect of wild-type adenovirus on cell cycle of infected adrenocortical cells. Adenovirus replicates autonomously in the cell modulating its DNA replication. This modulation at the level of DNA synthesis of host cell can be observed as induced S-phase. We analyzed cell cycle distribution of SW-13 and NCI-H295R cells after infection with wild-type adenovirus. Since we have observed efficient replication of wild-type adenovirus in adrenocortical cells, we expected that induction of S-phase would be provoked by rather low MOI values. For this reason, we decided to infect cells with MOI not higher than 25 in order to avoid excessive cell death. For the NCI-H295R cell line, the infection was conducted at an MOI 15. The cells were harvested from first to seventh day postinfection and analyzed for cell cycle distribution after propidium iodide staining. The seven-day postinfection period for this cell line was chosen on the basis of adenovirus replication kinetics, that showed to reach a peak around seven day pi (Figure 29). Indeed, consistent modulation of cell cycle was observed. The percentages of cells in each cell phase are presented in Table 7. We found no alternation of cell cycle in infected cells compared to uninfected control first and second day pi. The S phase slightly began to increase third day pi (9% in uninfected cells vs. 12.5% in infected cells) and continued until significant induction on seventh day pi (11.5% in uninfected cells vs. 26.7% in infected cells). Representative histograms showing S phase induction by adenovirus are depictured in Figure 39. In the case of SW-13 cell line, we analyzed cells earlier after infection, since they displayed maximal adenovirus replication already second to third day pi. In these cells, S-phase started to increase first day pi (11.9% in uninfected cells vs. 16.9% in infected cells) and demonstrated significant induction second day pi. Representative results are shown in Figure. In detail, the S phase of the infected cells was increased by about 11% and 40% when infected with MOI 15 and 25, respectively (Table 8). In both cells we analyzed also sub-G0 cell fraction as indicator of apoptotic or necrotic DNA fragmentation. We found no alternations compared to uninfected control confirming the inhibition of apoptosis in host cell occurring during natural adenovirus infection.

Results
80
8.5.2 Adenoviral vectors induce G2/M arrest in ACC cells Next, we wanted to determine whether the adenoviral vector transduction of SW-13 and NCI-H295R cells has some impact on distribution of cell populations over different cell cycle phases. We first performed experiments using low MOI values. No alternations of cell cycle phases were found in NCI-H295R when transduced with AdEGFP and Adnull at MOI 15 at any time point pi. Percentages of cells in each phase of cell cycle are summarized in Table 7. Likewise, AdEGFP transduction of SW-13 cells with slightly higher MOI of 25 and even 50 did not provoked any significant change of cell cycle 24h and 48h pi (Table 8). Representative histograms of cell cycle analysis obtained by flow citometry are demonstrated in Figure 40. As reported in the literature, G2/M delay was observed in various cell types when transduced with adenoviral vectors using higher MOI values of 250-500 viral particles, which are required for therapeutic viral delivery in vivo [48]. Therefore, we proceed with experiments using suggested MOI values. Indeed, the results obtained after transduction of both cell lines with AdEGFP and Adnull at MOI 100 and 500 have demonstrated the increase of G2/M phase. In the NCI-H295R cells the induction of G2/M phase was most prominent on day 2 after transduction. It was estimated, that in the case of Adnull, G2/M-cell fraction was about 19% at MOI 100 and 31% at MOI 500 compared with 12% in uninfected control. In the following day 3 and 5, the increase was still evident, but slightly minor (Figure 41). Similar findings were found when transduced with AdEGFP as summarized in Table 9. Table 7. Cell cycle distribution in NCI-H295R cells after infection with Adnull, AdEGFP and Ad5 at MOI 15.
Cell phase (%) control Adnull AdEGFP Ad5 Sub-G0 1.3 1.2 1.4 1.15 G0/G1 58.9 59.3 62.3 61.5 S 14.6 16.2 14.2 14.3 1d
G2/M 24.9 22.8 21.9 23.1 Sub-G0 1.2 1.3 1.4 2.3 G0/G1 61.5 60.5 61.2 58.7 S 10.5 9.9 12.6 12.2 2d
G2/M 25.5 27.2 24 25.7 Sub-G0 1 1 1.1 1.2 G0/G1 65.6 62.8 66.8 58.2 S 9 10.1 8.4 12.5 3d
G2/M 23.5 25.1 23.1 26.9 Sub-G0 1.15 1.6 2.7 1.4 G0/G1 66.36 64 63.5 59.3 S 8.9 10.3 10.4 14.5 4d
G2/M 22.6 23.4 22.7 23.3 Sub-G0 9.4 4.1 2.7 2.3 G0/G1 63.8 62.5 75.8 54 S 11.5 16.1 9.5 26.7 7d
G2/M 14.6 16.4 11.8 14.6 Each cell phase is expressed as the percentage of the total cell distribution after adenoviral transduction.

Department of Histology, Microbiology
and Medical Biotechnologies University of Padova
PhD Thesis Urška Matkovič XX Cycle 81
Table 8. Cell cycle distribution in SW-13 cells by infection with AdEGFP and Ad5 at MOI 15, 25, 50
Cell phase (%) control AdEGFP Ad5 MOI 25 MOI 50 MOI 15 MOI 25
Sub-G0 4.3 2.4 2.5 / 2.6 G0/G1 46.7 49.5 56.1 / 57.6 S 11.9 15.4 13 / 16.9 24
h
G2/M 29.1 28.3 24.6 / 17.3 Sub-G0 2.2 3.8 2.7 1.1 4.8 G0/G1 62.5 67.8 63.7 61.5 15.6 S 10.7 12.2 14.1 21.3 51.5 48
h
G2/M 19.2 14.1 17.5 15.6 11.7 Each cell population is expressed as the percentage of the total cell distribution after adenoviral transduction.
Regarding SW-13 cell line, cell cycle analysis has been performed on day 1, 2 and 3 pi. No changes were found on day 1, but like for NCI-H295R cells, the increase of the cells in the G2/M phase began on day 2 and was still present on day 3 after transduction with both adenoviral vectors at both MOIs at similar levels. In detail, in the case of Adnull, 14% of cells in uninfected control were determined to be in G2/M phase compared to 20% and 36% of cells transduced with MOI 100 and 500, respectively (Figure 42). With regards to AdEGFP, induction of G2/M phase to similar extent was observed (Table 10). It should be addressed that the cells were sub-confluent at the time of infection and the uninfected control cells had not yet reached the confluence at the time of harvesting to rule out the contact inhibition as the reason for cell arrest. In addition to evaluation of G2/M cell phase induction upon adenoviral vector infection, we observed also sub-G0 cell phase of cells with reduced DNA content as possible indicator of proapoptotic effect. We found no significant increase of cells in sub-G0 phase at tested MOIs, neither in the cases where G2/M was prolonged. These results indicate that adenoviral vector transduction at high MOIs provokes G2/M arrest of both ACC cell lines, which may be associated with decreased cell growth and morphological changes, but does not seem to induce cell death.
Figure 39. Induction of S phase by Ad5 infection. Representative graphs of SW-13 cells infected with the indicated adenoviruses at an MOI 25 were obtained 2 days postinfection. Cells were fixed, stained withpropidium iodide for DNA content and analyzed by FACS. The increased S phase was demonstrated when infected with Ad5 in contrast to mock-infected (a) and AdEGFP-infected cells (b). The percentage of cells in each phase is summarized in Table and was determined using WinMDI software.

Results
82
Figure 40. Induction of S phase by Ad5 infection. Representative graphs of NCI-H295R cells infected with the indicated adenoviruses at an MOI 15 were obtained 7 days postinfection. Cells were fixed, stained with propidium iodide for DNA content and analyzed by FACS. The increased S phase was demonstrated when infected with Ad5 (d) in contrast to mock-infected (a) and Adnull-, AdEGFP-infected cells (b, c). The percentage of cells in each phase is summarized in Tabel and was determined using WinMDI software.

Department of Histology, Microbiology
and Medical Biotechnologies University of Padova
PhD Thesis Urška Matkovič XX Cycle 83
Figure 41. G2/M arrest induced by Adnull infection of NCI-H295R cells. Cells were infected with MOI 100 and 500, stained with propidium iodide and analyzed by FACS at indicated time-points postinfection.Representative graphs of experiments done in duplicate are pictured here, demonstrating dose-dependant induction of G2/M phase of Adnull-infected cells vs. mock-infected control. Table 9. Cell cycle distribution in NCI-H295R cells by infection with AdEGFP at MOI 100 and 500.
Cell phase (%) control MOI 100 MOI 500 Sub-G0 1.3 2.1 4.3 G0/G1 67 57.7 42.9 S 17 18.5 26.4 2
day
G2/M 14.8 21.8 26.6 Sub-G0 4.8 2.3 4.8 G0/G1 66.6 68.3 55.2 S 15.3 15 20.8 3
day
G2/M 13.1 13.7 14 Sub-G0 2.8 3.5 7.8 G0/G1 74.3 73.4 61.1 S 11.5 10.2 17 5
day
G2/M 10.9 12.6 13.3 Each cell population is expressed as the percentage of the total cell distribution after adenoviral transduction.

Results
84
Figure 42. G2/M arrest induced by Adnull infection of SW-13 cells. Cells were infected with MOI 100 and 500, stained with propidium iodide and analyzed by FACS at indicated time-points postinfection.Representative graphs of experiments done in duplicate are pictured here, demonstrating dose-dependant induction of G2/M phase of Adnull-infected cells vs. mock-infected control. Table 10. Cell cycle distribution in SW-13 cells by infection with AdEGFP at MOI 100 and 500.
Cell phase (%) control MOI 100 MOI. 500 Sub-G0 0.9 0.8 0.9 G0/G1 45 46.9 46.3 S 18.5 17.7 17.2 24
h
G2/M 27.6 26.4 27.6 Sub-G0 2.8 1.8 3.9 G0/G1 47.9 54.6 49.8 S 10.9 15.8 11.9 48
h
G2/M 8.6 10.4 18.1 Sub-G0 1.9 2.7 3.7 G0/G1 65.4 58 51.3 S 10.4 8.3 9.6 72
h
G2/M 13.3 12.6 18.1 Each cell population is expressed as the percentage of the total cell distribution after adenoviral transduction.

Department of Histology, Microbiology
and Medical Biotechnologies University of Padova
PhD Thesis Urška Matkovič XX Cycle 85
8.6 The effect of adenoviral infection on ACCs cell death We were able to demonstrate S phase induction and G2/M arrest in adenovirus- and adenoviral vector-infected adrenocortical cells, respectively. We further investigated whether replication deficient adenoviral vectors affect cell death of adrenocortical cells. Since induction of apoptosis by adenoviral vectors deleted in E1 and E3 genes in different target cells is controversial in published studies, our interest was focused on that aspect. In the context of adenovirus toxicity during natural infection of adrenal gland we wanted to examine the mechanism of cell death provoked by replication-competent wild-type adenovirus and compare it to replication deficient adenovirus-derived vectors. For these experiments we used flow cytometric technique based on annexinV and propidium iodide staining that allows for simultaneous detection of apoptotic and necrotic cell populations.
8.6.1 Adenovirus replication results in cell death of ACC Adenovirus infection leads to enlargment of the infected cells disintegrating from the cell monolayer forming plaques or so called cytophatic effects. Subsequently, the cell death occurs as a lysis in the final phase of the infection due to high concentration of newly produced viruses rendering the cell more susceptible to lyse allowing the shedding of the progeny viruses. Our results with wild-type adenovirus confirmed the cell death induction as a result of adenovirus replication in human adrenocortical cells. Consistent with the efficient replication reaching the maximal viral titer third day pi in SW-13 and seventh day pi in NCI-H295R, the cell death was more evident at these time points than on the first and second day pi. Figure 43 show representative results for SW-13 cells. We observed no increase of death cells (upper right and left quadrants) 24 hours after adenovirus infection at MOI 25 and 50 and only a slight increase of apoptotic cells for about 9% (low right quadrants) compared to uninfected control. Importantly, the postapoptotic cell population began to increase 48 hours pi (Figure 43B) and markedly continued with time. At 72 hours pi (Figure 43C) an increase from 6% to approximately 40% annexinV- and propidium iodide-positive cells and from 13% to 22% annexin-V positive cells was detected in uninfected and adenovirus-infected SW-13 cells, respectively. With regards to NCI-H295R cells, we detected similar increase of postapoptotic cells after adenovirus infection. The percentages of each cell population 24 and 48 hours after infection are summarized in Table 11. These results showed a minor induction of apoptosis by adenovirus supporting the fact that apoptosis is not a primary characheristic of adenovirus-infected cells due to efficient blocking of it by adenoviral early proteins. However, the majority of dead cells were detected as both, annexinV- and propidium iodide-positive. This finding indicates that late proapototic activity of adenovirus as well as spontaneous cell lysis might contribute to final cell death in late phase of adenovirus infection.

Results
86
Figure 43. Apoptosis and necrosis detection by annexin V and propidium iodide staining in SW-13 cells infected with MOI 25 and 50 of adenovirus 1(A), 2(B) and 3(C) day postinfection. Table 11. Detection of apoptosis and necrosis of SW-13 cells by infection with adenovirus at indicated MOI values
control Ad5 MOI 25 MOI 50
% apoptosis 22.5 24 24.4 % postapoptosis 20.6 24 29.7 % necrosis 5.6 3.7 6.6 24
h
% live cells 51 48.2 39.2 % apoptosis 19 15 15.6 % postapoptosis 13.7 19.7 22.7 % necrosis 2.6 8 18.9 48
h
% live cells 64.7 57.3 43 Each cell population is expressed as the percentage of the total cell distribution after adenoviral transduction.
B
C
A

Department of Histology, Microbiology
and Medical Biotechnologies University of Padova
PhD Thesis Urška Matkovič XX Cycle 87
8.6.2 Adenoviral vectors affect cell death at high multiplicity of infection Based on different findings regarding cell death mediated by E1 and E3-deleted adenoviral vectors in variety of different cell types reported by others, we wondered whether adenoviral infection of adrenocortical cells induce apoptotic or necrotic cell death or possibly, does not have any effect on it. With regards to the latter assumption, we hypothesized the cell death might be affected at high multiplicity of infection due to adenoviral infection event itself rather than adenoviral gene expression of transfer gene. Moreover, induced G2/M arrest that we observed seems to be reversible indicating recovering cell growth some time later. For this reason, we expected that only a small percentage of growth-arrested cells would undergo cell death after adenoviral infection. In first set of experiments we examined apoptotic and necrotic response upon adenoviral vector infection at low MOI of 15. We used Adnull and AdHSV-TK30 vectors to see whether the effect would be transgene-associated. Both cell types were harvested 48 and 72 hours postinfection and stained by annexinV and propidium iodide for flow-cytometric analysis. As summarized in Table 12 and Table 13 we found no significant changes in death cell population compared with uninfected control. Importantly, both adenoviral vectors displayed similar results. Table 12. Induction of apoptosis and necrosis of SW-13 cells by infection with Adnull and AdHSV-TK30 at MOI 15
control Adnull AdHSV-TK30 % apoptosis 2 1.2 0.7 % postapoptosis 0.9 0.5 0.3 % necrosis 10.7 10.3 7.6 48
h
% live cells 86.4 88 91.4 % apoptosis 1.6 2 5.3 % postapoptosis 1.4 3.1 5.3 % necrosis 3 2.7 2.2 72
h
% live cells 94 92.2 87.2 Each cell population is expressed as the percentage of the total cell distribution after adenoviral transduction.
Table 13. Induction of apoptosis and necrosis of NCI-H295R cells by infection with Adnull and AdHSV-TK30 at MOI 15
control Adnull AdHSV-TK30 % apoptosis 0.6 0.6 1.3 % postapoptosis 1.7 0.5 0.9 % necrosis 17.1 25.6 21.5 2d
% live cells 80.6 73.3 76.3 % apoptosis 0.6 1.4 0.8 % postapoptosis 0.7 3.1 0.8 % necrosis 11.1 13.5 14.3 3d
% live cells 87.6 82 84.1 Each cell population is expressed as the percentage of the total cell distribution after adenoviral transduction.

Results
88
We proceeded with the experiments using higher MOI values. The cells were infected with MOI 100 and 500 and analyzed 24 hours after infection. Representative dot-blots including percentages of each cell fraction are shown in Figure 44. Interestingly, NCI-H295R cells demonstrated an increase of postapoptotic cells detected as annexinV- and PI-positive cells (upper right quadrant) from 17% in uninfected control to 21% and 34% in cells infected with MOI 100 and 500, respectively. Detection of apoptotic cell fraction stained as annexin V-positive cells (lower right quadrant) was slightly increased for about 6% only in cells infected with MOI 500. On the contrary, we have not observed any significant effects of adenoviral infection in SW-13 cells. Based on our previous results showing equally efficient gene transfer in both cell lines, lower transduction efficiency is not the reason for different (post)apoptotic response. We assume, this phenomenon could be in a part explained in the context of p53 mutation contained in SW-13 cells, whereas NCI-H295R cells contain wild-type p53.
Figure 44. Apoptosis and necrosis detection by annexin V and PI staining in NCI-H295R (A) and SW-13 (B) cells transduced with Adnul at MOI 100 and 500 24h pi. 1A. An increase from 17% (control) to 21% (m.o.i. 100) and 34% (m.o.i. 500) annexin V- and PI-positive cells (upper right quadrant) and from 9% (control) to 15% (m.o.i. 500) annexin V-positive cells (lower right quadrant) was detected in NCI-H295R cells 24h p.i. No significant alternations were detected 72h p.i. in both, NCI-H295R (1B) and SW-13 cells (1C).
A
B
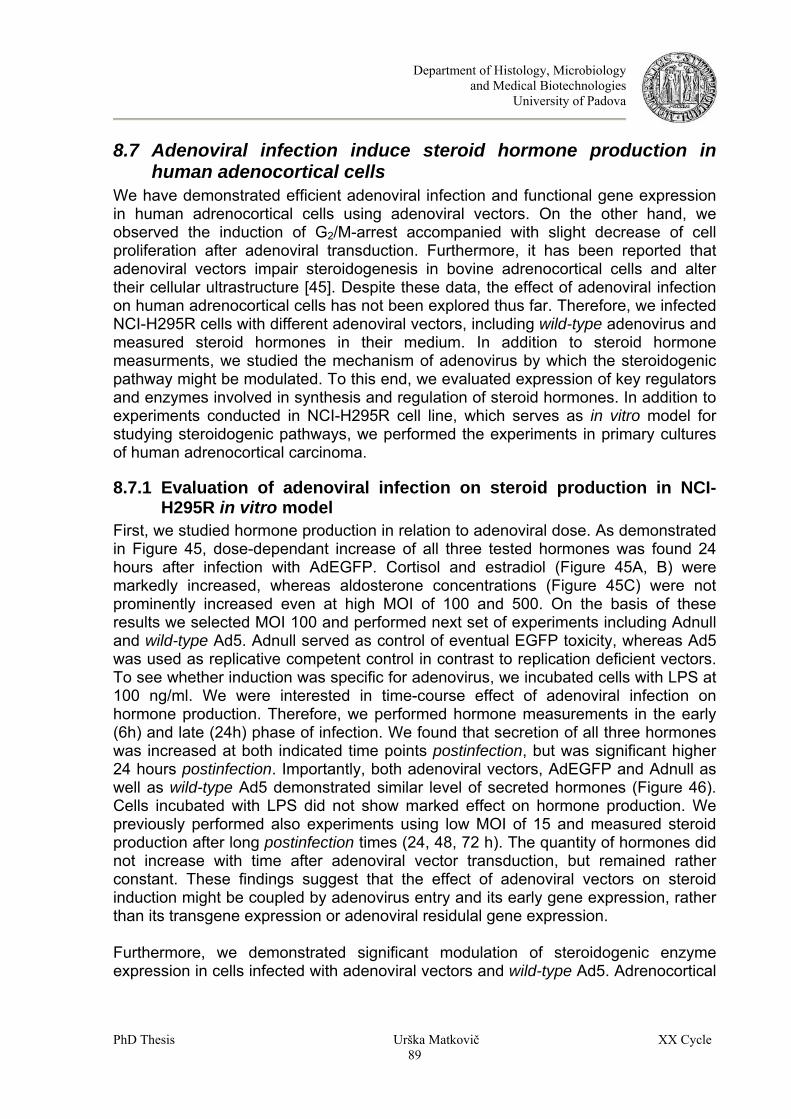
Department of Histology, Microbiology
and Medical Biotechnologies University of Padova
PhD Thesis Urška Matkovič XX Cycle 89
8.7 Adenoviral infection induce steroid hormone production in human adenocortical cells
We have demonstrated efficient adenoviral infection and functional gene expression in human adrenocortical cells using adenoviral vectors. On the other hand, we observed the induction of G2/M-arrest accompanied with slight decrease of cell proliferation after adenoviral transduction. Furthermore, it has been reported that adenoviral vectors impair steroidogenesis in bovine adrenocortical cells and alter their cellular ultrastructure [45]. Despite these data, the effect of adenoviral infection on human adrenocortical cells has not been explored thus far. Therefore, we infected NCI-H295R cells with different adenoviral vectors, including wild-type adenovirus and measured steroid hormones in their medium. In addition to steroid hormone measurments, we studied the mechanism of adenovirus by which the steroidogenic pathway might be modulated. To this end, we evaluated expression of key regulators and enzymes involved in synthesis and regulation of steroid hormones. In addition to experiments conducted in NCI-H295R cell line, which serves as in vitro model for studying steroidogenic pathways, we performed the experiments in primary cultures of human adrenocortical carcinoma.
8.7.1 Evaluation of adenoviral infection on steroid production in NCI-H295R in vitro model
First, we studied hormone production in relation to adenoviral dose. As demonstrated in Figure 45, dose-dependant increase of all three tested hormones was found 24 hours after infection with AdEGFP. Cortisol and estradiol (Figure 45A, B) were markedly increased, whereas aldosterone concentrations (Figure 45C) were not prominently increased even at high MOI of 100 and 500. On the basis of these results we selected MOI 100 and performed next set of experiments including Adnull and wild-type Ad5. Adnull served as control of eventual EGFP toxicity, whereas Ad5 was used as replicative competent control in contrast to replication deficient vectors. To see whether induction was specific for adenovirus, we incubated cells with LPS at 100 ng/ml. We were interested in time-course effect of adenoviral infection on hormone production. Therefore, we performed hormone measurements in the early (6h) and late (24h) phase of infection. We found that secretion of all three hormones was increased at both indicated time points postinfection, but was significant higher 24 hours postinfection. Importantly, both adenoviral vectors, AdEGFP and Adnull as well as wild-type Ad5 demonstrated similar level of secreted hormones (Figure 46). Cells incubated with LPS did not show marked effect on hormone production. We previously performed also experiments using low MOI of 15 and measured steroid production after long postinfection times (24, 48, 72 h). The quantity of hormones did not increase with time after adenoviral vector transduction, but remained rather constant. These findings suggest that the effect of adenoviral vectors on steroid induction might be coupled by adenovirus entry and its early gene expression, rather than its transgene expression or adenoviral residulal gene expression. Furthermore, we demonstrated significant modulation of steroidogenic enzyme expression in cells infected with adenoviral vectors and wild-type Ad5. Adrenocortical

Results
90
a b
0
2000
4000
6000
8000
10000
12000
14000
16000
18000
20000
MOI 15 MOI 50 MOI 100 MOI 500
Cor
tisol
(pg/
ml)
ctr-AdEGFP
0
2000
4000
6000
8000
10000
12000
14000
16000
18000
MOI 15 MOI 50 MOI 100 MOI 500E
stra
diol
(pg/
ml)
ctr-AdEGFP
c
0
25
50
75
100
125
150
175
200
225
MOI 15 MOI 50 MOI 100 MOI 500
Ald
oste
rone
(pg/
ml)
CTR-AdEGFP
Figure 45. Dose-dependant effect of AdEGFP on the basal cortisol (a), estradiol (b) and aldosterone (c) secretion of transduced NCI-H295R cells 24 hours postinfection. steroid hormone biosynthesis and its regulation is a complex network of enzymatic pathways. The global activator of steroidogenesis is steroidogenic acute regulatory protein, StAR, that facilitates intracellular uptake and intramitochondrial transfer of substrate cholesterol to be further metabolized in steroid precursors. Indeed, we found expression of StAR significantly upregulated by both, Adnull and AdEGFP. The upregulation was higher at 6 hours, but still marked at 24 hours postinfection (Figure 48A). The induction of StAR expression in the early infection period indicates its response to activate steroidogenic enzyme cascade immediately after adenovirus entry. In addition to StAR expression, other two steroidogenic regulators, DAX-1 and SF-1, were studied. DAX-1 is global negative regulator of steroid production and represses the expression of genes involved in steroidogenesis, whereas SF-1 is a stimulator of those genes. The ratio between the two antagonists influences the expression of StAR and steroidogenic enzymes. In fact, we found expression of DAX-1 unaltered 6
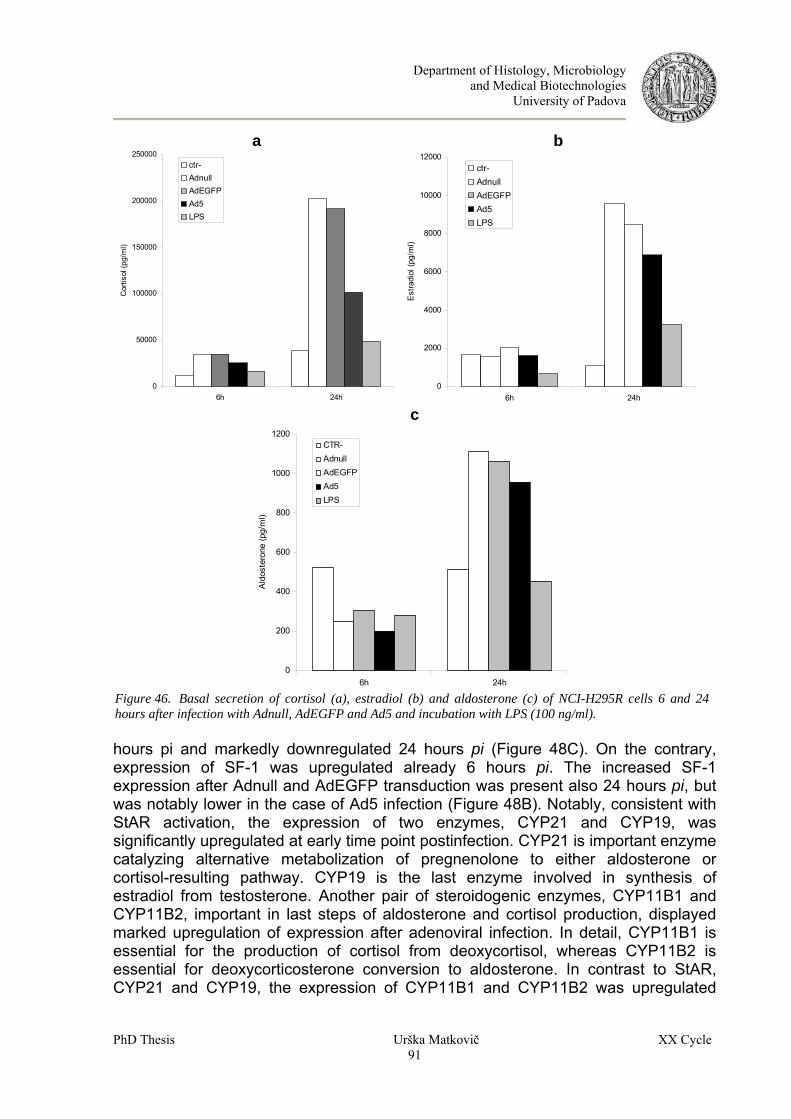
Department of Histology, Microbiology
and Medical Biotechnologies University of Padova
PhD Thesis Urška Matkovič XX Cycle 91
a b
0
50000
100000
150000
200000
250000
6h 24h
Cor
tisol
(pg/
ml)
ctr-Adnull AdEGFPAd5LPS
0
2000
4000
6000
8000
10000
12000
6h 24hE
stra
diol
(pg/
ml)
ctr-Adnull AdEGFPAd5 LPS
c
0
200
400
600
800
1000
1200
6h 24h
Ald
oste
rone
(pg/
ml)
CTR-AdnullAdEGFPAd5 LPS
Figure 46. Basal secretion of cortisol (a), estradiol (b) and aldosterone (c) of NCI-H295R cells 6 and 24 hours after infection with Adnull, AdEGFP and Ad5 and incubation with LPS (100 ng/ml). hours pi and markedly downregulated 24 hours pi (Figure 48C). On the contrary, expression of SF-1 was upregulated already 6 hours pi. The increased SF-1 expression after Adnull and AdEGFP transduction was present also 24 hours pi, but was notably lower in the case of Ad5 infection (Figure 48B). Notably, consistent with StAR activation, the expression of two enzymes, CYP21 and CYP19, was significantly upregulated at early time point postinfection. CYP21 is important enzyme catalyzing alternative metabolization of pregnenolone to either aldosterone or cortisol-resulting pathway. CYP19 is the last enzyme involved in synthesis of estradiol from testosterone. Another pair of steroidogenic enzymes, CYP11B1 and CYP11B2, important in last steps of aldosterone and cortisol production, displayed marked upregulation of expression after adenoviral infection. In detail, CYP11B1 is essential for the production of cortisol from deoxycortisol, whereas CYP11B2 is essential for deoxycorticosterone conversion to aldosterone. In contrast to StAR, CYP21 and CYP19, the expression of CYP11B1 and CYP11B2 was upregulated

Results
92
more prominently 24 hours with respect to 6 hours postinfection (Figure 47). Additional observation was found in the case of Ad5. Expression levels of CYP19, CYP11B1 and CYP11B2 were lower compared with those induced by Adnull and AdEGFP. This phenomenon may be related to lower SF-1 expression and suggests distinct action of wild-type adenovirus with respect to its non-replicative derivates. With regard to LPS incubation, no significant influence was observed on evaluated expression of examined enzymes.
a b
0
5
10
15
20
25
30
6h 24h
CY
P19
mR
NA
(x10
3 cop
ies
/ mg
tota
l RN
A) ctr-
Adnull AdEGFP Ad5LPS
0
50
100
150
200
250
300
6h 24h
CY
P21
mR
NA
(cop
ies
/ mg
tota
l RN
A)
ctr- Adnull AdEGFP Ad5LPS
c d
0
10
20
30
40
50
60
70
6h 24h
CY
P11
B1
mR
NA
(cop
ies
/ mg
tota
l RN
A)
ctr- Adnull AdEGFPAd5LPS
0
5
10
15
20
25
30
35
6h 24h
CY
P11
B2
mR
NA
(cop
ies
/ mg
tota
l RN
A)
ctr- Adnull AdEGFP Ad5LPS
Figure 47. Expression of steroidogenic enzymes CYP19 (a), CYP21 (b), CYP11B1 (c) and CYP11B2 (d) in NCI-H295R cells mock-infected and infected with adenoviral vectors and Ad5 at an MOI 100 and LPS-treated (100 ng/ml) at indicated time points postinfection.

Department of Histology, Microbiology
and Medical Biotechnologies University of Padova
PhD Thesis Urška Matkovič XX Cycle 93
a b
0
5
10
15
20
25
6h 24h
StA
R m
RN
A (x
10 3 c
opie
s / m
g to
tal R
NA
) ctr- Adnull AdEGFP Ad5LPS
0
0,5
1
1,5
2
2,5
3
6h 24h
SF-
1 m
RN
A (x
10 3 c
opie
s / m
g to
tal R
NA
)
ctr- Adnull AdEGFP Ad5LPS
c
0
10
20
30
40
50
60
70
80
90
100
6h 24h
DA
X-1
mR
NA
(cop
ies
/ mg
tota
l RN
A)
ctr- Adnull AdEGFP Ad5LSP
Figure 48. Expression of steroidogenic regulators StAR (a), SF-1 (b) and DAX-1 (c) in NCI-H295R cells mock-infected and infected with adenoviral vectors and Ad5 at an MOI 100 and LPS-treated (100 ng/ml) at indicated time points postinfection. Taken together, the results of steroids measured in cell medium of infected cells have shown increased concentrations compared with uninfected cells and minor alternations in medium of cells incubated with LPS. Consistent results were found at the expression levels of StAR and crucial steroidogenic enzymes in the case of cells infected with adenoviral vectors and wild-type Ad5. This effect was prominent after infection at high MOI, though it was already present after infection with low MOI. With regard to the latter, the induction of hormone production was present also during late times after adenoviral vector infection (48, 72h). The modulation of entire steroidogenic process provoked by adenovirus is summarized in Figure 49.

Results
94
StAR
CYP11A
Cholesterol
Pregnenolone HSD3B2
CYP17 SULT2A1
CYP21
CYP11B2
CYP11B1
Progesterone
Deoxycorticosterone
Corticosterone
ALDOSTERONE
17 OH Preg DHEA DHEA- sulfate
Androstenedione 17 OH Prog
Deoxycortisol
CORTISOL
HSD17B3
CYP19
ESTRADIOL
Testosterone
Figure 49. Schematic view of steroidogenic pathway. Studied steroidogenic enzymes affected by adenoviral infection are depicted in dark.

Department of Histology, Microbiology
and Medical Biotechnologies University of Padova
PhD Thesis Urška Matkovič XX Cycle 95
8.7.2 Effect of adenoviral infection on steroid function in human primary ACC cells
An adrenocortical carcinoma used in our study was removed from 55-year-old female and was clinically diagnosed as steroid hormone secreting tumor. The exams of patient blood detected presence of cortisol, androgen and testosterone. The cells were infected with AdEGFP at an MOI 20. Growth medium was collected 48 hours postinfection and assayed for steroids concentrations. Minor increase was observed for cortisol and aldosterone, whereas estradiol showed to be decreased (Figure 50). Correlated results of efficient adenoviral infection were obtained with immuno-fluorescence using antibody against adenoviral hexon protein and are shown on page 58 in Figure 23.
a b
0,0
0,5
1,0
1,5
2,0
2,5
3,0
3,5
ACC6R
Cor
tisol
(pg/
ml x
10 6 )
AdEGFPCTR-
0
5
10
15
20
25
30
35
40
ACC6R
Ald
oste
rone
(pg/
ml x
10 3 )
AdEGFPCTR-
c
0
50
100
150
200
250
300
350
400
450
500
ACC6R
Est
radi
ol (p
g/m
l)
AdEGFPCTR-
Figure 50. Secretion of cortisol (a), aldosterone (b) and estradiol (c) detected in supernatants of human ACC primary cells transduced with AdEGFP at an MOI 20 48 hours postinfection.

Results
96
8.8 Modulation of gene expression induced by recombinant adenoviral vector in human ACC cells
The use of E1/E3-defective adenoviruses abrogates both E1A interaction with pRB protein family and E3 action to counteract the host antiviral defense mechanism. However, although efficient delivery of the transgene is achieved, the adenoviral vector itself can modify gene expression of the host cell. Several endogenous genes have been described in the literature as being affected following infection with adenovirus-based vectors, including adenovirus empty virions, in different cell types [53, 54, 55, 56, 57, 58]. Few of these studies have used microarray technology to monitor comprehensively the effects on the profile of host gene expression. So far, the knowledge about the relevant impact of adenoviral vectors on gene expression profile during different steps of infection is limited. In this context, we were interested in examining the effect of recombinant E1-/E3- defective adenoviral vector on human adrenocortical cells during the entire process of infection, comprising early and late infection phase. In the experiment described here, we have infected human adrenocortical cell line SW-13 with adenoviral vector expressing green fluorescent protein (AdEGFP) at low MOI of 10. Total RNA from infected and uninfected cells was processed for microarray analysis as described in materials and methods. We monitored global gene expression changes 3, 6, 12, 24 and 48h after infection and mock-infection using microarray chip designed by CRIBI. The time points were chosen as being relevant for the specific steps in adenovirus infection; 3 and 6 hours after infection includes entry of the virus in the cell and transcription of early adenoviral genes, which are deleted in the vector. Around 12 to 20 hours after infection the expression of EGFP starts.
8.8.1 Differential Regulation Analysis Microarray analysis was obtained by GeneSight 4.0 software. Figure 51 presents box plot of gene expression ratios of SW-13 cells infected with AdEGFP at indicated time points performed by Differential Regulation Analysis. This kind of analysis allows for identification of up- and down-regulated genes following infection with AdEGFP compared to uninfected control as the logarithmic value of ratios between red and green intensity [log2(Cy5/Cy3)] is significantly higher or lower than 1 and –1, respectively. We observed variation of cellular gene expression with the time. Of the total 22.657 genes, RNA from virus-infected cells demonstrated differential expression for 499 cellular genes 3 hours after infection, at the time point at which the maximal modulation in cellular gene expression was found. The majority of modulated genes was upregulated at this point. At 48 hours post-infection the number of modulated genes decreased to 212 among which the number of up- and down-regulated genes was similar. As demonstrated in the figure, the significant upregulation of cellular genes was induced in the early phase of infection, following by stabilization of cellular gene expression in the late phase of infection (12-48h). The genes significantly upregulated in the early phase were genes involved in innate immune response (interferon-α , -γ, interferon-γ receptor).

Department of Histology, Microbiology
and Medical Biotechnologies University of Padova
PhD Thesis Urška Matkovič XX Cycle 97
3h 6h 12h 24h 48h3h 6h 12h 24h 48h
Figure 51. Graphic presentation of average, standard deviation and 99% interval of confidence, as logarithmic value on the base 2, between values of gene expression (fluorescence intensity) of SW-13 cells infected with AdEGFP and uninfected control cells. Results are presented as the average of experiments made in duplicates with inversion of the fluorophores (dye-swap).
8.8.2 2D-SOM analysis In addition to differential gene expression in each analyzed time point after infection, we were interested how the modulated expression level of analyzed genes varied with the time. To this end, we performed statistical 2D-self organizing map analysis (2D-SOM) that allows for classification of genes on the basis of their temporal profile of expression. This analysis has confirmed that infection with AdEGFP provoked significant variation of relatively low percentage of total 22.657 genes spotted on microarray chip. As can be noted in Figure the clusters of randomly selected genes performed approximately the same expression levels in different time points. Importantly, we found some clusters that demonstrated marked variation of gene expression profile 3-6 hours after infection. The examples are clusters 1 and 6, where 387 and 318 genes were analyzed demonstrating upregulation 6 hours after infection, hence confirming the modulation of gene expression in the early phase of adenoviral infection. Some markedly up- and downregulated genes obtained by both statistical analyses are summarized in Table 14. Consistent with several studies investigating immune response after administration of recombinant adenoviruses in both mice and primates, and microarray data published by others using recombinant adenoviruses in different cell types [48, 59, 60, 61, 62, 63], we observed induction of immune and stress-response genes. In detail, genes associated with inflammation were intereferons α, γ and proinflammatory cytokines such as tumor necrosis factor,

Results
98
Figure 52. Time-course analysis of gene expression profile of SW-13 cells after infection with AdEGFP performed by 2D-SOM anaysis. including interferon receptor γ, tumor necrosis receptor, chemokine receptor 5 and toll-interleukine 1 receptor (TIR) domain. The innate immune system recognizes microbial pathogens through Toll-like receptors (TLRs). Different TLRs recognize different pathogen-associated molecular patterns, but all have a TIR domain, which is responsible for signal transduction of the immune system, resulting in cytokine secretion and inflammatory response. The second group of upregulated genes comprised genes involved in stress-response like heat shock proteins and their homologs. In particular, we found induced the 70-kDa heat shock protein, which in conjuntion with other heat shock proteins stabilizes proteins against aggregation and mediates the folding of newly translated proteins in the cytosol and in organelles. The gene is located in the major histocompatibility complex III region [64]. Expression of several other genes was increased. These genes mostly encoded for basic transcription and RNA processing factors, basic metabolic enzymes, such as glyceraldehyde-3-phosphate dehydrogenase, a key enzyme in carbohydrate metabolism, and mitogen-activated protein kinases that respond to various cell stimuli by mediating immediate-early expression of genes that are involved in a wide variety of cellular processes such as proliferation, differentiation, transcription regulation and development.

Department of Histology, Microbiology
and Medical Biotechnologies University of Padova
PhD Thesis Urška Matkovič XX Cycle 99
Table 14. Representative genes modulated by AdEGFP in SW-13 cells at indicated time points postinfection.
Gene ID log2 Ratio 3h 6h 12h 24h 48h 001H08_Interferon, gamma 1.36 2.97 0.18 0.78 0.15 023C16_Interferon gamma receptor 1 2.04 2.94 3.58 1.69 -0.54 016O16_Interferon, alpha 8 1.51 2.13 0.09 -0.73 -0.20 044P15_Tumor necrosis factor (ligand) superfamily, member 13b 1.67 3.31 1.53 1.27 0.00 016O20_Tumor necrosis factor receptor superfamily, member 9 1.34 2.86 1.07 2.16 -0.15 008A19_Toll-interleukin 1 receptor (TIR) domain-containing adapter protein 1.18 3.65 1.64 1.66 1.13
014112_Chemokine (C-C motif) receptor 5 1.28 4.15 0.15 1.10 -0.01 005C17_DnaJ (Hsp40) homolog, subfamily B, member 12 1.35 2.44 3.87 1.01 0.80 018B05_Heat shock 70kD protein 1-like 1.83 2.01 0.11 -0.32 -0.26 026O20_HSPC052 protein 1.10 2.07 0.74 -0.38 0.63 018F05_Mitogen-activated protein kinase 8 interacting protein 2 2.22 2.87 -1.21 0.81 1.10 030M21_Basic transcription factor 3 1.21 2.92 -0.03 0.64 0.00 025M11_RNA processing factor 1 1.59 3.75 1.42 1.29 -0.07 021H10_Glyceraldehyde-3-phosphate dehydrogenase 1.49 3.29 2.74 1.85 -1.86 019D01_Insulin-like growth factor 1 (stomatomedin C) -1.45 -2.63 -3.40 -4.88 0.18 009N12_Serine/threonine protein kinase MASK -0.07 -2.87 -2.59 -2.93 0.02 016J05_Tyrosinase-related protein 1 0.00 -2.13 -2.13 -2.52 -0.23 003F09_F-box and leucine-rich repeat protein 5 0.45 -2.07 -2.52 -2.52 -0.23 010J22_Cyclin-E binding protein 1 0.72 -3.21 -2.77 -2.63 0.31 With regard to downregulated genes, we found the reduction of mRNA encoding serine/threonine protein kinase MASK, which localizes in Golgi apparatus and is cleaved by caspase-3 suggesting its function in the apoptotic pathway. Further, reduced expression of genes encoding for cyclin-E binding protein and insulin-like growth factor 1 (stomatomedin C) were also observed. Cyclin-E belongs to cyclins family, which function as regulators of distinct cell phases of the cell cycle. The activity of cyclin-E is required for cell cycle G1/S transition, indicating its downregulation can be related to inhibition of S phase progression of cell cycle. Insulin-like growth factors (IGFs) or stomatomedins comprise a family of peptides that play important roles in mammalian growth and development. Another gene was found downregulated and encodes for F-box and leucine-rich repeat protein 5. F-box proteins constitute one of the four subunits of ubiquitin protein ligase complex, which function in phosphorylation-dependent ubiquitination. This finding seems to be in the contrary to the activity of the wild-type adenovirus, which stimulates the formation of ubiquitin ligase complex by binding its E1B-55K/E4orf6 proteins to cellular elongins and cullins. Since the induction of these two gene groups was found early after infection, we hypothesize that the primary step of infection itself might impact cellular gene expression, regardless of modifications to the viral vector DNA template. Actually, it has been argued that most of the cellular effects of adenoviral vectors are the result of viral gene expression due to residual pathogenic potential [52, 42] despite of genome modifications to render them incapable of replication. However, microarray analysis carried by Stillwel and Samulski [48] using both, recombinant adenoviral vectors and empty adenovirus virion shells, demonstrated otherwise significant

Results
100
reduction of overall changes in gene expression after infection with empty capsids, but some of modulated genes involved in the immune and stress response were still activated 24h after infection. This data strongly suggest the important role of the virion shell during infection and provides new insights in development of gene therapy vectors in the terms of capsid modifications.

Department of Histology, Microbiology
and Medical Biotechnologies University of Padova
PhD Thesis Urška Matkovič XX Cycle 101
9 DISCUSSION First-generation recombinant adenoviral vectors are mostly based on human adenovirus serotypes 2 and 5 and are among the most commonly used vectors in gene therapy as well as analytical tools in basic research. We constructed recombinant adenoviral vectors carrying HSV-TK30 and EGFP using the AdEasy cloning system. This system is based on insertion of transgene into transfer vector, which is then co-transformed into E.coli together with adenoviral genome deleted in E1 and E3 regions to render replicative-defective adenoviral construct. Complete recombinant virions were then propagated in HEK 293 cell line stably expressing a copy of the E1 region. We were able to produce titers about 109 PFU/ml or 1010 VP/ml after four rounds of viral amplification. The problem regarding production of higher titers was the occurrence of replication competent adenoviruses (RCA) after the fourth passage. Therefore, we found HEK 293 cells not suitable for large-scale amplification to obtain adequate titers for in vivo studies. In fact, recently engineered cell lines for adenoviral vector amplification contain precisely inserted E1 coding region, without any sequence homologies with viral sequences. Several key attributes make replication-defective adenoviral vectors promising therapeutic agents, in particular, for cancer gene therapy. They display in vivo stability and higher gene transfer efficiency to numerous dividing and nondividing cell targets and are rarely linked to any severe disease in humans. Furthermore, production parameters for clinical grade adenoviral vectors are well established, allowing for easy manipulation and high titer production. Numerous pre-clinical studies using adenoviral vectors for gene therapy of different cancers have shown promising results. In our work we evaluated transduction and therapeutic efficiency of produced adenoviral vectors in human adrenocortical (ACC), hepatocellular (HCC) and esophageal (EAC) carcinomas. ACC and HCC cell lines have shown similar and efficient transduction with AdEGFP, determined by flow cytometry and fluorescent microscopy. With regard to EAC cell lines, OE33 cells demonstrated high transduction efficiency, comparable to ACC and HCC cell lines, followed by lower transduction efficiency of OE19 cells, whereas KYRA cells showed very low or no AdEGFP-transduced cells. Further, we assayed the sensitivity to GCV after transduction with AdHSV-TK30. We obtained correlated results; ACC, HCC and OE33 cell lines showed MOI- and GCV-dependent cell survival. OE19 and KYRA cells showed moderate or no response, respectively. In addition to GCV sensitivity test, we evaluated adequate expression of HSV-TK30 mRNA in transduced ACC and HCC cells. In vitro experiments for the EAC were confirmed in vivo in OE33 xenograft model in nude mice. GCV treatment regressed growth of tumors injected with AdHSV-TK30, histologically analyzed as necrotic tissue with presence of inflammatory infiltrates and apoptotic cells. Despite of evident tumor deterioration, the complete regression of tumor mass was not achieved. AdEGFP detection in tumor by confocal microscopy allowed us to examine the approximate quantity of EGFP-expressing tumor cells. In fact, the efficiency of AdEGFP transduction was maximal at the sites of tumor injection, whereas no fluorescence was found at the adjacent and distant parts. The reason for generally low quantity of transduced tumor mass is inability of replication of E1/E3-deleted adenoviral vectors. Thus, though they retain efficient internalization and gene transfer ability, they cannot spread to adjacent cells.

Results
102
Oncolytic adenoviral vectors that are the leading candidates for oncolytic virotherapy overcome this drawback. They are designed to replicate selectively in tumor cells, causing cell lysis and allowing for the spreading in the tumor from initial infection of only a few cells. In the context of adenoviral vector toxicity in clinical administration, our interest was emphasized on adenovirus interactions with adrenal gland. Reported adenoviral tropism for adrenal gland raised safety considerations regarding systemic use of adenoviral vectors. The adenoviral vector transduction of the adrenal gland can cause toxic effects related to alternations of intact cell physiology and functions due to immune-inflammatory reactions to vector or transgene delivery. In addition, an important issue regarding applications of gene therapy for adrenocortical carcinomas, like as for any other endocrine tumors, is the consideration of the effects of vector transduction on hormone production. There is a scarce data about effects of adenoviral-mediated gene therapy on adrenal gland. Therefore, we investigated the effects of replication-defective adenoviral vectors and replication competent wild-type adenovirus on different cell parameters, such as cell proliferation, cell cycle, steroid production and cellular expression. We confirmed high susceptibility of human adrenocortical cells to adenoviral infection in primary cultures and cell lines. The efficiency of adenoviral vector transduction carrying EGFP was at the similar level as efficiency of infection with wild-type adenovirus, confirming the internalization mechanism of replication-incompetent adenoviral vectors remains intact. To obtain additional data about adenovirus kinetics of replication in tested cells, we measured virus production over different time points postinfection. The amount of viral particles increased with time, proportional with growth characteristics of each cell line. The maximal viral titer in NCI-H295R cells was reached 6-7 day pi, since these cells divide every 5-6 days. The SW-13 cells have much shorter doubling time (2-3 days), thereby displaying the maximal viral production on the 3rd day pi. This experiment enabled us to design time course for further experiments, considering the time of maximal virus production and growth rate of cell types. To have reciprocal information, we measured cell proliferation after adenovirus infection at the same time points. Correlated results were obtained at the same MOI, showing the decrease of cell proliferation after the time points of maximal virus production. Consistently, we found the induction of S phase in infected cells, typically induced by E1A adenoviral early protein to stimulate cellular replicating machinery in order to facilitate viral replication. Finally, newly produced viral particles provoked cell death, detected as marked population of postapoptotic cells. Thus, replication and lytic potential of wild-type adenovirus represent beneficial characteristic that can be exploited to engineer oncolytic viruses for ACC. Simultaneously to wild-type adenovirus, we monitored cell proliferation also after transduction with replication-deficient adenoviral vectors AdEGFP and Adnull. We noted transient decrease of cell proliferation in NCI-H295R cells from 5-7 day pi already at lower MOIs than 50, regaining growth thereafter. Cell proliferation of SW-13 cells did not seem to be affected by adenoviral vectors at lower MOI. To simulate the titers received by cells in therapeutic viral delivery in vivo we continued with experiments using higher MOI values reaching approximately 100% and 5- to 25-fold higher infection efficiency. At MOIs higher than 50, cell proliferation was decreased

Department of Histology, Microbiology
and Medical Biotechnologies University of Padova
PhD Thesis Urška Matkovič XX Cycle 103
for 20% and 30% in SW-13 and NCI-H295R cells, respectively. Accordingly, we observed decreased cell confluence of NCI-H295R cells, but no morphological changes occurred in SW-13 cells. In fact, cytopathic effects induced by E1/E3-deleted adenoviral vectors have been described in different cell types, indicating that some citotoxic potential is retained. However, we demonstrated that the induction of phenotypic change was not transgene-specific, since it was provoked by two adenoviral vectors, carrying different transgenes (AdEGFP, AdHSV-TK30) and adenoviral vector without any transgene inserted (Adnull). Furthermore, we wondered whether decreased cell confluence is related to growth arrest or even cell death. To this end, we were able to demonstrate the induction of G2/M-arrest in cells transduced with adenoviral vectors at high MOI 100-500. With regard to cell death, NCI-H295R cells showed an increase of postapoptotic cells, whereas no effect of adenoviral infection on SW-13 was observed. The phenomenon regarding different response of SW-13 and NCI-H295R to adenoviral transduction cannot be attributed to differential transduction efficiency, since equally efficient gene transfer in both cell lines was demonstrated. Probably, it is related to different cell characteristics of the two tumor cell lines. SW-13 cell line derives from more aggressive form of ACC mutated in p53 gene and has lost the function to produce hormones, whereas NCI-H295R cells contain wild-type p53, produce hormones and retain slow growth rate. These features probably contribute to the higher sensitivity to adenoviral infection. Hence, adenoviral vectors at high MOI disturbed the cell integrity and influenced cell cycle. The molecular mechanism of these actions might include the interaction of excessive fibers released after internalization of adenoviral particles with CAR, which is responsible for tight junctions between adjacent cells. As a consequence, the cells detach, facilitating the dissemination of the virus. Adenoviral vectors have kept the intact capsid components, necessary for natural cell attachment and entry. Another factor is assumed to play important role in host cell interactions. E4 early region is not removed in first-generation adenoviral vectors and has been reported to be related to G2/M growth retardation. Since progression through cell cycle is regulated by cyclin-dependent kinases, adenoviral vectors alter cyclin protein expression. In fact, E4 gene products remaining in the E1/E3-deleted adenoviral vectors interfere with cyclin B degradation by ubiquitination or affect the activity of upstream regulators of the cyclin-B kinase complex. Degradation of cyclin B is required for passage through mitosis and subsequent division. This highly conserved mechanism of regulating G2/M transition of eucaryotic cells is a common target also for other viruses. For example, G2/M-arrest was observed in human foreskin fibroblasts infected with human cytomegalovirus and in different cells infected with human immunodeficiency virus type 1. In addition to adenovirus control to regulate cell cycle of infected cell, its major task is to regulate the cell’s apoptotic response upon adenovirus infection. Namely, induction of S phase by E1A adenoviral protein induces the tumor suppressor protein p53, which is responsible for activation of genes involved in cell-cycle arrest and apoptosis. Thus, adenovirus does not cause apoptotic cell death; conversely, adenoviral products encoded in E3 region inhibit apoptosis induced by different death ligands, such as Fas, TNF-α and TRAIL. There is only one proapoptotic protein, ADP, also encoded in E3 region, expressed in the late phase of infection. Actually, we observed the maximal increase of death cells 72 hours after infection with wild-type adenovirus. The dead cells seemed to be

Results
104
postapoptotically lysed, since they were found to be both annexinV and propidium iodide positive. The findings regarding apoptosis induction by E1 and E3-deleted adenoviral vectors in various cells are controversial. In our work, we have not found any effect on cell death provoked by adenoviral vectors at lower MOI, whereas transduction at high MOI increased postapoptotic cell fraction only in NCI-H295R cells. In a part, no apoptotic response is expected, since the global E1A transforming protein is not present in adenoviral vector genome and does not induce apoptosis. However, we assume that the induction of cell death observed at high MOI might involve some other mechanisms, probably associated either with residual adenoviral genes or capsid components and viral entry. It is to be emphasized that MOI values exceeding maximal 100% viral infectivity might account for nonspecific cell entry, not mediated by known cellular receptors as occurred in normal infection. The simultaneous entry of high viral particle quantity may disturb cell’s homeostasis. The cell resistance is certainly dependent on cell robustness and internal consistency. More aggressive tumor cells have internal citoskeletal network impaired, rendering them less susceptible for lysis. It should be noted that in our experiments we analyzed the effect of adenoviral infection on apoptosis in an in vitro experimental setting. The drawback of in vitro studies is the elimination of indirect effects, particularly those induced by the immune system. With particular attention, we studied the effect of adenoviral vectors on steroid secretion. Importantly, production of cortisol, estradiol and aldosterone was induced in MOI-dependant manner by AdEGFP. Both adenoviral vectors, AdEGFP and Adnull as well as wild-type Ad5 demonstrated similar effects on steroidogenesis. Cells incubated with LPS did not shown marked effect on hormone production, indicating the effect is adenovirus-specific. These findings also suggest that the effect of adenovirus on steroid induction might be coupled by adenovirus entry and its early gene expression, rather than its transgene or residual adenoviral expression. Adrenocortical steroid hormone biosynthesis and its regulation is a complex network of enzymatic pathways. In fact, expression of key regulators and enzymes employed in synthesis and regulation of steroid hormones was significantly modulated in cells after adenoviral infection. The global activator of steroidogenesis is steroidogenic acute regulatory protein (StAR) that facilitates intracellular uptake and intramitochondrial transfer of substrate cholesterol to be further metabolized in steroid precursors. Indeed, we found expression of StAR significantly upregulated by both adenoviral vectors and wild-type adenovirus. The induction of StAR expression in the early infection period (6h pi) indicates its response to activate steroidogenic enzyme cascade immediately after adenovirus entry. Furthermore, expression of the global negative regulator DAX1 and its antagonist SF-1 was also affected accordingly. In detail, expression of DAX1 remained unaffected at the early times pi and markedly downregulated 24h pi, whereas expression of SF-1 was upregulated. The ratio between DAX1 and SF-1 influences the expression of StAR and steroidogenic enzymes. Notably, consistent with StAR activation, the expression of two enzymes, CYP21 and CYP19, was significantly upregulated at early time point postinfection. CYP21 is important enzyme catalyzing alternative metabolization of pregnenolone to either aldosterone or cortisol-resulting pathway. CYP19 is the last enzyme involved in synthesis of estradiol from testosterone. Another pair of steroidogenic enzymes, CYP11B1 and CYP11B2, important in last steps of

Department of Histology, Microbiology
and Medical Biotechnologies University of Padova
PhD Thesis Urška Matkovič XX Cycle 105
aldosterone and cortisol production, displayed marked upregulation of expression. In detail, CYP11B1 is essential for the production of cortisol from deoxycortisol, whereas CYP11B2 is essential for deoxycorticosterone conversion to aldosterone. In addition to NCI-H295R cell line, we measured production of hormones in primary culture of human ACC. We observed significant induction of cortisol levels in cells transduced with AdEGFP. To monitor comprehensively the effects of adenoviral infection on the profile of host gene expression we used cDNA microarray technology. In this experiment, we infected SW-13 cell line with AdEGFP and analyzed global gene expression in early and late time points after infection. The Differential Regulation Analysis showed the maximal modulation in cellular gene expression early after infection (3h pi), followed by stabilization of cellular gene expression in the late phase of infection (12-24h pi). Consistent with 2D-SOM analysis, significantly upregulated genes 6h pi were mostly involved in innate immune response (interferons and proinflammatory cytokines and their receptors) and stress response (heat shock proteins and their homologs). The expression of several other genes was also increased, encoding for basic transcription and RNA processing factors, basic metabolic enzymes and mitogen-activated protein kinases. We found also some downregulated genes, encoding for cyclin binding proteins and insulin-like growth factors involved in cell cycle control and growth processes, respectively. However, the modulation of gene expression by recombinant adenovirus was moderate, confirming safety of adenoviral vectors when used at low MOI. The MOI in the microarray experiment was 15 and showed consistent negative results obtained by cell cycle and cell death experiments performed at the same MOI. In conclusion, adenoviral vectors have proven as safe and efficient gene transfer tool when used at low viral doses. In this context, they have not demonstrated any toxic effects on tested cell parameters, with only moderate gene expression alterations. Therefore, the oncolytic adenoviruses should be useful for intratumoral injection. The problem arises in the case of systemic administration, where the injection viral dose must be to 2-5-fold higher to reach the target tissue at sufficient therapeutic quantity, due to dissemination of particles in different organs. It is not clear yet, whether the effects of high adenovirus dose on host cell are caused by viral vector DNA and its residual pathogenic potential, including the presence of transgene, or by viral entry mediated by capsid components. Our experiments of steroids measurements showed no significant difference between the effect of adenoviral vectors and replication competent wild-type adenovirus, indicating the induced steroid production might be caused by viral capsids. Moreover, the modulation of cellular gene expression was found early after infection, what could be associated with adenoviral entry. Indeed, recent studies using adenovirus empty capsids strongly suggests that the cellular response to adenoviral vector infection is most likely provoked by primary step of virion infection, regardless of modifications to the vector genome.

References
106
10 REFERENCES
1. Somia N, Verma IM. Gene therapy: trials and tribulations. Nature Review Genetics 2000; 1: 91-99.
2. Friedmann T. Overcoming the obstacles to gene therapy. Scientific American 1997; 276, 6: 96-101.
3. Blaese RM. Gene therapy for cancer. Scientific American 1997; 276, 6: 111-115.4. McCornick F. Cancer gene therapy: fringe or cutting edge? Nature Review
Cancer 2001; 1: 130-141. 5. Barzon L, Boscaro M, Palù G. Endocrine aspects of cancer gene therapy.
Endocrine Reviews 2004; 25, 1: 1-44. 6. Luo D, Saltzman WM. Synthetic DNA delivery systems. Nature biotechnology
2000; 18: 33-37. 7. Kay MA, Glorioso JC, Naldini L. Viral vectors for gene therapy: the art of turning
infectious agents into vehicles of therapeutics. Nature Medicine 2001; 7, 1: 33-40.
8. Berk AJ. Adenoviridae: The viruses and their replication. Wold WSM, Horwitz MS. Adenoviruses. Fields Virology, 5th edition (LWW), 2006, 2356-2382; 2395-2417.
9. Russell WC. Update on adenovirus and its vectors. Journal of General Virology 2000; 81: 2573-2604.
10. Bird LE, Ren J, Wright A, Leslie KD, Degreve B, Balzarini J, Stammers DK. Crystal structure of varicella zoster virus thymidine kinase. The Journal of Biological Chemistry 2003; 278, 27:24680-24687.
11. Lusky M. Good Manufacturing Practice Production of Adenoviral Vectors for Clinical Trials. Human Gene Therapy 2005; 16:281–291.
12. Benihoud K, Yeh P, Perricaudet M. Adenovirus vectors for gene delivery. Current Opinion in Biotechnology 1999; 10: 440-447.
13. AdEasyTM Vector System. Application manual Version 1.4. 2002. Carlsbad, CA, Qbiogene,Inc. http://www.qbiogene.com/literature/protocols/gene-expression/pdf/m-adeasy.pdf (20. jan. 2004): 61 pp
14. Anderson RD, Haskell RE, Xia H, Roessler BJ, Davidson BL. A simple method for the rapid generation of recombinant adenovirus vectors. Gene Therapy 2000; 7: 1034-1038.
15. Bruning A, Runnebaum IB. CAR is a cell-cell adhesion protein in human cancer cells and is expressionally modulated by dexamethasone, TNF-α and TGFβ. 2003; Gene Therapy 10: 198-205.
16. Okegawa T, Pong RC, Li Y, Bergelson JM, Sagalowsky AI, Hsieh JT. The mechanism of the growth-inhibitory effect of coxsackie and adenovirus receptor (CAR) on human bladder cancer: a functional analysis of car protein structure. Cancer Research 2001; 61: 6592–6600.

Department of Histology, Microbiology
and Medical Biotechnologies University of Padova
PhD Thesis Urška Matkovič XX Cycle 107
17. Seidman MA, Hogan SM, Wendland RL, Worgall S, Crystal RG, Leopold PL. Variation in adenovirus receptor expression and adenovirus vector-mediated transgene expression at defined stages of the cell cycle. Molecular Therapy 2001; 4: 13–21.
18. Hemminki A, Kanerva A, Liu B, Wang M, Alvarez RD, Siegal GP et al. Modulation of coxsackie-adenovirus receptor expression for increased adenoviral transgene expression. Cancer Research 2003; 63: 847–853.
19. Fechner H, Haack A, Wang H, Wang X, Eizema K, Pauschinger M et al. Expression of coxsackie adenovirus receptor and alphav-integrin does not correlate with adenovector targeting in vivo indicating anatomical vector barriers. Gene Therapy 1999; 6: 1520–1535.
20. Alemany R, Curiel DT. CAR-binding ablation does not change biodistribution and toxicity of adenoviral vectors. Gene Therapy 2001; 8: 1347–1353.
21. Martin K, Brie A, Saulnier P, Perricaudet M, Yeh P, Vigne E. Simultaneous CAR-and alpha V integrin-binding ablation fails to reduce Ad5 liver tropism. Molecular Therapy 2003; 8: 485–494.
22. Smith T, Idamakanti N, Kylefjord H, Rollence M, King L, Kaloss M et al. In vivohepatic adenoviral gene delivery occurs independently of the coxsackievirus-adenovirus receptor. Molecular Therapy 2002; 5: 770–779.
23. Nicklin SA, Wu E, Nemerow GR, Baker AH. The influence of adenovirus fiber structure and function on vector development for gene therapy. Molecular Therapy 2005; 12: 384–393.
24. Smith TA, Idamakanti N, Rollence ML, Marshall-Neff J, Kim J, Mulgrew K et al. Adenovirus serotype 5 fiber shaft influences in vivo gene transfer in mice. Human Gene Therapy 2003; 14: 777–787.
25. Shayakhmetov DM, Li ZY, Ni S, Lieber A. Analysis of adenovirus sequestration in the liver, transduction of hepatic cells, and innate toxicity after injection of fibermodified vectors. Journal of Virology 2004; 78: 5368–5381.
26. Glasgow JN, Everts M, Curiel DT. Transductional targeting of adenovirus vectors for gene therapy. Cancer Gene Therapy 2006; 1-15.
27. Douglas JT, Rogers BE, Rosenfeld ME, Michael SI, Feng M, Curiel DT. Targeted gene delivery by tropism-modified adenoviral vectors. Nature Biotechnologies 1996; 14: 1574–1578.
28. Goldman CK, Rogers BE, Douglas JT, Sosnowski BA, Ying W, Siegal GP et al. Targeted gene delivery to Kaposi’s sarcoma cells via the fibroblast growth factor receptor. Cancer Research 1997; 57: 1447–1451.
29. Gu DL, Gonzalez AM, Printz MA, Doukas J, Ying W, D’Andrea M et al. Fibroblast growth factor 2 retargeted adenovirus has redirected cellular tropism: evidence for reduced toxicity and enhanced antitumor activity in mice. Cancer Research 1999; 59: 2608–2614.
References
108
30. Bauerschmitz GJ, Barker SD, Hemminki A. Adenoviral gene therapy for cancer: from vectors to targeted and replication competent agents (review). International journal of oncology 2002; 21: 1161–1174.
31. Belousova N, Korokhov N, Krendelshchikova V, Simonenko V, Mikheeva G, Triozzi PL et al. Genetically targeted adenovirus vector directed to CD40-expressing cells. Journal of Virology 2003; 77: 11367–11377.
32. Meulenbroek RA, Sargent KL, Lunde J, Jasmin BJ, Parks RJ. Use of adenovirus protein IX (pIX) to display large polypeptides on the virion-generation of fluorescent virus through the incorporation of pIX-GFP. Molecular Therapy 2004; 9: 617–624.
33. Le LP, Everts M, Dmitriev IP, Davydova JG, Yamamoto M, Curiel DT. Fluorescently labelled adenovirus with pIX-EGFP for vector detection. Molecular Imaging 2004; 3: 105–116.
34. Magnusson MK, Hong SS, Henning P, Boulanger P, Lindholm L. Genetic retargeting of adenovirus vectors: functionality of targeting ligands and their influence on virus viability. Journal of Gene Medicine 2002; 4: 356–370.
35. Gonin P, Gaillard C. Gene transfer vector biodistribution: Pivotal safety studies in clinical gene therapy development. Gene Therapy 2004; 11 (Suppl. 1), S98-S108.
36. Johnson M, Huyn S, Burton J, Sato M, and Wu L. Differential Biodistribution of Adenoviral Vector In Vivo as Monitored by Bioluminescence Imaging and Quantitative Polymerase Chain Reaction. Human Gene Therapy 2006; 17: 1262-1269.
37. Margolis G, Kilham L, Hoenig EM. Experimental adenovirus infection of the mouse adrenal gland. I. Light microscopic observations. American Journal of Pathology 1974; 75:363–74.
38. Chao J, Zhang JJ, Lin KF, Chao L. Human kallikrein gene delivery attenuates hypertension, cardiac hypertrophy, and renal injury in Dahl salt-sensitive rats. Human Gene Therapy 1998; 9:21–31.
39. Senoo M, Matsubara Y, Fujii K, Nagasaki Y, Hiratsuka M, Kure S et al. Adenovirus-mediated in utero gene transfer in mice and guinea pigs: tissue distribution of recombinant adenovirus determined by quantitative TaqMan-polymerase chain reaction assay. Molecular genetics and metabolism 2000; 69:269–76.
40. Groot-Wassink T, Aboagye EO, Glaser M, Lemoine NR, Vassaux G. Adenovirus biodistribution and non-invasive imaging of gene expression in vivo by positron emission tomography using the human sodium/iodide symporter as a reporter gene. Human Gene Therapy 2002;13:1723–35.
41. Wang Y, Groot-Wassink T, Lemoine NR, and Vassaux G. Cellular characterization of the tropism of recombinant adenovirus for the adrenal glands. European Journal of Clinical Investigation 2003; 33, 794–798.
Department of Histology, Microbiology
and Medical Biotechnologies University of Padova
PhD Thesis Urška Matkovič XX Cycle 109
42. Stauber E, Card C. Experimental intraamnionic exposure of bovine fetuses with subgroup 2, type 7 Adenovirus. Canadian Journal Comparative Medicine 1978; 42: 466-472.
43. Cutlip RC, McClurkin AW. Leisons and pathogenesis of disease in young calves experimentally induced by a bovine adenovirus type 5 isolated from a calf with weak calf syndrome. American journal of veterinary research 1975; 36: 1095-1098.
44. Medvedev N, Shastina GV. Morphology of the adrenal cortex in infants with generalized adenovirus infections. Arkhiv patologii 1978; 40: 32-36.
45. Alesci S, Ramsey WJ, Bornstein SR, Chrousos GP, Hornsby PJ, Benvenga S, Trimarchi F, Ehrhart-Bornstein M. Adenoviral vectors can impair adrenocortical steroidogenesis: clinical implications for natural infections and gene therapy. Proc Natl Acad Sci U S A. 2002;99:7484-9.
46. Tajima T, Okada T, Ma XM, Ramsey W, Bornstein S, Aguilera G. Restoration of adrenal steroidogenesis by adenovirus-mediated transfer of human cytochrome P450 21-hydroxylase into the adrenal gland of 21-hydroxylase-deficient mice. Gene Therapy 1999; 6: 1898-1903.
47. Ma L, Bluyssen HAR, Raeymaeker M, Laurysens V, Beek N, Pavliska H, Zonneveld AJ, Tomme P. Rapid determination of adenoviral vector titers by quantitative real-time PCR. Journal of Virological Methods 2001; 93: 181-188.
48. Stilwell JL, Samulski JS. Role of viral vectors and virion shells in cellular gene expression. Molecular Therapy 2003; 9, 3.
49. Wersto RP, Rosenthal ER, Seth PK, Eissa NT, Donahue RE. Recombinant, replication-defective adenovirus gene transfer vectors induce cell cycle dysregulation and inappropriate expression of cyclin proteins. Journal of Virology 1998; 9491-9502.
50. Greco O, Dachs GU. Gene directed enzyme/prodrug therapy of cancer: historical appraisal and future prospectives. Journal of Cellular Physiology 2001; 187: 22-36.
51. Barzon L, Pacenti M, Boscaro M, Palù G. Gene therapy for thyroid cancer. Expert opinion on biological therapy 2004; 4:1225-1239.
52. Brand K, Klocke R, Possling A, Paul D, Strauss M. Induction of apoptosis and G2/M arrest by infection with replication-deficient adenovirus at high multiplicity of infection. Gene Therapy 1999; 6:1054-63.
53. Scibetta AG, Copier J, Barrett A, Chaplin T, Taylor-Papadimitriou J. Gene expression changes induced by a recombinant E1-/E3- adenovirus type 5 vector in human mammary epithelial cells. Intervirology 2005; 48: 350-61.
54. Ramalingam R, Rafii S, Worgall S, Hackett NR, Crystal RG. Induction of endogenous genes following infection of human endothelial cells with an E1(-) E4(+) adenovirus gene transfer vector. Journal of Virology 1999; 73:10183-90.

References
110
55. Clesham GJ, Adam PJ, Proudfoot D, Flynn PD, Efstathiou S, Weissberg PL: High adenoviral loads stimulate NF κB-dependent gene expression in human vascular smooth muscle cells. Gene Therapy 1998; 5: 174–180.
56. Lieber A, He CY, Meuse L, Schowalter D, Kirillova I, Winther B, Kay MA: The role of Kupffer cell activation and viral gene expression in early liver toxicity after infusion of recombinant adenovirus vectors. Journal of Virology 1997; 71: 8798–8807.
57. McElvaney NG, Crystal RG: IL-6 release and airway administration of human CFR cDNA adenovirus vector. Nature Medicine 1995; 1: 182–184.
58. Zhao H, Granberg F, Elfi neh L, Pettersson U, Svensson C: Strategic attack on host cell gene expression during adenovirus infection. Journal of Virology 2003; 77: 11006–11015.
59. Schnell MA, Zhang Y, Tazelaar J, Gao GP, Yu QC, Qian R, Chen SJ, Varnavski AN, LeClair C, Raper SE, Wilson JM. Activation of innate immunity in nonhuman primates following intraportal administration of adenoviral vectors. Molecular Therapy 2001; 3, 708-22.
60. Zhang Y, Chirmule N, Gao GP, Qian R, Croyle M, Joshi B, Tazelaar J, Wilson JM. Acute cytokine response to systemic adenoviral vectors in mice is mediated by dendritic cells and macrophages. Molecular Therapy 2001; 3, 697-707.
61. Driesse MJ, Esandi MC, Kros JM, Avezaat CJ, Vecht C, Zurcher C, van der Velde I, Valerio D, Bout A, Sillevis Smitt PA. Intra-CSF administered recombinant adenovirus causes an immune response-mediated toxicity. Gene Therapy 2000; 7, 1401-9.
62. Liu Q, Zaiss AK, Colarusso P, Patel K, Haljan G, Wickham TJ, Muruve DA. The role of capsid-endothelial interactions in the innate immune response to adenovirus vectors. Human Gene Therapy 2003; 14:627-43.
63. Zaiss AK, Liu Q, Bowen GP, Wong NC, Bartlett JS, Muruve DA. Differential activation of innate immune responses by adenovirus and adeno-associated virus vectors. Journal of Virology 2002; 76: 4580-90.
64. Sargent CA, Dunham I, Trowsdale J, Campbell RD. Human major histocompatibility complex contains genes for the major heat shock protein HSP70. Proc Natl Acad Sci USA 1989; 86: 1968-1972.

Department of Histology, Microbiology
and Medical Biotechnologies University of Padova
PhD Thesis Urška Matkovič XX Cycle 111
11 ACKNOWLEDGEMENTS I sincerely thank my supervisor prof. Giorgio Palù for coordination and supervision of my PhD work. In particular, I would like to thank my co-supervisor dott.ssa Luisa Barzon for her invaluable support and critical review of my work. Lots of thanks also to my colleagues for technical assistance and working company. At last, but not the least, I thank my husband David Marko, who has always stood by my side. Yeah, he was actually the one, who brought me in Padova, where all the story began!