construction industry council !§ ref ere nee material for
TRANSCRIPT

CONSTRUCTION
INDUSTRY COUNCIL
�!§���
Ref ere nee Material for
Design and Assessment of Bridges in Regions of Low to Moderate Seismicity
– The Hong Kong Context

Reference Material for Design and Assessment of Bridges in Regions of Low to Moderate Seismicity –
The Hong Kong Context
Authors
Prof. Francis T.K. AU The University of Hong Kong
Dr. Ting HUANG The University of Hong Kong
Dr. Jiang YI The University of Hong Kong
Mr. Ce LI The University of Hong Kong
Prof. Nelson T.K. LAM The University of Melbourne
Dr. Rui-Juan JIANG Shenzhen Municipal Design and
Research Institute
Disclaimer
Whilst reasonable efforts have been made to ensure the accuracy of the information contained in this
publication, the CIC nevertheless would encourage readers to seek appropriate independent advice
from their professional advisers where possible and readers should not treat or rely on this publication
as a substitute for such professional advice for taking any relevant actions.
Enquiries
Any enquiries may be made to the CIC Secretariat at: CIC Headquarters
38/F, COS Centre, 56 Tsun Yip Street, Kwun Tong, Kowloon, Hong Kong
Tel: (852) 2100 9000
Fax: (852) 2100 9090
Email: [email protected]
Website: www.cic.hk
© 2019 Construction Industry Council

I
FOREWORD
Hong Kong lies within the Eurasian Plate and is fortunate to be relatively remote from the
Pacific Ring of Fire where many of the strongest earthquakes have occurred. Although the
seismicity of Hong Kong is regarded as low to moderate, as a densely populated area in the
region, Hong Kong has been preparing itself for possible earthquake hazards through a series
of coordinated investigations. They include studies of seismic hazard in Hong Kong, review of
earthquake data for the Hong Kong region and the subsequent studies on the introduction of
seismic-resistant building design code for Hong Kong. The release of the 2013 version of
Structures Design Manual for Highways and Railways, which has incorporated the state-of-
the-art seismic design methodology of bridges, is a major step forward.
This design guide entitled “Design and Assessment of Bridges in Regions of Low to Moderate
Seismicity – The Hong Kong Context” has been written to assist practitioners to appreciate the
seismic provisions adopted in Structures Design Manual for Highways and Railways 2013
from a holistic perspective, and to understand the fundamentals and up-to-date analytical
techniques in the earthquake resistant design and assessment of bridges.
Since the establishment of The University of Hong Kong and the Faculty of Engineering in
1912, the Department of Civil Engineering has nurtured many brilliant leaders in the civil
engineering discipline and made significant contributions to the local, Mainland China and
overseas community. The Department is constantly looking ahead to enhancing its goals in
education, research and community services in order to keep abreast of the ever-changing
demands of modern society. In addition to offering a broad range of internationally competitive
academic programmes and conducting high-impact research relevant to the needs of industry
and society, the Department is also committed to supporting the industry and society through
technology transfer and other forms of professional services.
I congratulate Prof. Francis T.K. Au for his leadership and visionary blueprint in developing
this design guide to promote technological advancement in sustainable infrastructure
development in Hong Kong. It is also a worthwhile effort that will surely benefit the
engineering profession.
Christopher CHAO
Chair Professor of Mechanical Engineering
Dean of Engineering
The University of Hong Kong

II
PREFACE
This design guide has stemmed from release of the 2013 version of Structures Design Manual
for Highways and Railways, which has underscored commitments of the Government of Hong
Kong Special Administrative Region to enhancement of the civil infrastructure in respect of
seismic design. With Structures Design Manual for Highways and Railways 2013 taking effect,
the seismic design of bridges in Hong Kong has been elevated to the international standard as
exemplified by the structural Eurocodes. The increase from the previous nominal ground
acceleration of 0.05g (where g is the acceleration due to gravity) to reference peak ground
acceleration of 0.12g together with possible amplification due to subsoil conditions implies
that the current design seismic action can be many times that of the previous value. Even though
the scenarios with design seismic actions may or may not be those controlling the design of a
particular structure, the aforementioned enhancement of the design code will call for a
complete revamp of design strategies instead of just allowing for a higher design seismic action
purely based on strength consideration as in the previous simplistic design approach. Proper
seismic design should address not only strength and stiffness, but also ductility and
deformability in order to achieve safety under extreme events. To help ensure a smooth
transition to the state-of-the-art seismic design methodology, it is desirable to develop a user-
friendly set of practical guidance that allows engineers to make informed decisions even from
the initial conceptual design stage for compliance with the current requirements.
With the support of the Construction Industry Council of Hong Kong, together with
contributions from members of the research team in the past 36 months, this design guide has
been prepared taking into account the local conditions and specific design requirements,
established engineering practices including those prevalent locally, in Mainland China and
overseas, effective measures to ensure seismic resistance, buildability, increased use of
prefabrication for better quality assurance and economy, as well as practicality of long-term
asset management and maintenance. I sincerely hope that readers find this design guide useful.
Francis T.K. AU
Professor and Head
Department of Civil Engineering
The University of Hong Kong

III
ACKNOWLEDGEMENTS
The authors would like to take this opportunity to thank the Construction Industry Council of
Hong Kong for providing financial support and useful suggestions for this project. The authors
would also like to express their deepest appreciation to the Highways Department of the
Government of Hong Kong Special Administrative Region for providing some records of
existing bridge structures as well as sharing with them useful feedback on their work. In
addition, the Highways Department has kindly given permission to the Research Team to use
their photographs of Tsing Ma Bridge and Kap Shui Mun Bridge. The assistance and advice
from the following organisations (in alphabetical order) are also greatly appreciated:
AECOM
Arup
Chun Wo Development Holdings Limited
CWF Piling & Civil Engineering Co. Ltd.
Kwok & Koehler Engineering Ltd.
Mannings (Asia) Consultants Limited
Mass Transit Railway Corporation Limited

IV
EXECUTIVE SUMMARY
This design guide has been prepared in response to the recent adoption of Structures Design
Manual for Highways and Railway 2013 (SDMHR 2013), aiming to facilitate a smooth
transition to the state-of-the-art seismic design methodology as introduced by the structural
Eurocodes and to encourage a holistic approach from the initial conceptual design stage for
compliance with the current requirements. It compares the performance requirements and the
corresponding design seismic hazard levels currently adopted by SDMHR 2013 in relation to
those used by other countries and regions. It organizes the seismic bridge design specifications
as prescribed in the Eurocodes BS EN 1998-1 and BS EN 1998-2 with modifications by
SDMHR 2013, where relevant, in a logical manner and also provides guidance on the choice
of earthquake-resisting systems, articulations and intended seismic behaviour based on the
established engineering practices in other countries and regions as well as some additional
findings of this project. The topics covered in each chapter are as follows:
Chapter 1 introduces the background of this design guide, highlighting the major revisions of
SDMHR 2013 on seismic bridge design as compared to the earlier SDMHR 3rd edition, and
identifies the typical characteristics of existing bridges in Hong Kong that form the basis of
this design guide.
Chapter 2 presents a general introduction to the seismic design of bridges based on a
comprehensive review of several major seismic bridge design codes from other countries
and/or regions, including their development history, design philosophy, major compliance
approaches, methods of seismic demand analysis, and representation of seismic action.
Chapter 3 summarizes the seismic bridge design specifications for Hong Kong, including those
for highway and railway bridges, in a sequential order of seismic design procedures followed
by a flowchart.
Chapter 4 provides guidance on the seismic design of new bridges at the conceptual design
stage in respect of the selection of earthquake-resisting systems, articulations, configurations
and intended seismic behaviour, i.e. elastic, limited-ductile or ductile behaviour, by examining
the relation between the choices and the design and response of structures under seismic actions.
Chapter 5 describes the preliminary compliance assessments of typical existing highway
bridges (previously designed to older codes) with reference to the current requirements of
SDMHR 2013 in regard to the design seismic actions and structural details. It then presents the
methodologies for performance-based seismic structural assessment of bridges and the
development of fragility curves of some typical classes of bridges in Hong Kong for the
purpose of rating of existing bridges.
Chapter 6 presents some of the latest trends of bridge engineering in respect of material,
construction method and structural system, with special emphasis on the implications of these
developments on seismic bridge design and retrofitting.

V
CONTENTS
FOREWORD............................................................................................................................ I
PREFACE ................................................................................................................................ II
ACKNOWLEDGEMENTS ................................................................................................. III
EXECUTIVE SUMMARY .................................................................................................. IV
CONTENTS............................................................................................................................. V
LIST OF FIGURES ........................................................................................................... VIII
LIST OF TABLES ................................................................................................................. XI
BACKGROUND
Bridges in Hong Kong .............................................................................................13
Development history ........................................................................................13
Structural forms ...............................................................................................15
Small- to medium-span bridges .......................................................................19
Revision of Structures Design Manual for Highways and Railways .......................23
General .............................................................................................................23
Revised seismic intensity .................................................................................25
From static approach to dynamic approach .....................................................26
From elastic design to ductile design ...............................................................26
Aims and Scope of this Guide .................................................................................27
Aims .................................................................................................................27
Scope ................................................................................................................28
INTRODUCTION TO SEISMIC DESIGN OF BRIDGES
Lessons Taught by Past Earthquakes .......................................................................29
Seismic Performance Requirements for Bridges .....................................................30
Seismic Design Strategies ........................................................................................32
Seismic Design Methodologies................................................................................33
Force-based method .........................................................................................33
Displacement-based method ............................................................................35
Methods of Demand Analysis ..................................................................................36
Single-mode response spectrum analysis .........................................................37
Response spectrum analysis .............................................................................37
Pushover analysis .............................................................................................38

VI
Nonlinear time-history analysis .......................................................................38
Representation of Seismic Action ............................................................................38
Seismic hazard analysis ...................................................................................38
Site response ....................................................................................................40
Representation of seismic action .....................................................................42
Determination of seismic parameters for Hong Kong .....................................45
SEISMIC BRIDGE DESIGN SPECIFICATIONS FOR HONG KONG
Introduction ..............................................................................................................48
Design Seismic Action .............................................................................................49
Elastic response spectrum ................................................................................49
Design spectrum for elastic analysis ................................................................52
Seismic Demand Analysis ........................................................................................53
Method of analysis ...........................................................................................53
Loading ............................................................................................................53
Modelling .........................................................................................................54
Design and Capacity Verification ............................................................................56
Strength verification .........................................................................................56
Deformation verification ..................................................................................58
Seismic Relevant Detailing ......................................................................................58
Confinement for concrete and main bars .........................................................58
Overlap length and clearance ...........................................................................59
Bearings and seismic links ...............................................................................60
Foundation Design ...................................................................................................60
Limit states .......................................................................................................60
Basis of design .................................................................................................61
Summary of Procedures for Seismic Design of Highway Bridges ..........................65
Seismic Design of Railway Bridges ........................................................................66
GUIDANCE FOR SEISMIC DESIGN OF NEW BRIDGES
Structural Forms.......................................................................................................70
Earthquake resisting system .............................................................................70
Articulation ......................................................................................................73
Desirable characteristics ..................................................................................74
Intended Seismic Behaviour ....................................................................................75
Structural design of pier under different design ..............................................75

VII
Full-range behaviour of pier under different design ........................................82
Piled foundation under different design ...........................................................84
Conclusions ......................................................................................................89
SEISMIC ASSESSMENT OF EXISTING BRIDGES
Compliance of Existing Bridges ..............................................................................90
Typical characteristics of existing bridges .......................................................90
Seismic action based on SDMHR 3rd and SDMHR 2013: Parametric study ..92
Assessment of structural details in existing bridges ........................................96
Summary ........................................................................................................103
Seismic Assessment of Existing Bridges ...............................................................104
Philosophy......................................................................................................104
Assessment criteria ........................................................................................105
Performance-based seismic assessment ......................................................... 111
Nonlinear time-history analysis ..................................................................... 118
Seismic Fragility Analysis .....................................................................................123
Methodology for fragility analysis .................................................................123
Seismic fragility analysis of existing bridges in Hong Kong ........................124
RECENT TREND OF BRIDGE ENGINEERING
Construction Materials ...........................................................................................136
High-strength concrete ...................................................................................136
High-performance concrete ...........................................................................137
Accelerated Bridge Construction ...........................................................................137
Prefabrication .................................................................................................138
Innovative construction methods ...................................................................142
Resilient Structural Systems ..................................................................................143
Self-centring system.......................................................................................143
Floating articulation .......................................................................................144
Design for Maintainability .....................................................................................146
REFERENCES

VIII
LIST OF FIGURES
Figure 1.1 Canal Road Flyover ................................................................................................ 14
Figure 1.2 Kwun Tong Bypass ................................................................................................ 15
Figure 1.3 A tied arch footbridge at Wong Tai Sin ................................................................. 16
Figure 1.4 A truss footbridge over Kwun Tong Road ............................................................. 16
Figure 1.5 A typical girder bridge ............................................................................................ 17
Figure 1.6 Tsing Ma Bridge ..................................................................................................... 17
Figure 1.7 Kap Shui Mun Bridge ............................................................................................. 18
Figure 1.8 Pedestrian cable-stayed bridge over West Kowloon Highway at Olympic ........... 18
Figure 1.9 Illustration for typical design process ..................................................................... 19
Figure 1.10 Common bridge forms of small- to medium-span bridges in Hong Kong ........... 20
Figure 1.10 Common bridge forms of small- to medium-span bridges in Hong Kong (continued)
......................................................................................................................................... 21
Figure 1.11 Common types of bearings ................................................................................... 21
Figure 1.12 Flyovers over Castle Peak Road ........................................................................... 22
Figure 1.13 Typical span lengths for common structural forms .............................................. 23
Figure 1.14 Typical carriageway widths for common structural forms ................................... 23
Figure 2.1 Determination of design seismic force in force-based method .............................. 34
Figure 2.2 Ground type classification by average shear wave velocity ................................... 41
Figure 2.3 Shape of the elastic acceleration response spectrum .............................................. 43
Figure 2.4 Normalized horizontal elastic response spectrum defined in different codes for (a)
Rock site; (b) Very dense/stiff soil site; and (c) Loose/soft soil site ............................... 44
Figure 3.1 Definition of horizontal elastic response spectrum adopted by SDMHR 2013 ..... 49
Figure 3.2 Horizontal elastic response spectra with ξ = 5% for the five basic sites ................ 50
Figure 3.3 Definition of vertical elastic response spectrum adopted by SDMHR 2013 .......... 52
Figure 3.4 Moment-curvature relationship of cross-section for reinforced concrete .............. 55
Figure 3.5 Capacity design moments MC within the member cotaining plastic hinge(s) ........ 57
Figure 3.6 Illustration for design by calculation ...................................................................... 62
Figure 3.7 Procedures for seismic design of highway bridges based on SDMHR 2013 ......... 66
Figure 3.8 Design response spectra for typical ground types .................................................. 68
Figure 4.1 Design moments intended for different seismic behaviour .................................... 77
Figure 4.2 Longitudinal reinforcement ratio intended for different behaviour ....................... 79
Figure 4.3 Moment-curvature relationship of base section for the pier with normalized axial
force of 0.093, height of 9 m and monolithic connection to the deck ............................. 80
Figure 4.4 Transverse reinforcement ratio intended for different behaviour ........................... 81

IX
Figure 4.5 Shear capacity and demand relation of pier ........................................................... 84
Figure 4.6 Full-range behaviour of ductile and limited ductile piers in terms of normalized
displacement capacity factor ............................................................................................ 84
Figure 4.7 Piled foundation studied ......................................................................................... 85
Figure 4.8 Relation of the size and reinforcement amount of pile between ductile design of
bridge and limited ductile or elastic design of bridge ...................................................... 87
Figure 4.9 Reduction effects on size and reinforcement amount of pile by ductile design of
bridge with the seismic risk ............................................................................................. 88
Figure 4.10 Reduction effects on size and reinforcement amount of pile by ductile design of
bridge with the bridge stiffness ........................................................................................ 89
Figure 5.1 Typical configurations of existing bridges in Hong Kong ..................................... 92
Figure 5.2 Fundamental periods of sample bridges ................................................................. 94
Figure 5.3 RSAs of sample bridges with Importance Class I and Ground Type A ................. 96
Figure 5.4 RSAs of sample bridges with Importance Class III and Ground Type D .............. 96
Figure 5.5 Premature buckling of longitudinal reinforcement in piers: (a) buckling between
adjacent hoops; and (b) buckling across several hoops ................................................... 98
Figure 5.6 Failure modes of RC column: (a) flexural failure; (b) flexural-shear failure; and (c)
brittle shear failure ........................................................................................................... 98
Figure 5.7 Curvature ductility of column section with and without lap-splicing of main bars99
Figure 5.8 Bridge with half joints .......................................................................................... 101
Figure 5.9 Torsional effect of bridge deck under transverse seismic excitation ................... 103
Figure 5.10 Residual deformation index (RDI) and equivalent damping ratio (ξeq) for
symmetric hysteresis loops ............................................................................................ 108
Figure 5.11 Residual deformation index (RDI) and equivalent damping ratio (ξeq) for
asymmetric hysteresis loops .......................................................................................... 108
Figure 5.12 The “fibre section” model of a bridge pier ......................................................... 112
Figure 5.13 Moment-curvature curve of a pier section .......................................................... 112
Figure 5.14 Plastic hinge methods ......................................................................................... 113
Figure 5.15 Interaction between flexure and shear ................................................................ 114
Figure 5.16 Capacity-demand analysis: (a) Acceleration-displacement response spectrum; and
(b) Determination of demand ......................................................................................... 115
Figure 5.17 Capacity-demand analysis for Bridge T026-S095-C058 ................................... 117
Figure 5.18 Capacity-demand analysis for Bridge T062-S368-C122 ................................... 118
Figure 5.19 Model for the unbonded laminated elastomeric bearing with and without sliding
bearing ........................................................................................................................... 119
Figure 5.20 Model for steel dowel ......................................................................................... 119
Figure 5.21 Model for pounding ............................................................................................ 120
Figure 5.22 SAP2000 line beam model for the bridge .......................................................... 121

X
Figure 5.23 Most unfavourable stress-strain response of concrete fibre at Pier #4 ............... 122
Figure 5.24 Comparison of response spectra of selected ground motions and the design
response spectra (BS EN 1998-2 Type 2 spectra with a return period of 475 years) .... 129
Figure 5.25 Regression analysis of seismic demands on the bridge components of MSSB . 130
Figure 5.26 Regression analysis of seismic demands on the bridge components of MSCB . 131
Figure 5.27 Component fragility curves for the existing MSSB ........................................... 133
Figure 5.28 Component fragility curves for the exiting MSCB ............................................ 134
Figure 6.1 Design compressive stress-strain relations for concrete based on SDMHR 2013 136
Figure 6.2 Illustration of composite bridge with corrugated steel webs ................................ 137
Figure 6.3 Precast column-to-footing connection using grouted sleeve coupler ................... 140
Figure 6.4 Exploded view of HfL precast bent concept ........................................................ 140
Figure 6.5 Joint construction of the CIP region ..................................................................... 141
Figure 6.6 Schematic view of modular precast segmental bridge pier .................................. 142
Figure 6.7 Two DADs for column-to-foundation connection: (a) internal dissipation; and (b)
external dissipation ........................................................................................................ 144
Figure 6.8 Bearing articulation: (a) conventional; and (b) floating ....................................... 145
Figure 6.9 Hybrid bearing system .......................................................................................... 146
Figure 6.10 Abutment gallery ................................................................................................ 148
Figure 6.11 Jacking place ...................................................................................................... 148

XI
LIST OF TABLES
Table 1.1 Key differences for seismic design between SDMHR 3rd and SDMHR 2013 ....... 25
Table 1.2 Importance Classes and Importance Factors specified by SDMHR 2013 ............... 26
Table 2.1 Performance requirements and corresponding design motion levels for seismic bridge
design adopted in different codes .................................................................................... 31
Table 2.2 Recommended allowable maximum member ductility for ductile reinforced concrete
members as specified by different codes ......................................................................... 36
Table 2.3 Common methods for seismic response analysis .................................................... 37
Table 3.1 Values of parameters describing the Type 2 horizontal elastic response spectrum . 50
Table 3.2 Elastic response spectral acceleration for 10% probability of exceedance in 50 year
......................................................................................................................................... 51
Table 3.3 Values of parameters describing the Type 2 vertical elastic response spectrum ..... 52
Table 3.4 Definition of foundation modelling method ............................................................ 56
Table 3.5 Resistance verification criteria of concrete sections ................................................ 57
Table 3.6 General design requirements set out in BS EN 1997-1 ........................................... 61
Table 3.7 Comparison between BS 8004:1986 and BS EN 1997-1 on design requirements .. 61
Table 3.8 Partial factor sets for ULS foundation design based on BS EN 1997-1 .................. 64
Table 3.9 Requirements for confining reinforcement .............................................................. 69
Table 4.1 Earthquake resisting elements ................................................................................. 72
Table 4.2 Permissible earthquake resisting systems ................................................................ 72
Table 4.3 Summary of parameters of piers .............................................................................. 76
Table 4.4 1-sec period design spectral acceleration coefficient for Hong Kong ..................... 82
Table 4.5 Pier design intended for ductile and limited ductile behaviour ............................... 83
Table 4.6 Design action effects for pier and foundation (Importance Class II and Ground Type
C) ..................................................................................................................................... 86
Table 4.7 Results of pile design for elastic, limited ductile and ductile design of bridge ....... 87
Table 5.1 Vulnerable members and possible failure modes .................................................. 104
Table 5.2 Bridge performance levels and criteria .................................................................. 106
Table 5.3 Threshold values of some indices at selected performance levels ......................... 109
Table 5.4 Performance strain limits ....................................................................................... 110
Table 5.5 Calibrated performance strain limits ...................................................................... 110
Table 5.6 Information of example bridges ............................................................................. 116
Table 5.7 Performance requirements for bridges based on SDMHR 2013 ........................... 116
Table 5.8 Representative bridge geometry ............................................................................ 125
Table 5.9 Significant parameters considered in the fragility analysis ................................... 126
Table 5.10 Definition of damage states for bridge components ............................................ 128

XII
Table 5.11 Estimates of probabilistic seismic demand models ............................................. 132
Table 5.12 Bridge system fragility curves for existing bridges ............................................. 135
13
BACKGROUND
Hong Kong has a highly developed and sophisticated transportation network with
approximately 2,101 km of roads, supporting 732,000 vehicles, and densely packed on its 1,104
sq. km of territory. Any disruption to the transportation network is likely to cause significant
social and economic impact. Earthquake damage in recent decades around the world has
revealed that bridges are one of the most vulnerable components of the transportation system
under seismic actions. As of September 2016, there are 775 footbridges and 1,351 road bridges
that form essential components of the highway network of Hong Kong (Highways Department,
2016a, 2016c). Based on the Travel Characteristics Survey of the Hong Kong Government,
over 90% of the journeys made are by public transport, in which railway transportation
accounts for 41% (Highways Department, 2016b). Although much of the railway system runs
in underground tunnels, some viaducts above ground still carry part of the railway traffic.
Furthermore, two iconic long-span bridges, i.e. Tsing Ma Bridge and Kap Shui Mun Bridge,
carry the Airport Express Line on their lower decks. It is therefore essential that these bridges
shall be designed for sufficient earthquake resistance.
The release of Structures Design Manual for Highways and Railways 2013 (SDMHR 2013)
(Highways Department 2013) that follows the paradigm shift from the British Standards to the
Eurocodes has significant impact on the design of new bridge structures and modification of
the existing structures, especially in respect of the seismic design. For new bridges, there are
differences in both analysis and design as compared to those in accordance with SDMHR 3rd
edition. To reap the full benefits of the contemporary seismic design methodology as
exemplified by the structural Eurocodes, practising engineers need to upgrade their mindset
and design approach. For the existing bridges designed to earlier codes, the concern is whether
they would perform satisfactorily at the level of seismicity as specified in the new code.
Strengthening may be necessary in case the necessary level of seismic resistance is not reached.
This chapter attempts to set the basis for practical guidelines for seismic design and assessment
of bridges in Hong Kong. Section 1.1 presents an overview of the bridges in Hong Kong,
including the development history, prevalent structural types and characteristics. The seismic
performance of bridges depends largely on the structural properties of bridge and seismology
at the bridge site. Identifying and characterizing typical bridges is critical for derivation of the
seismic behaviour of representative bridges and development of regional bridge fragility curves
applicable to Hong Kong. Section 1.2 reviews the major revisions of seismic bridge design
provisions brought about by SDMHR 2013, focusing on the upgrade of design seismic intensity
and design philosophy. Finally, Section 1.3 describes the aims and scope of this design guide.
Bridges in Hong Kong
Development history
The major phase in the development history of the built environment in Hong Kong dated back
to the 1950s, when the rapid economic and urban development in the post-war period
necessitated the development of transport infrastructure. Highways and bridges were needed
to improve the accessibility to the new towns and new areas developed to accommodate the
booming population. Before the 1960s, footbridges were built mainly to cross difficult terrains.
However, the rapid urban development then led to the need for grade separation of pedestrian
and road traffic for efficiency. The first footbridge for such a purpose was constructed in 1963,
crossing Leighton Road near Victoria Park (Highways Department, 2016a). During this period,
cast in-situ span-by-span method was commonly used for road bridge construction.

14
The 1970s saw the first generation of Mass Transit Railway development. The first line
connecting Shek Kip Mei to Kwun Tong was opened in 1979. Part of the line is supported on
viaducts. Furthermore, the new town development continued to grow in the New Territories
with the demand for new roads and associated bridges (Highways Department, 2016c). The
cast in-situ balanced cantilever construction method was first used in the 1970s. The Tsing Yi
Bridge (now known as Tsing Yi South Bridge), opened in 1974, was the first bridge in Hong
Kong built using this method. The Tsing Yi Bridge, connecting Tsing Yi Island with Kwai
Chung, contributed greatly to the development of Tsing Yi Island (Highways Department,
2016c). Another example was the Ap Lei Chau Bridge, which was opened in 1980. Both of
these bridges cross over navigation channels, making cast in-situ balanced cantilever a more
suitable construction method than the span-by-span method. The use of precast components
also started in the 1970s. A commonly used structural form since the 1970s involved the use of
precast beams with cast in-situ concrete slab. The precast beams may be I-beams or U-beams.
The first instance of its use in Hong Kong was Canal Road Flyover, which was opened in 1972.
Figure 1.1 shows Canal Road Flyover, where the precast I-beams placed at regular intervals
can be seen clearly.
Figure 1.1 Canal Road Flyover
In the late 1980s, precast segmental construction method was first used in Kwun Tong Bypass
(Figure 1.2), which was opened in stages from 1989 to 1991. This method is a variation of the
cast in-situ balanced cantilever construction method to facilitate faster construction with less
disruption to the traffic below, yet it overcomes the limitation on span length that precast span-
by-span method will normally have. Moreover, footbridges also evolved from simple crossings
to elevated walkway systems (Highways Department, 2016c).

15
Figure 1.2 Kwun Tong Bypass
There were barely any long-span bridges before the 1990s. The 1990s saw the construction of
several long-span bridges, including Tsing Ma Bridge (a suspension bridge), Kap Shui Mun
Bridge (a cable-stayed bridge) and Ting Kau Bridge (also a cable-stayed bridge). These bridges
serve to connect the new Hong Kong International Airport to the rest of Hong Kong and to
facilitate the Territorial Development Strategy. In addition to the long-span bridges, viaducts
were erected for the same purpose, such as West Kowloon Expressway, North Lantau
Expressway and Tsing Yi North Coastal Road.
The major bridges completed in the 2000s include Stonecutters Bridge and Shenzhen Bay
Bridge. The Shenzhen Bay Bridge, a 5.5 km long dual three-lane carriageway bridge opened
in 2007, serves as the fourth vehicular boundary crossing between Hong Kong and Mainland
China. The bridge consists of a series of concrete viaducts and two cable-stayed bridges above
the navigation channels. Stonecutters Bridge is a cable-stayed bridge with a main span of 1,018
m and two back spans of 289 m. It was one of the two bridges of its form with a main span in
excess of 1,000 m upon its completion in 2009.
In the 2010s, one of the major infrastructure projects involving bridge construction is the Hong
Kong–Zhuhai–Macao Bridge.
Structural forms
The design of a bridge is governed by many factors, including but not limited to its intended
functions, the site constraints, the materials and labour available, economy and aesthetics.
Though each bridge takes on its unique form, all bridges boil down to several basic types, some
of which found in Hong Kong are described below.
(1) Arch Bridges
An arch is a curved member supported in such a way that intermediate transverse loads are
transmitted to the supports primarily by axial compressive forces in the arch rib. The arch
system efficiently utilizes the compressive strength of materials that are strong in compression
but possibly weak in tension, such as concrete and masonry. Arch bridges can also be built of
steel.
While arch bridges have been built since antiquity, it is not a structural system commonly seen
in Hong Kong mainly because of the need for supports capable of providing sufficient

16
horizontal thrust. Nevertheless, tied arch bridges are used in some footbridges (Figure 1.3).
Figure 1.3 A tied arch footbridge at Wong Tai Sin
(2) Truss Bridges
A truss is a triangulated assembly of straight members. The applied loads are resisted primarily
by axial forces in the truss members. As the truss members may take tension or compression,
most truss bridges are made of steel.
Although very few road bridges in Hong Kong are purely of truss form, trusses are often used
as the stiffening girders of suspension bridges for their rigidity and lightness. Moreover, a
significant proportion of footbridges in Hong Kong are of truss form due to its efficient use of
material and lightness (Figure 1.4).
Figure 1.4 A truss footbridge over Kwun Tong Road
(3) Girder Bridges
Girder bridges, which primarily utilize the bending and shearing actions of the decks, have
been the most commonly used structural system for a few decades. Multi-span viaducts are
typical examples of this structural form. There may be many possible variations in respect of
the articulation. Many of the early girder bridges are either made up of a series of simply
supported spans or of Gerber beam configuration comprising numerous half joints. Although
their design is relatively simple, maintenance may not be convenient. With the growing
awareness of the need for convenience of maintenance and its cost, continuity is often preferred
in the modern design of girder bridges. The girder can take on a great variety of forms and
materials. Commonly used structural systems include steel plate girders, composite steel and
concrete construction, prestressed concrete box girders, etc. Many design approaches are
possible in the connections between the bridge deck and substructures, and they may affect the
seismic performance of the whole bridge. Figure 1.5 shows an example of a girder bridge.

17
Figure 1.5 A typical girder bridge
(4) Suspension Bridges
The suspension bridge is the structural form that is capable of spanning the longest distance to
date. Cables, with high strength-to-weight ratios, are highly efficient as the primary load-
carrying elements. The basic structural components of a suspension bridge system include the
main cables, main towers, anchorages, suspenders and stiffening trusses. The stiffening trusses
act as the bridge deck that supports and distributes the traffic loads, and also contributes to the
aerodynamic stability. It should be noted that steel is typically used for the deck structure of a
suspension bridge to minimize the dead weight. High-strength steel wires forming the main
cables act in tension to support through the suspenders the weight of stiffening trusses and
traffic loads. The main towers as intermediate supports for the main cables help transfer the
loads to the foundation. Massive concrete anchorages are normally provided to resist the pull
from the cables (Okukawa et al., 2014).
There is only one suspension bridge in Hong Kong, i.e. Tsing Ma Bridge, which is shown in
Figure 1.6.
Figure 1.6 Tsing Ma Bridge (Courtesy of Highways Department)
(5) Cable-stayed Bridges
The cable-stayed bridge is the more recent development in bridge systems. Similar to the
suspension bridge, it utilizes the high tensile strength of steel cables, but in a different way. The

18
cable-stayed girder bridge consists of a main girder system at deck level, supported on
abutments and piers, and in addition by a system of nearly straight cables emanating from the
towers and anchored at the main and approach spans. The deck structure of a cable-stayed
girder bridge can be steel, concrete or composite, depending on the cost-benefit analysis of the
specific project.
A cable-stayed bridge consists of a number of triangles, comprising the tower, the deck and the
cables. If relatively closely spaced stay cables are provided, the loads are mainly transferred as
axial forces rather than bending, making the structure more efficient. The compressive axial
forces in the towers and in the deck are balanced by the axial tension in the stay cables. The
dead load of the deck structure would also pre-tension the stay cables, thereby increasing the
stiffness of the structural system (Vejrum and Nielsen, 2014). One of the advantages of cable-
stayed bridge is that the structure is usually self-anchored and there is no need for large
anchorage, as in the case of a typical suspension bridge. This makes the cable-stayed bridge a
good solution at locations where the soil conditions are unfavourable and the foundation cost
would be excessive (Vejrum and Nielsen, 2014).
The major cable-stayed bridges in Hong Kong include Stonecutters Bridge, Kap Shui Mun
Bridge, Ting Kau Bridge and Shenzhen Bay Bridge. Figure 1.7 is a photograph of Kap Shui
Mun Bridge. Apart from the long-span road bridges mentioned above, the cable-stayed bridge
system is versatile and can also be used for footbridges, as shown in Figure 1.8.
Figure 1.7 Kap Shui Mun Bridge (Courtesy of Highways Department)
Figure 1.8 Pedestrian cable-stayed bridge over West Kowloon Highway at Olympic

19
Small- to medium-span bridges
Short- to medium-span girder bridges constitute the most prevalent bridge form in Hong Kong.
This section mainly reviews the local practices in the past four decades for this category of
bridges, including the design process, common structural configurations and design parameters.
(1) Design process
The design of bridges, like any structural design, is iterative in nature. It is essentially a
continuous refining process as illustrated in Figure 1.9. One starts by gathering all the relevant
information on the project, including but not limited to its intended use, alignment, economy,
site conditions and environmental impact. The initial ideas funnel down to the conceptual
design, including the choice of structural form and material, deck section, articulation, bearing
arrangement, and choice of substructure and foundation. The conceptual design materializes
through dimensioning member size, structural analysis and detailed design. It is also important
to take into consideration construction, operation and maintenance in the design process. The
initial design ideas may need to be reviewed and revised in the design process. A bridge design
is the end product of such a continuous refining process. While the general process of bridge
design follows the same rationale, the design practice and workflow vary from firm to firm.
Hong Kong engineers, through the rapid urban development, have accumulated rich experience
in bridge design.
Figure 1.9 Illustration for typical design process
(2) Forms of structural components
The beam-and-slab and concrete box girder are two of the most common forms of
superstructure. The beam-and-slab bridges are constructed with precast span-by-span method.
Some typical precast beam sections include I-beam, M-beam and U-beam. This structural form
was popular during the 1970s and 1980s. The first beam-and-slab bridge in Hong Kong is Canal
Road Flyover as shown in Figure 1.1. More examples include some spans in West Kowloon
Corridor and Island Eastern Corridor as shown in Figure 1.(a) and Figure 1.(b) respectively.
Box girder sections have become popular with its higher torsional stiffness and more efficient
distribution of load compared to beam-and-slab sections. Early box girder bridges in Hong
Kong consisted of a variety of designs, including single-cell, twin-cell and multi-cell box
girders. Some of the examples are shown in Figure 1.(c) to Figure 1.(f). However, in view of
the convenience in construction, the single-cell box girders have become more popular in
recent years.
The bridge deck is supported along its length on piers at appropriate locations and on abutments
Design Considerations
Conceptual Design
Detailed Design
End Product
• Use
• Economy
• Site
• Lay-out
• Environmental and social impact
• Choice of structure form
• Sketches
• Dimensioning member size
• Structural anlysis
• Structural design
• Construction planning

20
at the end, either by bearings or monolithically. Depending on the type and arrangement of the
superstructure, the pier also has a variety of representative configurations as shown in Figure
1.. The cross-section of pier may be circular, rectangular or octagonal.
(a) West Kowloon Corridor Span 7/1N-7/27N:
M-beam deck, “Y”-shaped pier
(b) Island Eastern Corridor:
U-beam deck, twin-column bent pier
(c) Kwun Tong Bypass Phase I K70E:
single-cell box girder, single-column pier
(d) Kwun Tong Bypass Phase II K77L:
single-cell box girder, single-column pier
Figure 1.10 Common bridge forms of small- to medium-span bridges in Hong Kong

21
(e) West Kowloon Corridor Span 7/28–7/45:
multi-cell box girder, “Y”-shaped pier
(f) Kwun Tong Bypass Phase III K76:
twin-box girder, “Y”-shaped pier
Figure 1.11 Common bridge forms of small- to medium-span bridges in Hong Kong
(continued)
Bearings transmit mainly vertical loads from the bridge deck to the substructure, while
restraining movement in some directions and allowing movement in others. Depending on the
design of a bearing, it may also be expected to resist horizontal loads resulting from various
actions. The most popular bearing type is the pot bearing (a kind of mechanical bearing) which
can take relatively high loading, as shown in Figure 1.(a). The second most popular is the
elastomeric bearing that is normally used for lighter loading. Most elastomeric bearings used
in bridges are laminated and consist of steel reinforcing plates, as shown in Figure 1.(b).
(a) Mechanical bearing (b) Elastomeric bearing
Figure 1.12 Common types of bearings
Movement joints are normally provided in the longitudinal direction of a bridge as a means of
releasing the stresses arising from induced deck deformations due to thermal actions, shrinkage
and other actions. To accommodate the relatively large movement between adjoining bridge
decks or between the bridge deck and abutment, the bearings at movement joints are usually a
combination of the elastomeric bearings and plain sliding bearings consisting of low friction
polytetrafluoroethylene (PTFE).
In the earlier bridges in Hong Kong, ease of maintenance was not accorded high importance as
today. There were some connection details which may cause problems with maintenance. They

22
include the extensive use of half joints in Gerber beam type of bridges, use of dowel bars for
structural fixity, bearing details that do not allow convenient access and replacement, etc.
Apparently these details are no longer adopted in modern bridge designs. Nevertheless, the
maintenance of the existing bridges constructed several decades ago will still be a major
challenge for bridge engineers.
Occasionally, the piers are designed to be monolithic with the bridge deck, thereby eliminating
the need for bearings and movement joints there. The bridge structure should have been
designed to take the stresses induced by restrained movement. Figure 1. shows one example of
such bridges. As bearings and movement joints require a lot of maintenance efforts, there is
increasing preference for monolithic construction.
Figure 1.13 Flyovers over Castle Peak Road
Deep foundations are normally used to support bridges in Hong Kong. The selection of pile
type depends on the specific project requirements, site conditions, environmental
considerations and engineering judgment. Spread footings can be used in some cases to support
bridges, e.g. availability of good bearing stratum or bedrock at shallow depth.
(3) Values of design parameters
Based on an initial survey of as-built bridges in Hong Kong, Figure 1. shows the typical ranges
of the span lengths and Figure 1. shows those of the carriageway widths for common types and
arrangements of superstructure. Furthermore, the number of continuous spans is found to vary
between three and six spans.

23
Figure 1.14 Typical span lengths for common structural forms
Figure 1.15 Typical carriageway widths for common structural forms
Revision of Structures Design Manual for Highways and Railways
General
The SDMHR has been providing guidance for the design of highway and railway structures in
Hong Kong since its first publication in August 1993, with the second and third editions
released in November 1997 and August 2006, respectively. The latest version was published
in May 2013 (Highways Department, 2013). In the 2013 edition, the Manual has been revised
for migration from British standards to Eurocodes. It is stated in Clause 1.1(4) of SDMHR
2013 that:
10 15 20 25 30 35 40 45 50
Beam-and-slab bridge, M beam
Beam-and-slab bridge, U beam
Box girder bridge
Span Length, m
0 5 10 15 20 25
Precast beams
Single-cell box grider
Multi-cell box girder
Twin-box girder
Carriageway width, m

24
“Eurocodes shall be used for the design of new and modification of existing highway
structures and railway bridges, but not for the structural assessment of existing structures,
unless agreed with the Chief Highway Engineer/Bridges and Structures.”
The publication of SDMHR 2013 would have significant impact on the design of new highway
and railway bridges and modification to the existing structures. The provisions given in BS EN
1998-1 (BSI, 2004c) and BS EN 1998-2 (BSI, 2005b), in particular, shall be followed for the
design for earthquake resistance.
There are differences in both analysis and design for earthquake resistance. The new SDMHR
2013 adopts the dynamic approach given in the Eurocodes using response spectrum analysis
as the reference procedure, while the previous SDMHR 3rd has adopted a relatively
straightforward equivalent static force approach. In respect of design, the change in code of
practice calls for new considerations in conceptual design and more stringent detailing rules.
The fundamental modifications are summarized in Table 1.1.

25
Table 1.1 Key differences for seismic design between SDMHR 3rd and SDMHR 2013
SDMHR 3rd SDMHR 2013
Importance class N/A Importance Classes I, II and III
Ground type N/A Ground Types A, B, C, D and E
Ground acceleration 0.05g, where g is the acceleration due
to gravity
Depending on the structural vibration
period (T), Importance Class (I, II or III)
and site conditions (A, B, C, D or E), with
a reference value of 0.12g for infinitely
stiff structures (T = 0) of Importance
Class I on Ground Type A
Components of seismic
action
Transverse and longitudinal Transverse, longitudinal and vertical (if
applicable)
Method of analysis Equivalent static force method Response spectrum method
(with allowance for alternative methods)
Combination with
other loads
• Permanent loads, with a partial
factor of 1.2 for dead load, 1.75 for
surfacing and 1.5 for other super-
imposed dead load;
• 1/3 HA traffic load of United
Kingdom Highways Agency’s
Departmental Standard BD 37/01
on one notional lane in each
direction, with a partial factor of
1.25; and
• Nominal seismic force with a
partial factor of 1.4.
• Permanent loads including dead load
and super-imposed dead load at their
characteristic values;
• 20% of Load Model 1 traffic load of
BS EN 1991-2 on each of the notional
lanes and remaining areas;
• Seismic action; and
• No partial factors need to be applied
for seismic combination.
Combination of
components
The design seismic force shall be
applied successively longitudinally
and transversely at footing level and to
the superstructure, making four
loading conditions to be considered in
all.
The seismic action is applied at top of
footings, or relevant surfaces of footings
in case the soil stiffness is taken into
account, separately in the longitudinal,
transverse and vertical (if applicable)
directions of the bridge.
The probable maximum action effect due
to the simultaneous occurrence of the
components of seismic action may be
estimated through application of the
SRSS rule or the 30% rule expressed by
Equations (4.18)-(4.22) in BS EN 1998-
1.
Revised seismic intensity
The ground acceleration of 0.05g combined with a partial factor of 1.4 as prescribed in SDMHR
3rd was based on the seismicity records for Southern Guangdong implying that structures built
in Hong Kong to withstand ground accelerations of 0.07g would probably have survived all
the earthquakes recorded in Guangdong since 288 AD.
SDMHR 2013 has specified a reference peak ground acceleration on Type A ground (i.e.
essentially rock) of 0.12g, which corresponds to a reference return period of 475 years based
on comprehensive probabilistic seismic hazard analyses for Hong Kong (Atkins, 2012, 2013).
Aside from the reference return period of 475 years, longer return period (i.e. 1,000 years and
2,500 years) may be considered for critical infrastructures through the introduction of
importance factor. The classification of importance classes and values of importance factors as

26
specified in Table 4.1 of SDMHR 2013 are shown in Table 1.2.
Table 1.2 Importance Classes and Importance Factors specified by SDMHR 2013 Importance
Class
Importance
Factor Relevant Highway Structures
Class I 1.0 All highway structures not under Importance Class II or III.
Class II 1.4 When any one of the following conditions is met:
• on traffic sensitive routes (Red and Pink Routes);
• on public transport sensitive routes; or
• on expressway.
Class III 2.3 When any one of the following conditions are met:
• any span length > 150 m;
• on expressway with total length > 1000 m; or
• critical for maintaining communications, especially in the
immediate post-earthquake period (e.g. on sole access routes to
hospital).
Note: The importance factors of 1.0, 1.4 and 2.3 correspond to return periods of 475, 1,000 and 2,500 years,
respectively.
For new bridges, depending on the vibration period of the specific structures, their classes of
importance and the conditions of the sites where they are located, the seismic design forces
based on the SDMHR 2013 in accordance with Type 2 response spectra of BS EN 1998-1 (BSI,
2004c) would, under most circumstances, be significantly larger than those derived based on
SDMHR 3rd.
From static approach to dynamic approach
For the seismic design of a bridge, structural analysis should be performed to evaluate the
structural behaviour under seismic actions and to provide the information necessary for the
design, such as forces, moments and deformations. The seismic analysis can be classified as
“static” or “dynamic”, depending on whether the earthquake loading is treated as equivalent
static forces or time-dependent forces.
A static seismic effect method is specified in SDMHR 3rd. The method has the simplified
assumptions that the structure is perfectly rigid and moves at same pace with the ground motion.
Thus the seismic force is simply the product of the effective mass and ground acceleration. A
nominal earthquake load equivalent to 5% of the total vertical load is specified for design
together with partial factors of 1.4 for ultimate limit state and 1.0 for serviceability limit state.
In SMHDR 2013, the standard procedure for seismic analysis as recommended in BS EN 1998-
2 is response spectrum analysis. This method consists in mainly an elastic calculation of the
peak dynamic responses of all significant modes of the structure using the ordinates of the site-
dependent design spectrum. The overall response is then obtained by statistical combination of
the maximum modal contributions. The direct dynamic methods, such as nonlinear time-history
analysis that explicitly includes the nonlinear properties of the members based on step-by-step
integration of the equations of motion in connection with ground motion time-histories, may
be required for analysis of irregular structures.
From elastic design to ductile design
The design philosophies of SDMHR 3rd and SDMHR 2013 are essentially different. SDMHR
3rd does not require explicit analysis for inelastic behaviour of the bridge under various kinds

27
of loads, including seismic loads, whereas BS EN 1998-2 that forms an important basis of
SDMHR 2013 requires that the bridge shall be designed for either ductile or limited ductile
behaviour under the design seismic actions. In contrast to SDMHR 3rd, the seismic design
philosophy of SDMHR 2013 consists of three distinctive components:
The bridge of ductile behaviour shall be provided with reliable means to dissipate a
significant amount of the input energy under earthquakes. This can be accomplished by
providing for the formation of flexural plastic hinges or by using isolation devices.
The intended formation of flexural plastic hinges shall be used in conjunction with the
capacity design strategy. While the flexural plastic hinges shall be formed at selected
locations, members where no plastic hinges are intended to be formed and which resist
shear forces shall be protected against all brittle modes of failure using the “capacity design
effects”.
The detailing plays an extremely crucial role in the ductility seismic design. The intended
plastic hinges shall be provided with adequate curvature/rotation ductility to ensure the
required overall ductility of the structure. As a consequence, the concrete compression
zone shall be properly confined, and all main longitudinal bars shall be restrained against
outward buckling in the potential plastic hinge regions.
Aims and Scope of this Guide
Aims
With the SDMHR 2013 taking effect, the seismic design of bridges in Hong Kong has been
elevated to the international level as exemplified by the structural Eurocodes. The increase
from the previous nominal ground acceleration of 0.05g to reference peak ground acceleration
of 0.12g together with possible amplification due to subsoil conditions implies that the current
design seismic action can be many times that of the previous value. Even though the scenarios
with design seismic actions may or may not be those controlling the design of an individual
structure, the aforementioned enhancement of the design code will call for a complete revamp
of design strategies instead of just allowing for a higher design seismic action purely based on
strength consideration as in the previous simplistic design approach. Proper seismic design
should address not only strength and stiffness, but also ductility and deformability in order to
achieve safety under extreme events. Examination of the possible failure modes under a severe
earthquake is necessary and energy absorption by ductile structural behaviour in such an
extreme event is often considered desirable.
To help ensure a smooth transition to the state-of-the-art seismic design methodology and to
encourage a holistic approach even from the initial conceptual design stage for compliance
with the current requirements, it is desirable to develop a comprehensive set of design
guidelines taking into account local conditions and specific design requirements, established
engineering practices including those available locally, in Mainland China and overseas,
effective measures to ensure seismic resistance, buildability, increased use of prefabrication for
better quality assurance and economy, possible standardization of detailing, as well as
practicality of long-term asset management and maintenance. This design guide aims to
achieve the following objectives:
To provide a systematic approach for earthquake-resistant design of bridges in compliance
with the current requirements;
To devise design guidelines for optimization of new bridges under local conditions, which
assist in decision making in the light of performance in various aspects;

28
To develop a framework for assessment of existing bridges under upgraded seismicity; and
To present a state-of-the-art review of latest trends of bridge engineering for local adoption
in the future.
Scope
This design guide will focus primarily on short- to medium-span concrete girder bridges that
are most commonly built in Hong Kong, although the design guide may also be applicable to
other types of bridges. The topics covered in each chapter are as follows:
Chapter 2 presents a general introduction to the seismic design of bridges based on a
comprehensive review of several major seismic bridge design codes from other countries
and/or regions, including their development history, design philosophy and major compliance
approaches, methods of seismic demand analysis, and representation of seismic action.
Chapter 3 summarizes the seismic bridge design specifications for Hong Kong, including those
for highway and railway bridges, in a sequential order of seismic design procedures followed
by a flowchart.
Chapter 4 provides guidance on the seismic design of new bridges at the conceptual design
stage in respect of the selection of earthquake-resisting systems, articulations, configurations
and intended seismic behaviour, i.e. elastic, limited-ductile or ductile behaviour, by examining
the relation between the choices and the design and response of structures under seismic actions.
Chapter 5 describes the preliminary compliance assessment of typical existing highway bridges
(previously designed to older codes) with reference to the current requirements of SDMHR
2013 in regard to the design seismic actions and structural details. It then presents the
methodologies for performance-based seismic structural assessment of bridges and the
development of fragility curves of some typical classes of bridges in Hong Kong for the
purpose of rating of existing bridges.
Chapter 6 presents some of the latest trends of bridge engineering in respect of material,
construction method and structural system, with special emphasis on the implications of these
developments on seismic bridge design and retrofitting.
It should be noted that the results presented in this design guide are primarily obtained based
on the assumption of short- to medium-span concrete girder bridges with fixed-base
foundations. This is also stressed in the text where appropriate.

29
INTRODUCTION TO SEISMIC DESIGN OF
BRIDGES
Lessons Taught by Past Earthquakes
Earthquakes are one of the most disastrous natural hazards in the world and have caused many
of the most terrible catastrophes in human history. Seismic damage to bridges can have severe
consequences. The worst scenario is the collapse of a bridge, which places the people on or
below the bridge at risk, and the bridge must be replaced after the earthquake unless alternative
routes of sufficient capacity are available. The less dramatic damage may still require
temporary closure of the bridge. Even a temporary bridge closure can have tremendous
consequences. In the aftermath of an earthquake, the closure of a bridge can also impair
emergency response operations. The economic impact of a bridge closure increases with the
period over which the bridge is closed, the importance of the bridge as a link in the
transportation network and the repair cost of the bridge.
It is possible to gain insight into the structural behaviour and to identify potential weakness in
the existing and new bridges by examining the typical vulnerabilities that bridges have
experienced in past earthquakes. The bridge damage observed from past earthquakes has
usually been the impetus for many improvements in seismic engineering codes and practice.
For example, California adopted new seismic design criteria including a detailed requirement
for site-specific ground motions after the damaging earthquake in 1971, i.e. the M6.6 San
Fernando Earthquake in USA. In Japan, bridges had traditionally been designed only for a large
offshore earthquake. After the 1995 M6.9 Kobe Earthquake in Japan highlighting the risk of
near-fault ground motions, Japanese bridge engineers started to design for two types of
earthquakes: a subduction earthquake and a large crustal earthquake (Yashinsky et al., 2014).
The seismic design practice has also improved significantly in Mainland China as a result of
experience gained from the Wenchuan earthquake. In 2008, the M7.9 Wenchuan Earthquake in
Sichuan, China highlighted the vulnerability of roads and bridges to strong shaking in a
mountain setting. Landslides caused quake lakes that washed away bridges, isolating the people
in the mountains. Just after the 2008 Wenchuan Earthquake, the Ministry of Communications
of the People’s Republic of China issued a new edition of Guidelines for Seismic Design of
Highway Bridges (the MCPRC Guidelines) (MCPRC, 2008). Compared to the previous edition
(MCPRC, 1989), the selection criteria for bridge site were greatly refined in the light of seismic
safety.
In addition to the necessary attention to design philosophy and design criteria, it is of particular
importance to examine miscellaneous structural details. Lots of damage to bridges that
earthquakes commonly induce can be attributed to inadequate detailing. For example, the
biggest lesson taught by the 1971 San Fernando Earthquake was the problem of poor
development of longitudinal reinforcement. During that particular earthquake, some concrete
columns were pulled out of pile caps and pile shafts as the bridge moved back and forth, thereby
contributing to bridge collapse. As a result, the California Department of Transportation
(Caltrans) required all major column reinforcement in new bridges to be fully developed
through the foundation and cap beam thereafter (Yashinsky et al., 2014). Other significant
damage contributing to poorly behaved columns, such as buckling of longitudinal rebars,
fracture of transverse reinforcement, and shear failure as featured by steeply inclined diagonal
cracks, have been associated with insufficient confinement to core concrete and longitudinal
reinforcement. Concern about this kind of columns prompted changes to the design practice
that all new bridges were required to have columns with larger diameter confining
reinforcement at a closer spacing after the San Fernando Earthquake (Yashinsky et al., 2014).
Moreover, Caltrans initiated its first seismic retrofitting programme following the San

30
Fernando Earthquake which included installation of cable restrainers at the expansion joints to
prevent dropping span in the light of a considerable number of bridge collapses caused by
unseating of girders (Yashinsky et al., 2014).
It is true that each subsequent earthquake will cause additional bridge damage and provide
additional lessons on bridge seismic behaviour. For instance, the cable restrainers incorporated
in highway bridges in California after the 1971 San Fernando Earthquake extended through
end diaphragms that had not been designed originally for the forces associated with restraint.
Some punching shear damage to the end diaphragms retrofitted with cable restrainers was
observed following the 1989 Lorna Prieta Earthquake in USA (Moehle and Eberhard, 2000).
Nevertheless, those bridges that were designed after the San Fernando Earthquake generally
performed well, which was very encouraging (Yashinsky et al., 2014). Taking advantage of
knowledge gained over the years through a substantial amount of laboratory investigations and
field data collected from past earthquakes, modern seismic engineering codes and practice have
had significant improvements.
Seismic Performance Requirements for Bridges
In view of the catastrophic consequences of bridge collapses, it is the minimum requirement to
design bridges in seismic regions for the performance level of “no collapse”. In accordance
with BS EN 1998-2 (BSI, 2005b), bridges shall be designed to withstand the design seismic
events without local or global collapse, thus retaining the structural integrity and residual load-
bearing capacity after the seismic events. Implied in such a statement is that damage is
explicitly permitted and expected under the design seismic action. Such responses are unlike
that expected for most other load combinations, because seismic actions are so large that elastic
design would be prohibitively expensive. Therefore, a bridge may suffer significant damage
under the design seismic event, but no collapse is allowed. Use by emergency vehicles should
be available after structural inspections and clearance of debris in the aftermath of the
earthquake, although partial or even complete replacement of the bridge may be required later.
The design seismic event represents the largest ground motion that can be expected with a
reasonable likelihood during the life of a bridge. This likelihood is usually expressed as a return
period in years, but it may also be described by an annual probability of occurrence, or a
probability of exceedance. When setting the seismic hazard level for design event, it is fair to
select a return period with some level of conservatism but not be overly conservative for
ordinary bridges; otherwise it would be too costly. The 475-year return period, which
corresponds to 10% probability of exceedance in 50 years, is recommended by BS EN 1998-1
(BSI, 2004a) and is also adopted in Structures Design Manual for Highways and Railways
2013 (SDMHR 2013) (Highways Department, 2013). For bridges whose failure is associated
with a large number of probable fatalities and/or would possibly create a major economic
impact, these bridges should be considered as critical for a local emergency plan and a longer
return period can be economically justified for the design seismic event. SDMHR 2013 has
specified the 1000-year and 2500-year return periods for important and critically important
bridges, respectively, which correspond to 5% and 2% probabilities of exceedance in 50 years.
As discussed above, the choice of design ground motion level cannot be considered separately
from decisions regarding the risk versus benefit. The set of design seismic hazard levels as
adopted in SDMHR 2013 for the design of various important classes of bridges for the “no
collapse” performance objective are consistent with those currently adopted in other regions
and countries such as Mainland China (MCPRC, 2008), Australia (Standards Australia, 2017)
and New Zealand (NZTA, 2016), as listed in Table 2.1. In the USA, a raise of the hazard level
from 500 years to 1000 years for the design of ordinary bridges was approved by the
Association of State Highway and Transportation Officials (AASHTO) in 2007 and then

31
subsequently adopted for the revised AASHTO Guide Specifications for LRFD Seismic Bridge
Design (referred to as AASHTO Guide Specifications) (AASHTO, 2011). However, owners
may choose to deviate from the ground motion criteria if the situation warrants it.
Table 2.1 Performance requirements and corresponding design motion levels for seismic
bridge design adopted in different codes
Region/Country Hong
Kong1 New
Zealand2 Australia3 USA4
Mainland China5
Design
Approach Single-Level Design
Dual-Level Design
Requirement No-Collapse No-
Collapse
Minimal
Damage Bridge Class Return periods (year) of design motions
Critical 2500 2500 2000 — * 2000 475
Important 1000 1000 1000 1000 1000 75 – 100
Minor 475 500 500 1000 475 50 1 SDMHR 2013 (Highways Department, 2013) 2 Bridge Manual (NZTA, 2016) 3 Bridge Design – Part 2: Design loads (Standards Australia, 2017) 4 AASHTO Guide Specifications for LRFD Seismic Bridge Design (AASHTO, 2011) 5 JTG/T B02-01-2008: Guidelines for Seismic Design of Highway Bridges (MCPRC, 2008) * Critical and/or essential bridges are not included in the scope of AASHTO Guide Specifications.
Aside from the “no collapse” requirement, there is usually another performance requirement
such as the “minimisation of damage” requirement as in BS EN 1998-2. Bridges shall be
designed to withstand earthquake ground motions having a higher probability of occurrence
than the design earthquake, without the occurrence of significant damage and the associated
limitations of use. In other words, a seismic action with a higher probability of occurrence than
the design level may cause only minor damage to secondary components and to those parts of
the bridge intended as energy dissipators so that the bridge can remain fully functional once
inspected after the event.
Overall, the expected seismic performance of bridges is that they should withstand smaller
earthquakes without significant damage and should withstand larger earthquakes without
collapse and without posing any threat to life. In practice, however, bridges have usually been
explicitly designed for ground motion for a single-level earthquake, i.e. only the upper-level
earthquake will be checked during design based on the expectation that bridges so designed
would be able to resist smaller earthquakes without significant damage by default. This single-
level design approach is employed partially to simplify the seismic design effort and so far it
has been widely adopted in the seismic bridge design codes worldwide.
However, the assumption made in the single-level design that satisfactory performance under
the upper-level earthquake also implies satisfactory performance at lower-level ground motions
may not invariably be true, unless elastic performance is targeted at the upper-level ground
motion. For certain important bridges, the owners may require that the bridges will remain fully
functional following more frequently occurring earthquakes than those that occur every one or
two thousand years. In like manner, the decision on the seismic hazard level for checking
functionality can vary from project to project, involving balancing the risk and cost of service
disruption versus the cost associated with additional design and construction measures. In the
USA, where owners have chosen to check functionality, the return periods for functionality-
checking earthquakes have varied from 72 years for toll road projects in Orange County, CA
to 500 years for major water-crossing bridges in New York City (FHWA, 2014). Unlike BS EN
1998-1, the MCPRC Guidelines (MCPRC, 2008) adopt a dual-level seismic bridge design
approach and requires explicit performance checking under different levels of seismic hazard.

32
The MCPRC Guidelines use notations “E1” and “E2” to describe the dual-level ground motions.
The E1 level motions have a return period of 50 – 475 years for checking functionality and the
E2 level motions have a return period of 475 – 2000 years for checking the requirement of no-
collapse, depending on the importance of bridge as presented in Table 2.1.
Seismic Design Strategies
There is an essential requirement of “no collapse” for seismic bridge design, which has been
adopted by many regions and countries. This design philosophy implies that a bridge will likely
be damaged and behave inelastically during the design earthquake. Technically speaking, it is
possible to design a bridge to remain undamaged during a moderate-to-strong earthquake. This
bridge must respond elastically to avoid damage and hence substantial forces will be developed
in the columns and foundations. However, in all but low seismic regions, these forces will be
too large to be resisted economically. Furthermore, there is a small but tangible possibility that
an earthquake larger than the design event can occur in the lifetime of the bridge and produce
even larger forces. Elastic design is usually unable to manage excess forces. Instead, it is
decided to design bridges for ductile behaviour under large seismic actions, which generally
involves yielding of various structural members and the corresponding plastic deformation in
these members, i.e. formation of plastic hinges. Once yielding occurs, the forces in the bridge
cannot exceed those that yield the members, even during very large earthquakes. This is a useful
concept since it places a cap on the forces that have to be considered in the design. The use of
ductility design has both an economic basis and a technical basis (FHWA, 2014). Economically,
it avoids spending undue resources on responding elastically to an extreme event that has a low
likelihood of occurrence by permitting some damage. Technically, it limits internal forces,
making the structure less vulnerable to earthquake events that are larger than the design event.
Ensuring the ductile response of bridges under seismic action requires design principles
different from those for most other load types. Although it is essential that the demand on any
component in the structure should be less than the capacity of the component to resist that
demand, simply providing more strength or capacity in an element without regard to its impact
on the other parts of the structural system is inappropriate for seismic design. Normally, a
bridge is composed of both key elements that yielding will be permitted and the other elements
that should not be damaged before the yielding elements reach their capacity. The key elements
will be determined first and designed to have capacity in excess of demand induced by the
action of design ground motion. The maximum feasible strength at designated plastic hinge
locations can be obtained at the end of this step taking into account potential overstrength. The
remaining elements shall then be designed to provide a load path to accommodate the forces
and deformations imposed on the selected key elements without the remaining elements losing
their strength, i.e. to capacity-protect the remaining elements in the load path. This is achieved
by ensuring that the dependable strength of the capacity-protected elements exceeds the
maximum feasible strength of the key elements in the load path. The purpose of the capacity
design strategy is to ensure that undesirable modes of inelastic deformation, such as plastic
hinging at unintended locations or brittle shear failure, cannot occur. The capacity design is
another equally important concept for the seismic bridge design.
Moreover, ductility design must be combined with detailing rules to ensure stable ductile
response, i.e. the key components should be detailed so that they will continue to resist the
applied loading with little or no degradation under reversal of both loading and deformation.
The transverse reinforcement, which may be in the form of either spirals or hoops in circular
sections, and links and ties in rectangular sections, is required to provide sufficient confinement
when yielding occurs. The confining steel shall be able to help resist the high compressive
inelastic strains imposed on the concrete core, as well as to restrain the longitudinal rebars

33
against buckling. The effectiveness of confinement depends heavily on the size and spacing of
well anchored transverse steel. The introduction of ductility-based detail design is believed also
to ensure minimum levels of inelastic deformation capacity at the plastic hinges by enabling
high compression strains to develop within the concrete core even after spalling of the concrete
cover.
Therefore, ductility design, capacity design and ductility-based detail design are essentially
three indispensable components of modern seismic bridge design. Damage is explicitly
permitted for the bridge under design ground motions, provided it is ductile in nature and then
only in members specifically designed and detailed for such behaviour. Where possible, the
preferable ductile members should be limited to locations within the bridge that can be easily
inspected and repaired following an earthquake, and these may include columns, piers, seismic
isolation and damping devices, bearings, shear keys, and steel end diaphragms.
There are basically three types of global strategy, depending on the ductile members selected.
Typically, the columns and piers are the major components designed for potential plastic
hinging to occur, while the bridge decks are not normally expected to behave in an inelastic
manner during an earthquake. The provisions in BS EN 1998-2 (BSI, 2005b) also seek to
ensure the ductile behaviour of bridges by proper formation of flexural plastic hinges in
columns and piers. In fact, the design of a ductile substructure with an essentially elastic
superstructure is the most recommended seismic bridge design strategy that is widely adopted
in seismic engineering codes. The approach of placing seismic isolation bearings between the
superstructure and substructure that increase the lateral flexibility of bridge and provide
additional damping is another strategy included in BS EN 1998-2. Isolation physically
uncouples a bridge superstructure from the horizontal components of earthquake ground
motion, leading to substantially reduced forces during an earthquake. Furthermore, when an
isolated bridge is subjected to an earthquake, the deformation occurs largely at the isolation
bearings rather than the substructure components. These greatly reduce the seismic forces and
displacements transmitted from the superstructures to the substructures, which can achieve the
condition of both elastic superstructures and elastic substructures at little cost (AASHTO, 2011).
Other devices in either passive or active form have also been proposed (FHWA, 2006) to
provide additional damping or energy dissipation. The methods for design of such elements are
beyond the scope of this monograph. The AASHTO Guide Specifications (AASHTO, 2011)
include another strategy for the design of an essentially elastic substructure with a ductile
superstructure, based on observations in some past earthquakes that plastic behaviour has
occurred in cross bracing of steel superstructure and some more subsequent research. This type
of global strategy is essentially an emerging technology and the design requirements for such
systems are not yet fully developed. There is currently no mention of ductile superstructures in
BS EN 1998-2.
Seismic Design Methodologies
Two fundamental methodologies have been developed to conduct seismic design. These are
the Force-Based Method and Displacement-Based Method. Fundamentally, both methods seek
to ensure that a structure has certain elements designed to yield in a ductile manner and all the
rest designed to remain essentially elastic during the design earthquake. It is only the method
of achieving this result that differs.
Force-based method
The Force-Based Method is the more common method that is used by most of the seismic codes
including those mentioned in Section 2.2. The method develops the design seismic forces for
yielding elements Fyeild by dividing the elastic forces Felastic obtained from the demand analysis

34
assuming no yielding occurs by an appropriate “Force Reduction Factor” as illustrated in
Figure 2.1. Inherent in this method is the expectation that the intended ductile members will
yield at a force level equal to the reduced elastic demand when subjected to the design ground
motions. The shortfall in strength is to be compensated by deformation ductility capacity.
Force, F
Displacement, Δ
Δyield Δelastic Δcapacity
Fyield
Felastic
Reduction Factor
Δdemand may or may
not be equal to Δelastic
Figure 2.1 Determination of design seismic force in force-based method
The general workflow for the Force-Based Method is summarized as follows:
(a) Calculate the earthquake forces and their distribution based on elastic analysis.
(b) Reduce the seismic elastic forces of intended ductile members by an appropriate
reduction factor and combine with other concurrent loads.
(c) Determine the required design strength of ductile members and design the members to
meet the strength demands; and provide structural detailing to ensure deformation
capacity.
(d) Provide capacity protection for the members that are designed to remain elastic and
shear protection for ductile members.
The force-reduction factor may be called “Behaviour Factor (q)” as in BS EN 1998-2, or
“Ductility Modification Factor” as used by some other codes. The force reduction factor is
often thought of as equivalent to the ductility factor which is defined as the ratio of the
displacement demand ∆demand to the yield displacement ∆yield. However, this is valid only when
the bridge forms its plastic hinges instantly rather than one at a time and the period of vibration
is such that ∆demand is equal to ∆elastic, i.e. the equal displacement approximation should be
effective (Priestley et al., 2014). It is well established that the equal displacement
approximation is inappropriate for structures of very short or very long periods as manifested
in some design codes in the form of “Displacement Modification Factor” where the elastic
displacement of a structure under the action of reduced seismic forces ∆yield is multiplied by a
factor to provide an estimate of the nonlinear response displacement ∆demand. The displacement
modification factor may be equal to the force reduction factor in some cases, which implies the
equal displacement approximation. It may be similar to the force reduction factor in other cases,
implying subtle variations from the equal displacement approximation. BS EN 1998-2 also
specifies a factor called “Displacement Ductility Factor (µd)” that considers the short- and long-
period modifications when determining the displacement demand.
Nevertheless, the force reduction factor roughly implies the expected ductility demand imposed
on inelastic members. An appropriate force reduction factor reduces the elastic response force
by a level that is consistent with the implied ductility capacity of the structure under

35
consideration, while the ductility capacity is ensured by prescribed confinement details. The
maximum values of the force reduction factors associated with common seismic resisting
systems as specified in different regional codes are shown in Table 2.2. It is found that BS EN
1998-2 is relatively conservative in the allowable maximum ductility demands as compared to
other codes, especially the New Zealand code.
Displacement-based method
The Displacement-Based Method is currently included in the MCPRC Guidelines (MCPRC,
2008) and AASHTO Guide Specifications (AASHTO, 2011). Unlike the Force-Based Method,
the Displacement-Based Method does not require the calculation of specific design forces for
the yielding elements. Instead, the Displacement-Based Method focuses on providing the
structure with sufficient displacement capacity to meet the displacement demand, i.e. to ensure
∆capacity > ∆demand. The designer is free to proportion the yielding system as necessary to ensure
that the displacement demand is less than the displacement capacity at each pier, provided that
a minimum lateral strength threshold is provided for each pier and that all of the non-seismic
load cases are also satisfied (FHWA, 2014). The displacement capacity is based on the ductility
of yielding columns and may be controlled by both the longitudinal and transverse
reinforcement in the columns as well as the configuration of substructure such as shear spans
of columns. The displacement capacity of the columns is determined explicitly by conducting
section analyses. A direct check of the displacement capacity with respect to the demand is
made in the end.
The general workflow for the Displacement-Based Method is summarized as follows:
(a) Propose a lateral load resisting system and the corresponding displacement capacities.
(b) Perform a seismic response analysis to determine the displacement and force demands.
(c) Ensure the proposed displacement capacities are adequate to meet the imposed
displacement demands.
(d) Check the load path and apply capacity protection principles to the elements that are
designed to remain elastic or essentially elastic.
It is worth mentioning that the maximum ductility demands imposed on the yielding elements
are normally restricted, although theoretically any displacement demand can be satisfied by
design. However, this explicit control of ductility demand in the Displacement-Based Method
is essentially different from that in the Force-Based Method where implicit control is achieved
by setting maximum values for the force reduction factors. The allowable maximum member
ductility demands for different seismic resisting systems taken from the AASHTO Guide
Specifications (AASHTO, 2011) are also listed in Table 2.2, together with the maximum values
of force reduction factors from other codes adopting the Force-Based Method.

36
Table 2.2 Recommended allowable maximum member ductility for ductile reinforced
concrete members as specified by different codes
Code and Factor Configuration detail
Maximum
allowable
value*
BS EN 1998-2:
Behaviour Factor (q)
(BSI, 2005b)
Piers with plastic hinges accessible or
reasonably accessible for inspection and
repair
Vertical 3.5
Inclined 2.1
Piles with plastic hinges inaccessible for
inspection and repair, e.g. formed at the foot
of a pier shaft immersed in deep water, or
the heads of piles beneath a large pile cap
Vertical 2.1
Inclined 1.5
Prestressed or post-tensioned members 1.0
New Zealand Bridge Manual:
Design Displacement Ductility
Factor (µ)
(NZTA, 2016)
Members with plastic hinges formed in accessible
positions, e.g. above ground or normal (or mean tide)
water level
6.0
Members with plastic hinges formed in reasonably
accessible positions, e.g. less than 2 m below ground but
not below normal (or mean tide) water level
4.0
Members with inaccessible plastic hinges, e.g. formed
more than 2 m below ground or below normal (or mean
tide) water level
3.0
Raked piles in which earthquake load induces large axial
force 2.0
Australian Bridge Design:
Design Ductility Factor (µ)
(Standards Australia, 2017)
Superstructure on fixed pot
or spherical bearings or
elastomeric bearings with
translational movement
restraint in the direction
considered at piers on:
- stiff foundations (i.e. with
negligible translational and
rotational movements) 4.0
- flexible foundations with
significant contribution to
the displacement at pier top
(i.e. piles in 10 m or more of
soft soil)
3.0
Piers integral with superstructure, and superstructure on
bearings at abutments 4.0
Hollow reinforced concrete piers 2.0
Abutments integral with superstructure 2.0
Wall-type piers 2.0
Prestressed concrete piers
with:
- bonded strands 2.0
- external or unbonded
strands 1.0
AASHTO Guide
Specifications:
Ductility Demand (µD)
(AASHTO, 2011)
Single-column bent 5.0
Multiple-column bent 6.0
Pier wall in the weak direction 5.0
Pier wall in the strong direction 1.0
Drilled shafts, cast-in-place piles, and prestressed piles
subjected to in-ground hinging 4.0
*A value of 1.0 for the allowable maximum member ductility means the members are not intended as ductile
elements.
Methods of Demand Analysis
Despite different end results, both the Force-Based Method and Displacement-Based Method
require a seismic demand analysis to be conducted. This process involves building a global
model, conducting a response analysis, and determining the relevant forces and displacements
from the analytical results for use in the design of individual components. The analysis for
dynamic loads in an earthquake is generally not as straightforward as that for static loads,

37
particularly if the bridge response exceeds its elastic limit and becomes nonlinear.
Various analytical methods have been developed for the purpose of estimating the force and
displacement demands on a bridge during an earthquake. The most common methods are listed
in Table 2.3, ranging from simple approximate methods to complex rigorous methods. For
many years, the common method to analyse a bridge with nonlinear behaviour has been to
solve an equivalent linear problem using the equivalent linearized properties such that the
elastic methods of analysis can still be used. However, the degree of conservatism in the results
is hardly known. More rigorous methods are now available with the development of explicit
nonlinear static and dynamic methods, i.e. pushover and time-history methods respectively.
The choice of an analytical method is based on many factors including the seismic hazard at
the bridge site, and complexity of the bridge and its foundation. Generally speaking, increasing
seismic hazard and irregularity of the bridge require increasingly rigorous analysis. Often an
equivalent static analysis may suffice for a preliminary design followed by a more detailed
elastic dynamic analysis, i.e. response spectrum analysis, or even in special cases nonlinear
analysis such as static pushover analysis or dynamic time-history analysis in the final stages of
design.
All but the simplest of the methods presented in Table 2.3 require the use of a computer
programme for their implementation, and computer software is readily available nowadays.
Even though a designer in practice may not be familiar with the details, the designer should
still be mindful of the limitations of each method. For this reason, this section will focus on the
principles of these methods and their applications.
Table 2.3 Common methods for seismic response analysis Static Dynamic
Elastic and linear Single-mode response spectrum analysis Multi-mode response spectrum analysis
Inelastic and nonlinear Pushover analysis Nonlinear time-history analysis
Single-mode response spectrum analysis
In the single-mode response spectrum analysis, the seismic forces are derived from the inertial
forces using the response spectral coefficient corresponding to the fundamental period of the
structure independently in both the longitudinal and transverse directions. The single-mode
response spectrum analysis is one of the equivalent static methods, which assumes that the
dynamic response of the bridge can be sufficiently approximated by its fundamental mode.
This assumption holds for conventional bridges that are simple and regular with uniform span
lengths and column heights. This method is rarely used in detailed design but is helpful for
preliminary design and checking.
Response spectrum analysis
The multi-mode response spectrum analysis, or simply response spectrum analysis, is based on
the superposition of modal response of all significant modes of the structure calculated from
the response spectrum coefficients. The method of the Complete Quadratic Combination (CQC)
is recommended for combining the modal responses. Alternatively, the Square-Root-of-the-
Sum-of-the-Squares (SRSS) is used when the modal periods are well separated. Measures are
introduced to determine the number of significant modes. The use of “effective modal mass”
is deemed to be efficient where it is possible to base the number of modes to be used in an
analysis on the participation of a minimum percentage of the total mass of the bridge, e.g. the
sum of the effective modal masses for the modes considered amounts to at least 90% of the
total mass of the bridge as used in BS EN 1998-2. This percentage is based on past experience
with the analysis of conventional bridges. It may be necessary to raise this figure to 95% for

38
non-conventional bridges or large multi-segmental bridges which tend to be governed by the
higher mode effects (FHWA, 2014). A detailed description of modal analysis and response
spectrum analysis is given by Chopra (2016) and Priestley et al. (1996). This method in general
does not have constraints other than being restricted to linear elastic behaviour.
Pushover analysis
Pushover analysis is a nonlinear static analysis of the structure subjected to constant gravity
loads and monotonically increasing lateral loads representing the action of a horizontal seismic
ground motion. Second-order effect is also accounted for. As output, the force may be plotted
against the displacement to illustrate the progression of inelastic deformation of bridge until
collapse. The method is usually used to determine the displacement capacity of individual bents,
frames or the whole bridge.
The evaluation of bridge displacement capacity is typically based on expected capacities of
inelastic components (usually piers with formation of plastic hinges), starting from ultimate
strain capacity of the material, further proceeding to ultimate curvature capacity of the section,
ultimate rotation capacity of the plastic hinge, and ultimate deformation capacity of the member,
and finally ending up with global ultimate displacement capacity of the bridge. Apart from the
ultimate limit state, intermediate damage limit states may also be defined for those inelastic
components based on consideration of the serviceability and repairability of the structure
(Kowalsky, 2000; Priestley et al., 2007). Although the analysis is based on monotonically
increasing load, the effects of cyclic loading is taken into account by selecting appropriate
material models considering strength and stiffness degradation.
This method of analysis provides additional information on the sequence and final pattern of
plastic hinge formation, redistribution of forces following the formation of plastic hinges and
expected deformation demands of columns and foundations, which provides the designer with
a greater understanding of the expected performance of the bridge than that obtained from
elastic analysis procedures.
Nonlinear time-history analysis
Nonlinear time-history methods are dynamic methods that calculate the demand on a bridge
while explicitly including the nonlinear properties of the members based on step-by-step
integration of the equations of motion where the structural stiffness matrix is updated as the
inelastic response develops. The seismic input is ground motion accelerogram. Such methods
can be very time consuming and computationally demanding for a typical bridge. However, a
nonlinear dynamic time-history analysis may be necessary for some important and complex
bridges.
Representation of Seismic Action
This section describes the process for determining the seismic hazard considered in seismic
design and basic types of representation of seismic action for use in design practice. In addition,
the derivation of the seismic action for Hong Kong prescribed in SDMHR 2013 (Highways
Department, 2013) is reviewed as an illustration.
Seismic hazard analysis
The quantitative estimation of ground shaking hazard at a particular area involves seismic
hazard analysis. There are two basic philosophies for the seismic hazard analysis, i.e.
deterministic and probabilistic seismic hazard assessment. Deterministic seismic hazard
assessment is to identify the maximum credible earthquake (MCE) that will affect a site. A
deterministic seismic analysis uses geology and seismic history to identify earthquake sources
and to interpret the strongest earthquake each source is capable of producing regardless of time.

39
These are the MCEs. The underlying philosophy is that, as one cannot safely predict when an
earthquake will happen, the MCEs are what a critical structure should be designed for if the
structure is to avoid surprises. Probabilistic seismic hazard analysis (PSHA), on the other hand,
advocates that the likelihood of occurrence should be considered in view of the fact that the
life of a structure is very short compared to the recurrence intervals of large events. The PSHA
involves integrating the probabilities of experiencing a particular level of ground motion during
a specified life period due to the total seismicity expected to occur in the area (about 300 km
radius) of a site of interest (Anderson and Trifunac, 1978; Cornell, 1968). It provides the
estimate of ground motion with a specified confidence level of the probability of not being
exceeded. The PSHA generally follows the steps below:
(a) Identify seismically active regions, structures and faults using earthquake catalogues,
geologic evidence and geodetic strains, etc.; the ordered pair (i, j) indicates an
earthquake of magnitude Mj occurring at distance Ri from the site of interest.
(b) For each fault or region, estimate the average event rate vij, using both instrumental and
historical seismicity data, and geodetic strains; then the expected number of
earthquakes with magnitude Mj occurring at distance Ri from the site during a time
interval of Y years is given by nij(Y) = vijY.
(c) Attenuate the ground motion from each source to the given site through an empirical
ground-motion prediction equation, which is a function of the distance, earthquake
magnitude and the geological conditions. A large number of such relations have been
developed over the years and a profound review of more than 450 ground-motion
prediction equations developed during the period 1964 – 2010 can be found from
Douglas (2011).
(d) Forecast the ground motion, parameterized as an engineering variable such as the peak
ground acceleration (PGA) and to a much lesser extent the peak velocity and
displacement, in terms of the probability of exceedance or the expected return period
of a given level of shaking.
(e) Sum the exceedance probabilities of the different sources to account for the fact that a
given site is potentially subject to shaking due to a variety of earthquakes sources.
(f) To summarize, letting X be the random ground motion variable and x be a possible level
of X, and also letting q(x|Mj,Ri) be the conditional probability that the value x will be
exceeded due to an earthquake of type (i, j), the expected number of times for which
X > x occurs due to all possible earthquakes is given by N(x) =∑ ∑ q(x|Mj,Ri) nij(Y) Jj=1
Ii=1 ;
assuming that the occurrence of the event X > x from earthquakes of type (i, j) is a
selective Poissonian process and that from all possible earthquakes is also Poissonian
with N(x) , the probability of X > x at a site may thus be obtained as
P|(X>x) = 1.0 - exp[-N(x)].
Therefore, the PSHA approach has incorporated uncertainties with respect to earthquake
location, magnitude and ground motion, producing a weighted average of all possibilities that
is a best estimate of the risk associated with seismic activity. A decision still must be made
about the appropriate risk level to use in design. The choice of the design ground motion level
cannot be considered separately from the level of performance specified for the design event
as discussed in Section 2.2. Common performance levels used in the design of transportation
facilities include the protection of life safety and maintenance of function after the event.
Keeping a bridge functional after the event is a more rigorous requirement than simply

40
maintaining life safety. In general, the bridges shall be able to withstand the design earthquakes
without collapse though they may suffer significant disruption in service and significant
damage, while they are expected to be able to avoid the occurrence of damage and limitation
of use after the more frequent seismic events. The determination of the design ground motion
level may also need to take into account the importance level of the facility. The cost of
designing facilities for an excessively long return period would generally be prohibitive, but a
longer return period may be justified for critical bridges when, for instance, an extended
duration in loss of operation of the structure would cause undue cost to the community or the
structure is part of a lifeline route for emergency operations. The PSHA as an approach
providing better defined risk levels in terms of return periods or the annual rate of exceedance
is considered the most appropriate basis for making rational design decisions about risk versus
benefit, and it has been widely adopted for use in establishing design ground motions. SDMHR
2013 (Highways Department, 2013) has employed a probabilistic approach and adopted a 475-
year reference return period as the basis to establish design ground motions for design of
ordinary bridges, which corresponds to 10% probability of exceedance in an exposure period
of 50 years. SDMHR 2013 has also specified 1000-year and 2500-year return periods for design
of important and critically important bridges, respectively. A different return period may also
be used if sufficiently justified.
A probabilistic approach also has the merit of being able to distinguish relative contributions
to risk from the more active versus the less active faults. As opposed to PSHA, which carries
out integration over the total expected seismicity during a given exposure period to provide the
estimate of a strong-motion parameter of interest with a specified confidence level, it has
become common to display the relative contribution to the total hazard of each source in terms
of magnitude and source-to-site distance. This is known as the de-aggregation of the PSHA.
De-aggregation enables identification of controlling magnitude and distance combinations of
the seismic hazard. This information is used, for example, when developing acceleration time-
histories for structural and geotechnical time-history analyses.
Despite all these merits, it should be noted that a probabilistic hazard approach is much more
complex than a deterministic approach and the results of probabilistic hazard solutions can
sometimes be questionable, particularly at very long return periods. It is generally suggested to
employ deterministic solutions as a sanity check on the results of probabilistic analyses for
long return periods.
Site response
The results of a hazard analysis may need to be modified to account for local site effects due
to the presence of soil overburden. At most sites, the rock will be covered by some thickness
of soil that can markedly influence the nature of the motions transmitted to the structure as well
as the loading on the foundation. Generally speaking, the soils act as filters to amplify the
response at some frequencies and de-amplify it at others. The greatest degree of amplification
occurs at frequencies corresponding to the characteristic site period.
The factors affecting the manner in which a site responds during an earthquake include the
near-surface stiffness gradient, the surface topography that can reflect and refract the incoming
waves, near-surface material boundaries, and deeper basin geometries. The interaction between
seismic waves and near-surface materials can be complex, particularly when the surface
topography and/or subsurface stratigraphy are complex. The quantification of site response has
usually been accomplished by either empirical or analytical methods.
For ordinary bridges, or for projects in which detailed subsurface information is not available,
the empirical approach is generally more prevalent. The empirical methods are built on the

41
database of strong ground motion records developed over the years. Division of the records
within this database according to the general site conditions has enabled the development of
empirical correlations for different site conditions. Usually, the site effects are expressed in
terms of the ratio of ground surface motion parameter to reference motion parameter for a given
site condition, i.e. site factors. Reference motions are generally taken as recorded motions for
a “rock” site. Classification of ground type is a complex matter with multiple criteria. The
available empirical methods have described site conditions in terms of surficial geology,
geotechnical classification and near-surface shear wave velocity (Scawthorn and Kramer,
2014). The latter approach, in which the site conditions are characterized by the average shear
wave velocity of the upper 30 m of a profile (vs,30) has become common. Bridge codes have
historically used relatively simple site classification schemes. Most of the codes (e.g. British
Standards Institution 2004, Standards New Zealand 2004, Standards Australia 2007, MCPRC
2008, AASHTO 2011) determine the site classes based on vs,30 in combination with soil depth,
but also allow average standard penetration test resistance (NSPT) and undrained shear strength
(cu) to be used when the shear wave velocity is not available. However, while there is similarity
in the criteria, the exact values for classification are quite different in these codes. To illustrate,
it is assumed that the ground types specified in different codes by average shear wave velocity
are broadly comparable as shown in Figure 2.2.
Figure 2.2 Ground type classification by average shear wave velocity
The reasonableness of empirically based methods for estimation of site response effects
depends on the extent to which the particular site conditions match the site conditions in the
databases from which the empirical relationships were derived. The empirical expressions of
site effects are based on regression analyses, and therefore they correspond best to sites with
characteristics, such as shear wave velocity profiles, that are similar to the average
characteristics of the profiles in the databases upon which the expressions are based. It is
important to be aware of the empirical nature of such methods.
For critical bridges and for sites with unusual characteristics, it may be necessary to perform
site-specific ground motion response analyses. Site-specific ground motion response analyses
involve: (a) characterizing a soil profile down to bedrock, (b) collecting and adjusting
appropriate “rock” input earthquake acceleration time-histories (horizontal ground motions),
and (c) modelling the propagation of the ground motions from bedrock up to the ground surface.
The analyses may be conducted in one, two or three dimensions.
Soils are highly nonlinear, even at very low strain levels. To account for the effects of nonlinear
soil behaviour, ground response analyses are generally performed using one of the two basic
approaches: equivalent linear approach or nonlinear approach. In practice, owing to the
difficulty of characterizing nonlinear constitutive model parameters, the use of equivalent
linear analysis is preferred in which the effects of nonlinearity are approximated in a linear
analysis with the use of strain-compatible soil properties. In the equivalent linear approach, a
0 200 400 600 800 1000 1200 1400 1600
Eurocode 8
(British Standards Institution 2004)
MCPRC Guidelines
(MCPRC 2008)
New Zealand (Standards New Zealand 2004)
Australia (Standards Australia 2007)
AASHTO Guide Specifications
(AASHTO 2011)
Average shear wave velocity, m/s
Very soft soil
Loose/soft soil
Dense/stiff soil
Very dense/stiff
soil

42
linear analysis is performed using shear moduli and damping ratios that are based on an initial
estimate of the strain amplitude. The strain level computed using these properties is then
compared with the estimated strain amplitude and the properties adjusted until the computed
strain levels are very close to those corresponding to the soil properties.
The seismic hazard analysis may also need to be modified to account for near-fault effects. It
has been found over the last three decades that when a bridge site is located sufficiently near a
fault, and if the earthquake is a forward rupturing event (i.e. the fault ruptures toward the site),
the long-period motions at the bridge site can be significantly enhanced with the occurrence of
very large velocity pulse. It is necessary to take special precautions in these situations since
such motions can be very damaging to certain classes of bridges. The need to consider near-
fault effects, however, is generally limited to sites with well-defined shallow active faults,
partially because methods used to quantify near-fault effects are still a subject of research.
Furthermore, only bridge sites within about 16 km of a rupturing fault need to be considered
for fault directivity effects. For these reasons, methods to account for near-fault effects are not
elaborated here.
Representation of seismic action
Once the seismic hazard analysis has been conducted, the design ground motions for use in
design corresponding to the return periods determined must be characterized, either by
response spectra or time-histories.
(1) Response spectra
If a structure is subjected to a time-history of ground motion, the elastic structural response can
be readily calculated as a function of time, generating a structural response time-history.
However, it is often sufficient to know only the maximum amplitude of the response time-
history for design purposes.
The response spectra are curves plotted between the maximum response amplitudes
(displacement, velocity or acceleration) of single-degree-of-freedom (SDOF) systems
subjected to specified earthquake ground motions and the natural periods. Usually the response
of an SDOF system is determined by time domain or frequency domain analysis, and for a
given time period of system, the maximum response is picked. This process is continued for
all range of possible time periods of the SDOF system. Such plots pertain to specified damping
ratio and input ground motion. The response spectra can be interpreted as the locus of
maximum response amplitude of an SDOF system for a given damping ratio. The same process
can be carried out with different damping ratios to obtain the overall response spectra. The
plots can be used to determine the peak structural responses within the linear range, thus
facilitating the earthquake-resistant design of structures. The response spectra form the basis
of much of the structural analysis and design in modern earthquake engineering.
In general, the design ground motions are expressed in terms of acceleration response spectra,
which can be employed by both the force-based method and displacement-based method to
calculate the seismic demand. The acceleration response spectra for horizontal elastic
earthquake response can generally be defined as a dimensionless spectral shape factor (or
normalized horizontal elastic response spectrum) modified by a hazard factor (or reference
peak ground acceleration in m/s2) and a dimensionless return period factor accounting for
deviation from the reference return period in a design scenario (also known as importance
factor). The spectral shape factor is a piece-wise function of the time period, usually consisting
of a linearly ascending branch (short-period zone), a horizontal branch (constant acceleration
response-control zone), a descending branch inversely proportional to the time period (constant
velocity response-control zone) and possibly another descending branch inversely proportional

43
to the square of time period (constant displacement response-control zone) as shown in Figure
2.3, where the respective corner periods may be defined by TB, TC and TD. Besides, the spectral
shape factor is generally derived based on the “rock” site and a default damping ratio of 5%,
and it should be adjusted by soil factors for the local site conditions and by damping correction
factors for different damping ratios.
Period
TB TC TD T
Sp
ectr
al
shap
e f
acto
r
Figure 2.3 Shape of the elastic acceleration response spectrum
Figure 2.4 shows the plots of the spectral shape factors as defined in the bridge codes mentioned
in Section 2.2. The Eurocode spectral shape factor shown is based on Type 2 response spectrum
of BS EN 1998-1 (BSI, 2004c) since it is considered more relevant to the Hong Kong region
in accordance with SDMHR 2013 (Highways Department, 2013) compared to Type 1 response
spectrum. The AASHTO Guide Specifications (AASHTO, 2011) are not considered here for
two reasons. First, the document adopts a 1000-year reference return period which is quite
distinct from the 475- or 500-year return periods used by the other codes. Second, it adopts a
unique approximation method to construct the acceleration response spectrum based on two
more spectral accelerations in addition to the peak ground acceleration so that a spectral shape
factor cannot be separated from the hazard factors. Type 2 response spectrum of BS EN 1998-
1 generally gives a narrow plateau at the peak of the spectrum and, as a consequence, the
seismic coefficient decays more rapidly with the increase of structural period, especially for
loose/soft soil, as shown in Figure 2.4.
The consideration of vertical component of the ground motion is occasionally required in
design apart from the horizontal components. When the vertical component of the seismic
motion needs to be taken into account, the vertical response spectra may generally be developed
by scaling the horizontal response spectra.

44
Eurocode 8 (British Standards Institution 2004)
MCPRC Guidelines(MCPRC 2008)
New Zealand(Standards New Zealand 2004)
Australia(Standards Australia 2007)
Eurocode 8 (British Standards Institution 2004)
MCPRC Guidelines(MCPRC 2008)
New Zealand(Standards New Zealand 2004)
Australia(Standards Australia 2007)
(a)
(b)
(c)
Eurocode 8 (British Standards Institution 2004)
MCPRC Guidelines(MCPRC 2008)
New Zealand(Standards New Zealand 2004)
Australia(Standards Australia 2007)
Figure 2.4 Normalized horizontal elastic response spectrum defined in different codes
for (a) Rock site; (b) Very dense/stiff soil site; and (c) Loose/soft soil site
(2) Acceleration time-history
While the response spectrum method is the most common method of seismic analysis for

45
conventional bridge design, many geotechnical analyses and some of the more complex
structural analyses require the development of a set of acceleration time-histories to represent
the design earthquake. The appropriate time-histories should be consistent with the target
elastic response spectrum, and so the development of these time-histories generally starts with
establishing the elastic response spectrum according to relevant return period and site
conditions. The time-histories can be obtained from either recorded events or artificial
accelerograms.
Time histories are developed to be consistent with the target spectrum by first selecting a
candidate set of appropriate ground motion records with magnitudes, source distances and
mechanisms, duration of motions and other relevant seismic source characteristics consistent
with those defining the design seismic action. The candidate ground motion records are then
scaled so that the resultant mean spectrum developed from the scaled response spectra closely
matches the target response spectrum. The simplest form of time-history modification is
amplitude scaling by a constant factor, and this is also preferred by practising engineers. The
basic problem with such generated time-histories is that a single scaled time history will
generally fit the target spectrum only over a very narrow range of period because the
acceleration response spectrum generated from a naturally recorded time-history normally has
many peaks and valleys. Therefore, a suite of scaled time-histories is required to encompass
the entire target spectrum. According to BS EN 1998-2 (BSI, 2005b), a minimum of three
scaled time-histories shall be employed if scaled natural records are to be used in an analysis.
The candidate acceleration time-histories can be selected from one of the many available
databases of recorded earthquake ground motions (e.g. the Pacific Earthquake Engineering
Research Center - PEER database) with constraints on earthquake parameters such as
earthquake magnitude, source distance and shear wave velocity of site soil. The Next
Generation Attenuation (NGA) database developed by PEER (2018) including over 3000
strong ground motions records from shallow crustal earthquakes in active tectonic regimes
throughout the world is widely employed. The PEER website also includes a tool for selecting
and scaling time-histories to match a target spectrum.
When appropriate ground motion records are not available, appropriate artificial accelerograms
may be used. A great number of computer programmes are available for generating spectrum-
compatible artificial accelerograms, e.g. SIMQKE_GR (Gelfi, 2012). A spectrum-compatible
time-history has been modified also in the time or frequency domain in addition to amplitude
to achieve a match with the target spectrum. Even for an analysis using spectrum-compatible
time-histories, it may be necessary to use three sets of such motions to achieve a statistically
stable result.
Determination of seismic parameters for Hong Kong
SDMHR 2013 (Highways Department, 2013) refers to BS EN 1998-1 (BSI, 2004c) for the
equations of spectral shape factor and ground type classification criteria for defining the
response spectrum, but with supplementary specifications on the hazard factor and return
period factor so as to suit specific conditions in Hong Kong. The determination of these seismic
parameters is reviewed below.
The PGA as adopted in SDMHR 2013 is largely based on the seismic hazard analyses carried
out by the Geotechnical Engineering Office (GEO) of Civil Engineering and Development
Department, Hong Kong in 1995 with the University of Hong Kong. GEO Report No. 65 (Lee
et al., 1998) was then issued. The GEO assessment adopted the probabilistic approach by
considering 16 closest potential source zones near the Hong Kong region and 119 recorded
earthquakes in South China with appropriate modifications for the analysis of seismic hazard
in the Hong Kong region. The bedrock PGA corresponding to a return period of 475 years was

46
determined as about 0.08g in the northern part of Hong Kong and about 0.11g in the southern
part based on the GEO assessment, where g is the acceleration due to gravity. On the other
hand, Hong Kong has been included in the Seismic Ground Motion Parameters Zonation Map
of China since the 2001 edition (CSP, 2001). In the latest seismic zonation map (CSP, 2015),
the northern part of Hong Kong falls in the region of 0.10g and the southern part of Hong Kong
falls in the region of 0.15g, both of which are considered as belonging to intensity VII.
Although the seismic zonation map of China gives a higher value of 0.15g for the southern part
of Hong Kong, it may be due to the differences in terms of data coverage and data modification
in the GEO assessment. In the absence of other comprehensive assessment of seismicity in
Hong Kong, the “Final Report on the Study for Seismic Actions” prepared by Atkins (2012)
recommended to adopt a PGA value of 0.12g corresponding to a return period of 475 years as
the reference peak ground acceleration for the design of ordinary highway and railway bridges
in Hong Kong, which encompasses the recommended range of 0.077g to 0.117g across the
Hong Kong region from the GEO assessment.
Additionally, based on the recommendation given in GEO Report No. 65, the ratio of the PGA
value corresponding to a return period of 2500 years to that corresponding to a return period of
475 years ranges from 2.0 to 2.3. Therefore, on the basis of GEO Report No. 65, the “Final
Report on the Study for Seismic Actions” (Atkins, 2012) recommended a multiplicative
importance factor of 2.3 for seismic action with a return period of 2500 years. The importance
factor for seismic action with a return period of 1000 years was calibrated as 1.4.
The GEO commissioned Arup to carry out another study in 2009, involving an overall seismic
hazard assessment of Hong Kong and an area-specific seismic micro-zonation assessment of
the north-west New Territories area as well as an evaluation of the potential effects of
earthquakes on natural terrain. The findings together with updated seismic hazard contour plots
for Hong Kong were published in the “Final Report on Overall Seismic Hazard Assessment”
(Arup, 2012). A rock PGA ranging from 0.09g to 0.12g for a return period of 475 years could
be obtained from these updated contour plots. The “Final Supplementary Report on the Study
for Seismic Actions” (Atkins, 2013) concluded that the recommended reference PGA of 0.12g
as in the earlier “Final Report on the Study for Seismic Actions” was still appropriate for Hong
Kong (Atkins, 2013). GEO Report No. 311 (Arup, 2015) provided a thorough comparison of
the seismicity of the Hong Kong region with those of some other regions including the UK,
Eastern USA, Western USA, the Philippines, Japan, Greece and Beijing. It is found that the
average recurrence relationship of the Hong Kong region is very similar to that of Eastern
America, which is much higher than that of the UK (which is known to have pretty low
seismicity) and is about 40 times less than that in highly seismic areas such as California, Japan,
Taiwan or the Philippines.
The “Final Report on Overall Seismic Hazard Assessment” (Arup, 2012) also contains de-
aggregation plots of all earthquake occurrences that have contributed to the ground-motion
hazard values. For a hazard level with a return period of 475 years, it is found that the total
contribution of earthquakes with surface-wave magnitudes Ms = 4.42 and Ms = 5.3 amounts to
51%, which is marginally higher than the total contribution of earthquakes with Ms = 5.97 to
Ms = 7.43 (Atkins, 2013). It is thus considered that the earthquakes that contribute most to the
seismic hazard have an Ms not greater than 5.5. BS EN 1998-1 (BSI, 2004c) has specified two
types of standard response spectrum, i.e. Type 1 and Type 2, and it explains in Clause
3.2.2.2(2)P NOTE and 3.2.2.3(1)P NOTE that, “… if the earthquakes that contribute most to
the seismic hazard defined for the site for the purpose of probabilistic hazard assessment have
a surface-wave magnitude, Ms, not greater than 5.5, it is recommended that the Type 2 spectrum
is adopted…”. In view of the findings of the “Final Report on Overall Seismic Hazard
Assessment” (Arup, 2012), the BS EN 1998-1 Type 2 response spectrum shall be used in Hong

47
Kong as recommended in the “Final Supplementary Report on the Study for Seismic Actions”
(Atkins, 2013).

48
SEISMIC BRIDGE DESIGN SPECIFICATIONS
FOR HONG KONG
Introduction
The Structures Design Manual for Highways and Railways (SDMHR) has been providing
guidance and requirements for the design of highway and railway structures in Hong Kong
since its first release in August 1993. The second and third editions of SDMHR were published
in November 1997 and August 2006, respectively, while the latest edition, i.e. SDMHR 2013,
was released in May 2013 (Highways Department, 2013). Unlike the previous editions which
referred to the British Standards for design guidance, SDMHR 2013 has been revised for
migration to the structural Eurocodes. Specifically, the seismic bridge design shall follow the
provisions given in BS EN 1998-1 (BSI, 2004c), BS EN 1998-2 (BSI, 2005b), the UK national
annexes to BS EN 1998-1 (BSI, 2004e) and BS EN 1998-2 (BSI, 2005e), and the
recommendations in PD 6698 (BSI, 2009) except where modified by the manual to suit Hong
Kong conditions.
The key features of the seismic bridge design practices in SDMHR 2013 include:
SDMHR 2013 has established three importance classes, depending on the consequences
and economic losses associated with collapse of a bridge, closure of the bridge in the
immediate aftermath of the earthquake, and the cost of repair and/or replacement of the
bridge.
SDMHR 2013 has adopted probabilistic representation of the seismic hazard and adoption
of the 10%, 5% and 2% probabilities of exceedance in 50 years (i.e. 475-, 1000- and 2500-
year return periods, respectively) for the development of design spectra for bridges of
Importance Classes I, II and III, respectively. For a reference return period of 475 years,
the peak ground acceleration (PGA) on rock is taken to be 0.12g, where g is the
acceleration due to gravity, as recommended by Atkins (2012). This recommendation
aims to improve the seismic design requirements for bridges in Hong Kong. The ratios of
the PGAs corresponding to the 1000- and 2500-year return periods to that corresponding
to a 475-year return period, i.e. importance factors, are taken to be 1.4 and 2.3, respectively
(Atkins, 2012). A single value of PGA for the entire territory of Hong Kong is considered
sufficient.
SDMHR 2013 has adopted the use of response spectrum and site classification system
that consider the site factors for determining the design seismic actions in recognition of
the dynamic characteristics of both the structures and soils. Two types of response
spectrum have been defined in BS EN 1998-1 depending on the surface-wave magnitude
of the earthquakes that contribute most to the seismic hazard. It is recommended to adopt
the Type 2 response spectrum based on the de-aggregation of the overall seismic hazard
assessment of Hong Kong (Atkins, 2013).
SDMHR 2013 has adopted the response spectrum method as the basic method for seismic
demand analysis. Nonlinear time-history analysis is allowed as supplementary analysis.
SDMHR 2013 has applied the concept of intended ductile and limited ductile behaviour
of bridges. In accordance with BS EN 1998-2, the bridge shall be designed so that its
behaviour under the design seismic action is either ductile or limited ductile, unless
requested otherwise by the owners. A force-based approach with the adoption of
behaviour factor, as used in the BS EN 1998-2, aims at providing bridge engineers with

49
an easy way to conduct ductility design. The other measures essential to ductility design
are also introduced, including capacity design and detailed design.
The provisions given in SDMHR 2013 are the minimum requirements developed for the design
of new conventional bridges (i.e. slab, beam, girder and box girder superstructures) in Hong
Kong to resist the effects of earthquake motions. For special bridges (e.g. suspension bridges,
cable-stayed bridges, truss bridges, arch bridges and bridges with span exceeding 150 m) and
bridges of critical importance, the economic consequence of collapse or closure of such bridges
is comparatively higher than other bridges. Therefore, the owner should specify appropriate
project-specific requirements and compliance criteria for such bridges to achieve higher
performance for repairable and minimum damage. The owner may also conduct site-specific
hazard analysis for establishing the design seismic actions.
Design Seismic Action
Elastic response spectrum
According to Clause 4.7(1) of SDMHR 2013, “In the absence of site-specific hazard analysis,
Type 2 elastic response spectrum as defined in Clause 3.2.2 of BS EN 1998-1 shall be adopted
with ground type determined in accordance with Table 3.1 in Clause 3.1.2 of BS EN 1998-1.”
The horizontal elastic response spectrum Se is constructed using the shape factor modified by
soil factor S and damping correction factor η, reference peak ground acceleration agR and return
period factor (importance factor) γI as shown in Figure 3.1. The values of agR and γI are
specified in SDMHR 2013 and the spectral shape factor is obtained from the Type 2 elastic
response spectrum of BS EN 1998-1 as discussed above. The soil factor and corner periods TB,
TC and TD defining the shape of the Type 2 elastic response spectrum for a ground type as
shown in Table 3.1 are taken from Table 3.3 in Clause 3.2.2.2 of BS EN 1998-1. These soil
factors generally increase as the soil profiles becomes softer (i.e. in going from ground type A
to D) because of the strongly nonlinear behaviour of soil. The nonlinear soil behaviour
amplifies the structural response especially at periods from 0.10 s to 1.2 s as shown in Figure
3.2. The horizontal elastic response spectral acceleration for 10% probability of exceedance in
50 years is tabulated in Table 3.2 with the structural period, showing that the seismic
coefficients for structures of periods shorter than 1.0 s to 1.6 s will likely exceed 0.07g defined
in last version of SDMHR for the ultimate limit state.
TB TC TD
e
I gR
Sa
2.5S
C2.5T
ST
C D
22.5
T TS
T
T
100.55
5
where is the viscous damping ratio
of the structure expressed as a percentage
S
Figure 3.1 Definition of horizontal elastic response spectrum adopted by SDMHR 2013

50
Table 3.1 Values of parameters describing the Type 2 horizontal elastic response
spectrum Ground Type S TB (s) TC (s) TD (s)
A 1.00 0.05 0.25 1.20
B 1.35 0.05 0.25 1.20
C 1.50 0.10 0.25 1.20
D 1.80 0.10 0.30 1.20
E 1.60 0.05 0.25 1.20
Figure 3.2 Horizontal elastic response spectra with ξ = 5% for the five basic sites
0.00
1.00
2.00
3.00
4.00
5.00
0 1 2 3 4
Sp
ectr
al
sha
pe
fact
or
Se/
(γIa
gR)
Period T (s)
ABCDE

51
Table 3.2 Elastic response spectral acceleration for 10% probability of exceedance in 50
year (unit: g) Period Type A Type B Type C Type D Type E
0.00 0.120 0.162 0.180 0.216 0.192
0.05 0.300 0.405 0.450 0.540 0.480
0.25 0.300 0.405 0.450 0.540 0.480
0.35 0.217 0.293 0.326 0.415 0.348
0.44 0.170 0.230 0.256 0.338 0.273
0.54 0.140 0.189 0.210 0.284 0.224
0.63 0.119 0.161 0.179 0.245 0.190
0.73 0.103 0.140 0.155 0.216 0.166
0.82 0.091 0.123 0.137 0.193 0.146
0.92 0.082 0.111 0.123 0.174 0.131
1.01 0.074 0.100 0.111 0.159 0.119
1.11 0.068 0.092 0.102 0.146 0.109
1.20 0.063 0.084 0.094 0.135 0.100
1.30 0.053 0.072 0.080 0.115 0.085
1.40 0.040 0.062 0.069 0.099 0.073
1.48 0.041 0.055 0.062 0.089 0.066
1.60 0.035 0.047 0.053 0.076 0.056
1.76 0.029 0.039 0.044 0.063 0.046
2.04 0.022 0.029 0.032 0.047 0.035
2.32 0.017 0.023 0.025 0.036 0.027
2.60 0.013 0.018 0.020 0.029 0.021
2.88 0.011 0.015 0.016 0.023 0.017
3.16 0.009 0.012 0.014 0.019 0.014
3.44 0.008 0.010 0.011 0.016 0.012
3.72 0.007 0.009 0.010 0.014 0.010
4.00 0.006 0.008 0.008 0.012 0.009
Note: For elastic response spectral accelerations for 5% and 2% probabilities of exceedance in 50 years, which
are adopted for the design of bridges in Importance Classes II and III, the above values shall be multiplied by
importance factors of 1.4 and 2.3, respectively.
The vertical elastic response spectrum SVe is defined as shown in Figure 3.3. The parameters
defining the magnitude and shape of the Type 2 vertical elastic response spectrum as shown in
Table 3.3 are taken from Table 3.4 in Clause 3.2.2.3 of BS EN 1998-1.

52
TB TC TD
e
I VgR
Sa
3.0
C3.0T
T
C D
23.0
T T
T
T
100.55
5
where is the viscous damping ratio
of the structure expressed as a percentage
1
Figure 3.3 Definition of vertical elastic response spectrum adopted by SDMHR 2013
Table 3.3 Values of parameters describing the Type 2 vertical elastic response spectrum aVgR/agR TB (s) TC (s) TD (s)
0.45 0.05 0.15 1.00
Site-specific probabilistic hazard analysis shall be conducted to develop spectra that are more
accurate for the local seismic and site conditions than that obtained using the general procedure
if any of the following applies:
Soils at the site require site-specific evaluation, i.e. ground types S1 and S2, according to
Clause 3.1.2(4) of BS EN 1998-1.
The bridge is considered to be critical or essential, for which a higher degree of confidence
of meeting the performance requirement is desirable.
A site-specific procedure shall also be used if the site is located within 10 km horizontally of a
known active seismotectonic fault that may produce an event of Moment Magnitude higher
than 6.5 according to Clause of 3.2.2.3 of BS EN 1998-2. Based on GEO Report No. 65 (Lee
et al., 1998), none of the faults in Hong Kong or in the vicinity of Hong Kong exhibits any
evidence of significant recent activity. Therefore, it is recommended in Clause 4.7(3) of
SDMHR 2013 that “all faults within 10 km horizontally of Hong Kong may be considered not
active” and the near source effects in BS EN 1998-2 need not be considered in Hong Kong
(Atkins, 2012).
Design spectrum for elastic analysis
It is desirable to design a bridge for ductile behaviour or limited ductile behaviour especially
in regions of moderate-to-high seismicity as specified in Clause 2.3.2 of BS EN 1998-2, which
means that the structure could go into the inelastic range that permits their design for resistance
to seismic forces to be smaller than those corresponding to a linear elastic response. To avoid
explicit inelastic analysis, a behaviour factor (q) is allowed for the structure to undertake a
fraction of the elastic seismic action necessary for an elastic response, i.e. equivalent linear
analysis. The values of the behaviour factor for various materials and structural systems should
be taken from Table 4.1 in Clause 4.1.6 of BS EN 1998-2 according to the relevant ductility
classes and modified as necessary to account for effects of normalized axial force and
accessibility of intended plastic hinges in accordance with Clause 4.1.6(5)-(7) of BS EN 1998-
2. The design seismic actions shall be derived by dividing the elastic seismic actions by the

53
behaviour factor, but need not be smaller than 20% of the elastic seismic actions in accordance
with Clause 3.2.2.5 of BS EN 1998-1.
Seismic Demand Analysis
Method of analysis
BS EN 1998-2 has mentioned various methods, including the fundamental mode method
(single-mode response spectrum method), response spectrum method and both static (pushover
analysis) and dynamic (time-history analysis) nonlinear methods for the purpose of estimating
the force and displacement demands on a bridge during an earthquake. The response spectrum
method is the primary method and may be replaced by the fundamental mode method to
consider only the fundamental mode of the structure for very simple bridges described in
Clause 4.2.2.2 of BS EN 1998-2. The nonlinear time-history analysis can be used only in
combination with a standard response spectrum analysis to provide insight into the post-elastic
response as stipulated in Clause 4.2.4.1(2) of BS EN 1998-2. The nonlinear time-history
analysis or static nonlinear analysis may be required for bridges of irregular seismic behaviour
as described in Clauses 4.1.8 and 4.1.9 of BS EN 1998-2. Specifically, a force reduction factor
ri for ductile member i is obtained as
ri = qMEd,i
MRd,i (3.1)
where MEd,i is the maximum value of design moment at the intended plastic hinge location of
ductile member i as derived from the analysis for the seismic design situation; q is the behaviour
factor used in the analysis; and MRd,i is the design flexural resistance of the same section with
its actual reinforcement under the concurrent action of non-seismic action effects in the seismic
design situation. A bridge is considered to have irregular behaviour in the horizontal direction
considered when the following condition is not met:
ρ = rmax
rmin ≤ ρ
0 (3.2)
where rmax and rmin are the maximum and minimum values of the local force reduction factors
among all ductile members, respectively; and ρ0 = 2 is recommended in BS EN 1998-2.
The rationale is associated with the varying overstrength among piers. The sequential yielding
of the ductile members may cause concentration of unacceptably high ductility demands and
redistribution of stiffnesses after the formation of the first plastic hinges, leading to deviations
of the results of the equivalent linear analysis performed with the assumption of a global force
reduction factor q (behaviour factor) from those of the nonlinear response of the bridge.
Loading
According to Clause 5.5 of BS EN 1998-2, the load combination in the seismic design situation
is:
Ed = Gk "+" Pk "+" AEd "+" Ψ21Q1k "+" Q2 (3.3)
where "+" = “to be combined with”; Gk = the permanent actions including self-weight and
superimposed dead loads (e.g. road surfacing, parapet, etc.) with their characteristic values; Pk
= the characteristic value of prestressing after all losses; AEd = the design seismic action; Q1k =
the characteristic value of traffic load; Ψ21 = the combination factor for traffic loads; and Q2 =
the quasi-permanent value of actions of long duration (e.g. earth pressure, buoyancy, currents,
etc.). In particular, the accompanying traffic and the value of factor Ψ21 are taken in accordance
with Clause 4.9 of SDMHR 2013 as Ψ21 = 0.2 for Load Model 1 (BSI, 2003) for road bridges

54
and Ψ21 = 0.2 for uniformly distributed load qfk (BSI, 2003) for footbridges.
The seismic input is quantified in terms of either a design response spectrum or a spectrum-
compatible ground motion time-history generated in accordance with Clause 3.2.3 of BS EN
1998-2 for each component of the earthquake ground motion, depending on the method of
analysis. In general, only the horizontal components of the seismic action need to be taken into
account for the design of bridges. The vertical earthquake consideration may not be ignored for
bridges having unusual framing or geometrical configurations as described in Clause 4.1.7 of
BS EN 1998-2. Bridges with components sloping in the vertical direction, prestressed concrete
deck, and components such as bearings and links will be affected by vertical ground motions.
According to Clause 3.1.2 of BS EN 1998-2, the bridge can be analysed separately for the
components of the seismic action in the longitudinal, transverse and vertical directions, and the
action effects in each direction under consideration are then combined by applying the SRSS
rule (i.e. square root of the sum of squares of the modal responses) or the 30% rule in
accordance with Clause 4.2.1.4 of BS EN 1998-2 (which refers to Clause 4.3.3.5.2(4) of BS
EN 1998-1) when the response spectrum method is applied, while the bridge should be
analysed under the simultaneous action of different components when nonlinear time-history
analysis is performed.
For bridges with a continuous bridge deck, the spatial variability of ground motions should be
included in the analysis if either the supports are founded on more than one ground types or
the length of the continuous bridge deck exceeds a limiting length regardless of the ground
types as stipulated in Clause 4.8 of SDMHR 2013. The simplest way to consider the spatial
variability of ground motions is by using a single input seismic action (e.g. a single response
spectrum or the corresponding accelerogram sets) corresponding to the most severe ground
type underneath the bridge supports for the entire structure as described in Clause 3.3(4) of BS
EN 1998-2.
Modelling
The models used for dynamic analysis should include the strength, stiffness, mass and energy
dissipation characteristics of the structural members and components of the bridge. Depending
on the method of dynamic analysis, different approximations may be used for modelling these
quantities. Clause 4.1 of BS EN 1998-2 provides general guidance on the distribution of
stiffness and mass to capture the response of a bridge subjected to an earthquake.
In general, the number and location of the displacement degrees of freedom in a bridge
model determine the way mass is represented and distributed throughout the structure.
The degree of discretization shall represent the distribution of mass so that all significant
deformation modes and inertial forces are activated under the design seismic excitation.
As most of the mass of a bridge is in the superstructure, the superstructure may generally
be divided into four to five elements per span (Marsh et al., 2014).
The seismic response of a bridge with piers in deep water is affected by the hydrodynamic
mass of a volume of water that is forced to move with the piers. This mass should be added
to the mass of the pier when modelling the mass of a bridge as stipulated in Clause 4.1.2(5)
of BS EN 1998-2. The hydrodynamic added mass is obtained by the mass of a cylinder of
water of length equal to the immersed depth. Reasonable estimates of the diameter of the
cylinder of water, depending on the shape of the pier cross-section, are given in Annex F
of BS EN 1998-2. For piers of circular cross-section, for instance, the diameter of the
cylinder of water is equal to the diameter of the pier.

55
The model should represent the stiffness of individual structural elements considering the
material properties and section dimensions. When an elastic analysis is used to determine
the response of an inelastic structure, the stiffness may be based on an equivalent
linearized value. A value calculated on the basis of the secant stiffness at the theoretical
yield point as shown in Figure 3.4 may be used for reinforced concrete piers in bridges
designed for either ductile or limited ductile behaviour, as specified in Clause 2.3.6.1 of
BS EN 1998-2. In the absence of sophisticated moment-curvature analysis, the secant
stiffness at the theoretical yield point may be determined by one of the two approximate
methods presented in Annex C of BS EN 1998-2. For prestressed or reinforced concrete
decks, on the other hand, the stiffness of the uncracked gross concrete sections may
generally be used. However, the torsional stiffness of concrete decks should be discounted
to account for cracking. For open sections or slabs, the torsional stiffness may be ignored.
For prestressed concrete box sections, the effective stiffness may be based on 50% of the
uncracked gross section stiffness. For reinforced concrete box sections, 30% of the
uncracked gross section stiffness may be used in the modelling.
ϕy ϕy'
My
MRd
ϕu
Moment
Curvature
EcJeff= MRd/ϕy'
Figure 3.4 Moment-curvature relationship of cross-section for reinforced concrete
The energy dissipation in a bridge is represented by viscous damping. The selection of an
effective viscous damping ratio depends on the type of dynamic analysis. This is usually
done by scaling the earthquake response spectrum for the correct amount of damping
when response spectrum analysis is used. Suitable damping values may be obtained from
field measurements of induced free vibrations or from forced vibration tests. In lieu of
measurements, equivalent viscous damping ratios recommended in Clause 4.1.3(1) of BS
EN 1998-2 on the basis of the material of the ductile members may be used. Equivalent
viscous damping ratios of 5% and 2% are usually assumed for reinforced concrete and
prestressed concrete, respectively. In nonlinear analysis, the stress-strain diagrams for
both concrete and reinforcement in the regions of potential plastic hinges should reflect
the probable post-yield behaviour, taking into account the confinement of concrete and
strain hardening effect for steel as discussed in Annex E.2 of BS EN 1998-2. The shape
of hysteresis loops should also be properly modelled, taking into account the degradation
of strength and stiffness, and hysteretic pinching, if dynamic time-history analysis is
performed.
In accordance with Clause 4.1.4(1) of BS EN 1998-2, soil-structure interaction normally
need not be taken into account in the seismic analysis of the entire structure with the
supporting members (e.g. piers and abutments) fixed on the foundation soil. However,

56
when the soil flexibility contributes more than 20% of the total displacement at the top of
pier, the soil-structure interaction effects should always be considered as stipulated in
Clause 4.1.4(2) of BS EN 1998-2, using the appropriate impedances or appropriately
defined soil springs in accordance with BS EN 1998-5 (BSI, 2004d). Similar provisions
can be found in the AASHTO Guide Specifications for LRFD Seismic Bridge Design
(AASHTO Guide Specifications) (AASHTO, 2011) as described in Table 3.4.
Table 3.4 Definition of foundation modelling method (AASHTO, 2011)
Design and Capacity Verification
In BS EN 1998-2, the earthquake-resisting capacity of a bridge shall be verified according to
the method of analysis used. In general, strength verification shall be conducted for bridges
designed by the equivalent linear method taking into account ductile or limited ductile
behaviour of the structure, whereas the deformation verification shall be applied on the basis
of results of nonlinear analysis.
Strength verification
(1) Materials and design strength
The design flexural resistance MRd and design shear resistance VRd of a reinforced concrete
section shall be determined in accordance with Clauses 6.1 and 6.2 and of BS EN 1992-1 (BSI,
2004a), respectively, and with Clause 5.6.3.4(2)(3)(4) of BS EN 1998-2 where relevant, based
on the actual dimensions of the cross-section, final amount of reinforcement, interaction with
the axial force and possibly with biaxial bending where relevant. In particular, the ductile
concrete members in bridges designed for ductile behaviour shall be reinforced with steel of
Grade 500C described in CS2:2012 (SCCT, 2012) in accordance with Clause 5.2.1 of BS EN
1998-2 and Clause 4.10 of SDMHR 2013. Non-ductile concrete members of bridges designed
for ductile behaviour and all concrete members of bridges designed for limited ductile
behaviour may be reinforced with steel of Grade 500B described in CS2:2012 (SCCT, 2012).
(2) Design seismic action effects and capacity design effects
The design value of moment as derived from the linear analysis for the seismic design situation,
after modification to take into account second order effects as specified in Clause 5.4 of BS
EN 1998-2, is designated as MEd. The design value of shear force, i.e. the value as derived from
the linear analysis for the seismic design situation multiplied by the behaviour factor q used in
the analysis, is designated as VEd.
For structures designed for ductile behaviour, additional capacity design effects MC and VC
shall be calculated by analysing the intended plastic mechanism as described in Clause 5.3 of
BS EN 1998-2. Specifically, to account for the variability of material strength properties, an
overstrength moment M0 of a section is defined as
Foundation type Modelling method I Modelling method II
Spread footing Rigid Rigid for rock sites and hard soil sites. For other
soil types, foundation springs required if footing
flexibility contributes more than 20% to pier
displacement.
Pile footing with pile cap Rigid Foundation springs required if footing flexibility
contributes more than 20% to pier displacement.
Pile bent / drilled shaft Estimated depth to fixity Estimated depth to fixity or soil-springs based
on P-y curves.

57
M0 = γ0MRd (3.4)
where γ0 is the overstrength factor whose value depends on the material and the normalized
axial force as specified in Clause 5.3(4) of BS EN 1998-2. A value of 1.35 is recommended for
concrete members. The capacity design effects MC and VC within the length of members that
develop plastic hinge(s) are then calculated under the level of seismic action at which all
intended flexural hinges have developed bending moments equal to their overstrength moment
as shown in Figure 3.5, but they need not be taken as greater than those resulting from the
linear analysis for the seismic design situation multiplied by the behaviour factor q used in the
analysis. Besides, the capacity design moment MC in the vicinity of the hinge need not be taken
as greater than the relevant design flexural resistance MRd of the nearest hinge.
MEdMRdM0=γ0MRd
MC
Plastic hinge
Pier
Hinge
length
Figure 3.5 Capacity design moments MC within the member cotaining plastic hinge(s)
(3) Resistance verification
The general criteria for resistance verification are given in Clause 2.3.3 of BS EN 1998-2. In
bridges designed for ductile behaviour, the regions of plastic hinges shall be verified to have
adequate flexural strength to resist the design seismic action effects, while the shear resistance
of the plastic hinges as well as both the shear and flexural resistances of all other regions shall
be designed to resist the capacity design effects. The purpose of the capacity design is to ensure
that an appropriate hierarchy of resistance exists within various structural components and
undesirable modes of inelastic deformation, such as plastic hinging at unintended locations, or
shear failure, cannot occur. In bridges designed for limited ductile behaviour, all sections
should be verified to have adequate strength to resist the design seismic action effects. These
criteria are summarized and compared in Table 3.5.
Table 3.5 Resistance verification criteria of concrete sections
Resistance Bridges of ductile behaviour Bridges of limited ductile behaviour
Plastic hinges Outside plastic hinges All sections
Flexural MEd ≤ MRd MC ≤ MRd MEd ≤ MRd
Shear VC ≤ VRd / γBd VC ≤ VRd / γBd VEd ≤ VRd / γBdl
Note: The shear resistance of concrete members shall be divided by an additional safety factor against brittle
failure. The safety factor for structures of limited ductile behaviour γBd1 is recommended to be 1.25 and that for
structures of ductile behaviour γBd is related to γBd1 as specified in Clause 5.6.3.3(1)b) of BS EN 1998-2.
It is noted that BS EN 1998-2 does not require capacity design for bridges based on the design
for limited ductile behaviour. In fact, the design shear force for limited ductile behaviour VEd
with additional amplification by using a safety factor γBd1 of about 1.25 does not necessarily
cater for the possible material overstrength. As a consequence, shear failure may still occur.
The designer may wish to adopt ductile design instead.

58
(4) Verification of protected components
According to BS EN 1998-2, no significant yielding as described in Clause 5.6.3.6(2) shall
occur in the bridge deck. Verification should be carried out under the most adverse design
seismic action effects for bridges of limited ductile behaviour, and under the capacity design
effects for bridges of ductile behaviour.
All critical structural components of concrete abutments shall be designed to remain essentially
elastic under the design seismic action. For those abutments flexibly connected to the deck as
defined in Clause 6.7.2 of BS EN 1998-2, the capacity design effects from the bearings should
be taken into account for the seismic design of the abutments if a ductile behaviour has been
assumed for the bridge.
Any joint between a vertical ductile pier and the deck or a foundation element adjacent to a
plastic hinge in the pier shall be designed in shear to resist the capacity design effects of the
plastic hinge in the relevant direction. The design and verification of joints shall be conducted
in accordance with Clause 5.6.3.5 of BS EN 1998-2.
Deformation verification
A ductile member is intentionally designed to deform inelastically for several cycles without
significant degradation of strength or stiffness under the design seismic actions. Besides, the
intended plastic hinges shall be provided with adequate ductility to ensure the required overall
global ductility of the structure. Note that conformance to accompanying details specified in
the code is deemed to ensure the availability of adequate local and global ductility as well as
stable ductile behaviour. When nonlinear static or dynamic analysis is performed, however, the
chord rotation demands shall be checked against the available rotation capacities of the plastic
hinges in accordance with Clause 4.2.4.4 of BS EN 1998-2. Specifically, the plastic hinge
rotation demands θp,E shall be safely lower than the rotation capacities as follows:
θp,E ≤ θp,u / γR,p (3.5)
where θp,u is the probable rotation capacities derived from relevant test results or calculated
from the ultimate curvatures and plastic hinge lengths as shown in Annex E.3 of BS EN 1998-
2; and γR,p is a safety factor that reflects local defects of the structure, uncertainties of the model
and/or the dispersion of relevant test results.
Seismic Relevant Detailing
Confinement for concrete and main bars
The reliable performance of ductile members largely depends on the structural details. To be
able to sustain the levels of inelastic deformation required under the design-level earthquake
without premature failure, the potential plastic hinge regions must be properly detailed. The
detailing rules are as follows:
Ductile behaviour of the compression concrete zone shall be ensured within the potential
plastic hinge regions. This is accomplished by providing an adequate amount of confining
reinforcement over the design length of potential plastic hinge as described in Clause 6.2.1
of BS EN 1998-2. Confinement of compression zone shall be provided in the potential
hinge regions where the normalized axial force exceeds 0.08 as specified in Clause
6.2.1.1(2) of BS EN 1998-2 and in critical sections of bridges designed for limited ductile
behaviour as specified in Clause 6.5.1(2) of BS EN 1998-2, unless confinement is not
necessary according to 6.2.1.1(3) of BS EN 1998-2. Pursuant to Clause 6.2.4(4) of BS EN
1998-2, there is no need for verification of the confining reinforcement in accordance with

59
Clause 6.2.1 of BS EN 1998-2 in piers with simple or multiple box section unless the
normalized axial force exceeds 0.20, provided that avoidance of buckling of longitudinal
compression reinforcement is ensured in accordance with Clause 6.2.2 of BS EN 1998-2.
Buckling of longitudinal reinforcement shall be avoided along potential hinge areas of
bridges designed for ductile behaviour and along critical sections of bridges designed for
limited ductile behaviour, even after several cycles into the post-yield region. Transverse
reinforcement (hoops or cross-ties) perpendicular to the longitudinal bars in accordance
with Clause 6.2.2 of BS EN 1998-2 shall be provided.
The confining reinforcement shall be properly anchored and/or spliced in accordance with
Clauses 6.2.2(3)a), 6.2.3(1) and (2) of BS EN 1998-2. Besides, no splicing by lapping or
welding of longitudinal reinforcement is allowed within the plastic hinge region.
Overlap length and clearance
During an earthquake, out-of-phase response between adjacent girders and between girders and
abutments may lead to large relative hinge displacements including hinge opening and closing,
resulting in unseating of girders and pounding of adjacent elements. These shall be avoided by
providing sufficient overlap length and/or clearance at articulations to accommodate the
displacements in the seismic design situation.
(1) Design value of displacement
The design seismic displacement dE shall be derived in accordance with Clause 2.3.6.1(6) of
BS EN 1998-2, with the displacement determined from a linear analysis based on the design
spectrum multiplying by the displacement ductility factor specified in Clause 2.3.6.1(8) of BS
EN 1998-2. Additionally, the displacement in the seismic design situation shall also take into
account the long-term displacement due to post-tensioning, shrinkage and creep for concrete
decks dG, displacement due to thermal movements dT, and the effective displacement of two
parts due to the spatial variation of the seismic ground displacement deg estimated in accordance
with Clause 6.6.4(3) of BS EN 1998-2.
(2) Minimum overlap length and clearance
At locations where the relative movement between structural elements is intended under
seismic conditions, clearance shall be provided between those elements as specified by Clause
2.3.6.3 of BS EN 1998-2. At supports where the relative movement between the supported and
supporting members is intended, a minimum overlap length shall be provided to maintain the
function of the support under extreme seismic displacement as specified by Clause 6.6.4 of BS
EN 1998-2. The values of minimum overlap length and clearance are slightly different from
location to location as summarized below:
For protection of critical or major structural members, the clearance shall accommodate
dEd, i.e. the total design value of the displacements dE, dG and dT combined in accordance
with Clause 2.3.6.3(2) of BS EN 1998-2.
In the case of ductile / resilient members or special energy absorbing devices provided
between major structural members to prevent large shock forces caused by unpredictable
impact, a slack at least equal to dEd shall be designed.
For non-critical structural components such as deck movement joints and abutment back-
walls that are expected to be damaged due to the design seismic action but avoiding any
damage under frequent earthquakes, the clearance may accommodate fractions of dE and
of dT, respectively, after allowing for any dG as specified in Clause 2.3.6.3(5) of BS EN

60
1998-2. The appropriate values of such fractions shall be chosen to cater for a predictable
mode of damage and provide for the possibility of permanent repair.
At an end support of an abutment, the basic minimum overlap length lov in accordance with
Clause 6.6.4(3) of BS EN 1998-2 shall be provided, i.e. sum of dEd and deg plus a minimum
support length for safe transmission of the vertical reaction (no less than 400 mm).
In the case of an intermediate separation joint between two sections of the deck such as in-
span hinge, the minimum overlap length should be estimated by taking the square root of
the sum of the squares of lov calculated for each of the two sections of the deck.
At an end support of a deck section on an intermediate pier, the minimum overlap length
should be taken as lov plus dE of the top of the pier.
For decks connected to piers or to an abutment through seismic links with slack, the
minimum overlap lengths defined above shall be increased by the slack.
Bearings and seismic links
The bearings comprise fixed bearing, moveable bearing and elastomeric bearing. The seismic
demands on bearings shall be taken in accordance with Clause 6.6.2 of BS EN 1998-2.
Fixed bearings shall generally be designed to resist the design seismic action effects determined
through capacity design. Fixed bearings may be designed solely for the effects of seismic
design situation from the analysis, provided that they can be replaced without difficulties and
that seismic links are provided as a second line of defence. Moveable bearings shall be capable
of accommodating without damage the displacement dEd. Elastomeric bearings to resist only
non-seismic horizontal actions shall be designed to resist the maximum shear deformation
imposed by vertical compression, total design horizontal displacement and total design angular
rotation.
Foundation Design
According to SDMHR 2013, Eurocodes shall be used for the design of new highway structures,
with the exception of foundation design. The provisions for the design of foundations given in
BS EN 1997-1 (for normal operation design) (BSI, 2004b) and BS EN 1998-5 (for earthquake
resistance design) (BSI, 2004d) are not followed. The foundations of highway structures in
Hong Kong shall be designed in accordance with the principles set out in BS 8004:1986 (BSI,
1986) and the pile design shall be carried out by reference to Geotechnical Engineering Office
Publication No. 1/2006 (GEO, 2006).
The design philosophy of BS 8004:1986 is fundamentally different from that of Eurocodes. In
2015, however, the second edition of BS 8004 was released and the design philosophy was
completely changed reflecting advances in foundation technology over the past 30 years. The
design philosophy of BS 8004:2015 (BSI, 2015) is fully compatible with the Eurocodes. It is
desirable for practising engineers to be mindful of the latest changes and the difference in
foundation design concepts between BS EN 1997-1 and BS 8004:1986.
Limit states
BS EN 1997-1 has been drafted on the basis of limit state design and, more importantly, it
makes a clear distinction between the ultimate limit state (ULS) design and serviceability limit
state (SLS) design for spread foundations and piled foundations as shown in Table 3.6. For
each geotechnical design situation, it shall be verified that no relevant limit state is exceeded.
Unlike BS EN 1997-1, BS 8004:1986 provides much advisory information, i.e. not obligatory,

61
and it often refers readers to datasheets and other publications. Because of the nature of its
design philosophy, BS 8004:1986 does not distinguish ULS from SLS explicitly. Instead, it
goes through a whole list of design considerations one by one as shown in Table 3.7, which
essentially overlap with items in BS EN 1997-1 (Wang and Thusyanthan, 2008).
Table 3.6 General design requirements set out in BS EN 1997-1 (BSI, 2004b)
Limit states Design requirements
Spread foundations Piled foundations
Ultimate limit state (ULS)
Overall stability
Adequate bearing resistance
Adequate sliding resistance
Adequate structural capability
Overall stability
Adequate bearing resistance
Adequate uplift resistance
Adequate structural capability
Serviceability limit state (SLS)
No excessive settlement
Design against heave
Design for vibration loads
No excessive settlement
No excessive lateral movement
Design against heave
Design for vibration loads
Table 3.7 Comparison between BS 8004:1986 and BS EN 1997-1 on design requirements BS 8004:1986 BS EN 1997-1
Ground movement, due to
Application of load
Removal of load
Factors independent of foundation load
Overall stability; settlement; heave
Ground water; flooding Heave; uplift; downdrag
Allowable bearing pressure Bearing capacity
Structural considerations Structural capacity
Ground / Structure interdependence Soil / Structure interaction
Moreover, BS EN 1997-1 subdivides ULS into 5 broad categories as described below:
EQU: Loss of equilibrium of the structure or the ground, considered as a rigid body, in
which the strengths of structural materials and the ground are insignificant in providing
resistance.
STR: Internal failure or excessive deformation of the structure or structural elements,
including footings, piles, basement walls, etc., in which the structural material is
significant in providing resistance.
GEO: Failure or excessive deformation of the ground, in which the strength of soil or rock
is significant in providing resistance.
UPL: Loss of equilibrium of the structure or the ground due to uplift by water pressure
(buoyancy) or other vertical actions.
HYD: Hydraulic heave, internal erosion and piping in the ground caused by hydraulic
gradients.
The main focal points in ULS design are the GEO and STR limit states. The UPL and HYD
limit states should only be checked if buoyancy and hydraulic gradients are matters of concern,
while the EQU limit state is limited to rare cases such as a rigid foundation bearing on rock
(BSI, 2004b). Each category has a particular set of partial factors, which should be applied in
the corresponding design calculations.
Basis of design
BS EN 1997-1 allows limit states, including both ULS and SLS, to be verified by one or a
combination of the following methods:

62
Use of calculations
Adoption of prescriptive measures
Experimental models and load tests
An observational method
(1) Design by calculation
Design by calculation is a direct method, which comprises separate analyses for each of the
limit states. It involves examination of actions, properties of substrate materials, geometrical
data, limiting values of deformations, crack widths, vibrations, etc., and calculation models, as
illustrated in Figure 3.6. It shall be verified that the design effects of actions will not exceed
the design resistance and any relevant serviceability criterion is within its limiting value. The
resistance to an action as well as the settlement may be calculated using an analytical model, a
semi-empirical model or a numerical model.
Weight of soil and rock
Stress in ground
Earth pressures
Free water pressures
Ground water pressures
Seepage forces
Dead and imposed loads
Surcharges
Mooring forces
Removal of load or excavation of ground
Traffic loads
Indirect actions
Actions
Soils
Rocks
Other materials
Ground properties
Geometrical data
Design by calculation
Limiting values for movements
Calculation models
Analytical
Semi-empirical
Numerical
Limit states
Serviceability limit states
Ultimate limit states
Loss of static equilibrium
(EQU)
Rupture or excessive deformation of
structure or ground (STR and GEO)
Uplift (UPL)
Heave by seepage of water
(HYD)
Design approach 1
Design approach 2
Design approach 3
Figure 3.6 Illustration for design by calculation (Bond and Harris, 2008)
In view of the fact that many components can affect the performance of a foundation such as
material properties and types of actions, BS EN 1997-1 introduces three distinctive Design
Approaches (DAs) for the GEO and STR limit states in the persistent and transient situations.
They differ in the way the partial factors are distributed between actions or the effects of actions
(denoted by Ai, i = 1, 2), soil properties (denoted by Mi, i = 1, 2) and resistances (denoted by
Ri, i = 1, 2, 3, 4) as explained below with the i-th set of values of the partial factors shown in
Table 3.8:
DA-1 Combination 1: A1 “+” M1 “+” R1
In this approach, partial factors are applied to actions or effects of actions alone.
DA-1 Combination 2 (except for the design of axially loaded piles and anchors): A2 “+”
M2 “+” R1
In this approach, partial factors are applied mainly to ground strength parameters.
DA-1 Combination 2 (for axially loaded piles and anchors): A2 “+” (M1 or M2) “+” R4

63
In this approach, partial factors are applied to actions or effects of actions and to ground
resistances for calculating resistances of piles, and sometimes to ground strength
parameters for calculating unfavourable actions on piles, for example, owing to negative
skin friction or transverse loading.
DA-2: A1 “+” M1 “+” R2
In this approach, partial factors are applied to actions or effects of actions and to ground
resistances simultaneously.
DA-3: (A1 or A2) “+” M2 “+” R3
In this approach, partial factors are applied to actions or effects of actions from the
structure and to ground strength parameters simultaneously.

64
Table 3.8 Partial factor sets for ULS foundation design based on BS EN 1997-1 Partial factors on actions (γF) or effects of actions (γE), based on Table A-3 of BS EN 1997-1 Annex A
Action Symbol Set
A1 A2
Permanent Unfavourable
γG 1.35 1.0
Favourable 1.0 1.0
Variable Unfavourable
γQ 1.5 1.3
Favourable 0 0
Partial factors for soil parameters (γM), based on Table A-4 of BS EN 1997-1 Annex A
Material Property Symbol Set
M1 M2
Angle of shearing resistance γφ' 1.0 1.25
Effective cohesion γc' 1.0 1.25
Undrained shear strength γcu 1.0 1.4
Unconfined compressive strength γqu 1.0 1.4
Weight density γγ 1.0 1.0
Partial resistance factor (γR) for spread foundation, based on Table A-5 of BS EN 1997-1 Annex A
Resistance Symbol Set
R1 R2 R3
Bearing γR;v 1.0 1.4 1.0
Sliding γR,h 1.0 1.1 1.0
Partial resistance factor (γR) for driven piles, based on Table A-6 of BS EN 1997-1 Annex A
Resistance Symbol Set
R1 R2 R3 R4
Base γb 1.0 1.1 1.0 1.3
Shaft (compression) γs 1.0 1.1 1.0 1.3
Total/combined (compression) γt 1.0 1.1 1.0 1.3
Shaft in tension γs,t 1.25 1.15 1.1 1.6
Partial resistance factor (γR) for bored piles, based on Table A-7 of BS EN 1997-1 Annex A
Resistance Symbol Set
R1 R2 R3 R4
Base γb 1.25 1.1 1.0 1.6
Shaft (compression) γs 1.0 1.1 1.0 1.3
Total/combined (compression) γt 1.15 1.1 1.0 1.5
Shaft in tension γs,t 1.25 1.15 1.1 1.6
Note: Only the partial factor tables for the STR and GEO limit states are shown. For the EQU, UPL and HYD
limit states, one must use the other partial factor tables specified in Annex A of BS EN 1997-1. The values of
partial factors for SLS are normally taken to be 1.0.
As opposed to BS EN 1997-1, BS 8004:1986 adopts an overall safety factor γ of 2.0 or 3.0 for
the ultimate bearing stress while the loads are unfactored. Since a single factor is applied to
cater for uncertainties in all components including the action or effect of action, soil properties
and resistance, the global safety factor inevitably adopts a rather conservative value than the
partial factors will normally do.
(2) Load test and observation method
When there is little local experience or insufficient information on the ground conditions, it is
difficult to predict the structural behaviour with sufficient accuracy. In these cases, reliance is
placed on the load tests or the observation method. Tests may be carried out on a sample of the
actual construction. When the results of load tests on full scale or reduced scale models are
used to justify a design, allowance shall be made for the differences in ground conditions
between the test and the actual construction, the time effects especially if the duration of the
test is much less than the duration of loading in the actual construction, and the scale effects.
In the observation method, the design is reviewed during construction. A range of potential
behaviour and the relevant acceptable limits of behaviour must be identified before
construction. Depending on the observed behaviour during construction, the planned

65
contingency actions may be put into operation as appropriate, e.g. when the limits of behaviour
are exceeded. This approach is normally based on serviceability limits and does not explicitly
provide sufficient reserve against ultimate failures. It is therefore important that the limiting
design criteria are suitably conservative.
(3) Prescriptive method
In addition to the use of calculation and indirect methods, such as load tests, tests on
experimental models and observation method, the prescriptive method based on presumed
bearing resistance is also allowed where the ground conditions are well known. Spread
foundations on rock may normally be designed using the method of presumed bearing
resistance. However, unlike BS 8004:1986 providing presumed allowable bearing values for a
variety of sites including rocks, non-cohesive soils, cohesive soils, peat and organic soils, made
ground fill, high porosity chalk and Keuper marl, BS EN 1997-1 only includes presumed
bearing values for rocks.
The presumed vertical bearing values for granitic and volcanic rocks, meta-sedimentary rock,
intermediate soil (e.g. decomposed granite and decomposed volcanic), non-cohesive soil and
cohesive soil, the presumed lateral bearing pressure for rock as well as the presumed bond or
friction between rock and concrete or grout of piles for use in Hong Kong may be found in the
Code of Practice for Foundations (BD, 2017).
Summary of Procedures for Seismic Design of Highway Bridges
The procedures for seismic design of highway bridges discussed above are summarized in the
flowchart in Figure 3.7.

66
Preliminary bridge
design for service loads
Applicability of specifications
(SDMHR 2013 cl. 4.1(2))
Elastomeric bearings? (BS EN 1998-2 cl. 4.1.6(11))
Main part of the design seismic action
is resisted by elastomeric bearings?
Design in accordance with
Section 7 of BS EN 1998-2
Calculate normalized axial force ηk (BS EN 1998-2 cl. 5.3(4))
Obtain q(BS EN 1998-2 cl. 4.1.6(3)(5)(6)(7))
Yes Yes
No
No
Determine intended seismic
behaviour: ductile or limited ductile
Accessibility for
inspection and repair?
Type 2 design response spectra(BS EN 1998-1 cl. 3.2.2.5)
Determine Ground Type(BS EN 1998-1 cl. 3.1.2)
Determine Importance Factor(SDMHR cl. 4.4)
Mathematical model of bridge incl.
masses and effective stiffnesses(BS EN 1998-2 cl. 4.1, cl. 5.5)
Verification of flexural resistance of
potential plastic hinges using MEd MRd
(BS EN 1998-2 cl. 5.6.2(1))
Is it limited ductile?
Yes
Critical section?(BS EN 1998-2 cl. 6.5.1(2))
Re-size structural members
and/or re-do structural design
No
Yes
Confinement of concrete and
restraint of longitudinal bar?(BS EN 1998-2 cl. 6.2.1.1(2)(3))
Modify obtained bending moment to account for second order
effects to determine MEd ; multiply obtained shear force by q
to determine VEd ; multiply obtained seismic displacement by
ductility factor to determine design seismic displacement dE
(BS EN 1998-2 cl.2.3.6.1(6), cl. 5.4, cl.5.6.2(2)a))
Verification of shear resistance of potential
plastic hinges using VEd VRd/γBdl
(BS EN 1998-2 cl. 5.6.2(2)b))
Yes
Verification of resistance of other sections
using MEd MRd and VEd VRd/γBdl
(BS EN 1998-2 cl. 5.6.2(1), cl. 5.6.2(2)b))
No
Detailing
(BS EN 1998-2 cl. 6.2.1, cl. 6.2.2)
Yes
No
Confinement of concrete and restraint
of longitudinal bar?
(BS EN 1998-2 cl. 6.2.1.1(2)(3))
Detailing(BS EN 1998-2 cl. 6.2.1, cl. 6.2.2)
Yes
Calculate overstrength moment
M0=γ0MRd
(BS EN 1998-2 cl. 5.3)
Determine capacity design effects
MC and VC
(BS EN 1998-2 cl. 5.3)
Verification of shear resistance of potential
plastic hinges using VC VRd/γBd
(BS EN 1998-2 cl. 5.6.3.4)
Yes
No
Verification of resistance of other sections
using MC MRd and VC VRd/γBd
(BS EN 1998-2 cl. 5.6.3.2, cl. 5.6.3.3)
Regular?(BS EN 1998-2 cl. 4.1.8(1)(2)(3))
Mathematical model of bridge incl. masses, effective
stiffnesses, nonlinear stress-strain diagrams and
hysteresis loops for both concrete and materials(BS EN 1998-2 cl. 4.1, cl. 5.5, Annex E.2 )
Spectrum-compatible ground
motion time-histories(BS EN 1998-1 cl. 3.2.3)
Verification of available rotation capacities
of the plastic hinges using θp,E θp,u/γR,p
(BS EN 1998-2 cl. 4.2.4.4 )
Yes
Verification of joint(BS EN 1998-2 cl.5.6.3.5)
Verification of deck(BS EN 1998-2 cl.5.6.3.6(2) )
Provide adequate overlap lengths and clearances(BS EN 1998-2 cl.2.3.6.3, cl.6.6.4 )
Verification of bearings(BS EN 1998-2 cl.6.6.2 )
No
No
Yes
No
Reduce q(BS EN 1998-2 cl. 4.1.8(4))
Re-size structural members and/
or re-do structural design
Design of foundation(BS EN 1998-2 cl.5.8, BS 8004 )
Yes
Project-specific requirements and compliance
criteria and/or site-specific hazard analysis for
establishing the design seismic actions
No
No
Figure 3.7 Procedures for seismic design of highway bridges based on SDMHR 2013
Seismic Design of Railway Bridges
The railways of Hong Kong are predominantly run and maintained by the Mass Transit Railway
Corporation Limited (MTRCL). The corporation has adopted a separate in-house design
manual for railway structures, i.e. New Works Design Standard Manual (NWDSM) (MTRCL,
2013). NWDSM also includes provisions for earthquake loading and earthquake analysis of
bridges, which are different from those described in SDMHR 2013.

67
NWDSM specifies a reference peak ground acceleration of 0.15g with a return period of 1000
years. According to SDMHR 2013, the reference peak ground acceleration that corresponds to
a reference return period of 475 years is 0.12g, while the peak ground acceleration is taken as
0.12g × 1.4 = 0.168g for a return period of 1000 years. Aside from this, NWDSM stipulates
that bridge design and analysis shall comply with American Association of State Highway
Transport Officials - Standard Specifications for Highway Bridges, Seismic Design (AASHTO
Standard Specifications) (AASHTO, 2002), while SDMHR 2013 mainly refers to BS EN 1998-
1 and BS EN 1998-2 for seismic bridge design.
The determination of seismic action and the method of seismic analysis adopted by NWDSM
seem to be compatible with those by SDMHR 2013 as elaborated below:
For bridges of conventional steel and concrete girder and box girder forms with spans not
exceeding 150 m, the AASHTO Standard Specifications classify them as either essential
bridges or other bridges on the basis of social / survival and security / defence
requirements, which are roughly equivalent to bridges of Importance Classes II and I,
respectively, as defined in SDMHR 2013.
In accordance with the AASHTO Standard Specifications, bridges with a seismic
coefficient of 0.15 shall be assigned to Seismic Performance Category B. For Seismic
Performance Category B, the design seismic force for the superstructure, supporting
substructure including the columns and piers, and the connections between the
superstructure and the supporting substructure shall be determined by dividing the elastic
seismic force by the appropriate Response Modification Factor (R). For reinforced
concrete piers, the recommended R-Factors to be used for single column and multiple-
column bent are 3.0 and 5.0, respectively. These are similar to the Behaviour Factors (q)
used in BS EN 1998-2. However, BS EN 1998-2 specifies q-values of 1.5 to 3.5 for
reinforced concrete piers, depending on the intended ductility. In other words, the piers
designed in accordance with the NWDSM are intended for ductile behaviour from the
perspective of BS EN 1998-2. For connections such as bearings and shear keys, the
AASHTO Standard Specifications have prescribed the R-factor of 1.0 to enforce elastic
behaviour. BS EN 1998-2 adopts capacity design effects for the non-ductile components,
which are determined from the strength of adjacent ductile members with an overstrength
factor of at least 1.3 but it need not be greater than the elastic seismic forces.
According to the AASHTO Standard Specifications, the design seismic coefficient Sd is
defined using the Acceleration Coefficient (A), the Spectral Factor (C) and the Response
Modification Factor (R) as
Sd = AC R⁄ (3.6)
NWDSM specifies that the Spectral Factor C proposed in the paper “Seismic Design of
Buildings in Hong Kong” by Scott et al. (1994) shall be used to suit Hong Kong conditions,
which is related to the Site Coefficient (S) and Period of the bridge (T) as
C =S/T 1.1 ≤ 2.7 (3.7)
where S = 0.47 for rock and hard soil sites, and S = 0.67 for reclaimed sites.
The values of the design seismic coefficient obtained using the NWDSM model with an
R-factor of 3.0 and using the BS EN 1998-1 Type 2 spectrum with a q-factor of 3.5, both
for single-column piers intended for ductile behaviour, are compared in Figure 3.8.

68
Figure 3.8 Design response spectra for typical ground types
BS EN 1998-1 has defined five site classes in total, i.e. Ground Types A, B, C, D and E,
mainly based on the shear wave velocity. However, only Ground Types A, B and C are
presented here as they are considered to be the most representative of site conditions in
Hong Kong. On the other hand, the NWDSM classification comprises two, i.e. rock and
hard sites, and reclaimed sites. Figure 3.7 shows that the design seismic coefficients
defined for hard sites and reclaimed sites by NWDSM are very close to those defined for
Ground Types A and B, respectively, by BS EN 1998-1 for structural periods of 0.30 s to
0.90 s. Generally speaking, the design seismic forces in accordance with NWDSM are
comparable to those based on SDMHR 2013 or even smaller considering that R-factors
greater than 3.0 can be used, suggesting that the NWDSM seismic design is aimed for
more ductile bridge structures.
The AASHTO Standard Specifications and BS EN 1998-2 have similar requirements for
the selection of a suitable method of analysis for a particular bridge. The fundamental
mode method, i.e. single-mode spectral method, can be used for the analysis of “Regular”
bridges. The multi-mode spectral method or more rigorous, generally accepted procedure
such as the time-history method, are recommended for the analysis of bridges that are
“Not Regular”.
The NWDSM and SDMHR 2013 are slightly different in terms of detailing as shown in Table
3.9. Confining reinforcement shall be provided in the potential plastic hinge regions, which are
generally located at the top and/or bottom of the columns. Both the diameter and spacing of
the confining reinforcement shall satisfy certain criteria. The NWDSM requires that the
detailing of reinforced concrete members shall comply with the latest issue of Code of Practice
for Structural Use of Concrete (CoP-SUC), while SDMHR 2013 refers to BS EN 1992-1 (BSI,
2004a) and BS NA EN 1992-2 (BSI, 2005d) for general rules and BS EN 1998-2 for rules for
seismic ductility. Table 3.9 shows that CoP-SUC 2013 (BD, 2013) and BS EN 1998-2 have
slightly different specifications for these requirements. In Hong Kong, the least dimensions of
highway bridge piers are often about 1500 mm to 2000 mm, the majority of longitudinal bars
used are 32 mm or 40 mm in diameter, and the transverse reinforcement is mostly of 16 mm.
The longitudinal spacing of the confining reinforcement can then often exceed 200 mm in
accordance with SDMHR 2013, while this spacing should not exceed 150 mm in accordance
with NWDSM. As a result, more confining reinforcement shall be provided for confinement of
concrete in accordance with NWDSM, which may result from the intended higher levels of
ductility implied in AASHTO Standard Specifications. In addition to the hoops, supplementary
cross-ties or links shall also be provided to make sure that the transverse distance between hoop
legs or cross-ties is less than 200 mm such that any bar is not far away from a restrained bar
based on BS EN 1998-2. CoP-SUC 2013 has specified a similar requirement.
Soil Factor 1.00 1.35 1.50 1.80 0.47 0.67
Period A B C D Rock and hard Reclaimed
0.00 0.048 0.065 0.072 0.086
0.01 0.062 0.084 0.083 0.099 0.135 0.135
0.02 0.077 0.104 0.094 0.112 0.135 0.135
0.03 0.091 0.123 0.104 0.125 0.135 0.135
0.04 0.106 0.143 0.115 0.138 0.135 0.135
0.05 0.120 0.162 0.126 0.151 0.135 0.135
0.06 0.120 0.162 0.137 0.164 0.135 0.135
0.07 0.120 0.162 0.148 0.177 0.135 0.135
0.08 0.120 0.162 0.158 0.190 0.135 0.135
Eurocode 8 NWDSM
0.000
0.025
0.050
0.075
0.100
0.125
0.150
0.175
0.200
0.05 0.07 0.09 0.15 0.25 0.40 0.60 0.80 1.00 1.20 1.40
Acc
eler
atio
n (
g)
Period (s)
A
B
C
Rock and hard
Reclaimed
Eurocode8
NWDSM

69
Table 3.9 Requirements for confining reinforcement Requirement BS EN 1998-2 CoP-SUC 2013
Minimum diameter 6 mm or 1/4 the diameter of the largest
longitudinal bar, whichever is greater
10 mm or 1/4 the diameter of the
largest longitudinal bar, whichever is
greater
Maximum spacing along
the column
1/5 of the minimum dimension of the
confined core or 6 times the longitudinal
bar diameter, whichever is smaller
8 times the longitudinal bar diameter
or 150 mm, whichever is smaller
Maximum distance
between hoop legs
1/3 of the minimum dimension of the
confined core or 200 mm, whichever is
smaller
20 times the link bar diameter or 250
mm, whichever is smaller
To conclude, although NWDSM and SDMHR 2013 refer to different design codes for the
seismic design of railway bridges, the seismic design method specified in AASHTO Standard
Specifications and that in BS EN 1998-2 are found to be comparable to each other. In relation
to the intended seismic behaviour, NWDSM appears to call for design of railway bridges for a
higher level of ductility and require more closely spaced confining reinforcement at the
potential plastic hinge zones as compared to SDMHR 2013. Actually in a sense, NWDSM had
been more advanced in seismic design philosophy than SDMHR prior to its revision in 2013.

70
GUIDANCE FOR SEISMIC DESIGN OF NEW
BRIDGES
The specifications and procedures for seismic design of bridges in Hong Kong as introduced
in the Structures Design Manual for Highways and Railways 2013 (SDMHR 2013) (Highways
Department, 2013) have already been summarized in Chapter 3. This chapter will focus on the
related conceptual design, which covers considerations of bridge location, sizing, geometry and
bridge systems. In the seismic design situation, it is clear that choices made early in selecting
the bridge type, articulation and configuration can have significant effects on the seismic design
and ultimately the seismic response. It is particularly important that implications of the seismic
action are considered at the conceptual design stage of the bridges so as to determine the most
suitable solution for a bridge to meet the performance specifications for the design-level
earthquake, while balancing the life-cycle cost and all other constraints. While various
structural options for seismic resistance are subject to a number of non-seismic constraints such
as the traffic flow or dominating ground terrain, it is still desirable to identify the preferred
structural characteristics for seismic resistance that would apply in the absence of any
constraints. In addition, recommendations are provided on the determination of intended
seismic behaviour of the bridge, i.e. elastic, limited-ductile or ductile behaviour, based on a
series of parametric studies conducted to illustrate the effects of the intended behaviour on the
seismic design of bridge pier and foundation.
Structural Forms
The response of a bridge under seismic loading depends largely on its structural form, including
the bridge geometry, structural type, member strengths, and member articulations. These
attributes combine to govern how lateral loads will be induced in a bridge by an earthquake
and how such loads will be resisted by the bridge. Some good practices and the underlying
principles are presented below.
Earthquake resisting system
Identification of a suitable lateral force-resisting scheme and selection of the necessary
elements to realise the scheme should be accomplished in the conceptual design phase.
Bridge structures are normally composed of the superstructure, substructures, foundations and
their connections. The superstructure of a bridge is the main structural component that carries
not only its self-weight but also the traffic and other loads acting on it, thereby contributing
most of the mass. Under earthquake excitation, the lateral inertial force on the superstructure
will be transferred to the nearest bent through the bearings or joints, through the cap beam of
the bent to the columns, from the columns to the foundations, and finally to the soil.
Except for extremely important bridges, it is generally expedient to introduce a certain level of
ductility into the bridge in order to bring down the forces in the seismic load path, especially
in moderate-to-high seismicity areas. The use of ductile systems, where the maximum element
forces developed in the system are capped by the element yield strengths and somewhat less
than those calculated for an equivalent fully elastic system, also limits the maximum inertial
forces that can be developed in the system based on force equilibrium. Thus, the designer can
control the maximum inertial force that will be developed in the structure by controlling the
maximum lateral force that the structural system can transmit.
The approach to achieve ductile behaviour for bridges is by either providing for the formation
of a dependable plastic mechanism or using seismic isolation and energy dissipation devices.
Essentially, the earthquake resisting systems should meet the following requirements:

71
The locations selected for energy dissipation should be chosen with easy accessibility for
inspection and repair wherever possible.
The earthquake resisting system must provide a reliable and uninterrupted load path for
transmitting seismically induced forces to the surrounding soil without any potential of
brittle failures and have sufficient means of energy dissipation and/or restraint to reliably
control seismically induced displacements.
The inelastic action of a structural member cannot jeopardize the gravity load-carrying
capability of the structure.
Clause 4.1.6 of BS EN 1998-2 (BSI, 2005b) has provided some guidance on the selection of
earthquake resisting elements that contribute to energy dissipation during an earthquake. A
more comprehensive list of all kinds of earthquake resisting elements and their appropriateness
can be found in the AASHTO Guide Specifications for LRFD Seismic Bridge Design
(AASHTO Guide Specifications) (AASHTO, 2011), which consist of three categories, i.e.
“Permissible”, “Permissible with owner’s approval”, and “Not recommended for new bridges”,
for the purpose of encouraging good practice in seismic design as shown in Table 4.1. One
guiding principle that distinguishes elements in the three categories is the desire to keep
potential damage at locations that can be inspected (Marsh et al., 2014). For instance, plastic
hinges that form above ground fall into the “Permissible” category. On the other hand, plastic
hinges that form below the ground surface (i.e. in-ground plastic hinges such as plastic hinging
in piles below a wall pier or an integral abutment or in piles with the same strength as the
extension above ground) are not preferred and thus fall within the “Permissible with owner’s
approval” category. This can be interpreted as being “Permissible under exceptional
circumstances with full justifications”. This recognizes the fact that in-ground plastic hinging
may not be avoidable in all cases and, once such behaviour is expected, it may be utilized with
the approval of the owner. This is important because the owner should be aware that in-ground
damage may be difficult or impossible to detect and thus such damage will likely be
unrepairable. One exception is that plastic hinges that form just below the ground surface are
permissible owing to their accessibility by reasonable excavation. These considerations are also
included in BS EN 1998-2 in terms of the magnitude of the behaviour factor. The maximum
values of behaviour factor as specified in Table 4.1 of BS EN 1998-2 may be used only if the
locations of all the relevant plastic hinges are accessible for inspection; otherwise these values
shall be multiplied by 0.6 to enforce a lower extent of ductility as stipulated in Clause 4.1.6(6).
Other earthquake resisting elements listed in Table 4.1 that require the owner’s approval
represent less conservative design methods than the traditional options, although these systems
should perform well and meet the no-collapse requirement if the design is done correctly. It
should be noted that these systems, particularly the foundation systems, are generally not
recommended for use as intentional sources of energy dissipation in accordance with BS EN
1998-2. The “Not recommended” category contains four examples of earthquake resisting
elements that have performed poorly in past earthquakes and are therefore strongly discouraged.
In particular, plastic hinging in the superstructure is not recommended due to the interaction of
gravity loading (Marsh et al., 2014). As opposed to the relatively lightly loaded columns and
piers in compression, the horizontal framing system of the superstructure of a bridge is
generally optimized around the gravity loading so as to increase the span lengths. It is advisable
to assure that the superstructure will not form plastic hinges and jeopardize the performance of
the system with potentially poor inelastic behaviour. Note that this is opposite to the intended
plastic mechanisms for buildings, where plastic hinging is restricted to beams as columns are
usually more heavily loaded. BS EN 1998-2 also restricts the formation of plastic hinges in the
superstructure except for secondary deck members such as continuity slab.

72
Table 4.1 Earthquake resisting elements (Imbsen, 2014) Categories Description of earthquake resisting element
Permissible
• Plastic hinges below cap beams including pile bents.
• Above ground / near ground plastic hinges.
• Seismic isolation bearings or bearings designed to accommodate expected seismic
displacements with no damage.
• Piles with ‘pinned-head’ conditions.
• Columns with moment reducing or pinned hinge details.
• Capacity-protected pile caps, including caps with batter piles, which behave elastically.
• Plastic hinges at base of wall piers in weak direction.
• Pier walls with or without piles.
• Spread footings that satisfy the overturning criteria.*
• Passive abutment resistance using a limited passive resistance.
• Seat abutments whose back-wall is designed to fuse.
• Columns with architectural flares – with or without an isolation gap.
• Seat abutments whose back-wall is designed to resist the expected impact force in an
essentially elastic manner.
Permissible with
owner’s approval
• Passive abutment resistance using full passive resistance.
• Sliding of spread footing abutment allowed to limit force transferred.*
• Foundations permitted to rock.*
• More than the outer line of piles in group systems allowed to plunge or uplift under
seismic loadings.
• Wall piers on pile foundations that are not strong enough to force plastic hinging into
the wall and are not designed for the design earthquake elastic forces.
• Plumb piles that are not capacity-protected (e.g. integral abutment piles or pile-
supported seat abutments that are not fused transversely).*
• In-ground hinging in shafts or piles.
• Batter pile systems in which the geotechnical capacities and/or in-ground hinging
define the plastic mechanisms.
Not
recommended
• Plastic hinges in superstructure.
• Cap beam plastic hinging (particularly hinging that leads to vertical girder movement)
also includes eccentric braced frames with girders supported by cap beams.
• Bearing systems that do not provide for the expected displacements and/or forces (e.g.
rocker bearings).
• Batter-pile systems that are not designed to fuse geotechnically or structurally by
elements with adequate ductility capacity.
Note: * Not recommended in BS EN 1998-2.
At the bridge level, the earthquake resisting system with permissible resisting elements forming
individual contributors must be rationally designed. There are a couple of general rules. Firstly,
conventional plastic hinging is permitted for only intermediate substructure locations. Secondly,
isolation bearings are also permitted, but there should be no mixed use of plastic hinging and
isolation bearings at the same pier, i.e. isolation bearings are permitted with plastic hinges at
other pier locations. Thirdly, abutments required as part of the earthquake resisting system are
also permissible, although limited passive resistance shall be mobilized. Finally, the number of
supporting members (i.e. piers and abutments) that will be used to resist the seismic forces in
the longitudinal direction may have to be less than the total number of supporting members, as
it is desirable to provide sliding or flexible mountings between the deck and some piers in the
longitudinal direction to reduce the stresses arising from imposed deck deformations due to
thermal actions, shrinkage and other non-seismic actions. The permissible earthquake resisting
systems based on these general rules are listed in Table 4.2.
Table 4.2 Permissible earthquake resisting systems (Imbsen, 2014) Component Description of earthquake resisting system Application in the axis of bridge
Intermediate
structural
Plastic hinges at inspectable locations Longitudinal and transverse
Isolation bearings accommodate full displacement Longitudinal

73
components •Multiple simply supported spans with adequate seat
lengths
•Plastic hinges at inspectable locations
Longitudinal
Plastic hinges at inspectable locations
Isolation bearings elsewhere with or without energy
dissipaters to limit overall displacements
Longitudinal and transverse
Abutment
Not used as part of earthquake resisting system
Knock-off back-walls permissible Longitudinal
Not used as part of earthquake resisting system
Breakaway wing-walls permissible Transverse
Required to resist design earthquake elastically
Limited passive resistance can be mobilized Longitudinal and transverse
Articulation
The manner in which the superstructure is articulated in particular will affect where and how
the forces are resisted within the structure.
Consider a bridge with the abutments flexibly connected to the deck that permit longitudinal
movement of the superstructure relative to the abutments. The articulation provided by sliding
or elastomeric bearings means that little longitudinal load will be resisted by the abutments
provided that the longitudinal movement does not close the gap between the superstructure and
the abutment back-wall. Such unrestrained movement at the abutment places the bulk of the
inertial forces on the intermediate substructures. This will likely require that the piers be
designed to be stiffer and stronger in the longitudinal direction than if the abutments participate
in the seismic resistance in the cases of having rigid connections to the deck through either
monolithic joints or fixed bearings.
The influence of articulation of a bridge on the lateral load path is even more prominent in the
transverse direction and must be considered at the conceptual design stage. For bridges laterally
loaded in the transverse direction, the superstructure may form a diaphragm that acts in parallel
with the lateral resistance of the substructure. Take a common concrete box girder bridge for
example. The lateral stiffness of such a superstructure is normally much larger than that of the
substructure. If the superstructure is continuous over the piers, it would undertake the bulk of
the transverse inertial forces such that the piers are unlikely to yield regardless of how weak
the pier is made. As a result, it would be difficult to achieve the ductile response of system
without having the superstructure yielding, but permitting yielding in the superstructure is not
preferred due to the need for preserving the integrity of the gravity support system.
Alternatively, fusible shear keys might be used at the locations where the superstructure and
the piers are connected to attain the ductile response after the first yield of the keys. Moreover,
depending on the in-plan aspect ratio and stiffness, the superstructure may suffer diaphragm
bending effect as transverse inertial forces acting on the superstructure and the maximum
superstructure moment about the vertical axis will occur near the weakest pier. If the
superstructure is changed to prestressed concrete girders with a cast-in-place deck and full
integral diaphragm over the piers, careful attention must be paid to the detail used to tie the
adjacent spans together. This is important since such integral construction does not necessarily
meet the minimum support lengths. Besides, the designer must ensure that the superstructure
can sustain the forces that will be induced. Even if the elastic-based design forces are used,
additional factors of safety may be used to increase the elastic demands for added conservatism
(Marsh et al., 2014). On the other hand, if the superstructure consists of multiple simple spans
rather than a continuous one, the pier would take its proportional share of the transverse inertial
forces without the associated large moments being induced in the deck. In such a case, however,
the potential for unseating of spans and impact of two adjacent spans as they deflect laterally
would need to be considered.

74
Desirable characteristics
Bridges provided with clear and dependable earthquake resisting system, reliable articulation,
and balanced stiffness, mass and strength have been proved to perform much better during
earthquake than those without these features, and their responses are more accurately predicted
with elastic analysis. In recognition of this, it is desirable to incorporate simplicity, integrity
and symmetry into the design to the extent possible (Marsh et al., 2014). General guidance that
should be followed are summarized below:
It is desirable to use balanced frame geometry and balanced stiffness so that different piers
or frames have similar seismic response during the earthquake. The optimum post-elastic
seismic behaviour is achieved if the intended plastic hinges develop approximately
simultaneously. An unbalanced stiffness between two columns in a pier will cause more
damage to the stiffer one as a result of column torsion generated by rigid body rotation of
the superstructure. The unbalanced frame geometry will likely induce out-of-phase
response between adjacent frames (i.e. structural units on either side of an articulation
joint, such as an expansion joint), leading to large relative displacements between the
frames that increase the likelihood of longitudinal unseating and pounding between frames
at the expansion joints. The pounding will not only damage the expansion joint but also
place additional seismic demand on the frame, which can be detrimental considering the
stand-alone capacity of the frame. As a reference, the California Department of
Transportation (Caltrans) Seismic Design Criteria (Caltrans, 2013) includes the balanced
stiffness provision such that the variation in stiffness may differ by not more than 50%
between any two piers within a frame or between any two columns in a pier, and by not
more than 25% between adjacent piers within a frame or between adjacent columns within
a pier. Caltrans (2013) also includes the balanced frame geometry provision that adjacent
frames shall have fundamental vibration periods that are within 30% of one another. It can
be challenging to achieve balanced stiffness and balanced frame geometry when restricted
by the terrain. Some useful concepts have been developed in an attempt to balance the
stiffness and dynamic characteristics of a bridge, including the following (Marsh et al.,
2014): (a) adjusting the effective column height by lowering footings; (b) using oversized
drilled shafts; (c) modifying end fixities / restraints; (d) varying the column cross section
and longitudinal reinforcement; (e) adding or relocating columns or bents; (f) reducing or
redistributing the superstructure mass, and (g) incorporating seismic isolators or dampers.
It is desirable to minimize the skew and curvature of bridge deck to the extent possible,
although the skew and curvature are typically a function of roadway alignment. Both the
skew and curvature are features that tend to couple lateral response in the transverse and
longitudinal directions, making the dynamic response of bridge more complex. Skew and
curvature can make the design more difficult, which calls for more advanced analysis.
Additionally, skew and curvature complicate the dynamic analysis because of the
torsional motions of the bridge about a vertical axis so induced. It is suggested that the
skew should be minimized overall to less than 30 degrees if possible (Yashinsky and
Karshenas, 2003).
It is desirable to reduce the number of expansion joints to an acceptable minimum and
avoid half-joints and in-span hinges. In general, bridges with continuous deck behave
better under seismic conditions than those with many movement joints. However, the
expansion joints may not be completely eliminated owing to the built-up of thermal
stresses or for construction ease. The strategy to achieve a “continuous” deck in order of
preference is then as follows: (a) using continuous or integral construction; (b) providing
generous support lengths, and (c) adding restrainers or shock transmission units to

75
interconnect adjacent frames. Restrainers are the least preferred solution for preventing
unseating for new construction because the forces in restrainers under the design
earthquake are usually quite difficult to predict and may thus be difficult to design as
capacity-protected elements from past experience (Marsh et al., 2014).
Intended Seismic Behaviour
The seismic design strategies of SDMHR 3rd (Highways Department, 2006) and SDMHR 2013
(Highways Department, 2013) are essentially different. SDMHR 3rd has implicitly assumed the
bridge to resist various kinds of loads including seismic action elastically, whereas BS EN
1998-2 that forms the fundamental basis of SDMHR 2013 requires that the bridge shall be
designed for either ductile or limited ductile behaviour under the design seismic action. In
particular, it is generally preferable to design a bridge for ductile behaviour in cases of
moderate-to-high seismicity, whereas a limited ductile behaviour may be justified in cases of
low-to-moderate seismicity. The type of intended seismic behaviour should also be decided at
the conceptual design stage. Different design approaches may be adopted for different seismic
behaviour.
To enable the appropriate seismic design of bridges, it is necessary to identify the effects on
the seismic design and seismic performance of bridges, which may be brought about by
different intended seismic behaviour first. This will be elaborated through a series of parametric
studies on the seismic design of bridge piers and piled foundations.
Structural design of pier under different design
The structural design of reinforced concrete bridge piers intended for elastic, limited ductile
and ductile seismic behaviour are presented and compared below.
(1) Description of the piers
A series of rectangular bridge piers under designated axial forces represented by the normalized
axial force (ηk) are designed for earthquake resistance. Note that confining reinforcement shall
be provided in the potential hinge regions in accordance with Clause 6.2.1.1(2) of BS EN 1998-
2 once ηk exceeds 0.08. Thus, two categories of piers with ηk of 0.066 and 0.093 are studied in
order to determine the effect of choice between ductile design and limited ductile design on the
required amount of transverse reinforcement. Both normalized axial forces are deemed to be
reasonable for bridge structures. The piers are assumed to be fixed at the base and are connected
to the deck at the top either through fixed bearings that have little hysteresis energy dissipation
or monolithically. As the structural connection through fixed bearings is usually provided over
one pier only in a multi-span bridge frame, while there can be two consecutive monolithically
connected piers, the tributary mass (m) of the deck and quasi-permanent traffic load at the top
of the pier is halved when the articulation is changed to integral. The parameters of the piers
are listed in Table 4.3, together with the depth (D) and width (W) of the cross section, and the
clear height (H). The clear height of pier varies from 5 m to 17 m.

76
Table 4.3 Summary of parameters of piers
# ηk D
(m)
W
(m)
H
(m)
m
(kg) Connection # ηk
D
(m)
W
(m)
H
(m)
m
(kg) Connection
1 0.066 1.50 2.50 5 3760 Bearing 14 0.093 1.80 3.00 5 7653 Bearing
2 0.066 1.50 2.50 7 3760 Bearing 15 0.093 1.80 3.00 7 7653 Bearing
3 0.066 1.50 2.50 9 3760 Bearing 16 0.093 1.80 3.00 9 7653 Bearing
4 0.066 1.50 2.50 11 3760 Bearing 17 0.093 1.80 3.00 11 7653 Bearing
5 0.066 1.50 2.50 13 3760 Bearing 18 0.093 1.80 3.00 13 7653 Bearing
6 0.066 1.50 2.50 15 3760 Bearing 19 0.093 1.80 3.00 15 7653 Bearing
7 0.066 1.50 2.50 17 3760 Bearing 20 0.093 1.80 3.00 17 7653 Bearing
8 0.066 1.50 2.50 7 1880 Monolithic 21 0.093 1.80 3.00 7 3826 Monolithic
9 0.066 1.50 2.50 9 1880 Monolithic 22 0.093 1.80 3.00 9 3826 Monolithic
10 0.066 1.50 2.50 11 1880 Monolithic 23 0.093 1.80 3.00 11 3826 Monolithic
11 0.066 1.50 2.50 13 1880 Monolithic 24 0.093 1.80 3.00 13 3826 Monolithic
12 0.066 1.50 2.50 15 1880 Monolithic 25 0.093 1.80 3.00 15 3826 Monolithic
13 0.066 1.50 2.50 17 1880 Monolithic 26 0.093 1.80 3.00 17 3826 Monolithic
(2) Structural design against seismic action
The horizontal design seismic action to which the pier is subjected along the direction of its
cross-sectional depth at the centre of mass is determined first. The fundamental mode method
is adopted for this preliminary analysis. The elastic seismic action is then derived from the
inertial force corresponding to the natural period of the fundamental mode of structure by
multiplying the tributary mass by the relevant ordinate of Type 2 elastic response spectrum in
BS EN 1998-1 with a reference peak ground acceleration of 0.12g as specified in SDMHR
2013, where g is the acceleration due to gravity. For reinforced concrete piers, the stiffness to
be used in linear analysis can be based on the flexural stiffness of uncracked gross section in
the elastic and limited ductile design. In ductile design, the effective stiffness of pier to be used
for the equivalent linear analysis shall be taken to be the secant stiffness at the theoretical yield
point as specified in Clause 2.3.6.1(2) of BS EN 1998-2. As it is almost impossible to define
accurately the secant stiffness at the beginning of design process, an estimate of 30% of the
flexural stiffness of uncracked gross section is often used to start the design process and an
iterative procedure is used to update it. The elastic seismic actions will be modified in limited
ductile and ductile design to include the effect of ductility, by dividing them by the relevant
behaviour factors determined in accordance with Clause 4.1.6 of BS EN 1998-2.
The inertial force of superstructure is transmitted to the structural connection, which in turn
transmits the loading to the pier. The design moments at the base of the pier, corresponding to
elastic, limited ductile and ductile design, are then determined. The values are compared in
Figure 3.1 with the values normalized by those for the elastic design.

77
Bearing connection Monolithic connection
5 7 9 11 13 15 17
0.0
0.1
0.2
0.3
0.4
0.5
0.6
0.7
0.8
0.9
1.0
5 7 9 11 13 15 17
0.0
0.1
0.2
0.3
0.4
0.5
0.6
0.7
0.8
0.9
1.0
Norm
ali
sed
base
seis
mic
ben
din
g m
om
en
t
Elastic
Limited-ductile
Ductile
k=0.066
Pier height, m
k=0.093
5 7 9 11 13 15 17
0.0
0.1
0.2
0.3
0.4
0.5
0.6
0.7
0.8
0.9
1.0
5 7 9 11 13 15 17
0.0
0.1
0.2
0.3
0.4
0.5
0.6
0.7
0.8
0.9
1.0
Norm
ali
sed
base
sei
smic
ben
din
g m
om
ent
Elastic
Limited-ductile
Ductile
k=0.066
Pier height, m
k=0.093
(a) Importance Class I and Ground Type A
5 7 9 11 13 15 17
0.0
0.1
0.2
0.3
0.4
0.5
0.6
0.7
0.8
0.9
1.0
5 7 9 11 13 15 17
0.0
0.1
0.2
0.3
0.4
0.5
0.6
0.7
0.8
0.9
1.0
Norm
ali
sed
base
sei
smic
ben
din
g m
om
ent
Elastic
Limited-ductile
Ductile
k=0.066
Pier height, m
k=0.093
5 7 9 11 13 15 17
0.0
0.1
0.2
0.3
0.4
0.5
0.6
0.7
0.8
0.9
1.0
5 7 9 11 13 15 17
0.0
0.1
0.2
0.3
0.4
0.5
0.6
0.7
0.8
0.9
1.0
Norm
ali
sed
base
sei
smic
ben
din
g m
om
ent
Elastic
Limited-ductile
Ductile
k=0.066
Pier height, m
k=0.093
Bearing connection Monolithic connection
(b) Importance Class II and Ground Type C
Figure 4.1 Design moments intended for different seismic behaviour
Figure 3.1 shows that the design moment can generally be reduced significantly if the pier is
designed for ductile behaviour or limited ductile behaviour as compared with that for elastic
behaviour, especially for short piers.

78
Once the seismic action effects in the pier have been calculated, the structural design can be
conducted. In accordance with Clause 5.6 of BS EN 1998-2, if the bridge is intended for ductile
behaviour, the regions of plastic hinges, e.g. the bottom junction of a pier with the foundation,
are verified to have adequate flexural strength to resist the design moments, whereas the shear
resistances of the plastic hinges as well as sections outside the plastic hinges should be designed
to resist the “capacity design effects” determined in accordance with Clause 5.3 of BS EN
1998-2. If the bridge is intended for limited ductile behaviour or elastic behaviour, all sections
are verified against the design moments and shear forces derived directly from the demand
analysis. Moreover, the detailing should conform to the basic requirement set forth in Clauses
6.2 and 6.5 of BS EN 1998-2 for ductile and limited ductile concrete piers, respectively, or
comply with those outlined in Clause 9.5 of BS EN 1992-1 for elastically designed concrete
columns. In this preliminary study, the assumed pier sizes are maintained with the required
flexural and shear resistances of pier achieved by provision of adequate reinforcement.
(3) Results and discussions
The longitudinal reinforcement ratios under different design strategies are compared in Figure
4.2. It is anticipated that a minimum amount of longitudinal reinforcement would be needed if
the bridge is designed for ductile behaviour. However, despite the much smaller design
moments, the design for ductile behaviour may require as much longitudinal reinforcement as
that intended for limited ductile behaviour as shown in Figure 4.2(a) for tall integral piers. The
same amount of longitudinal reinforcement may also be adequate for the elastic design, as the
reinforcement design is also controlled by detailing rules in such cases. Nevertheless, pier re-
sizing to smaller sizes are not considered in this preliminary study for the size may be controlled
by load combinations other than those for the seismic design situation. Owing to over-
reinforcing, the intended ductile behaviour may not be able to develop, but may end up with
limited ductile or even elastic behaviour under the design seismic action, as observed from the
design moment (MEd) in relation to the design flexural resistance of the base section shown in
Figure 4.3(a). When bridges are on a strategic route and the site conditions are relatively poor,
however, Figure 4.2(b) shows that the amount of longitudinal reinforcement may vary
significantly with the design strategy adopted. The pier will be provided with the minimum
amount of longitudinal reinforcement if it is designed for ductile behaviour. The intended
distinct modes of behaviour are generally achieved through the design, as observed from the
design moment in relation to the design flexural resistance of the base section shown in Figure
4.3(b). It is worth mentioning that the piers of heights of 5 m and 7 m with fixed bearing
connection to the deck are incapable of developing sufficient flexural strength for achieving
elastic behaviour even with the maximum allowable reinforcement, which will require larger
sections and will in turn incur greater seismic actions. Should the larger piers still fail to meet
the requirements for elastic behaviour, it will be necessary to design the bridge for ductile
behaviour or limited ductile behaviour, or alternatively adopt seismic isolation.
Figure 4.4 shows the results of transverse reinforcement ratio. If a bridge is considered to
belong to the category of average importance and the site condition is not poor so that it does
not incur significant seismic actions, it may not be essential to design the bridge pier for ductile
behaviour. Figure 4.4(a) shows that much more transverse reinforcement is required for
relatively heavier loaded piers intended for ductile behaviour due to the provision of
confinement, although the intended ductile behaviour may not develop under the design
seismic actions as discussed above. These bridges may better be designed for limited ductile
behaviour instead. If the bridge is of critical importance and/or if the site condition is poor, the
choice of ductile behaviour might be more economical and safer especially for short piers, since
ductile piers can dissipate the input energy more efficiently through the rotation associated with
plastic hinges, thereby likely requiring much less reinforcement as shown in Figure 4.2(b) and

79
Figure 4.4(b).
Bearing connection Monolithic connection
5 7 9 11 13 15 17
0.7
1.0
1.3
1.6
1.9
2.2
2.5
2.8
3.1
3.4
5 7 9 11 13 15 17
0.7
1.0
1.3
1.6
1.9
2.2
2.5
2.8
3.1
3.4
Lo
ng
itu
din
al
rein
forc
emen
t ra
tio
, %
Elastic
Limited-ductile
Ductile
k=0.066
Pier height, m
k=0.093
5 7 9 11 13 15 17
0.7
1.0
1.3
1.6
1.9
2.2
2.5
2.8
3.1
3.4
5 7 9 11 13 15 17
0.7
1.0
1.3
1.6
1.9
2.2
2.5
2.8
3.1
3.4
Lo
ng
itu
din
al
rein
forc
emen
t ra
tio
, %
Elastic
Limited-ductile
Ductile
k=0.066
Pier height, m
k=0.093
(a) Importance Class I and Ground Type A
Bearing connection Monolithic connection
5 7 9 11 13 15 17
0.71.01.31.61.92.22.52.83.13.43.74.04.3
5 7 9 11 13 15 17
0.71.01.31.61.92.22.52.83.13.43.74.04.3
Lon
git
ud
ina
l re
info
rcem
ent
rati
o, %
Elastic
Limited-ductile
Ductile
k=0.066
Pier height, m
k=0.093
5 7 9 11 13 15 17
0.71.01.31.61.92.22.52.83.13.43.74.04.3
5 7 9 11 13 15 17
0.7
1.1
1.5
1.9
2.3
2.7
3.1
3.5
3.9
4.3
Lon
git
ud
ina
l re
info
rcem
ent
rati
o, %
Elastic
Limited-ductile
Ductile
k=0.066
Pier height, m
k=0.093
(b) Importance Class II and Ground Type C
Figure 4.2 Longitudinal reinforcement ratio intended for different behaviour

80
0.000 0.010 0.020 0.0300
5000
10000
15000
20000
25000
30000
35000
40000
45000
MEd
Curvature, 1/m
Mo
men
t, k
N-m
Elastic
Limited-ductile
Ductile
0.000 0.010 0.020 0.0300
10000
20000
30000
40000
50000
60000
70000
80000
90000
MEd
Curvature, 1/m
Mo
men
t, k
N-m
Elastic
Limited-ductile
Ductile
(a) Importance Class I and Ground Type A (b) Importance Class II and Ground Type C
Figure 4.3 Moment-curvature relationship of base section for the pier with normalized
axial force of 0.093, height of 9 m and monolithic connection to the deck
In summary, on the choice of suitable intended behaviour in the design of a bridge in Hong
Kong, it is preferable to design the bridge for ductile behaviour if the bridge is considered to
be of critical importance and/or the site condition is relatively poor. If the design conditions are
more favourable, it may be better to opt for limited ductile behaviour for economic reasons.
Particular attention should be paid to bridges having either piers shorter than 9 m or tall piers
exceeding 13 m in height in the earthquake resisting system. The former group will generally
be subjected to strong seismic motions due to their short periods so that the selection of ductile
behaviour is usually expedient, regardless of the importance class of the bridge and the site
conditions. For the latter group, the seismic resisting systems are quite flexible and it is usually
justifiable to design them for limited ductile behaviour irrespective of the importance class and
ground type. In most cases, designing for elastic behaviour is wasteful and should not be
accepted.

81
Bearing connection Monolithic connection
5 7 9 11 13 15 17
0.1
0.2
0.3
0.4
0.5
0.6
0.7
0.8
0.9
1.0
5 7 9 11 13 15 17
0.1
0.2
0.3
0.4
0.5
0.6
0.7
0.8
0.9
1.0
Tra
nsv
erse
rein
forcem
en
t ra
tio
, %
Elastic
Limited-ductile
Ductile
k=0.066
Pier height, m
k=0.093
5 7 9 11 13 15 17
0.1
0.2
0.3
0.4
0.5
0.6
0.7
0.8
0.9
1.0
5 7 9 11 13 15 17
0.1
0.2
0.3
0.4
0.5
0.6
0.7
0.8
0.9
1.0
Tran
sverse
rein
forcem
en
t rati
o, %
Elastic
Limited-ductile
Ductile
k=0.066
Pier height, m
k=0.093
(a) Importance Class I and Ground Type A
Bearing connection Monolithic connection
5 7 9 11 13 15 17
0.1
0.2
0.3
0.4
0.5
0.6
0.7
0.8
0.9
1.0
5 7 9 11 13 15 17
0.1
0.2
0.3
0.4
0.5
0.6
0.7
0.8
0.9
1.0
Tra
nsv
erse
rei
nfo
rcem
ent
rati
o, %
Elastic
Limited-ductile
Ductile
k=0.066
Pier height, m
k=0.093
5 7 9 11 13 15 17
0.1
0.2
0.3
0.4
0.5
0.6
0.7
0.8
0.9
1.0
5 7 9 11 13 15
0.1
0.2
0.3
0.4
0.5
0.6
0.7
0.8
0.9
1.0
Tra
nsv
erse
rei
nfo
rcem
ent
rati
o,
%
Elastic
Limited-ductile
Ductile
k=0.066
Pier height, m
k=0.093
(b) Importance Class II and Ground Type C
Figure 4.4 Transverse reinforcement ratio intended for different behaviour
The AASHTO Guide Specifications (AASHTO, 2011) have developed the concept of seismic
design category (SDC) to determine different requirements for the methods of analysis, column
design details, etc. Four SDCs are established based on the seismic risks, using the horizontal
response spectral acceleration coefficient at period of 1.0 sec (SDl) (where the abbreviation “sec”

82
denotes “second” in this chapter in order to be consistent with terms used in the AASHTO
Guide Specifications), and the seismic design requirements are adjusted for each of the SDCs.
When the 1-sec period design spectral acceleration coefficient is smaller than 0.15, the bridge
shall be assigned to SDC A. The seismic analysis for bridges in SDC A is generally not required
for such low seismic hazard level. Instead, default values are used as minimum design forces
in lieu of rigorous analysis. A clearly identifiable earthquake resisting system (ERS) is not
necessary either and minimum detailing requirements for support length and column transverse
steel are deemed adequate. For bridges in SDC B, where the 1-sec period design spectral
acceleration coefficient is between 0.15 and 0.30, the identification of an ERS selected to
achieve adequate seismic performance should be considered. The designer should ensure that
an ERS is present and capable of providing a reliable and uninterrupted load path for
transmitting seismically induced forces to the surrounding soil and sufficient means of energy
dissipation and/or restraint are available to reliably control seismically induced displacement.
In addition, to avoid unintentional weak links in the ERS, capacity design should be considered
for column shear. The seismic analysis should be conducted for bridges in SDC B and a
displacement demand to capacity check is required for individual piers or bents. Furthermore,
SDC B level of detailing should be provided. More stringent detailing rules may apply to
bridges in SDC C and above.
The SDC concept may also be adopted for local use. Actually, the design requirements for
bridges in SDC B and above according to the AASHTO Guide Specifications, including
identification of ERS, capacity design and sufficient detailing, are essentially the same for the
bridges designed for ductile behaviour based on BS EN 1998-2. These requirements may be
lessened or avoided for bridges in SDC A of the AASHTO Guide Specifications, which is also
considered in BS EN 1998-2 for the design for limited ductile behaviour. In view of the
similarities, the SDC strategy may be used to assist in the selection of intended seismic
behaviour at the conceptual design stage. The horizontal 1.0-sec period design spectral
acceleration coefficients for different seismic design situations in Hong Kong are listed in Table
4.4. Three SDCs are identified by reference to the AASHTO Guide Specifications, with SDCs
A and B forming the main SDCs applicable to Hong Kong owing to the low-to-moderate
seismicity. It is found that SDC B has included those bridges of critical importance and/or on
relatively poor sites recommended by the present study to be designed for ductile behaviour,
and SDC A is limited to those bridges with more favourable conditions for which essentially
elastic behaviour is recommended. The use of the SDC strategy can provide a rational basis
according to findings of the present study.
Table 4.4 1-sec period design spectral acceleration coefficient for Hong Kong
Importance Class Ground Type
A B C E D
I 0.075 0.101 0.113 0.120 0.162
II 0.105 0.142 0.158 0.168 0.227
III 0.173 0.233 0.259 0.276 0.373
Note: In accordance with the AASHTO Guide Specifications, the seismic design situations marked by the “blue”,
“green” and “red” zones, where the 1-sec period design spectral acceleration coefficients satisfying SD1 < 0.15,
0.15 ≤ SD1 < 0.30 and 0.30 ≤ SD1 < 0.50, are assigned to SDCs A, B and C, respectively.
Full-range behaviour of pier under different design
The seismic performance of the pier is more of a concern than the cost or others. Since shear
capacity is known to decrease as plastic deformation develops (Kowalsky and Priestley, 2000),
unintentional shear failure can occur in piers under earthquakes that are more severe than the
design events. It is thus of interest to evaluate the full-range behaviour of piers designed based
on intended ductile and limited ductile behaviour.

83
(1) Description of the piers
Five rectangular reinforced concrete bridge piers under the same normalized axial force (ηk) of
0.093 are designed to resist the seismic inertial forces with seismic coefficients corresponding
to conditions of Importance Class II and Ground Type C. The tributary masses of the deck and
quasi-permanent traffic load are listed for the piers in Table 4.5, together with the depth of the
cross section in the direction of the force (h), clear height (H), and aspect ratio (αs) that is
related to the cross-sectional depth as well as end rigidity. Both ductile design and limited
ductile design are performed for each of the piers. For the ductile design case, the value of the
behaviour factor is taken in accordance with Table 4.1 of BS EN 1998-2. Besides, the natural
vibration period of the pier is calculated based on the tributary mass and cracked stiffness of
pier that is initially assumed to be 30% of the flexural stiffness of uncracked gross section.
Thus the structural design is conducted in an iterative manner. For the limited ductile design,
the value of the behaviour factor is taken to be 1.5, and the natural period of the pier is
calculated based on the flexural stiffness of uncracked gross section as suggested by Clause
2.3.6.1(3) of BS EN 1998-2. The longitudinal and transverse reinforcement ratios at the base
section (i.e. ρL and ρw, respectively) determined under different design schemes are also
summarized in Table 4.5. It is noted that the transverse steel has met the minimum detailing
requirement specified in BS EN 1998-2 for ductile and limited ductile reinforced concrete piers.
Table 4.5 Pier design intended for ductile and limited ductile behaviour
Column Properties of column Ductile design Limited ductile design
h (m) H (m) αs ηk m (kg) T (s) ρL (%) ρw (%) T (s) ρL (%) ρw (%)
1 3.00 5 1.7 0.093 7653 0.26 0.95 0.58 0.16 3.68 0.61
2 1.80 9 2.5 0.093 3826 0.84 0.72 0.44 0.53 1.82 0.72
3 3.00 9 3.0 0.093 3826 0.64 0.72 0.37 0.40 1.82 0.38
4 1.80 15 4.2 0.093 3826 1.81 0.72 0.37 1.15 1.35 0.33
5 3.00 15 5.0 0.093 3826 1.38 0.72 0.37 0.87 1.35 0.25
(2) Shear-displacement capacity analysis
Pushover analysis is performed for each of the piers. The resulting shear-displacement curve
may be represented by bilinear approximation schematically as shown in Figure 4.5, where the
retention of the shear capacity with development of plastic deformation is decided by reference
to Priestley et al. (2007), which accounts for not only the contribution of the transverse
reinforcement, longitudinal reinforcement and axial force to the shear resistance, but also the
reduction effect of the plastic deformation. The column can fail in flexure, flexure-shear and
shear under the design-level earthquake, depending on the shear capacity and demand relation
as depicted in Figure 4.5. In respect of the full-range behaviour, the column displacement
capacity (dc) can be significantly reduced from the ultimate displacement (du) if shear-type
failures dominate. As a measure of this feature, a normalized displacement capacity factor (dp),
defined as the ratio of the plastic part of displacement capacity (dc-dy) to the plastic part of
ultimate displacement (du-dy) is proposed, where dy denotes the yield displacement. Note that
the value of this factor can be negative, between 0.0 and 1.0, or equal to 1.0, indicating full-
range behaviour of shear, flexure-shear and flexure, respectively.

84
Figure 4.5 Shear capacity and demand relation of pier
(3) Results and discussions
The calculated values of dp for these piers under different design schemes are plotted in Figure
4.6 against the aspect ratios. It shows that piers with aspect ratios not exceeding 3.0 are
susceptible to flexural-shear failure and the pier with an aspect ratio as small as 1.7 is prone to
shear failure based on the design for limited ductile behaviour, while the ductile design enables
piers to fail in ductile mode regardless of the aspect ratio. The occurrence of either flexural-
shear failure or shear failure for limited ductile design is attributed to that BS EN 1998-2 does
not require capacity design for bridges based on the design for limited ductile behaviour. As
opposed to limited ductile design, ductile design has been equipped with capacity design
strategy to avoid brittle shear failures of any kind.
Figure 4.6 Full-range behaviour of ductile and limited ductile piers in terms of
normalized displacement capacity factor
Piled foundation under different design
The intended behaviour of bridge will also affect the magnitude of seismic actions transmitted
to the foundation. This section further illustrates the effect of intended seismic behaviour of
bridge on the design of foundation.
Bas
e sh
ear
forc
e o
f co
lum
n
Displacement at the top of column
Shear-displacementShear strength 1Shear strength 2Shear strength 3Flexural failure
Flexural-shear failureShear failure
dy(dc) (dc) (dc)du
-0.20
0.00
0.20
0.40
0.60
0.80
1.00
1.20
1 2 3 4 5 6Norm
aliz
ed d
ispla
cem
ent
capac
ity
fact
or
Aspect ratio αs
Ductile design
Limited ductile design

85
(1) Description of the problem
A piled foundation is designed to support a reinforced concrete bridge pier with rectangular
cross section of 3.0 m × 1.8 m and height of 9 m. The base of the pier is fixed to the pile cap
while the top of pier is assumed to be free to move and rotate. The tributary deck mass and the
mass associated with traffic load are lumped at the top of pier for simplicity. The total weight
for seismic design situation consists of a permanent weight of 14000 kN and a quasi-permanent
weight of 1000 kN, leading to a normalized axial force in the pier defined in Clause 5.3(4) of
BS EN 1998-2 of approximately 0.1. The seismic response of the superstructure will generate
lateral forces at the centre of mass, and these forces will be transmitted through the pier to the
piled foundation.
The piled foundation consists of a group of four bored piles arranged on a square grid at a
centre-to-centre spacing of 3 times the pile diameter (d) as shown in Figure 4.7. The subsoil is
assumed to be uniform. The piles are founded on bedrock at 30.5 m below ground level. The
allowable bearing pressure of bedrock (qb) is taken to be 5000 kN/m2, which corresponds to
moderately strong rock with a total core recovery of more than 85% of the grade as given in
Table 6.6 of GEO 1/2006 (GEO, 2006). The minimum penetration of the piles into rock is 0.3
m to conform to the requirement set forth in Note (3) to Table 6.6. The 2 m thick pile cap has
a soil cover of 1.5 m.
3d
1.5
1.5
3d 1.51.5
A A
d Ø Pile
X X
Y
Y
℄ C
OL
UM
N &
PIL
E C
AP
℄ COLUMN & PILE CAP
Cover C = 1.5
Depth D = 2.0
Ground Surface
Length L = 27
A-A
rxi
Anticipated bedrock level
Horizontal Force Fx
Vertical Force N
Bending Moment Myy
BB
qb=5000 kN/m2
Ground Surface
B-B
ryi
Horizontal Force Fy
Vertical Force N
Bending Moment Mxx
Figure 4.7 Piled foundation studied (unit: m)

86
The following seismic design situations with various combinations of bridge importance class
and ground type are investigated: (a) Importance Class I and Ground Type B; (b) Importance
Class I and Ground Type C; (c) Importance Class II and Ground Type C; and (d) Importance
Class II and Ground Type D.
In accordance with the definition of Ground Type B as given in Table 3.1 of BS EN 1998-1,
stiff clay with undrained shear strength cu of 350 kN/m2 is considered. The adhesion factor α
for the soil / pile interface is estimated to be 0.4. For Ground Type C, a medium dense residual
soil with weight intensity γs of 17 kN/m3 and undrained shear strength cu of 200 kN/m2 is
considered. The friction angle of shearing resistance φ' is taken to be 35° and the shaft
resistance coefficient β is estimated as 0.2. The poorer site of Ground Type D consists of soft
clay with undrained shear strength cu of 50 kN/m2. The adhesion factor α for the soil / pile
interface has a value of 0.8.
(2) Design of foundation
Bridge foundations shall not be intentionally used as sources of hysteretic energy dissipation
and therefore shall, as far as practicable, be designed to remain elastic under the design seismic
actions. In accordance with Clause 5.8.2 of BS EN 1998-2, the design shear loads and moments
on the foundation shall be either those at the base of pier intended for limited ductile behaviour
multiplied by the behaviour factor or the “capacity design effects” of pier intended for ductile
behaviour based on the actual reinforcement and accounting for overstrength, but not exceeding
those resulting from elastic analysis. It is expected that the intended limited ductile behaviour
of bridge will result in the same design action effects on the foundation as the elastic behaviour
will do. The axial compressive load on the foundation shall include the weight of the pier.
The relation between the design shear at the pier base and the design action effects on the
foundation for intended elastic, limited ductile or ductile behaviour of bridge corresponding to
Important Class II and Ground Type C, for instance, are shown in Table 4..
Table 4.6 Design action effects for pier and foundation (Importance Class II and
Ground Type C)
Intended
seismic behaviour
of bridge
Pier Foundation
Longitudinal Transverse Longitudinal Transverse
Fx
(kN)
Fy
(kN)
Myy
(kNm)
Fx
(kN)
Mxx
(kNm)
Fy
(kN)
Elastic 6249 5846 56241 6249 52614 5846
Limited ductile 4166 3897 56241 6249 52614 5846
Ductile 2520 1056 33615 3735 33264 3696
The piles must be verified to have sufficient axial and lateral resistances. To simplify the design,
the following simplifying assumptions are made:
The moments acting on the foundation are assumed to be kept in equilibrium solely by the
axial loads of the piles.
The weight of overburden can be balanced by that of the pile, allowing both to be excluded
from the bearing resistance and bearing load respectively.
The lateral loads on the foundation are assumed to be distributed to the piles equally.
The deflection, bending moment and shear along a pile subjected to lateral loading can be
determined using the generalised solutions of Matlock and Reese (1962) included in
Geotechnical Engineering Office Publication No. 1/2006 (GEO, 2006). The constants of

87
horizontal subgrade reaction nh for the soils considered for Ground Types B, C and D are
taken to be 17.6 MN/m3, 6.6 MN/m3 and 2.2 MN/m3, respectively.
The lateral load capacity of a pile is either the maximum resistance that can be offered by
the soil or the ultimate structural resistance (i.e. bending moment and shear) of the pile
section, whichever is the lesser. The allowable lateral deflection of the pile is limited to
0.1 m.
The pile diameter is determined when any of the three criteria is met: (a) the axial compressive
load on a pile reaches the bearing resistance of the foundation; (b) the tensile pile reaches the
uplift capacity; and (c) the allowable lateral deflection of the pile is attained. Adequate
longitudinal and transverse reinforcement should be provided to satisfy the maximum bending
moment and shear force in the pile, and to meet the detailing rules set forth in BS EN 1992-1-
1 (BSI, 2004a) and BS EN 1536 (BSI, 2000). In particular, the clear distance between
longitudinal bars as measured along the periphery of the pile should not exceed 200 mm as
specified in Clause 9.8.5(4) of BS EN 1992-1-1.
(3) Results and discussions
The diameters and structural design of the piles are summarized in Table 4.. Figure 4.8 shows
the sizes and reinforcement amounts of the piles for ductile design of bridges, normalized by
those for elastic and limited ductile design of bridges. The results show that the pile diameter
can be reduced by 5% to 29% and the steel volume in pile can be reduced by 4% to 41% if the
bridge is designed for ductile behaviour instead of elastic and limited ductile behaviour. The
reduction effects are more significant in cases of poor soil conditions.
Table 4.7 Results of pile design for elastic, limited ductile and ductile design of bridge
Design situations Intended seismic
behaviour of bridge
Diameter
(m)
Longitudinal
reinforcement
Transverse
reinforcement Importance
Class
Ground
Type
I B Elastic / Limited ductile 1.642 26 T32 T20 - 200
Ductile 1.562 26 T32 T20 - 200
I C Elastic / Limited ductile 1.681 28 T32 T25 - 250
Ductile 1.568 26 T32 T20 - 200
II C Elastic / Limited ductile 1.820 32 T32 T25 - 200
Ductile 1.620 26 T32 T20 - 200
II D Elastic / Limited ductile 2.770 46 T32 T25 - 200
Ductile 1.970 32 T32 T25 - 250
Figure 4.8 Relation of the size and reinforcement amount of pile between ductile design
of bridge and limited ductile or elastic design of bridge

88
The use of the concept of SDC has been explored to determine the intended seismic behaviour
of bridge as presented in Section 4.2.1(3). The seismic design situations for bridges in Hong
Kong can be classified primarily into two categories as shown in Table 4.4 based on the design
spectral acceleration coefficients at a period of 1.0 sec. The previous work shows that the
bridges classified as SDC B should generally be designed for ductile behaviour. Bridges
classified as SDC A should be designed for elastic or limited ductile behaviour based on
considerations of economic efficiency, with the exception of very stiff bridges such as those
with short piers. These conclusions are expected to remain valid even when the effects of
various intended behaviour of bridges on foundation design are considered. Figure 4.9 shows
the normalized sizes and reinforcement amounts of the piles intended for ductile behaviour of
bridges by those for elastic and limited ductile behaviour of bridge plotted against the design
spectral acceleration coefficients at a period of 1.0 sec for the design situations. The design for
intended ductile behaviour of bridge can reduce the size and total amount of reinforcement of
the piles for bridges in SDC B. However, the reduction effects are generally not as significant
for bridges in SDC A. The plot confirms that the SDC can provide guidance on the design of
bridges from the economic point of view.
Figure 4.9 Reduction effects on size and reinforcement amount of pile by ductile design
of bridge with the seismic risk
The bridges having either piers shorter than 9 m or tall piers exceeding 13 m in height in the
earthquake resisting system may not be completely described by the SDC as discussed in
Section 4.2.1(3). The same bridge pier with the height taken as 7 m is considered with the
design situation of Importance Class I and Ground Type C, which falls into SDC A. On the
other hand, the design situation of Importance Class II and Ground Type D in SDC B is
considered for the bridge pier with the height taken as 13 m. The results are presented in Figure
4.10 and compared with those for pier height of 9 m taken from Figure 4.9. By adopting ductile
design for the 7 m pier in SDC A, the pile diameter is reduced by 13% and the volume of
reinforcement is reduced by more than 40%. The pile design for the 13 m pier in SDC B,
however, is only slightly affected by the ductile design of bridge.

89
Figure 4.10 Reduction effects on size and reinforcement amount of pile by ductile design
of bridge with the bridge stiffness
Conclusions
In summary, on the choice of suitable intended behaviour in the design of a bridge in Hong
Kong, it is preferable to design the bridge for ductile behaviour if the bridge is considered to
be of critical importance and/or the site is relatively poor. If the design conditions are more
favourable, it may be better to opt for limited ductile behaviour for economic reasons. The SDC
defined based on seismic risk can be used to determine the intended seismic behaviour of the
bridge for a design situation. The classification of the SDCs applicable to Hong Kong is given
in Table 4.4. Bridges of SDC A can be designed for essentially elastic behaviour and those of
SDC B shall be designed for ductile behaviour. Special attention should be paid to bridges
having either piers shorter than 9 m or tall piers exceeding 13 m in height in the earthquake
resisting system. The former group will generally be subjected to strong seismic motions due
to their short periods so that the selection of ductile behaviour is usually expedient even if the
situation is classified as SDC A. Besides, piers with aspect ratios not greater than 3.0 are
susceptible to flexural-shear or even shear failure during earthquakes more severe than the
design events if designed for limited ductile behaviour. For the latter group, the seismic
resisting systems are quite flexible and it is usually justifiable to design such bridges in SDC
B for limited ductile behaviour.

90
SEISMIC ASSESSMENT OF EXISTING BRIDGES
As one of the most densely populated metropolises, Hong Kong has a highly developed and
sophisticated transportation network with bridges forming critical links. Traffic disruption
caused by natural hazards such as earthquakes or super typhoons could lead to enormous
economic losses, apart from potential loss of lives. The current stock of highway bridges in
Hong Kong has an average age of over 30 years. Since their construction, there have been
significant improvements in bridge design practice, particularly in seismic bridge design and
analysis, based on lessons learnt from the subsequent earthquakes and more laboratory
investigations around the world. Sophisticated bridge design codes incorporating advanced
methodologies and procedures for design for earthquakes resistance have emerged worldwide
since the release of Structures Design Manual for Highways and Railways 3rd Edition, i.e.
SDMHR 3rd (Highways Department, 2006). As opposed to SDMHR 3rd, the recent SDMHR
2013 Edition (Highways Department, 2013) has mainly made reference to BS EN 1998-1 (BSI,
2004c, 2005b) and BS EN 1998-2 (BSI, 2004c, 2005b) for seismic bridge design provisions.
The revisions to the design manual are quite significant in respect of adoption of ductility
design and dynamic analysis as the basis. Moreover, knowledge of the seismic hazard in the
region has grown. On the basis of a comprehensive seismic hazard analysis for Hong Kong as
described in Chapter 2, the reference peak ground acceleration is raised from 0.05g in SDMHR
3rd to 0.12g in SDMHR 2013, where g is the acceleration due to gravity. Hence some of the
existing highway bridges designed to earlier standards may be vulnerable to damage during a
moderate-to-high seismic event. It is therefore essential to examine the compliance of existing
bridges with the current design manual by appropriate seismic assessment.
This chapter firstly summarizes the arrangements and structural details of some typical existing
highway bridges followed by discussions of their compliance with SDMHR 2013 including the
design seismic action and detailing rules. The vulnerable components, such as piers, pier-deck
connections, deck and abutment, and their possible damage and failure modes will be identified.
The available methodologies for seismic assessment of a specific bridge are then elaborated
with a focus on strain-based evaluation method. This method will be demonstrated with an
example. Lastly, an approach to obtain the vulnerability of a class of bridges by means of
fragility analysis is introduced, which is particularly useful for optimization of bridge
retrofitting programmes and development of pre-earthquake action plans. The fragility curves
for typical classes of highway bridges in Hong Kong are presented.
Compliance of Existing Bridges
Typical characteristics of existing bridges
After an initial survey of major highway bridges in Hong Kong, it is found that the bridges in
Hong Kong are predominately concrete girder bridges. As-built bridge data have been collected
and examined for general details of piers, superstructures and their connections. Based on the
types of superstructure and connection surveyed, the typical existing highway bridges in Hong
Kong comprise mainly two classes of concrete girder bridges: multi-span simply supported
bridges (MSSB) and multi-span continuous bridges (MSCB), which are prevalent in the 1980s
and 1990s, respectively. Figure 5.1 shows the typical configurations of these two classes of
bridges. It should be noted that some generalizations have been made as necessary. Although
all details are not identical, the details shown here are considered to be representative of their
respective bridge classes.
The MSSB bridges consist of multiple spans of 25 m to 30 m that are simply supported on
bents as shown in Figure 5.1(a). The superstructure usually consists of a number of precast U-

91
beams resting on crossheads, each of which is cast with either single or multiple octagonal
columns. The width of the deck and the arrangement of columns depend on the number of U-
beams used, i.e. often 9 to 13 U-beams supported by two columns and 4 to 5 U-beams supported
by one column. Laminated elastomeric bearings are used to support the deck under each U-
beam. At one end, the connection of the beam to the pier crosshead consists of an elastomeric
bearing pad with a ϕ50 mm galvanized dowel bar cast in the precast beam and grouted in a hole
left in the crosshead to restrain relative displacement between the girder and the pier, i.e.
equivalent elastomeric fixed bearing. No dowel bars are provided at the other end so as to allow
expansion movements. All bearings are installed between an upper plinth and a bearing plinth
on the crosshead, both of roughly the same size as the bearing.
For the MSCB bridges, the superstructure is continuous across the pier crosshead. There are 4
or 5 roughly uniform continuous spans between expansion joints with the span length ranging
from 30 m to 50 m. The superstructure consists of a single- or multi-cell box girder and the pier
usually consists of a single octagonal column as shown in Figure 5.1(b). The MSCB bridges
can be further divided into two classes depending on the type of principal structural girder-pier
connection: using either fixed bearings on one central pier, or monolithic joints over two
consecutive piers close to the middle of the bridge. Laminated elastomeric bearings are used
for the rest of the connections to allow longitudinal deck movements. In addition, additional
plane sliding bearings mainly consisting of polytetrafluoroethylene (PTFE) are provided on the
top of the elastomeric bearings at the expansion joints to accommodate large deck movement
as shown in Figure 5.1(b). The movable bearings are provided with a concrete shear key system
that allows the deck to move freely in the longitudinal direction while excessive movement in
the transverse direction is to be restrained as shown in Figure 5.1(b). The fixed bearings are
often fixed pot bearings, each of which consists of an upper steel plate with keeper plates, a
bottom steel pot and an elastomer in-between. All bearings are installed between an upper
plinth and a bearing plinth on pier crosshead, both of roughly the same size as the bearing.
The columns usually have octagonal sections for both classes of bridges and the longitudinal
reinforcing bars are mostly 40 mm in diameter. The transverse reinforcement typically consists
of ϕ12 mm stirrups at a spacing of 300 mm for the MSSB and at a spacing of 250 mm for the
MSCB.
25~30
Fixed end Free end
U-Beams
0.97
1.5
1.39
0.165
W
0.6 0.6
D
0.3
0.3
Diam.40mmU-Beam
Cross-Head
Dowel Bar
Diam. 50mm
Grouted with
concrete
LEB
Multi-span Simply Supported Bridge U-beam deck on crosshead
U-beam Column section Fixed end
H1 H2
90mm
(a) Typical MSSB bridges

92
Monolithic jointSliding
bearing
Laminated
bearing
Laminated
bearing
Sliding
bearing
H
Type 2: Continuous box girder bridge with monolithic joint
Elevation view for
single-column pier
Fixed
bearingSliding
bearingLaminated
bearing
Sliding
bearing
Type 1: Continuous box girder bridge with fixed pot bearing
Box girder
Pier top
Concrete shear key
0.7
Bearing
Transverse shear key
W
D
0.375
0.375
Diam.40
Column section
0.625 0.625
5.5
0.50.2
2.25
11
Girder section
Fixed bearing
Upper plate
Bottom plate
Elastomer
Gap=15mm
Monolithic joint
Laminated
bearing
(b) Typical MSCB bridges
Figure 5.1 Typical configurations of existing bridges in Hong Kong
(Dimensions are in metres unless otherwise stated)
Seismic action based on SDMHR 3rd and SDMHR 2013: Parametric study
The seismic actions defined in SDMHR 3rd and SDMHR 2013 are fundamentally different with
the former based on static treatment in terms of nominal earthquake load equivalent to 5% of
the total vertical load together with a partial factor of 1.4 for ultimate limit state (i.e. an
equivalent response acceleration of 0.07g) and the latter based essentially on dynamic
consideration using the response spectrum. The seismic action may be underestimated under
the SDMHR 3rd and the effects of design parameters including deck width, span length, pier
height, and number of spans on the seismic action are evaluated below via a comprehensive
parametric study.
(1) Key design parameters and representative ranges
A total of 219 hypothetical sample bridges were generated from the MSSB and MSCB classes
with 3, 4 and 6 equal spans. The values considered for the other design variables were decided
so as to cover as broadly as possible the existing bridges. They are summarized here:
Three span lengths were studied, i.e. 30 m, 40 m and 50 m, in order to approximate the
span lengths that are commonly used in small- to medium-span bridges.

93
The deck width was from one of the six values, i.e. 6.15 m, 7.40 m, 8.80 m, 12.18 m,
18.80 m and 22.50 m, to cover a variety of traffic lane layouts from one-way one lane to
dual-way six lanes.
The cross-sectional area of deck is associated with the span length and deck width, and it
is supposed to increase with the increase of span length and deck width. The cross-
sectional area of deck of the sample bridges were decided by drawing on existing bridges
with similar span lengths and deck widths to make sure that the sample bridges studied
are reasonable.
The pier with a single straight rectangular column was considered for both the MSSB and
MSCB classes. The pier height was assumed to be one of the following values, i.e. 5 m, 7
m, 9 m, 11 m, 13 m, 15 m, 17 m, 19 m and 21 m. The dimensions of pier cross-section
were also drawn from existing bridges with similar span lengths, deck widths and pier
heights. The dimensions were between 1.5 m and 3.0 m.
According to SDMHR 2013 and the relevant Eurocodes, the seismic action is related to the
ground type. As the soil gets softer, the seismic action becomes larger. In addition, the seismic
action is varied to take into account various levels of structural importance. The results for
Importance Class I with Ground Type A and Importance Class III with Ground Type D would
provide the lower bound and upper bound estimates of the seismic action in accordance with
SDMHR 2013.
Other assumptions made for the calculations are as follows:
The permanent masses for consideration of seismic action included self-weight and
superimposed dead load. The superimposed dead load mainly consisted of road surfacing
and parapet. Solid reinforced concrete (RC) parapet with a sectional area of 0.5 m2 and
130 mm thick bituminous road surfacing with a unit weight of 23 kN/m3 were assumed.
The other associated masses for consideration of seismic action included traffic actions of
Load Model 1 from BS EN 1991-2 (BSI, 2003) with a combination factor of 0.2 as
required in Clause 4.9(a) of SDMHR 2013 and 1/3 type HA highway loading from
BD37/01 (Highways Agency, 2001) as required in Clause 2.6(b)(i) of SDMHR 3rd.
The dynamic responses of the sample bridges were approximated by equivalent single-
degree-of-freedom systems without accounting for soil-structure interaction. Apart from
the mass, the stiffness of the system was taken to be the sum of the stiffnesses of the
resisting members. In the transverse direction, the seismic resistance of the bridge was
considered to be provided by all the piers. In the longitudinal direction with some piers
rigidly connected to the deck either monolithically or through fixed bearings which have
a major contribution to the seismic resistance, only the longitudinal stiffnesses of such
piers were accounted for.
Elastic behaviour was assumed for all of the sample bridges. Therefore, the elastic
stiffness of the pier corresponding to the uncracked gross concrete section and a behaviour
factor of 1.0 were adopted when determining the stiffness of pier and design seismic action
respectively based on SDMHR 2013.
(2) Results and discussions
The fundamental periods of the sample bridges are shown in Figure 5.2. The ranges of period
encompassing the horizontal branch (constant acceleration response-control zone) and first
descending branch (constant velocity response-control zone) of Type 2 response spectrum of
BS EN 1998-1 (BSI, 2004c), i.e. 0.05 s to 0.3 s and 0.3 s to 1.2 s, respectively, are also marked
in the figure by pink and blue, respectively. It can be seen that the fundamental periods of the

94
majority of sample bridges containing monolithic joints are covered by the first descending
branch in both the longitudinal and transverse directions. The majority of sample bridges with
the structural deck-pier connection of fixed bearings have fundamental periods covered by the
first descending branch in the transverse direction but the second descending branch (constant
displacement response) in the longitudinal direction. The different structural connections seem
to have major effect on the longitudinal fundamental period only.
The fundamental period is significantly influenced by the pier height. Taller piers can result in
longer fundamental periods in both horizontal directions. In addition to the pier height, the
weight of bridge also has some effect on the fundamental period in the longitudinal direction.
As longitudinal sliding or flexible mountings must be provided between the deck and some
piers to reduce the stresses induced by deck deformations due to thermal actions, shrinkage,
etc., the overall stiffness is unlikely to increase as much as that of the weight in the longitudinal
direction. The longitudinal fundamental period of bridge then tends to increase as the total
length and hence weight increase.
Considering the most favourable seismic design situation with Importance Class I and Ground
Type A, bridges that are subjected to elastic response spectral acceleration (RSA) not greater
than 0.07g shall have fundamental periods longer than 1.07 s based on SDMHR 2013. This
critical fundamental period is also marked by a red line in Figure 5.2. It can be seen that a large
portion of sample bridges are susceptible to RSAs above 0.07g for having fundamental periods
below 1.07 s.
Pier height, m
Pier height, mPier height, m
(a) (b)
(c) (d)
Pier height, m
Constant acceleration response-control zone Constant velocity response-control zone
Figure 5.2 Fundamental periods of sample bridges
The RSAs for these sample bridges corresponding to Importance Class I with Ground Type A
and Importance Class III with Ground Type D based on SDMHR 2013 are plotted in Figure
5.3 and Figure 5.4, respectively, giving the following observations:

95
The RSAs for the sample bridges with monolithic joints are rarely below the equivalent
response acceleration of 0.07g as adopted in SDMHR 3rd in both horizontal directions,
except for those with piers taller than 17 m. When the design conditions get more stringent
up to Importance Class III with Ground Type D, the RSAs for this particular type of
bridges are very likely to exceed 0.07g. The most likely upper and lower bounds of RSAs
for this type of bridges are found to lie in 0.03g - 0.30g and 0.14g - 1.26g, respectively.
Similar trends have also been found for sample bridges with structural deck-pier
connections of fixed bearings in the transverse direction of the bridge.
The bridges having fixed bearings as the structural deck-pier connections are normally
subjected to much smaller RSAs than their counterparts with monolithic joints in the
longitudinal direction of the bridge. The RSAs of the former in the longitudinal direction
can be lower than the equivalent response acceleration of 0.07g as adopted in SDMHR 3rd
for some MSCBs of this type especially when the piers are taller than 7 m. However, only
part of those with piers taller than 15 m can still have RSAs not exceeding that specified
by SDMHR 3rd under the most unfavourable circumstances with Importance Class III and
Ground Type D. In the longitudinal direction, the most likely upper and lower bounds of
RSAs for MSCBs of this type are found to lie in 0.03g - 0.14g and 0.07g - 0.70g,
respectively, while those for MSSBs are found to lie in 0.03g - 0.24g and 0.07g - 1.20g,
respectively. The MSSBs are generally stiffer than the MSCBs with fixed bearings and
are thus susceptible to higher RSAs.
In summary, the elastic seismic coefficient defined in accordance with SDMHR 2013 is higher
than 0.07g as adopted in SDMHR 3rd for common short- to medium-span highway bridges
under most circumstances and can most often be up to 2 to 18 times higher. Therefore, the
existing bridges are expected to yield under the design level earthquakes rather than to remain
elastic. For these bridges, the seismic coefficients can theoretically be reduced by a behaviour
factor not exceeding 3.5 as allowed by BS EN 1998-2 (BSI, 2005b) on condition that the
structural details comply with the minimum requirements as set out in BS EN 1998-2 to ensure
the required levels of ductility, which is rather unlikely. This will be discussed next. For those
incurring extremely large seismic coefficients, the flexural resistance of the piers of these
bridges may need enhancement so as to lessen the ductility demand imposed on the piers by
seismic actions within the available levels of ductility as allowed by BS EN 1998-2.

96
Pier height, m Pier height, m
Pier height, m Pier height, m
(a) (b)
(c) (d)
Figure 5.3 RSAs of sample bridges with Importance Class I and Ground Type A
Pier height, m Pier height, m
Pier height, m Pier height, m
(a) (b)
(c) (d)
Figure 5.4 RSAs of sample bridges with Importance Class III and Ground Type D
Assessment of structural details in existing bridges
BS EN 1998-2 has incorporated ductility requirements into the structural design to avoid
collapse during the design earthquake by ensuring the structural integrity of the bridge at
connections and providing at least a minimum level of deformability at critical sections. For
concrete piers, BS EN 1998-2 requires that the transverse reinforcement be closely spaced
especially over the potential plastic hinges to guard against outward buckling of main
longitudinal bars and that the longitudinal bars develop as far as possible into the bent cap and

97
pile cap among others. At the moveable connections, BS EN 1998-2 has specified a minimum
overlap (seat) length to avoid unseating at abutments and expansion joints. The relevant details
in the existing bridges will be checked for their compliance and potential failure modes of non-
compliant components will be discussed below. Other prevalent details that are vulnerable to
seismic actions will also be presented.
(1) Confining reinforcement
The intended ductility is largely dependent on the structural details that have been proven in
the laboratory to provide at least the intended ductility, and the effective confinement of the
core concrete is found to be of particular importance to the concrete piers. The requirements as
set out in BS EN 1998-2 for the spacing between hoops or ties in the longitudinal direction sL
and the transverse distance between hoop legs or cross-ties sT over the entire length of plastic
hinge are as follows:
sL shall not exceed 6 times the longitudinal bar diameter or 1/5 of the smallest dimension
of the confined concrete core to the hoop centreline; and
sT shall not exceed 200 mm or 1/3 of the smallest dimension of the concrete core to the
hoop centreline.
As there is no explicit ductility requirement according to the previous versions of design
manual, it is uncertain if both the values of sL and sT in the existing bridges can fulfil the current
standards, possibly resulting in deficient confinement of concrete. For instance, SDMHR 3rd
adopts a maximum longitudinal spacing of 12 times the size of longitudinal bar and a maximum
transverse distance of 300 mm for the transverse reinforcement, which are both larger than
those specified in BS EN 1998-2.
One of the important functions of the transverse reinforcement is to provide lateral support to
the longitudinal reinforcement in the bridge pier. If the transverse reinforcement is inadequate,
buckling of longitudinal bars may occur and cause premature brittle failure of the pier. Figure
5.5 shows two types of premature buckling of longitudinal reinforcement in a pier. Figure 5.5(a)
illustrates the buckling of the longitudinal bar between adjacent sets of transverse
reinforcement, while Figure 5.5(b) shows the buckling across multiple sets of transverse
reinforcement. The former is related to the excessive spacing while the latter is generally
caused by the inefficient lateral binding action provided by the hoops and/or cross ties.

98
Longitudinal
reinforcement
Longitudinal
reinforcement
Hoops Hoops
(a) (b)
Figure 5.5 Premature buckling of longitudinal reinforcement in piers: (a) buckling
between adjacent hoops; and (b) buckling across several hoops
Another important function of the transverse reinforcement is to provide shear resistance. As
shear failure is brittle in nature, it should be avoided. The capacity design strategy has been
adopted by BS EN 1998-2 to ensure that potential plastic hinges form before shear and/or other
brittle failures. The capacity design principles require that the shear resistance of the plastic
hinges and all other regions shall be designed to resist the shear forces developed when all the
plastic hinges have attained their overstrength moments. Considering the relationship between
shear resistance and moment resistance of a pier, there are three possible damage modes under
extremely strong earthquake: flexural failure, flexural-shear failure and brittle shear failure, as
illustrated in Figure 5.6 (ATC, 1981). Adequately confined concrete piers will behave
according to Figure 5.6(a). In the previous versions of design manual, no capacity protection
accounting for formation of plastic hinges was prescribed and the base shear force could be
underestimated, and hence the piers in some existing bridges may behave as shown in Figure
5.6(b) and Figure 5.6(c).
(a) (b) (c)
Figure 5.6 Failure modes of RC column: (a) flexural failure; (b) flexural-shear failure;
and (c) brittle shear failure (ATC, 1981)
Ba
se S
hea
r F
orc
e, V
Displacement Ductility, μΔ
Shear Strength
envelope
Flexural Strength
Ba
se S
hea
r F
orc
e, V
Displacement Ductility, μΔ
Shear Strength
envelope
Flexural Ba
se S
hea
r F
orc
e, V
Displacement Ductility, μΔ
Shear Strength
envelope
Flexural

99
(2) Splicing of longitudinal reinforcement
It is also common in some existing bridges that the longitudinal reinforcement was lap-spliced
at critical sections for construction convenience. However, this practice is discouraged today,
since “lap-splice failure” is probable even at small to moderate displacement ductility unless
very large amount of transverse reinforcement is provided. BS EN 1998-2 has allowed no
splicing by lapping or welding of longitudinal reinforcement within the plastic hinge region.
The “lap-splice failure” is described as “failure that involves relative longitudinal movement
of the spliced bars and that requires the formation of a fracture both perpendicular and parallel
to the member surface in order to permit the bars to slide relative to the RC-member core”
(Priestley et al., 1996). Theoretically the splice failure can occur before or after any yielding
of the longitudinal bars, depending on the spliced bars, the concrete and reinforcement, but
mostly on the splice length (Priestley et al., 1996). If the splice failure occurs before any
yielding of the bars, the section will not be able to develop its intended flexural strength. Even
if the splice is able to develop the flexural strength, its competence may gradually degrade
under cyclic loading. Eventually the residual moment capacity is sustained by the concrete
stress in the compression zone of the column with no contribution from the longitudinal bars.
Not only will lap-splice affect the moment capacity, but it will also have obvious influence on
the deformability of plastic hinges. Four types of moment-curvature behaviour have been
proposed by Priestley et al. (1996) as shown in Figure 5.7. Curves (1) and (2) denote the
moment-curvature model for confined and unconfined RC sections, respectively, both without
lap-splices. Curves (3) and (4) denote the models for lap-spliced section that the intended
flexural strength can and cannot be attained, respectively. These idealised models have been
verified by various studies (Chail et al., 1991; Lynn et al., 1996; Melek and Wallace, 2004). It
can be seen from Figure 5.7 that the curvature ductility drops significantly due to the presence
of lap-splice. However, if there is ample lap length and the section stays elastic under the design
seismic action such that the flexural strength is not exceeded, the existing bridge may be free
from lap-splice failure.
Figure 5.7 Curvature ductility of column section with and without lap-splicing of main
bars (Priestley et al., 1996)
Mu
Curvature ductility 米耳
Mom
ent
Mn
Ms
M r
米1
unconfinedconfined (1)
lap-spliced
(2)
(3)
(4)
1 米3 8 米2 8+米3

100
(3) Bearings and monolithic joint
Unless the superstructure and substructure are connected monolithically, bearings are
commonly used on the piers and abutments to support the superstructure. Aside from
transferring vertical gravity loads, the bearings can also facilitate longitudinal movements and
rotation due to live load deflection, expansion and contraction. The bearings can be important
components for transferring seismically induced forces from the superstructure to the
substructure and accommodating seismic movements. They are vitally important to the seismic
performance of the whole bridge.
The bearings can be classified by their horizontal behaviour as either fixed, moveable or
deformable. Moreover, the bridge articulation can be different in the longitudinal and
transverse directions. BS EN 1998-2 has specified different criteria for the design of different
bearings. Fixed bearings shall be designed as capacity protection components and damage of
shear keys and anchor bolts shall be avoided. Moveable bearings shall be able to accommodate
without damage the total displacement in the seismic design situation. Elastomeric bearings
shall be designed to resist the maximum shear deformation.
However, these present design approaches most likely have not been applied to the design of
existing bridges. In view of the higher seismic hazard level, bearings may be vulnerable in
earthquakes, particularly if they are also required to carry transverse shear. Fixed bearings are
vulnerable to shear failures in case the design shear capacity is exceeded. Elastomeric bearings
that have deflected beyond their design shear movement may be ruptured. For sliding bearings,
if the design capacity for sliding movement has been exceeded, damage is likely.
Monolithic connection as another type of connection between the superstructure and
substructure is able to transfer shear forces as well as bending moments. The performance of
such joints depends on proper structural detailing. For example, the reinforcement may be
pulled out of the joint due to insufficient development length of reinforcement through the
connection. Besides, joint shear damage is often caused by insufficient confinement at the joint
region. BS EN 1998-2 has required capacity design in shear for joints, and continuation of pier
stirrups and “beam” stirrups into the joint is recommended.
(4) Movement joint
Movement joints are normally provided in bridges to allow movements due to thermal, creep
and shrinkage deformations of the superstructure. The movement joints have been a source of
extensive damage in past earthquakes due to the pounding at joints. Although they are often
treated as non-critical structural components and expected to be damaged under the design
seismic action, they should still cater for a predictable mode of damage and provide the
possibility of permanent repair. For this reason, BS EN 1998-2 requires that the clearances
should accommodate appropriate fractions of the design seismic displacement and of the
thermal movement after allowing for any long-term creep and shrinkage effects. In this manner,
any damage under frequent earthquakes for much shorter return periods than that for the design
seismic event is avoided. Appropriate values of such fractions may be chosen, based on a
judgement of the cost-effectiveness of the measures taken to prevent damage.
During an initial survey of existing bridges, it was found that common clearances at movement
joints of 50 mm, 75 mm and 100 mm were provided to bridges in Hong Kong of small- to
medium-spans. It is expected that these movement joints may be incapable of relieving possible
pounding under extremely strong earthquakes. The current seismic design methodology for
bridges calls for movement joints that are capable of accommodating large multi-directional
displacements as well as dissipating energy, i.e. the so-called “seismic movement joint”.

101
(5) Overlap length
The unseating at movement joints is one of the most devastating types of bridge damage. The
damage due to unseating has been mostly attributed to narrow seats. Sufficient overlap length
between the supported and supporting members shall be provided if relative displacement is
intended, which includes but is not restricted to
seismic displacement;
long-term displacement, such as shortening due to prestressing, and creep and shrinkage
of concrete decks;
thermal expansion and contraction; and
minimum supported length ensuring the safe transmission of the vertical reaction (not less
than 400 mm).
It is necessary to estimate the value of the total displacement in order to provide adequate
overlap length. BS EN 1998-2 has provisions for the design value for each of the displacements
in seismic design situation, whereas the previous versions of manual have not provided any
guidance on estimation of the seismic displacement.
The typical overlap lengths in existing bridges were found to be 0.4 m to 0.8 m for the MSSBs
and 1.1 m to 2.5 m for the MSCBs. It is unlikely that the girders will become unseated with
such ample seats. Nevertheless, detailed assessment should be carried out. If the required
minimum overlap lengths are not met, seat extenders can be provided, or alternatively positive
linkages such as catchers and restrainers between supporting and supported members may be
used.
(6) Half joint
The half joint as shown in Figure 5.8 is a typical feature in many bridges built until mid- to late
1990s around the world and, with no exception, it applies to Hong Kong. In accordance with
BS EN 1998-2, seismic links shall always be provided at intermediate separation joints located
within the span to prevent unseating of the suspended beams and to resist large shock forces
caused by unpredictable pounding between adjacent sections.
Half joints were initially introduced into concrete bridges as a means to simplify design and
construction operations. However, in addition to potential pounding and unseating damage
during earthquakes, there are usually leakage problems causing concrete deterioration and
corrosion of reinforcement at the joints. Moreover, they are not easily accessible for inspection
and maintenance. The use of half joints should be discouraged now.
Figure 5.8 Bridge with half joints
Pier
Half joint
Bridge deck
Existing Road

102
(7) Dowel bar
After reviewing some existing bridges in Hong Kong, it is found that dowel bars were widely
used in precast-beam-and-slab bridges in the past as shown in Figure 5.1(a). The dowel bar is
embedded in the precast beam and inserted into the keyhole cast at the cap beam so as to restrict
the horizontal movements of the deck. This practice is usually adopted at one end of the precast
beam, i.e. the fixed end. At the other end, the beam is only supported by the laminated
elastomeric bearing that is designed to cope with rotational and horizontal movements in all
directions, i.e. the free end.
However, this supporting system can be detrimental to the seismic resistance of bridges. Owing
to the presence of the dowel bar, the horizontal shear stiffness at the fixed end is much higher
than that at the free end, causing torsional effect as shown in Figure 5.9. The torsional effect is
mainly balanced by shear forces of the dowel bars and eventually transferred to the pier.
Consequently, it is likely that the pier would suffer the effect of shear-bending-torsion
interaction during an earthquake, which would adversely affect the seismic resistance of the
pier. Besides, the deck may also rotate so much as to break the dowel bars. Once the dowel
bars are ruptured, pounding between adjacent components may occur, possibly causing even
unseating of the beams.
In view of the risks, the use of dowel bars for shear keys should be reviewed and improved in
future. One possible solution is to provide only laminated elastomeric bearings at both ends.
To avoid unseating, larger bearing seat and side keeper devices may be adopted. Alternatively,
if the deck is made continuous over several spans, the torsional effect can be relieved.

103
Cap beam
Bridge deck
F1
F1 Transverse inertial force
Fixed end with dowel bar
Free end with elastomeric bearing
Figure 5.9 Torsional effect of bridge deck under transverse seismic excitation
Summary
In Table 5.1 that summarizes the possible failure modes of various components during
earthquake, there are basically two categories of failure in nature: brittle failures such as shear
failure and span unseating, and ductile failures such as flexural failure. Owing to the brittle
nature of all the possible failure modes of the superstructure and connections, these components
are required to remain elastic and shall be protected by capacity design and proper detailing. A
problem with foundation damage is that it occurs underground, which may not be detected or
accessible for repair. Bridge foundations shall thus be designed to remain elastic as capacity-
protected components as far as practicable. The substructure is usually intentionally used as a
major means of hysteretic energy dissipation for non-isolated bridges. Brittle shear failure
should be avoided in the substructures by applying capacity design strategy and proper
detailing. These principles, which were specified in BS EN 1998-2 and adopted by SDMHR
2013, should be adequately considered not only in the design of new bridges but also in the
assessment of existing bridges.
Fixed end with dowel barFree end with elastomeric bearing
FI
Cap beam
Bridge deck
Transverse inertia forceFI

104
Table 5.1 Vulnerable members and possible failure modes Component Possible failure modes
Superstructure Span unseating or pounding caused by large movement (Brittle)
Girder-pier connection Shear failure of bearing or cast-in-place joint (Brittle)
Pier Shear failure (Brittle), or flexural failure (Ductile)
Foundation Shear failure (Brittle), or flexural failure (Ductile)
Seismic Assessment of Existing Bridges
Philosophy
Seismic structural assessment is usually required for non-compliant structures to obtain
information on their likely performance so as to facilitate decision making on suitable
retrofitting plans. The seismic assessment of existing structures can be conducted in a variety
of ways, including the standard force-based assessment, equivalent elastic strength assessment,
nonlinear time-history analysis and displacement-based assessment (Priestley et al., 1996).
The most straightforward method of seismic assessment is the standard force-based assessment,
which is similar to the strength verification in design of new structures, by comparison of the
base shear demand specified by the design code against the estimated base shear capacity. The
base shear strength required by the design code is obtained in the usual manner, i.e. reducing
the elastic base shear force corresponding to the elastic stiffness of the structure by a code-
specified force-reduction or behaviour factor to account for the effect of presumed ductility.
The actual assessed base shear strength is then estimated. Comparison of the capacity with the
demand will indicate whether the structure is satisfactory. For the case of the capacity being
not less than the demand, the structure is satisfactory; otherwise it is unsatisfactory.
The classical approach of using the capacity-demand ratio is primarily based on strength, but
no assessment is made regarding the actual displacement or ductility capacity. In view of this,
the equivalent elastic strength assessment, relying on a mixed strength and displacement
assessment, is a much-improved approach. The characteristic force-displacement response is
determined, resulting in an expected strength and displacement capacity. Then, as opposed to
the standard force-based assessment, an equivalent elastic strength is derived by multiplying
the actual strength by the displacement ductility factor based on the equal displacement
approximation and is compared with the elastic base shear requirement for the same elastic
stiffness according to the design code. Although this approach still retains elements of the
force-based approach, the actual ductility capacity is adopted. However, the method is
considered less effective for multi-degree-of-freedom structural systems, as there is hardly any
reliable way for including the effects of higher-order modes for determining the displacement
capacity. Moreover, owing to the use of displacement-equivalence rule, such as the equal
displacement approximation, the accuracy of this method is affected.
At present, the most accurate method for determining the seismic response of an existing
structure is by nonlinear time-history analysis. In this method, the effects of higher-order modes
and nonlinear properties of components are directly included in the analyses. As a result, it is
expected to provide insight into the actual performance of the structure under seismic ground
motions and to predict the force and displacement demands at various components more
accurately. The procedure of nonlinear time-history analysis is quite straightforward. An
appropriate structural model is developed, a suite of spectrum-compatible accelerograms is
chosen, the average structural response to the accelerograms is determined, and the critical
response parameters are then compared with their respective capacities.

105
Assessment criteria
(1) Conventional damage index
The damage index (DI) is usually employed to quantify the extent of damage to structures
caused by earthquake excitations. Many proposals are currently available to calibrate a DI
based on a number of parameters such as deformation, stiffness, energy absorption, etc. The
available concepts related to DIs can be divided into two broad categories: non-cumulative DI
and cumulative DI.
Non-cumulative DIs are generally simple but they often do not reflect the state of damage
accurately because the effects of cyclic loading are not included. The ductility ratio, which is
expressed as the ratio of the maximum deformation in the loading time history to the yield
displacement, is an example of non-cumulative DI and it is also the simplest available DI.
On the other hand, cumulative DIs are more rational but more complicated than the non-
cumulative DIs as they include the effects of cyclic loading. The mechanistic seismic damage
model (Park and Ang, 1985) has been widely adopted by researchers up to now, which
expresses the seismic structural damage as a linear combination of the damage caused by
excessive deformation considering the effect of repeated cyclic loading as
DI=δM
δu+
β
Qyδu∫ dE (5.1)
where δM is the maximum deformation under earthquake; δu is the ultimate deformation under
monotonic loading; Qy is the calculated yield strength; dE is the incremental absorbed
hysteretic energy; and β is a non-negative parameter. The three parameters included in the
damage model shall be calibrated on the basis of extensive monotonic and cyclic test data of
RC beams and columns.
A number of modifications to the above damage model of Park and Ang have been developed
over time. For instance, Stone and Taylor (1993) used the moment-curvature behaviour and
accounted for the effect of recoverable curvature as
DI = Φm-Φr
Φu-Φr+β (
At
ΦuMy) (5.2)
where Φm denotes the maximum curvature attained during seismic loading; Φu denotes the
ultimate curvature capacity of section; Φr denotes the recoverable curvature at unloading; My
is the yield moment of section; At is the total area bounded by the M -Φ loops; and β is a
strength deterioration parameter.
The first component in Equation (5.2) is equivalent to the ductility ratio, while the second
component is a strength deterioration term that is related to the cumulative normalized energy
absorbed by the columns. Besides, Stone and Taylor (1993) proposed three states, i.e. yield,
ultimate and failure states, as distinguished by the yielding of longitudinal steel, attainment of
ultimate load (moment) capacity and loss of lateral load capacity up to 20%, respectively. The
three states form useful delimiters for four possible damage states that might exist in a bridge
column following an earthquake, i.e. no damage, repairable, to demolish and about to collapse.
Stone and Taylor (1993) estimated the threshold values of the damage index for the three limit
states by examining the statistical distribution of calculated values from laboratory tests of 82
spiral-reinforced bridge piers. The tenth percentile of each of the three distributions was found
to provide threshold damage index estimates, which are close to the mode and yet are fairly
conservative. The tenth percentile threshold index estimates for the three damage states are
determined as 0.11, 0.40 and 0.77, respectively.

106
Hose and Seible (1999) proposed five performance levels for individual components and entire
system. The corresponding damage limit states are No Damage, Minor Damage, Moderate
Damage, Major Damage, and Local Failure / Collapse. The qualitative and quantitative
guidelines for these five performance levels as provided by Hose and Seible (1999) based on
results of bridge components and systems tested over 15 years are shown in Table 5.2. The
qualitative and quantitative descriptions for these performance levels are based on performance
measures that can be observed visually. The first performance level, i.e. Cracking, which
corresponds to the No Damage limit state, is described by barely visible hairline cracks that
close after a seismic event and require no repair. The second performance level, i.e. Yielding,
is defined as the stage when the reinforcement has yielded and it is characterized by cracks that
are clearly visible after the seismic event but are less than 1 mm in width, which implies Minor
Damage. The third performance level, i.e. Initiation of Local Mechanism, is defined as the
onset of inelastic deformation that, depending on the prevalent failure mechanism, consists of
development of diagonal cracks or spalling of concrete cover. This performance level is
quantified by Moderate Damage with crack widths between 1 mm and 2 mm or lengths of
spalled regions greater than 1/10 of the cross-section depth. The Major Damage limit state is
correlated with the full development of local mechanism. This performance level can be
qualitatively described as the stage when cracks and spalling extend over the full region of the
local mechanism region. Quantitatively, cracks greater than 2 mm in width and lengths of
spalled regions that extend significantly beyond half of the section depth in the loading
direction are commonly observed. The final performance level, i.e. Collapse, is reached when
the structural component or system experiences a significant reduction in observed or
calculated strength such that the load-carrying capacity of the component can no longer be
relied upon. This performance level is reached when buckling of the main reinforcement is
initiated, and the hoop or tie reinforcement fails due to anchorage problem or rupture. It can
also be caused by crushing of concrete core. For field investigation following a seismic event,
this level can be characterized by crack width greater than 2 mm within the concrete core.
Table 5.2 Bridge performance levels and criteria (Hose and Seible, 1999)
Hose and Seible (1999) adopted three indices that can be evaluated at each performance level:
residual deformation index RDI, equivalent viscous damping ratio ξeq and normalized effective
Level Performance level Qualitative performance
description
Quantitative performance
description
I Cracking
(Fully operational) Onset of hairline cracks Cracks barely visible
II Yielding
(Operational)
Theoretical first yielding of
longitudinal reinforcement Crack widths < 1 mm
III
Initiation of local
mechanism
(Limited damage)
Initiation of inelastic deformation;
Onset of concrete spalling;
Development of diagonal cracks
Crack widths 1 - 2 mm;
Length of spalled region > 1/10 cross-
section depth
IV
Full development of
local mechanism
(Life safety)
Wide and extended cracks;
Significant spalling over local
mechanism region
Crack widths > 2 mm;
Diagonal cracks extend over 2/3 cross-
section depth;
Length of spalled region > 1/2 cross-
section depth
V
Strength
degradation
(Collapse)
Buckling of main reinforcement;
Rupture of transverse
reinforcement; Crushing of core
concrete
Crack widths > 2 mm in core concrete

107
stiffness nk. The RDI is a non-dimensional index that is obtained by dividing the permanent
residual displacement observed at each performance level Δr by the ideal yield displacement
Δy, i.e.
RDI=Δr
Δy (5.3)
The parameters necessary for the calculation of the RDI are shown in Figure 5.10. On the other
hand, the equivalent viscous damping ratio ξeq can be calculated based on the equal area
approach in terms of parameters Ed and Es defined in Figure 5.10 as
ξeq=1
2π(
Ed
Es) (5.4)
The calculation of ξeq for cases with symmetric hysteresis loops is also shown in Figure 5.10.
In particular, Ed is the area within the inelastic force-displacement response curve, which is a
measure of the hysteresis damping or energy-dissipating capacity of the structure, while the
hatched region Es denotes the elastic energy stored in an equivalent linear elastic system. The
slope of the equivalent linear elastic system is defined as the effective stiffness Keff. For non-
dimensional representation, the effective stiffness parameter is normalized by the initial
stiffness Ko to give the normalized effective stiffness nk as
nk=Keff
Ko (5.5)
The parameters necessary for the calculation of the normalized effective stiffness nk are also
shown in Figure 5.10. Some components and systems may experience asymmetric response in
the two loading directions under cyclic loading. The concept of taking the average of the push
and pull responses can be applied to the determination of the residual displacement index RDI,
equivalent viscous damping ratio ξeq and normalized effective stiffness nk, as shown in Figure
5.11 and in equation forms, respectively, as
RDI=1
2(
Δr1
Δy1+
Δr2
Δy2) (5.6)
ξeq=1
4π(
Ed1
Es1+
Ed2
Es2) (5.7)
nk=1
2(
Keff1
Ko1+
Keff2
Ko2) (5.8)

108
Es
Ed
Force
Δ
Δy
Fy
Δr Δ
F
K0Keff
Δy =ideal yield displacement
Δr =permanent residual deformation
Es=elastic strain energy
Ed=energy dissipated per cycle
K0=ideal yield stiffness
Keff=effective stiffness
Figure 5.10 Residual deformation index (RDI) and equivalent damping ratio (ξeq) for
symmetric hysteresis loops (Hose and Seible, 1999)
Es1
Ed2
Force
Δ Δy1
Fy1
Δr1 Δ1
F1
Ko1Keff1
Δy1 =yield displacement, 1
Δr1 =residual deformation, 1
Es1=elastic strain energy, 1
Ed1=energy dissipated, 1
KO1=ideal yield stiffness, 1
Keff1=effective stiffness, 1
Es2
Ko2
F2
Fy2
Δy2 Δr2 Δ2
Δy2 =yield displacement, 2
Δr2 =residual deformation, 2
Es2=elastic strain energy, 2
Ed2=energy dissipated, 2
KO2=ideal yield stiffness, 2
Keff2=effective stiffness, 2
Keff2
Ed1
Figure 5.11 Residual deformation index (RDI) and equivalent damping ratio (ξeq) for
asymmetric hysteresis loops (Hose and Seible, 1999)
From the evaluation of results from laboratory tests as well as damage from past earthquakes,
the threshold values for these indices at each performance level are estimated as shown in Table
5.3. The indices have been observed to vary depending on the type of failure mode of the
structure.

109
Table 5.3 Threshold values of some indices at selected performance levels (Hose and
Seible, 1999) Behaviour Mode: Brittle
I II III IV V
RDI
ξeq
nk
< 0.1
< 8
1.6
0.25
8
1.1
0.5
10
0.8
0.75
11
0.5
1.25
12
0.3
Behaviour Mode: Strength Degrading
I II III IV V
RDI
ξeq
nk
< 0.1
< 8
1.6
0.25
8
1.0
0.5
10
0.5
1
13
0.3
1.5
14
0.1
Behaviour Mode: Ductile
I II III IV V
RDI
ξeq
nk
< 0.1
< 8
1.6
0.25
8
1.1
0.5
10
0.6
3
20
0.25
5
25
0.175
As observed from the above, there is no universally accepted range for the magnitude of DI. It
is now widely accepted that the magnitude of DI should ideally vary between 0 and 1. In other
words, a structure suffers no damage when it operates within its elastic limit and hence the DI
should be equal to 0 at this stage, while the maximum possible magnitude for DI should be set
equal to 1, which denotes the event of total collapse. Obviously, the DIs discussed above have
the drawbacks as follows: (a) the magnitude of DI is non-zero when a structure operates within
the elastic range; and (b) the magnitude of DI often exceeds 1, i.e. there is no specific upper
limit to define the state of collapse.
(2) Strain-based damage index
For RC flexural members such as concrete beams, columns and walls, the strain limits at the
material level can be used for the identification of element damage limit states and performance
levels. The strain-based damage index has the benefits of cumulative and non-cumulative
damage indices. The strain limits for concrete compression and steel tension adopted by
Kowalsky (2000) to define selected limit states are shown in Table 5.4. The two limit states
considered are “serviceability” and “damage control”. According to Kowalsky (2000),
“serviceability’’ implies that repair is not needed after the earthquake, while ‘‘damage control’’
implies that only repairable damage occurs. Consequently, the serviceability concrete
compression strain is defined as the strain at which crushing is expected to begin, while the
serviceability steel tension strain is defined as the strain at which residual crack widths would
exceed 1 mm, thus likely requiring repair and interrupting serviceability. The proposed strain
limits for serviceability limit state as shown in Table 5.4 are generally accepted. The damage
control concrete compression strain is defined as the compression strain at which the concrete
is still repairable. As the ultimate concrete compression strain estimated using the model of
Mander et al. (1988) is found to be consistently conservative by 50% or more as compared to
the test results, Kowalsky (2000) has based the damage control concrete compression strain
level on this estimated ultimate concrete compression strain, recognising that failure would not
occur until the strain levels increase by at least 50% over the damage control strain. It should
be noted that the damage control concrete strain of 0.018 is obtained assuming well-detailed
systems typically with the volumetric ratio of transverse reinforcement of around 1% and may
not be appropriate for assessment of existing columns with insufficient confinement. The steel
tension strain at the damage control level is likely to be related to the point after which incipient
buckling of reinforcement will occur during subsequent reversed load cycles. However, there
were insufficient data to quantify this limit at that time. Therefore, the steel tension strain at

110
damage control level as shown in Table 5.4 is limited to avoid rupture of reinforcement while
allowing for the reduction in strain capacity due to cyclic loading.
Table 5.4 Performance strain limits (Kowalsky, 2000)
Limit State Concrete Compressive Strain
Limit Steel Tensile Strain Limit
Serviceability 0.004
(Onset of cover concrete crushing)
0.015
(Residual crack widths exceeding 1 mm)
Damage Control
0.018
(Ultimate concrete compression
strain estimated according to Mander
et al. (1988))
0.060
(Avoiding rupture of reinforcement while
allowing for reduction in strain capacity due
to cyclic loading)
Goodnight et al. (2013, 2015, 2016) tested 30 large-scale RC bridge piers with diverse values
of axial load, longitudinal steel content, aspect ratio and transverse steel detailing under
reversed cyclic loading and real seismic load histories, and made an effort to calibrate the
performance strain limits recommended by Kowalsky (2000) through the use of an optical
three-dimensional position measurement system to obtain high fidelity strain data of concrete
and reinforcing steel. The calibrated performance strain limits are shown in Table 5.5 with
major change to the damage control steel tensile strain limit. The peak tensile strain expected
to initiate bar buckling in longitudinal reinforcement upon reversal of load was found to be
much smaller than 0.060 and an empirical expression was developed based on the dataset.
Table 5.5 Calibrated performance strain limits (Goodnight et al., 2013, 2015, 2016)
Limit State Concrete Compressive Strain
Limit Steel Tensile Strain Limit
Serviceability 0.004
(Onset of cover concrete crushing) Not provided.
Damage Control
0.018
(Ultimate concrete compression
strain estimated according to Mander
et al. (1988))
0.03+700ρs
fyh
Es
-0.1P
f'cAg
where ρs is the transverse volumetric steel
ratio, fyh
Es is the yield strain of transverse steel,
and P
f'cAg is the axial load ratio.
Su et al. (2017) further proposed damage indices based on the strain-based damage to
reinforcing bars and cover concrete. The damage index Ds based on the damage limit states
proposed by Hose and Seible (1999) is given in terms of the steel tensile strain εs by
Ds=
{
(εs εy⁄ )Ds1 εs<εy
Ds1+[(εs-εy) (εc1-εy)⁄ ](Ds2-Ds1) εy≤εs<εc1
Ds2+[(εs-εc1) (εc2-εc1)⁄ ](Ds3-Ds2) εc1≤εs<εc2
Ds3+[(εs-εc2) (εbb-εc2)⁄ ](Ds4-Ds3) εc2≤εs<εbb
Ds4+[(εs-εbb) (εu-εbb)⁄ ](Ds5-Ds4) εbb≤εs<εu
Ds5 εs≥εu
(5.9)
where εy denotes the steel yield strain, εc1 and εc2 denote the steel strains corresponding to 1
mm and 2 mm crack widths, respectively, εbb denotes the peak steel strain prior to bar buckling

111
and εu denotes the ultimate steel strain; and the parameters Ds1 to Ds5 are damage measures at
the limit states, which are set to 0.1, 0.2, 0.4, 0.6 and 1.0, respectively. The damage index Dc
is given in terms of the length of spalled region p as a percentage of the cross-section depth by
Dc={
(p p1
⁄ )Dsc1 p≤p1
Dsc1+[(p-p1) (p
2-p
1)⁄ ](Dsc2-Dsc1) p1
<p≤p2
Dsc2+[(p-p2) (p
3-p
2)⁄ ](Dsc3-Dsc2) p2
≤p<p3
(5.10)
where the selected damage limit states are determined based on Hose and Seible (1999) with
p1, p
2 and p
3 rounded off to 25%, 65% and 100%, respectively; and the corresponding damage
measures Dsc1, Dsc2 and Dsc3 are set to 0.2, 0.4 and 0.6, respectively. The damage index for the
section is then taken as the larger of the concrete and steel damage measures. It should be noted
that this damage index varies between 0 and 1.
Performance-based seismic assessment
A variety of performance levels and the associated limit states have been introduced at member-
level to evaluate the performance of concrete structures as noted above. Other classifications
of performance level are also available. At member-level, Priestley et al. (2007) presented five
damage limit states: cracking state, first-yield limit state, spalling limit state, buckling limit
state and ultimate limit state, while BS EN 1998-3 (BSI, 2005c) specified three limit states, i.e.
Damage Limitation (DL), Significant Damage (SD) and Near Collapse (NC), based on chord
rotation limits. The strain-based limit states are now widely adopted in performance-based
seismic design and assessment of structures. This section provides an overview of the
procedures for conducting performance-based seismic assessment based on capacity-demand
analysis. This method applies to bridges with piers as major earthquake-resisting components.
(1) Moment-curvature analysis
One of the basic steps for performance-based seismic assessment of structures is moment-
curvature analysis. In simple terms, the cross section is discretised into fine strips (“fibre”) and
the stress in each strip and that in the reinforcement are calculated based on the assumed strain
profile that complies with the assumption that plane sections remain plane. Based on the
calculated axial force, the strain profile is then updated so that the calculated axial force
converges to the applied axial force. The curvature and bending moment at that point are then
calculated. The definition of the section is illustrated in Figure 5.12. It is important that the
material properties are prescribed separately for the cover concrete, confined core concrete and
longitudinal reinforcement. In particular, the compressive properties of confined concrete
should take into account the confining effect of as-built transverse steel details and the model
of Mander et al. (1988) has usually been employed to generate the stress-strain model for
confined concrete. At the end of this step, the curvatures at selected limit states when some of
the concrete and steel “fibres” have reached the associated strain limits should be determined.
For example, in Figure 5.13 that shows the moment-curvature curve of a pier base-section, the
curvatures at three limit states, i.e. DL, SD and NC as specified in BS EN 1998-3 (BSI, 2005c),
are identified based on steel tensile strain of 0.0025, concrete compressive strain of -0.005 and
concrete compressive strain of -0.006, respectively, which correspond to the yielding strain of
longitudinal bar, spalling strain of cover concrete and ultimate strain of core concrete in this
case.

112
Figure 5.12 The “fibre section” model of a bridge pier
Figure 5.13 Moment-curvature curve of a pier section
(2) Force-displacement response (pushover analysis)
The next step is to relate the selected limit state curvatures to the member response. The main
technique currently utilised to convert curvatures to displacements is based on the plastic hinge
method presented by Priestley et al. (2007). In this method, the elastic and plastic curvature
distributions are separated into simplified equivalent shapes, i.e. triangular distribution and
uniform distribution, as shown in Figure 5.14. In particular, the plastic curvature is concentrated
over a constant height termed the plastic hinge length Lp and the width of the rectangular shape
is equal to the actual plastic curvature ϕp at the base section. To account for the strain
penetration of longitudinal reinforcement into the footing, the curvature distribution is assumed
to extend into the footing by a depth termed the strain penetration length Lsp.
-0.060
-0.040
-0.020
0.000
0.020
0
10
20
30
40
50
60
70
0 0.01 0.02 0.03
Str
ain
Mo
men
t M
(×1
03
kN
·m)
Curvature φ (1/m)
0.0025
-0.005
SD
DL
Tensile strain of outmost main bar
Compressive strain of
innermost cover concrete
-0.006
NC
M-φ curve

113
Lc
Lsp
Lp ϕ p
'
y '
y
M
M
Figure 5.14 Plastic hinge methods (Priestley et al., 2007)
The displacement at the top of column, which is deemed to be fixed at the base, is mainly
contributed by the flexural deformation (including both elastic and inelastic components) along
the length of the column and fixed-end rotation attributable to the strain penetration. The shear
deformation along the length of the column may be neglected as it is commonly much smaller
compared with the flexural deformation, especially for columns of aspect ratios greater than 3
(Priestley et al., 2007). Therefore, the displacement at the top of column ∆ is obtained in terms
of the moment M and curvature ϕ at the base section by
∆ = ∆'yM
M 'y+∆p (5.11)
∆'y =φ'y(H+C1Lsp)
2
3C1 (5.12)
∆p = (φ-φ'yM
M 'y)Lp (H+C1Lsp-
C1Lp
2) (5.13)
where ∆'y denotes the displacement at first yield when the extreme tension reinforcement first
attains its yield strain; ∆p denotes the displacement contributed by flexural plastic deformation
including strain penetration; M 'y and ϕ'y are the moment and curvature at first yield,
respectively; H is the effective height of column; and C1 is a coefficient accounting for end
rigidity with C1 = 1 for vertical cantilevers and C1 = 2 for double-bending columns assuming
the contraflexure point to be at the mid-height. The plastic hinge length Lp and strain
penetration length Lsp can be estimated, respectively, by (Priestley et al., 2007)
Lp =kH
C1+Lsp ≥ 2Lsp (5.14)
Lsp = 0.022fyk
dbL (5.15)
where fyk
and dbL are the yield strength and diameter of main reinforcing bar, respectively; and
k is a coefficient associated with ultimate tensile strength / yield strength ratio (ftk
fyk
⁄ ) of the
main reinforcing bar given by
k = 0.2 (ftk
fyk
-1) ≤ 0.08 (5.16)
For the force-displacement curve (also known as the capacity curve here), the lateral force at
the top of column F is calculated by

114
𝐹 =C1M
H (5.17)
Furthermore, the flexural response has been found to interact with the shear response
(Kowalsky and Priestley, 2000). The shear strength decreases as the flexural plastic
deformation increases. Flexural-shear failure may occur and lead to incomplete development
of displacement capacity of the column as shown in Figure 5.15. Priestley et al. (2007) have
also proposed a method for the calculation of shear capacity in this case.
Figure 5.15 Interaction between flexure and shear
(3) Capacity-demand assessment of bridge
As mentioned previously, the earthquake demand for a bridge may be represented by a response
spectrum. Both the elastic acceleration spectrum Se(T) and elastic displacement spectrum
SDe(T) can be used, but by far the most commonly used is the acceleration spectrum. The
elastic displacement spectrum can be obtained by direct transformation of the elastic
acceleration response spectrum using (BSI, 2004c)
SDe(T)=Se(T) (T
2π)
2
(5.18)
These spectra, when scaled by the seismic mass, give the seismic forces acting through the
centre of mass of the bridge. To combine the pushover capacity curve and the demand spectrum
in a single plot, however, it is convenient to express the spectral acceleration in terms of spectral
displacement rather than period T , resulting in the acceleration-displacement response
spectrum Sa(SDe) (also known as the demand curve here). To do so, Equation (5.18) is first
written as
SDe(T)=2.5ag∙S∙η∙TC⋅T
4π2 (5.19)
based on the acceleration spectrum defined in BS EN 1998-1 (BSI, 2004c) as
Se(T)=2.5ag∙S∙η∙TC
T (5.20)
where ag denotes the design peak ground acceleration on “rock” site with importance of
structure accounted for, S is the soil factor, η is the damping correction factor, and TC is the
upper limit of the period of the constant spectral acceleration branch (BSI, 2004c). Combining
Equations (5.19) and (5.20) to eliminate the period T gives
Se=1
SDe(2.5ag∙S∙η∙
TC
2π)
2
(5.21)
Bas
e sh
ear
forc
e F
Displacement ∆
Shear strength
Flexural response

115
Figure 5.16(a) shows the spectral acceleration plotted against spectral displacement. It is noted
that the probable maximum spectral displacement is solved by setting T = TD defining the
beginning of the constant displacement response range in Equation (5.19).
This spectrum assumes 5% viscous damping in the bridge and it should be modified by η for
other damping values. A value of 5% is appropriate for essentially elastic behaviour. However,
once yielding occurs, the damping level increases. The effective damping ξeff is therefore
introduced for this purpose, which can be calculated assuming idealized elasto-plastic response
as (Kowalsky et al., 1995)
ξeff = ξ0+1
π(1 −
1
√𝜇) (5.22)
where 𝜇 = ∆ ∆y′⁄ is the ductility factor at the current displacement; and ξ0 is the damping
before the yielding of the bridge, which is taken to be 0.05. The value of the damping correction
factor η may be determined as (BSI, 2004c)
η=√0.1
0.05+ξeff
≥ 0.55 (5.23)
2.5PGA S
C D2.52π 2π
T TPGA S
RSD
RSA
2
C2.52π
TRSA RSD PGA S
Displacement
Accel
era
tio
n
Performance point
(a) (b)
Figure 5.16 Capacity-demand analysis: (a) Acceleration-displacement response
spectrum; and (b) Determination of demand
The seismic demand imposed on a bridge by the design earthquake may be determined by the
intersection point when its capacity curve is superimposed onto the demand curve as shown in
Figure 5.16(b). The seismic performance of the bridge can then be evaluated by comparing the
seismic demand with the capacity at selected limit states. The difficulty, however, is that the
final displacement is unknown and those damping factors cannot be calculated in advance.
Iteration is therefore used, starting with an initial estimate for displacement and iterating until
the assumed value and the calculated value are in agreement. The basic steps in this method
are listed below:
(1) Start iteration by setting ∆ equal to the displacement of the bridge assuming elastic
behaviour, and calculate the ductility factor μ;
(2) Calculate the damping factors ξeff and η;
(3) Calculate the capacity acceleration /ca F M , where F is the capacity of the bridge at
displacement ∆ and M is the seismic mass;
(4) Set Sa = ac and solve for SDe in Equation (5.21);
(5) Compare SDe with the value for ∆ and, if in agreement, go to Step (6); otherwise set
∆=SDe and recalculate μ, and then repeat from Step (2); and

116
(6) Compare the final ∆ with the capacity displacements at various limit states to estimate
the likely performance of the bridge.
Numerical Simulation
Two bridges with conditions of Importance Class II and Ground Type C are assessed using the
capacity-demand analysis. The structural seismic response of a bridge is mostly related to the
fundamental period T, the normalized axial force k Ed c ck/N A f expressed in terms of the
axial force NEd, the gross area of column cross-section Ac, and the characteristic compressive
strength of concrete fck, the aspect ratio 1/s H C h expressed in terms of the shear span
1/H C where C1 has been defined before, and the depth of column cross-section in the
direction of flexure h, and the longitudinal and transverse reinforcement ratios ρL and ρw,
respectively. The information of the two example bridges are listed in Table 5.6.
Table 5.6 Information of example bridges
Bridge Properties of bridge
h (m) H (m) Connection C1 αs ηk T (s) ρL (%) ρw (%)
T026-S095-C058 3.00 5 Fixed-bearing 1 1.7 0.093 0.26 0.95 0.58
T062-S368-C122 1.80 5 Fixed-bearing 1 2.8 0.093 0.62 3.68 1.22
The basic performance requirement for bridges as set out in BS EN 1998-2 (BSI, 2005b) is that
the bridge shall retain the structural integrity and possess adequate residual resistance to enable
the immediate occupancy of emergency traffic after occurrence of design seismic event and
that the damage to some parts of the bridge due to their contribution to energy dissipation shall
be easily repairable. A further requirement is that frequent events with much shorter return
periods than that of the design event should only cause minor damage and the bridge should
remain fully functional after those events. In view of these, the performance requirements as
adopted in SDMHR 2013 for bridges are elaborated in Table 5.7.
Table 5.7 Performance requirements for bridges based on SDMHR 2013
Return Period (year) Bridge
Importance Class III Importance Class II Importance Class I
475 Full service Full service Emergency traffic
1000 Full service Emergency traffic -
2500 Emergency traffic - -
It is known from a number of experimental investigations (Berry et al., 2004; Goodnight et al.,
2015; Lehman et al., 2004) that the sequence of damage in RC columns under cyclic excitations
is normally as follows: concrete cracking, yielding of longitudinal reinforcement, initial
spalling of concrete cover, complete spalling of concrete cover, yielding of transverse
reinforcement, buckling of longitudinal reinforcement, fracture of transverse reinforcement,
and fracture of longitudinal reinforcement. As either bar buckling, spiral fracture or
longitudinal bar fracture will initiate loss of lateral-load resistance and hence prohibit
immediate post-earthquake occupancy, these types of damage should technically be avoided
and not expected in consideration of the basic performance requirement. The damage limit state
for the performance level of restricted service by emergency traffic is taken to be (a) residual
crack width of 2 mm, and (b) cover concrete spalled up to 1/10 of section depth by reference
to Hose and Seible (1999) and Lehman et al. (2004). The corresponding strain limits are
defined as follows. The steel tensile strain at which the residual crack width would exceed 2
mm is taken to be 0.02 (Su et al., 2017), and the concrete spalling strain is conservatively taken
to be the crushing strain of -0.004.

117
The results of capacity-demand analysis for Bridges T026-S095-C058 and T062-S368-C122
are shown in Figure 5.17 and Figure 5.18, respectively. Selected damage limit states and the
associated performance levels are marked on the capacity curves. Figure 5.17(a) and Figure
5.18(a) show that the lateral displacement is mostly from flexural displacement with little shear
displacement even for the columns studied with aspect ratios below 3. Figure 5.17(a) also
shows that the displacement capacity of Bridge T026-S095-C058 depends on the flexural
ductility, while that of Bridge T062-S368-C122 is limited by the shear capacity well before the
full development of flexural ductility as shown in Figure 5.18(a). The demand curves as shown
in Figure 5.17(b) and Figure 5.18(b) are determined with ag = 0.168g, S = 1.5, TC = 0.25 and
TD = 1.2 for bridges of Importance Class II and Ground Type C in Hong Kong. They show that
the responses of both bridges under the design earthquake are within the elastic stages and they
are likely to remain in full service after the event.
0.00
0.10
0.20
0.30
0.40
0.50
0.60
0.70
0.80
0.90
1.00
0 20 40 60 80 100
Accele
ra
tio
n,
g
Displacement, mm
Acceleration-Displacement Response
Capacity Curve
Full Service
Emergency traffic
Close
Demand Curve
Performance point
(a) Force-Displacement Capacity
(b) Capacity vs. Demand
Figure 5.17 Capacity-demand analysis for Bridge T026-S095-C058

118
0.00
5.00
10.00
15.00
20.00
25.00
0 50 100 150 200
Sh
ear
Forc
e, M
N
Displacement, mm
Total Disp.
Flex. Disp.
Shear Strength
Yielding of Reinforcing Bar
Initial Spalling of Concrete Cover
Attainment of shear strength
Crack Width = 2 mm (or Spalled Region>1/10 cross-section depth,
depending on which attains first)Buckling of Longitudinal Bar (or Fracture of Longitudinal Bar / Fracture
of Transverse Hoop, depending on which attains first)
0.00
0.20
0.40
0.60
0.80
1.00
1.20
1.40
0 20 40 60 80 100
Acc
eler
ati
on
, g
Displacement, mm
Capacity curve
Full Service
Close
Demand Curve
Performance point
(a) Force-Displacement Capacity
(b) Capacity vs. Demand
Figure 5.18 Capacity-demand analysis for Bridge T062-S368-C122
Nonlinear time-history analysis
Although nonlinear time-history analysis is quite time-consuming and computationally
demanding, it is often preferred for seismic assessment of bridges because it can provide insight
into the performance of various bridge components during earthquake including the piers,
bearings and shear keys. The use of nonlinear time-history analysis for assessing existing
bridges is not much different from that for the design of new bridges, except that the existing
bridges may exhibit highly nonlinear behaviour in piers due to impact at movement joints and
that some unique details may also need further attention. Some recommendations are presented
below.
For bridge piers under combined compression and bending, which may exhibit significant
material nonlinearities, the fibre-based approach is normally implemented with concrete
and individual longitudinal bars modelled separately. The confining effect provided by
the transverse reinforcement for core concrete may be ignored for the existing bridge piers
due to potentially inadequate confinement.
Bearings are usually modelled using link elements. Since laminated elastomeric bearings
used to be installed without effective connection to the piers and girder, the relative
frictional sliding between the bearing and the contact surfaces can occur in case of
moderate-to-large earthquakes. For unbonded elastomeric bearings, the bilinear hysteresis
curve as shown in Figure 5.19 is adopted, which is defined by the elastic stiffness and
yield force. The elastic stiffness ke can be calculated by (Choi, 2002):
ke = GA/hr (5.24)

119
where G is the shear modulus of the elastomer, and A and hr are the plan area and thickness
of the elastomeric pad, respectively. The yield force Ff that denotes the frictional force at
the initiation of sliding can be calculated by
Ff = μeN (5.25)
where N is the normal force acting on the bearing, and μe is the coefficient of friction
between the elastomer and the concrete surface, which depends on the contact pressure σm
and may be estimated in terms of the average of compressive stress σm in MPa by (BSI,
2005a)
μe = 0.1+0.9/σm (5.26)
ke
Deformation
Force
Ff=uN
Figure 5.19 Model for the unbonded laminated elastomeric bearing with and
without sliding bearing
At the supports near expansion joints, the elastomeric bearings were often used together
with sliding bearings in order to accommodate large deck movements. The sliding
bearings usually consist of a low-friction polymer, such as PTFE, sliding against a metal
plate. The combined bearing can also be modelled using the bilinear mechanical model
used for elastomeric bearings as shown in Figure 5.19. The coefficient of friction μp used
to determine the yield force for sliding bearings, however, is obtained in a different way
due to the distinct sliding surfaces. According to Annex B of BS EN 1337-2 (BSI, 2005a),
the recommended design coefficients of friction between PTFE and stainless steel is given
in terms of the PTFE contact pressure σp in MPa by
μp=1.2/(10+σp) (5.27)
The steel dowels are simulated as suggested by Vintzeleou and Tassios (1987) using a
multi-linear hysteresis model as shown in Figure 5.20. The characteristic stiffness ki (i =
1, 2, 3 and 4) of the model can be obtained by finite element analysis of a three-
dimensional model of the steel dowel. The values as shown in Figure 5.20 are obtained
for dowel bars of 50 mm diameter and 75 mm clear height.
k1
k2
k3
k4
Deformation
Force
k1=235kN/mm;
k2=11kN/mm;
k3=3.7kN/mm;
k4=-k1;
d1=1.2mm;
d2=7.4mm.
d3=40mm
d1 d2 d3
Figure 5.20 Model for steel dowel
The pounding between the girder and the pier crosshead or the girder and the shear key

120
can be modelled using a compression-only link element. The pounding can be simulated
by the Kelvin model (Jankowski et al., 1998) plus a gap gp to represent the expansion joint
as shown in Figure 5.21. This model consists of a linear spring in conjunction with a
damper element that accounts for energy dissipation during the impact. The relationship
between the impact force Fc and the displacement d can be expressed as
Fc = kk(d-gp) + ckd for d-gp > 0 (5.28)
Fc = 0 for d-gp ≤ 0 (5.29)
where kk is the pounding stiffness of the Kelvin model, which can be taken as the axial
stiffness of the girder; and ck is the damping coefficient. The damping coefficient ck is
related to the coefficient of restitution e by considering the energy losses during the impact
as
ck = 2ξ√kkm1m2
m1+m2 (5.30)
ξ =-lne
√π2+(lne)2 (5.31)
where m1 is the mass of the girder for the span; m2 is the effective mass of the pier, which
is taken to be half of the mass of the pier; ξ is the equivalent viscous damping for energy
dissipation; and the coefficient of restitution e is 0.65 for concrete material (Jankowski et
al., 2000).
Force
kk
DisplacementGap
Figure 5.21 Model for pounding
Example
The assessment of an MSCB bridge of Importance Class II using nonlinear time-history
analysis is shown here. The superstructure is a twin-cell box girder that is continuous over six
spans of 34 m each. The superstructure is supported by Y-shaped piers on bearings. In particular,
fixed bearings are used on the central support and sliding bearings are used on the two end
supports adjacent to expansion joints. Elastomeric bearings are used in conjunction with RC
shear keys in the transverse direction over the rest of the supports. The piers have about the
same height of 10 m.
In this study, SAP2000 is used to perform the nonlinear time-history analysis on the three-
dimensional line beam model of the bridge model as shown in Figure 5.22. The piers are
numbered #1 to #7 from the left end, with Pier #4 connected to the deck through the fixed
bearings. In particular, the superstructure is modelled with elastic beam-column elements since
it is expected to remain in the elastic stage in its inertial response, while nonlinear fibre beam-
column elements are employed over the potential plastic hinge zones in the piers. The
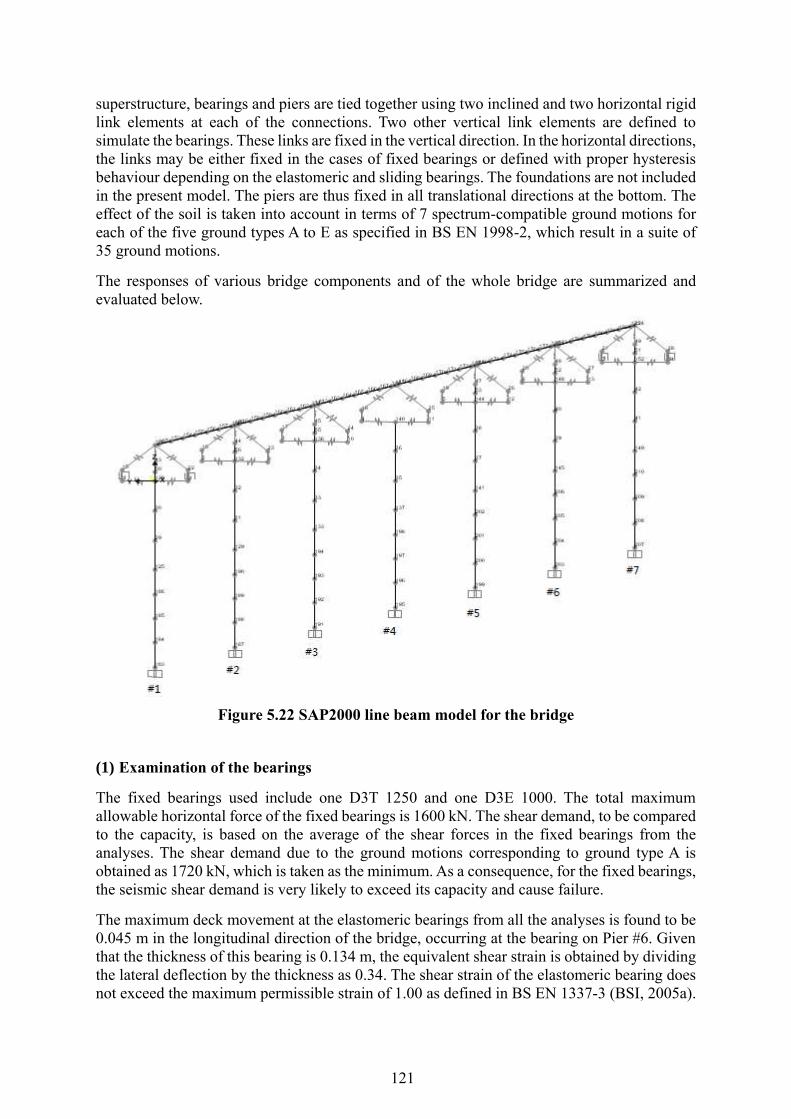
121
superstructure, bearings and piers are tied together using two inclined and two horizontal rigid
link elements at each of the connections. Two other vertical link elements are defined to
simulate the bearings. These links are fixed in the vertical direction. In the horizontal directions,
the links may be either fixed in the cases of fixed bearings or defined with proper hysteresis
behaviour depending on the elastomeric and sliding bearings. The foundations are not included
in the present model. The piers are thus fixed in all translational directions at the bottom. The
effect of the soil is taken into account in terms of 7 spectrum-compatible ground motions for
each of the five ground types A to E as specified in BS EN 1998-2, which result in a suite of
35 ground motions.
The responses of various bridge components and of the whole bridge are summarized and
evaluated below.
Figure 5.22 SAP2000 line beam model for the bridge
(1) Examination of the bearings
The fixed bearings used include one D3T 1250 and one D3E 1000. The total maximum
allowable horizontal force of the fixed bearings is 1600 kN. The shear demand, to be compared
to the capacity, is based on the average of the shear forces in the fixed bearings from the
analyses. The shear demand due to the ground motions corresponding to ground type A is
obtained as 1720 kN, which is taken as the minimum. As a consequence, for the fixed bearings,
the seismic shear demand is very likely to exceed its capacity and cause failure.
The maximum deck movement at the elastomeric bearings from all the analyses is found to be
0.045 m in the longitudinal direction of the bridge, occurring at the bearing on Pier #6. Given
that the thickness of this bearing is 0.134 m, the equivalent shear strain is obtained by dividing
the lateral deflection by the thickness as 0.34. The shear strain of the elastomeric bearing does
not exceed the maximum permissible strain of 1.00 as defined in BS EN 1337-3 (BSI, 2005a).

122
The maximum deck movement at the expansion joint is estimated to be 0.065 m. As the length
of the sliding bearing is 0.5 m, the movement capacity is evaluated as a quarter of the length
as 0.125 m, which is able to accommodate the seismic displacement.
(2) Examination of possible damage of concrete shear key
For the superstructure supported on elastomeric bearings, the restriction of movement in the
transverse direction of the bridge is often achieved by means of RC shear keys against the
girder. The keys are thus subjected to shear forces and bending moments in seismic events. The
average of the shear forces from analyses with ground motions based on ground type D is used
to obtain the probable maximum shear demand on the key. The maximum shear demand is then
found to be 545 kN acting on the key at Pier #5. The shear capacity of the keys is estimated to
be 840 kN. The keys can therefore resist the seismic shear without failure.
(3) Examination of base shear
Owing to the fixed bearings, Pier #4 carries a large portion of the total seismic shear in both
longitudinal and transverse directions of the bridge. The average values of the base shear forces
at Pier #4 from analyses based on ground type D are obtained as 2530 kN in the longitudinal
direction and 2590 kN in the transverse direction. The corresponding shear capacities of Pier
#4 are calculated as 5680 kN and 6610 kN, respectively, in accordance with Clause A.3.3.1 of
BS EN 1998-3 (BSI, 2005c), which are adequate to resist the design seismic base shear forces.
(4) Examination of possible formation of plastic hinges
The flexural response of Pier #4 should also be examined. The most unfavourable stress-strain
response of concrete at the base section of Pier #4 is shown in Figure 5.23, giving the maximum
compressive strain of concrete of about 0.0014, which is below the limiting strain of onset of
concrete crushing as suggested by Kowalsky (2000). Besides, the maximum tensile strain of
steel reinforcing bar is found to be 0.0016, not even attaining the yielding strain of the
reinforcing steel. In other words, the bridge is unlikely to suffer visible damage after the design
events.
Figure 5.23 Most unfavourable stress-strain response of concrete fibre at Pier #4
(5) Summary
In view of the assessment results of various bearings and piers, the bridge will experience shear
failure of fixed bearings when subjected to the design seismic actions specified in SDMHR

123
2013 for highway structures of Importance Class II. This work may be refined by considering
the effects of lap-splice and material deterioration.
Seismic Fragility Analysis
There are a variety of uncertainties associated with the seismic hazard and properties of the
bridge. Thus a probabilistic model is usually more suitable than a deterministic model for
seismic risk assessment of bridges. The seismic fragility curves are emerging tools that have
been adopted for the development of probabilistic assessment of bridges under earthquake
hazards. Fragility curves define the conditional probability, i.e. the likelihood of a structure
being damaged beyond a specific damage level for a given ground motion intensity. It has
become a useful tool for assessing the vulnerability of a class of bridges in terms of the
probability of damage over a range of potential earthquake ground motion intensities. This
characterization can be used to optimize bridge retrofitting programmes and develop pre-
earthquake action plans as proposed by some bridge design codes (FHWA, 2006).
Fragility analysis can be either empirical or analytical. Empirical fragility curves are usually
established by relating the reported and/or observed bridge damage states from past
earthquakes to the recorded ground motion intensities. For example, empirical fragility curves
have been developed for bridges in California following the 1989 Loma Prieta and 1994
Northridge earthquakes (Basoz et al., 1999; Mander and Basöz, 1999) and in Japan following
the 1995 Kobe earthquake (Yamazaki et al., 1999). However, owing to differences in ground
motions and bridge characteristics in different regions, empirical fragility curves developed in
these regions are generally not applicable to bridges elsewhere. In Hong Kong, since data are
lacking for the development of empirical bridge fragility curves, analytical fragility curves are
derived instead. The method for deriving analytical seismic fragility curves are presented
followed by the development of analytical seismic fragility curves for MSSBs and MSCBs in
Hong Kong.
Methodology for fragility analysis
Analytical fragility curves are developed based on the seismic response data from the analyses
of bridges by a fragility function. This function defines the conditional probability of the
seismic demand (D) placed upon the structure exceeding its capacity (C) for a given level of
ground motion intensity (IM) as
Fragility = P [D ≥ C | IM] (5.32)
This evaluation is accomplished by the convolution of the capacity models and the demand
models. Normally, in order to describe the uncertainty of the demand, the seismic demand
models are assumed to follow a lognormal distribution as
P [D ≥ d | IM] = 1-∅ [ln(d) - ln(Sd)
βD|IM
] (5.33)
where ∅(∙) is the standard normal cumulative distribution function, Sd is the median value of
the seismic demand, and βD|IM is the logarithmic standard deviation of the demand conditioned
on the IM.
The capacity of the bridge is defined in terms of limit state capacities for various damage states
of the bridge component. Similar to the demand models, the capacity models are also described
by a two-parameter lognormal distribution with median value Sc and logarithmic standard
deviation βc.
Having described the demand and capacity models, the component fragility as expressed in
Equation (5.32) can be computed with a closed-form solution in lognormal form as

124
Fragility = ∅ [ln(
SdSc)
√βD|IM2
+βc
2
] (5.34)
This closed-form solution results in fragility curves for component-level failure probabilities.
The fragility of the full bridge system can then be assessed. A common assumption is that a
bridge damage state is reached if any of the components exhibits the associated level of damage.
Assuming that all the components are statistically independent (Choi et al., 2004), it is
appropriate to take the upper bound estimate of the system fragility as a conservative estimate
on the overall bridge fragility, giving the joint probability of failure of the entire system P(Fsys)
as
P(Fsys)=1-∏ [1 - P(Fi)]mi=1 (5.35)
where P(Fi) is the probability of failure of the i-th component.
The development of seismic fragility curves for some typical existing highway bridges in Hong
Kong is introduced. The procedures adopted are described as follows:
Classify typical highway bridges in Hong Kong based on the structural types and other
details critical to seismic performance.
Establish appropriate bridge samples representative of their respective bridge classes,
considering geometric uncertainties and material uncertainties.
Generate a suite of earthquake inputs, which cover various levels of ground shaking
intensity in terms of the peak ground acceleration (PGA).
Randomly pair the earthquake inputs with the bridge samples to establish a set of bridge-
motion pairs for each bridge class.
Establish a nonlinear finite element model of bridge and perform time-history analysis for
each of the bridge-motion pairs to obtain the maximum demand placed on various
components.
Perform a regression analysis on the simulated response data to determine the probabilistic
characteristics of structural demand as a function of the PGA.
Define component damage states based on repair-related decision and establish the
probabilistic characteristics of structural capacity corresponding to each damage state.
Compute the conditional probabilities that the structural demand exceeds the structural
capacity for various levels of ground shaking and plot the component-level fragility curves
as a function of the PGA.
Determine the bridge fragility curves based on the component-level vulnerability.
Seismic fragility analysis of existing bridges in Hong Kong
(1) Bridge classifications
The success of fragility analysis depends largely on the effectiveness of bridge classification
based on a limited number of parameters that can provide a reliable description of the bridge
characteristics within each portfolio or class. Two prevalent classes of bridges in Hong Kong,
i.e. the MSSB and MSCB bridges depending on the continuity of superstructures as depicted
in Figure 5.1, are studied for their fragilities. Besides, the variations in significant geometric
characteristics should be accounted for, including the number of U-beams and the bent type for
the MSSBs, and the principal structural girder-pier connection type and the number of spans
for the MSCBs. To this end, ten basic bridge samples with representative geometric

125
configurations are prescribed for each of the two bridge classes as presented in Table 5.8.
Table 5.8 Representative bridge geometry
MSSB Sample # 1 2 3 4 5 6 7 8 9 10
Nos. of U-beams 4 4 6 6 9 9 11 11 13 13
Elastomer dimensions (longi.
mm × trans. mm × hr mm) 355 × 610 × 60
Bent type Single-column bent Two-column bent
Column spacing (m) - - - - 8.2 8.2 12.2 12.2 16 16
Column sectional dimensions (W
m × D m)
2.0×
1.5
2.5×
1.5
2.5×
1.5
3.0×
1.8
2.5×
1.5
3.0×
1.8
2.5×
1.5
3.0×
1.8
2.5×
1.5
3.0×
1.8
MSCB Sample # 1 2 3 4 5 6 7 8 9 10
Connection type Fixed bearing (Tetron D3T 1250) Monolithic
Elastomer dimensions (longi.
mm × trans. mm × hr mm) 550 × 600 × 75
No. of spans 4 4 4 5 5 4 4 4 5 5
Column sectional dimensions (W
m × D m)
2.0×
1.5
2.5×
1.5
3.0×
1.8
2.5×
1.5
3.0×
1.8
2.0×
1.5
2.5×
1.5
3.0×
1.8
2.5×
1.5
3.0×
1.8
(2) Generation of bridge samples
The uncertainty of bridge geometry, material properties and other random variables affecting
the seismic response is further explored. Since a large number of random variables may be
considered in the fragility assessment of bridge classes, past studies have indicated that some
parameters are less significant than the others and may be neglected (Pang et al., 2013; Tavares
et al., 2012). Table 5.9 shows the significant parameters considered in this study and their
associated distribution parameters. The upper and lower levels for each of these parameters are
also selected such that they encompass only the reasonable values for the parameter.

126
Table 5.9 Significant parameters considered in the fragility analysis
Parameter Probability
Distribution Mean Deviation
Lower
level
Upper
level Unit
MSSB
1. Elastomeric bearing stiffness Uniform a 100 50 50 150 %
2. Fixed bearing stiffness Uniform a 100 50 50 150 %
3. Dowel strength Normal a 100 20 80 120 %
4. Deck mass Uniform a 100 10 90 110 %
5. Damping ratio Normal a 0.05 0.03 0.02 0.08 -
6. Gap between beam end and cross-head Normal c 30 6 24 36 mm
7. Pier height (H1) Uniform c 10.5 3.5 7 14 m
8. Pier height difference (H1-H2) Uniform c 1 1 0 2 m
9. Longitudinal steel ratio Uniform c 0.0225 0.0075 0.015 0.03 -
MSCB
1. Sliding bearing coefficient Uniform b 0.05 0.03 0.02 0.08 -
2. Elastomeric bearing stiffness Uniform a 100 50 50 150 %
3. Deck mass Uniform a 100 10 90 110 %
4. Damping ratio Normal a 0.05 0.03 0.02 0.08 -
5. Span length Normal c 35 5 30 40 m
6. Gap between shear key and girder Normal c 15 15 0 30 mm
7. Pier height (H1) Uniform c 10.5 3.5 7 14 m
8. Pier height difference (H1-H2) Uniform c 1 1 0 2 m
9. Longitudinal steel ratio Uniform c 0.0225 0.0075 0.015 0.03 - a Nielson and DesRoches (2007) b Dolce et al. (2005) c Adapted from Nielson and DesRoches (2007) to suit local situations
For each of the geometry samples as listed in Table 5.8, the uniform design method (Fang et
al., 2000) is used to generate 30 statistically different and nominally identical bridge samples
by sampling on the significant variables as shown in Table 5.9. Thus, 300 bridge samples are
generated for each of the bridge classes. Later each of the resulting bridge samples is paired
with a ground motion for use in the probabilistic seismic demand analysis.
(3) Limit state capacity estimates
Fragility analysis requires the knowledge of capacities of various bridge components. These
capacities are defined in terms of limit state capacities for selected damage states of the bridge
components. The damage states may be repair-related decisions. The selected damage states
here are qualitatively described as slight, moderate, extensive and complete damage. The
descriptions of these damage states are broadly defined as follows (Ramanathan, 2012):
Slight damage: aesthetic damage of the component occurs, where the associated repair is
primarily aimed at restoring the aesthetics.
Moderate damage: significant repairs are required to restore component functionality.
Extensive damage: extensive repairs are required to restore component functionality.
Complete damage: component replacement is likely to be the most cost-effective means
to restore component functionality.
The component limit states at each damage state are selected in an effort to maintain
consistency across various bridge components, i.e. reaching a particular damage state for one
component should have a similar impact on the functional performance of the entire bridge
system as reaching the damage state for another component. Estimates of limit state capacities
of the existing bridges are quantitatively presented in Table 5.10, in which the individual limit

127
state capacities are characterized by a two-parameter lognormal distribution with the median
Sc and dispersion βc.
The damage states for columns are quantified by the curvature ductility and those described in
Table 5.10 are based on tests on columns (Ramanathan, 2012) similar to those found in the
existing bridges. Such definitions have taken into account large spacing of transverse
reinforcement and lap-splices at the base of columns that are usually found in non-seismically
designed columns.
The damage states for the expansion bearings, i.e. elastomeric bearings with or without sliding
bearings on top, are associated with deformation. The deformation may be combinations of
shear deformation of elastomer and sliding at unrestrained interfaces. The nominal bearing
limit of deformation reaching 100% of the thickness of the elastomer (BSI, 2005a) is defined
as the slight damage limit state. With further increase in the deformation, frictional sliding starts
to occur at these bearings. Large relative displacement can cause problems of instability and
unseating, and elastomeric bearings incorporating a layer of PTFE are also likely to suffer
PTFE damage due to knife-edge contact of the sole plate trailing edge on the PTFE (Steelman
et al., 2015). Experiments have shown that sliding bearings can tolerate deformation up to
approximately the size of the bearing prior to unseating, i.e. elastomer plan size in the direction
of horizontal motion (Steelman et al., 2015). This is adopted to define the limit state for
complete damage of the expansion bearing. The limit state deformations for moderate and
extensive damage are defined by intermediate values before the unseating deformation as 25%
and 50% of the elastomer plan size, respectively.
The damage states for the fixed elastomeric bearings are based on the numerical simulation
results of the steel dowel as shown in Figure 5.20. At a deformation of 7.4 mm, material
nonlinearity develops throughout the dowel bar section, which is defined as slight damage. A
deformation of 23 mm results in 100% shear strain in the elastomer and also large permanent
deformation in the dowel bar. Thus, this is taken as the moderate damage state. At a deformation
of 40 mm, dowel fracture would occur. Replacement of new steel retention dowels is likely
required in addition to deck realignment, implying an extensive damage state. After the fracture
of the steel dowels, the elastomeric bearings have the same unseating problem as do the
expansion bearings and it thus warrants a deformation limit for the complete damage state to
be the elastomer plan size in the direction of horizontal motion.
The damage states for the fixed pot bearing are based on the design shear capacity. For the
Tetron D3T 1250 fixed pot bearing, the damage state ranges from a horizontal load of 900 kN
for slight damage to a horizontal load of 1500 kN for complete damage as provided by the
manufacturer. The horizontal load capacity of 990 kN at serviceability limit state is defined as
moderate damage. A horizontal load of 1200 kN is adopted for extensive damage.
Table 5.10 summarizes the limit state capacities of various bridge components adopted for the
existing bridges. The uncertainty associated with component capacities at each of these limit
states is characterized by a dispersion value of 0.35 across the components and damage states
(Ramanathan, 2012). This value is a particularly good estimate for columns (Berry et al., 2004).

128
Table 5.10 Definition of damage states for bridge components
Component
Slight
damage
Moderate
damage
Extensive
damage
Complete
damage
Sc βc Sc βc Sc βc Sc βc
MSSB
Fixed elastomeric bearing,
longitudinal (mm) 7.4 0.35 23 0.35 40 0.35 355 0.35
Fixed elastomeric bearing,
transverse (mm) 7.4 0.35 23 0.35 40 0.35 610 0.35
Expansion bearing, longitudinal (mm) 60 0.35 90 0.35 180 0.35 355 0.35
Expansion bearing, transverse (mm) 60 0.35 150 0.35 305 0.35 610 0.35
Column (-) 1 0.35 2 0.35 3.5 0.35 5 0.35
MSCB
Fixed pot bearing (kN) 900 0.35 990 0.35 1200 0.35 1500 0.35
Expansion bearing, longitudinal (mm) 75 0.35 137 0.35 275 0.35 550 0.35
Expansion bearing, transverse (mm) 75 0.35 150 0.35 300 0.35 600 0.35
Column (-) 1 0.35 2 0.35 3.5 0.35 5 0.35
(4) Earthquake inputs
Since there are very few strong ground motion records in Hong Kong available, the Next
Generation Attenuation (NGA) database developed by the Pacific Earthquake Engineering
Research Center (PEER) (PEER, n.d.) is employed. A suite of 300 ground motion records is
selected.
According to the “Final Supplementary Report on the Study for Seismic Actions” (Atkins,
2013), the selected ranges of moment magnitude Mw and epicentral distance are decided to be
5.0 – 8.0 and 10 – 100 km, respectively. Besides, the shear velocity for ground vs,30 is taken to
be about 180 m/s, covering rock to medium dense soil sites based on ground classifications as
prescribed in BS EN 1998-1, which is also typical in Hong Kong. Each of the selected ground
motions is scaled so that its spectral acceleration matches the design spectral acceleration at a
given period (Baker et al., 2011). This specific period is normally the fundamental period of
the structure. Owing to random coupling of ground motions and bridge samples in fragility
analysis, the specific period is taken to be 0.5 s after several trials. Figure 5.24 shows that the
median response spectra of the selected accelerograms generally agree well with the design
response spectra derived in accordance with SDMHR 2013 for the ground types considered at
periods above 0.1 s, where the fundamental periods of bridges are most likely to concentrate.
Since the selected accelerograms have the magnitudes and source distances consistent with
records in Hong Kong and generally good agreement is achieved between the median response
spectra and the design response spectra, it is justified to use the selected ground motions for
fragility analysis in Hong Kong.

129
0.01 0.1 1 51E-3
0.01
0.1
1
10
Sa(
g)
Respnse spectra of
selected ground motions
Median response spectrum
Design response spectrum
T(s) 0.01 0.1 1 5
1E-3
0.01
0.1
1
10
Sa(
g)
Response spectra of
selected ground motions
Median response spectrum
Design response spectrum
T(s)
0.01 0.1 1 51E-3
0.01
0.1
1
10
Sa(
g)
Response spectra of
selected ground motions
Median response spectrum
Design response spectram
T(s)
(a) Ground Type A (b) Ground Type B (c) Ground Type C
Figure 5.24 Comparison of response spectra of selected ground motions and the design
response spectra (BS EN 1998-2 Type 2 spectra with a return period of 475 years)
(5) Analytical modelling
The 300 bridge samples for each bridge class are then randomly paired with the 300 ground
motions to create 300 bridge-motion pairs for each bridge class. A full nonlinear time-history
analysis is performed for each bridge-motion pair in the longitudinal and transverse directions
separately, and the maximum demand placed on each component is then recorded. In total,
1200 nonlinear time-history analyses are performed for the bridge samples in the two bridge
classes considered. The bridges consist of components that may exhibit highly nonlinear
behaviour, such as the elastomeric bearings, columns, and the impact between the neighbouring
girders and/or the girder and the crosshead. These nonlinearities are incorporated into three-
dimensional nonlinear analytical models of the bridge samples as discussed in Section 5.2.4.
These models are developed using the OpenSees platform (Mazzoni et al., 2006).
(6) Probabilistic seismic demand models
Probabilistic seismic demand models (PSDMs) are constructed through regression analysis on
the computed peak responses of the critical bridge components of the 300 bridge samples for
each bridge class. The component responses of concern include the curvature ductility of
columns µφ, deformation of expansion bearings dex, deformation of fixed elastomeric bearings
dfx, and shear force of fixed pot bearings Fp.
The relationship between the peak component response and the ground motion intensity can be
estimated in the form of a power law as (Cornell et al., 2002)
Sd = a(IM)b (5.36)
which can be rewritten in logarithmic form as
ln(Sd) = bln(IM) + ln(a) (5.37)
where a and b are unknown coefficients determined from linear regression in the log space.

130
The intensity measure adopted for demand modelling in this study is the PGA since it is
identified as an appropriate intensity measure for girder bridges (Padgett et al., 2008). In
addition to the median value, the uncertainty of the demand model is characterized by a
lognormal distribution in which the conditional logarithmic standard deviation is estimated as
an average across all PGAs as
βD|PGA
=√∑ (lndi - lnSd)
2Ni=1
N - 2 (5.38)
where N is the number of simulations, and di is the peak response of the component of interests
from the i-th simulation.
Figure 5.25 and Figure 5.26 show the results of the probabilistic seismic demand analysis for
components for the bridge classes MSSB and MSCB, respectively. The component PSDMs for
the two bridge classes are summarized in Table 5.11.
-6 -5 -4 -3 -2 -1 0 1
-4
-2
0
2
4 ln(dfx)=1.024ln(PGA)+2.688
ln(d
fx)
of
elas
tom
eric
fix
ed b
eari
ng
ln(PGA) -5 -4 -3 -2 -1 0 1
-1
0
1
2
3
4
ln(dex)=0.835ln(PGA)+3.04
ln(d
ex)
of
expan
sion b
eari
ng
ln(PGA) -5 -4 -3 -2 -1 0 1
-6
-4
-2
0 ln()=1.146ln(PGA)-1.171
ln()
of
pie
r co
lum
nln(PGA)
(a) Longitudinal direction
-6 -5 -4 -3 -2 -1 0 1
-4
-2
0
2
4 ln(dfx)=1.104ln(PGA)+2.634
ln(d
fx)
of
elas
tom
eric
fix
ed b
eari
ng
ln(PGA) -5 -4 -3 -2 -1 0 1
-4
-2
0
2
4
6
ln(dex)=1.065ln(PGA)+3.563
ln(d
ex)
of
expan
sion b
eari
ng
ln(PGA) -5 -4 -3 -2 -1 0 1
-6
-4
-2
0 ln()=1.033ln(PGA)-1.050
ln()
of
pie
r co
lum
n
ln(PGA) (b) Transverse direction
Figure 5.25 Regression analysis of seismic demands on the bridge components of MSSB
-5 -4 -3 -2 -1 0 10
2
4
6
8
10
ln(Fp)=0.691ln(PGA)+7.095
ln(F
p)
of
pot
fixed
bea
ring
ln(PGA) -5 -4 -3 -2 -1 0 1
0
2
4ln(dex)=0.733ln(PGA)+3.117
ln(d
ex)
of
expan
sion b
eari
ng
ln(PGA) -5 -4 -3 -2 -1 0 1
-6
-4
-2
0
2
ln()=0.954ln(PGA)-0.803
ln()
of
pie
r co
lum
n
ln(PGA) (a) Longitudinal direction

131
-5 -4 -3 -2 -1 0 10
2
4
6
8 ln(Fp)=1.067ln(PGA)+6.860
ln(F
p)
of
pot
fixed
bea
ring
ln(PGA) -5 -4 -3 -2 -1 0 1
-4
-2
0
2
4
6
ln(dex)=0.725ln(PGA)+2.150
ln(d
ex)
of
expan
sion b
eari
ng
ln(PGA) -5 -4 -3 -2 -1 0 1
-8
-6
-4
-2
0
2
ln()=1.253ln(PGA)-0.683
ln()
of
pie
r co
lum
n
ln(PGA) (b) Transverse direction
Figure 5.26 Regression analysis of seismic demands on the bridge components of MSCB

132
Table 5.11 Estimates of probabilistic seismic demand models
Component Longitudinal direction Transverse direction
b ln(a) βD|PGA b ln(a) βD|PGA
MSSB
Fixed elastomeric bearing (dfx) 1.024 2.688 1.011 1.104 2.634 1.009
Expansion bearing (dex) 0.835 3.044 0.700 1.065 3.563 0.949
Column (µφ) 1.146 -1.171 0.886 1.033 -1.050 0.837
MSCB
Fixed pot bearing (FP, kN) 0.691 7.095 0.709 1.067 6.860 0.801
Expansion bearing (dex) 0.733 3.117 0.633 0.725 2.150 0.892
Column (µφ) 0.955 -0.803 0.868 1.253 -0.683 0.938
(7) Component fragility curves
The seismic fragility or probability of exceeding a limit state given a PGA is assessed for the
four damage states. The probability that the demand on the component will exceed its capacity
as expressed by Equation (5.34) can be rewritten by substitution of regression parameters for
the demand median as
P(LS|PGA) = ∅ [ln (PGA) - ln(λ)
ξ] (5.39)
where λ and ξ are the median and dispersion, respectively, of the specific limit state, which are
given, respectively, by
λ = eln(Sc) - ln(a)
b (5.40)
ξ = √βD/PGA
2 + βc2
b (5.41)
This closed-form analysis results in fragility curves for component-level failure probabilities,
which are useful in comparing the relative vulnerability of bridge components within a given
class. Figure 5.27 and Figure 5.28 show the component fragility curves for the typical existing
MSSB and MSCB bridges at the four damage states, respectively. For the MSSB bridges, the
elastomeric fixed bearings are the most vulnerable components at all damage states, including
the slight, moderate and extensive damage states, indicating the highest probability of the limit
states being exceeded, while the expansion bearings and columns have much lower fragilities.
The steel dowels of the fixed bearings have acted as “fuse elements” which are destroyed in
the first place, preventing the elastomeric bearings and the substructure from serious damage.
For the MSCB bridges, the fixed pot bearings are the most fragile components at all the damage
states, followed by the columns and expansion bearings. The fixed pot bearings have significant
vulnerability especially in the longitudinal direction. This should be expected as the fixed pot
bearings are designed for the main restriction of deck movement and there is thus considerable
demand imposed on the bearings, although their failure helps mitigate the force transmitted to
the columns thereby resulting in less fragile columns. Overall, the fixed bearings tend to be the
controlling fragile components at all damage states for both the existing MSSB and MSCB
bridges in Hong Kong.
It is normal to have distinct seismic fragilities for various components of the bridge since they
have been designed for multiple load cases and they may thus have diverse redundancies in
terms of seismic capacity. Besides, the earthquake-resisting members designed for potential
inelastic behaviour will incur damage more easily and are therefore more fragile than those
capacity-protected members. It is also desirable to tune the fragility of components in seismic
bridge design by assigning sacrificial elements. Forces that can be transmitted to critical

133
structural components can be limited by using yielding elements as “fuses”. If, for example, a
column is more fragile and intended to yield by forming plastic hinges, the maximum moment
that can be transmitted from the column to the foundation is limited by the yield moments of
the hinges. The preferable ductile members should be those that can be easily inspected and
repaired following an earthquake and are usually columns, pier walls, seismic isolation and
damping devices, bearings, and shear keys. It is advisable to design a bridge system with
hierarchical fragility of components based on the complexity and cost of repair or replacement
of the components.
Bridge
Fixed elastomeric bearing
Expansion bearing
Column
0.0 0.6 1.2 1.8 2.4 3.00.0
0.2
0.4
0.6
0.8
1.0
Transv.
Long.
×
P [
Sli
ght|P
GA
]
PGA(g)
Bridge
Fixed elastomeric bearing
Expansion bearing
Column
0.0 0.6 1.2 1.8 2.4 3.00.0
0.2
0.4
0.6
0.8
1.0
Transv.
Long.
×
P [
Moder
ate|
PG
A]
PGA(g) (a) Slight damage (b) Moderate damage
Bridge
Fixed elastomeric bearing
Expansion bearing
Column
0.0 0.6 1.2 1.8 2.4 3.00.0
0.2
0.4
0.6
0.8
1.0
Transv.
Long.
×
P [
Exte
nsi
ve|
PG
A]
PGA(g)
Bridge
Fixed elastomeric bearing
Expansion bearing
Column
0.0 0.6 1.2 1.8 2.4 3.00.0
0.2
0.4
0.6
0.8
1.0
Transv.
Long.
×
P [
Com
ple
te|P
GA
]
PGA(g) (c) Extensive damage (d) Complete damage
Figure 5.27 Component fragility curves for the existing MSSB

134
Bridge
Fixed pot bearing
Expansion bearing
Column
0.0 0.6 1.2 1.8 2.4 3.00.0
0.2
0.4
0.6
0.8
1.0
Transv.
Long.
×P
[S
light|P
GA
]
PGA(g)
Bridge
Fixed pot bearing
Expansion bearing
Column
0.0 0.6 1.2 1.8 2.4 3.00.0
0.2
0.4
0.6
0.8
1.0
Transv.
Long.
×
P [
Mo
der
ate|
PG
A]
PGA(g)
(a) Slight damage (b) Moderate damage
Bridge
Fixed pot bearing
Expansion bearing
Column
0.0 0.6 1.2 1.8 2.4 3.00.0
0.2
0.4
0.6
0.8
1.0
Transv.
Long.
×
P [
Exte
nsi
ve|
PG
A]
PGA(g)
Bridge
Fixed pot bearing
Expansion bearing
Column
0.0 0.6 1.2 1.8 2.4 3.00.0
0.2
0.4
0.6
0.8
1.0
Transv.
Long.
×P
[C
om
ple
te|P
GA
]
PGA(g) (c) Extensive damage (d) Complete damage
Figure 5.28 Component fragility curves for the exiting MSCB
(8) System fragility curves
To enable comparison of the relative vulnerability of various bridge types, it is essential that
the overall bridge fragility be determined. A common approximation method is adopted for the
system-level failure analysis, where a bridge damage state is reached if any component exhibits
the associated level of damage. As presented in Equation (5.35), the probability that the bridge
is at or beyond a particular limit state is therefore the union of the probabilities of each of the
components exceeding the same limit state.
The system fragility curves for the existing MSSB and MSCB bridges are also shown in Figure
5.27 and Figure 5.28, respectively. In general, the bridge as a system is more fragile than any
of its components. This is a consequence of the underlying series assumption that has been
used in formulating these curves. Nevertheless, the transverse fixed bearing response tends to
dominate the system fragility in the case of the MSSB, while it is the longitudinal fixed bearing
response in the case of the MSCB. For the reference design ground acceleration of 0.12g
according to SDMHR 2013, the probabilities of exceeding the four damage states for the bridge
system for the two bridge classes are tabulated in Table 5.12. The median values of fragility
curves for the two bridge classes across the four limit states are also summarized in Table 5.12.
These bridges generally show negligible fragility for a PGA of 0.12g even at the slight damage
limit state. As the ground motion intensity increases, however, the MSCB tends to have a higher
fragility than the MSSB. This finding is consistent with those of past studies in other regions,
owing to the larger inertial loads from continuous decks which tends to increase demands

135
placed on the key bridge components.
Table 5.12 Bridge system fragility curves for existing bridges
Existing
bridges
Median (unit: g) P(LS|0.12g) (unit: %)
Slight Moderate Extensive Complete Slight Moderate Extensive Complete
MSSB 0.66 1.55 2.60 8.75 8.27 0.72 0.15 0.00
MSCB 0.51 0.75 0.99 1.37 2.09 1.25 0.49 0.14
(9) Summary
This section presents the analytical development of fragility curves for two bridge classes
commonly found in Hong Kong. Each bridge class was represented by a suite of 300 three-
dimensional analytical models subjected to a suite of bi-directional ground motion time-
histories for Hong Kong. The resulting probabilistic seismic demand analysis considered the
major components including the columns and bearings in assessing the seismic vulnerability.
Both component-level demands and capacities were described using lognormal distributions.
Fragility curves were derived for the components and the typical Hong Kong bridge systems
for slight, moderate, extensive and complete damage limit states defined based on repair-related
decisions. The results show that the fixed elastomeric bearings and fixed pot bearings govern
the fragility for the typical simply supported and continuous concrete girder bridges,
respectively. Representing a bridge system simply by its columns as commonly adopted in the
single-degree-of-freedom system approximation is thus likely to underestimate the
vulnerability of the bridge. Nevertheless, the fragility curves show that the typical existing
bridges in Hong Kong have negligible fragility for ground motions with a peak ground
acceleration of 0.12g. In cases of greater ground motion intensities, the continuous bridges are
more vulnerable than the simply supported bridges, which is consistent with findings in other
regions. These curves can be improved if more knowledge of the responses of various bridge
components of the real bridges is acquired and additional laboratory testing of similar
components as well as input from stakeholders regarding the component capacity limit state
estimates are available.

136
RECENT TREND OF BRIDGE ENGINEERING
Bridge engineering has undergone significant developments towards advanced performance
and improved buildability and maintainability during the past decade. This chapter presents a
state-of-the-art review of emerging bridge engineering practices particularly in three aspects:
material, construction and structural system. Special focus has been placed on the strategies
and/or impact that are brought about by these new trends on seismic bridge design and
retrofitting.
Construction Materials
High-strength concrete
High-strength concrete (HSC) refers to concrete with a characteristic compressive strength over
60 MPa. Owing to its high strength, HSC is supposed to significantly reduce the size of
component for the same load-carrying capacity and thus reduce the self-weight. As a result,
HSC is preferred in tall buildings and bridges with tall piers.
It is necessary to provide not only sufficient strength, but also a minimum level of flexural
ductility for steel reinforced concrete (RC) columns in seismic design. For a particular material,
very often the ductility decreases when the strength increases. Concrete, of course, is no
exception. Figure 6.1 shows the design compressive stress-strain relations for concrete as
defined in SDMHR 2013. The figure shows that with the rise of concrete grade, the strain upon
reaching the design strength rises sharply while the ultimate strain decreases for concrete
grades beyond C60, indicating less ductility for HSC compared with normal-strength concrete.
Figure 6.1 Design compressive stress-strain relations for concrete based on SDMHR
2013
In order to explore the flexural ductility of HSC columns, a theoretical study of their full-range
flexural behaviour has been carried out based on symmetrical RC columns cast of normal- and
high-strength concrete (Bai and Au, 2009). The results indicate that confinement can help HSC
column sustain the residual moment up to a much greater curvature at the post-peak stage.
Hence, if HSC is used in RC piers, sufficient confining reinforcement should be provided for
proper ductility design.
More recently, HSC is often utilised instead of normal concrete in the increasingly popular
composite bridge with prestressed concrete flanges and corrugated steel webs as shown in
0
5
10
15
20
25
30
35
40
0.0 0.5 1.0 1.5 2.0 2.5 3.0 3.5
Str
ess
(MP
a)
Strain (‰)
C30C40C50C60C70C80C85

137
Figure 6.2. The idea is that the prestressed concrete flanges together mainly carry bending
moments, while the corrugated steel webs resist shear without the need for excessive stiffeners.
Owing to the “accordion effect” associated with the flexible corrugated steel webs (Jiang et al.,
2014), the efficiency of prestressing is much improved. The relative lightness of this type of
superstructures will incur less seismic actions during earthquake.
Figure 6.2 Illustration of composite bridge with corrugated steel webs
High-performance concrete
High-performance concrete (HPC) is a relatively new class of concrete, featuring excellent
durability, dimensional stability and workability in addition to the high compressive strength.
Today, HPC has been widely used in bridges, especially in sea bridges which have stricter
requirements for durability. Examples include Confederation Bridge in Canada (Dunaszegi,
2005) and the newly built Hong Kong - Zhuhai - Macao Bridge in South China (Zhao and Li,
2015).
In the event of seismic design situation, ordinary HPC also suffers from low ductility. As an
alternative to the common practice of relying on confining steel reinforcement, some special
types of HPC with high ductility have been developed.
Engineered Cementitious Composite (ECC), also called “bendable concrete”, is a kind of
concrete with a matrix reinforced by selected short fibres such as polymeric fibres. As opposed
to materials based on ordinary Portland cement with inherent brittle nature, ECC exhibits
metal-like tensile strain-hardening property with ultimate tensile strain capacity in excess of 4%
(Li, 2003). ECC is most suitable for shear-vulnerable elements (Li, 2003) such as short columns,
beam-column joints, in-filled walls, etc., making ECC a very promising construction material
for seismic regions. As an alternative to traditional movement joints, ECC has been used in the
link slab for jointless bridges (Lepech and Li, 2009). The successful implementation of this
strategy also relies on the ample tensile strain capacity of ECC to accommodate the long-term
and thermal deformation.
Ultra-high-performance concrete (UHPC) is an upgrade of HPC mixed with steel fibres. It
differs from the normal- or even high-strength concrete in compression by its strain hardening
behaviour before failure. In addition, it possesses as good tensile resistance and tensile ductility
as ECC. Like ECC, UHPC is very damage tolerant and capable of absorbing energy, and thus
it is favourable in seismic regions.
Accelerated Bridge Construction
In parallel with the economic developments in many countries, the volume of traffic has
increased so much that the majority of bridges, especially those in urban areas, are now carrying
Concrete upper flange
Corrugated steel web
Concrete bottom flangePrestressed cables
Tendons

138
more vehicles and higher loading than they have been designed for. This has placed an
increasing demand for upgrading their capacities. In addition, many of them are close to their
design lives and the ageing problems are matters of concern. Tremendous resources are needed
for repairs, rehabilitation and replacement of existing bridges. However, the biggest challenge
for construction activities in congested urban areas like Hong Kong is to minimise the impact
on the motorists and neighbourhood due to lane closures, reduced speed zones, noise and air
pollution. It is apparent that shortening the construction time is a key factor in improving the
buildability of bridges. A relatively new idea for bridge construction, namely Accelerated
Bridge Construction (ABC), might be an option. The core of ABC is to save as much as possible
the on-site construction time needed when building new bridges or replacing and rehabilitating
existing bridges, through the use of innovative planning, design, materials and construction
methods in a safe and cost-effective manner (Culmo, 2011).
Prefabrication
Prefabrication is an important method for ABC. A major advantage of prefabrication is that it
can reduce the on-site construction time, resulting in reduction of lane closures and traffic
detours. Prefabrication can also improve the quality of bridge elements and systems since they
are constructed in a controlled environment using high quality materials and standardized
production processes. Although there can be a cost premium for using prefabrication during
construction, improved quality leads to an extension of service life and reduction in life-cycle
costs. Other benefits that can justify the additional costs of prefabrication include improved
safety. By reducing the amount of construction that takes place on site, the duration over which
construction workers and passers-by are exposed to hazards on construction site is also reduced.
With more extensive use of prefabrication, contractors and fabricators will become more
proficient in the techniques, thereby boosting the efficiency and economy of prefabrication.
Indeed, the past few decades have witnessed the rising trend in adoption of prefabrication in
bridge building.
Prefabrication is actually not a new concept. The vast majority of existing bridges today have
employed some degree of prefabrication. Steel girders and pretensioned concrete beams are
some of the most common prefabricated elements in typical bridges. The techniques of
prefabrication of steel bridges are well established and documented (Hayward et al., 2002), but
continuous efforts have been spent on prefabrication of concrete bridges for many decades.
Precast concrete deck panels have been used for many years. The use of precast segmental
construction of box girder bridges in conjunction with post-tensioning has now spread
throughout the world since its first appearance in 1960s in France and has made substantial
contribution to the continual evolution of prestressed concrete bridge construction. Precast
concrete segmental bridge decks have been most commonly used in recent decades for
accelerated bridge construction projects due to several distinct advantages. First and foremost,
as concrete is the most common material for construction of bridge decks but the conventional
cast-in-place (CIP) construction of concrete bridge decks can be very time consuming because
of the significant amount of formwork and falsework, prefabrication can minimise or eliminate
the need for on-site concreting. Other common prefabricated elements include pier caps.
Precast pier caps have been used due to the difficulties of casting large concrete components at
relatively high positions over land or water.
The application of ABC to the substructure like precast segmental columns used to be limited.
Unlike superstructures, columns are often the most heavily loaded elements during a seismic
event. The presence of weak connection between prefabricated elements may affect the seismic
resistance of major resisting component, especially in regions with moderate-to-high seismicity.
To address this problem, several connection details have been proposed for the application of

139
ABC to the substructures.
The high demand region in a typical column is at the ends where the column connects to the
footings and pier caps. One method to connect the precast columns to adjoining members is
through the use of mechanical rebar splices commonly referred to as couplers. The ability of
couplers to splice rebars between precast elements to simulate CIP construction (Saito and
Terada, 2016) has made them a popular choice for bridge designers. The most common type of
rebar coupler for bridge column construction is the grouted sleeve coupler shown in Figure 6.3
(Pantelides et al., 2017) with wide application according to the Federal Highway
Administration (FHWA) in USA (FHWA, 2009). The cast steel sleeve is cast into the end of
one element and a protruding reinforcing bar is cast in the end of the adjacent element. The
elements are connected by inserting the protruding bars from one element into the hollow ends
of couplers in the other element. The joint between the pieces is then grouted, and grout is
pumped into the couplers to make the connection. The grouted sleeve coupler gains more
popularity than other types of couplers, such as threaded and headed couplers, because it does
not require as tight construction tolerances and is less time consuming to connect. Research
has shown that grouted couplers are able to develop the full rebar strengths with much shorter
spliced lengths than the conventional development lengths (Hayshi et al., 1994; Saito and
Terada, 2016), which makes this connection especially desirable for substructure connections
with large diameter bars. The use of grouted couplers is currently limited to low-to-moderate
seismic areas and not recommended for high seismic areas that require plastic hinging of
connections (AASHTO, 2011). There is concern that the grouted sleeve couplers are not
capable of developing plastic hinges in these high demand connections. However, recent
research has shown that the grouted sleeve couplers with proper detailing can be emulative of
CIP column-to-footing connections in terms of displacement capacity of columns in moderate-
to-high seismic zones (Tazarv and Saiidi, 2014). The researchers thus suggest the removal of
the restrictions imposed on grouted rebar couplers by AASHTO in seismic zones. The Texas
Department of Transportation, USA has built connections that employ standard post-tensioning
ducts to create voids for projecting reinforcing steel (FHWA, 2009). These connections are
similar to the grouted splice couplers in that rebars are inserted into a sleeve made up of
standard post-tensioning duct. The difference is that the duct is non-structural and therefore
additional confining reinforcement is required around the duct to develop a significant
connection. More recently, connections with performance emulative of CIP connections in
moderate-to-high seismic zones have been developed by researchers by employing ultra-high-
performance concrete filled corrugated duct connections (Tazarv and Saiidi, 2015).
Grout bed
Precast column
Pile cap
Bar couplerGrout
outlet
Bar stop
Grout
inlet
Ductile
cast-iron
sleeve
Steel bar
Steel bar
High-strength
grout

140
Figure 6.3 Precast column-to-footing connection using grouted sleeve coupler
(Pantelides et al., 2017)
The details for column connections that are proposed by FHWA in the Highways for LIFE (HfL)
Technology Partnerships Program can also be used for energy dissipation connections in high
seismic regions (FHWA, 2013a). The HfL connections, which are used especially for a fully
precast bent system, consist of a column-to-footing connection, referred to as the socket
connection, and a column-to-cap beam connection, as shown in Figure 6.4. The socket
connection is made by placing the precast column in the excavation, placing the footing steel,
and then casting the footing concrete around the column. Alternatively, the footing steel may
be placed before the column is set. The surfaces of the column are usually roughened to enhance
the connection. The socket concept represents a simple way to precast a column and integrate
it with the foundation. Compared with the other alternatives, such as the grouted sleeve
couplers, the socket system has the advantages that the placement tolerances for the column
are significantly greater than those available with a sleeve system and that the connection
requires no special or proprietary hardware. For the precast bent system, the column-to-cap
beam connection has utilized the grouted post-tensioning duct connection. The lower precast
cap beam is placed by lowering the beam over the rebars that protrude upwards from the precast
column. Corrugated metal ducts are provided in the cap beam to accept the column dowels.
The column rebars are subsequently grouted into the ducts. A socket connection at the base and
a grouted duct connection at the top are considered to be practical solutions to the use of
assembled substructures (FHWA, 2013a). The socket connection and the grouted duct
connection have also been tested in New Zealand (Mashal et al., 2014).
Figure 6.4 Exploded view of HfL precast bent concept (FHWA, 2013a)
In Taiwan, a new connection detail as shown in Figure 6.5 for building segmental concrete
columns in seismic regions appeared in 2012 and was used for the Taichung Metro - Area No.
4 Elevated Expressway (Ou et al., 2013). The segmental column has the lower part cast in place
with the foundation and the upper part consisting of hollow segments. The CIP region provides
U-hoop steel ducts for post-tensioning tendons and a rebar cage protruding into the hollow core
of the first segment. Concrete is poured into the CIP region up to the hollow core of the first
segment to ensure a sealed connection between them. The connections between the other

141
column segments are made by using the match casting method of construction in conjunction
with post-tensioning. The joints are epoxy bonded together and post-tensioning completes the
joint. It should be noted that the height of the CIP region and post-tensioning force in the precast
region are selected such that the ultimate condition is dominated by the plastic hinging
behaviour of the CIP region rather than by significant nonlinear behaviour of precast joints (Ou
et al., 2013). In this way, the critical joint of the precast region is protected. Nevertheless,
opening of the precast joints is not prevented. Thus, the post-tensioning tendons are designed
to be unbonded from the concrete to reduce yielding and the subsequent prestress loss due to
joint opening. Besides, the unbonded post-tensioning tendons are also known to provide
excellent self-centring capability (Priestley et al., 1999). In order to enhance the hysteretic
energy dissipation capacity of the segmental columns, the bonded longitudinal mild steel rebars
inside the column segments may be made continuous at the segment joints by using grouted
steel corrugated duct connections, forming a hybrid system (Ou et al., 2009). While the tendons
provide self-centring and restoring actions, the mild steel rebars act as energy dissipaters and
shock absorbers through the opening and closing of the precast joint, which is often termed the
rocking mechanism.
Figure 6.5 Joint construction of the CIP region (Ou et al., 2013)
A new precast segmental bridge pier system has been proposed (Sung et al., 2017) as shown in
Figure 6.6. The system contains multiple segmental layers with several small precast modular
segments for each layer, and therefore the size of each segment can be kept small to ease
transportation and erection. This system has utilised the block-stacking concept. Each of the
precast modular segments includes double joint holes and shear keys at the top and bottom
surfaces, respectively, so that it can be bonded to two adjoining segments in the neighbouring
layer by embedding each of the two shear keys in the corresponding joint holes belonging to
two different segments to establish interlocking between segments in the horizontal direction
(Sung et al., 2017). Post-tensioning is applied to complete the assembly. It should be noted that
shear keys are commonly used in precast segmental bridge piers mainly to ease assembly and
their shear resistance need not be taken into account in the design phase. The shear keys adopted
in this system, however, are used not only as alignment guides to facilitate assembly but also
to provide shear resistance between segments in order to reduce the prestressing force needed
(Sung et al., 2017). To use such prefabricated columns in moderate-to-high seismic regions,
the connection between segments in the vertical direction utilizes a hybrid connection that
contains not only shear keys but also bonded mild steel rebars that are spliced by rebar couplers
Rebar cage for
CIP portion
Tendon duct
Foundation
Excavationsupport
Tendon
duct
Excavationsupport
Tendon
Epoxy
2nd precastsegment
1nd precastsegment
Cast-in-place
concrete
Steel bracketAdjustablesupport
Form system

142
and unbonded tendons with small prestressing force (Sung et al., 2017). Likewise, the bonded
steel reinforcement that runs continuously between segments can provide strength and energy
dissipation capability, and the prestressed unbonded tendons can provide re-centring forces to
minimize residual displacements. Cyclic loading test results and construction practices of the
system have confirmed the seismic performance and constructability of the modular precast
segmental column to be satisfactory (Sung et al., 2017).
Figure 6.6 Schematic view of modular precast segmental bridge pier (Sung et al., 2017)
Innovative construction methods
For projects based on large and heavy prefabricated elements, a particular timely and
economical solution is to rotate or slide bridge structures from the assembly area to its final
position using heavy lifting equipment and techniques.
The rotation construction method involves building the superstructure at one side of the
obstacle being spanned (normally at 90 degrees with its final position), depending on the bridge
layout and surrounding landform, and then rotating the superstructure into place. In the earliest
attempts, vertical rotation construction method has been used in arch construction. Horizontal
rotation method was accomplished decades later and is applicable to other types of bridges as
well (Sun et al., 2011). The highly-mechanized rotation method is efficient when used in the
proper circumstances, such as spanning a busy shipping channel or railway. Compared with the
balanced cantilever method and incremental launching method, the rotation method shortens
the construction time and causes minimal traffic impact. The technique has been quite popular
in Mainland China. One notable bridge is Gusao-Tree Road Overpass in Wuhan City (武漢市
姑嫂樹路高架跨鐵路橋), which spans over one of the busiest railway routes in China, i.e. the
Jingguang Railway (京廣鐵路) that connects the capital Beijing and Guangzhou City. In 2014,
a 17,000-ton part of this elevated motorway, after being constructed independently beside the
high-speed railway, was carefully swung 106 degrees about a vertical axis into place through a
horizontal plane 15 m above ground and connected to the rest of the bridge in 90 minutes.
The slide-in bridge construction method is a special method used to replace an existing bridge
with the minimum road closure duration. It is also one of the fundamental ABC techniques
being promoted in the USA (Aktan and Attanayake, 2013). In this method, the new
superstructure is built alongside an existing bridge on temporary supports. All traffic continues

143
uninterrupted on the existing bridge until the construction of the new superstructure is
completed. Then the existing bridge is demolished or removed, and the new bridge can be slid
into place (FHWA, 2013b). There is a minimum road closure duration during the lateral bridge
slide, which is required to be within 24 hours (SHRP 2, 2013). The old substructure can be
retained or a new substructure can be built before the new superstructure is slid in. In some
instances, the new substructure is pre-constructed below the existing structure to reduce the
overall road closure time (SHRP 2, 2013). This method also provides a safer environment for
construction workers and greater ease, as construction work need not be carried out
immediately adjacent to the traffic. There is additional room for girder sets, deck concrete
placement and equipment access (SHRP 2, 2013).
Resilient Structural Systems
Self-centring system
Ductility design attempts to prevent catastrophic failure through the formation of reliable
plastic hinges. However, the hysteretic dissipation of energy usually causes non-repairable
damage to the hinge zones. After a strong earthquake, even though life safety may have been
assured, extensive damage may have left the structure unserviceable and costly to repair. Owing
to this, Damage Avoidance Design (DAD) based on self-centring system is proposed to be used
with the ABC method.
The concept of self-centring system was first proposed in 1991 under the Precast Seismic
Structural System (PRESSS) Research Programme at University of California at San Diego
(Priestley, 1991). It is a jointed ductile connection system similar to that shown in Figure 6.5,
aiming to minimize damage in the pier through dissipating the energy via “controlled” rocking
motion at the segmental connections. External dissipative devices that can be easily replaced
may be provided at the rocking section to dissipate the energy for easy maintenance (Marriott
et al., 2008).
Priestley et al. (1999) proved that an effective and viable solution is to allow the rocking motion
between structural members, i.e. the beam-to-column or column-to-foundation connection,
rather than adopting CIP. Figure 6.7 shows a solution to DAD at the column-to-foundation
connection. The rocking motion of the column is “controlled” by an additional restoring force
provided either by the inner partially unbonded mild steel bar as shown in Figure 6.7(a) or
through external dissipative linkages (reinforcing bars or mechanical dissipative devices)
placed at the rocking section as shown in Figure 6.7(b). The latter is preferable in the event of
moderate-to-high seismicity.

144
(a) (b)
Figure 6.7 Two DADs for column-to-foundation connection: (a) internal dissipation; and
(b) external dissipation
It is expected that controlled dissipative rocking action during an earthquake offers restoring
or self-centring capacity plus energy dissipation. This technology is likely to reduce the
potential damage to the structure and preserve the functionality of the bridge after the
earthquake, representing a promising solution to future bridge seismic design.
In New Zealand, damage avoidance design has been used in a three-span continuous bridge,
i.e. Wigram‐Magdala Bridge (Routledge et al., 2016). Nevertheless, there are still many
problems to be solved before wide application of DAD.
Floating articulation
Laminated elastomeric bearings are commonly used in small- to medium-span bridges around
the world for they are relatively cheap and they require low maintenance. In some of the past
earthquakes, engineers found that bridges with mixed use of elastomeric bearings and fixed
bearings as shown in Figure 6.8(a) performed poorly as compared to those with solely
elastomeric bearings on all supports as shown in Figure 6.8(b), i.e. floating bearing articulation.
Bridges with the floating bearing articulation have the following advantages in respect of
seismic performance:
Incurring smaller seismic action due to the smaller stiffness and longer fundamental period;
Enabling more uniform distribution of inertial forces among piers and hence smaller pier
sizes; and
Ease of repair and replacement of bearings after earthquake.
Type 1: Internal dissipation Type 2: External dissipation
Grouted Mild Steel
Unbonded Post-
Tensioned Tendon
Partly
Mild steel
Unbonded
ImposedRotation
External mildsteel disspaters
Pier

145
Horizontal inertial force
E* F E*
F: Fixed pot bearing E*: Elastomeric bearings with sliding interface or
low stiffness elastomeric bearings (a)
Horizontal inertial force
E E E
E: Elastomeric bearing
(b)
Figure 6.8 Bearing articulation: (a) conventional; and (b) floating
The floating articulation system, also known as “seismic isolation”, has been widely used in
many countries in recent years. In Japan, this practice has been adopted for the majority of
bridges built after the 1995 M6.9 Great Hanshin earthquake.
Despite the numerous advantages, the use of floating articulation system should be adopted
with caution. Large seismic displacement could occur, making it difficult for the design of
movement joints. For bridges founded on soft ground, the stiffness of the elastomeric bearings
shall not be lessened by an excessive amount as resonance may occur between the structure
and ground.
The adoption of floating bearing articulation in long-span bridges may result in large bearing
sizes, which could offset the material savings achieved in the substructure. To solve this, a
hybrid bearing system has recently been proposed in Japan (Saito and Terada, 2016). The
hybrid bearing system consists of pot bearings and elastomeric bearings on the same pier as
shown in Figure 6.9. The pot bearings with sliding interface are aimed for supporting the
vertical load, while the elastomeric bearings are for resistance and flexibility in the horizontal
direction. Since the elastomeric bearings in the hybrid bearing system do not carry substantial
vertical loads due to the shielding effect of the stiffer pot bearing, they can be much more
compact.

146
Sliding bearing
Elastomericbearing
Bridge deck
Pier
Figure 6.9 Hybrid bearing system
Design for Maintainability
It is increasingly recognized that many decisions taken during the planning and design of a
bridge can significantly influence its service life as well as the costs of future inspection and
maintenance, and that maintainability should become one of the primary considerations in the
bridge design process. This is a paradigm shift as most planning and design operations in the
past were governed by the current needs and initial costs then with less emphasis on the future
maintenance, which has resulted in bridge designs that are not conducive to cost-effective
maintenance. The basic maintenance aspects include the selection of material and components
that are easy to repair, details that can provide easy access to inspect and repair, components
that can be replaced easily, and use of features such as integral abutment bridges to avoid joints
that can cause deterioration of other components because of their failure and so forth (Alampalli,
2014a). All these aspects have been changing slowly from very reactive to very proactive in
nature because of the increasing emphasis on life-cycle costs.
The following considerations are recommended in bridge design for improved maintainability
(Alampalli, 2014b; Ceran and Newman, 1992; NYSDOT, 2017):
It is desirable to reduce the number of expansion joints to an acceptable minimum and
avoid half-joints and in-span hinges. The maintenance impacts of deck joint failure include
deterioration of the beams, pier caps and bearings as a result of water and chemicals
leaking through the joints. A non-functioning or jammed joint, and the resulting pressure,
will cause undesirable movement of abutments or piers, and spalling of concrete decks,
beams, and abutments or pile caps. As a result, the designer should try to avoid the use of
open joints. Most importantly, the designer should accept that joints will leak and therefore
waterproof the concrete and steel works below. Elimination of joints may be accomplished
by designing for continuity and taking advantage of the flexibility of the structural system.
The major maintenance impacts associated with deck drainage are retention of water due
to inadequate deck drainage and deterioration of the superstructure and substructure
elements when water is not directed away from these elements. In this regard, the drains
should be designed with adequate gradients and cross falls. Besides, it is better to avoid
placing bridges on sag vertical curves, especially when concrete barriers are used, as it will
create problems in case the drain becomes clogged. If this cannot be avoided, drainage
outlets through the barrier should be provided to prevent ponding. Inlet grates shall be
located in front of barriers in such a way that they are easily accessible for daily cleaning
to minimize obstruction of deck drains with debris. Flat inlet grates should be provided to

147
avoid damage to the inlet by pavement cleaning equipment. Moreover, oversized pipes and
fittings, inlet openings and catch basins may be adopted to eliminate clogging even though
they are not required for capacity purposes. In severe clogging conditions, it is preferable
to provide mechanical joints so that the downspout system can be disassembled if
necessary. The downspouts shall not be encased in concrete pier where they cannot be
maintained or the problems are out of sight. It is also suggested that the downspouts extend
below the superstructure so that water is not sprayed onto the superstructure elements.
The use of elastomeric bearing pads should be the first bearing of choice. These bearings
are inexpensive and can be detailed for very simple and fast installations. They are also
known for their good seismic performance. Unlike rocker, roller and sliding bearings made
of steel, which are prone to debris blocking and corrosion, elastomeric bearings do not
seize or corrode, and they require a minimal amount of maintenance. Nevertheless,
bearings should be protected from dirt, adverse chemicals and water by proper details. It
will help to reduce maintenance and future rehabilitation requirements by eliminating or
reducing the number of bearings by designing a continuous superstructure with integral
interior piers and/or abutments. However, the continuous superstructure will unfortunately
cause an increase in the magnitude of movements at the expansion bearings. Elastomeric
pads, in combination with polytetrafluoroethylene (PTFE) and stainless steel, can be
provided to accommodate large movements.
Owing to the corrosion vulnerability of the post-tensioning systems, tendons located in the
columns below the highest water splash zone elevation should be avoided, and no precast
concrete hollow column section specified below the waterline should be allowed. Multiple
levels of protection shall be provided at the anchorages, including the permanent grout cap,
epoxy material pour-back and polymer coating over the pour-back. A post-tensioning
redundancy system or practical replacement capabilities should be incorporated (FHWA,
2004).
For inspection and maintenance purpose, access to parts that may require maintenance or
replacement during the life of the bridge, e.g. bearings, anchorages, unbonded prestressing
tendons, etc., should be included in the plans, and the required clearances for removal of
components should be provided. In providing the access, consideration should also be
given to provide a dry, comfortable and pleasant environment in which the inspector is to
work. Improved accessibility at the end supports may be achieved by providing an
inspection gallery to the rear of the bearings as shown in Figure 6.10. The preferable width
and headroom clearance of such galleries are recommended to be not less than 1000 mm
and 1800 mm, respectively (NRA, 2010). The abutment galleries are also useful for
inspection and maintenance of expansion joints, prestressing tendons and anchorages, deck
ends and abutment curtain walls. A suitable gap should always be provided between the
top of the bearing shelf and the deck soffit. Besides, bearings should always be designed
for future removal and replacement. The location for jacking should be considered,
especially when it would be difficult to place a jacking bent. Consideration may be given
to providing a widened bridge seat where jacks may be placed as shown in Figure 6.11
(DOTMR, 2013).

148
Road surface Movement joint Sand Asphalt
Waterproofing
Bridge deck
Flashing to joint
extended to act as
drip
Bearings
100×50
Drained
Channel
Abutment
Gallery
Abutment
Minimum width
1000
Bearing
Drip
PlinthM
inim
um
hei
ght 1
80
0
(unit: mm)
Figure 6.10 Abutment gallery (NRA, 2010)
Steel packers
and wedges
(as required)
Pier
Hydraulic jack
Elastomeric
bearings in 10
deep recesses (unit: mm)
Figure 6.11 Jacking place (DOTMR, 2013)
Where possible, it is recommended to include with the bridge design equipment to ease
inspection and maintenance. Smaller structures may not justify a health monitoring system
or permanent cradles and runway beams, but portable, “over the side” inspection and repair
platforms can save scaffold erection and be moved as required. With the present practice
of using Under Bridge Inspection Truck (UBIT), the need for simple attached platform has
been reduced. If a UBIT is required for inspection of a bridge, the fencing along the fascia
should be limited or fence gate should be provided to swing the boom and basket of the
UBIT to reach outside the fence. Nevertheless, the use of UBIT may not be able to inspect
some utilities due to the deep superstructure or other design details.
It is desirable to ensure that all materials are of a suitable quality so as not to require
frequent renewal. It is also important to make sure that the work force has the necessary
expertise in the use of the materials.

149
REFERENCES
AASHTO (2002). Standard Specifications for Highway Bridges - Division I-A: Seismic Design.
American Association of State Highway Officials and Transportation Officials,
Washington, DC.
AASHTO (2011). Guide Specifications for LRFD Seismic Bridge Design. American
Association of State Highway Officials and Transportation Officials, Washington, DC.
Aktan, H., and Attanayake, U. (2013). MDOT RC-1602 Improving Bridges with Prefabricated
Precast Concrete Systems. Research Administration, Michigan Department of
Transportation.
Alampalli, S. (2014a). Bridge maintenance. In Bridge Engineering Handbook (2nd Edition):
Construction and Maintenance, Chen W. F. and Duan L. (Eds.), pp.269-300, CRC Press.
Alampalli, S. (2014b). Design Bridges for Inspectability and Maintainability. In Maintenance
and Safety of Aging Infrastructure (Volume 10): Structures and Infrastructures, D. M.
Frangopol and Y. Tsompanakis (Eds.), pp. 27-53, CRC Press.
Anderson, J. G., and Trifunac, M. D. (1978). Uniform risk functionals for characterization of
strong earthquake ground motion. Bulletin of the Seismological Society of America,
68(1), 205-218.
Arup (2012). Final Report on Overall Seismic Hazard Assessment. The Government of the
Hong Kong Administrative Region, Hong Kong, China.
Arup (2015). GEO Report No. 311: Seismic Hazard Analysis of the Hong Kong Region.
Geotechnical Engineering Office, Civil Engineering and Development Department,
Government of the Hong Kong Administrative Region, Hong Kong, China.
ATC (1981). ACT-6 Seismic Design Guidelines for Highway Bridges. Applied Techonology
Council Berkeley, California.
Atkins (2012). Study on the Use of Eurocodes for Highway Structures and Updating of
Structures Design Manual for Highways and Railways: Final Report on the Study for
Seismic Actions. Highways Department, The Government of the Hong Kong
Administrative Region, Hong Kong, China.
Atkins (2013). Study on the Use of Eurocodes for Highway Structures and Updating of
Structures Design Manual for Highways and Railways: Final Supplementary Report
on the Study for Seismic Actions. Highways Department, The Government of the Hong
Kong Administrative Region, Hong Kong, China.
Bai, Z. Z., and Au, F. T. K. (2009). Ductility of symmetrically reinforced concrete columns.
Magazine of Concrete Research, 61(5), 345-357.
Baker, J. W., Lin, T., Shahi, S. K., and Jayaram, N. (2011). New Ground Motion Selection
Procedures and Selected Motions for the PEER Transportation Research Program.
PEER Report, Pacific Earthquake Engineering Research Center, University of
California, Berkeley, Berkeley, CA.
Basoz, N. I., Kiremidjian, A. S., King, S. A., and Law, K. H. (1999). Statistical analysis of
bridge damage data from the 1994 Northridge, CA Earthquake. Earthquake Spectra,
15(1), 25-54.
BD (2013). Code of Practice for Structural Use of Concete 2013. Buildings Department, The
Government of the Hong Kong Special Administrative Region, Hong Kong.

150
BD (2017). Code of Practice for Foundations 2017. Buildings Department, The Government
of the Hong Kong Special Administrative Region, Hong Kong.
Berry, M., Parrish, M., and Eberhard, M. (2004). PEER Structural Performance Database
User’s Manual (version 1.0). PEER Report, Pacific Earthquake Engineering Research
Center, University of California, Berkeley, Berkeley, CA.
Bond, A., and Harris, A. (2008). Decoding Eurocode 7. Taylor and Francis.
BSI (1986). BS EN 8004:1986 British Standard Code of Practice for Foundations. British
Standards Institution, London, UK.
BSI (2000). BS EN 1536:2000 Execution of Special Geotechnical Work – Bored piles. British
Standards Institution, London, UK.
BSI (2003). BS EN 1991-2 Actions on Structures – Part 2: Traffic loads on bridges. British
Standards Institution, London, UK.
BSI (2004a). BS EN 1992-1 Design of Concrete Structures – Part 1-1: General rules and rules
for buildings. British Standards Institution, London, UK.
BSI (2004b). BS EN 1997-1 Geotechnical Design – Part 1: General rules. British Standards
Institution, London, UK.
BSI (2004c). BS EN 1998-1 Design of Structures for Earthquake Resistance – Part 1: General
rules, seismic actions and rules for buildings. British Standards Institution, London,
UK.
BSI (2004d). BS EN 1998-5 Design of Structures for Earthquake Resistance – Part 5:
Foundations, retaining structures and geotechnical aspects. British Standards
Institution, London, UK.
BSI (2004e). BS NA EN 1998-1 UK National Annex to Eurocode 8 Design of structures for
earthquake resistance Part 1 General rules, seismic actions and rules for building.
British Standards Institution, London, UK.
BSI (2005a). BS EN 1337-3 Structural Bearings – Part 3: Elastomeric bearings. British
Standard Institution, London, UK.
BSI (2005b). BS EN 1998-2 Design of Structures for Earthquake Resistance – Part 2: Bridges.
British Standards Institution, London, UK.
BSI (2005c). BS EN 1998-3 Design of Structures for Earthquake Resistance – Part 3:
Assessment and retrofitting of buildings. British Standards Institution, London, UK.
BSI (2005d). BS NA EN 1992-2 UK National Annex to Eurocode 2 Design of concrete
structures Part 2 Concrete bridges – Design and detailing rules. British Standards
Institution, London, UK
BSI (2005e). BS NA EN 1998-2 UK National Annex to Eurocode 8 Design of structures for
earthquake resistance Part 2 Bridges. British Standards Institution, London, UK
BSI (2009). PD 6698 Recommendations for the design of structures for earthquake resistance
to BS EN 1998. British Standards Institution, London, UK
BSI (2015). BS EN 8004:2015 British Standard Code of Practice for Foundations. British
Standards Institution, London, UK.
Caltrans (2013). Caltrans Seismic Design Criteria (Version 1.7). California Department of
Transportation, Sacramento, CA.

151
Ceran, T., and Newman, R. B. (1992). Maintenance Considerations in Highway Design.
National Cooperative Highway Research Program (NCHRP), Report 349, National
Academy Press, Washington, DC.
Chail, Y. H., Priestley, M. J. N., and Seible, F. (1991). Seismic retrofit of circular bridge
columns for enhanced flexural performance. Structural Journal, 88(5), 572-584.
Choi, E. (2002). Seismic Analysis and Retrofit of Mid-America Bridges. Doctoral dissertation,
School of Civil and Environmental Engineering, Georgia Institute of Technology.
Choi, E., DesRoches, R., and Nielson, B. (2004). Seismic fragility of typical bridges in
moderate seismic zones. Engineering Structures, 26(2), 187-199.
Chopra, A. K. (2016). Dynamics of Structures: Theory and Applications to Earthquake
Engineering (5th Edition). Pearson Publishing.
Cornell, C. A. (1968). Engineering seismic risk analysis. Bulletin of the Seismological Society
of America, 58(5), 1583-1606.
Cornell, C. A., Jalayer, F., Hamburger, R. O., and Foutch, D. A. (2002). Probabilistic basis for
2000 SAC federal emergency management agency steel moment frame guidelines.
Journal of Structural Engineering, 128(4), 526-533.
CSP (2001). GB18306-2001 Seismic Ground Motion Parameter Zonation Map of China. China
Standard Press, Beijing, China.
CSP (2015). GB18306-2015 Seismic Ground Motion Parameter Zonation Map of China. China
Standard Press, Beijing, China.
Culmo, M. P. (2011). FHWA-HIF-12-013 Accelerated Bridge Construction - Experience in
design, fabrication and erection of prefabricated bridge elements and systems. Federal
Highway Administration, Washington, DC.
Dolce, M., Cardone, D., and Croatto, F. (2005). Frictional behavior of steel-PTFE interfaces
for seismic isolation. Bulletin of Earthquake Engineering, 3(1), 75-99.
DOTMR (2013). Drafting and Design Presentation Standards (Volume 3): Structural Drafting
Standards, Chapter 13 – Provision for bridge jacking, Inspection and Maintenance.
Department of Transport and Main Roads, The State of Queensland, Australia.
Douglas, J. (2011). BRGM/RP-59356-FR Ground-Motion Prediction Equations 1964-2010.
Pacific Earthquake Engineering Research Center (PEER), University of California,
Berkeley.
Dunaszegi, L. (2005). HPC for durability of the Confederation Bridge. In HPC Bridge Views
(Volume 5), Federal Highway Administration and National Concrete Bridge Council.
Fang, K. T., Lin, D. K., Winker, P., and Zhang, Y. (2000). Uniform design: theory and
application. Technometrics, 42(3), 237-248.
FHWA (2004). FHWA/TX-04/0-1405-9 Conclusions, Recommendations and Design
Guidelines for Corrosion Protection of Post-Tensioned Bridges. Federal Highway
Administration, Turner-Fairbank Highway Research Center, McLean, VA.
FHWA (2006). FHWA-HRT-06-032 Seismic Retrofitting Manual for Highway Structures: Part
1-Bridges. Federal Highway Administration, Turner-Fairbank Highway Research
Center, McLean, VA.
FHWA (2009). FHWA-IF-09-010 Connection Details for Prefabricated Bridge Elements and
Systems. Federal Highway Administration, Turner-Fairbank Highway Research Center,

152
McLean, VA.
FHWA (2013a). FHWA-HIF-13-037 Precast Bent System for High Seismic Regions - Final
Report. Federal Highway Administration, Turner-Fairbank Highway Research Center,
McLean, VA.
FHWA (2013b). FHWA-ST-99-232 Slide-In Bridge Construction Implementation Guide.
Federal Highway Administration, Turner-Fairbank Highway Research Center, McLean,
VA.
FHWA (2014). FHWA-NHI-15-004 LRFD Seismic Analysis and Design of Bridges: Reference
Manual. Federal Highway Administration, Turner-Fairbank Highway Research Center,
McLean, VA.
Gelfi, P. (2012). SIMQKE_GR version 2.7. University of Brescia.
GEO (2006). Foundation Design and Construction. Geotechnical Engineering Office, Civil
Engineering and Development Department, Hong Kong.
Goodnight, J. C., Kowalsky, M. J., and Nau, J. M. (2013). Effect of load history on performance
limit states of circular bridge columns. Journal of Bridge Engineering, 18(12), 1383-
1396.
Goodnight, J. C., Kowalsky, M. J., and Nau, J. M. (2015). The Effects of Load History and
Design Variables on Performance Limit States of Circular Bridge Columns. Alaska
Department of Transportation and Public Facilities, Research, Development
andTechnology Transfer, Juneau, AK, USA.
Goodnight, J. C., Kowalsky, M. J., and Nau, J. M. (2016). Strain limit states for circular RC
bridge columns. Earthquake Spectra, 32(3), 1627-1652.
Hayshi, Y., Shimizu, R., Nakatsuka, T., and Suzuki, K. (1994). Bond stress-slip characteristic
of reinforcing bars in grout-filled coupling steel sleeves. Journal of Structural and
Construction Engineering, 10(2), 27-35.
Hayward, A., Sadler, N., and Tordoff, D. (2002). BCSA 51/10 Steel Bridges: A Practical
Approach to Design for Efficient Fabrication and Construction. British Constructional
Steelwork Association, Kovic Design Ltd, British.
Highways Agency (2001). BD37/01 Loads for Highway Bridges, Design Manual for Roads
and Bridges. Department of Transport, UK.
Highways Department (2006). Structures Design Manual for Highways and Railways, Third
Edition. The Government of the Hong Kong Special Administrative Region, Hong
Kong, China.
Highways Department (2013). Structures Design Manual for Highways and Railways 2013
Edition. The Government of the Hong Kong Special Administrative Region, Hong
Kong, China.
Highways Department (2016a). Footbridges and Subways of Hong Kong. The Government of
the Hong Kong Special Administrative Region, Hong Kong, China.
Highways Department (2016b). Hong Kong: The Facts - Railway Network. The Government
of the Hong Kong Special Administrative Region, Hong Kong, China.
Highways Department (2016c). Hong Kong: The Facts - Highways. The Government of the
Hong Kong Special Administrative Region, Hong Kong, China.
Hose, Y. D., and Seible, F. (1999). Performance Evaluation Database for Concrete Bridge

153
Components and Systems under Simulated Seismic Loads. PEER Report, Pacific
Earthquake Engineering Research Center, University of California, Berkeley, Berkeley,
CA.
IBC (2009). International Building Code. International Code Council, California, USA.
Imbsen, R. A. (2014). Seismic bridge design specifications for the United States. In Bridge
Engineering Handbook (2nd Edition): Seismic Design, Chen W. F. and Duan L. (Eds.),
pp. 237-277. CRC Press.
Jankowski, R., Wilde, K., and Fujino, Y. (1998). Pounding of superstructure segments in
isolated elevated bridge during earthquakes. Earthquake Engineering and Structural
Dynamics, 27(5), 487-502.
Jankowski, R., Wilde, K., and Fujino, Y. (2000). Reduction of pounding effects in elevated
bridges during earthquakes. Earthquake Engineering and Structural Dynamics, 29(2),
195-212.
Jiang, R. J., Au, F. T. K., and Xiao, Y. F. (2014). Prestressed concrete girder bridges with
corrugated steel webs. Journal of Structural Engineering, 141(2), 04014108.
Kowalsky, M. J. (2000). Deformation limit states for circular reinforced concrete bridge
columns. Journal of Structural Engineering, 126(8), 869-878.
Kowalsky, M. J., and Priestley, M. J. N. (2000). Improved analytical model for shear strength
of circular reinforced concrete columns in seismic regions. Structural Journal, 97(3),
388-396.
Kowalsky, M. J., Priestley, M. N., and Macrae, G. A. (1995). Displacement‐based design of
RC bridge columns in seismic regions. Earthquake Engineering and Structural
Dynamics, 24(12), 1623-1643.
Lee, C. F., Ding, Y. Z., Huang, R. H., Yu, Y. B., Guo, G. A., Chen, P. L., and Huang, X. H.
(1998). GEO Report No.65: Seismic Hazard Analysis of the Hong Kong Region.
Geotechnical Engineering Office, Civil Engineering and Development Department,
Government of the Hong Kong Administrative Region, Hong Kong, China.
Lehman, D., Moehle, J., Mahin, S., Calderone, A., and Henry, L. (2004). Experimental
evaluation of the seismic performance of reinforced concrete bridge columns. Journal
of Structural Engineering, 130(6), 869-879.
Lepech, M. D., and Li, V. C. (2009). Application of ECC for bridge deck link slabs. Materials
and Structures, 42(9), 1185.
Li, V. C. (2003). On engineered cementitious composites (ECC). Journal of Advanced Concrete
Technology, 1(3), 215-230.
Lynn, A. C., Moehle, J. P., Mahin, S. A., and Holmes, W. T. (1996). Seismic evaluation of
existing reinforced concrete building columns. Earthquake Spectra, 12(4), 715-739.
Mander, J. B., and Basöz, N. (1999). Seismic fragility curve theory for highway bridges. In
Proceedings of the 5th U.S. Conference on Lifeline Earthquake Engineering:
Optimizing Post-Earthquake Lifeline System Reliability, Elliott W. M. (Eds), American
Society of Civil Engineers, Reston, VA.
Mander, J. B., Priestley, M. J., and Park, R. (1988). Theoretical stress-strain model for confined
concrete. Journal of Structural Engineering, 114(8), 1804-1826.
Marriott, D., Pampanin, S., Bull, D., and Palermo, A. (2008). Dynamic testing of precast, post-

154
tensioned rocking wall systems with alternative dissipating solutions. Bulletin of NZ
Society for Earthquake Engineering, 41(2), 90-103.
Marsh, M. L., Buckle, I. G., and Kavazanjian Jr, E. (2014). LRFD Seismic Analysis and Design
of Bridges: Reference Manual. National Highway Institute, U.S. Department of
Transportation, Federal Highway Administration, Washington, DC.
Mashal, M., White, S., and Palermo, A. (2014). Uni and bi-direction quasi-static cyclic testing
of Emulative Precast Segmental Bridge Piers (E-PSBP) in moderate to high seismic
regions. In Proceedings of the 7th International Conference of Bridge Maintenance,
Safety and Management (IABMAS 2016): Bridge Maintenance, Safety, Management
and Life Extension, Chen A., Frangopol D. M. and Ruan X. (Eds.), CRC Press.
Matlock, H., and Reese, L. C. (1962). Generalized solutions for laterally loaded piles.
Transactions of the American Society of Civil Engineers, 127(1), 1220-1247.
Mazzoni, S., McKenna, F., Scott, M. H., and Fenves, G. L. (2006). OpenSees Command
Language Manual. Pacific Earthquake Engineering Research (PEER) Center.
MCPRC (1989). JTJ 004-89 Specifications of Earthquake Resistant Design for Highway
Engineering. Ministry of Communications of the People’s Republic of China, People’s
Communications Press, Beijing, China.
MCPRC (2008). JTG/T B02-01-2008 Guidelines for Seismic Design of Highway Bridges.
Ministry of Communications of the People’s Republic of China, People’s
Communications Press, Beijing, China.
Melek, M., and Wallace, J. W. (2004). Cyclic behavior of columns with short lap splices.
Structural Journal, 101(6), 802-811.
Moehle, J. P., and Eberhard, M. O. (2000). Earthquake damage to bridges. In Bridge
Engineering Handbook, Chen W. F. and Duan L. (Eds.), CRC Press.
MTRCL (2013). New Works Design Standards Manual. MTR Corporation Limited, Hong
Kong, China.
Nielson, B. G., and DesRoches, R. (2007). Seismic fragility methodology for highway bridges
using a component level approach. Earthquake Engineering and Structural Dynamics,
36(6), 823-839.
NRA (2010). NRA BD 57/10 Design Manual for Roads and Bridges (Volume 1), Section 3:
General Design – Part 7: Design for Durability. National Roads Authority, Transport
Infrastructure Ireland, Dublin.
NYSDOT (2017). Bridge Manual. New York State Department of Transportation, New York.
NZTA (2016). SP/M/022 Bridge Manual. New Zealand Transport Agency, Wellington, New
Zealand.
Okukawa, A., Suzuki, S. and Harazaki, I. (2014). Suspension bridges. In Bridge Engineering
Handbook (2nd Edition) – Superstructure Design, Chen W. F. and Duan L. (Eds.), CRC
Press.
Ou, Y. C., Oktavianus, Y., and Tsai, M. S. (2013). An emulative precast segmental concrete
bridge column for seismic regions. Earthquake Spectra, 29(4), 1441-1457.
Ou, Y. C., Wang, P., Tsai, M. S., Chang, K. C., and Lee, G. C. (2009). Large-scale experimental
study of precast segmental unbonded posttensioned concrete bridge columns for
seismic regions. Journal of Structural Engineering, 136(3), 255-264.

155
Padgett, J. E., Nielson, B. G., and DesRoches, R. (2008). Selection of optimal intensity
measures in probabilistic seismic demand models of highway bridge portfolios.
Earthquake Engineering and Structural Dynamics, 37(5), 711-725.
Pang, Y., Wu, X., Shen, G., and Yuan, W. (2013). Seismic fragility analysis of cable-stayed
bridges considering different sources of uncertainties. Journal of Bridge Engineering,
19(4), 04013015.
Pantelides, C. P., Ameli, M., and Reaveley, L. D. (2017). MPC 17-320: Evaluation of Grouted
Splice Sleeve Connections for Precast Reinforced Concrete Bridge Piers. Mountain-
Plains Consortium, Department of Transportation, U.S.
Park, Y. J., and Ang, A. H. (1985). Mechanistic seismic damage model for reinforced concrete.
Journal of Structural Engineering, 111(4), 722-739.
PEER (2018). PEER Ground Motion Database: https://ngawest2.berkeley.edu/. Pacific
Earthquake Engineering Research Center, University of California, Berkeley.
Priestley, M. J. N. (1991). Overview of PRESSS research program. PCI Journal, 36(4), 50-57.
Priestley, M. J. N., Calvi, G. M., and Kowalsky, M. J. (2007). Displacement-based Seismic
Design of Structures. IUSS Press, Pavia, Italy.
Priestley, M. J. N., Kowalsky, M. J., and Calvi, G. M. (2014). Displacement-based seismic
design of bridges. In Bridge Engineering Handbook (2nd Edition) – Seismic Design,
Chen W. F. and Duan L. (Eds.), CRC Press.
Priestley, M. J. N., Seible, F., and Calvi, G. M. (1996). Seismic Design and Retrofit of Bridge.
John Wiley and Sons.
Priestley, M. J. N., Sritharan, S., Conley, J. R., and Pampanin, S. (1999). Preliminary results
and conclusions from the PRESSS five-story precast concrete test building. PCI
Journal, 44(6), 42-67.
Ramanathan, K. N. (2012). Next Generation Seismic Fragility Curves for California Bridges
Incorporating the Evolution in Seismic Design Philosophy. Doctoral dissertation,
Georgia Institute of Technology.
Routledge, P. J., Cowan, M. J., and Palermo, A. (2016). Low-damage detailing for bridges – A
case study of Wigram–Magdala bridge. In Proceedings of the New Zealand Society for
Earthquake Engineering 2016Conference (NZSEE 2016).
Saito, D., and Terada, K. (2016). More for less in seismic design for bridges – An overview of
the Japanese approach. The Structural Engineer, 94(2), 19-28.
Scawthorn, C., and Kramer, S. L. (2014). Geotechnical earthquake considerations. In Bridge
Engineering Handbook (2nd Edition) - Seismic Design, Chen W. F. and Duan L. (Eds.),
pp. 1-51, CRC Press.
SCCT (2012). Construction Standard CS2:2012 – Steel Reinforcing Bars for the Reinforcement
of Concrete. Standing Committee on Concrete Technology, The Government of the
Hong Kong Special Administrative Region, Hong Kong, China.
Scott, D., Pappin, J., and Kwok, M. (1994). Seismic design of buildings in Hong Kong. HKIE
Transactions, 1(2), 37-50.
SHRP 2 (2013). Innovative Bridge Designs for Rapid Renewal: ABC Toolkit. The Strategic
Highway Research Program 2 (SHRP 2), Report No. S2-R04-RR-2, Transportation
Research Board of the National Academies, Washington, D.C.

156
Standards Australia (2017). AS 5100.2:2017 Bridge Design – Part 2: Design loads. SAI Global
Limited.
Steelman, J. S., Fahnestock, L. A., Hajjar, J. F., and LaFave, J. M. (2015). Performance of
nonseismic PTFE sliding bearings when subjected to seismic demands. Journal of
Bridge Engineering, 21(1), 04015028.
Stone, W. C., and Taylor, A. W. (1993). Seismic Performance of Circular Bridge Columns
Designed in accordance with AASHTO/CALTRANS Standards. NIST Building Science
Series 170, National Institute of Standards and Technology.
Su, J., Dhakal, R. P., and Wang, J. (2017). Fiber-based damage analysis of reinforced concrete
bridge piers. Soil Dynamics and Earthquake Engineering, 96, 13-34.
Sun, Q. S., Guo, X. G., Zhang, D. P., Guan, X. K., and Zheng, Y. (2011). Research on the
application of horizontal rotation construction method with flat hinge in cable-stayed
bridge construction. Advanced Materials Research, 255, 856-860.
Sung, Y. C., Hung, H. H., Lin, K. C., Jiang, C. R., and Chang, K. C. (2017). Experimental
Testing and Numerical Simulation of Precast Segmental Bridge Piers Constructed with
a Modular Methodology. Journal of Bridge Engineering, 22(11), 04017087.
Tavares, D. H., Padgett, J. E., and Paultre, P. (2012). Fragility curves of typical as-built highway
bridges in eastern Canada. Engineering Structures, 40, 107-118.
Tazarv, M., and Saiidi, M. S. (2014). Next Generation of Bridge Columns for Accelerated
Bridge Construction in High Seismic Zones. Center for Civil Engineering Earthquake
Research, Report No. CCEER-14-06, Department of Civil and Environmental
Engineering, University of Nevada, Reno.
Tazarv, M., and Saiidi, M. S. (2015). UHPC-filled duct connections for accelerated bridge
construction of RC columns in high seismic zones. Engineering Structures, 99, 413-
422.
Vejrum, T. and Nielsen, L. L. (2014). Cable-stayed bridges. In Bridge Engineering Handbook
(2nd Edition) – Superstructure Design, Chen W. F. and Duan L. (Eds.), CRC Press.
Vintzeleou, E. N., and Tassios, T. P. (1987). Behavior of dowels under cyclic deformations.
Structural Journal, 84(1), 18-30.
Wang, J., and Thusyanthan, N. I. (2008). Evaluating foundation design concepts of Eurocode
7 and 8. In Proceedings of the 2nd British Geotechnical Association (BGA) International
Conference on Foundations: Foundations, Brown M. J., Bransby M. F., Brennan A. J.
and Knappett J. A. (Eds), IHS BRE Press.
Yamazaki, F., Hamada, T., Motoyama, H., and Yamauchi, H. (1999). Earthquake damage
assessment of expressway bridges in Japan. In Proceedings of the 5th U.S. Conference
on Lifeline Earthquake Engineering: Optimizing Post-Earthquake Lifeline System
Reliability, Elliott W. M. (Eds), American Society of Civil Engineers, Reston, VA.
Yashinsky, M., and Karshenas, M. J. (2003). Fundamentals of Seismic Protection for Bridges.
Earthquake Engineering Research Institute.
Yashinsky, M., Moehle, J., and Eberhard, M. (2014). Earthquake damage to bridges. In Bridge
Engineering Handbook (2nd Edition) - Seismic Design, Chen W. F. and Duan L. (Eds.),
pp. 53-97, CRC Press.
Zhao, J., and Li, B. (2015). Life prediction model of cross-sea bridge considering chloride ion

157
penetration coupled with temperature and moisture transfer (in Chinese). Journal of
Shenzhen University Science and Engineering, 32(6), 632-637.