construction analysis for pavement rehabilitation strategies · construction analysis for pavement...
TRANSCRIPT

CA4PRS
Construction Analysis for Pavement Rehabilitation StrategiesAccelerated Road Work for Work Zone Safety & Mobility
Peer Exchange WorkshopJune 5-6, 2012
E.B. LeeInstitute of Transportation Studies
Univ. of California at Berkeley
Chang Mo KimUniversity of California at Davis

CA4PRS 2
Transportation Trends (1970-2010)
Up 580%
Up 32%
Up 63%
Up 90%
Up 132%
Up 6%
Travel Miles1970
Americans Drivers Vehicles Ton Miles Highways
Aging
Congestion
Freights

CA4PRS
CA4PRS HistoryCA4PRS History• CA4PRS Software Development
– Pooled-fund (CA, FL, MN, TX, WA): UC Berkeley 2003– Help DOT agencies develop more economical highway
construction and TMP strategies • FHWA Outreach
– 2009 Market-ready Innovation and Technology Product– Arranged Free-group License for State DOTs– Training: 1,200 Eng (20 DOTs), 12 univ., Online course
• AASHTO Promotion– CAST: WZ Traffic Tools: 2007-2009

CA4PRS
CA4PRS Analysis ProcessCA4PRS Analysis Process
Decision-Support Model Multi-discipline Teamwork
CA4PRS 5
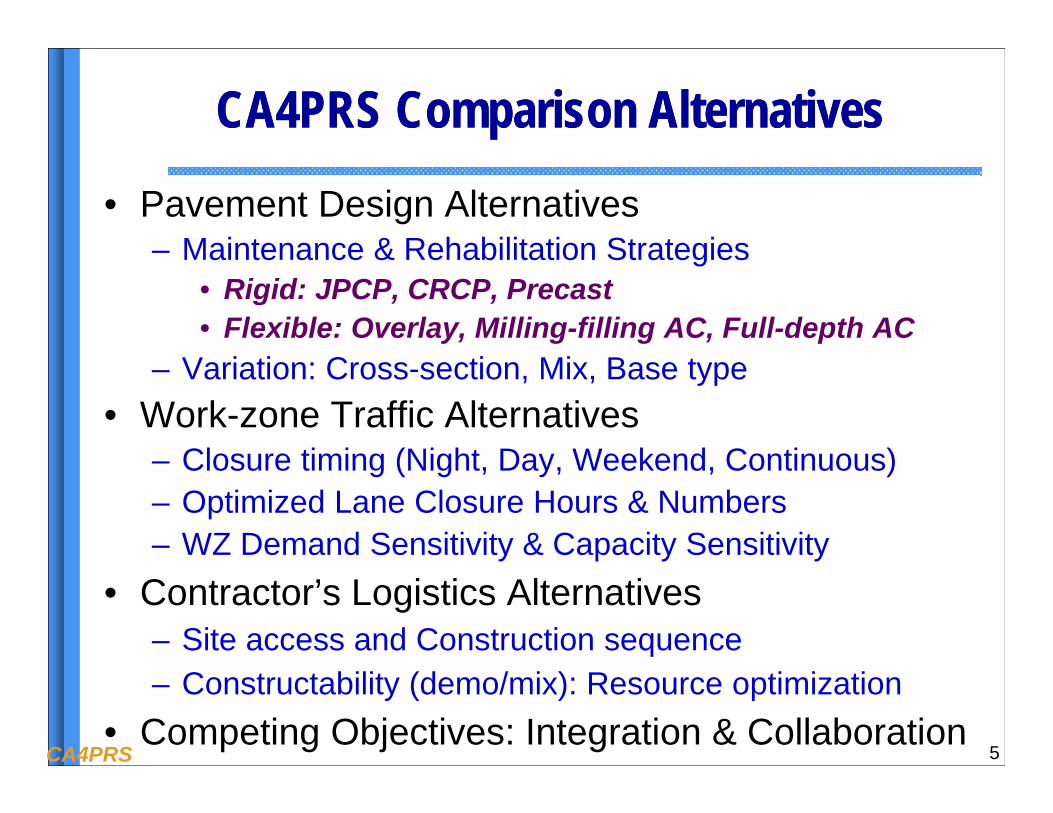
CA4PRS Comparison Alternatives CA4PRS Comparison Alternatives • Pavement Design Alternatives
– Maintenance & Rehabilitation Strategies• Rigid: JPCP, CRCP, Precast• Flexible: Overlay, Milling-filling AC, Full-depth AC
– Variation: Cross-section, Mix, Base type• Work-zone Traffic Alternatives
– Closure timing (Night, Day, Weekend, Continuous) – Optimized Lane Closure Hours & Numbers– WZ Demand Sensitivity & Capacity Sensitivity
• Contractor’s Logistics Alternatives– Site access and Construction sequence– Constructability (demo/mix): Resource optimization
• Competing Objectives: Integration & Collaboration

CA4PRS
• Pavement Cost: Itemized unit-price and quantity– Materials (PCC, HMA, RAC, Pre-cast), Base, Subbase– Item unit-price from bid-database
• Non-pavement Cost: % of construction cost – Earth work cost; Drainage cost– Specialty items(Retaining/Barrier), Stormwater (SWPPP)
• Traffic Costs– TMP (COZEEP, I/D) and Traffic-handling, Outreach
• Indirect Cost: % of construction cost– Minor Items, Mobilization, Supplemental, Contingency– Support: Agency (Plan, Design, Traffic, Construction)
• Other Optional Costs– Structures and ROW
CA4PRS EstimateAgency (Project) Cost
CA4PRS EstimateAgency (Project) Cost
=> Total Project Cost
CA4PRS
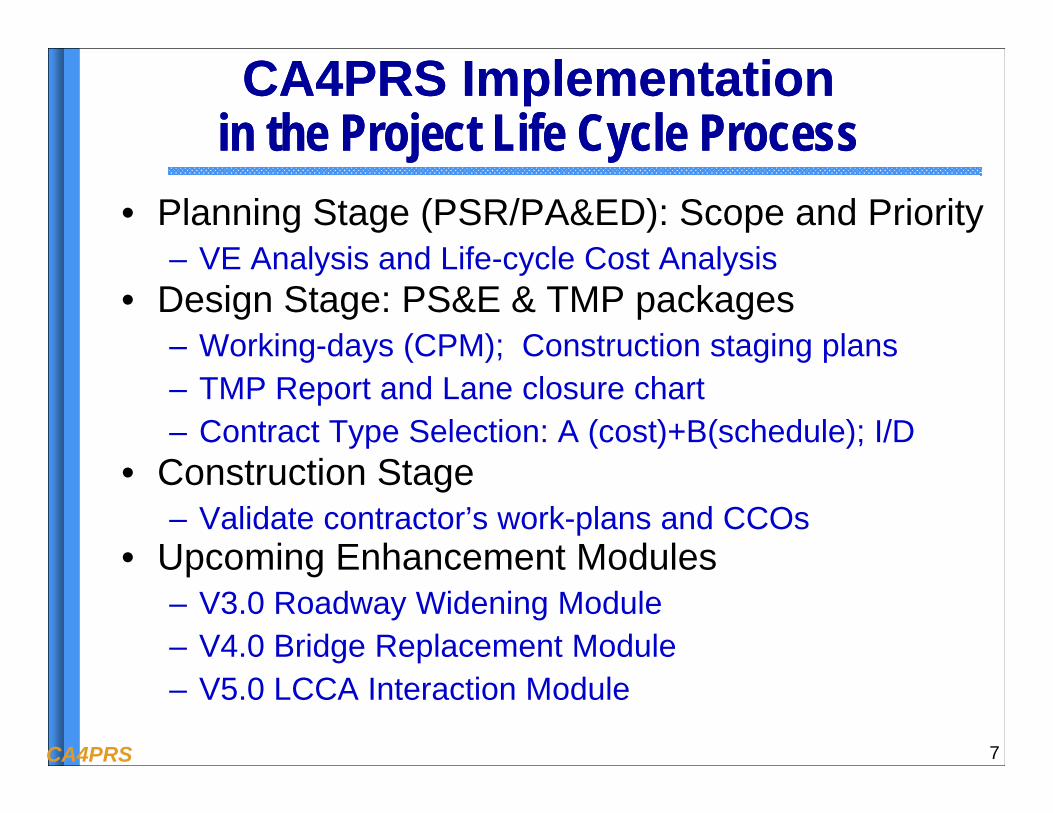
• Planning Stage (PSR/PA&ED): Scope and Priority– VE Analysis and Life-cycle Cost Analysis
• Design Stage: PS&E & TMP packages– Working-days (CPM); Construction staging plans – TMP Report and Lane closure chart– Contract Type Selection: A (cost)+B(schedule); I/D
• Construction Stage– Validate contractor’s work-plans and CCOs
• Upcoming Enhancement Modules– V3.0 Roadway Widening Module– V4.0 Bridge Replacement Module– V5.0 LCCA Interaction Module
7
CA4PRS Implementation in the Project Life Cycle ProcessCA4PRS Implementation
in the Project Life Cycle Process

CA4PRS
Hands-on Training Workshops:Caltrans + 20 DOTs => 1,200 engineers
CA4PRS Nationwide Implementation MapCA4PRS Nationwide Implementation Map

CA4PRS
CA4PRS Implementation Projects List (as of Feb 2011)CA DOT (Caltrans) Projects
No Route Location Type Cost Savings Distance Year Status1 I-10 Pomona, D7 AC Rehab $16M $0.3M 1 mile 2000 Partially adopted2 I-710 Long Beach, D7 AC Rehab $17M $1M 5 miles 2003 Adopted3 I-15 Devore-I, D8 PCC Rehab $16M $8M 3 miles 2005 Adopted4 I-15 Devore-II, D8 PCC Rehab $24M $4M 5 miles 2007 Adopted5 I-15 Ontario, D8 PCC Rehab $59M $5M 8 miles 2009 Adopted6 I-280 Santa Clara, D4 PCC CAPM $20M ($2M) 6 miles 2009 Not adopted7 US-101 San Jose, D4 AC CAPM $27M $3M 7 miles 2009 Partially Adopted8 I-680 San Ramon, D4 Rehab $70M $1M 12 miles 2010 Partially Adopted9 US-101 Ukiah, D1 PCC CAPM $19M $2M 6 miles 2010 Partially adopted10 I-5 Redding, D2 AC Rehab $50M - 14 miles 2011 Not adopted11 I-80 Sacramento, D3 PCC Rehab $92M $4M 9 miles 2011 Partially adopted12 I-5 Sacramento, D3 AC Rehab $88M - 17 miles 2011 Partially adopted13 SR-99 Elk Grove, D3 AC CAPM $21M ($3.5M) 14 miles 2010 Not adopted14 I-5 Yolo/Colusa, D3 AC CAPM $25M - 24 miles 2010 Not adopted15 I-5 Stockton, D10 CRCP Rehab $45M - 3 mile 2012 Adopted
Other State DOT Projects16 I-5 Seattle, WA PCC Rehab $5 - 2 miles 2005 Verification17 I-494 St. Paul, MN AC Rehab $10M - 10 miles 2004 Verification18 I-15 St. George, UT AC Rehab $16 $2M 8 miles 2010 Verification19 I-35 Oklahoma City, OK PCC Rehab $13M 6 miles 2010 Verification20 SR-39 Ogden, UT PCC Rehab $8M 1.3 miles 2011 Progress (implement)21 I-95 Richmond, VA AC Rehab $20M 5 miles 2012 Progress (Verification)22 I-5 Burlington, WA AC Rehab $15M 12 miles 2011 Adopted

CA4PRS
Concrete Pavement Cross-sectionsConcrete Pavement Cross-sections
(b) Concrete Slab Replacement
CONCRETE 205mm (8")
CTB 102mm (4")
AB 305mm (12")
SG
CONCRETE 305mm (12")
BASE 152mm (6")
AB 152mm (6")
SG
(c) Concrete Slab & Base Reconstruction(a) Milling Filling AC
ORExisting AC Pavement
51 mm
76 mm25 mm
0.5 hour
1 hour0.5 hour
Type C
Type CRAC-O

CA4PRS
Closure <=> Access <=> ProductionFull Closure for Concurrent MethodClosure <=> Access <=> ProductionFull Closure for Concurrent Method
Mobilization
Demolition Base PavingPCC Paving
Demobilization0.0
0.3
0.5
0.8
1.0
0 12 24 36 48 60 72 hour
prog
ress
(km)
Long Closure
Better Access
Faster Schedule
Higher Delay / Closure

CA4PRS
Closure <=> Access <=> ProductionPartial Closure for Sequential MethodClosure <=> Access <=> ProductionPartial Closure for Sequential Method
Mobilization
Demolition Base Paving PCC Paving
Demobilization0.0
0.3
0.5
0.8
1.0
0 12 24 36 48 60 72 hour
prog
ress
(km)
Short Closure
Limited Access
Slower Schedule
Less Delay / Closure

CA4PRS
CA4PRS WZ Traffic ModuleInputs & Outputs (HCM Model)
CA4PRS WZ Traffic ModuleInputs & Outputs (HCM Model)
• Basic Input Data– Closure schedule.– 24-hour traffic volumes.– User’s Time values (vehicle cost)
• WZ Impact Analysis Outputs– Max queue length and max delay per closure– Total Road User Cost – WZ Capacity (Sensitivity) and Demand Management
• Road user cost (RUC) Components– Delay cost; Vehicle operation costs: Detour cost
• WZ Analysis Application– Evaluate TMP (Lane Closure) Strategies– Contract: Incentives/Disincentive & A+B

CA4PRS 14

CA4PRS 15

CA4PRS
Importing Traffic Demand
16

CA4PRS

CA4PRS

CA4PRS
Lane Closure Charts
19

CA4PRS
Work Zone Capacity
20
CA4PRS
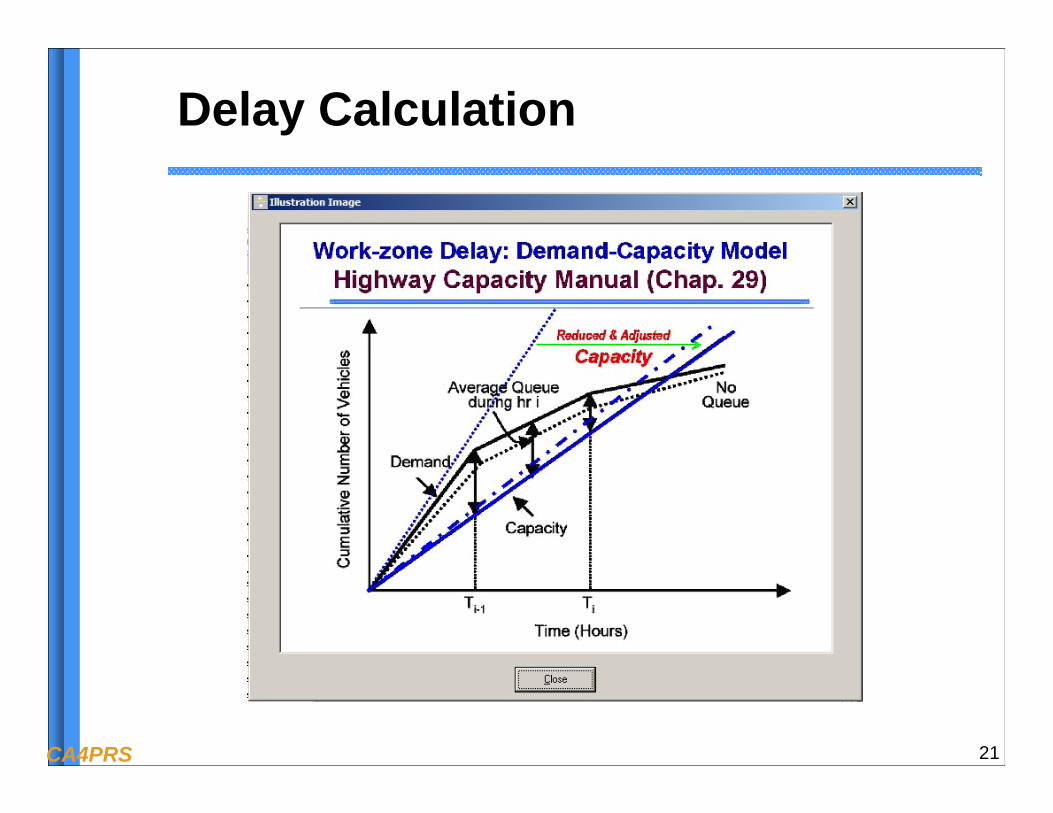
Delay Calculation
21

CA4PRS
Outputs: Summary of Results
22

CA4PRS
Output: Hourly Traffic Patterns
23

CA4PRS
Output: Lane Required
24

CA4PRS
Example - Sensitivity Analysis on Demand Management
Scenarios Demand Control Maximum Delay
Maximum Queue
Daily User Cost
Total User Cost
Scenario 1 No show 0 %Detour 0 % 57 min 3.3 miles $ 71K $ 8.2M
Scenario 2 No show 5 %Detour 5 % 37 min 2.6 miles $ 41K $ 4.7M
Scenario 3 No show 10 %Detour 10 % 24 min 1.9 miles $ 19K $ 2.2M
25
Scenario 1
Scenario 2
Scenario 3

CA4PRS 26
I-15 Devore PCC Reconstruction Project, 2005I-15 Devore PCC Reconstruction Project, 2005
10 lane-mile of PCC Pavement were Rebuilt TWO 9-day closures (Non-stop Construction)
Saved $8M Agency Cost!It would take 10 month of Nighttime Closures

CA4PRS
I-15 Devore WZ Capacity: Full-closure Dynamic Lane Configuration Using QCMB
I-15 Devore WZ Capacity: Full-closure Dynamic Lane Configuration Using QCMB

CA4PRS 28
I-15 Devore Pre-construction Analysis CA4PRS Schedule-Traffic-Cost Comparison
TotalClosures
ClosureHours
Max.Delay(Min)
Delay (RUC)Cost ($M)
AgencyCost ($M)
TotalCost ($M)
One RoadbedContinuous (24/7) 2 400 80 5.0 25.0 30.0
72-Hour WeekdayNon-stop 8 576 50 8.0 26.0 34.0
55-Hour WeekendExtended 16 880 80 14.0 27.0 41.0
9-Hour NighttimeClosures 230 2,100 50 7.0 31.0 38.0
8-Hour NighttimeClosures 300 2,400 20 3.0 33.0 36.0
7-Hour NighttimeClosures 410 2,900 10 1.0 35.0 36.0
ConstructionScenario
ConstructionSchedule
CostWZ Traffic Delay
CA4PRS 29
Yes,70%
No,30%
Before- construction After-construction
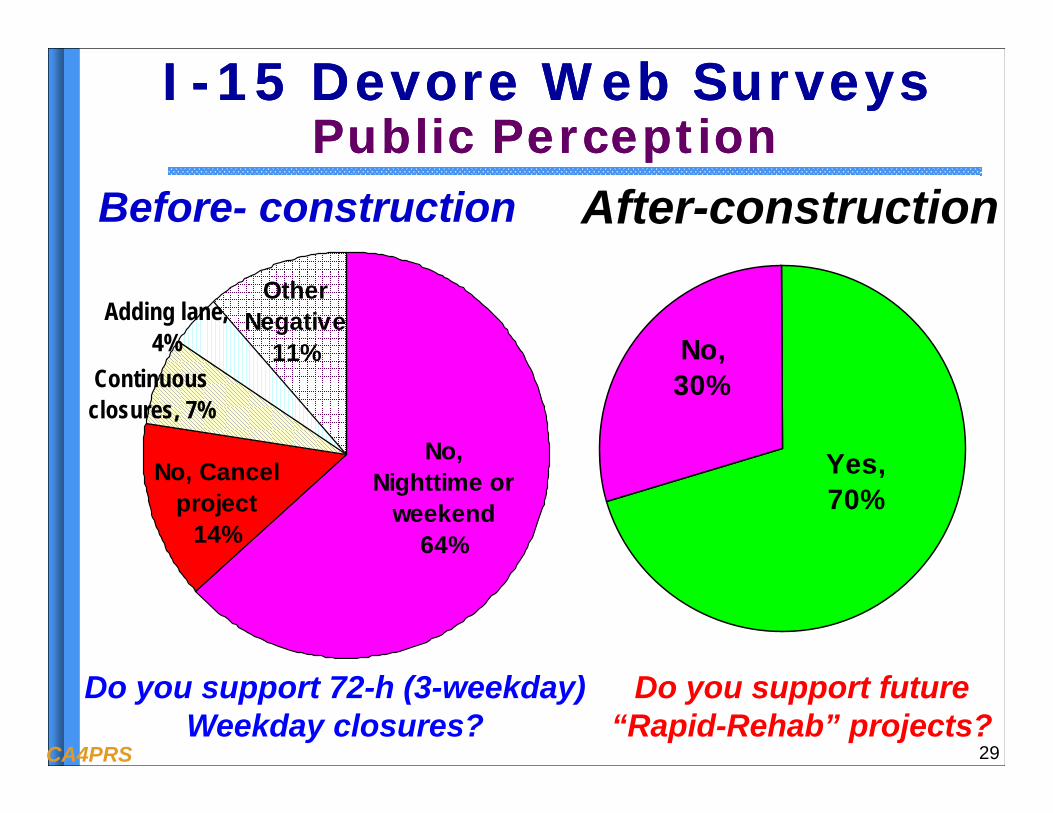
I-15 Devore Web SurveysPublic Perception
I-15 Devore Web SurveysPublic Perception
Do you support future “Rapid-Rehab” projects?
OtherNegative
11%
No,Nighttime or
weekend64%
No, Cancelproject
14%
Adding lane,4%
Continuousclosures, 7%
Do you support 72-h (3-weekday) Weekday closures?

CA4PRS 30http://www.dot.ca.gov/hq/research/roadway/ca4prs/index.htmhttp://www.dot.ca.gov/hq/research/roadway/ca4prs/index.htm
CA4PRS on Caltrans WebCA4PRS on Caltrans Web

CA4PRS 31
CA4PRS Download and InstallationCA4PRS Download and Installation
http://www.dot.ca.gov/hq/research/roadway/ca4prs/index.htm
1st
2nd
ID: CA4PRSPW: SPTC

CA4PRS 32
More Information?More Information?
• Contacts – Dr. E.B. Lee: UC Berkeley-ITS
• (510) 665-3637; [email protected]– Dr. Chang Mo Kim: UC Davis
• (530) 752-4886; [email protected]– Ken Jacoby: FHWA Asset Management
• (202) 366-6503; [email protected]
– Siva Nadarajah: FHWA Turner-Fairbank Highway Research Center
• (202) 493-3147; [email protected]