constraints to profitability of smallholder dairy farmers
TRANSCRIPT
Developing Country Studies www.iiste.org
ISSN 2224-607X (Paper) ISSN 2225-0565 (Online)
Vol.5, No.7, 2015
11
Constraints to Profitability of Smallholder Dairy Farmers in
Nyeri South Sub-County, Kenya
Dr. Francis Ofunya Afande, PhD., FCIM (UK).
Dedan Kimathi University of Technology,P.O. Box 657,10100, Nyeri Kenya
Ichaura Jeremiah Wachira
P.O Box 34, Othaya, Kenya
Abstract
Aims: The purpose of the study was to investigate the constraints to profitability of small holder dairy farmers in
Nyeri South Sub-county. The study was guided by the following specific objectives; to establish the production
methods used by smallholder dairy farmers and their impact in profitability in Nyeri South Sub-county, to
examine how the cost of production affects profitability of smallholder dairy farmer, to establish how
government policy interventions in the dairy market influence the profitability of smallholder dairy farmers and
to find out social economic factors that affect profitability of smallholder dairy farmers.
Study design: The study employed a descriptive research design.
Place and duration of the study: The target population for the study included all the dairy farmers in Nyeri South
Sub-county and took a period of three months.
Methodology applied: Simple random sampling and stratified technique were used to select a sample of 131
farmers. The data was collected using questionnaires. A pilot study was used to determine the validity and
reliability of the questionnaires.
Analysis: The data was analyzed using descriptive statistics. Relationships between independent variables and
the dependent variable were established using regression analysis. The Statistical Package for Social Science
(SPSS) was applied.
Results: The study found that that there was a statistically significant relationship (F=19.68, P<0.05) between
Production methods, Production costs, Social Economic Factors, Government Policy and profitability of
smallholder dairy farmers. Socio-economic factors had the greatest effect on profitability with a unit increase of
social economic factors resulting in a 29.6% increase in profitability. Changes in production methods, production
costs, socio-economic factors and government policy explain 56.1% of profitability of small scale dairy farmers.
Conclusions: The researchers concluded that population growth and increased land fragmentation coupled with
mixed farming practices have seen fodder production lowering. This forces the farmers to highly rely on
expensive manufactured feed and thus reducing their incomes.
Recommendations: The researchers recommended that dairy farmers should use better husbandry practices to
improve production and reduce cost. Dairy farmers can improve access to land through leasing. The government
should make capacity building programmes more accessible to dairy farmers as well as improve their support
services to them. These would promote production and income in the dairy sector hence dairy farmers’
profitability in the sector.
Keywords: Artificial Insemination, Brokers, Dairy Farming, Extension Officers, Fodder, Productivity,
Profitability/ Return, Zero Grazing
1 INTRODUCTION
1.1 Background
Constraints to the small holder dairy farming in high potential areas of Kenya are related to high human
population and subsequent pressure on the land. As a result, dairy cattle are reared under zero or semi zero
grazing. Dairy farming involves the rearing of cows and goats, camels and sheep for milk production. Small
holder dairy farmers rely on dairy products for domestic and commercial purposes. Based on a definition from
Porter (2008), “profitability in this study is defined as the ability of a milk producer to achieve sustainable
business growth while earning at least the opportunity cost of management.” Thus a producer is considered
competitive if positive returns to land are earned. The Kenya Dairy Board (KDB) was established in 1958 under
the Dairy Act Cap 336 with the mandate to efficiently and sustainably promote, regulate and develop the dairy
industry in Kenya. It was also established to provide control and regulate milk sale to ensure hygiene and
cleanliness and quality for consumers. The dairy sector contributes 3.5% of the national GDP, and 14% of the
agricultural GDP (GOK, 2008). This makes it a significant sector whose growth and development is of national
importance. According to Kenya Dairy Board report (2006) demand for milk was projected to rise by 15% to 5.8
billion litres and supply at 5 billion litres, per year leaving a deficit of 800 million litres and efforts need to be
made to increase production.
The government in assisting the farmers started the Kenya cooperative creameries (KCC) which
Developing Country Studies www.iiste.org
ISSN 2224-607X (Paper) ISSN 2225-0565 (Online)
Vol.5, No.7, 2015
12
bought milk from farmers over the years but was unable to serve the farmers adequately and at times did not pay
the farmers. Thus the farmers stopped their supply to KCC, and a lot of milk went to waste. In 1992 the dairy
sector was liberalized and other processors moved in to fill the gap in the dairy industry in Kenya. A good
example is Brookside Dairy Ltd which has been consistent in buying Farmers milk. Prior to policy change in
2004, informal vendors (mobile milk traders bar vendors, transporters) were not officially recognized and were
frequently harassed, as powerful milk players sought to protect their interests and share.
The dairy policy now clearly recognizes the Small Scale Milk Vendors (SSMVs) and contains specific
measures to promote them including development of low cost technologies. Liberalization also created the
middlemen who bought raw milk from farmers in rural areas and then transported it to towns to sell to
consumers. Thus the farmers’ access to the market has been curtailed and milk prices are dictated by the sellers.
Actually 70% of the total milk market is controlled by the informal sector with the balance handled by the formal
market channels. Thus the level of value addition of milk is low since the informal market is characterized by
direct sale of raw milk to consumers.
According to statistics Republic of Kenya (2008) there were about 3.5 million cattle in Kenya. 75% of
Kenya’s total milk production is dominated by smallholder producers. Most of them are found in rural areas
characterized by poor infrastructural, communication and marketing networks. Dairy production is a major
activity in the livestock sector and an important source of livelihood for about 600,000 small scale farmers.
The dairy farmers have over the years remained in poverty and low living standards which has affected
their contribution to the national economy and their individual development. The processing of milk has not
developed in Kenya with only a few players in the sector, thus the level of value addition at the local level is
very low causing the low incomes and impeding on the growth of the industry. Raw milk fetches very low farm-
gate prices and worse even is the determination of the price by middlemen. Although Kenya dairy sector has a
significant contribution to the national economy, household incomes and food security, the industry faces a
number of technical, economic and institutional problems in milk production, processing and marketing. These
constraints affect the ability of the sector to participate and compete in domestic and regional markets. Nyeri
South Sub-county is in Nyeri South County, in central Kenya. It is situated 150km north of Nairobi, Kenya’s
capital city and comprises of Chinga north and south, Iriaini, Karima, Mumwe and Mahiga divisions. The
District covers an area of 184.2 square kilometres with most of it being arable land. 82% of the residents depend
on agriculture with the main activities/production being tea, coffee and dairy. The dairy sector here is composed
predominantly of small holder dairy farmers who sell their raw milk to either the formal or informal market.
There is only one dairy cooperative society in the area namely Othaya Dairy Cooperative Society,
established in 1964, with 23 staff, and a registered membership of 11263 farmers of whom only 1303 are active
members today. The cooperative collects and markets the farmers’ raw milk as well as creating access to credit
facilities of A.I. services, animal feeds and veterinary services. The dairy cattle population in the district is 17890,
with ninety seven percent (97%) improved breeds Kenya Agriculture Productivity Assistance Programme,
(KAPAP, 2010). Milk production is 17228.16 million kg per annum, with a total value of about Kshs. 348
million. Of late dairy goat sub sector has become crucial in the dairy industry, and there are now 1136 dairy
goats producing 199440kgs of milk.
1.2 Statement of the Problem
Dairy industry is dynamic and plays an important economic and nutrition role in the lives of many people.
Almost every household in Nyeri South Sub-county has at least one or two dairy cows. Nyeri South Sub-county
has 19,613 households. However, the dairy farmers have not fully enjoyed the returns from dairy farming, as
they have remained low over the years. This has affected their profitability in the dairy industry and the
agricultural sector at large. This study therefore sought to investigate the causes of this scenario with a view of
providing information and recommend possible interventions that can be taken in order for the industry to
provide steady and sufficient revenues in Nyeri South Sub-county.
1.3 Purpose of the Study
The purpose of the study was to establish the constraints to the profitability of smallholder dairy farmers in Nyeri
South Sub-county.
1.4 Objectives of the Study
The study was guided by the following objectives:
(i) To establish the production methods used by smallholder dairy farmers and their impact on profitability
in Nyeri South Sub-county.
(ii) To assess the effect of cost of production on the profitability of smallholder dairy farmers
(iii) To evaluate social- economic factors and their effect on the profitability of smallholder dairy farmers
(iv) To analyse Government policy interventions on the dairy market and their influence on the profitability
Developing Country Studies www.iiste.org
ISSN 2224-607X (Paper) ISSN 2225-0565 (Online)
Vol.5, No.7, 2015
13
of smallholder dairy farmers.
1.5 Research Questions
The study sought answers to the following research questions:
(i) How do production methods used by smallholder dairy farmers affect their profitability in Nyeri South
Sub-county?
(ii) How does the cost of production affect the profitability of smallholder dairy farmers?
(iii) How do social- economic factors affect the profitability of smallholder dairy farmers?
(iv) How do government policy interventions in the dairy market influence the profitability of smallholder
dairy farmers?
1.6 Significance of the Study
The dairy farming sub sector is an integral part of Kenya’s economic activities because it provides income, food
and employment to the people. Profitability to farmers is crucial in ensuring continuity and if streamlined, it can
provide steady and sufficient revenues and income to farmers, their families and all stakeholders. The study was
therefore highly beneficial to farmers as it enumerated the main challenges in the industry and possible
interventions.
It is hoped that the government may use the study information when setting dairy sector policies. With
the new constitutional dispensation and creation of the county government, the people of Nyeri county, and
especially Nyeri South Sub-county will find it important in the establishment and allocation of resources. Further
the dairy farmers would be able to get relevant information regarding the sector on challenges and possible
interventions. Manufacturers would also benefit from the study which presented the status of farmers, their
potential and the market situation. The researchers and academicians could also use the information for reference
material, comparison and future research in the industry.
1.7 Scope and limitations of the study
1.7.1 Scope of the study
The research focused on constraints inhibiting the profitability of smallholder dairy farmers in Nyeri South Sub-
county, which has an area of 184.2km2. The study was mainly focusing on the dairy production of cattle and
goats by smallholder dairy farmers, the major suppliers of milk in Kenya. The study narrowed down to the four
major factors affecting the dairy sector which were the most prevalent after the baseline survey carried on local
farmers in Nyeri South Sub-county. These were production methods, production costs, social economic factors
and government’s policies on markets.
1.7.2 Limitations of the study
The study was limited to truthfulness and correctness of information provided by the farmers who were the
respondents in the study. Some farmers were afraid of revealing details about their dairy farming especially the
proceeds. To avoid this limitation affecting the findings of the study, the researcher sought consent from the
participants and assured them of confidentiality of their information. Nyeri South sub-county covers a large area
and the researcher would not have made to cover the entire area by himself therefore the researcher hired two
enumerators to assist in data collection. Some areas in the study area were quite remote and inaccessible
especially during rainy days, in order to access such areas, the researcher hired motor cycles which could easily
access treacherous areas.
2 LITERATURE REVIEW
2.1 Introduction
This chapter presents details on previous researches undertaken and covers the theoretic review, the critical
review, the research gaps and the study framework.
2.2 Smallholder dairy farming
2.2.1 Dairy Farming
Dairy farming has been practiced in Kenya since time immemorial. Dairy farming is the activity of rearing cows
and goats, sheep and camels in order to produce milk. Most dairy farmers are small holders and keep a few cows
and goats. Awino (2009), categorizes the milk farmers into three, the small scale producers SSP, who rear less
than three animals, middle scale producers (MSP), who rear between three and six animals and the large scale
producers (LSP) who rear more than seven animals. The large scale producers are financially stable and heavily
invest in the dairy farming and mostly have large tracts of land or purchase animal feed in large quantities and
store them in silages and thus enjoy competitive advantage in the industry. They can also manage to market their
products individually, fetching good unit prices and income. Middle scale producers are also able to market their
products but upon joining together.
Developing Country Studies www.iiste.org
ISSN 2224-607X (Paper) ISSN 2225-0565 (Online)
Vol.5, No.7, 2015
14
2.2.2 Dairy Farming Value Chain
The value chain, known as value chain analysis, is a concept from business management that was first described
and popularized by Porter (1985). The value chain framework quickly made its way to the forefront of
management thought as a powerful management tool for strategic management. It is a useful comprehensive tool
envisaging various interlocking stages involved from taking a good or service from raw materials to production
and then to the consumers, with the goal of value maximization at minimal cost. Maximizing the core value
activities within the dairy chain would enhance dairy farmers’ profitability. The core activities are activities
within the inbound stage of the dairy value chain and which include: Provision of farm inputs, selection of good
cattle breeds, provision of animal feeds, drugs and proper milk handling practices. This means training of the
dairy farmers on clean milk production at farm level. Noted further, was that the dairy farmers lack knowledge
on how to handle milk especially at the milking stage and poor hygiene of milk jars used during milking process.
This affects the quality of milk as a result of bacteria that contaminates the milk causing rejects at the collection
points. For Michael Porter’s value chain to be effective in the producer owned groups there is need to include
external support activities that are outside the milk value chain. There’s thus need for embracing newly imported
business drivers. Expanding the value chain ensures that no potential strategic activity is forgotten and no
opportunities for enhancing value overlooked.
2.2.3 Dairy Farming Profitability There are 15 measures of profitability in the dairy sector according to Diane, Polson, Oelker & Gary (2008)
based on 10 major areas namely; Rate of production, cost control, capital efficiency, profitability, liquidity,
repayment schedule, solvency, mission, maintain family’s living standard and motivated labour force among
others.
Phillip (2011), accords on competitive analysis of the Netherlands and Dutch dairy Cluster Micro
economics of Profitability. In Netherlands, the dairy cluster dominates and is one of the most productive and
export- oriented in the world. The high level of productivity is driven by sophisticated domestic and
neighbourhood demand and competition, technological innovation, high regulatory standards and a skilled
workforce.
Profitability is ability to offer products and services that meet the quality standards of the local and
world markets at prices that are competitive and provide adequate returns on the resources employed or
consumed in producing them. To dairy farmers it involves the ability to produce quality goods that are valuable
in the local and international market (Barney & Hasterly, 2008).
The above authors further describe the Value, Rare, Imitable and Organization (VRIO) framework as a
good tool to examine the internal environment of an enterprise. It stands for four questions one must ask about a
resource or capability to determine its competitive potential. These involves the question of; value –does a
resource enable a firm to exploit an environmental opportunity and or neutralize an environmental threat; the
question of rarity- is a resource currently controlled by only one or a small number of competing firms? Are the
resources to make products rare; the question of immutability - do firms without a resource face a cost
disadvantage in obtaining or developing it? Is what a firm doing difficult to imitate; the question of organization-
are the firm’s other policies and procedures organized to support the exploitation of its valuable, rare and costly
to imitate resources? If the resources are not valuable, there is competitive disadvantage and where they are
valuable and not rare; there is competitive parity (equality), but when they are valuable, rare, not imitable, and
organized, there is competitive advantage. Vertical integration promotes value chain economics. Value chain for
dairy industry emanates from seed companies and crop farmers, then to dairy farmers for milk production then to
dairy processors and lastly to the consumer. Vertical integration enhances competitive advantage.
Baltenweck (2010) alludes that the evaluation to which extent local dairy producers compete against
imported products is to calculate the imported price of products. Import parity in the case of milk is calculated by
starting with the world prices for Whole Milk Powder (WMP) and adding it to costs of transport to local markets
and the cost of transformation into liquid milk. To compare with farm gate prices, the cost of local milk
collection is deducted from the reconstructed liquid milk costs. This then presents the import parity price of milk
at farm gate, directly comparable to the prices received by farmers. If the import parity price is lower than farm
gate price local producers have difficulty competing because consumers are likely to prefer the lower cost import.
If the import parity price is higher than the farm price, local producers may be competitive, as their milk is
cheaper than imports. However, these price comparisons ignore differences in quality, which should be kept in
mind. Quantified value added hour of labour put into dairy farming is also a competitive measure of dairy
farmers profitability. If the return on labour is higher than average local wage rate, then the farming system can
afford to pay competitive wages and should be sustainable from the labour standpoint. Average local wage in
developing countries is in Hours.
2.2.4 Milk Production Features Milk production is generally low during cold and dry months and high during the wet and warm months. These
seasonal variations in production can lead to the generation of seasonal surpluses and shortages of fresh milk and

Developing Country Studies www.iiste.org
ISSN 2224-607X (Paper) ISSN 2225-0565 (Online)
Vol.5, No.7, 2015
15
other dairy products resulting in a fluctuating producer price due to the price in- elastic nature of supply and
demand for milk.
Commercial milk production is highly capital intensive and requires the use of specialized production
inputs. Milk is also harvested daily and is highly perishable, locking the producer into a choice of selling,
processing or dumping of the milk. This makes adjustment to changes in milk prices, as well as changes in input
prices difficult as in the short run, resources used in the production of milk are fixed. This increases the risk
borne by producers in producing milk who may feel government support is necessary to help manage the price
risk (Siggel, 2006).
Price in-elasticity of demand and supply for fresh milk is another feature. Fresh milk is traditionally
considered a basic necessity implying a price in- elastic demand. Due to the perishable nature of milk and its
frequency of harvest and the distance from the market, milk producers are left with few alternatives buyers for
their milk. The oligopolistic(few large buyers and many small sellers) market structures means that milk
producers have reduced bargaining power in the market and may often not be in a position to negotiate more
favourable prices.
Karanja (2006) alludes that smallholder dairy production systems range from stratified cut and carry
systems, supplemented with purchased concentrate feed, to free grazing on unimproved natural pasture in the
more marginal areas. Upgraded dairy breeds tend to be kept in stall feeding units, cross breed cattle in semi zero
grazing systems, and Zebu cattle in free grazing systems. The production systems are influenced by the agro
climatic characteristics of areas, land productivity potential and prevalence of animal diseases.
Some of the constraints to increased milk production in Kenya have been identified as seasonality in
production, inadequate quantity and quality of feeds, including limited use of manufactured cattle feeds, lack of
good quality animal husbandry and farming practices. Poor access to breeding, animal health and credit services
and high cost of Artificial Insemination (AI) services are other constraining factors. In some areas, dairy
producers are faced with the problem of poor infrastructure (roads and electricity), inadequate milk collection
and marketing systems, poor interaction and priority setting between research, extension and training and limited
farmers’ involvement in the output market, hence reducing the incentive to increase milk production.
The national economy growth rate has increased from 0.2% in 2000 to the current 4.6% in 2012, with a
high of 6%, in 2006 (ROK, 2009). This showed an increase in per capita income which was an assurance of
improved marginal propensity to consume and a reliable market for the dairy sector. Thus it is the expectation
that dairy sector value chain has improved and farmers are earning sufficient returns, processors making
sustainable incomes and the consumers enjoying quality milk and milk by-products.
The small scale producers however produce low quantities of milk in Kenya (Waithaka, 2010). The
methods used by most farmers are traditional where the sheds are poorly built and maintained. Some cows sleep
on their own dropping and the sheds not frequently cleaned. According to Kamau (2011), for good husbandry,
the shed should be cleaned at least twice a day. The feeding pens should be hygienically constructed so that food
is not contaminated. The sheds are mostly not large enough to allow movement of the animals especially where
zero grazing is practiced, and the drainage and washing sheds are inadequate or lacking. Owuor (2010) opines
that the type of breeds especially cows are traditional and their milk production quantity is low. They do not
produce over 10 kilograms of milk. Thus the farmer has to rear at least two animals to increase quantity
produced. However, this brings added responsibility and work. There has been of late effort by the government
to encourage farmers improve their breeds in order to produce more milk without actually increasing the number
of animals. The new high breed cows produce a higher amount of milk some producing 40 kgs each. Further
noted is the low conception rate of A.I. system.
A survey by Kenya Agriculture Productivity Assistance Programme, (KAPAP, 2010) showed that due
to many challenges the farmers are earning only ten percent (10%) of the possible income with the current
production data as; average household herd size is two cows; average production per cow 6-8 kgs per day; milk
price range kshs 18-27 and many small poorly managed groups in marketing. However a farmer can rear just one
or two such cows and get more income by improving the breed and produce higher quantities of milk, rather than
have many to produce the same quantity of milk. The farmer has less work and equitably less and better use of
scarce land and resources.
According to the Ministry of Livestock Development report (2009), the government in collaboration
with the German government has introduced the dairy goat project through the organization German Technical
Assistance Organization (GTZ). The project has introduced the exotic high breed goat which produces better
quantity of milk, which is more nutritious and useful for health reasons. Goat milk is medically recommended to
persons with blood pressure and diabetic problems. This has increased milk production in the region and added
to family incomes.
The government has also set up the National Agriculture and Livestock Extension Programme which
trains and equips extension officers who visit farmers and impart relevant information regarding farming
activities. Feeding is another setback to dairy farmers. Normally the animals are fed on grass, maize stalks, bran,
Developing Country Studies www.iiste.org
ISSN 2224-607X (Paper) ISSN 2225-0565 (Online)
Vol.5, No.7, 2015
16
maize germ and molasses. Maize germ, bran and molasses are manufactured foods that are very costly. Few
farmers can afford to purchase the required rations regularly, reducing quantity of milk produced. Knowledge on
best feeding practices is low and so feeding is inadequate and preference is given to fodder grown in the farms
because it is cheaper (Owuor, 2010).
Changes in weather patterns and effects of global warming have negatively affected crop production
leaving the farmers with no option but to greatly rely on expensive manufactured feeds. The manufactured foods
are more nutritious and healthy for the animals but due to their high costs are unaffordable, and thus most
farmers maintain low quality and unhealthy animals. ROK (2009), asserts that the government through the
Ministry of Agriculture Livestock (MoLD) and the Ministry of Agriculture (MoA) have established concerted
efforts to improve the dairy sub sector. Extension officers have been trained to educate farmers on new and
better ways of practicing dairy farming. The dairy board was established to regulate the sector. It was mandated
to oversee that the sale of milk consumed by human beings was hygienic and clean in order to prevent diseases
and exploitation of consumers by sellers through use of harmful additives and even water. The extension services
have not been a success story and farmers are known to continually complain that the extension officers seldom
visit their farms. Further the allocation of government funding in the respective ministries for extension services
and facilities has been generally low.
Jerry (2011), relates that in as much as new institutional arrangements (since liberalization in 1992) in
milk marketing have offered expanded business opportunities and enhanced competition, they do offer major
challenges to growth and development of the dairy industry. The informal marketing channels not only expose
the public to health and hygiene related risks but also continues to stifle the growth of the formal milk sector.
Wambugu (2010) explains that the internal production, processing and marketing constraints have also
played a major role in diminishing the profitability of the dairy sector in Kenya. This has occurred to the extent
where milk powder imports are said to out-compete locally produced milk. This development only constraint the
domestic milk market but also closes opportunities for expanding export markets. Middlemen, brokers have
highly infiltrated the sector due to high demand of milk. Actually 80% of the milk marketers are in the informal
sector and the brokers buy milk from farmers at low prices and transport it to towns raw. About 56% of milk
produced is sold raw to consumer at high prices. The Kenya cooperate creameries KCC was set up as a parastatal
to market milk from farmers. It has over the years been performing poorly and was even closed in the late 90s
due to mismanagement and embezzlement by employees.
In 1992, the dairy market was liberalized and other new processors created notably the Brookside
Dairy Ltd, Meru Central Farmers Dairy and Limuru dairy ltd. By the end of year 2000, there were around 1500
licensed informal milk traders. Four main categories are recognized by KDB, producers, milk bars, mini dairies
and cottages. The traders pay an annual fee ranging from sh. 1000 to sh 5000. These brought competition and
milk prices improved and provided a more stable alternative market for the product. They have managed to
ensure regular income to farmers though comparatively low in regard to cost of production.
2.3 Empirical Review
2.3.1 Production Methods
Tacken et al. (2009) opine that the high cost of feed coupled with poor knowledge of husbandry best practices
hindered optimal production and earnings for dairy farmers. Land fragmentation due to population growth
reduced available acreage for dairy feeds production. Further, the extensive growth of cash crops, believed to be
higher and stable income earners leave little parcels of land for dairy food. He further states that the production
of food crops is more prioritized by farmers in ensuring food security. Further cash crops like tea and coffee are
believed to be income generating practices in the farms, and mostly preferred to milk production. The culture of
land inheritance and usage has caused high land fragmentation which has greatly reduced land available for
fodder production. This has also forced farmers to rear just one or two cows reducing milk production capacity
and income.
Kirimi (2010) relates that although small holder farmers contribute over fifty six (56%) of total
marketed milk production, the productivity per animal in these farms remains low. Erratic payments, low farm
gate prices and low sales as a proportion of total production especially evening milk, unreliable market outlets
and limited access to veterinary and A.I. services are all factors that negatively affect productivity and
performance of the dairy subsector. However, the potential for increasing dairy productivity in the country and
especially the small holder dairy farmer remains great. The average yield per cow in small holder farms is as low
as one thousand three hundred (1,300) litres per year as compared to the best world practice of four thousand to
six thousand (4,000 - 6000) litres. Increased productivity will not only enhance farm incomes, nutrition, and
reduced poverty but will also supply dairy products to the growing urban populations.
Dairy sector profitability program managed by United States Aid for International Development
(USAID) Kenya was established in 2008 to help transform the Kenya Dairy Sector, into a globally competitive,
regional market leader. Its overall goal was increasing small holder household income through the sale of quality

Developing Country Studies www.iiste.org
ISSN 2224-607X (Paper) ISSN 2225-0565 (Online)
Vol.5, No.7, 2015
17
milk and milk products, as well as eliminating inefficiencies and lower production and processing costs through
the dairy value chain while at the same time ensuring that Kenyan milk can meet domestic and international
quality standards. Its success however has not been realized as the program has not reached completion which is
end of year 2012.
2.3.3 Production Cost
Kamau (2011) opines that due to high fuel and raw materials costs the manufactured animal feeds have become
very expensive. This has led to the sale of low quality feeds by manufacturers, which contribute to low milk
production. However the few manufacturers who produce quality feeds sell them at very high prices which are
unaffordable to most small scale farmers which erodes their margins. Raihan (2008), further relates that reliance
on climate for production of feeds affects the dairy farmers. When there are adverse weather conditions, cow
feed grown in the farms is reduced, forcing the farmers to rely on commercial feeds whose prices have escalated.
Kiama (2009) further elucidates that knowledge of alternative highly nutritious plants among the small
holder farmers is low. For example, Lucerne, leucaena, caliangra and gliricidia is low. These alternative and
highly nutritious feeds could improve milk yields and reduce feeding costs and thus enhance farmer’s income.
He further notes that the low extension services and poor reading culture coupled with inaccessibility of
information facilities and documents has contributed to low production capacity and poor quality of milk,
reducing its value and also income to farmers and their competiveness in the agricultural sector.
Shitanda (2004) notes that all kinds of animal diseases can easily contribute to the low level of milk
production among farmers. Diseases like mastitis, pneumonia, foot and mouth, bovine tuberculosis to name but a
few of them affect the animal’s health and milk production. The cost of veterinary drugs, services, vaccines and
pesticides is high and whose application procedures are not well known by most farmers. Further noted is the
high cost of dairy equipment like milking salves, which would enhance safety and quality of milk, an important
competitive edge in the dairy sector.
Ondwasi (2009) reveals that artificial insemination is one way of improving the stocks and increasing
milk production. The traditional method of the local bull hardly improves the breed. However, to get the best
semen is very expensive, prohibiting most farmers from accessing them. Also knowledge on keeping the best
type of breed is low. It is recommended that the Friesian, Jersey and Ganze breeds of cows should be kept in
order to produce large quantities of milk.
2.3.4 Social Economic Factors Nderitu (2009), notes that in practicing mixed farming, which cushions the farmer from lack of food, acreage
under dairy farming is low. The actual size of land to most farmers is small due to fragmentation as families
enlarge and population increases. Thus, the dairy farmers have problems with growing enough fodder for the
animals. Gloria (2008) is of the opinion that the high demand for milk in Kenya urban areas has been affected by
high costs of production, processing, transportation (poor infrastructure), inaccessibility to affordable credit and
high cost of electricity, among others. Other constraints were due to lack of good Information Communication
Technology (ICT), poor governance and lack of an enabling environment, low value addition which translates
into poor prices in markets. It is therefore imperative to facilitate the sub sectors growth and development,
reduce production cost and increase value addition for milk products with the hope of increasing trade
subsequent economic growth.
Nyoro (2006), reveals that access to both internal and external financial sources have an influence to
the size and growth dynamics. High entry costs may indicate the presence of profit in the industry and may serve
as entry barriers for new entrants as they may lack financial capacity to invest in technology and expansion. A
social cultural belief of small holder’s farmers is that dairy farming is a subsistence undertaking which affects
their investment levels in dairy ventures. Most rural farmers perceive other agricultural products like coffee and
tea as more lucrative and concentrate investments in them. This is supported by government through marketing
boards that are able to export the products and fetch good prices for them. The dairy industry lacks government
supported marketing boards and as such marketing is poorly integrated and left to the private sector control. The
liberalization of the dairy market has thus cut-failed the contribution of dairy farmers and reduced their
profitability in the agricultural sector.
2.2.5 Government Policy on Markets
Since 1967 the Kenyan government has pursued the policy on import substitution (ROK, 2009). After a foreign
exchange crisis in 1971, the government introduced strict import control rather than devolution of the currency.
This created a boost to local production of necessary goods, milk included. Republic of Kenya’s (2009) statistics
show that the current status of poor incomes from dairy farming has created poverty with available statistics
showing poverty levels on the increasing trend. In 2008, it was estimated at 56% up from 48% in 1992 and 52%
in 1997. This normally results to decreased food security, inadequate access to basic social amenities like health
and education, unemployment, escalations of insecurity, lawlessness and general economic decay. The
government further advocates that small holder farmers and the government should strengthen the cooperative
movement, building and construction, education and trade to promote the dairy sub sector. Investment in new
Developing Country Studies www.iiste.org
ISSN 2224-607X (Paper) ISSN 2225-0565 (Online)
Vol.5, No.7, 2015
18
farming technologies and post- harvest storage facilities like coolers can be accessed through the Cooperative
Initiative, (Central Province Investment Initiative (CEPII) report, January 2010). According to the director of
livestock development the government will initiate aggressive marketing and look for ways to link the farmers
directly with the various markets. In the policy the government also promised to increase finances to farmers. It
stated that the government will increase the budgetary allocation to dairy activities and facilitate investors in the
entire dairy value chain.
Ondwasi (2009), explains that agriculture extension service in Kenya is centralized and its structure
and budgetary flow of funds is also hierarchical and bureaucratic within the governments’ ministry of agriculture
(MoA). The high proportion of the extension budget over the entire ministry’s budget can be attributed to
renewed donor funding of development projects in Kenya since 2003. Extension and research being a core
function have generally received the lion’s share of the ministry’s annual budget averaging 70%. While this can
be viewed positively, its composition is worrying.
Lack of extension at close proximity in households causes low productivity and worse still, agricultural
extension agents are not keen to serve low productivity rural areas with even infrastructural barriers. The
national agricultural sector extension policy Framework National Agriculture and Livestock Extension
Programme (NALEP) has been established by the ministry of Agriculture which was meant to encourage more
participation in the provision of extension services to farming community in Kenya (ROK, 2009).
Porter (2008), created the five competitive forces that shape strategy in marketing of products and
services. They include ; Existing competitive rivalry between supplies; Threat of new market entrants;
Bargaining power of buyers; Power of suppliers ;Threat of substitute products (including technological
change) .They are relevant in the dairy industry and can enhance profitability of the sector players. Njarui (2010),
opines that the farmers’ major concern in milk marketing is the development of marketing channels that
minimize losses and maximize returns. This calls for value addition in the whole supply chain which ensures
better products and services to the consumers. Value addition to an otherwise standard product or service can
provide viable entrepreneurial opportunities. This is true in many economic sectors but may be more apparent in
the dairy sub sector in Kenya with impressive production volumes, yet little is done towards value addition.
Odhiambo (2008) reveals that Kenya has also become a signatory to various regional integration
initiatives within Africa including Common Market for East and Southern Africa (COMESA). It also participates
in the Cotonou Partnership Agreement (CPA) involving African, Caribbean and Pacific (ACP) group of
countries and the European Union (EU). These are areas of potential dairy products market which when well
undertaken can improve revenues and incomes to dairy farmers. Gelan (2011), explains that milk processing and
marketing is limited by several factors. Primary marketing faces infrastructure bottleneck caused by poor road
networks and lack of appropriate cooling and storage facilities. Transportation of milk is affected from farms to
collection centres and from collection centres to processors. Lack of electricity in some areas has hindered the
establishment of cooling plants; as a result, during the flush period of March to June, there is surplus milk that
cannot be absorbed in the domestic market. Dairy sector in Kenya requires adoption of new emerging
innovations in order to stay afloat, giving the market more of what they want, when and where they want it with
an objective of increasing market share. This includes new products, new markets, and new technology, new
organizations formed to promote their industry and new methods of promoting milk drinking aimed at
cultivating a milk drinking culture in Kenya
2.4 Research Gaps
The review on cost of production was not conclusive since the knowledge level of farmers and knowledge of
good husbandry practice in dairy production needs to be established as well as its effects and impact on dairy
farming. As regards social economic effects, it would be imperative to establish those of particular regions due to
diversity in terms of resource endowments and social culture. The reviews noted government contributions like
extension services program. However the policies and programs in the dairy sector were inadequately
enumerated and the knowledge by farmers of them was overlooked. The lack of involvement of the smallholder
dairy farmers in the output market limits their capacity to influence pricing and market share. This was not
adequately reviewed by the past researchers and a further study is crucial.
Developing Country Studies www.iiste.org
ISSN 2224-607X (Paper) ISSN 2225-0565 (Online)
Vol.5, No.7, 2015
19
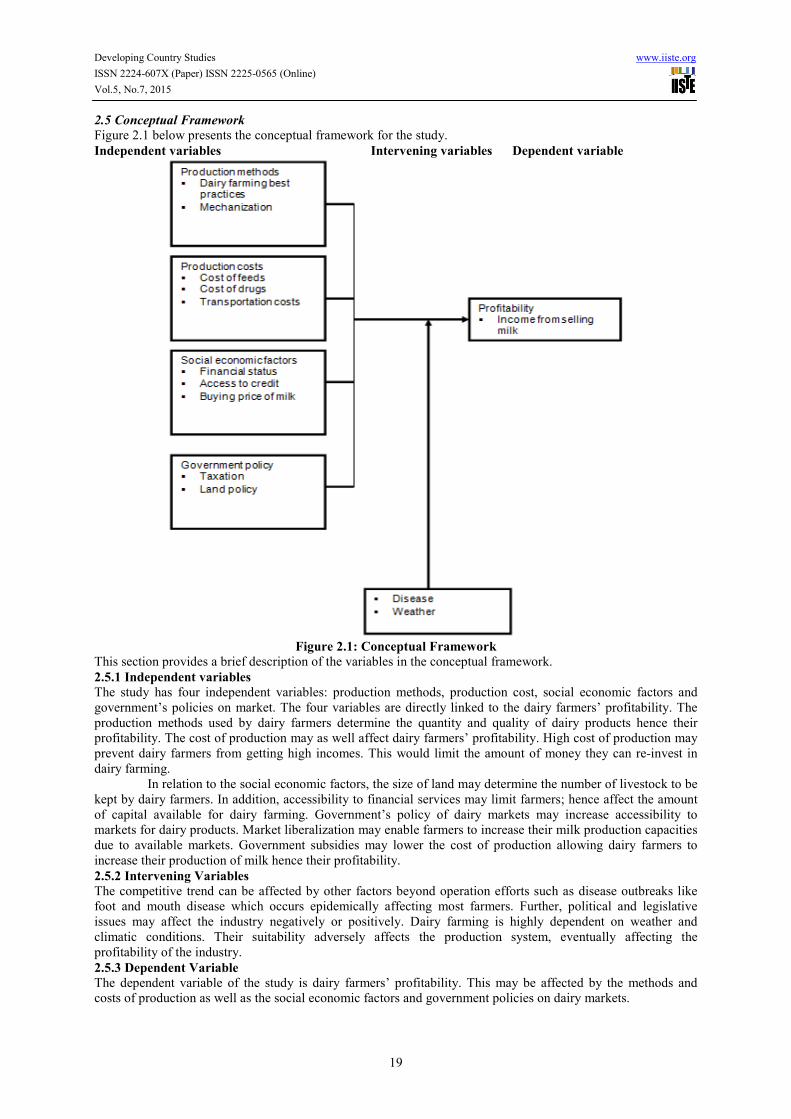
2.5 Conceptual Framework
Figure 2.1 below presents the conceptual framework for the study.
Independent variables Intervening variables Dependent variable
Figure 2.1: Conceptual Framework
This section provides a brief description of the variables in the conceptual framework.
2.5.1 Independent variables
The study has four independent variables: production methods, production cost, social economic factors and
government’s policies on market. The four variables are directly linked to the dairy farmers’ profitability. The
production methods used by dairy farmers determine the quantity and quality of dairy products hence their
profitability. The cost of production may as well affect dairy farmers’ profitability. High cost of production may
prevent dairy farmers from getting high incomes. This would limit the amount of money they can re-invest in
dairy farming.
In relation to the social economic factors, the size of land may determine the number of livestock to be
kept by dairy farmers. In addition, accessibility to financial services may limit farmers; hence affect the amount
of capital available for dairy farming. Government’s policy of dairy markets may increase accessibility to
markets for dairy products. Market liberalization may enable farmers to increase their milk production capacities
due to available markets. Government subsidies may lower the cost of production allowing dairy farmers to
increase their production of milk hence their profitability.
2.5.2 Intervening Variables
The competitive trend can be affected by other factors beyond operation efforts such as disease outbreaks like
foot and mouth disease which occurs epidemically affecting most farmers. Further, political and legislative
issues may affect the industry negatively or positively. Dairy farming is highly dependent on weather and
climatic conditions. Their suitability adversely affects the production system, eventually affecting the
profitability of the industry.
2.5.3 Dependent Variable
The dependent variable of the study is dairy farmers’ profitability. This may be affected by the methods and
costs of production as well as the social economic factors and government policies on dairy markets.
Developing Country Studies www.iiste.org
ISSN 2224-607X (Paper) ISSN 2225-0565 (Online)
Vol.5, No.7, 2015
20
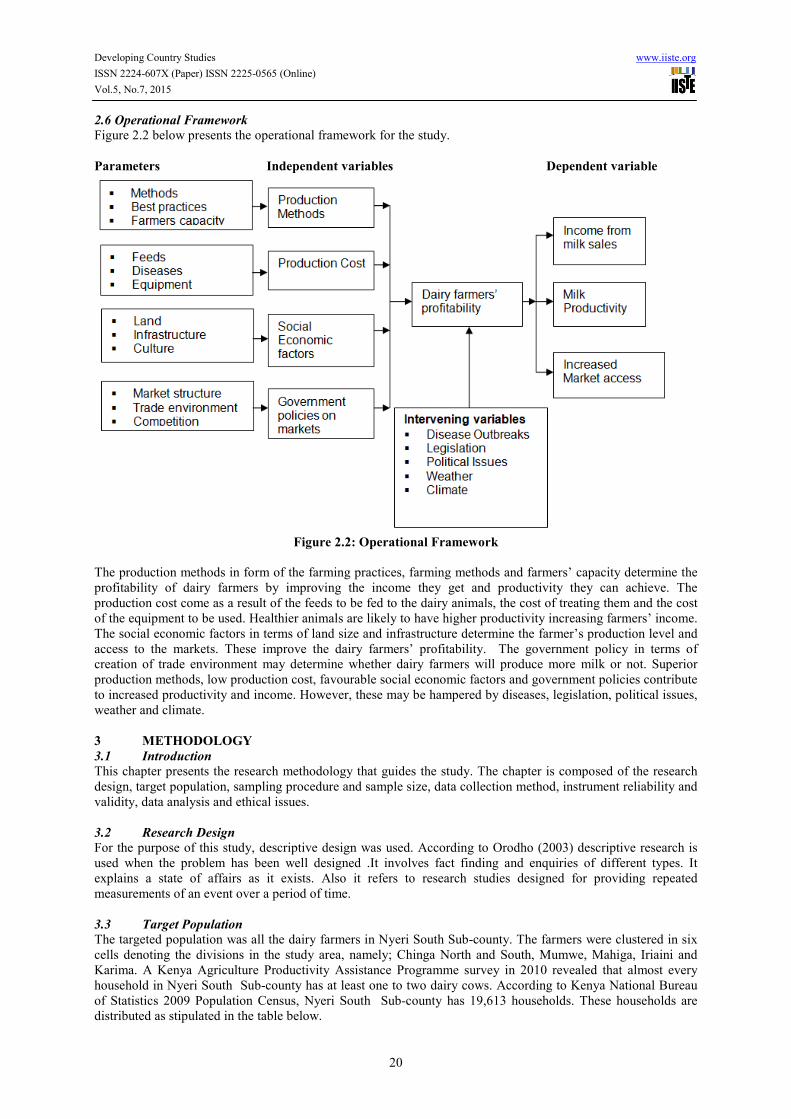
2.6 Operational Framework
Figure 2.2 below presents the operational framework for the study.
Parameters Independent variables Dependent variable
Figure 2.2: Operational Framework
The production methods in form of the farming practices, farming methods and farmers’ capacity determine the
profitability of dairy farmers by improving the income they get and productivity they can achieve. The
production cost come as a result of the feeds to be fed to the dairy animals, the cost of treating them and the cost
of the equipment to be used. Healthier animals are likely to have higher productivity increasing farmers’ income.
The social economic factors in terms of land size and infrastructure determine the farmer’s production level and
access to the markets. These improve the dairy farmers’ profitability. The government policy in terms of
creation of trade environment may determine whether dairy farmers will produce more milk or not. Superior
production methods, low production cost, favourable social economic factors and government policies contribute
to increased productivity and income. However, these may be hampered by diseases, legislation, political issues,
weather and climate.
3 METHODOLOGY
3.1 Introduction
This chapter presents the research methodology that guides the study. The chapter is composed of the research
design, target population, sampling procedure and sample size, data collection method, instrument reliability and
validity, data analysis and ethical issues.
3.2 Research Design
For the purpose of this study, descriptive design was used. According to Orodho (2003) descriptive research is
used when the problem has been well designed .It involves fact finding and enquiries of different types. It
explains a state of affairs as it exists. Also it refers to research studies designed for providing repeated
measurements of an event over a period of time.
3.3 Target Population
The targeted population was all the dairy farmers in Nyeri South Sub-county. The farmers were clustered in six
cells denoting the divisions in the study area, namely; Chinga North and South, Mumwe, Mahiga, Iriaini and
Karima. A Kenya Agriculture Productivity Assistance Programme survey in 2010 revealed that almost every
household in Nyeri South Sub-county has at least one to two dairy cows. According to Kenya National Bureau
of Statistics 2009 Population Census, Nyeri South Sub-county has 19,613 households. These households are
distributed as stipulated in the table below.

Developing Country Studies www.iiste.org
ISSN 2224-607X (Paper) ISSN 2225-0565 (Online)
Vol.5, No.7, 2015
21
Table 3.1: Target Population
Division Dairy Farmers Population
Chinga North 2,714
Chinga South 3,266
Mumwe 1,049
Mahiga 3,322
Iriaini 6,670
Karima 2,592
TOTAL 19,613
Source: Kenya National Bureau of Statistics (KNBS), 2009
3.4 Sampling Procedure
To come up with the sample size befitting the study, the researcher used the stratified random sampling method,
basing it on the administrative boundaries of the six divisions of Nyeri South Sub-county. According to
Mugenda and Mugenda (2003), stratified random sampling refers to the sampling technique in which the
universe is grouped into cells and sub-cells in the most representative form. The selection becomes free of
personal bias since the investigator does not exercise his discretion of preference in the choice of items.
The systematic sampling was used based on the equal-probability method. In this approach,
progression through the list is treated circularly, with a return to the top once the end of the list is passed. The
sampling starts by selecting an element from the list at random and then every kth
element in the frame is selected,
where k, the sampling interval (sometimes known as the skip): this is calculated as:
Where n is the sample size, and N is the population size (Kothari, 2004). Using this procedure each
element in the population has a known and equal probability of selection.
For this study, the researcher selected the 150th
smallholder farmer in Nyeri South sub-county District,
in each of the six divisions and as such was able to ascertain a sample size of 131 respondents for the study.
Table 3.2: Sample Size
Division Dairy Farmers Population Sample size
Chinga North 2,714 18
Chinga South 3,266 22
Mumwe 2,592 17
Mahiga 3,322 22
Iriaini 6,670 45
Karima 1,049 7
Total 19,613 131
3.5 Data Collection Method
For the purpose of this study, a semi structured questionnaire was used to collect primary data from the
respondents. Questionnaires were more appropriate when addressing sensitive issues and they provided
anonymity as well as reduce reluctance or deviation from respondents. Then they were administered to a number
of respondents at the same time and maintained uniformity from one measurement to another .The
questionnaires were administered through drop and pick method. The respondents were given 14 days to
complete answering questionnaires and thereafter the questionnaires were gathered after stipulated response time
was over. The questionnaires had open and closed ended questions accompanied by a list of possible alternatives
from which the respondents selected the answer that they indicated best suited their response. These was easier
to administer and economical in terms of time and money, and were easy to analyse as they were in an
immediate usable form. However, they limited the researcher’s choices and the respondents were compelled to
answer questions to the researcher’s alternatives.
3.6 Reliability and Validity
3.6.1 Pilot Study
The researcher conducted a pilot study in Tetu Sub-County a month before the actual study to test on the
reliability and validity of the research instrument in providing relevant data befitting the study. Orodho (2005)
recommends that the number of participants in the pre-test should be equal to 10% of the desired sample in the
main study. Therefore the researcher carried out a pilot study involving 13 famers in Tetu Sub-County.
3.6.2 Instruments Validity
Orodho and Kombo (2002) defined validity as degree to which results obtained from analysis of the data actually

Developing Country Studies www.iiste.org
ISSN 2224-607X (Paper) ISSN 2225-0565 (Online)
Vol.5, No.7, 2015
22
represents the phenomenon under study. In order to improve validity the researcher ensured that the research
instruments were accurate by making the necessary adjustments after conducting a pilot study and ensuring the
questions were getting the right response to measure what was intended.
3.6.3 Instrument Reliability
Reliability were also tested to enable the researcher identify misunderstandings, ambiguities and inadequate
terms in the research instruments and make the necessary adjustments so that the data collected is more reliable.
The researcher undertook a pilot study in Tetu Sub-County with a few sampled respondents to test the reliability
and validity of the research instruments. Tetu Sub-County was chosen because it borders Nyeri South Sub-
county and shares the same environmental, social and economic conditions. The study tested the internal
consistency of the instruments by computing Cronbach’s alpha to determine the reliability of the instrument. A
Cronbach’s alpha of 0.83 was obtained in the questionnaires which qualified the instruments as reliable since the
coefficient was above the recommended 0.8 and above according to (Kothari,2004).
3.7 Data Analysis
Upon collecting data the researcher analysed the information collected using a combination of methods.
Quantitative data was analysed through descriptive statistics in form of measures of central tendency. Qualitative
data was analysed through content analysis. Statistical Package for Social Sciences (SPSS) computer software
was used. In order to establish the factors affecting profitability of the small holder dairy farmers, data was
captured using the likert scale and used descriptive statistics including the standard deviation which measured
the variables and the mean deviation that measured the central tendency.
3.8 Ethical Considerations
Authorization to conduct the study was sought from Dedan Kimathi University of Technology. Government sub-
county commissioner of Nyeri South Sub-county was also informed of the study. The principle of voluntary
participation requires that people are not coerced into participating in research (William, 2006). Closely related
to the notion of voluntary participation is the requirement of informed consent. Essentially, this means that
prospective research participants must be fully informed about the procedures and risks involved in research and
must give their consent to participate. The researcher ensured that the respondents contributed willingly and
freely during the research.
4.0 RESULTS AND DISCUSSIONS
4.1 Introduction
This chapter presents the findings of the study and their discussion in relevance to the objectives and past studies
carried out in the same area. Quantitative data was analysed using SPSS version 19 for windows and was
presented in form of frequencies, means, modes and percentages. Qualitative data was presented by content
analysis. Presentation was done using tables, charts and graphs for easy yet effective communication. Data
analysis aimed to answer the following questions: (i) How do production methods used by smallholder dairy
farmers affect their profitability in Nyeri South Sub-county?; (ii) How does the cost of production affect the
profitability of smallholder dairy farmers?; (iii) How do social- economic factors affect the profitability of
smallholder dairy farmers?; and (iv) How do government policy interventions in the dairy market influence the
profitability of smallholder dairy farmers?
Response Rate: With the help of research assistants, the researcher administered 131 questionnaires.
During sorting, 11 questionnaires were rejected due to incomplete information. This left 120 questionnaires for
analysis which represents a 91.6% response rate. According to Mugenda & Mugenda (2003) a response rate of
70% and above is acceptable as representative of the sampled population.
4.2 Effects of Production Methods Used by Smallholder Dairy Farmers on Their profitability
In order to meet the first objective of the study “to establish how production methods used by smallholder dairy
farmers affect their profitability’ the research looked into the types and number of cows reared, type of grazing
methods, amount of milk produced after gestation, amount of income earned, breeding, milk harvesting methods,
milk cooling facilities and farmers knowledge on best husbandry practices.
Species of Cows and Goats Reared: Firstly, the respondents were asked to name the type of cows and goats they
reared by ticking as appropriate against listed alternatives. The responses are as summarized and presented in
table 4.1 below.
Developing Country Studies www.iiste.org
ISSN 2224-607X (Paper) ISSN 2225-0565 (Online)
Vol.5, No.7, 2015
23
Table 4.1: Cows and Goats Species Reared
Animal Species Frequency Percentage
Cow Zebu 0 0%
Fresian 82 68%
Jersey 15 13%
Ganze 8 6%
Arsher 15 13%
Total 120 100%
Goats Foundation 0 0%
Pedigree 35 47%
Intermediary 40 53%
Apex 0 0%
Total 75 100%
The findings in table 4.1 above shows that Friesian (68%) was the most reared animal among the study
participants with the Jersey (13%) coming in a distant second and no farmers reared Zebu. This is probably
because Nyeri South Sub-county has a cool and wet climate which is popular with the Friesian species of cows.
Intermediary species of goats were found to be reared by the majority (53%) of the goat keepers while
Foundation and Apex goat species were not reared by the farmers in this region.
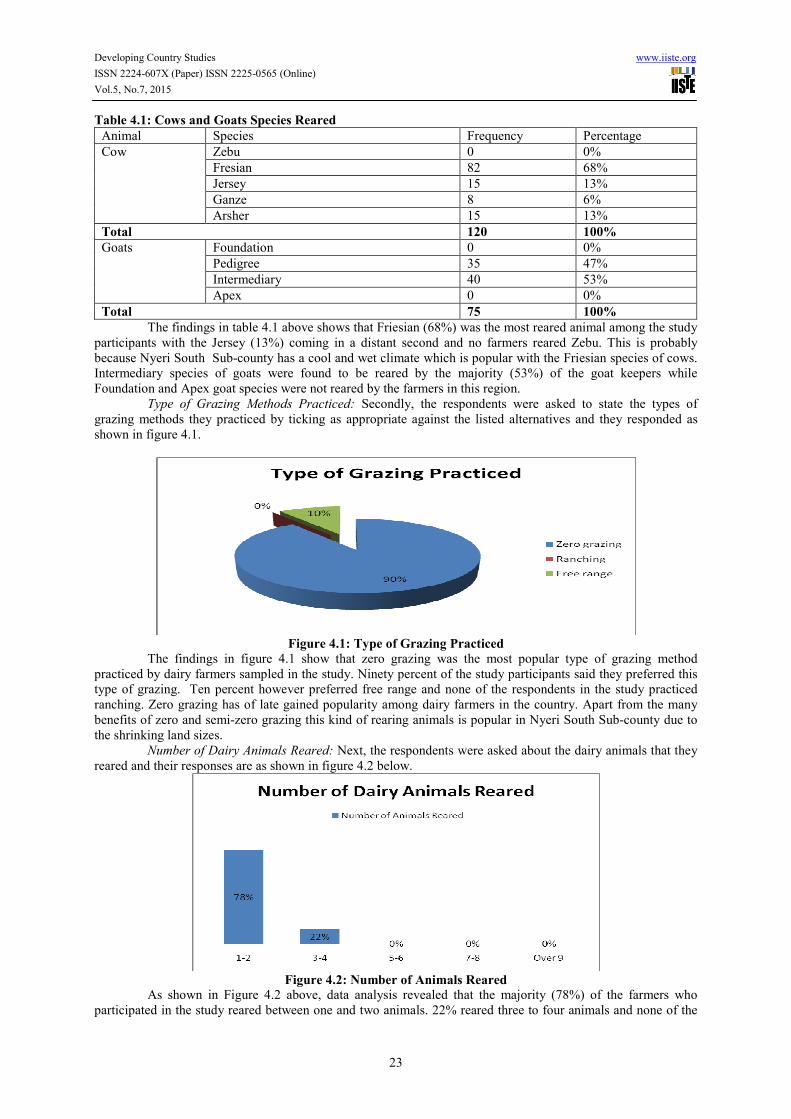
Type of Grazing Methods Practiced: Secondly, the respondents were asked to state the types of
grazing methods they practiced by ticking as appropriate against the listed alternatives and they responded as
shown in figure 4.1.
Figure 4.1: Type of Grazing Practiced
The findings in figure 4.1 show that zero grazing was the most popular type of grazing method
practiced by dairy farmers sampled in the study. Ninety percent of the study participants said they preferred this
type of grazing. Ten percent however preferred free range and none of the respondents in the study practiced
ranching. Zero grazing has of late gained popularity among dairy farmers in the country. Apart from the many
benefits of zero and semi-zero grazing this kind of rearing animals is popular in Nyeri South Sub-county due to
the shrinking land sizes.
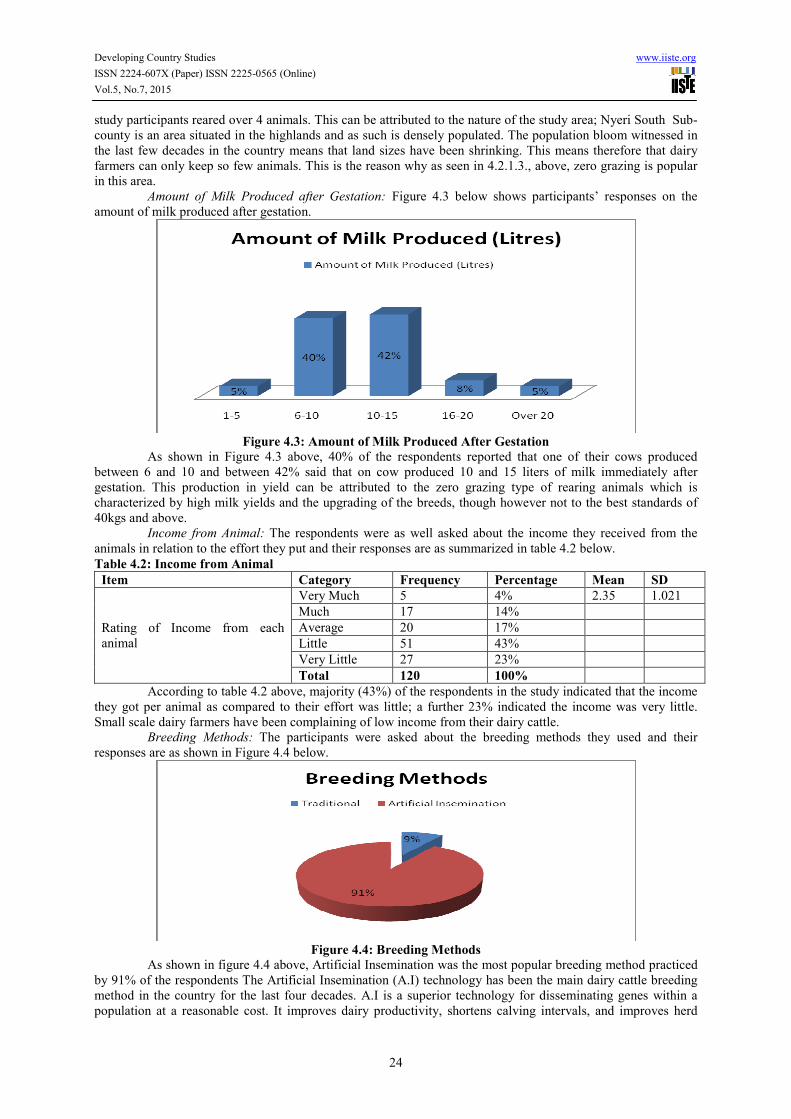
Number of Dairy Animals Reared: Next, the respondents were asked about the dairy animals that they
reared and their responses are as shown in figure 4.2 below.
Figure 4.2: Number of Animals Reared
As shown in Figure 4.2 above, data analysis revealed that the majority (78%) of the farmers who
participated in the study reared between one and two animals. 22% reared three to four animals and none of the
Developing Country Studies www.iiste.org
ISSN 2224-607X (Paper) ISSN 2225-0565 (Online)
Vol.5, No.7, 2015
24
study participants reared over 4 animals. This can be attributed to the nature of the study area; Nyeri South Sub-
county is an area situated in the highlands and as such is densely populated. The population bloom witnessed in
the last few decades in the country means that land sizes have been shrinking. This means therefore that dairy
farmers can only keep so few animals. This is the reason why as seen in 4.2.1.3., above, zero grazing is popular
in this area.
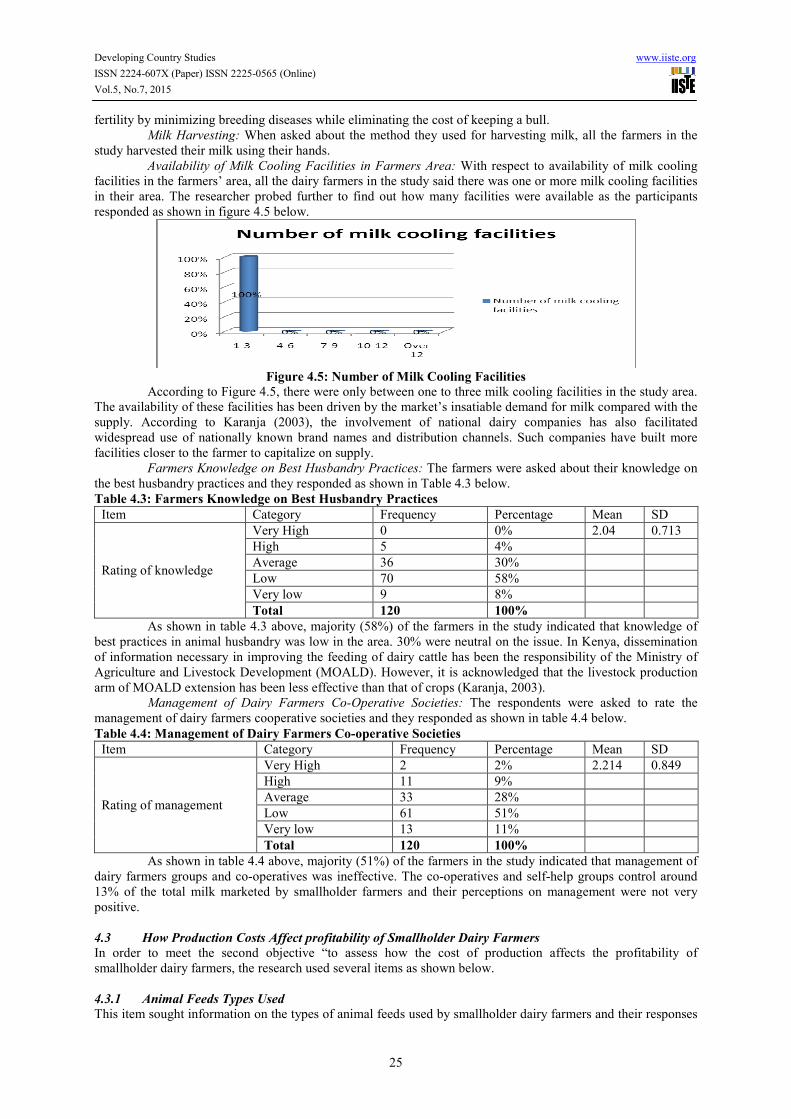
Amount of Milk Produced after Gestation: Figure 4.3 below shows participants’ responses on the
amount of milk produced after gestation.
Figure 4.3: Amount of Milk Produced After Gestation
As shown in Figure 4.3 above, 40% of the respondents reported that one of their cows produced
between 6 and 10 and between 42% said that on cow produced 10 and 15 liters of milk immediately after
gestation. This production in yield can be attributed to the zero grazing type of rearing animals which is
characterized by high milk yields and the upgrading of the breeds, though however not to the best standards of
40kgs and above.
Income from Animal: The respondents were as well asked about the income they received from the
animals in relation to the effort they put and their responses are as summarized in table 4.2 below.
Table 4.2: Income from Animal
Item Category Frequency Percentage Mean SD
Rating of Income from each
animal
Very Much 5 4% 2.35 1.021
Much 17 14%
Average 20 17%
Little 51 43%
Very Little 27 23%
Total 120 100%
According to table 4.2 above, majority (43%) of the respondents in the study indicated that the income
they got per animal as compared to their effort was little; a further 23% indicated the income was very little.
Small scale dairy farmers have been complaining of low income from their dairy cattle.
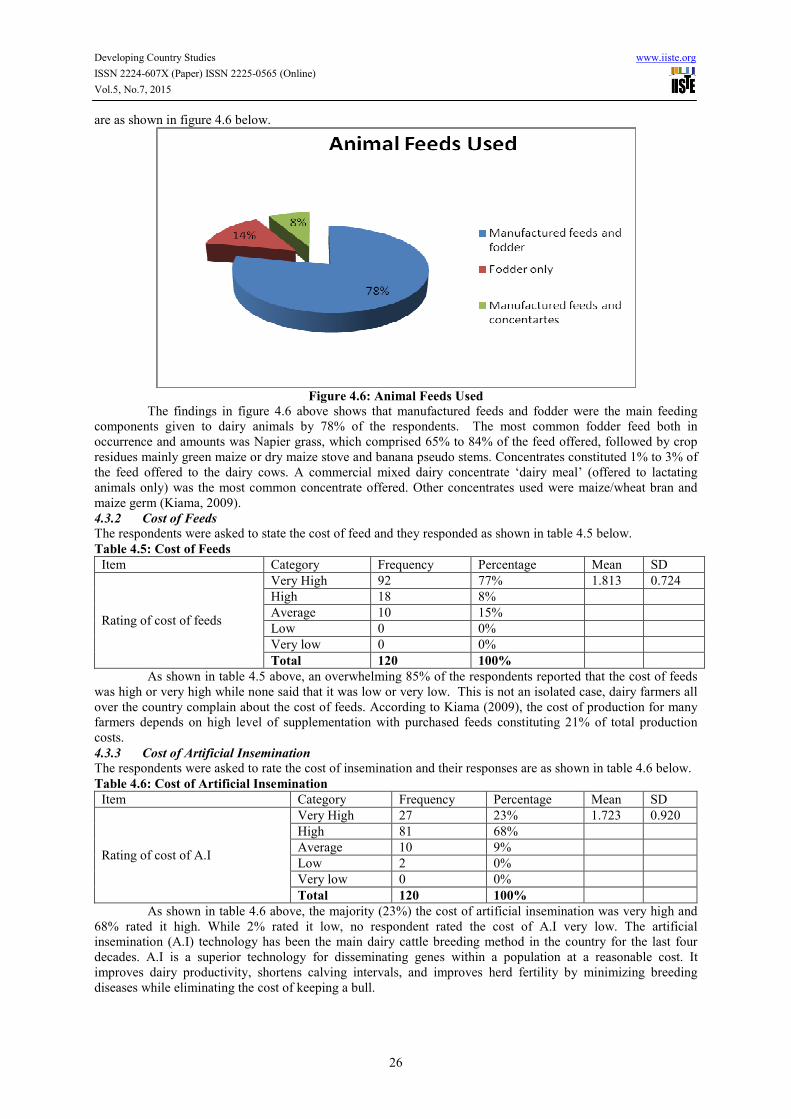
Breeding Methods: The participants were asked about the breeding methods they used and their
responses are as shown in Figure 4.4 below.
Figure 4.4: Breeding Methods
As shown in figure 4.4 above, Artificial Insemination was the most popular breeding method practiced
by 91% of the respondents The Artificial Insemination (A.I) technology has been the main dairy cattle breeding
method in the country for the last four decades. A.I is a superior technology for disseminating genes within a
population at a reasonable cost. It improves dairy productivity, shortens calving intervals, and improves herd
Developing Country Studies www.iiste.org
ISSN 2224-607X (Paper) ISSN 2225-0565 (Online)
Vol.5, No.7, 2015
25
fertility by minimizing breeding diseases while eliminating the cost of keeping a bull.
Milk Harvesting: When asked about the method they used for harvesting milk, all the farmers in the
study harvested their milk using their hands.
Availability of Milk Cooling Facilities in Farmers Area: With respect to availability of milk cooling
facilities in the farmers’ area, all the dairy farmers in the study said there was one or more milk cooling facilities
in their area. The researcher probed further to find out how many facilities were available as the participants
responded as shown in figure 4.5 below.
Figure 4.5: Number of Milk Cooling Facilities
According to Figure 4.5, there were only between one to three milk cooling facilities in the study area.
The availability of these facilities has been driven by the market’s insatiable demand for milk compared with the
supply. According to Karanja (2003), the involvement of national dairy companies has also facilitated
widespread use of nationally known brand names and distribution channels. Such companies have built more
facilities closer to the farmer to capitalize on supply.
Farmers Knowledge on Best Husbandry Practices: The farmers were asked about their knowledge on
the best husbandry practices and they responded as shown in Table 4.3 below.
Table 4.3: Farmers Knowledge on Best Husbandry Practices
Item Category Frequency Percentage Mean SD
Rating of knowledge
Very High 0 0% 2.04 0.713
High 5 4%
Average 36 30%
Low 70 58%
Very low 9 8%
Total 120 100%
As shown in table 4.3 above, majority (58%) of the farmers in the study indicated that knowledge of
best practices in animal husbandry was low in the area. 30% were neutral on the issue. In Kenya, dissemination
of information necessary in improving the feeding of dairy cattle has been the responsibility of the Ministry of
Agriculture and Livestock Development (MOALD). However, it is acknowledged that the livestock production
arm of MOALD extension has been less effective than that of crops (Karanja, 2003).
Management of Dairy Farmers Co-Operative Societies: The respondents were asked to rate the
management of dairy farmers cooperative societies and they responded as shown in table 4.4 below.
Table 4.4: Management of Dairy Farmers Co-operative Societies
Item Category Frequency Percentage Mean SD
Rating of management
Very High 2 2% 2.214 0.849
High 11 9%
Average 33 28%
Low 61 51%
Very low 13 11%
Total 120 100%
As shown in table 4.4 above, majority (51%) of the farmers in the study indicated that management of
dairy farmers groups and co-operatives was ineffective. The co-operatives and self-help groups control around
13% of the total milk marketed by smallholder farmers and their perceptions on management were not very
positive.
4.3 How Production Costs Affect profitability of Smallholder Dairy Farmers
In order to meet the second objective “to assess how the cost of production affects the profitability of
smallholder dairy farmers, the research used several items as shown below.
4.3.1 Animal Feeds Types Used
This item sought information on the types of animal feeds used by smallholder dairy farmers and their responses
Developing Country Studies www.iiste.org
ISSN 2224-607X (Paper) ISSN 2225-0565 (Online)
Vol.5, No.7, 2015
26
are as shown in figure 4.6 below.
Figure 4.6: Animal Feeds Used
The findings in figure 4.6 above shows that manufactured feeds and fodder were the main feeding
components given to dairy animals by 78% of the respondents. The most common fodder feed both in
occurrence and amounts was Napier grass, which comprised 65% to 84% of the feed offered, followed by crop
residues mainly green maize or dry maize stove and banana pseudo stems. Concentrates constituted 1% to 3% of
the feed offered to the dairy cows. A commercial mixed dairy concentrate ‘dairy meal’ (offered to lactating
animals only) was the most common concentrate offered. Other concentrates used were maize/wheat bran and
maize germ (Kiama, 2009).
4.3.2 Cost of Feeds
The respondents were asked to state the cost of feed and they responded as shown in table 4.5 below.
Table 4.5: Cost of Feeds
Item Category Frequency Percentage Mean SD
Rating of cost of feeds
Very High 92 77% 1.813 0.724
High 18 8%
Average 10 15%
Low 0 0%
Very low 0 0%
Total 120 100%
As shown in table 4.5 above, an overwhelming 85% of the respondents reported that the cost of feeds
was high or very high while none said that it was low or very low. This is not an isolated case, dairy farmers all
over the country complain about the cost of feeds. According to Kiama (2009), the cost of production for many
farmers depends on high level of supplementation with purchased feeds constituting 21% of total production
costs.
4.3.3 Cost of Artificial Insemination
The respondents were asked to rate the cost of insemination and their responses are as shown in table 4.6 below.
Table 4.6: Cost of Artificial Insemination
Item Category Frequency Percentage Mean SD
Rating of cost of A.I
Very High 27 23% 1.723 0.920
High 81 68%
Average 10 9%
Low 2 0%
Very low 0 0%
Total 120 100%
As shown in table 4.6 above, the majority (23%) the cost of artificial insemination was very high and
68% rated it high. While 2% rated it low, no respondent rated the cost of A.I very low. The artificial
insemination (A.I) technology has been the main dairy cattle breeding method in the country for the last four
decades. A.I is a superior technology for disseminating genes within a population at a reasonable cost. It
improves dairy productivity, shortens calving intervals, and improves herd fertility by minimizing breeding
diseases while eliminating the cost of keeping a bull.
Developing Country Studies www.iiste.org
ISSN 2224-607X (Paper) ISSN 2225-0565 (Online)
Vol.5, No.7, 2015
27
4.3.4 Diseases and the Cost of Production
The respondents were asked whether diseases affected their cost of production. All the farmers in the study
confirmed that at one time or another, their animals suffered from diseases. They were also asked about the
method of treating diseases and their responses were as summarized in table 4.7 below.
Table 4.7: Method of Treating Diseases
Item Category Frequency Percentage Mean SD
Treatment of
Disease
Veterinary drugs 118 98.3% 1.643 0.7784
Traditional herbs 2 1.7%
Total 120 100%
As shown in table 4.7, 98.3% of the farmers said they used veterinary drugs to treat diseases in their
animals. On the other hand, 1.7% of the respondents applied the traditional herbs in treating the dairy cow
diseases. Traditional methods have been shadowed by the modern veterinary drugs that are more effective and
accessible.
4.3.5 Rating of Effect of Diseases on Production
The respondents were asked to rate the effects of disease on production and they responded as shown in table 4.8
below.
Table 4.8: Diseases Effect on the Cost of Production
Item Category Frequency Percentage Mean SD
Rating of effect of diseases on
production
Very High 73 61% 1.505 0.610
High 28 23%
Average 9 16%
Low 0 0%
Very low 0 0%
Total 120 100%
As shown in table 4.8 above, 61% of the respondents indicated that the diseases affected very highly,
and 23% highly on the cost of production while no respondent reported that the effect of diseases on production
was either low or very low. Despite the obvious costs, disease control and treatment are a must for any dairy
farmer. Schreuder, et al.(1996) assessed the impact of veterinary interventions in terms of delivery of disease
control messages in Afghanistan. Livestock mortality in districts that received veterinary services was lower than
in districts without any veterinary services. The decreased mortality resulted from using better disease control
methods.
4.3.6 Costs of Veterinary Services and Drugs
This item sought information on the costs of veterinary services and drugs and the respondents responded as
shown in table 4.9 below.
Table 4.9: Costs of Veterinary Services and Drugs
Item Category Frequency Percentage Mean SD
Rating of effect of diseases on
production
Very High 84 70% 1.436 0.682
High 30 19%
Average 6 11%
Low 0 0%
Very low 0 0%
Total 120 100%
As shown in table 4.9 above, majority (70%) indicated that costs of veterinary services and drugs were
very high and none of the respondents reported that it was either low or very low. Despite the high costs, the
study found that most of the dairy farmers in the study endeavoured to hire the services of a veterinary. The
veterinary service was essential since the consequences of disease were more immediate and drastic than those
of poor nutrition.
4.4 How Social Economic Factors Affect Smallholder Dairy Farmers’ Profitability
This section is in line with the third objective of the study “to evaluate how social economic factors affect the
profitability of small holder dairy farmers. The research used several items in order to meet this objective.
4.4.1 Size of Land
The respondents were asked about the size of land and they responded a shown in figure 4.7 below.

Developing Country Studies www.iiste.org
ISSN 2224-607X (Paper) ISSN 2225-0565 (Online)
Vol.5, No.7, 2015
28
Figure 4.7: Size of Land
As shown in figure 4.7 above, majority (92%) of the respondents had below 3 acres and of these, 43%
had less than one acre of land and none had more than 5 acres of land. Land is a big problem in central province.
The land inheritance culture coupled within a high population bloom has led to shrinking land sizes in many
parts of central province. This has also increased the price of land to almost 500% of what it was worth a decade
ago. Due to the declining land sizes, farms are small; cattle are confined and fed through a cut-and-carry system
in which feed materials are brought to the animals (Baltenweck et al., 1998 and Staal et al., 1999).
4.4.2 Mixed Farming
When asked about the farming method they used, all the dairy farmers who participated in the study confirmed
that they employed mixed farming in their land.
4.4.3 Size of Farm where Fodder Foods are Grown
This item sought for information on the size of the farm where fodder foods are grown and the participants
responded as shown in figure 4.8 below.
Figure 4.8: Size of Farm where Fodder Foods are Grown
According to figure 4.8, a share of 49% of the respondents had between one and three acres under
fodder crops while 43% had grown the same in under an acre. None of the respondents had used more than 5
acres to grow fodder food. This is in line with the practice of mixed farming where portions are left for food
crops and also cash crops.
4.4.4 Accessibility of Financial Services
This item sought information on the way farmers rated their accessibility to financial services. Their responses
were as shown in table 4.10 below.
Table 4.10: Accessibility of Financial Services
Item Category Frequency Percentage Mean SD
Rating of accessibility of
financial services
Very High 5 4% 1.892 1.038
High 17 14%
Average 20 17%
Low 51 43%
Very low 27 22%
Total 120 100%
As shown in table 4.10, 43% of the respondents indicated that accessibility to credit was low while
only 4% reported that it was very high. This has been a problem for most farmers in the agriculture industry.
Lack of access to credit has been identified as the greatest hindrance to the growth of smallholder ventures in the
country. Banks and micro finance institutions seem not to have faith in investors in the agriculture industry,
(Owuor, 2009).

Developing Country Studies www.iiste.org
ISSN 2224-607X (Paper) ISSN 2225-0565 (Online)
Vol.5, No.7, 2015
29
4.5 How Government Policy Interventions in the Dairy Market Influences the profitability of
Smallholder Dairy Farmers
In order to meet the fourth objective “to analyse how government policy interventions in the dairy market
influences the profitability of smallholder dairy farmers, the researcher used several items as shown in the
following paragraphs
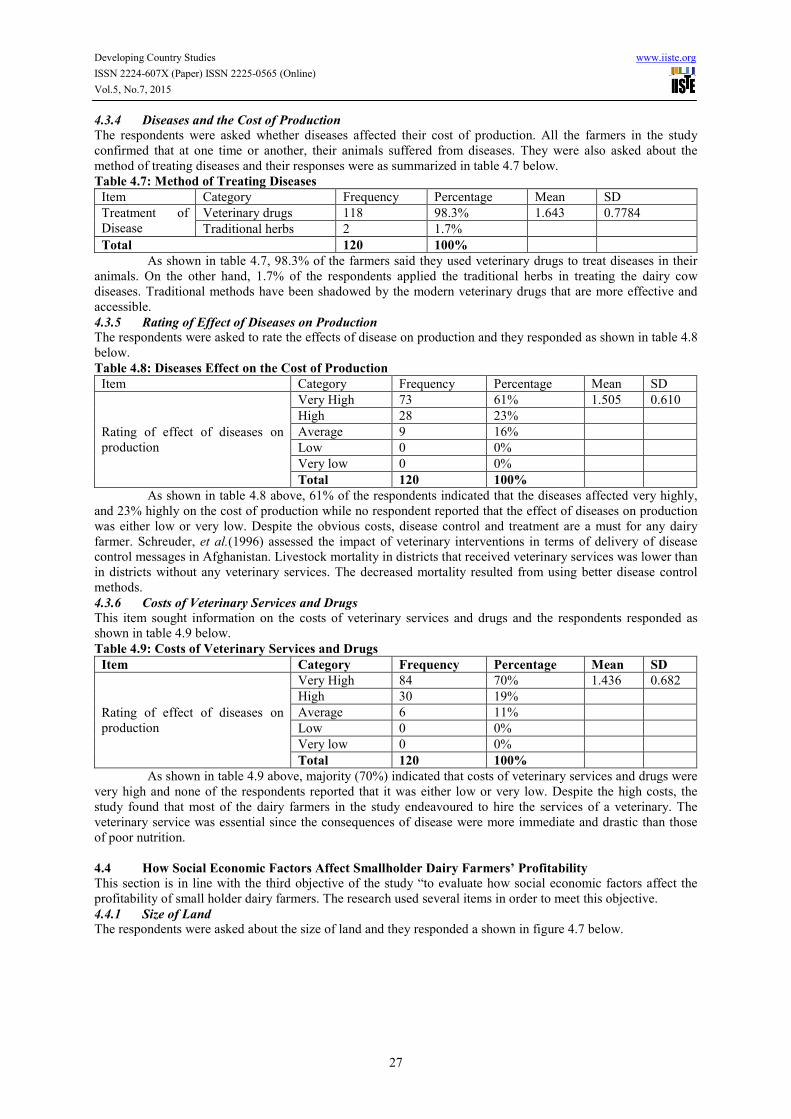
4.5.1 Governments’ Assistance to Dairy Farmers
This item sought for information on the government policy on dairy markets and the participants responded as
shown in table 4.11 below.
Table 4.11: Governments’ Assistance to Dairy Farmers
Item Category Frequency Percentage Mean SD
Rating of government’s
assistance to farmers
Very High 0 0% 1.541 0.976
High 6 5%
Average 21 18%
Low 66 55%
Very low 27 22%
Total 120 100%
As shown in table 4.11 above, 55% of the study participants indicated that the government’s assistance
to dairy farmers was low and 22% very low respectively. None of the respondents reported that the assistance
given by the government was very high. Dairy cooperatives and informal networks were the most important
sources of information to all the farmers regardless of location and wealth status.
4.5.2 Frequency of Visits by Veterinary Officers
The participants were asked about the frequency with which they received visits by the veterinary officers and
they responded as shown in figure 4.9 below.
Figure 4.9: Frequency of Visits by Veterinary Officers
According to figure 4.9, majority (62%) of the farmers in the study had visits by trained veterinary
officers in their farms once a year. The most frequent visit by veterinary officers was quarterly (3%) and none of
the participant indicated to have visits by veterinary officer monthly. Farmers’ knowledge of dairy developments
on best husbandry practices thus remains low, as well as their profitability.
4.5.3 Provision of Information
This part sought for information on how often information regarding dairy farming was provided to farmers by
the government and the participants responses were summarized in table 4.12 below.
Table 4.12: Provision of Information
Item Category Frequency Percentage Mean SD
Rating of provision of
information
Very often 0 0% 1.403 0.863
Often 0 0%
Rarely 43 36%
Very rarely 58 48%
Never 19 16%
Total 120 100%
As shown in table 4.12, (48%) of the dairy farmers reported that provision of information on dairy
farming by the government was very rare. None of the respondents reported that they were provided with
information on dairy farming often or very often. In Kenya, dissemination of information necessary in improving
the feeding of dairy cattle has been the responsibility of the Ministry of Agriculture and Livestock Development
(MOALD). However, it is acknowledged that the livestock production arm of MOALD extension has been less
effective than that of crops (Baltenweck et al., 1998). The sources of technical information to small-scale dairy
farmers in Kenya’s central highlands are not well documented and their effectiveness has not been assessed.
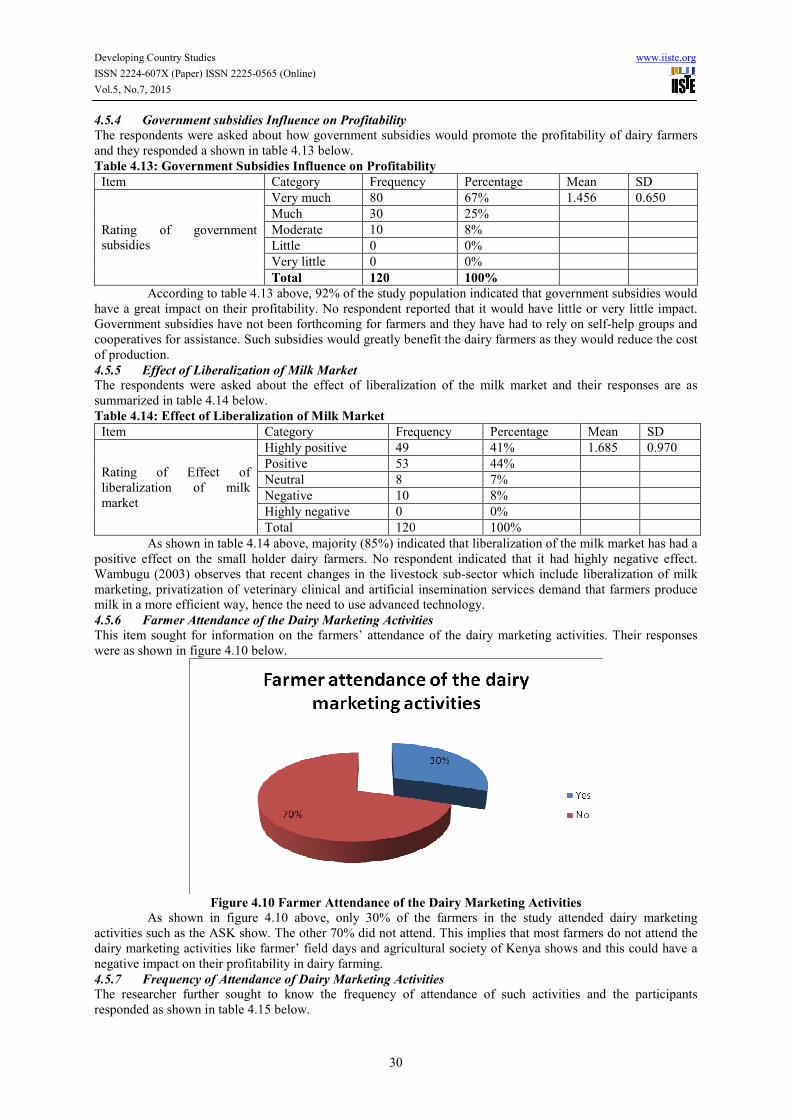
Developing Country Studies www.iiste.org
ISSN 2224-607X (Paper) ISSN 2225-0565 (Online)
Vol.5, No.7, 2015
30
4.5.4 Government subsidies Influence on Profitability
The respondents were asked about how government subsidies would promote the profitability of dairy farmers
and they responded a shown in table 4.13 below.
Table 4.13: Government Subsidies Influence on Profitability
Item Category Frequency Percentage Mean SD
Rating of government
subsidies
Very much 80 67% 1.456 0.650
Much 30 25%
Moderate 10 8%
Little 0 0%
Very little 0 0%
Total 120 100%
According to table 4.13 above, 92% of the study population indicated that government subsidies would
have a great impact on their profitability. No respondent reported that it would have little or very little impact.
Government subsidies have not been forthcoming for farmers and they have had to rely on self-help groups and
cooperatives for assistance. Such subsidies would greatly benefit the dairy farmers as they would reduce the cost
of production.
4.5.5 Effect of Liberalization of Milk Market
The respondents were asked about the effect of liberalization of the milk market and their responses are as
summarized in table 4.14 below.
Table 4.14: Effect of Liberalization of Milk Market
Item Category Frequency Percentage Mean SD
Rating of Effect of
liberalization of milk
market
Highly positive 49 41% 1.685 0.970
Positive 53 44%
Neutral 8 7%
Negative 10 8%
Highly negative 0 0%
Total 120 100%
As shown in table 4.14 above, majority (85%) indicated that liberalization of the milk market has had a
positive effect on the small holder dairy farmers. No respondent indicated that it had highly negative effect.
Wambugu (2003) observes that recent changes in the livestock sub-sector which include liberalization of milk
marketing, privatization of veterinary clinical and artificial insemination services demand that farmers produce
milk in a more efficient way, hence the need to use advanced technology.
4.5.6 Farmer Attendance of the Dairy Marketing Activities
This item sought for information on the farmers’ attendance of the dairy marketing activities. Their responses
were as shown in figure 4.10 below.
Figure 4.10 Farmer Attendance of the Dairy Marketing Activities
As shown in figure 4.10 above, only 30% of the farmers in the study attended dairy marketing
activities such as the ASK show. The other 70% did not attend. This implies that most farmers do not attend the
dairy marketing activities like farmer’ field days and agricultural society of Kenya shows and this could have a
negative impact on their profitability in dairy farming.
4.5.7 Frequency of Attendance of Dairy Marketing Activities
The researcher further sought to know the frequency of attendance of such activities and the participants
responded as shown in table 4.15 below.
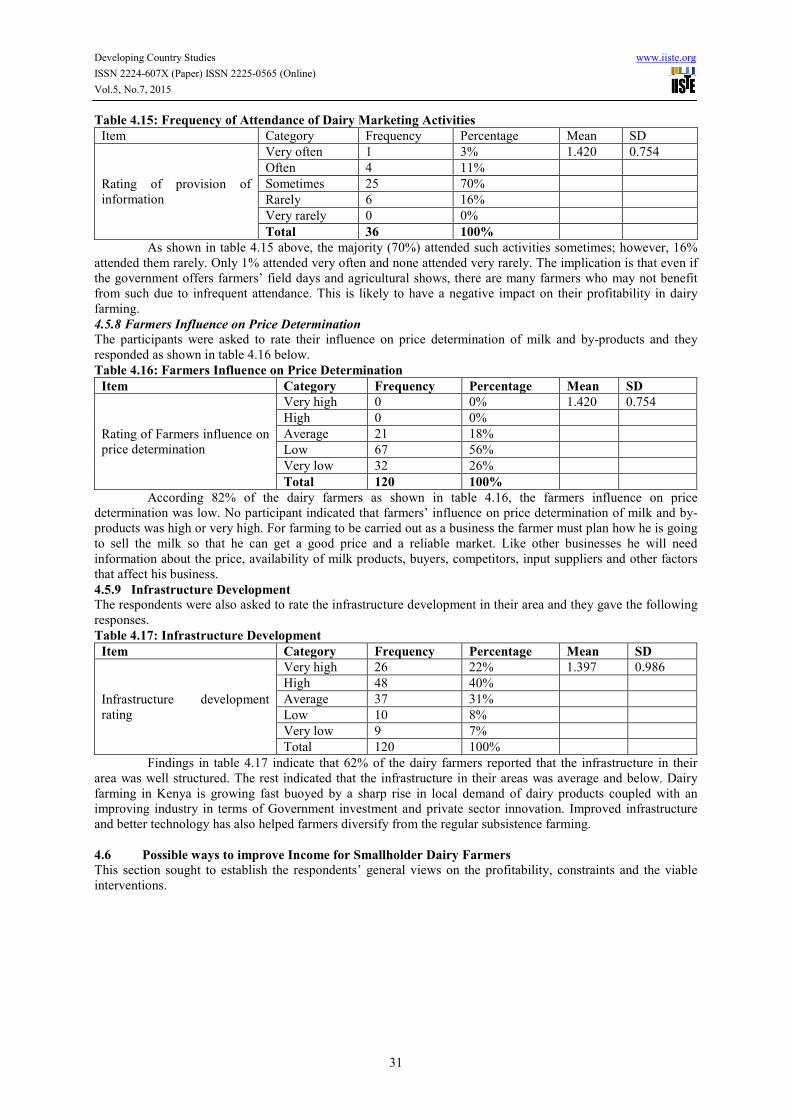
Developing Country Studies www.iiste.org
ISSN 2224-607X (Paper) ISSN 2225-0565 (Online)
Vol.5, No.7, 2015
31
Table 4.15: Frequency of Attendance of Dairy Marketing Activities
Item Category Frequency Percentage Mean SD
Rating of provision of
information
Very often 1 3% 1.420 0.754
Often 4 11%
Sometimes 25 70%
Rarely 6 16%
Very rarely 0 0%
Total 36 100%
As shown in table 4.15 above, the majority (70%) attended such activities sometimes; however, 16%
attended them rarely. Only 1% attended very often and none attended very rarely. The implication is that even if
the government offers farmers’ field days and agricultural shows, there are many farmers who may not benefit
from such due to infrequent attendance. This is likely to have a negative impact on their profitability in dairy
farming.
4.5.8 Farmers Influence on Price Determination
The participants were asked to rate their influence on price determination of milk and by-products and they
responded as shown in table 4.16 below.
Table 4.16: Farmers Influence on Price Determination
Item Category Frequency Percentage Mean SD
Rating of Farmers influence on
price determination
Very high 0 0% 1.420 0.754
High 0 0%
Average 21 18%
Low 67 56%
Very low 32 26%
Total 120 100%
According 82% of the dairy farmers as shown in table 4.16, the farmers influence on price
determination was low. No participant indicated that farmers’ influence on price determination of milk and by-
products was high or very high. For farming to be carried out as a business the farmer must plan how he is going
to sell the milk so that he can get a good price and a reliable market. Like other businesses he will need
information about the price, availability of milk products, buyers, competitors, input suppliers and other factors
that affect his business.
4.5.9 Infrastructure Development
The respondents were also asked to rate the infrastructure development in their area and they gave the following
responses.
Table 4.17: Infrastructure Development
Item Category Frequency Percentage Mean SD
Infrastructure development
rating
Very high 26 22% 1.397 0.986
High 48 40%
Average 37 31%
Low 10 8%
Very low 9 7%
Total 120 100%
Findings in table 4.17 indicate that 62% of the dairy farmers reported that the infrastructure in their
area was well structured. The rest indicated that the infrastructure in their areas was average and below. Dairy
farming in Kenya is growing fast buoyed by a sharp rise in local demand of dairy products coupled with an
improving industry in terms of Government investment and private sector innovation. Improved infrastructure
and better technology has also helped farmers diversify from the regular subsistence farming.
4.6 Possible ways to improve Income for Smallholder Dairy Farmers
This section sought to establish the respondents’ general views on the profitability, constraints and the viable
interventions.
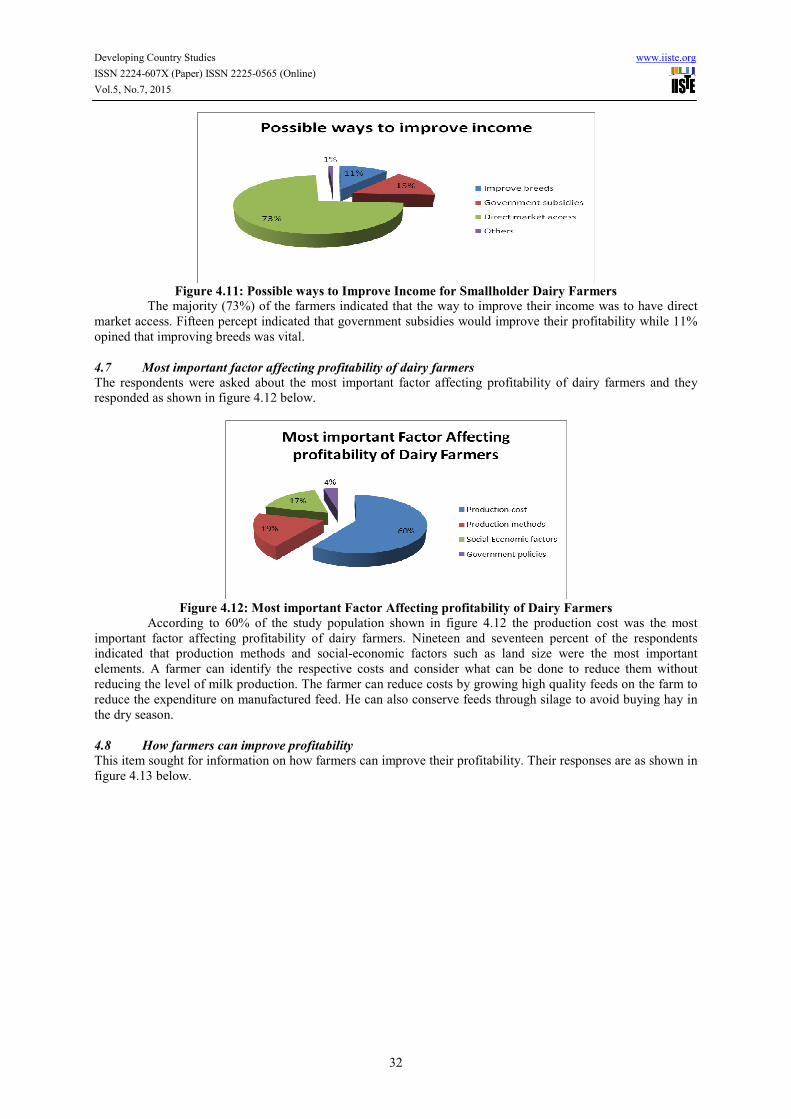
Developing Country Studies www.iiste.org
ISSN 2224-607X (Paper) ISSN 2225-0565 (Online)
Vol.5, No.7, 2015
32
Figure 4.11: Possible ways to Improve Income for Smallholder Dairy Farmers
The majority (73%) of the farmers indicated that the way to improve their income was to have direct
market access. Fifteen percept indicated that government subsidies would improve their profitability while 11%
opined that improving breeds was vital.
4.7 Most important factor affecting profitability of dairy farmers
The respondents were asked about the most important factor affecting profitability of dairy farmers and they
responded as shown in figure 4.12 below.
Figure 4.12: Most important Factor Affecting profitability of Dairy Farmers
According to 60% of the study population shown in figure 4.12 the production cost was the most
important factor affecting profitability of dairy farmers. Nineteen and seventeen percent of the respondents
indicated that production methods and social-economic factors such as land size were the most important
elements. A farmer can identify the respective costs and consider what can be done to reduce them without
reducing the level of milk production. The farmer can reduce costs by growing high quality feeds on the farm to
reduce the expenditure on manufactured feed. He can also conserve feeds through silage to avoid buying hay in
the dry season.
4.8 How farmers can improve profitability
This item sought for information on how farmers can improve their profitability. Their responses are as shown in
figure 4.13 below.
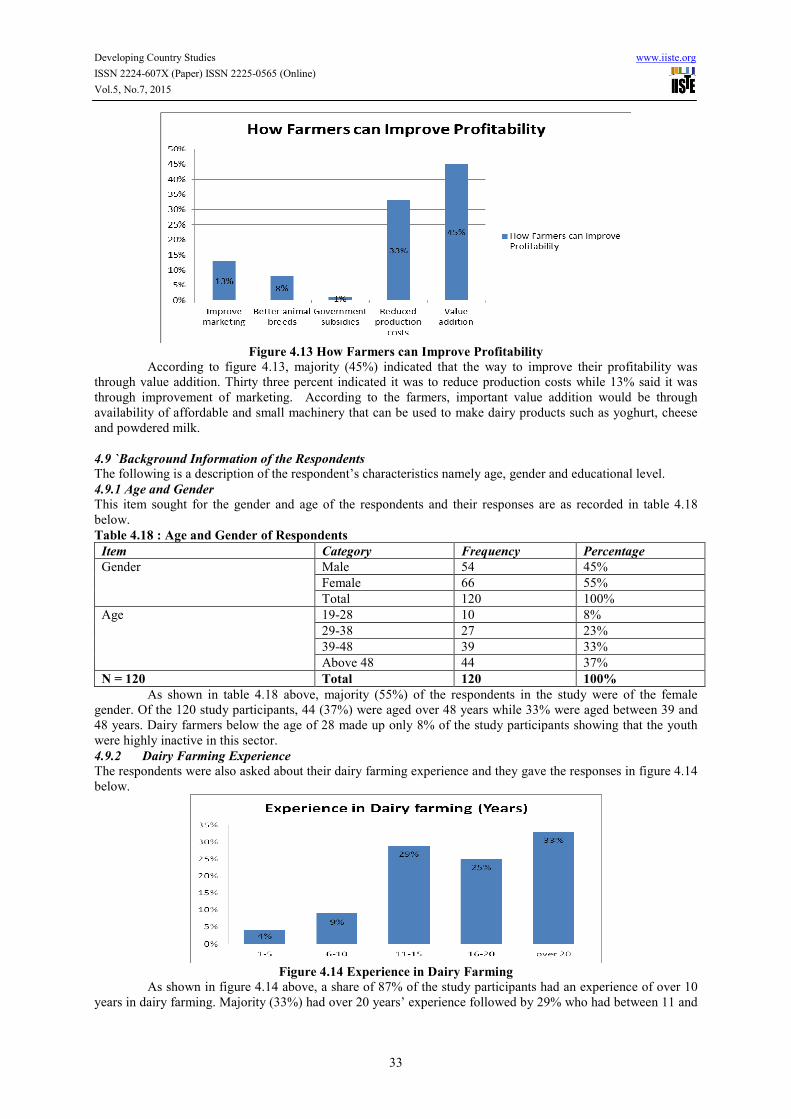
Developing Country Studies www.iiste.org
ISSN 2224-607X (Paper) ISSN 2225-0565 (Online)
Vol.5, No.7, 2015
33
Figure 4.13 How Farmers can Improve Profitability
According to figure 4.13, majority (45%) indicated that the way to improve their profitability was
through value addition. Thirty three percent indicated it was to reduce production costs while 13% said it was
through improvement of marketing. According to the farmers, important value addition would be through
availability of affordable and small machinery that can be used to make dairy products such as yoghurt, cheese
and powdered milk.
4.9 `Background Information of the Respondents
The following is a description of the respondent’s characteristics namely age, gender and educational level.
4.9.1 Age and Gender
This item sought for the gender and age of the respondents and their responses are as recorded in table 4.18
below.
Table 4.18 : Age and Gender of Respondents
Item Category Frequency Percentage
Gender Male 54 45%
Female 66 55%
Total 120 100%
Age 19-28 10 8%
29-38 27 23%
39-48 39 33%
Above 48 44 37%
N = 120 Total 120 100%
As shown in table 4.18 above, majority (55%) of the respondents in the study were of the female
gender. Of the 120 study participants, 44 (37%) were aged over 48 years while 33% were aged between 39 and
48 years. Dairy farmers below the age of 28 made up only 8% of the study participants showing that the youth
were highly inactive in this sector.
4.9.2 Dairy Farming Experience
The respondents were also asked about their dairy farming experience and they gave the responses in figure 4.14
below.
Figure 4.14 Experience in Dairy Farming
As shown in figure 4.14 above, a share of 87% of the study participants had an experience of over 10
years in dairy farming. Majority (33%) had over 20 years’ experience followed by 29% who had between 11 and
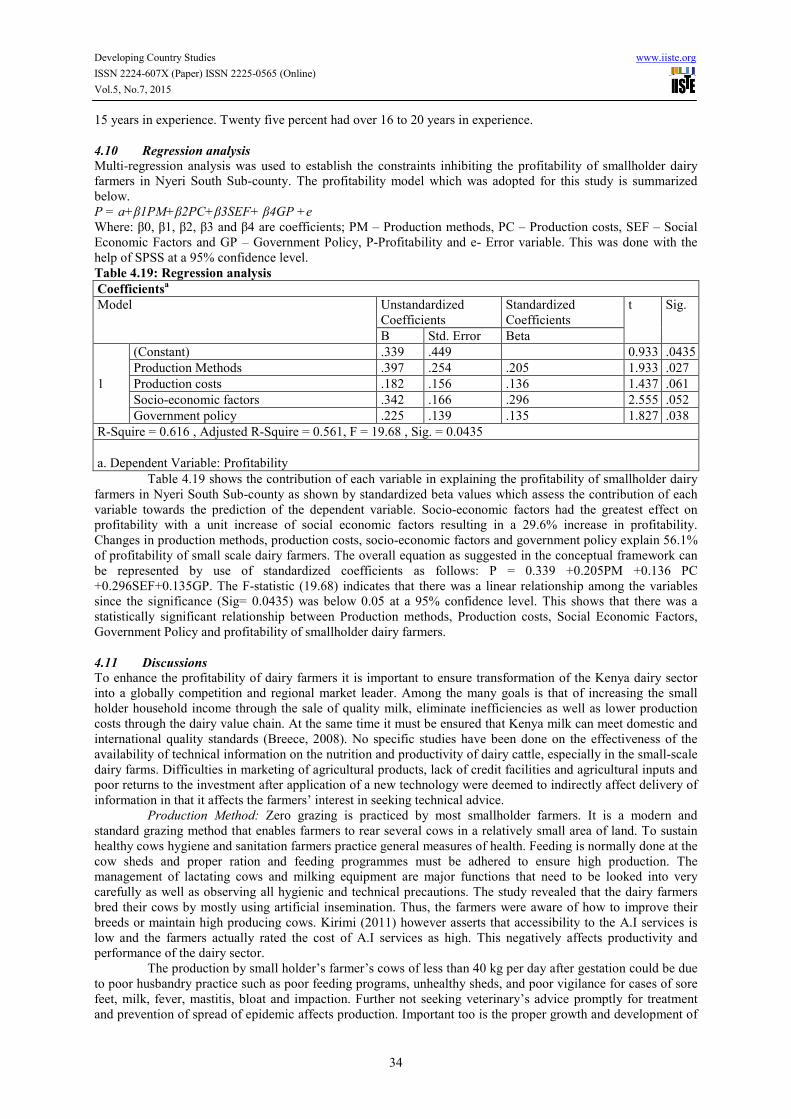
Developing Country Studies www.iiste.org
ISSN 2224-607X (Paper) ISSN 2225-0565 (Online)
Vol.5, No.7, 2015
34
15 years in experience. Twenty five percent had over 16 to 20 years in experience.
4.10 Regression analysis
Multi-regression analysis was used to establish the constraints inhibiting the profitability of smallholder dairy
farmers in Nyeri South Sub-county. The profitability model which was adopted for this study is summarized
below.
P = a+β1PM+β2PC+β3SEF+ β4GP +е
Where: β0, β1, β2, β3 and β4 are coefficients; PM – Production methods, PC – Production costs, SEF – Social
Economic Factors and GP – Government Policy, P-Profitability and e- Error variable. This was done with the
help of SPSS at a 95% confidence level.
Table 4.19: Regression analysis
Coefficientsa
Model Unstandardized
Coefficients
Standardized
Coefficients
t Sig.
B Std. Error Beta
1
(Constant) .339 .449 0.933 .0435
Production Methods .397 .254 .205 1.933 .027
Production costs .182 .156 .136 1.437 .061
Socio-economic factors .342 .166 .296 2.555 .052
Government policy .225 .139 .135 1.827 .038
R-Squire = 0.616 , Adjusted R-Squire = 0.561, F = 19.68 , Sig. = 0.0435
a. Dependent Variable: Profitability
Table 4.19 shows the contribution of each variable in explaining the profitability of smallholder dairy
farmers in Nyeri South Sub-county as shown by standardized beta values which assess the contribution of each
variable towards the prediction of the dependent variable. Socio-economic factors had the greatest effect on
profitability with a unit increase of social economic factors resulting in a 29.6% increase in profitability.
Changes in production methods, production costs, socio-economic factors and government policy explain 56.1%
of profitability of small scale dairy farmers. The overall equation as suggested in the conceptual framework can
be represented by use of standardized coefficients as follows: P = 0.339 +0.205PM +0.136 PC
+0.296SEF+0.135GP. The F-statistic (19.68) indicates that there was a linear relationship among the variables
since the significance (Sig= 0.0435) was below 0.05 at a 95% confidence level. This shows that there was a
statistically significant relationship between Production methods, Production costs, Social Economic Factors,
Government Policy and profitability of smallholder dairy farmers.
4.11 Discussions
To enhance the profitability of dairy farmers it is important to ensure transformation of the Kenya dairy sector
into a globally competition and regional market leader. Among the many goals is that of increasing the small
holder household income through the sale of quality milk, eliminate inefficiencies as well as lower production
costs through the dairy value chain. At the same time it must be ensured that Kenya milk can meet domestic and
international quality standards (Breece, 2008). No specific studies have been done on the effectiveness of the
availability of technical information on the nutrition and productivity of dairy cattle, especially in the small-scale
dairy farms. Difficulties in marketing of agricultural products, lack of credit facilities and agricultural inputs and
poor returns to the investment after application of a new technology were deemed to indirectly affect delivery of
information in that it affects the farmers’ interest in seeking technical advice.
Production Method: Zero grazing is practiced by most smallholder farmers. It is a modern and
standard grazing method that enables farmers to rear several cows in a relatively small area of land. To sustain
healthy cows hygiene and sanitation farmers practice general measures of health. Feeding is normally done at the
cow sheds and proper ration and feeding programmes must be adhered to ensure high production. The
management of lactating cows and milking equipment are major functions that need to be looked into very
carefully as well as observing all hygienic and technical precautions. The study revealed that the dairy farmers
bred their cows by mostly using artificial insemination. Thus, the farmers were aware of how to improve their
breeds or maintain high producing cows. Kirimi (2011) however asserts that accessibility to the A.I services is
low and the farmers actually rated the cost of A.I services as high. This negatively affects productivity and
performance of the dairy sector.
The production by small holder’s farmer’s cows of less than 40 kg per day after gestation could be due
to poor husbandry practice such as poor feeding programs, unhealthy sheds, and poor vigilance for cases of sore
feet, milk, fever, mastitis, bloat and impaction. Further not seeking veterinary’s advice promptly for treatment
and prevention of spread of epidemic affects production. Important too is the proper growth and development of
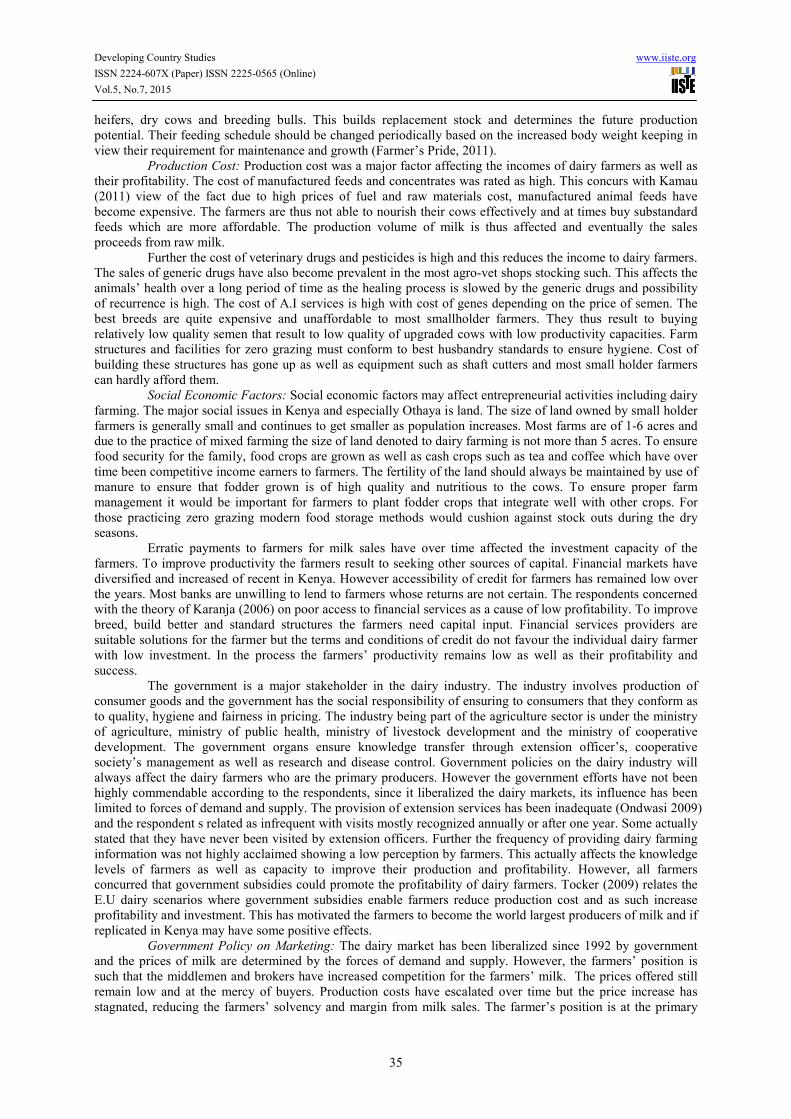
Developing Country Studies www.iiste.org
ISSN 2224-607X (Paper) ISSN 2225-0565 (Online)
Vol.5, No.7, 2015
35
heifers, dry cows and breeding bulls. This builds replacement stock and determines the future production
potential. Their feeding schedule should be changed periodically based on the increased body weight keeping in
view their requirement for maintenance and growth (Farmer’s Pride, 2011).
Production Cost: Production cost was a major factor affecting the incomes of dairy farmers as well as
their profitability. The cost of manufactured feeds and concentrates was rated as high. This concurs with Kamau
(2011) view of the fact due to high prices of fuel and raw materials cost, manufactured animal feeds have
become expensive. The farmers are thus not able to nourish their cows effectively and at times buy substandard
feeds which are more affordable. The production volume of milk is thus affected and eventually the sales
proceeds from raw milk.
Further the cost of veterinary drugs and pesticides is high and this reduces the income to dairy farmers.
The sales of generic drugs have also become prevalent in the most agro-vet shops stocking such. This affects the
animals’ health over a long period of time as the healing process is slowed by the generic drugs and possibility
of recurrence is high. The cost of A.I services is high with cost of genes depending on the price of semen. The
best breeds are quite expensive and unaffordable to most smallholder farmers. They thus result to buying
relatively low quality semen that result to low quality of upgraded cows with low productivity capacities. Farm
structures and facilities for zero grazing must conform to best husbandry standards to ensure hygiene. Cost of
building these structures has gone up as well as equipment such as shaft cutters and most small holder farmers
can hardly afford them.
Social Economic Factors: Social economic factors may affect entrepreneurial activities including dairy
farming. The major social issues in Kenya and especially Othaya is land. The size of land owned by small holder
farmers is generally small and continues to get smaller as population increases. Most farms are of 1-6 acres and
due to the practice of mixed farming the size of land denoted to dairy farming is not more than 5 acres. To ensure
food security for the family, food crops are grown as well as cash crops such as tea and coffee which have over
time been competitive income earners to farmers. The fertility of the land should always be maintained by use of
manure to ensure that fodder grown is of high quality and nutritious to the cows. To ensure proper farm
management it would be important for farmers to plant fodder crops that integrate well with other crops. For
those practicing zero grazing modern food storage methods would cushion against stock outs during the dry
seasons.
Erratic payments to farmers for milk sales have over time affected the investment capacity of the
farmers. To improve productivity the farmers result to seeking other sources of capital. Financial markets have
diversified and increased of recent in Kenya. However accessibility of credit for farmers has remained low over
the years. Most banks are unwilling to lend to farmers whose returns are not certain. The respondents concerned
with the theory of Karanja (2006) on poor access to financial services as a cause of low profitability. To improve
breed, build better and standard structures the farmers need capital input. Financial services providers are
suitable solutions for the farmer but the terms and conditions of credit do not favour the individual dairy farmer
with low investment. In the process the farmers’ productivity remains low as well as their profitability and
success.
The government is a major stakeholder in the dairy industry. The industry involves production of
consumer goods and the government has the social responsibility of ensuring to consumers that they conform as
to quality, hygiene and fairness in pricing. The industry being part of the agriculture sector is under the ministry
of agriculture, ministry of public health, ministry of livestock development and the ministry of cooperative
development. The government organs ensure knowledge transfer through extension officer’s, cooperative
society’s management as well as research and disease control. Government policies on the dairy industry will
always affect the dairy farmers who are the primary producers. However the government efforts have not been
highly commendable according to the respondents, since it liberalized the dairy markets, its influence has been
limited to forces of demand and supply. The provision of extension services has been inadequate (Ondwasi 2009)
and the respondent s related as infrequent with visits mostly recognized annually or after one year. Some actually
stated that they have never been visited by extension officers. Further the frequency of providing dairy farming
information was not highly acclaimed showing a low perception by farmers. This actually affects the knowledge
levels of farmers as well as capacity to improve their production and profitability. However, all farmers
concurred that government subsidies could promote the profitability of dairy farmers. Tocker (2009) relates the
E.U dairy scenarios where government subsidies enable farmers reduce production cost and as such increase
profitability and investment. This has motivated the farmers to become the world largest producers of milk and if
replicated in Kenya may have some positive effects.
Government Policy on Marketing: The dairy market has been liberalized since 1992 by government
and the prices of milk are determined by the forces of demand and supply. However, the farmers’ position is
such that the middlemen and brokers have increased competition for the farmers’ milk. The prices offered still
remain low and at the mercy of buyers. Production costs have escalated over time but the price increase has
stagnated, reducing the farmers’ solvency and margin from milk sales. The farmer’s position is at the primary
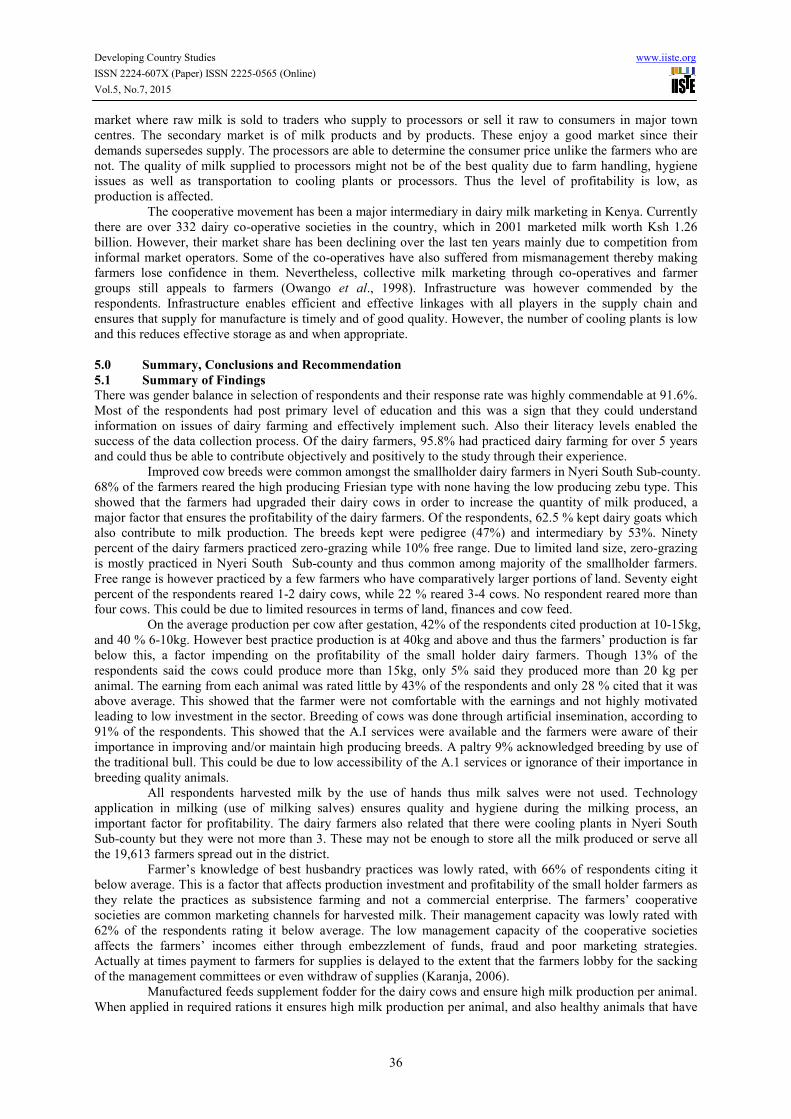
Developing Country Studies www.iiste.org
ISSN 2224-607X (Paper) ISSN 2225-0565 (Online)
Vol.5, No.7, 2015
36
market where raw milk is sold to traders who supply to processors or sell it raw to consumers in major town
centres. The secondary market is of milk products and by products. These enjoy a good market since their
demands supersedes supply. The processors are able to determine the consumer price unlike the farmers who are
not. The quality of milk supplied to processors might not be of the best quality due to farm handling, hygiene
issues as well as transportation to cooling plants or processors. Thus the level of profitability is low, as
production is affected.
The cooperative movement has been a major intermediary in dairy milk marketing in Kenya. Currently
there are over 332 dairy co-operative societies in the country, which in 2001 marketed milk worth Ksh 1.26
billion. However, their market share has been declining over the last ten years mainly due to competition from
informal market operators. Some of the co-operatives have also suffered from mismanagement thereby making
farmers lose confidence in them. Nevertheless, collective milk marketing through co-operatives and farmer
groups still appeals to farmers (Owango et al., 1998). Infrastructure was however commended by the
respondents. Infrastructure enables efficient and effective linkages with all players in the supply chain and
ensures that supply for manufacture is timely and of good quality. However, the number of cooling plants is low
and this reduces effective storage as and when appropriate.
5.0 Summary, Conclusions and Recommendation
5.1 Summary of Findings
There was gender balance in selection of respondents and their response rate was highly commendable at 91.6%.
Most of the respondents had post primary level of education and this was a sign that they could understand
information on issues of dairy farming and effectively implement such. Also their literacy levels enabled the
success of the data collection process. Of the dairy farmers, 95.8% had practiced dairy farming for over 5 years
and could thus be able to contribute objectively and positively to the study through their experience.
Improved cow breeds were common amongst the smallholder dairy farmers in Nyeri South Sub-county.
68% of the farmers reared the high producing Friesian type with none having the low producing zebu type. This
showed that the farmers had upgraded their dairy cows in order to increase the quantity of milk produced, a
major factor that ensures the profitability of the dairy farmers. Of the respondents, 62.5 % kept dairy goats which
also contribute to milk production. The breeds kept were pedigree (47%) and intermediary by 53%. Ninety
percent of the dairy farmers practiced zero-grazing while 10% free range. Due to limited land size, zero-grazing
is mostly practiced in Nyeri South Sub-county and thus common among majority of the smallholder farmers.
Free range is however practiced by a few farmers who have comparatively larger portions of land. Seventy eight
percent of the respondents reared 1-2 dairy cows, while 22 % reared 3-4 cows. No respondent reared more than
four cows. This could be due to limited resources in terms of land, finances and cow feed.
On the average production per cow after gestation, 42% of the respondents cited production at 10-15kg,
and 40 % 6-10kg. However best practice production is at 40kg and above and thus the farmers’ production is far
below this, a factor impending on the profitability of the small holder dairy farmers. Though 13% of the
respondents said the cows could produce more than 15kg, only 5% said they produced more than 20 kg per
animal. The earning from each animal was rated little by 43% of the respondents and only 28 % cited that it was
above average. This showed that the farmer were not comfortable with the earnings and not highly motivated
leading to low investment in the sector. Breeding of cows was done through artificial insemination, according to
91% of the respondents. This showed that the A.I services were available and the farmers were aware of their
importance in improving and/or maintain high producing breeds. A paltry 9% acknowledged breeding by use of
the traditional bull. This could be due to low accessibility of the A.1 services or ignorance of their importance in
breeding quality animals.
All respondents harvested milk by the use of hands thus milk salves were not used. Technology
application in milking (use of milking salves) ensures quality and hygiene during the milking process, an
important factor for profitability. The dairy farmers also related that there were cooling plants in Nyeri South
Sub-county but they were not more than 3. These may not be enough to store all the milk produced or serve all
the 19,613 farmers spread out in the district.
Farmer’s knowledge of best husbandry practices was lowly rated, with 66% of respondents citing it
below average. This is a factor that affects production investment and profitability of the small holder farmers as
they relate the practices as subsistence farming and not a commercial enterprise. The farmers’ cooperative
societies are common marketing channels for harvested milk. Their management capacity was lowly rated with
62% of the respondents rating it below average. The low management capacity of the cooperative societies
affects the farmers’ incomes either through embezzlement of funds, fraud and poor marketing strategies.
Actually at times payment to farmers for supplies is delayed to the extent that the farmers lobby for the sacking
of the management committees or even withdraw of supplies (Karanja, 2006).
Manufactured feeds supplement fodder for the dairy cows and ensure high milk production per animal.
When applied in required rations it ensures high milk production per animal, and also healthy animals that have

Developing Country Studies www.iiste.org
ISSN 2224-607X (Paper) ISSN 2225-0565 (Online)
Vol.5, No.7, 2015
37
high production in terms of quality and quantity. Most (78%) of the respondent cited that the mix of fodder and
manufactured feeds was commonly used. The cost of the manufactured feeds was rated very high by 77% and
low by none of the respondents. This showed that they impacted greatly on the farmers’ profitability and
capacity to enhance profitability. The cost of A.I services was also rated very high by 23% and high by 68% of
the respondents. The A.I. services are mostly used and the high breed semen is very costly .The farmers due to
low finances afford the cheaper ones and as such cannot breed the top breeds that produce high milk quantities.
This impacts on their profitability since the volumes of raw milk remain low, which would otherwise increase
sales and cover production costs more effectively.
Diseases were cited to affect the dairy production process by all respondents. At times however it
completely terminates the process if the animals are totally attacked or die. In treating the disease 98.3% used
veterinary drugs while 1.7% used traditional herbs. Veterinary drugs are more effective in treating the animal
diseases than traditional drugs. However farmers may result to their use especially where finances are low. 61 %
of the respondent related that the effect of diseases on production was very much, and 23% much, concurring
with the fact that diseases affect milk production and sale of the milk. Upon treatment the veterinary doctors may
stop milk consumption for a certain period during treatment. This means no sales for that period for the farmers.
The cost of the veterinary drugs and pesticides was rated as average by 11% and 89 % rated it above
average. Thus, treatment of diseases as well as prevention through veterinary drugs reduced profitability levels
for the dairy farmers. The high cost of drugs meant that at times the dairy animals were left untreated, leading to
disablement and at times death. The size of land owned by the farmers was generally between 1-7 acres. None of
the respondents owned over seven acres while 43% had land less than 1 acre. This showed smallholder
ownership of land for the dairy farmers. The land under dairy farming was below 6 acres as per 43% of the
respondents, since all the farmers practiced mixed farming to supplement their food needs as well as growing
cash crops, especially tea and coffee.
Access to financial services was rated below average by 65% of the respondents. Though available the
farmer’s access especially for credit was low. Farmers’ knowledge of financial services may be a reason for such
inaccessibility though the terms and conditions by financial services providers may dissuade the farmers.
Government assistance to dairy farmers was rated generally below average by 77% of the respondents. This
showed poor acknowledgement of government efforts in the industry by the farmers. The impact of such efforts
might not be very positive to farmers and thus the reason for the low rating. 62% of the respondents related that
government trained veterinary officers visited the farms annually. Thus their capacity to impact husbandry best
practices to farmers as well as monitor development was low. This was reason for farmers low knowledge levels
on dairy issues that would enhance their profitability. Further, the respondents related the frequency of
government provision of relevant dairy farming information as rare (36%) and very rare (43%). However, 16%
cited that the officers never visit the dairy farmers and could not be aware of programmes such as NALEP which
are run by the government. All respondents concurred that government subsidies could promote the profitability
of dairy farmers. Subsidies could help reduce production costs and eventually enhance incomes of dairy farmers.
The farmers would thus be able to invest further and improve the dairy value chain.
The liberalization of the milk market by the government was viewed to positively affect farmers by
85% of the respondents. However, 8% of the respondents indicated the effect was negative. Liberalization of the
dairy market brought in new processers, buyers and formation of local farmer groups. Further it led to farmer’s
freedom of market and this was positive since it led to improved farm-gate prices. Further it rejuvenated the
industry from the slump of KCC’s monopoly and woes that had farmers lose millions of shillings in terms of
milk supplied and investment. The negative effect was noted by some respondents who experienced lack of
prices control of raw milk, though the prices of milk products kept rising. The farmer’s voice on the market price
of raw milk is low and they have to do with what buyers offer. If the prices were harmonized, the dairy farmers
would be assured of more stable income during production. Farmers influence on milk prices was rated below
average by 56% farmers. Thus their demands for increased prices to mitigate or cover production costs are
ineffective and thus contributing to their low profitability.
Of the respondents, 70% had infrequently attended dairy marketing events, However 30% did but their
frequency of attendance was not high since 70% related that they attended sometimes, 11% often and 3% very
often. Attendance to dairy marketing activities is important since the farmers can meet with experts in the field
who can impart relevant husbandry and market issues. This would build the farmers capacity to enhance their
profitability. Infrastructure development was well rated by the respondents 62% rated it above average while
31% rated it average. However 15% indicated it was below average infrastructure is an important feature in the
dairy industry. Good all weather roads ensure efficient transportation, electricity enables establishment of
cooling plants while communication ensures proper coordination of all the players in the dairy supply chain.
As to how the farmers can improve their income from dairy farming direct market access was related
as the most effective initiative. Direct market access would ensure farmers contribution to price determination.
Farmers would lobby directly for better farm gate prices at the primary market and as such enhance their income.

Developing Country Studies www.iiste.org
ISSN 2224-607X (Paper) ISSN 2225-0565 (Online)
Vol.5, No.7, 2015
38
Government subsidies were also a major initiative recognized for enhancing income to dairy farmers. Subsidies
would enable reduction of production cost and eventually enhance earnings from milk. Improved/upgraded
breeds would enable high quality production and increased sales volumes that would help cover production costs
and enhance income. The improvement of cooperative society’s management in terms of efficiency and
effectiveness would enhance their performance. Thus, they would be able to ensure prompt payment to farmers
for supplies as well as negotiate for better milk prices with processors. Further, they could organize the
procurement of cheaper farm inputs and through bulk buying as well as enhance farmers’ trainings to boost their
production capacities and best husbandry practice. No respondent cited working hard as a way of increasing
income.
According to 60% of the respondent production cost was a major factor affecting the profitability of
smallholder dairy farmers. The cost of feeds, A.I. services, drugs and pesticides highly impacted on the earning
from milk sales. Nineteen and seventeen percent of the respondents indicated that production methods and
social economic factors such land were the most important elements. To the dairy farmers, the primary market
price is dictated by middlemen and brokers who have highly infiltrated the sector due to high demand for milk
(Wambugu, 2010). They buy the milk from farmers at relatively low prices. If the market was more harmonized,
the farmers would fetch better prices. The cooperative societies which would assist farmers have further had
management problems and being marketing channels for farmers have contributed greatly to their low
profitability. Government policies were cited as major factors by 4%. The low impact of government
programmes at farm level has led to low capacities on best husbandry practices and competitive edge for farmers.
Zero grazing methods have been known to enable production competitively with the application of the
right husbandry practices .The respondents recommended on how profitability can be improved as the value
addition at the primary level of the dairy chain. The use of technology especially in milking and production
process for items like yoghurt would improve farmer’s profitability. Reduced production cost was also noted as a
way of improving profitability. This can be achieved by proper husbandry practice, observing hygiene in the
cowsheds, and harvesting process that reduces cases of contamination of milk, poor animal health and diseases.
Further reduced wastage of food and water as well as understanding dairy rations would ensure efficient food
usage. Growing of crops for fodder feed such as maize, rice and wheat also ensures raw materials for
manufactured feeds and cushion escalation of food prices.
Improved marketing was also related as a way of improving profitability. The farmers cited that the
market is the determinant of prices and when well structured it can ensure continued returns to the farmers and
enable them to plan and invest in their dairy practice. Better animal breeds were also cited as enablers for
improved profitability. Better breeds would mean higher quantity production; higher sales/revenues which
matched against production cost would ensure profitability through economies of scale. Government subsidies
were not strongly recommended. The farmers were aware of linearization of industry where government role is
only on policy issues and not practices. However the government has the mandate to offer agro-economic
support to help farmers yield the best quality and quantity milk from their cows .Political influence on
government might not allow for subsidies and most farmers are aware of it.
5.2 Conclusions
In view of the findings of the study, the following conclusions were drawn:
Production methods affected the profitability of dairy farmers. The respondents cited the influence of
production methods on profitability as high. Their capacity to exercise/practice best husbandry practices
determined their level of profitability. It contributed to their ability to increase production, sales volumes and
cover production costs to result to profitability. Efforts in promoting production methods knowledge, either by
the individual dairy farmers or all stakeholders are requisite in enhancing profitability. It would promote hygiene,
cost reduction, proper record keeping and thus enhance management, quality and quantity of production and
performance of the dairy farmers. The participation of farmers in dairy programmes set by government and other
dairy players would enable better access to knowledge for the farmers on how to improve production quality and
quantity such as NALEP dairy sector profitability program (DSCP) among others.
Cost of production when matched with the raw milk sales determines the income received by the small
holder dairy farmers. The cost of production has become very high in recent years and has greatly affect
production capacity of dairy farmers. Respondents to the study concurred with this fact and rated the influence of
production cost on profitability as high. Farmers who do not have sufficient land to plant fodder could buy hay
when there is plenty of rain because the prices are significantly lower and store it for the dry season. The cost of
manufactured feeds is high and farmers cannot afford to purchase the daily standard rations for effective feeding
programs others result to buying low quality feeds which they can afford but do not give enough nutrients that
help the cows produce high quantities of milk. Thus, the milk production levels even after gestation remain at
below 20kgs while the competitive range is 40 kgs and above. Further the rearing of 1-2 animals may seem
worthwhile but, knowledge has it that for best practice in zero grazing, at least six cows enables profitability and
Developing Country Studies www.iiste.org
ISSN 2224-607X (Paper) ISSN 2225-0565 (Online)
Vol.5, No.7, 2015
39
competitive advantage to the farmers.
The cost of veterinary drugs and pesticides is also high. Respondents concurred to this and the effect
on productivity is a high reduction in net income and farmer’s profitability. A.I services are also available but
very high. The farmers are thus unable to breed best quality cows that produce high milk quantities thus; their
low quantities have been a reason for low profitability in the dairy sector
In relation to social economic factors, land size was a major social factor that affected the effectiveness
of the small holder dairy farmers. Population growth and increased land fragmentation coupled with mixed
farming practices have seen fodder production lowering. This forces the farmers to highly rely on expensive
manufactured feed and thus reducing their incomes. The farmers should seek more information on modern best
practices on small holder level farming that ensure high returns. Access to finance has also contributed to low
profitability of the dairy farmers. Their capacity to increase investment as well as access running capital has been
low and the perceptions of the financiers on the risk of credit finance to the farmers has highly contributed to this.
In connection to government policy on marketing, liberalization of the dairy market has both been a
blessing and a problem for the smallholder farmers. On the one hand, it allowed for more players in the field
who created more market for farmers’ raw milk. Competition among these players also improved the farm gate
prices. On the other hand, the expected high farm gate prices have not been accessed by the small holder dairy
farmers. Actually, their influence on the market price is insignificant. As such the farmers can hardly plan on
their income, thus reducing their profitability. Government subsidies would greatly enhance profitability of the
smallholder dairy farmers. Where subsidies are provided to the farmers, the production cost is greatly reduced,
enabling the farmers to have higher income that would enable more investment and better living standards.
The government is mandated to provide capacity building programs for the dairy farmers. However the
farmers have low opinions on them and rarely get involved in them. Attendance of marketing activities such as
the Agricultural Society of Kenya Shows was very low, and even those who attended did so rarely. The
extension services are also poorly provided with the extension officers infrequently visiting the farmers in the
field. Thus the government needs to restructure its extension programme and formulate marketing programs that
enhance the farmers’ capacity and profitability.
5.3 Recommendations
This section presents measures for policy to practice and recommended areas for further study.
5.3.1 Recommendations for Policy and Practice
In view of the findings and conclusions of the study, the following recommendations are made to guide policy
and practice:
Value addition of raw milk should be encouraged at the primary production. The farmers can produce
yoghurt, which has higher income as compared to raw milk. This would ensure profitability of the small holder
dairy farmers. The small holder farmers should ensure credible record keeping in their dairy production. Records
of sales, purchases, diseases control, A.I. enable the dairy farmers to have a data base that they can rely on and
ascertain their performance at any given time and enable them plan their production. Higher breed genes should
be sought to ensure cows with high production quantity of milk that would increase revenues to farmers. Proper
husbandry of the high breed will ensure that farmers are able to plan on production. Proper feeding programs, for
example ensure that the cows are healthy and their production cycle is well known to the farmers. They should
also be able to know the appropriate time for breeding, time of high and low production, as this can help them
plan on milk production.
Increased food production, especially fodder, should be undertaken to avail cheaper animal feed that
reduces cost of production. As such, they feed the animals with fodder and as a result spend less on the former,
eventually increasing their retained earnings. The government should ensure that production of food staff such as
maize and wheat (that produce bran is increased countrywide. This will further reduce the cost of manufactured
feed to enable dairy farmers to competitively undertake milk production.
The customary system of land inheritance should be carefully reviewed since the land fragmentation
has and continues to reduce viable land for dairy farming. The smallholder dairy farmers should weigh the
option of leasing farmland in areas nearby so as to increase fodder production that lowers high reliability on
manufactured feed as well as production cost. Access to financial services should be encouraged to avail funds
for investment by the smallholder dairy farmers. Insurance companies should also educate and enhance market
outreach to all dairy farmers on insurance cover for the dairy cows and thus build confidence of the farmers to
invest in top breed dairy cows. The government should also through its financial agricultural statutory boards
avail more funds and financial services to dairy farmers.
Capacity building programs on dairy farming and husbandry should be more accessible to smallholder
dairy farmers. These would increase the farmers’ knowledge on good husbandry and help enhance the quality of
milk sold to processors. This would increase their income levels and also their profitability. The management
and staff of dairy cooperative societies should be trained on best practices to enhance the performance levels and

Developing Country Studies www.iiste.org
ISSN 2224-607X (Paper) ISSN 2225-0565 (Online)
Vol.5, No.7, 2015
40
enable optimal income to the smallholder farmers.
The farmers should form organized unions that would enable them bargain for better farm gate prices
as well as eradicate the middleman’s influence in marketing of their milk. Also they should sell processed
products. Increase cooling facilities near to the farmers would increase the life and quality of milk sold.
Livestock extension services program should be restructured in the ministry of livestock to ensure that the
extension officers visit the farmers regularly so that farmers can get necessary information that would enhance
their production as well as market knowledge and profitability.
Stakeholders should ensure regular and structured data collection in order to aid strategic data
collection. This will aid strategic planning in the dairy industry, thus enabling the establishment of viable
programmes and activities that would boost the focus of small holder dairy farmers to competitive production.
Milk prices should be harmonized so that farmers are sure of their profit margin when they sell to processors.
5.3.2 Recommended Areas for Further Study
This study has focused on constraints inhibiting profitability of smallholder dairy farmers in Nyeri South Sub-
county, Kenya. The following areas are however recommended for further study: (i) Areas of access to financial
services and products for the smallholder dairy farmers; (ii) Effects of land fragmentation on dairy farming; and
(iii) Dairy farmers’ perception of technology in dairy farming
REFERENCES
Athane, P. J. (2009). Developing skills through training employment, income and equality, James Curry, London.
Awino, Z. B. (2009). Effectiveness of the value chain strategy in the selected producer- owned dairy groups in
Kenya, UON, Nairobi.
Baker, J.B. (1992). Research for Marketing, Macmillan Press, London.
Ballock, A. & Brett, P. (2011). Agricultural production in Othaya, Kenya .
Baltenweck, I. (2010). Are Smallholder dairy farmers in East Africa Competitive? ILRI, Kigali.
Barney, J. B., & Hesterly, W. S. (2008). Vertical Integration, Strategic Management Competitive Advantage,
2ND
Edition, Pearson Prentice hall.
Chinsinga, B. (2010). Roles and performance of the Ministry of Agriculture in Nyeri South Sub-county.
Dianne, S., Polson J, Oelker E. & Gary, S. (2008). 15 measures of profitability in the dairy sector dairy excel,
USA.
Dryer, J. (2011). Products Supply; Dairy and Food market Analyst, e-letter, Nairobi.
Farmer’s Pride, (2011). Health, hygiene and sanitation in dairy farming, farmers pride magazine, media services,
July 2011, issue No 2072, .pp.16-20. Nairobi.
Kamau, P. (2011). What a startup dairy farmer needs to know about cattle, the organic farmer magazine, issue
No. 79, 2011, Nairobi .
Karanja, A. ( 2006). The dairy Industry in Kenya, Post Liberalization Agenda, Nairobi.
Karimi, L., Wambugu, S., & Opiyo,J., (2010). Productivity trends and performance of Dairy Farming, Nairobi.
Karuga, S., (2009). Dairy Value Chain analysis, Timau Milk sheds, draft report, Nairobi.
Kenya Bureau of Statistics, (2010). Kenya National Population and Household Census, Nairobi.
Kiama, J. & Nderitu J. M. (2009). Success in Agriculture, 9th
Edition, pg 127- 136, East African Publishers,
Nairobi.
Kiragu, J. W., Onyango, T. A., Wachira, A.M, Sinket S.N. & Kinyanjui H. (2007). Challenges of improving
dairy Productivity on the smallholders in High Altitude Areas of Nyandarua and the opportunities of
growing herbaceous legumes, National Husbandry Research Centre, Nyahururu.
Kothari, C. R. (2004). Research Methodology: Methods and Techniques (2nd revised edition). New Delhi: New
Age International (P) Ltd.
Lancaster, G. A., Dodd, S. & Williamson, P. R. (2004). Design and analysis of pilot studies: recommendations
for good practice. Journal of Evaluation in Clinical Practice 10(2): 307-12.
Massimo, V. & Muiru, O. (2010). Financial Supply Side Survey 2010. Financial sector deepening program,
Nairobi.
Republic of Kenya. (2009). Ministry of Livestock Annual Report. Government printer: Nairobi.
Ministry of Planning and National Development, Statistical Abstract,(2003), Central bureau of statistics. The
Dairy Industry in Kenya, 2002, ministry of trade, Industry and Agriculture Kenya, 2003.
Mugenda, O. M., & Mugenda, A. G. (2003). Research Methods; Quantitative & Qualitative Approaches; ACTS
Press Nairobi.
Muriithi, D.A. & Batltenweck, I. (2011). Key performance indicators, East Africa Dairy Development Project
Baseline Survey Briefs, Nairobi Kenya, ILRI.
Mwangi, B. (2007). Alarm raised over toxic in local milk. Organic farmer journal 33 (2)
Nderitu, J. & Kiama, J. (2009). Success in Agriculture, 7th
Edition, Techno Resource Trainers, Nairobi.
Ngamba, P. (2005). Productivity, profitability and Food Security Report, Tegemeo Institute of Agriculture,
Developing Country Studies www.iiste.org
ISSN 2224-607X (Paper) ISSN 2225-0565 (Online)
Vol.5, No.7, 2015
41
Nairobi.
Nyoro, J. K. (2006). Impact on Agriculture Productivity, profitability and Food Security Report, Tegemeo
Institute of Agriculture, Nairobi.
Odhiambo, W. (2008), Trade policy. Reforms and poverty in Kenya Vol 1. Kenya Institute for Public Policy
Research and Analysis (KIPPRA), Nairobi, Kenya.
Odhiambo, W. & Otieno, G. (2010). Central Province investment Initiative (CEPPII), report Kenya Investment
Authority 31st
January 2010; Trade policy reforms in Kenya.
Omondi, G. (2012). Kenya Dairy Firms Bet on Regional Integration to Grow Market, Nairobi.
Ondwasi, H. (2009). Kenya Research Institute Notes, 8th February 2008.
Orodho, A. J. (2004). Techniques of Writing Research Proposal and Report in Education and Social Science;
Mosala Publishers, Nairobi.
Orodho, A. J. & Kombo, D. K. (2002). Research Methods. Kenyatta University Institute of Open Learning.
Nairobi.
Otieno, G. (2008). Trade development. Poverty linkages, Vol. 1. Nairobi: Kenya Dairy Board annual report.
Ouguma, B. (2011). Analysis of constrains facing Urban Dairy Farmers and Gender. African Journal of Basic
and Applied Sciences 3(6):313-318.
Owango, M., Lukuyu, B., Staal, S.J,, Kenyanjui,M., Njubi, D. & Thorpe, W.(1998). Dairy Co-Operatives And
Policy Reform In Kenya: Effects of Livestock Service and Milk Market liberalization Kenya
Agricultural Research Institute (KARI), Kenya.
Owuor, J. (2009). Sustainable Livestock enterprises, Modern Agriculture Journal, Nairobi.
Phillip, A. (2011). Competitive analysis of the Netherlands and Dutch dairy cluster, Microeconomics of
profitability, Amsterdam.
Porter, M. E. (2008). The five competitive forces that shape strategy. Harvard Business Review.
Raihan, S. (2008). Trade-Development-Poverty linkages, Vol.1, country case Studies,
Republic of Kenya (2010). Kenya Agricultural Productivity & Agribusiness Project (KAPAP) Homabay, Kenya.
Republic of Kenya, (2008). Annual Report on Agricultural 2007, Ministry of Agriculture, Kenya.
Schreuder, B. E. C., Noorman, N., Halimi, M. & Wassink, G. (1996). Livestock mortality in Afghanistan in
districts with and without a veterinary program. Tropical Animal Health & Production 28:129-136.
Shitanda, A. & Sternes, J. (2004). Factors contributing to occurrence of antimicrobial drug residues in Kenya
milk, journal of Food Protection, pg 399-402, MacMillan publishers.
Siggel, E. (2006). International profitability and comparative advantage: a survey and proposal for measurement,
Journal of industry, competition and trade 6:137-159.
Staal, S. J. (2011). The profitability of smallholder dairy production. Evidence from sub-Saharan Africa, Asia
and Latin America, Nairobi.
Tacken, G. M., Batowska A, Gardebroek C., K. Nesha T., Banse M., Wijnands J. H. & Poppe K. J. (2009).
Profitability of the E.U dairy industry, 2009-2011 report, the Hague.
Wachira, A. & Mugaah, C. (2005). Secondary Agriculture, pg 38-42, MacMillan Publishers, Nairobi.
Waithaka, M. (2010). International Dairy Markets for Kenyan Farmers; Export processing zone Authority
Journal, issue 17, August 2010, pp 18, Nairobi.
Waithaka, M. (2010). Dairy profitability, export processing Zone report, October 2010, Nairobi.
Wayama, M., Mose, L.O., Odendo, M, Okuro J.O & Owur, J.O, (2010). Determinants of income diversification
Strategies among Rural Households in Maize Based Farming Systems of Kenya, Nairobi.
William, M. K (2006). Research Methods, Method Based Application, 2nd
Edition, pp 188, Mc Graw-hill
Publishers, London.
Ynze, V. (2008). Quick Scan of the Dairy and Meat Sector in Kenya, Issues and Opportunities, Nairobi Kenya.
Developing Country Studies www.iiste.org
ISSN 2224-607X (Paper) ISSN 2225-0565 (Online)
Vol.5, No.7, 2015
42
ABBREVIATIONS AND ACRONYMS
AI Artificial Insemination
ACP African Caribbean and Pacific Countries
CEPII Central Province Investment Initiative
COMESA Common Market for Eastern and Southern Africa
DSCP Dairy Sector Profitability Programme
EAC East Africa Community
EU European Union
GDP Gross Domestic Product
GTZ German Technical Assistance Organization
IT Information Technology
KAPAP Kenya Agriculture Productivity Assistance Programme
KCC Kenya Cooperative Creameries
KDB Kenya Daily Board
KNBS Kenya National Bureau of Statistics
LSP Large Scale Producers
MoA Ministry of Agriculture
MoL Ministry of Livestock
MSP Middle Scale Producers
NALEP National Agriculture and Livestock Extension Programme
USAID United States Aid for International Development
SPSS Statistical Package for Social Sciences
SSP Small Scale Producer
VRIO Value, Rare, Imitable, Organization
DEFINITION OF KEY TERMS
Artificial Insemination Modern methods of breeding other than the bulls.
Brokers People who buy commodities from one person and sell it to another for financial
gains
Dairy Farming Rearing of cows and goats for milk production.
Extension Officers Trained government personnel who offer on farm education on best farming
practices.
Fodder Food crops meant for consumption of cows and goats.
Productivity Yield of milk per animal.
Profitability/ Return Amount of money in profit realised by dairy farmers.
Zero Grazing Rearing of cows and goats in standard structured shelters and feeding them there in.

The IISTE is a pioneer in the Open-Access hosting service and academic event management.
The aim of the firm is Accelerating Global Knowledge Sharing.
More information about the firm can be found on the homepage:
http://www.iiste.org
CALL FOR JOURNAL PAPERS
There are more than 30 peer-reviewed academic journals hosted under the hosting platform.
Prospective authors of journals can find the submission instruction on the following
page: http://www.iiste.org/journals/ All the journals articles are available online to the
readers all over the world without financial, legal, or technical barriers other than those
inseparable from gaining access to the internet itself. Paper version of the journals is also
available upon request of readers and authors.
MORE RESOURCES
Book publication information: http://www.iiste.org/book/
Academic conference: http://www.iiste.org/conference/upcoming-conferences-call-for-paper/
IISTE Knowledge Sharing Partners
EBSCO, Index Copernicus, Ulrich's Periodicals Directory, JournalTOCS, PKP Open
Archives Harvester, Bielefeld Academic Search Engine, Elektronische Zeitschriftenbibliothek
EZB, Open J-Gate, OCLC WorldCat, Universe Digtial Library , NewJour, Google Scholar