constellation software inc. financial report...income tax expense (recovery) 29 29 (0) 0% 123 106 17...
TRANSCRIPT

Constellation Software Inc.
FINANCIAL REPORT
Fourth Quarter Fiscal Year 2019
For the three months and fiscal year ended December 31, 2019

1
CONSTELLATION SOFTWARE INC.
MANAGEMENT’S DISCUSSION AND ANALYSIS (“MD&A”)
The following discussion and analysis should be read in conjunction with the Annual Consolidated Financial Statements for the year ended December 31, 2019, which we prepared in accordance with International Financial Reporting Standards (“IFRS”). Certain information included herein is forward-looking and based upon assumptions and anticipated results that are subject to uncertainties. Should one or more of these uncertainties materialize or should the underlying assumptions prove incorrect, actual results may vary significantly from those expected. See “Forward-Looking Statements” and “Risks and Uncertainties”.
Unless otherwise indicated, all dollar amounts are expressed in U.S. dollars. All references to “$” are to U.S. dollars and all references to “C$” are to Canadian dollars. Due to rounding, certain totals and subtotals may not foot and certain percentages may not reconcile.
Additional information about Constellation Software Inc. (the “Company” or “Constellation” or “CSI”),
including our most recently filed Annual Information Form ("AIF"), is available on SEDAR at www.sedar.com. Forward Looking Statements
Certain statements in this report may contain “forward looking” statements that involve risks, uncertainties and other factors that may cause the actual results, performance or achievements of the Company or industry to be materially different from any future results, performance or achievements expressed or implied by such forward-looking statements. Words such as “may”, “will”, “expect”, “believe”, “plan”, “intend”, “should”, “anticipate” and other similar terminology are intended to identify forward looking statements. These statements reflect current assumptions and expectations regarding future events and operating performance as of the date of this MD&A, February 13, 2020. Forward looking statements involve significant risks and uncertainties, should not be read as guarantees of future performance or results, and will not necessarily be accurate indications of whether or not such results will be achieved. A number of factors could cause actual results to vary significantly from the results discussed in the forward looking statements, including, but not limited to, the factors discussed under “Risks and Uncertainties”. Although the forward looking statements contained in this MD&A are based upon what management of the Company believes are reasonable assumptions, the Company cannot assure investors that actual results will be consistent with these forward looking statements. These forward looking statements are made as of the date of this MD&A and the Company assumes no obligation, except as required by law, to update any forward looking statements to reflect new events or circumstances. This report should be viewed in conjunction with the Company’s other publicly available filings, copies of which can be obtained electronically on SEDAR at www.sedar.com. Non-IFRS Measures
This MD&A includes certain measures which have not been prepared in accordance with IFRS such as Free cash flow available to shareholders.
Free cash flow available to shareholders ‘‘FCFA2S’’ refers to net cash flows from operating activities less interest paid on lease obligations, interest paid on other facilities, credit facility transaction costs, repayments of lease obligations, the TSS membership liability revaluation charge, and property and equipment purchased, and includes interest and dividends received. We believe that FCFA2S is useful supplemental information as it provides an indication of the uncommitted cash flow that is available to shareholders if we do not make any acquisitions, or investments, and do not repay any debts. While we could use the FCFA2S to pay dividends or repurchase shares, our objective is to invest all of our FCFA2S in acquisitions which meet our hurdle rate.
FCFA2S is not a recognized measure under IFRS and, accordingly, readers are cautioned that FCFA2S should not be construed as an alternative to net cash flows from operating activities. See ‘‘Results of Operations

2
—Free cash flow available to shareholders” for a reconciliation of FCFA2S to net cash flows from operating activities.
Overview
We acquire, manage and build vertical market software (“VMS”) businesses. Generally, these businesses provide mission critical software solutions that address the specific needs of our customers in particular markets. Our focus on acquiring businesses with growth potential, managing them well and then building them, has allowed us to generate significant cash flows and revenue growth during the past several years.
Our revenue consists primarily of software license fees, maintenance and other recurring fees, professional service fees and hardware sales. Software license revenue is comprised of license fees charged for the use of our software products generally licensed under multiple-year or perpetual arrangements. Maintenance and other recurring revenue primarily consists of fees charged for customer support on our software products post-delivery and also includes, to a lesser extent, recurring fees derived from software as a service, subscriptions, combined software/support contracts, transaction-related revenues, and hosted products. Maintenance and other recurring fee arrangements generally include ongoing customer support and rights to certain product updates “when and if available” and products sold on a subscription basis. Professional service revenue consists of fees charged for implementation and integration services, customized programming, product training and consulting. Hardware sales include the resale of third party hardware that forms part of our customer solutions, as well as sales of customized hardware assembled internally. Our customers typically purchase a combination of software, maintenance, professional services and hardware, although the type, mix and quantity of each vary by customer and by product.
Expenses consist primarily of staff costs, the cost of hardware, third party licenses, maintenance and professional services to fulfill our customer arrangements, travel and occupancy costs and other general operating expenses.

3
Results of Operations (In millions of dollars, except percentages and per share amounts)Unaudited
2019 2018 $ % 2019 2018 $ %
Revenue 956 831 125 15% 3,490 3,060 430 14%
Expenses 724 604 120 20% 2,648 2,303 345 15%
Amortization of intangible assets 96 70 26 38% 331 279 52 19%Foreign exchange (gain) loss (9) (6) (3) 42% 11 (3) 14 NMTSS membership liability revaluation charge 22 18 5 26% 52 55 (4) -6%Finance and other income (2) (4) 2 -43% (4) (17) 13 -75%Bargain purchase gain (10) (68) 58 -86% (45) (69) 23 -34%Finance costs 12 8 4 57% 42 26 16 60%Income before income taxes 121 209 (87) -42% 456 486 (29) -6%
Income tax expense (recovery)Current income tax expense (recovery) 43 33 9 27% 164 127 38 30%Deferred income tax expense (recovery) (13) (4) (9) 225% (41) (20) (21) 101%Income tax expense (recovery) 29 29 (0) 0% 123 106 17 16%
Net income 92 179 (87) -49% 333 379 (46) -12%
Net cash flows from operating activities 255 208 46 22% 767 662 105 16%
Free cash flow available to shareholders 193 180 14 8% 590 559 32 6%
Weighted average number of shares outstanding Basic and diluted 21.2 21.2 21.2 21.2
Net income per share Basic and diluted 4.34$ 8.46$ (4.12)$ -49% 15.73$ 17.91$ (2.18)$ -12%
Net cash flows from operating activities per share Basic and diluted 12.02$ 9.84$ 2.19$ 22% 36.17$ 31.24$ 4.93$ 16%
Free cash flow available to shareholders per share Basic and diluted 9.12$ 8.48$ 0.65$ 8% 27.86$ 26.37$ 1.49$ 6%
Cash dividends declared per share Basic and diluted 1.00$ 1.00$ -$ 0% 24.00$ 4.00$ 20.00$ 500%
Total assets 3,488 2,935 552 19%Total long-term liabilities 1,069 725 344 47%
NM - Not meaningfulDue to rounding, certain totals may not foot and certain percentages may not reconcile.
Three months ended December 31,
Period-Over-Period Change
Year ended December 31,
Period-Over-Period Change

4
Comparison of the three and twelve month periods ended December 31, 2019 and 2018
Revenue:
Total revenue for the quarter ended December 31, 2019 was $956 million, an increase of 15%, or $125 million, compared to $831 million for the comparable period in 2018. For the 2019 fiscal year total revenues were $3,490 million, an increase of 14%, or $430 million, compared to $3,060 million for the 2018 fiscal year. The increase for both the three and twelve month periods compared to the same periods in the prior year is primarily attributable to growth from acquisitions as the Company experienced organic growth of negative 3% and negative 1% for the three and twelve month periods respectively, negative 2% and positive 1% respectively after adjusting for the impact of changes in the valuation of the US dollar against most major currencies in which the Company transacts business. For acquired companies, organic growth is calculated as the difference between actual revenues achieved by each company in the financial period following acquisition compared to the estimated revenues they achieved in the corresponding financial period preceding the date of acquisition by Constellation.
The following table displays the breakdown of our revenue according to revenue type:
For comparative purposes the table below shows the quarterly organic growth as compared to the same period in the prior year by revenue type since Q4 2017.
Q418 Proforma
Adj.Organic Growth
FY18 Proforma
Adj.Organic Growth
(Note 1) (Note 2)2019 2018 $ % $ % 2019 2018 $ % $ %
Licenses 62 57 4 7% 11 -10% 226 198 28 14% 42 -6%Professional services 188 173 15 9% 32 -8% 673 616 58 9% 108 -7%Hardware and other 51 58 (7) -12% 7 -22% 173 175 (1) -1% 23 -12%Maintenance and other recurring 655 542 113 21% 101 2% 2,417 2,072 346 17% 309 2%
956 831 125 15% 151 -3% 3,490 3,060 430 14% 483 -1%$M - Millions of dollarsDue to rounding, certain totals may not foot and certain percentages may not reconcile.
Three months ended December 31,
Period-Over-Period Change
($ in millions, except percentages)
Period-Over-Period Change
Year ended December 31,
Note 1: Estimated pre-acquisition revenues for the three months ended December 31, 2018 from companies acquired after September 30, 2018. (Obtained from unaudited vendor financial information.)
($ in millions, except percentages)
Note 2: Estimated pre-acquisition revenues for the twelve months ended December 31, 2018 from companies acquired after December 31, 2017. (Obtained from unaudited vendor financial information.)
Dec. 31 Mar. 31 Jun. 30 Sep. 30 Dec. 31 Mar. 31 Jun. 30 Sep. 30 Dec. 31
2017 2018 2018 2018 2018 2019 2019 2019 2019
Licenses 6% ‐4% ‐5% ‐9% ‐3% ‐3% 5% ‐14% ‐10%Professional services 7% 3% 3% ‐5% 1% ‐5% ‐7% ‐8% ‐8%Hardware and other 17% ‐16% ‐11% ‐20% 4% ‐4% ‐15% ‐2% ‐22%Maintenance and other recurring 7% 8% 6% 3% 2% 1% 2% 1% 2%
Revenue 8% 5% 4% ‐1% 2% ‐1% ‐1% ‐2% ‐3%
Quarter Ended

5
The following table shows the same information adjusting for the impact of foreign exchange movements.
As announced in January 2015, Trapeze Group (“Trapeze”), a division of Constellation’s wholly-owned subsidiary, Volaris Group Inc., was awarded a significant contract by the High Commission for the Development of Arriyadh represented by ARRIYADH DEVELOPMENT AUTHORITY (“Riyadh”), for the provision of a comprehensive intelligent transportation system (“ITS”). The hardware revenue recognized in association with this project is the primary explanation for the negative 21% organic growth in Hardware and other revenue in Q419. Hardware and other revenue associated with this project was $11 million and $15 million lower for the three and twelve months ended December 31, 2019 compared to the same periods in the prior year. Excluding hardware revenue associated with this project, the foreign exchange adjusted organic growth in Hardware and other revenue would have been negative 5% for the three and twelve months ended December 31, 2019.
We aggregate our business into two distinct segments for financial reporting purposes: (i) the public sector reportable segment, which includes business units focused primarily on government and government-related customers, and (ii) the private sector reportable segment, which includes business units focused primarily on commercial customers. Following the guidance set out by IFRS 8, the public sector reportable segment is derived by combining our Volaris, Harris and TSS operating groups, and the private sector reportable segment is derived by combining our Vela, Jonas and Perseus operating groups. Each of our operating groups operate essentially as mini Constellations, conglomerates of small vertical market software companies with similar economic characteristics. While the operating groups in the public sector are comprised of businesses that primarily serve government and government-related customers, they also include businesses that serve commercial customers, and similarly the operating groups in the private sector are comprised of businesses that primarily serve commercial customers but also include businesses that serve government and government-related customers. For the fiscal years ended December 31, 2019 and 2018 approximately 35% and 30% respectively of the revenue in the public sector reportable segment is generated from commercial customers, and 15% and 16% respectively of revenue in the private sector reportable segment is generated from government and government-related customers.
The following table displays our revenue by reportable segment and the percentage change for the three and twelve months ended December 31, 2019 compared to the same periods in 2018:
Dec. 31 Mar. 31 Jun. 30 Sep. 30 Dec. 31 Mar. 31 Jun. 30 Sep. 30 Dec. 31
2017 2018 2018 2018 2018 2019 2019 2019 2019
Licenses 3% ‐8% ‐7% ‐7% ‐1% 1% 8% ‐12% ‐9%Professional services 3% ‐3% 0% ‐4% 3% ‐1% ‐4% ‐5% ‐7%Hardware and other 14% ‐20% ‐13% ‐19% 5% ‐1% ‐14% 0% ‐21%Maintenance and other recurring 4% 4% 4% 4% 4% 5% 4% 3% 3%
Revenue 5% 0% 1% 0% 3% 3% 2% 0% ‐2%
Quarter Ended

6
Public Sector
For the quarter ended December 31, 2019, total revenue in the public sector reportable segment increased 18%, or $99 million to $655 million, compared to $556 million for the quarter ended December 31, 2018. For the fiscal year ended December 31, 2019, total revenue increased by 15%, or $305 million to $2,353 million, compared to $2,047 million for the comparable period in 2018. For purposes of calculating organic growth, estimated pre-acquisition revenues included from the relevant companies acquired in 2018 and 2019 was $115 million and $351 million for the three and twelve month periods ended December 31, 2018, respectively. Organic revenue growth was negative 2% for both the three and twelve months ended December 31, 2019 compared to the same periods in 2018, and negative 1% and 0% respectively after adjusting for the impact of changes in the valuation of the US dollar against most major currencies in which the Company transacts business. For comparative purposes the table below shows the quarterly organic growth as compared to the same period in the prior year by revenue type since Q4 2017 adjusting for the impact of foreign exchange movements.
Private Sector
For the quarter ended December 31, 2019, total revenue in the private sector reportable segment increased 9%, or $26 million to $300 million, compared to $275 million for the quarter ended December 31, 2018. For the fiscal year ended December 31, 2019, total revenue increased by 12%, or $125 million to $1,138 million, compared to $1,013 million for the comparable period in 2018. For purposes of calculating organic growth, estimated pre-
Q418 Proforma
Adj.Organic Growth
FY18 Proforma
Adj.Organic Growth
(Note 1) (Note 2)2019 2018 $ % $ % 2019 2018 $ % $ %
Public SectorLicenses 41 33 8 24% 10 -4% 143 121 22 18% 34 -7%Professional services 147 132 15 12% 28 -8% 522 471 51 11% 91 -7%Hardware and other 42 51 (9) -17% 5 -25% 143 146 (3) -2% 19 -13%Maintenance and other recurring 425 340 85 25% 72 3% 1,544 1,309 235 18% 208 2%
655 556 99 18% 115 -2% 2,353 2,047 305 15% 351 -2%
Private SectorLicenses 21 24 (4) -15% 2 -20% 83 77 6 8% 9 -3%Professional services 41 41 (0) 0% 4 -8% 151 144 7 5% 18 -7%Hardware and other 9 7 2 26% 2 -2% 30 28 2 7% 5 -8%Maintenance and other recurring 230 202 28 14% 29 0% 873 763 110 14% 101 1%
300 275 26 9% 36 -3% 1,138 1,013 125 12% 132 -1%
Due to rounding, certain totals may not foot and certain percentages may not reconcile.
Note 2: Estimated pre-acquisition revenues for the twelve months ended December 31, 2018 from companies acquired after December 31, 2017. (Obtained from unaudited vendor financial information.)
($ in millions, except percentages)($ in millions, except percentages)
Note 1: Estimated pre-acquisition revenues for the three months ended December 31, 2018 from companies acquired after September 30, 2018. (Obtained from unaudited vendor financial information.)
Three months ended December 31,
Period-Over-Period Change
Year ended December 31,
Period-Over-Period Change
Dec. 31 Mar. 31 Jun. 30 Sep. 30 Dec. 31 Mar. 31 Jun. 30 Sep. 30 Dec. 31
2017 2018 2018 2018 2018 2019 2019 2019 2019
Licenses 0% ‐9% ‐10% ‐11% ‐11% ‐4% 2% ‐16% ‐3%Professional services 3% ‐3% ‐5% ‐6% 0% ‐2% ‐3% ‐6% ‐7%Hardware and other 19% ‐12% ‐7% ‐17% 14% 1% ‐16% 2% ‐24%Maintenance and other recurring 4% 3% 4% 3% 3% 4% 4% 3% 4%
Revenue 5% ‐1% 0% ‐2% 2% 2% 1% 0% ‐1%
Quarter Ended

7
acquisition revenues included from the relevant companies acquired in 2018 and 2019 was $36 million and $132 million for the three and twelve month periods ended December 31, 2018, respectively. Organic revenue growth was negative 3% and negative 1% respectively for the three and twelve months ended December 31, 2019 compared to the same periods in 2018, and negative 2% and positive 2% respectively after adjusting for the impact of changes in the valuation of the US dollar against most major currencies in which the Company transacts business. For comparative purposes the table below shows the quarterly organic growth as compared to the same period in the prior year by revenue type since Q4 2017 adjusting for the impact of foreign exchange movements.
Expenses:
The following table displays the breakdown of our expenses:
Overall expenses for the quarter ended December 31, 2019 increased 20%, or $120 million to $724 million,
compared to $604 million during the same period in 2018. As a percentage of total revenue, expenses increased to 76% for the quarter ended December 31, 2019 from 73% for the same period in 2018. During the fiscal year ended December 31, 2019, expenses increased 15%, or $345 million to $2,648 million, compared to $2,303 million during the same period in 2018. As a percentage of total revenue, expenses were 76% for the fiscal year ended December 31, 2019 and 75% for the same period in 2018. The change in valuation of the US dollar against most major currencies in which the Company transacts business resulted in an approximate 1% and 2% decrease in expenses for the three and twelve months ended December 31, 2019 respectively compared to the comparable periods of 2018.
Staff expense – Staff expenses increased 20% or $79 million for the quarter ended December 31, 2019 and 15% or $232 million for the fiscal year ended December 31, 2019 over the same periods in 2018. Staff expense
Dec. 31 Mar. 31 Jun. 30 Sep. 30 Dec. 31 Mar. 31 Jun. 30 Sep. 30 Dec. 31
2017 2018 2018 2018 2018 2019 2019 2019 2019
Licenses 11% ‐6% ‐1% ‐1% 18% 11% 20% ‐5% ‐19%Professional services 6% ‐1% 16% 6% 15% 4% ‐7% ‐2% ‐7%Hardware and other ‐5% ‐41% ‐33% ‐25% ‐34% ‐9% ‐3% ‐11% 0%Maintenance and other recurring 4% 6% 5% 6% 6% 5% 4% 2% 1%
Revenue 5% 2% 4% 4% 6% 5% 4% 1% ‐2%
Quarter Ended
2019 2018 $ % 2019 2018 $ %
ExpensesStaff 481 402 79 20% 1,797 1,565 232 15%Hardware 33 32 1 4% 101 96 5 6%Third party license, maintenance and professional services 82 71 11 16% 300 265 35 13%Occupancy 9 20 (11) -55% 35 78 (43) -56%
Travel, Telecommunications, Supplies & Software and equipment 58 50 8 15% 201 181 20 11%Professional fees 15 11 4 40% 49 39 10 26%Other, net 19 13 7 55% 73 52 21 39%Depreciation 27 7 20 291% 92 27 65 242%
724 604 120 20% 2,648 2,303 345 15%Due to rounding, certain totals may not foot and certain percentages may not reconcile.
($ in millions, except percentages) ($ in millions, except percentages)
Three months ended December 31,
Period-Over-Period Change
Year ended December 31,
Period-Over-Period Change

8
can be broken down into five key operating departments: Professional Services, Maintenance, Research and Development, Sales and Marketing, and General and Administrative. Included within staff expenses for each of the above five departments are personnel and related costs associated with providing the necessary services. The table below compares the period over period variances.
The increase in staff expenses for the three and twelve months ended December 31, 2019 was primarily due to the growth in the number of employees compared to the same periods in 2018 primarily due to acquisitions.
Hardware expenses – Hardware expenses increased 4% or $1 million for the quarter ended December 31, 2019 and 6% or $5 million for the fiscal year ended December 31, 2019 over the same periods in 2018 as compared with the negative 12% and negative 1% increase in hardware and other revenue for the three and twelve month periods ended December 31, 2019 respectively over the comparable periods in 2018. Hardware margins for the three and twelve months ended December 31, 2019 were 36% and 42% respectively as compared to 46% and 45% for the comparable periods in 2018.
Third party license, maintenance and professional services expenses – Third party license, maintenance and professional services expenses increased 16% or $11 million for the quarter ended December 31, 2019 and 13% or $35 million for the fiscal year ended December 31, 2019 over the same periods in 2018. The increase is primarily due to third party license, maintenance and professional services expenses of acquired businesses.
Occupancy expenses – Occupancy expenses decreased 55% or $11 million for the quarter ended December 31, 2019 and 56% or $43 million for the fiscal year ended December 31, 2019 over the same periods in 2018. The decrease is a result of the Company’s adoption of IFRS 16, “Leases”. (See the “New standards and interpretations adopted” section below.) The Company has adopted IFRS 16 with an initial adoption date of January 1, 2019. The Company utilized the modified retrospective method to adopt the new standard and therefore, the comparative information has not been restated and continues to be reported under IAS 17, “Leases” and related interpretations. Under IAS 17 occupancy costs would have been approximately $24 million and $87 million for the three and twelve months ended December 31, 2019 respectively, an increase of 23% and 11% over the same periods in 2018 respectively.
Travel, Telecommunications, Supplies & Software and equipment expenses – Travel, Telecommunications, Supplies & Software and equipment expenses increased 15% or $8 million for the quarter ended December 31, 2019 and 11% or $20 million for the fiscal year ended December 31, 2019 over the same periods in 2018. The increase in these expenses is primarily due to expenses incurred by acquired businesses.
Professional fees – Professional fees increased 40% or $4 million for the quarter ended December 31, 2019 and 26% or $10 million for the fiscal year ended December 31, 2019 over the same periods in 2018. There are no individually material reasons contributing to this variance.
2019 2018 $ % 2019 2018 $ %
Professional services 103 89 14 15% 385 341 43 13%Maintenance 97 83 15 18% 371 327 44 13%Research and development 132 106 26 24% 491 421 71 17%Sales and marketing 69 57 12 21% 254 219 35 16%General and administrative 81 67 13 20% 297 257 39 15%
481 402 79 20% 1,797 1,565 232 15%Due to rounding, certain totals may not foot and certain percentages may not reconcile.
Three months ended December 31,
Period-Over-Period Change
Year ended December 31,
Period-Over-Period Change
($ in millions, except percentages) ($ in millions, except percentages)

9
Other, net – Other expenses increased 55% or $7 million for the quarter ended December 31, 2019 and 39% or $21 million for the fiscal year ended December 31, 2019 over the same periods in 2018. The following table provides a further breakdown of expenses within this category.
The contingent consideration expense amounts recorded for the periods above relate to an increase (decrease) in anticipated acquisition earnout payment accruals primarily as a result of increases (decreases) to revenue forecasts for the associated acquisitions. Revenue forecasts are updated on a quarterly basis and the related anticipated acquisition earnout payment accruals are updated accordingly. There are no individually material reasons contributing to the remaining variances.
Depreciation – Depreciation of property and equipment increased 291% or $20 million for the quarter ended December 31, 2019 and 242% or $65 million for the fiscal year ended December 31, 2019 over the same periods in 2018. The increase is primarily a result of the Company’s adoption of IFRS 16 as explained in the “New standards and interpretations adopted” section below. Under IAS 17 depreciation expense would have been approximately $11 million and $34 million for the three and twelve months ended December 31, 2019 respectively, an increase of 59% and 26% over the same periods in 2018 respectively. The increase is primarily due to the depreciation expense associated with acquired businesses.
Other Income and Expenses:
The following table displays the breakdown of our other income and expenses:
2019 2018 $ % 2019 2018 $ %
Advertising and promotion 13 11 1 11% 46 43 4 8%
Recruitment and training 5 5 (0) -4% 19 17 2 11%
Bad debt expense 1 1 (0) -12% 4 4 1 23%
R&D tax credits (10) (5) (4) 76% (24) (21) (3) 13%
Contingent consideration 1 (4) 5 NM 9 (2) 12 NM
Other expense, net 9 4 5 131% 18 12 5 44%
19 13 7 55% 73 52 21 39%
NM - Not meaningful
Due to rounding, certain totals may not foot and certain percentages may not reconcile.
Three months ended December 31,
Period-Over-Period Change
Year ended December 31,
Period-Over-Period Change
($ in millions, except percentages) ($ in millions, except percentages)
2019 2018 $ % 2019 2018 $ %
Amortization of intangible assets 96 70 26 38% 331 279 52 19%Foreign exchange (gain) loss (9) (6) (3) 42% 11 (3) 14 NMTSS membership liability revaluation charge 22 18 5 26% 52 55 (4) -6%Finance and other expense (income) (2) (4) 2 -43% (4) (17) 13 -75%Bargain purchase gain (10) (68) 58 -86% (45) (69) 23 -34%Finance costs 12 8 4 57% 42 26 16 60%Income tax expense (recovery) 29 29 (0) 0% 123 106 17 16%
140 47 92 197% 509 377 131 35%NM - Not meaningfulDue to rounding, certain totals may not foot and certain percentages may not reconcile.
($ in millions, except percentages) ($ in millions, except percentages)
Three months ended December 31,
Period-Over-Period Change
Year ended December 31,
Period-Over-Period Change

10
Amortization of intangible assets – Amortization of intangible assets increased 38% or $26 million for
the quarter ended December 31, 2019 and 19% or $52 million for the fiscal year ended December 31, 2019 over the same periods in 2018. The increase in amortization expense for the three and twelve months ended December 31, 2019 is primarily attributable to an increase in the carrying amount of our intangible asset balance over the twelve-month period ended December 31, 2019 as a result of acquisitions completed during this twelve-month period.
Foreign exchange – Most of our businesses are organized geographically so many of our expenses are incurred in the same currency as our revenues, which mitigates some of our exposure to currency fluctuations. For the three and twelve months ended December 31, 2019, we realized a foreign exchange gain of $9 million and loss of $11 million respectively compared to gains of $6 million and $3 million for the same periods in 2018. The following table provides a breakdown of these amounts.
The remaining foreign exchange gains and losses per the table above are primarily related to the unrealized foreign exchange translation gains and losses of certain net Canadian dollar denominated liability balances to US dollars as a result of the Canadian dollar’s depreciation or appreciation against the US dollar.
TSS membership liability revaluation charge – The valuation of the TSS membership liability that was put in place in Q4 2014 increased by approximately 11% or $22 million from Q3 2019, and approximately 28% or $52 million from Q4 2018. The increases are primarily the result of the growth in TSS’ reported trailing twelve month maintenance revenue (primarily due to acquisitions). Maintenance revenue and net tangible assets are the two main drivers in the calculation of the liability. The liability recorded on the balance sheet increased by 20% or $37 million over the twelve month period ended December 31, 2019 from $184 million to $221 million as a result of the revaluation charge of $52 million offset by a distribution to the TSS minority owners of $11 million and a $3 million foreign exchange gain that was recorded through other comprehensive income. The TSS membership liability is denominated in Euros and the Euro depreciated versus the US dollar during 2019.
Finance and other expense (income) – Finance and other income for the three and twelve month periods ended December 31, 2019 was $2 million and $4 million respectively compared to $4 million and $17 million for the comparable periods in 2018. In September 2008 the Company acquired certain assets and liabilities of Maximus Inc.’s Asset, Justice, and Education Solutions businesses. As part of the acquisition, the Company recorded an accrual of $8 million for financial liabilities potentially due on a long-term acquired contract. No financial liabilities were ever assessed and the statute of limitations now restricts any legal action by the customer with regards to the acquired contract. The $8 million accrual was released into income in Q1 2018. Interest earned on cash balances
2019 2018 $ % 2019 2018 $ %
Unrealized foreign exchange (gain) loss related to:
‐ revaluation of intercompany loans between
entities with differing functional currencies (1) (16) 4 (20) NM (7) 13 (20) NM
‐ revaulation of the Company's unsecured subordinated floating rate debentures as a result of the appreciation (depreciation) of the Canadian dollar against the US dollar. 4 (12) 16 NM 10 (19) 29 NM
Remaining foreign exchange (gain) loss 4 2 1 63% 9 3 6 208%
(9) (6) (3) 41% 11 (3) 15 NM
NM - Not meaningful
Due to rounding, certain totals may not foot and certain percentages may not reconcile.
(1) Offsetting amounts recorded in other comprehensive income. Net impact to Total comprehensive income for each period is nil.
Three months ended December 31,
Period-Over-Period Change
Year ended December 31,
Period-Over-Period Change
($ in millions, except percentages) ($ in millions, except percentages)

11
for the three and twelve months ended December 31, 2019 was $0 million and $3 million respectively, compared to $4 million and $5 million for the same periods in 2018.
Bargain purchase gain – Bargain purchase gain adjustments totalling $10 million and $45 million were
recorded in the three and twelve month periods ended December 31, 2019 respectively relating to multiple acquisitions made during 2018 and 2019 compared to $68 million and $69 million for the same periods in 2018. In Q4 2018 the Company acquired a business that was undergoing an extensive restructuring. The seller of that business capitalized the balance sheet on closing with cash in the amount of $53 million (€47 million) that is being utilized to fund losses generated by the business, contributing to a bargain purchase gain of $63 million being recorded in Q4 2018. Revisions to the restructuring cost expectations resulted in an additional bargain purchase gain of $4 million being recorded in Q1 2019. An additional payment from the seller relating to revisions to the acquired net tangible asset balance resulted in a further $7 million bargain purchase gain being recorded in Q3 2019. The business recorded a net loss excluding the bargain purchase gains and amortization of intangible assets expense, of $10 million in the twelve month period ended December 31, 2019. There was no current income tax recovery recorded in 2019 associated with these losses. Bargain purchase gain adjustments totalling $6 million and $30 million were recorded in the three and twelve month periods ended December 31, 2019 respectively relating to an acquisition made in Q1 2019 where the seller will continue as a minority partner in the acquired business. The seller contributed $17 million into the partnership on acquisition. This business recorded a net loss excluding the bargain purchase gains and amortization of intangible assets expense of $7 million and $13 million for the three and twelve month periods ended December 31, 2019.
Finance costs – Finance costs for the quarter ended December 31, 2019 increased $4 million to $12 million,
compared to $8 million for the same period in 2018. During the twelve months ended December 31, 2019, finance costs increased $16 million to $42 million, compared to $26 million for the same period in 2018. Interest on debt and debentures increased $2 million and $6 million for the three and twelve month periods ended December 31, 2019 respectively over the same periods in 2018 as a result of an increase in the average amount of debt outstanding. The remaining increase is primarily a result of the Company’s adoption of IFRS 16 as explained in the “New standards and interpretations adopted” section below. Under IFRS 16 interest expense on lease obligations totaling $4 million and $7 million was recorded in the three and twelve month periods ended December 31, 2019 respectively, with no similar expense being recorded in 2018.
Income taxes – We operate globally and we calculate our tax provision in each of the jurisdictions in which we conduct business. Our effective tax rate on a consolidated basis is, therefore, affected by the realization and anticipated relative profitability of our operations in those various jurisdictions, as well as different tax rates that apply and our ability to utilize tax losses and other credits. For both the quarters ended December 31, 2019 and December 31, 2018, income tax expense was $29 million. During the twelve months ended December 31, 2019, income tax expense increased $17 million to $123 million compared to $106 million for the same period in 2018. Current tax expense has historically approximated our cash tax expense however the quarterly expense can sometimes fall outside of the annual range due to out of period adjustments. Current tax expense reflects gross taxes before the application of R&D tax credits which are classified as part of “other, net” expenses in the statement of income.
Constellation is subject to tax audits in the countries in which the Company carries on business globally.
These tax audits could result in additional tax expense in future periods relating to historical filings. Reviews by tax authorities generally focus on, but are not limited to, the validity of the Company’s inter-company transactions, including financing and transfer pricing policies which generally involve subjective areas of taxation and a significant degree of judgment. If any of these tax authorities are successful with their challenges, the Company’s income tax expense may be adversely affected and Constellation could also be subject to interest and penalty charges.

12
Net Income and Earnings per Share:
Net income for the quarter ended December 31, 2019 was $92 million compared to net income of $179 million for the same period in 2018. On a per share basis this translated into a net income per diluted share of $4.34 in the quarter ended December 31, 2019 compared to net income per diluted share of $8.46 for the same period in 2018. For the 2019 fiscal year, net income was $333 million or $15.73 per diluted share compared to $379 million or $17.91 per diluted share for the 2018 fiscal year. There was no change in the number of shares outstanding.
Net cash flows from operating activities (“CFO”):
For the quarter ended December 31, 2019, CFO increased $46 million to $255 million compared to $208 million for the same period in 2018 representing an increase of 22%. For the twelve months of 2019, CFO increased $105 million to $767 million compared to $662 million during the same period in 2018, representing an increase of 16%. In conjunction with the Company’s adoption of IFRS 16 on January 1, 2019, lease obligation and interest payments that have historically been deducted from CFO are now recorded as a component of cash flows used in financing activities. For the three and twelve months ended December 31, 2019 lease obligation and interest payments totaled $19 million and $59 million respectively. If lease obligation and interest payments were deducted from CFO for the three and twelve months ended December 31, 2019 the increase in CFO would have been 13% and 7% over the same periods in 2018.
Free cash flow available to shareholders (“FCFA2S”):
For the quarter ended December 31, 2019, FCFA2S increased $14 million to $193 million compared to $180 million for the same period in 2018 representing an increase of 8%. For the twelve months of 2019, FCFA2S increased $32 million to $590 million compared to $559 million during the same period in 2018, representing an increase of 6%. The primary reason for the large variance between the 6% growth in FCFA2S and the 14% revenue growth for the twelve months of 2019 is that FCFA2S includes the impact of changes in non-cash operating assets and liabilities exclusive of effects of business combinations or “changes in non-cash operating working capital”. For the twelve months ended December 31, 2019 there was $28 million of cash used in non-cash operating working capital compared to $14 million of cash generated from non-cash operating working capital for the same period in 2018.
There are many reasons contributing to the non-cash operating working capital impact variance none of which are indicative of an underlying concern with the Company’s overall non-cash operating working capital balance. See “Non-IFRS Measures” for a description of FCFA2S.
2019 2018 $ %
FCFA2S 590 559 32 6%
Add back change in non-cash operating working capital 28 (14) 42 NM
FCFA2S excluding changes in non-cash operating working capital 618 545 73 13%
NM - Not meaningfulDue to rounding, certain totals may not foot and certain percentages may not reconcile.
Period-Over-Period Change
Year ended December 31,
($ in millions, except percentages)

13
The following table reconciles FCFA2S to net cash flows from operating activities:
Quarterly Results
We experience seasonality in our operating results in that CFO and FCFA2S in the first quarter of every year is typically the highest and CFO and FCFA2S in the second quarter of every year is the lowest. The key driver impacting this seasonality is the timing of annual maintenance contract renewals. Our quarterly results may also fluctuate as a result of the various acquisitions which may be completed by the Company in any given quarter. We may experience variations in our net income on a quarterly basis depending upon the timing of certain expenses or gains, which may include changes in provisions, acquired contract liabilities, foreign exchange gains and losses, bargain purchase gains, and gains or losses on the sale of financial and other assets.
Supplemental Financial Information We will no longer be including the non-IFRS and IFRS tables that were historically included in the annual letter to shareholders. However, the Average Invested Capital figure will be provided for purposes of calculating a
2019 2018 2019 2018
Net cash flows from operating activities 255 208 767 662 Adjusted for:Interest paid on lease obligations (2) - (7) - Interest paid on other facilities (8) (7) (31) (24) Credit facility transaction costs (2) (1) (3) (4) Payments of lease obligations (17) - (51) - TSS membership liability revaluation charge (22) (18) (52) (55) Property and equipment purchased (10) (7) (34) (25) Interest and dividends received 0 4 3 5
Free cash flow available to shareholders 193 180 590 559
Due to rounding, certain totals may not foot.
Three months ended December 31,
Year ended December 31,
($ in millions, except percentages) ($ in millions, except percentages)
Dec. 31 Mar. 31 Jun. 30 Sep. 30 Dec. 31 Mar. 31 Jun. 30 Sep. 30 Dec. 312017 2018 2018 2018 2018 2019 2019 2019 2019
Revenue 688 718 752 759 831 819 846 870 956 Net income 76 83 52 66 179 87 73 82 92 CFO 163 258 53 143 208 284 50 177 255 FCFA2S 143 242 27 112 178 250 12 134 193
Net income per share Basic & diluted 3.59 3.90 2.45 3.10 8.46 4.09 3.45 3.85 4.34
CFO per share Basic & diluted 7.67 12.16 2.50 6.75 9.84 13.40 2.36 8.37 12.02
FCFA2S per share Basic & diluted 6.75 11.41 1.27 5.29 8.39 11.81 0.58 6.35 9.12
($ in millions, except per share amounts)
Quarter Ended

14
return on invested capital metric. It will be left to the discretion of shareholders to determine what profitability metric to include in the numerator of such a calculation. The Average Invested Capital for 2019 was $2,260 million.
“Average Invested Capital” represents the average equity capital of Constellation, and is based on the company’s estimate of the amount of money that its common shareholders had invested in Constellation. Subsequent to that estimate, each period the company has kept a running tally, adding a proxy for cash earnings, subtracting any dividends, adding any amounts related to share issuances and making some minor adjustments, including adjustments relating to our use of certain incentive programs and the amortization of impaired intangibles. The company believes that Average Invested Capital is a useful measure as it approximates the retained earnings of the company prior to taking into consideration amortization of intangible assets, deferred income taxes, and certain other non-cash expenses (income) incurred or recognized by the company from time to time. Liquidity
Our net cash position (cash less bank indebtedness excluding capitalized transaction costs) decreased by $395 million to $36 million in the twelve months ended December 31, 2019 resulting from net capital deployed on acquisitions plus dividends paid exceeding cash flows from operations. Cash decreased by $273 million to $316 million at December 31, 2019 compared to $589 million at December 31, 2018 and bank indebtedness increased by $123 million to $280 million at December 31, 2019 compared to $157 million at December 31, 2018.
Total assets increased $552 million, from $2,935 million at December 31, 2018 to $3,488 million at December 31, 2019. The increase is primarily due to a $447 million increase in intangible assets and $234 million of right of use assets set up in conjunction with the Company’s adoption of IFRS 16 offset by a decrease in cash of $273 million. (See the “New standards and interpretations adopted” section below.) At December 31, 2019 four subsidiaries holding cash totalling $67 million maintained debt facilities, which facilities are without recourse to Constellation. As explained in the “Capital Resources and Commitments” section below, there are limitations on the ability of these subsidiaries to distribute funds to Constellation.
Current liabilities increased $388 million, from $1,344 million at December 31, 2018 to $1,732 million at December 31, 2019. The increase is primarily due to an increase in deferred revenue of $131 million mainly due to acquisitions made since December 31, 2018 and the timing of maintenance and other billings versus performance and delivery under those customer arrangements, lease obligations of $62 million set up in conjunction with the Company’s adoption of IFRS 16, and an increase in bank indebtedness of $69 million.
Net Changes in Cash Flows($ in millions)
Year ended December 31,
2019
Year ended December 31,
2018
Net cash provided by operating activities 767 662 Net cash from (used in) financing activities (496) (49)
Cash used in the acquisition of businesses (622) (603) Cash obtained with acquired businesses 118 118 Net cash from (used in) other investing activities (39) (23) Net cash from (used in) investing activities (544) (508)
Effect of foreign currency 1 (6)
Net increase (decrease) in cash and cash equivalents (273) 100

15
The net cash flows from operating activities were $767 million for the year ended December 31, 2019. The $767 million provided by operating activities resulted from $333 million in net income plus $601 million of non-cash adjustments to net income offset by $28 million of cash used in non-cash operating working capital and $140 million in taxes paid.
The net cash flows used in financing activities in the year ended December 31, 2019 were $496 million, which is mainly a result of dividends paid of $509 million, a distribution to the minority owners of TSS of $11 million, and interest paid on bank indebtedness and the Company’s unsecured subordinated floating rate debentures in the period of $31 million. In addition, lease obligation and interest payments of $59 million were included within financing activities in 2019 in conjunction with the Company’s adoption of IFRS 16. Under IAS 17 in 2018 this cash outflow would have reduced cash flows from operating activities. Offsetting the above was a net increase in bank indebtedness of $117 million.
The net cash flows used in investing activities in the year ended December 31, 2019 were $544 million. The cash used in investing activities was primarily due to acquisitions for an aggregate of $622 million (including payments for holdbacks relating to prior acquisitions) offset by $118 million of acquired cash.
We believe we have sufficient cash and available credit capacity to continue to operate for the foreseeable future. Generally, our VMS businesses operate with negative working capital as a result of the collection of maintenance payments and other revenues in advance of the performance of the related services. As such, management anticipates that it can continue to grow the business organically without any additional funding. If we continue to acquire VMS businesses we may need additional external funding depending upon the size and timing of the potential acquisitions.
Capital Resources and Commitments
CSI Facility
On December 13, 2019, Constellation completed an amendment and restatement of its revolving credit facility agreement (the “CSI Facility”), with a syndicate of Canadian chartered banks, U.S. banks, and a Japanese bank in the amount of $700 million, extending its maturity date to December 2024. The CSI Facility bears a variable interest rate with no fixed repayments required over the term to maturity. Interest rates are calculated at standard U.S. and Canadian reference rates plus interest rate spreads based on a leverage table. The CSI Facility is currently collateralized by the majority of the Company’s assets including the assets of certain material subsidiaries. The CSI Facility contains standard events of default which if not remedied within a cure period would trigger the repayment of any outstanding balance. As at December 31, 2019, $65 million had been drawn from this credit facility, and letters of credit totaling $21 million were issued, which limits the borrowing capacity on a dollar-for-dollar basis.
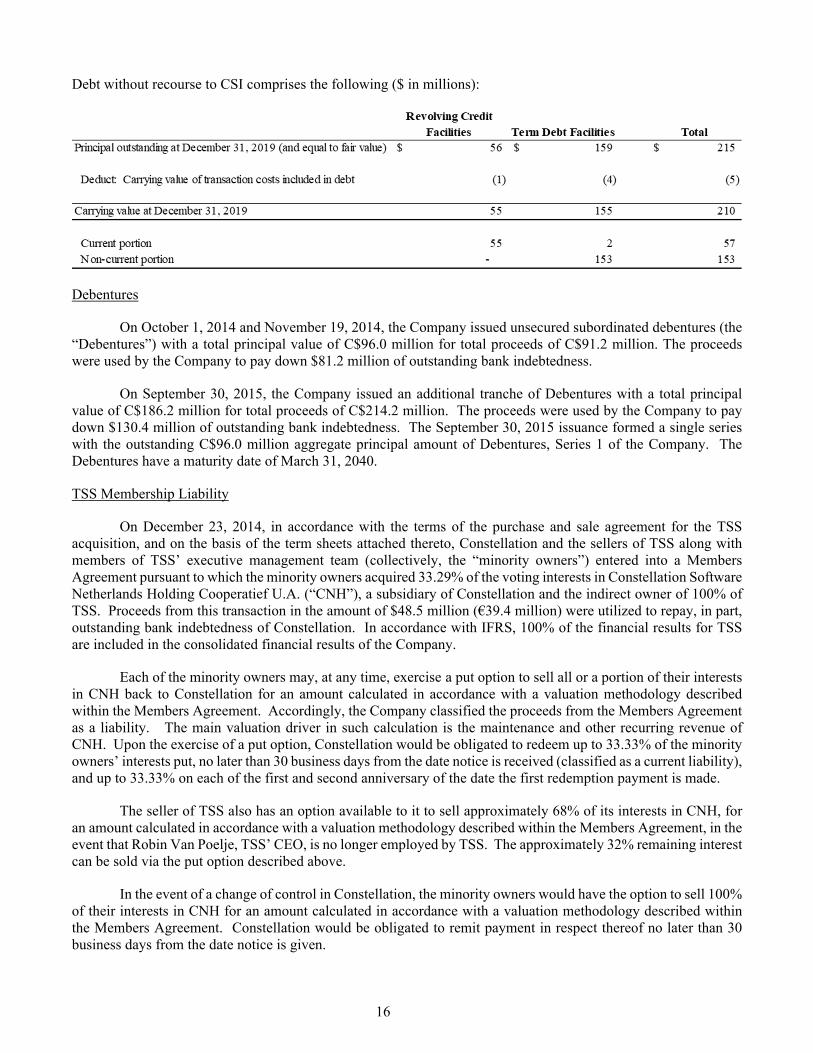
Debt without recourse to CSI
Certain of CSI’s subsidiaries have entered into term debt facilities and revolving credit facilities with various financial institutions. CSI does not guarantee the debt of its subsidiaries, nor are there any cross-guarantees between subsidiaries. The credit facilities are collateralized by substantially all of the assets of the borrowing entity and its subsidiaries. The credit facilities typically bear interest at a rate calculated using an interest rate index plus a margin. The financing arrangements for each subsidiary typically contain certain restrictive covenants, which may include limitations or prohibitions on additional indebtedness, payment of cash dividends, redemption of capital, capital spending, making of acquisitions and sales of assets. In addition, certain financial covenants must be met by those subsidiaries that have outstanding debt.
16
Debt without recourse to CSI comprises the following ($ in millions):
Debentures
On October 1, 2014 and November 19, 2014, the Company issued unsecured subordinated debentures (the “Debentures”) with a total principal value of C$96.0 million for total proceeds of C$91.2 million. The proceeds were used by the Company to pay down $81.2 million of outstanding bank indebtedness.
On September 30, 2015, the Company issued an additional tranche of Debentures with a total principal value of C$186.2 million for total proceeds of C$214.2 million. The proceeds were used by the Company to pay down $130.4 million of outstanding bank indebtedness. The September 30, 2015 issuance formed a single series with the outstanding C$96.0 million aggregate principal amount of Debentures, Series 1 of the Company. The Debentures have a maturity date of March 31, 2040.
TSS Membership Liability
On December 23, 2014, in accordance with the terms of the purchase and sale agreement for the TSS acquisition, and on the basis of the term sheets attached thereto, Constellation and the sellers of TSS along with members of TSS’ executive management team (collectively, the “minority owners”) entered into a Members Agreement pursuant to which the minority owners acquired 33.29% of the voting interests in Constellation Software Netherlands Holding Cooperatief U.A. (“CNH”), a subsidiary of Constellation and the indirect owner of 100% of TSS. Proceeds from this transaction in the amount of $48.5 million (€39.4 million) were utilized to repay, in part, outstanding bank indebtedness of Constellation. In accordance with IFRS, 100% of the financial results for TSS are included in the consolidated financial results of the Company.
Each of the minority owners may, at any time, exercise a put option to sell all or a portion of their interests in CNH back to Constellation for an amount calculated in accordance with a valuation methodology described within the Members Agreement. Accordingly, the Company classified the proceeds from the Members Agreement as a liability. The main valuation driver in such calculation is the maintenance and other recurring revenue of CNH. Upon the exercise of a put option, Constellation would be obligated to redeem up to 33.33% of the minority owners’ interests put, no later than 30 business days from the date notice is received (classified as a current liability), and up to 33.33% on each of the first and second anniversary of the date the first redemption payment is made.
The seller of TSS also has an option available to it to sell approximately 68% of its interests in CNH, for an amount calculated in accordance with a valuation methodology described within the Members Agreement, in the event that Robin Van Poelje, TSS’ CEO, is no longer employed by TSS. The approximately 32% remaining interest can be sold via the put option described above.
In the event of a change of control in Constellation, the minority owners would have the option to sell 100% of their interests in CNH for an amount calculated in accordance with a valuation methodology described within the Members Agreement. Constellation would be obligated to remit payment in respect thereof no later than 30 business days from the date notice is given.

17
Commencing at any time after December 31, 2023, Constellation may exercise a call option to purchase all of the minority owners’ interests in CNH, for an amount calculated in accordance with a valuation methodology described within the Members Agreement. Upon exercise of the call option, the full purchase price will be paid within 30 business days of the notice date, following which the minority owners’ membership in CNH will be terminated. There is a valuation premium if the call option is exercised versus the put option.
If any of TSS’ executive management team that participate in the Members Agreement are terminated for urgent cause as defined in Section 7:678 of the Dutch Civil Code, Constellation shall have the right to purchase all of the interests beneficially owned by the terminated executive for an amount calculated in accordance with the valuation methodology described within the Members Agreement. The full purchase price will be paid within 30 business days from the date notice is given, following which the terminated executive’s membership in CNH will be terminated. An option does exist for the terminated executive to elect to be paid in annual installments of 33.33% of his interests in CNH over a 3 year period. The valuation of the interests being purchased will be calculated at each annual payment date.
Other commitments
Commitments include operating leases for office equipment and facilities, letters of credit and performance bonds issued on our behalf by financial institutions in connection with facility leases and contracts with public sector customers. Also, occasionally we structure some of our acquisitions with contingent consideration based on the future performance of the acquired business. The fair value of contingent consideration recorded in our statement of financial position was $59 million at December 31, 2019. Aside from the aforementioned, we do not have any other business arrangements, derivative financial instruments, or any equity interests in non-consolidated entities that would have a significant effect on our assets and liabilities as at December 31, 2019.
The TSS membership liability commitment assumes that the minority owners have exercised their put option to sell 100% of their interests back to Constellation. This option however has not been exercised as at February 13, 2020. See the “Critical Accounting Estimate” section of the Company’s 2019 Annual Consolidated Financial Statements for a discussion on the valuation methodology utilized.
Foreign Currency Exposure
We operate internationally and have foreign currency risks related to our revenue, operating expenses, assets and liabilities denominated in currencies other than the U.S. dollar. Consequently, we believe movements in the foreign currencies in which we transact will impact future revenue and net income. The impact to organic revenue growth for the three and twelve months ended December 31, 2019 was approximately negative 1% and negative 2% respectively. We cannot predict the effect of foreign exchange gains or losses in the future; however, if significant foreign exchange losses are experienced, they could have a material adverse effect on our business, revenues, results of operations, and financial condition. The Company enters into forward foreign exchange contracts from time to time with the objective of mitigating volatility in profit or loss in respect of financial liabilities. In entering into these forward exchange contracts, the Company is exposed to the credit risk of the counterparties to such contracts and the possibility that the counterparties will default on their payment obligations under these contracts. However, given that the counterparties are Schedule 1 banks or affiliates thereof, the
($ in millions)Total < 1 yr 1-5 yrs > 5 yrs
Lease obligations 275 67 158 50 Holdbacks 101 76 25 - TSS membership liability 221 86 136 - Debentures 217 - - 217 CSI facility 65 65 - - Debt without recourse to Constellation Software Inc. 215 58 112 45 Total outstanding commitments 1,094 352 431 311
18
Company believes these risks are not material. During the year ended December 31, 2019, the Company did not purchase any contracts of this nature.
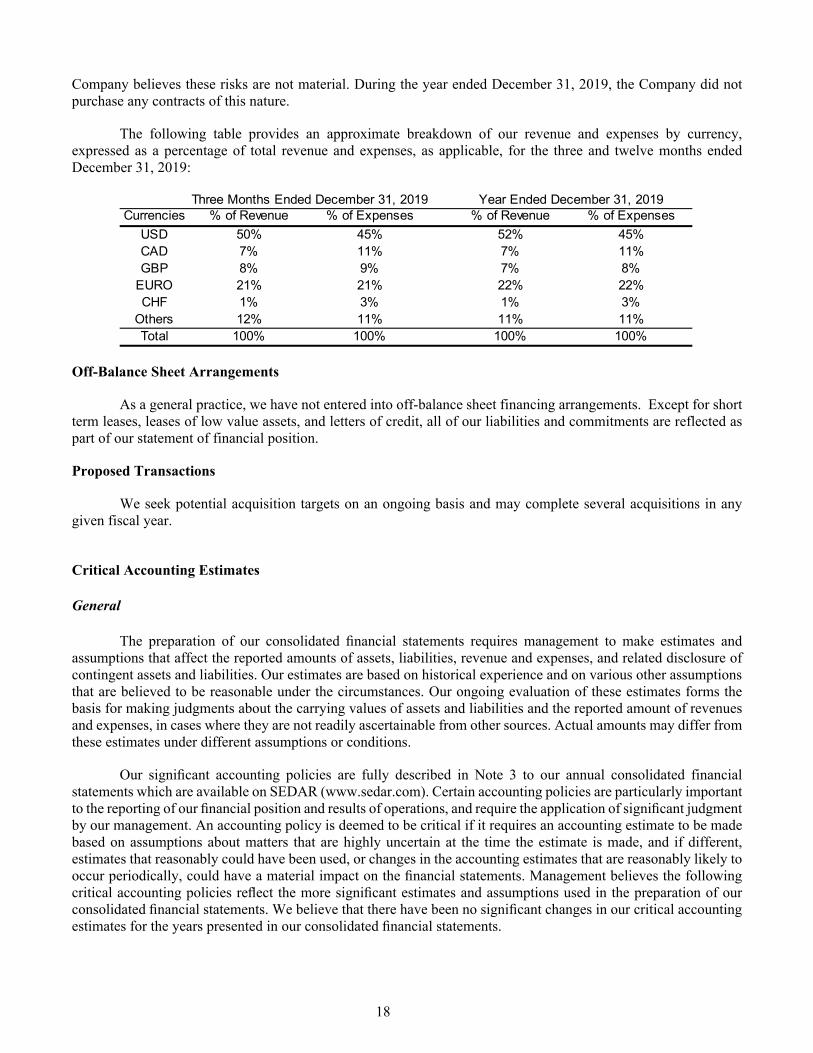
The following table provides an approximate breakdown of our revenue and expenses by currency, expressed as a percentage of total revenue and expenses, as applicable, for the three and twelve months ended December 31, 2019:
Off-Balance Sheet Arrangements
As a general practice, we have not entered into off-balance sheet financing arrangements. Except for short term leases, leases of low value assets, and letters of credit, all of our liabilities and commitments are reflected as part of our statement of financial position.
Proposed Transactions
We seek potential acquisition targets on an ongoing basis and may complete several acquisitions in any given fiscal year.
Critical Accounting Estimates
General
The preparation of our consolidated financial statements requires management to make estimates and assumptions that affect the reported amounts of assets, liabilities, revenue and expenses, and related disclosure of contingent assets and liabilities. Our estimates are based on historical experience and on various other assumptions that are believed to be reasonable under the circumstances. Our ongoing evaluation of these estimates forms the basis for making judgments about the carrying values of assets and liabilities and the reported amount of revenues and expenses, in cases where they are not readily ascertainable from other sources. Actual amounts may differ from these estimates under different assumptions or conditions.
Our significant accounting policies are fully described in Note 3 to our annual consolidated financial statements which are available on SEDAR (www.sedar.com). Certain accounting policies are particularly important to the reporting of our financial position and results of operations, and require the application of significant judgment by our management. An accounting policy is deemed to be critical if it requires an accounting estimate to be made based on assumptions about matters that are highly uncertain at the time the estimate is made, and if different, estimates that reasonably could have been used, or changes in the accounting estimates that are reasonably likely to occur periodically, could have a material impact on the financial statements. Management believes the following critical accounting policies reflect the more significant estimates and assumptions used in the preparation of our consolidated financial statements. We believe that there have been no significant changes in our critical accounting estimates for the years presented in our consolidated financial statements.
Currencies % of Revenue % of Expenses % of Revenue % of Expenses
USD 50% 45% 52% 45%CAD 7% 11% 7% 11%GBP 8% 9% 7% 8%
EURO 21% 21% 22% 22%CHF 1% 3% 1% 3%
Others 12% 11% 11% 11%Total 100% 100% 100% 100%
Three Months Ended December 31, 2019 Year Ended December 31, 2019

19
Revenue Recognition
Revenue represents the amount the Company expects to receive for products and services in its contracts with customers, net of discounts and sales taxes. The Company reports revenue under four revenue categories being, License, Hardware and other, Professional services, and Maintenance and other recurring revenue. Software license revenue is comprised of non-recurring license fees charged for the use of software products licensed under multiple-year or perpetual arrangements. Professional service revenue consists of fees charged for implementation services, custom programming, product training and consulting. Hardware and other revenue includes the resale of third party hardware as part of customized solutions, as well as sales of hardware assembled internally and the reimbursement of travel costs. Maintenance and other recurring revenue primarily consists of fees charged for customer support on software products post-delivery and also includes recurring fees derived from combined software/support contracts, transaction revenues, managed services, and hosted products.
Contracts with multiple products or services
Typically, the Company enters into contracts that contain multiple products and services such as software
licenses, hosted software-as-a-service, maintenance, professional services, and hardware. The Company evaluates these arrangements to determine the appropriate unit of accounting (performance obligation) for revenue recognition purposes based on whether the product or service is distinct from some or all of the other products or services in the arrangement. A product or service is distinct if the customer can benefit from it on its own or together with other readily available resources and Constellation’s promise to transfer the good or service is separately identifiable from other promises in the contractual arrangement with the customer. Non-distinct products and services are combined with other goods or services until they are distinct as a bundle and therefore form a single performance obligation.
Where a contract consists of more than one performance obligation, revenue is allocated to each based on
their estimated standalone selling price.
Nature of products and services The Company sells on-premise software licenses on both a perpetual and specified-term basis. Revenue
from the license of distinct software is recognized at the time that both the right-to-use the software has commenced and the software has been made available to the customer. Certain of the Company’s contracts with customers contain provisions that require the customer to renew optional support and maintenance in order to maintain the active right to use a perpetual or term license. The renewal payments after the initial bundled support and maintenance term in these cases apply to both the continued right-to-use the license and the support and maintenance renewal. Where the fees payable for the initial term are incremental to the fees for the renewal terms, the excess is treated as a prepayment for expected renewals and allocated (amortized) evenly over the expected customer renewals, up to the estimated life of the software that is typically 4-6 years.
Revenue from the license of software that involves complex implementation or customization that is not
distinct, and/or includes sales of hardware that is not distinct, is recognized as a combined performance obligation using the percentage-of-completion method based either on the achievement of contractually defined milestones or based on labour hours.
A portion of the Company's sales, categorized as hardware and other revenue, are accounted for as product
revenue. Product revenue is recognized when control of the product has transferred under the terms of an enforceable contract.
Revenue related to the customer reimbursement of travel related expenses incurred during a project
implementation where the Company is the principal in the arrangement is included in the hardware and other revenue category. Revenue is recognized as costs are incurred which is consistent with the period in which the

20
costs are invoiced. Reimbursable travel expenses incurred for which an invoice has not been issued, are recorded as part of unbilled revenue on the statement of financial position.
Maintenance and other recurring revenue primarily consists of fees charged for customer support on
software products post-delivery and also includes, to a lesser extent, recurring fees derived from software licenses that are not distinct from maintenance, transaction revenues, managed services, and hosted products.
Revenue from software-as-a-service (SaaS) arrangements, which allows customers to use hosted software
over a term without taking possession of the software, are provided on a subscription basis. Revenue from the SaaS subscription, which includes the hosted software and maintenance is recognized rateably over the term of the subscription. Significant incremental payments for SaaS in an initial term are recognized rateably over the expected renewal periods, up to the estimated life of the software.
Professional services revenue including installation, implementation, training and customization of
software is recognized by the stage of completion of the performance obligation determined using the percentage of completion method noted above or as such services are performed as appropriate in the circumstances. The revenue and profit of fixed price contracts is recognized on a percentage of completion basis when the outcome of a contract can be estimated reliably. When the outcome of the contract cannot be estimated reliably but the Company expects to recover its costs, the amount of expected costs is treated as variable consideration and the transaction price is updated as more information becomes known.
The timing of revenue recognition often differs from contract payment schedules, resulting in revenue that
has been earned but not billed. These amounts are included in unbilled revenue. Amounts billed in accordance with customer contracts, but not yet earned, are recorded and presented as part of deferred revenue.
Valuation of Identifiable Goodwill and Other Intangible Assets
Acquisitions have been accounted for using the acquisition method required by IFRS 3. Goodwill arising on acquisitions is measured as the fair value of the consideration transferred including the recognized amount of any non-controlling interest in the acquiree, if any, less the net recognized amount of the estimated fair value of identifiable assets acquired and liabilities assumed (subject to certain exemptions to fair value measurement principles such as deferred tax assets or liabilities), all measured as of the acquisition date. When the excess of the consideration transferred less the assets and liabilities acquired is negative, a bargain purchase gain is recognized immediately in profit or loss. Transaction costs that the Company incurs in connection with a business combination are expensed as incurred.
We use the income approach to value acquired technology and customer related intangible assets, which
are the two material intangible asset categories reported in our financial statements. The income approach is a valuation technique that calculates the fair value of an intangible asset based on
the cash flows that the asset can be expected to generate over its remaining useful life. We utilize the discounted cash flow (“DCF”) methodology which is a form of the income approach that begins with a forecast of the annual cash flows a market participant would expect the subject intangible asset to generate over a discrete projection period. The forecasted cash flows for each of the years in the discrete projection period are then converted to their present value equivalent using a rate of return appropriate for the risk of achieving the intangible assets’ projected cash flows, again, from a market participant perspective. The present value of the forecasted cash flows are then added to the present value of the residual value of the intangible asset (if any) at the end of the discrete projection period to arrive at a conclusion with respect to the estimated fair value of the subject intangible asset.
Specifically, we rely on the relief-from-royalty method to value the acquired technology and the multiple-
period excess earnings method (“MEEM”) to value customer relationship assets.

21
The underlying premise of the relief-from-royalty method is that the fair value of the technology is equal to the costs savings (or the "royalty avoided") resulting from the ownership of the asset by the avoidance of paying royalties to license the use of the technology from another owner. Accordingly the income forecast reflects an estimate of a fair royalty that a licensee would pay, on a percentage of revenue basis, to obtain a license to utilize the technology.
The MEEM method isolates the cash flows attributable to the subject asset by utilizing a forecast of
expected cash flows less the returns attributable to other enabling assets, both tangible and intangible. Goodwill is initially recorded when the purchase price paid for an acquisition exceeds the fair value
assigned to the net identifiable tangible and intangible assets acquired. Goodwill is not amortized but rather it is periodically assessed for impairment.
After initial recognition, goodwill is measured at cost less any accumulated impairment losses, with the
carrying value being reviewed for impairment at least annually and whenever events or changes in circumstances indicate that the carrying value may be impaired. We perform an annual review in the fourth quarter of each fiscal year, or more frequently if indicators of potential impairment exist, to determine if the recorded goodwill is impaired. In respect of equity accounted investees, the carrying amount of goodwill is included in the carrying amount of the investment, and an impairment loss on such an investment is not allocated to any asset, including goodwill, that forms part of the carrying amount of the equity accounted investee. No such losses have been recognized during the year.
The impairment test methodology is based on a comparison between the higher of fair value less costs to
sell and value-in-use of each of the Company's cash generating units (“CGU”) and the net asset carrying values (including goodwill). Within the Company's reporting structure, business units generally reflect the CGU and are one level below the six operating segments (Volaris, Harris, Total Specific Solutions, Jonas, Perseus, and Vela Operating Groups). In determining the recoverable amount, the Company applies an estimated market valuation multiple to the business unit's most recent annual recurring revenues, which are generally derived from post-contract customer support revenues, transactional revenues, and hosted products revenues. Valuation multiples applied by the Company for this purpose reflect current market conditions specific to the business unit and are assessed for reasonability by comparison to the Company's current and past acquisition experience involving ranges of revenue-based multiples required to acquire representative software companies and the Company’s overall revenue based-trading multiple. In addition, in certain instances, the recoverable amount is determined using a value-in-use approach which follows the same valuation process that is undertaken for the Company’s business acquisitions. An impairment is recognized if the carrying amount of a CGU exceeds its estimated recoverable amount. The recoverable amount of goodwill is estimated annually on December 31 of each year or whenever events or changes in circumstances indicate that the carrying value may be impaired.
We also review the carrying value of amortizable intangible assets for impairment whenever events and
circumstances indicate that the carrying value of an asset may not be recoverable from the estimated future cash flows expected to result from its use and eventual disposition. Any change in estimate which causes the undiscounted expected future cash flows to be less than the carrying value, would result in an impairment loss being recognized equal to the amount by which the carrying value of the asset exceeds the fair value of the asset.
The critical accounting estimates described above affect both the public and private segments of the
business. The approach taken by management in performing these estimates is not significantly different between segments.
TSS Membership Liability
Commencing any time after December 31, 2014, each of the minority owners may exercise a put option to sell all or a portion of their interests in CNH back to Constellation for an amount calculated in accordance with a

22
valuation methodology described within the Members Agreement. Accordingly, the Company classified the proceeds from the membership agreement as a liability. The main valuation driver in such calculation is the maintenance and other recurring revenue of CNH. Upon the exercise of a put option, Constellation would be obligated to redeem up to 33.33% of the minority owners’ interests put, no later than 30 business days from the date notice is received, and up to 33.33% on each of the first and second anniversary of the date the first redemption payment is made.
In determining the valuation of the liability at December 31, 2019 we assumed the minority owners exercised their put option on December 31, 2019, and redeemed 33.33% of their interests on exercise, and will redeem 33.33% on each of the first and second anniversary dates. Maintenance and recurring revenue of CNH for the fiscal year ended December 31, 2019 was used as the basis for valuing the interests at each redemption date. A similar approach will be utilized to value any interests that have not been put or called at the end of each subsequent reporting period. However, the actual maintenance and recurring revenue of CNH for the trailing twelve months from the date of the related reporting period end will be utilized in the calculation. Any increase or decrease in the value of the membership liability will be recorded as an expense or income respectively in the Consolidated Statements of Income for the period.
Accounting for Income Taxes
Significant management judgment is required in determining our provision for income taxes, our income tax assets and liabilities, and any valuation allowance recorded against our net income tax assets. We operate in multiple geographic jurisdictions, and to the extent that we have profits in each jurisdiction, these profits are taxed pursuant to the tax laws of their jurisdiction. Our effective tax rate may be affected by changes in, or interpretations of, tax laws in any given jurisdiction, the level of profitability, utilization of net operating losses and tax credit carry forwards, changes in geographical mix of income and expense, and changes in management’s assessment of matters, such as the ability to realize future tax assets. As a result of these considerations, we must estimate our income taxes in each of the jurisdictions in which we operate on a quarterly basis. This process involves estimating our actual current tax exposures, together with assessing temporary differences resulting from differing treatment of items for tax and accounting purposes. These differences result in future tax assets and liabilities, which are included in our consolidated balance sheet.
Current tax is the expected taxes payable or receivable on the taxable income or loss for the period, using
tax rates enacted or substantively enacted at the reporting date, and any adjustment to taxes payable in respect of previous years.
Deferred tax is recognized in respect of temporary differences between the carrying amounts of assets and
liabilities for financial reporting purposes and the amounts used for taxation purposes. Deferred tax is not recognized for temporary differences relating to investments in subsidiaries to the extent that it is probable that they will not reverse in the foreseeable future. In addition, deferred tax is not recognized for taxable temporary differences arising on the initial recognition of goodwill.
Deferred tax is measured at tax rates that are expected to be applied to temporary differences when they
reverse, based on the laws that have been enacted or substantively enacted by the reporting date. Deferred tax assets and liabilities are offset if there is a legally enforceable right to offset current tax liabilities and assets, and they relate to income taxes levied by the same tax authority on the same taxable entity, or on different tax entities, but we intend to settle current tax liabilities and assets on a net basis or their tax assets and liabilities will be realized simultaneously.
A deferred tax asset is recognized for unused tax losses, tax credits, difference in tax bases in the purchaser's
tax jurisdiction and its cost as reported in the consolidated financial statements as a result of an intra-group transfer of assets and deductible temporary differences, to the extent that it is probable that future taxable profits will be

23
available against which they can be utilized. Deferred tax assets are reviewed at each reporting date and are reduced to the extent that it is no longer probable that the related tax benefit will be realized.
We are subject to income tax audits by various authorities in respect of prior periods that could result in
additional tax expense in future periods. While the outcome of current outstanding actions and claims remains uncertain, it is expected that they will be resolved without a material impact to our financial position. However, there can be no assurances as to the final resolution of these matters and, if the final outcome is adverse to us, the amounts we will be required to pay and the loss of certain future tax deductions could be material to our financial statements.
Accounts Receivable
We evaluate the collectability of our trade receivables at both a specific and collective level. All individually significant receivables are assessed for specific impairment. All individually significant receivables found not to be specifically impaired, together with receivables that are not individually significant are collectively assessed for impairment by grouping together receivables with similar risk characteristics.
Work In Progress
For revenue arrangements that are accounted for under the percentage of completion method as well as other arrangements and contracts which limit our ability to invoice at certain milestones that do not match the timing of the actual provision of the services, we record such revenue and the related unbilled receivable in work in process. Similar to accounts receivable, we constantly have to evaluate our ability to bill and subsequently collect any amounts contained in the work in progress accounts. We review these balances on a periodic basis to ensure customer balances are prudent based upon a variety of factors, such as the financial health of the customer, macroeconomic considerations and historical experience. If circumstances related to specific customers change, our estimates of the recoverability of work in progress may be further adjusted.
Provisions
A provision is recognized if, as a result of a past event, the Company has a present legal or constructive obligation that can be estimated reliably, and it is probable that an outflow of economic benefits will be required to settle the obligation. Provisions are measured at the estimated future cash flows required to settle the present obligation, based on the most reliable evidence available at the reporting date. The estimated cash flows are discounted at a pre-tax rate that reflects current market assessments of the time value of money and the risks specific to the liability. The amortization of the discount is recognized as part of finance costs.
We are currently involved in various claims and legal proceedings. Quarterly, we review the status of each significant matter and assess our potential financial exposure. Because of the uncertainties related to these matters, provisions are based only on the best information available at the time. As additional information becomes available, we reassess the potential liability related to our pending claims and litigation and, if necessary, revise our provisions. Such revisions in the estimates of the potential liabilities could have a material impact on our results of operations and financial position.
New standards and interpretations adopted
IFRS 16 Leases
The Company has adopted IFRS 16 with an initial adoption date of January 1, 2019. The Company utilized the modified retrospective method to adopt the new standard and therefore, the comparative information has not been restated and continues to be reported under IAS 17, Leases and related interpretations.

24
IFRS 16 specifies how leases will be recognized, measured, presented and disclosed and it provides a single lessee model, requiring lessees to recognize right-of-use assets and lease liabilities for all major leases. The impact of the transition to IFRS 16 is shown in Note 31 of the Company’s Annual Consolidated Financial Statements for the year ended December 31, 2019. The Company’s accounting policy under IFRS 16 is as follows:
At inception of a contract, the Company assesses whether a contract is, or contains, a lease based on whether the contract conveys the right to control the use of an identified asset for a period of time in exchange for consideration. The Company recognizes a right-of-use asset and a lease liability at the lease commencement date. The right-of-use asset is initially measured based on the initial amount of the lease liability adjusted for any lease payments made at or before the commencement date, plus any initial direct costs incurred and an estimate of costs to dismantle and remove the underlying asset or to restore the underlying asset or the site on which it is located, less any lease incentives received. The assets are depreciated to the earlier of the end of the useful life of the right-of-use asset or the lease term using the straight-line method as this most closely reflects the expected pattern of consumption of the future economic benefits. The lease term includes periods covered by an option to extend if the Company is reasonably certain to exercise that option. In addition, the right-of-use asset can be periodically reduced by impairment losses, if any, and adjusted for certain remeasurements of the lease liability. The lease liability is initially measured at the present value of the lease payments that are not paid at the commencement date, discounted using the interest rate implicit in the lease or, if that rate cannot be readily determined, the Company’s incremental borrowing rate. Generally, the Company uses its incremental borrowing rate as the discount rate.
The lease liability is measured at amortized cost using the effective interest method. It is remeasured when there is a change in future lease payments arising from a change in an index or rate, if there is a change in the Company’s estimate of the amount expected to be payable under a residual value guarantee, or if the Company changes its assessment of whether it will exercise a purchase, extension or termination option. When the lease liability is remeasured in this way, a corresponding adjustment is made to the carrying amount of the right-of-use asset, or is recorded in profit or loss if the carrying amount of the right-of-use asset has been reduced to zero. The Company has elected to apply the practical expedient not to recognize right-of-use assets and lease liabilities for short-term leases that have a lease term of 12 months or less and leases of low value assets. The lease payments associated with these leases is recognized as an expense on a straight-line basis over the lease term.
Share Capital
As at February 13, 2020, there were 21,191,530 common shares outstanding.
Risks and Uncertainties
The Company’s business is subject to a number of risk factors which are described in our most recently filed AIF. Additional risks and uncertainties not presently known to us or that we currently consider immaterial also may impair our business and operations and cause the price of the common shares to decline. If any of the noted risks actually occur, our business may be harmed and the financial condition and results of operation may suffer significantly. In that event, the trading price of the common shares could decline, and shareholders may lose all or part of their investment.
Controls and Procedures Evaluation of disclosure controls and procedures:
Management is responsible for establishing and maintaining disclosure controls and procedures as defined under National Instrument 52-109. At December 31, 2019, the President and Chief Financial Officer concluded that the design and operation of these disclosure controls and procedures were effective and that material information relating to the Company, including its subsidiaries, was made known to them and was recorded, processed, summarized and reported within the time periods specified under applicable securities legislation.

25
Internal controls over financial reporting: The President and Chief Financial Officer have designed or caused to be designed under their supervision, disclosure controls and procedures which provide reasonable assurance that material information regarding the Company is accumulated and communicated to the Company’s management, including its President and Chief Financial Officer in a timely manner.
In addition, the President and Chief Financial Officer have designed or caused it to be designed under their supervision internal controls over financial reporting (“ICFR”) to provide reasonable assurance regarding the reliability of financial reporting and the preparation of financial statements. The President and Chief Financial Officer have been advised that the control framework the President and the Chief Financial Officer used to design the Company’s ICFR is recognized by the Committee of Sponsoring Organizations of the Treadway Commission.
The President and the Chief Financial Officer have evaluated, or caused to be evaluated under their
supervision, whether or not there were changes to its ICFR during the period ended December 31, 2019 that have materially affected, or are reasonably likely to materially affect the Company’s ICFR. No such changes were identified through their evaluation.
A control system, no matter how well conceived and operated, can provide only reasonable, not absolute,
assurance that its objectives are met. Due to inherent limitations in all such systems, no evaluations of controls can provide absolute assurance that all control issues, if any, within a company have been detected. Accordingly, our disclosure controls and procedures and our internal controls over financial reporting are effective in providing reasonable, not absolute, assurance that the objectives of our control systems have been met.

For the years ended December 31, 2019 and 2018
Consolidated Financial Statements(In U.S. dollars)
CONSTELLATIONSOFTWARE INC.

MANAGEMENT'S RESPONSIBILITY FOR FINANCIAL REPORTING December 31, 2019 The accompanying consolidated financial statements of Constellation Software Inc. ("Constellation") and its subsidiaries and all the information in Management's Discussion and Analysis are the responsibility of management and have been approved by the Board of Directors. The consolidated financial statements have been prepared by management in accordance with International Financial Reporting Standards ("IFRS"). The consolidated financial statements include certain amounts that are based on the best estimates and judgements of management and in their opinion present fairly, in all material respects, Constellation's financial position, results of operations and cash flows, in accordance with IFRS. Management has prepared the financial information presented elsewhere in the Management's Discussion and Analysis and has ensured that it is consistent with the consolidated financial statements, or has provided reconciliations where inconsistencies exist. Management of Constellation has developed and maintains a system of internal controls, which is supported by the internal audit function. Management believes the internal controls provide reasonable assurance that material transactions are properly authorized and recorded, financial records are reliable and form a basis for the preparation of consolidated financial statements and that Constellation's material assets are properly accounted for and safeguarded. The Board of Directors carries out its responsibility for the consolidated financial statements principally through its Audit Committee. This committee meets with management and the Company’s independent auditors to review the Company’s reported financial performance and to discuss audit, internal controls, accounting policies, and financial reporting matters. The consolidated financial statements were reviewed by the Audit Committee and approved by the Board of Directors. The consolidated financial statements have been audited by KPMG LLP, the external auditors, in accordance with Canadian generally accepted auditing standards on behalf of the shareholders. KPMG LLP has full and free access to the Audit Committee. February 13, 2020 "Mark Leonard" "Jamal Baksh" President Chief Financial Officer

3
INDEPENDENT AUDITORS’ REPORT To the Shareholders of Constellation Software Inc. Opinion
We have audited the consolidated financial statements of Constellation Software Inc. (“the
Entity”), which comprise:
the consolidated statements of financial position as at December 31, 2019 and December
31, 2018
the consolidated statements of income for the years then ended
the consolidated statements of comprehensive income for the years then ended
the consolidated statements of changes in equity for the years then ended
the consolidated statements of cash flows for the years then ended
and notes to the consolidated financial statements, including a summary of significant
accounting policies
(Hereinafter referred to as the “financial statements”).
In our opinion, the accompanying financial statements present fairly, in all material respects, the consolidated financial position of the Entity as at December 31, 2019 and 2018, and its consolidated financial performance and its consolidated cash flows for the years then ended in accordance with International Financial Reporting Standards (IFRS). Basis for Opinion We conducted our audit in accordance with Canadian generally accepted auditing standards. Our responsibilities under those standards are further described in the “Auditors’ Responsibilities for the Audit of the Financial Statements” section of our auditors’ report.
We are independent of the Entity in accordance with the ethical requirements that are relevant to our audit of the financial statements in Canada and we have fulfilled our other ethical responsibilities in accordance with these requirements.
We believe that the audit evidence we have obtained is sufficient and appropriate to provide a basis for our opinion.
Emphasis of Matter We draw attention to Notes 3(s) and 31 to the financial statements which indicates that the Entity has changed its accounting policy for leases, as a result of the adoption of IFRS 16, Leases, and has applied that change using the modified retrospective method. Our opinion is not modified in respect of this matter. Other Information Management is responsible for the other information. Other information comprises:
Management’s Discussion and Analysis filed with the relevant Canadian Securities Commissions.
4
Our opinion on the financial statements does not cover the other information and we do not and will not express any form of assurance conclusion thereon.
In connection with our audit of the financial statements, our responsibility is to read the other information identified above and, in doing so, consider whether the other information is materially inconsistent with the financial statements or our knowledge obtained in the audit and remain alert for indications that the other information appears to be materially misstated.
We obtained the information included in Management’s Discussion and Analysis filed with the relevant Canadian Securities Commissions as at the date of this auditors’ report. If, based on the work we have performed on this other information, we conclude that there is a material misstatement of this other information, we are required to report that fact in the auditors’ report.
We have nothing to report in this regard.
Responsibilities of Management and Those Charged with Governance for the Financial Statements Management is responsible for the preparation and fair presentation of the financial statements in accordance with International Financial Reporting Standards, and for such internal control as management determines is necessary to enable the preparation of financial statements that are free from material misstatement, whether due to fraud or error.
In preparing the financial statements, management is responsible for assessing the Entity’s ability to continue as a going concern, disclosing as applicable, matters related to going concern and using the going concern basis of accounting unless management either intends to liquidate the Entity or to cease operations, or has no realistic alternative but to do so.
Those charged with governance are responsible for overseeing the Entity’s financial reporting process. Auditors’ Responsibilities for the Audit of the Financial Statements
Our objectives are to obtain reasonable assurance about whether the financial statements as a whole are free from material misstatement, whether due to fraud or error, and to issue an auditors’ report that includes our opinion.
Reasonable assurance is a high level of assurance, but is not a guarantee that an audit conducted in accordance with Canadian generally accepted auditing standards will always detect a material misstatement when it exists.
Misstatements can arise from fraud or error and are considered material if, individually or in the aggregate, they could reasonably be expected to influence the economic decisions of users taken on the basis of the financial statements.
As part of an audit in accordance with Canadian generally accepted auditing standards, we exercise professional judgment and maintain professional skepticism throughout the audit.
We also: Identify and assess the risks of material misstatement of the financial statements, whether due to
fraud or error, design and perform audit procedures responsive to those risks, and obtain audit evidence that is sufficient and appropriate to provide a basis for our opinion. The risk of not detecting a material misstatement resulting from fraud is higher than for one resulting from error,

5
as fraud may involve collusion, forgery, intentional omissions, misrepresentations, or the override of internal control.
Obtain an understanding of internal control relevant to the audit in order to design audit procedures that are appropriate in the circumstances, but not for the purpose of expressing an opinion on the effectiveness of the Entity's internal control.
Evaluate the appropriateness of accounting policies used and the reasonableness of accounting estimates and related disclosures made by management.
Conclude on the appropriateness of management's use of the going concern basis of accounting and, based on the audit evidence obtained, whether a material uncertainty exists related to events or conditions that may cast significant doubt on the Entity's ability to continue as a going concern. If we conclude that a material uncertainty exists, we are required to draw attention in our auditors’ report to the related disclosures in the financial statements or, if such disclosures are inadequate, to modify our opinion. Our conclusions are based on the audit evidence obtained up to the date of our auditors’ report. However, future events or conditions may cause the Entity to cease to continue as a going concern.
Evaluate the overall presentation, structure and content of the financial statements, including the disclosures, and whether the financial statements represent the underlying transactions and events in a manner that achieves fair presentation.
Communicate with those charged with governance regarding, among other matters, the planned scope and timing of the audit and significant audit findings, including any significant deficiencies in internal control that we identify during our audit.
Provide those charged with governance with a statement that we have complied with relevant ethical requirements regarding independence, and communicate with them all relationships and other matters that may reasonably be thought to bear on our independence, and where applicable, related safeguards.
Obtain sufficient appropriate audit evidence regarding the financial information of the entities or business activities within the Entity to express an opinion on the financial statements. We are responsible for the direction, supervision and performance of the group audit. We remain solely responsible for our audit opinion.
Chartered Professional Accountants, Licensed Public Accountants The engagement partner on the audit resulting in this auditors’ report is Brendan Gerard Maher. Toronto, Canada February 13, 2020

CONSTELLATION SOFTWARE INC.Consolidated Statements of Financial Position
December 31, 2019 December 31, 2018*
Assets
Current assets:Cash 316$ 589$
Accounts receivable 422 362
Unbilled revenue 110 80
Inventories (note 5) 31 34
Other assets (note 6) 184 143
1,062 1,207
Non-current assets:
Property and equipment (note 7) 78 67
Right of use assets (notes 8 and 31) 234 ‐
Deferred income taxes (note 17) 45 47
Other assets (note 6) 72 64
1,997 1,549
2,425 1,728
Total assets 3,488$ 2,935$
Liabilities and Shareholders' Equity
Current liabilities:
CSI facility (note 10) 63$ ‐$
Debt without recourse to Constellation Software Inc. (note 11) 57 51
TSS membership liability (note 13) 86 67
Accounts payable and accrued liabilities 529 464
Dividends payable (note 18) 21 21
Deferred revenue 788 657
Provisions (note 14) 13 7
Acquisition holdback payables 76 47
Lease obligations (notes 15 and 31) 62 ‐
Income taxes payable (note 16) 36 30
1,732 1,344
Non-current liabilities:
Debt without recourse to Constellation Software Inc. (note 11) 153 102
TSS membership liability (note 13) 136 117
Debentures (note 12) 222 215
Deferred income taxes (note 17) 246 192
Acquisition holdback payables 25 25
Lease obligations (notes 15 and 31) 187 ‐
Other liabilities (note 6) 101 74
1,069 725
Total liabilities 2,800 2,069
Shareholders' equity (note 18):
Capital stock 99 99
Accumulated other comprehensive income (loss) (40) (37)
Retained earnings 628 804687 866
Subsequent events (notes 18 and 29)
Total liabilities and shareholders' equity 3,488$ 2,935$
See accompanying notes to the consolidated financial statements.
Intangible assets (note 9)
* The Company applied IFRS 16 "Leases" using the modified retrospective method. Under this method, the comparative information is not restated. See note 31.
(In millions of U.S. dollars, except per share amounts. Due to rounding, numbers presented may not foot.)
31

CONSTELLATION SOFTWARE INC.
2019 2018*
Revenue
License 226$ 198$
Professional services 673 616
Hardware and other 173 175
Maintenance and other recurring 2,417 2,072
3,490 3,060
Expenses
Staff 1,797 1,565
Hardware 101 96
Third party license, maintenance and professional services 300 265
Occupancy (note 31) 35 78
Travel, telecommunications, supplies, software and equipment 201 181
Professional fees 49 39
Other, net 73 52
Depreciation (note 31) 92 27
Amortization of intangible assets 331 279
2,979 2,582
Foreign exchange loss (gain) 11 (3)
TSS membership liability revaluation charge (note 13) 52 55
Finance and other expense (income) (note 19) (4) (17)
Bargain purchase gain (note 4) (45) (69)
Finance costs (notes 19 and 31) 42 26
55 (8)
Income before income taxes 456 486
Current income tax expense (recovery) 164 127
Deferred income tax expense (recovery) (41) (20)
Income tax expense (recovery) 123 106
Net income 333 379
Earnings per shareBasic and diluted (note 20) 15.73$ 17.91$
See accompanying notes to the consolidated financial statements.
Consolidated Statements of Income
Years ended December 31,
* The Company applied IFRS 16 "Leases" using the modified retrospective method. Under this method, the comparative information is not restated. See note 31.
(In millions of U.S. dollars, except per share amounts. Due to rounding, numbers presented may not foot.)
32

CONSTELLATION SOFTWARE INC.
2019 2018*
Net income 333$ 379$
(4) (10)
- -
(4) (10)
330$ 369$
Years ended December 31,
* The Company applied IFRS 16 "Leases" using the modified retrospective method. Under this method, the comparative information is not restated. See note 31.
Consolidated Statements of Comprehensive Income
Items that are or may be reclassified subsequently to net income:
Foreign currency translation differences from foreign operations
Deferred income tax recovery (expense)
Other comprehensive (loss) income for the period, net of income tax
Total comprehensive income (loss) for the period
See accompanying notes to the consolidated financial statements.
(In millions of U.S. dollars, except per share amounts. Due to rounding, numbers presented may not foot.)
33

CONSTELLATION SOFTWARE INC.
Capital stock Accumulated other comprehensive (loss) income
Retained earnings Total*
Cumulative translation account
99$ (37)$ 804$ 866$
Net income - - 333 333
- (4) - (4)
- (4) - (4)
- (4) 333 330
- - (509) (509)
99$ (40)$ 628$ 687$
(In millions of U.S. dollars, except per share amounts. Due to rounding, numbers presented may not foot.)Consolidated Statements of Changes in Equity
Foreign currency translation differences from
Transactions with owners, recorded directly in equity Dividends to shareholders of the Company (note 18)
foreign operations
Total other comprehensive income (loss)for the period
Total comprehensive income (loss) for the period
Year ended December 31, 2019
Balance at January 1, 2019
Total comprehensive income for the period:
Other comprehensive income (loss)
Balance at December 31, 2019
See accompanying notes to the consolidated financial statements.* The Company applied IFRS 16 "Leases" using the modified retrospective method. Under this method, the comparative information is not restated. See note31.
34

CONSTELLATION SOFTWARE INC.
(In millions of U.S. dollars, except per share amounts. Due to rounding, numbers presented may not foot.)Consolidated Statements of Changes in Equity
Capital stock Accumulated other comprehensive (loss) income
Retained earnings Total*
Cumulative translation account
99$ (27)$ 532$ 604$
- - (23) (23)
- - 379 379
- (10) - (10)
- (10) - (10)
- (10) 379 369
- - (85) (85)
99$ (37)$ 804$ 866$
* The Company applied IFRS 16 "Leases" using the modified retrospective method. Under this method, the comparative information is not restated. See note 31.
Dividends to shareholders of the Company (note 18)
Foreign currency translation differences fromforeign operations
Balance at January 1, 2018
Total comprehensive income for the period:
Net income
Other comprehensive income (loss)
Year ended December 31, 2018
Impact of change in accounting policy
Total other comprehensive income for the period
Total comprehensive income for the period
Transactions with owners, recorded directly in equity
Balance at December 31, 2018
See accompanying notes to the consolidated financial statements.
35

CONSTELLATION SOFTWARE INC.
2019 2018*
Net income 333$ 379$ Adjustments for:
Depreciation 92 27 331 279 52 55 (4) (17)
(45) (69) Finance costs 42 26
123 106 11 (3)
(28) 14 (140) (135) 767 662
Interest paid on lease obligations (note 31) (7) - Interest paid on other facilities (31) (24) Increase (decrease) in CSI facility 65 -
5 (46) 49 110 (2) (1) (3) (4)
Payments of lease obligations (note 31) (51) - Distribution to TSS minority owners (note 13) (11) -
(509) (85) (496) (49)
(549) (523) Cash obtained with acquired businesses (note 4) 118 118
(74) (80) Purchases of other investments (11) (3)
6 5 (34) (25)
(544) (508)
1 (6)
(273) 100
589 489
316$ 589$
Dividends paid
Cash flows from (used in) investing activities:
Change in non-cash operating assets and liabilities
Years ended December 31,
(In millions of U.S. dollars, except per share amounts. Due to rounding, numbers presented may not foot.)
Proceeds from issuance of term debt under facilities without recourse to CSI
Cash flows from operating activities:
Amortization of intangible assets
Bargain purchase (gain)
Foreign exchange loss (gain)
Income taxes paidNet cash flows from operating activities
Cash flows from (used in) financing activities:
* The Company applied IFRS 16 "Leases" using the modified retrospective method. Under this method, the comparative information is not restated. See note 31.
Consolidated Statements of Cash Flows
TSS membership liability revaluation chargeFinance and other expense (income)
Income tax expense (recovery)
exclusive of effects of business combinations (note 27)
Increase (decrease) in revolving credit under debt facilities without recourse to CSI
Credit facility transaction costs
Net cash flows from (used in) in financing activities
Post-acquisition settlement payments, net of receipts
Interest, dividends and other proceeds received
Repayments of term debt under facilities without recourse to CSI
Cash, end of period
See accompanying notes to the consolidated financial statements.
Acquisition of businesses (note 4)
Net cash flows from (used in) investing activities
Effect of foreign currency on
Increase (decrease) in cash
Cash, beginning of period
Property and equipment purchased
cash and cash equivalents
36

CONSTELLATION SOFTWARE INC. Notes to Consolidated Financial Statements (In millions of U.S. dollars, except per share amounts and as otherwise indicated.) (Due to rounding, numbers presented may not foot.) Years ended December 31, 2019 and 2018
37
Notes to the consolidated financial statements
1. Reporting entity 17. Deferred tax assets and liabilities
2. Basis of presentation 18. Capital and other components of equity
3. Significant accounting policies 19. Finance and other expense (income) and finance costs
4. Business acquisitions 20. Earnings per share
5. Inventories 21. Capital risk management
6. Other assets and liabilities 22. Financial risk management and financial instruments
7. Property and equipment 23. Revenue
8. Right of use assets 24. Operating segments
9. Intangible assets and goodwill 25. Contingencies
10. CSI facility 26. Guarantees
11. Debt without recourse to CSI 27. Changes in non-cash operating working capital
12. Debentures 28. Related parties
13. TSS membership liability 29. Subsequent events
14. Provisions 30. Comparative figures
15. Lease obligations 31. Explanation of adoption of IFRS 16
16. Income taxes

CONSTELLATION SOFTWARE INC. Notes to Consolidated Financial Statements (In millions of U.S. dollars, except per share amounts and as otherwise indicated.) (Due to rounding, numbers presented may not foot.) Years ended December 31, 2019 and 2018
38
1. Reporting entity
Constellation Software Inc. ("Constellation") is a company domiciled in Canada. The address of Constellation's registered office is 20 Adelaide Street East, Suite 1200, Toronto, Ontario, Canada. The consolidated financial statements of Constellation as at and for the fiscal years ended December 31, 2019 and December 31, 2018 comprise Constellation and its subsidiaries (together referred to as the "Company") and the Company's interest in associates. The Company is engaged principally in the development, installation and customization of software relating to the markets listed below, and in the provision of related professional services and support.
Public Sector: Public transit operators Asset management Municipal systems Para transit operators Fleet and facility management School administration School transportation District attorney Public safety Non-emergency medical Taxi dispatch Healthcare Ride share Benefits administration Rental Local government Insurance Electric utilities Agri-business Collections management Court Marine asset management Water utilities School and special library Communications Credit unions Drink distribution Education Financial services Notaries Fashion retail Pharmacies Long-term care Home and community care County systems Research management Retail management and distribution Public housing authorities Not-for-profit organizations Automotive Accountancy Catering Small and medium sized businesses Property management Food services Creative agencies Commercial printing Horticulture Event management Distillery Hospitality Manufacturing plant performance Advertising and marketing Project management Quality management Real estate brokers and agents Compliance Human resources and payroll Parking Manufacturing design

CONSTELLATION SOFTWARE INC. Notes to Consolidated Financial Statements (In millions of U.S. dollars, except per share amounts and as otherwise indicated.) (Due to rounding, numbers presented may not foot.) Years ended December 31, 2019 and 2018
39
Private Sector: Private clubs and daily fee golf courses Lease management Window manufacturers
Construction Winery management Cabinet manufacturers Food services Buy here pay here dealers Made-to-order manufacturers Health clubs RV and marine dealers Window and other dealers Moving and storage Pulp and paper manufacturers Multi-carrier shipping Metal service centers Agriculture equipment dealers Supply chain optimization Attractions Outdoor equipment dealers Multi-channel distribution Leisure centers Education Wholesale distribution
Retail management and distribution Healthcare electronic medical records Homebuilders
Radiology and laboratory information systems
Pharmaceutical and biotech manufacturers
Third party logistics warehouse management systems
Product licensing Event management Financial services Tire distribution Salons and spas Association management Housing finance agencies Municipal treasury and debt systems Public housing authorities Tour operators Auto clubs Real estate brokers and agents Long-term care Textiles and apparel Home and community care Hospitality Mining Ombudsman Aerospace Design and welding Manufacturing plant performance Oil and gas Publishing Marinas Small and medium sized businesses Healthcare Automotive Local government Legal Grocery Advertising and marketing Field service Inspections and management Asset management
2. Basis of presentation
(a) Statement of compliance
These consolidated financial statements have been prepared in accordance with International Financial Reporting Standards (IFRS), issued and outstanding as of February 13, 2020, the date the Board of Directors approved such financial statements.
(b) Basis of measurement
The consolidated financial statements have been prepared on the historical cost basis except for certain assets and liabilities initially recognized in connection with business combinations, and certain financial instruments and derivative financial instruments, which are measured at fair value.
(c) Functional and presentation currency
The consolidated financial statements are presented in U.S. dollars, which is Constellation's functional currency.

CONSTELLATION SOFTWARE INC. Notes to Consolidated Financial Statements (In millions of U.S. dollars, except per share amounts and as otherwise indicated.) (Due to rounding, numbers presented may not foot.) Years ended December 31, 2019 and 2018
40
(d) Use of estimates and judgements
The preparation of the consolidated financial statements in conformity with IFRS requires management to make judgements, estimates and assumptions that affect the application of accounting policies and reported amounts of assets, liabilities, income and expenses. Actual results may differ from these estimates.
Estimates and underlying assumptions are reviewed on an ongoing basis. Estimates are based on historical experience and other assumptions that are considered reasonable in the circumstances. The actual amount or values may vary in certain instances from the assumptions and estimates made. Changes will be recorded, with corresponding effect in profit or loss, when, and if, better information is obtained.
Information about assumptions and estimation uncertainties that have a significant risk of resulting in a material adjustment within the next financial year are included in the following notes:
Note 3(k) - Revenue recognition Note 3(a)(i) - Business combinations Note 3(m) - Income taxes Note 3(i) - Impairment Note 3(d) - Intangible assets Note 13 - TSS membership liability Note 25 - Contingencies Critical judgements that the Company has made in the process of applying accounting policies disclosed herein and that have a significant effect on the amounts recognized in the consolidated financial statements relate to the (i) determination of functional currencies for Constellation’s subsidiaries and, most notably, in respect of businesses acquired during the period; (ii) assessment as to whether certain customer contract obligations and deliverables related to multiple-element arrangements are distinct; (iii) recognition of deferred tax assets; and (iv) recognition of provisions. Functional currency – the Company applies judgement in situations where primary and secondary
indicators are mixed. Primary indicators such as the currency that mainly influence sales prices are given priority before considering secondary indicators.
The Company uses judgment to assess whether multiple products and services sold in a contract are considered distinct and should be accounted for as separate performance obligations or together. Estimates are required to determine the estimated standalone selling price (SSP) for each distinct performance obligation in order to allocate revenue where multiple performance obligations exist in a contract. The Company exercises judgement in determining whether a contract's outcome can be estimated reliably. The Company also applies estimates in the calculation of future contract costs and related profitability as it relates to labour hours, costs and other considerations, which are used in determining the value of amounts recoverable on contracts and timing of revenue recognition. Estimates are continually and routinely revised based on changes in the facts relating to each contract. Judgement is also needed in assessing the ability to collect the corresponding receivables.
Deferred tax assets - the recognition of deferred tax assets is based on forecasts of future taxable profit. The measurement of future taxable profit for the purposes of determining whether or not to recognize deferred tax assets depends on many factors, including the Company's ability to generate such profits and the implementation of effective tax planning strategies. The occurrence or non-occurrence of such events in the future may lead to significant changes in the measurement of deferred tax assets.

CONSTELLATION SOFTWARE INC. Notes to Consolidated Financial Statements (In millions of U.S. dollars, except per share amounts and as otherwise indicated.) (Due to rounding, numbers presented may not foot.) Years ended December 31, 2019 and 2018
41
Provisions - in recognizing provisions, the Company evaluates the extent to which it is probable that it has incurred a legal or constructive obligation in respect of past events and the probability that there will be an outflow of benefits as a result. The judgements used to recognize provisions are based on currently known factors which may vary over time, resulting in changes in the measurement of recorded amounts as compared to initial estimates.
3. Significant accounting policies
The accounting policies set out below have been applied consistently to all periods presented in these consolidated financial statements unless otherwise indicated.
The significant accounting policies have been applied consistently by the Company‘s subsidiaries.
(a) Basis of consolidation
(i) Business combinations
Acquisitions have been accounted for using the acquisition method required by IFRS 3 Business Combinations. Goodwill arising on acquisitions is measured as the fair value of the consideration transferred including the recognized amount of any non-controlling interest in the acquiree, if any, less the net recognized amount of the estimated fair value of identifiable assets acquired and liabilities assumed (subject to certain exemptions to fair value measurement principles such as deferred tax assets or liabilities), all measured as of the acquisition date. When the consideration transferred is less than the estimated fair value of assets acquired and liabilities assumed, a bargain purchase gain is recognized immediately in the consolidated statements of income. Transaction costs that the Company incurs in connection with a business combination are expensed as incurred.
The Company uses its best estimates and assumptions to reasonably value assets and liabilities assumed at the acquisition date as well as contingent consideration, where applicable, and these estimates are inherently uncertain and subject to refinement. As a result, during the measurement period, which may be up to one year from the acquisition date, the Company may record adjustments to the assets acquired and liabilities assumed with a corresponding offset to goodwill. Upon conclusion of the measurement period or final determination of the values of assets acquired or liabilities assumed, whichever comes first, any subsequent adjustments are recorded to profit or loss. For a given acquisition, the Company may identify certain pre-acquisition contingencies as of the acquisition date and may extend its review and evaluation of these pre-acquisition contingencies throughout the measurement period in order to obtain sufficient information to assess these contingencies as part of acquisition accounting, as applicable.
(ii) Consolidation methods
Entities over which the Company has control are fully consolidated from the date that control commences until the date that control ceases. Entities over which the Company has significant influence (investments in "associates") are accounted for under the equity method. Significant influence is assumed when the Company's interests are 20% or more, unless qualitative factors overcome this assumption.
Associates are those entities in which the Company has significant influence, but not control, over the financial and operating policies. Investments in associates are recognized initially at cost, inclusive of transaction costs. The Company's investment includes goodwill identified on acquisition, net of any accumulated impairment losses. The consolidated financial statements include the Company's share of the income and expenses and equity changes of

CONSTELLATION SOFTWARE INC. Notes to Consolidated Financial Statements (In millions of U.S. dollars, except per share amounts and as otherwise indicated.) (Due to rounding, numbers presented may not foot.) Years ended December 31, 2019 and 2018
42
equity accounted investees, from the date that significant influence commences until the date that significant influence ceases.
(iii) Transactions eliminated on consolidation
Intra-company balances and transactions, and any unrealized income and expenses arising from intra-company transactions, are eliminated in preparing the consolidated financial statements.
(b) Foreign currency translation
(i) Foreign currency transactions
Transactions in foreign currencies are translated to the respective functional currencies of subsidiaries of the Company at exchange rates at the dates of the transactions. Monetary assets and liabilities denominated in foreign currencies at the reporting date are re-measured to the functional currency at the exchange rate at that date. Foreign currency differences arising on re-measurement are recognized through profit or loss, except for differences arising on the retranslation of available-for-sale equity instruments, which are recognized in other comprehensive income. Non-monetary items that are measured in terms of historical cost in a foreign currency are translated using the exchange rate at the date of the transaction. Foreign currency gains and losses are reported in profit and loss on a net basis. The effect of currency translation adjustments on cash and cash equivalents is presented separately in the statements of cash flows and separated from investing and financing activities when deemed significant.
(ii) Foreign operations
The assets and liabilities of foreign operations, including goodwill and fair value adjustments arising on acquisition, are translated to U.S. dollars at exchange rates at the reporting date. The income and expenses of foreign operations are translated to U.S. dollars using average exchange rates for the month during which the transactions occurred. Foreign currency differences are recognized in other comprehensive income in the cumulative translation account; however, if the operation is a non-wholly owned subsidiary, then the relevant proportionate share of the translation difference is allocated to the non-controlling interest when applicable.
Foreign exchange gains or losses arising from a monetary item receivable from or payable to a foreign operation, the settlement of which is neither planned nor likely to occur in the foreseeable future and which its substance is considered to form part of the net investment in the foreign operation, are recognized in other comprehensive income in the cumulative amount of foreign currency translation differences. If, and when, settlement plans change or deemed likely to occur, then the accounting process in (b)(i) above is applied. When a foreign operation payable or receivable classified as a net investment is partially or fully disposed, the proportionate share of the cumulative amount in the translation reserve related to that foreign operation is transferred to profit or loss as part of the profit or loss on disposal. The Company has elected not to treat repayments of monetary items receivable or payable to a foreign operation as a disposition.
(c) Financial Instruments
The Company's financial instruments comprise cash, accounts receivable, CSI facility, Debt without recourse to CSI, debentures, Total Specific Solutions B.V. (“TSS”) membership liability, accounts payable and accrued liabilities, dividends payable, income taxes payable and holdback assets or liabilities on acquisitions.

CONSTELLATION SOFTWARE INC. Notes to Consolidated Financial Statements (In millions of U.S. dollars, except per share amounts and as otherwise indicated.) (Due to rounding, numbers presented may not foot.) Years ended December 31, 2019 and 2018
43
Financial assets are recognized in the consolidated statement of financial position if we have a contractual right to receive cash or other financial assets from another entity. Financial assets, including accounts receivable, are derecognized when the rights to receive cash flows from the investments have expired or were transferred to another party and the Company has transferred substantially all risks and rewards of ownership.
Financial liabilities include the CSI facility, Debt without recourse to CSI, TSS membership liability, debentures, accounts payable and accrued liabilities, dividends payable, income taxes payable and holdbacks on acquisitions. Financial liabilities are generally recognized initially at fair value, typically being transaction price, plus any directly attributable transaction costs and subsequently measured at amortized cost using the effective interest method. The Company derecognizes a financial liability when its contractual obligations are discharged, cancelled, or expired.
Financial assets and liabilities are offset and the net amount presented in the statement of financial position when, and only when, the Company has a legal right to offset the amounts and intends either to settle on a net basis or to realize the asset and settle the liability simultaneously.
Common shares are classified as equity. Incremental costs directly attributable to the issue of common shares are recognized as a deduction from equity, net of tax.
The Company’s derivatives are carried at fair value and are reported as assets when they have a positive fair value and as liabilities when they have a negative fair value.
Changes in the fair values of derivative financial instruments are reported in the consolidated statements of income, except for cash flow hedges that meet the conditions for hedge accounting. The portion of the gain or loss on the hedging instruments that are determined to be an effective hedge are recognized directly in other comprehensive income, and the ineffective portion in the consolidated statements of income. The gains or losses deferred in other comprehensive income in this way are subsequently recognized in the consolidated statements of income in the same period in which the hedged underlying transaction or firm commitment is recognized in the statement of income. In order to qualify for hedge accounting, the Company is required to document in advance the relationship between the item being hedged and the hedging instrument. The Company is also required to document and demonstrate an assessment of the relationship between the hedged item and the hedging instrument, which shows that the hedge will be highly effective on an ongoing basis. This effectiveness testing is re-performed at the end of each reporting period to ensure that the hedge remains highly effective.
(d) Intangible assets
(i) Goodwill
Goodwill that arises upon the acquisition of subsidiaries is included in intangible assets. After initial recognition, goodwill is measured at cost less any accumulated impairment losses, with the carrying value being reviewed for impairment at least annually and whenever events or changes in circumstances indicate that the carrying value may be impaired. In respect of equity accounted investees, the carrying amount of goodwill is included in the carrying amount of the investment. No such losses relating to goodwill have been recognized during the year.
The impairment test methodology is based on a comparison between the higher of fair value less costs to sell and value-in-use of each of the Company's cash generating units (“CGU”) and the net asset carrying values (including goodwill). Within the Company's reporting structure, business units generally reflect the CGU and are one level below the six operating segments (Volaris, Harris, Total Specific Solutions, Jonas, Perseus, and Vela Operating Groups). In determining the recoverable amount, the Company applies an estimated market valuation multiple to

CONSTELLATION SOFTWARE INC. Notes to Consolidated Financial Statements (In millions of U.S. dollars, except per share amounts and as otherwise indicated.) (Due to rounding, numbers presented may not foot.) Years ended December 31, 2019 and 2018
44
the business unit's most recent annual recurring revenues, which are generally derived from post-contract customer support revenues, transactional revenues, and hosted products revenues. Valuation multiples applied by the Company for this purpose reflect current market conditions specific to the business unit and are assessed for reasonability by comparison to the Company's current and past acquisition experience involving ranges of revenue-based multiples required to acquire representative software companies and the Company’s overall revenue based-trading multiple. In addition, in certain instances, the recoverable amount is determined using a value-in-use approach which follows the same valuation process that is undertaken for the Company’s business acquisitions. An impairment is recognized if the carrying amount of a CGU exceeds its estimated recoverable amount. The recoverable amount of goodwill is estimated annually on December 31 of each year or whenever events or changes in circumstances indicate that the carrying value may be impaired.
(ii) Acquired intangible assets
The Company uses the income approach to value acquired technology and customer relationship intangible assets. The income approach is a valuation technique that calculates the estimated fair value of an intangible asset based on the estimated future cash flows that the asset can be expected to generate over its remaining useful life.
The Company utilizes the discounted cash flow ("DCF") methodology which is a form of the income approach that begins with a forecast of the annual cash flows that a market participant would expect the subject intangible asset to generate over a discrete projection period. The forecasted cash flows for each of the years in the discrete projection period are then converted to their present value equivalent using a rate of return appropriate for the risk of achieving the intangible assets' projected cash flows, again, from a market participant perspective. The present value of the forecasted cash flows are then added to the present value of the residual value of the intangible asset (if any) at the end of the discrete projection period to arrive at a conclusion with respect to the estimated fair value of the subject intangible assets.
Specifically, the Company relies on the relief-from-royalty method to value the acquired technology and the multiple-period excess earnings ("MEEM") method to value customer relationship assets.
The underlying premise of the relief-from-royalty method is that the fair value of the technology is equal to the cost savings (or the "royalty avoided") resulting from the ownership of the asset by the avoidance of paying royalties to license the use of the technology from another owner. Accordingly the income forecast reflects an estimate of a fair royalty that a licensee would pay, on a percentage of revenue basis, to obtain a license to utilize the technology.
The MEEM method isolates the cash flows attributable to the subject asset by utilizing a forecast of expected cash flows less the returns attributable to other enabling assets, both tangible and intangible.
Other intangible assets that are acquired by the Company and have finite useful lives are measured at cost, being reflective of fair value, less accumulated amortization and impairment losses. Subsequent expenditures are capitalized only when it increases the future economic benefits that form part of the specific asset to which it relates and other criteria have been met. Otherwise all other expenditures are recognized in profit or loss as incurred.
Amortization is recognized in profit or loss on a straight-line basis over the estimated useful lives of intangible assets, other than goodwill, from the date that they are acquired and available for use, since this most closely reflects the expected usage and pattern of consumption of the future economic benefits embodied in the asset. To determine the useful life of the technology assets, the Company considers the length of time over which it expects to earn or recover the majority of the present value of the forecasted cash flows of the related intangible assets. The estimated useful lives for the current and comparative periods are as follows:

CONSTELLATION SOFTWARE INC. Notes to Consolidated Financial Statements (In millions of U.S. dollars, except per share amounts and as otherwise indicated.) (Due to rounding, numbers presented may not foot.) Years ended December 31, 2019 and 2018
45
Technology assets 2 to 12 years Customer assets 5 to 20 years Trademarks 20 years Backlog Up to 1 year Non-compete agreements Term of agreement
Amortization methods, useful lives and the residual values are reviewed at least annually (or when there has been an indication of impairment) and are adjusted as appropriate.
(iii) Research and development
Expenditure on research activities, undertaken with the prospect of gaining new scientific or technical knowledge and understanding, is recognized in profit or loss as an expense as incurred.
Expenditure on development activities, whereby research findings are applied to a plan or design for the production of new or substantially improved products and processes, is capitalized only if the product or process is technically and commercially feasible, if development costs can be measured reliably, if future economic benefits are probable, if the Company intends to use or sell the asset and the Company intends and has sufficient resources to complete development. To date, no material development expenditures have been capitalized.
For the year ended December 31, 2019, $505 (2018 ‒ $430) of research and development costs have been expensed in profit or loss. These costs are net of estimated investment tax credits, recognized as part of other, net expenses through profit or loss of $24 for the year ended December 31, 2019 (2018 ‒ $21).
(e) Property and equipment
(i) Recognition and measurement
Property and equipment are measured at cost less accumulated depreciation and accumulated impairment losses. Cost includes initial and subsequent expenditures that are directly attributable to the acquisition of the related asset. When component parts of an item of property and equipment have different useful lives, they are accounted for as separate items (major components) of property and equipment, where applicable.
(ii) Depreciation
Depreciation is recognized in profit or loss on a straight-line basis over the estimated useful lives of each part of an item of property and equipment.
The estimated useful lives for the current and comparative periods are as follows:
Asset Rate Computer hardware 3-5 years Computer software 1 year Furniture and equipment 5 years Leasehold improvements Shorter of the estimated useful life and the term of the lease Building 50 years

CONSTELLATION SOFTWARE INC. Notes to Consolidated Financial Statements (In millions of U.S. dollars, except per share amounts and as otherwise indicated.) (Due to rounding, numbers presented may not foot.) Years ended December 31, 2019 and 2018
46
Depreciation methods, useful lives and residual values are reviewed at each financial year end or more frequently as deemed relevant, and adjusted where appropriate.
(f) Inventories
Inventories are measured at the lower of cost and net realizable value. The cost of inventories is based on the first-in first-out principle, and includes expenditures incurred in acquiring the inventories, production and other costs incurred in bringing them to their existing location and condition. In the case of manufactured inventories and work in progress, cost includes an appropriate share of production overheads based on normal operating capacity. Net realizable value is the estimated selling price in the ordinary course of business, less the estimated costs of completion and selling expenses.
(g) Unbilled revenue
Unbilled revenue represents the gross unbilled amount expected to be collected from customers for contract work performed to date. It is measured at cost plus profit recognized to date less progress billings and recognized losses, if any.
Unbilled revenue is presented in the statement of financial position for all contracts in which costs incurred plus recognized profits exceed progress billings. If progress billings exceed costs incurred plus recognized profits, then the excess is presented as deferred revenue in the statement of financial position.
(h) Other non-current liabilities
Other non-current liabilities consists principally of certain acquired contract liabilities, deferred revenue, provisions and contingent consideration recognized in connection with business acquisitions to be settled in cash, which are discounted for measurement purposes.
(i) Impairment
(i) Financial assets (including receivables)
A financial asset not carried at fair value through profit or loss is assessed at each reporting date to determine whether there is objective evidence that it is impaired. A financial asset is impaired if objective evidence indicates that a loss event has occurred after the initial recognition of the asset, and that the loss event had a negative effect on the estimated future cash flows of that asset that can be estimated reliably.
Objective evidence that financial assets are impaired can include default or delinquency by a debtor, restructuring of an amount due to the Company on terms that the Company would not consider otherwise, or indications that a debtor or issuer will enter bankruptcy.
The Company considers evidence of impairment for receivables at both a specific and collective level. All individually significant receivables are assessed for specific impairment. All individually significant receivables found not to be specifically impaired, together with receivables that are not individually significant are collectively assessed for impairment by grouping together receivables with similar risk characteristics.
An impairment loss in respect of a financial asset measured at amortized cost is calculated as the difference between its carrying amount and the present value of the estimated future cash flows discounted at the asset's

CONSTELLATION SOFTWARE INC. Notes to Consolidated Financial Statements (In millions of U.S. dollars, except per share amounts and as otherwise indicated.) (Due to rounding, numbers presented may not foot.) Years ended December 31, 2019 and 2018
47
original effective interest rate. Losses are recognized in profit or loss and reflected in an allowance account against receivables. When a subsequent event causes the amount of impairment loss to decrease, the decrease in impairment loss is reversed through profit or loss.
(ii) Non-financial assets
The carrying amounts of the Company’s non-financial assets, other than inventories (which is addressed in note 3(f)) and deferred tax assets (which is addressed in note 3(m)), are reviewed at each reporting date (or more frequently if required) to determine whether there is any indication of impairment. If any such indication exists, then the asset’s recoverable amount is estimated. For goodwill, the recoverable amount is estimated annually on December 31 of each fiscal year or whenever required.
The recoverable amount of an asset or CGU is the greater of its value in use and its fair value less costs to sell. In assessing the value in use, the Company uses discounted cash flows which are determined using a pre-tax discount rate specific to the asset or CGU. The discount rate used reflects current market conditions including risks specific to the assets. Significant estimates within the cash flows include recurring revenue growth rates and operating expenses. For the purpose of impairment testing, assets that cannot be tested individually are grouped together into the smallest group of assets that generates cash inflows from continuing use that are largely independent of the cash inflows of other assets or groups of assets, which for the Company’s purposes is typically representative of the business unit level within the corporate and management structure. For the purposes of goodwill impairment testing, goodwill acquired in a business combination is allocated to the CGU, or the group of CGUs, that is expected to benefit from the synergies of the combination.
An impairment loss is recognized if the carrying amount of an asset or its CGU exceeds its estimated recoverable amount. Impairment losses are recognized in profit or loss. Impairment losses recognized in respect of CGUs are allocated first to reduce the carrying amount of any goodwill allocated to the CGU, and then to reduce the carrying amounts of the other assets (such as intangible assets and property and equipment) in the CGU (group of units) on a pro rata basis.
Goodwill that forms part of the carrying amount of an investment in an associate is not recognized separately and, therefore, is not tested for impairment separately. Instead, the entire amount of the investment in an associate is tested for impairment as a single asset when there is objective evidence that the investment in an associate may be impaired.
An impairment loss in respect of goodwill is not reversed. In respect of other non-financial assets, impairment losses recognized in prior periods are assessed at each reporting date for any indications that the loss has decreased or no longer exists. An impairment loss is reversed if there has been a change in the estimates used to determine the recoverable amount. An impairment loss is reversed only to the extent that the asset's carrying amount does not exceed the carrying amount that would have been determined, net of depreciation or amortization, if no impairment loss had been previously recognized.
(j) Provisions
A provision is recognized if, as a result of a past event, the Company has a present legal or constructive obligation that can be estimated reliably, and it is probable that an outflow of economic benefits will be required to settle the obligation. Provisions are measured at the estimated future cash flows required to settle the present obligation, based on the most reliable evidence available at the reporting date. The estimated cash flows are discounted at a pre-tax rate that reflects current market assessments of the time value of money and the risks specific to the liability. The amortization of the discount is recognized as part of finance costs.

CONSTELLATION SOFTWARE INC. Notes to Consolidated Financial Statements (In millions of U.S. dollars, except per share amounts and as otherwise indicated.) (Due to rounding, numbers presented may not foot.) Years ended December 31, 2019 and 2018
48
(k) Revenue recognition
Revenue represents the amount the Company expects to receive for products and services in its contracts with customers, net of discounts and sales taxes. The Company reports revenue under four revenue categories being, License, Hardware and other, Professional services, and Maintenance and other recurring revenue. Software license revenue is comprised of non-recurring license fees charged for the use of software products licensed under multiple-year or perpetual arrangements. Professional service revenue consists of fees charged for implementation services, custom programming, product training and consulting. Hardware and other revenue includes the resale of third party hardware as part of customized solutions, as well as sales of hardware assembled internally and the reimbursement of travel costs. Maintenance and other recurring revenue primarily consists of fees charged for customer support on software products post-delivery and also includes recurring fees derived from combined software/support contracts, transaction revenues, managed services, and hosted products.
Contracts with multiple products or services
Typically, the Company enters into contracts that contain multiple products and services such as software licenses, hosted software-as-a-service, maintenance, professional services, and hardware. The Company evaluates these arrangements to determine the appropriate unit of accounting (performance obligation) for revenue recognition purposes based on whether the product or service is distinct from some or all of the other products or services in the arrangement. A product or service is distinct if the customer can benefit from it on its own or together with other readily available resources and Constellation’s promise to transfer the good or service is separately identifiable from other promises in the contractual arrangement with the customer. Non-distinct products and services are combined with other goods or services until they are distinct as a bundle and therefore form a single performance obligation.
Where a contract consists of more than one performance obligation, revenue is allocated to each based on their estimated SSP.
Nature of products and services
The Company sells on-premise software licenses on both a perpetual and specified-term basis. Revenue from the license of distinct software is recognized at the time that both the right-to-use the software has commenced and the software has been made available to the customer. Certain of the Company’s contracts with customers contain provisions that require the customer to renew optional support and maintenance in order to maintain the active right to use a perpetual or term license. The renewal payments after the initial bundled support and maintenance term in these cases apply to both the continued right-to-use the license and the support and maintenance renewal. Where the fees payable for the initial term are incremental to the fees for the renewal terms, the excess is treated as a prepayment for expected renewals and allocated (amortized) evenly over the expected customer renewals, up to the estimated life of the software that is typically 4-6 years.
Revenue from the license of software that involves complex implementation or customization that is not distinct, and/or includes sales of hardware that is not distinct, is recognized as a combined performance obligation using the percentage-of-completion method based either on the achievement of contractually defined milestones or based on labour hours.
A portion of the Company's sales, categorized as hardware and other revenue, are accounted for as product revenue. Product revenue is recognized when control of the product has transferred under the terms of an enforceable contract.
Revenue related to the customer reimbursement of travel related expenses incurred during a project implementation where the Company is the principal in the arrangement is included in the hardware and other revenue category.

CONSTELLATION SOFTWARE INC. Notes to Consolidated Financial Statements (In millions of U.S. dollars, except per share amounts and as otherwise indicated.) (Due to rounding, numbers presented may not foot.) Years ended December 31, 2019 and 2018
49
Revenue is recognized as costs are incurred which is consistent with the period in which the costs are invoiced. Reimbursable travel expenses incurred for which an invoice has not been issued, are recorded as part of unbilled revenue on the statement of financial position.
Maintenance and other recurring revenue primarily consists of fees charged for customer support on software products post-delivery and also includes, to a lesser extent, recurring fees derived from software licenses that are not distinct from maintenance, transaction revenues, managed services, and hosted products.
Revenue from software-as-a-service (SaaS) arrangements, which allows customers to use hosted software over a term without taking possession of the software, are provided on a subscription basis. Revenue from the SaaS subscription, which includes the hosted software and maintenance is recognized rateably over the term of the subscription. Significant incremental payments for SaaS in an initial term are recognized rateably over the expected renewal periods, up to the estimated life of the software.
Professional services revenue including installation, implementation, training and customization of software is recognized by the stage of completion of the performance obligation determined using the percentage of completion method noted above or as such services are performed as appropriate in the circumstances. The revenue and profit of fixed price contracts is recognized on a percentage of completion basis when the outcome of a contract can be estimated reliably. When the outcome of the contract cannot be estimated reliably but the Company expects to recover its costs, the amount of expected costs is treated as variable consideration and the transaction price is updated as more information becomes known.
The timing of revenue recognition often differs from contract payment schedules, resulting in revenue that has been earned but not billed. These amounts are included in unbilled revenue. Amounts billed in accordance with customer contracts, but not yet earned, are recorded and presented as part of deferred revenue.
Costs to Obtain a Contract
The Company allocates incremental costs to obtain a contract (which principally consists of commissions) to the various performance obligations to which they relate using the expected-based allocation (relative expected margins) for bundled costs. For those performance obligations that are expected to be renewed at the end of the initial period without a further commission (such as post-contract customer support), the Company has considered expected renewals over the life of the intellectual property when determining the expected margins from the arrangement. For performance obligations not delivered upfront, the allocated commissions are deferred and amortized over the pattern of transfer of the related performance obligation. For commissions allocated to term-based license arrangements and post-contract customer support, the amortization period is expected to be approximately 4-6 years. Capitalized costs to obtain a contract are included in other non-current assets on the consolidated balance sheet.
(l) Finance income and finance costs
Finance income comprises interest income, gains on the disposal of available-for-sale financial assets, and changes in the fair value of financial assets at fair value through profit or loss. Interest income is recognized as it accrues through profit or loss, using the effective interest method.
Finance costs comprise interest expense on borrowings, amortization of the discount on provisions, and impairment losses recognized on financial assets other than trade receivables. Transaction costs attributable to the Company’s bank indebtedness are recognized in finance costs using the effective interest method.

CONSTELLATION SOFTWARE INC. Notes to Consolidated Financial Statements (In millions of U.S. dollars, except per share amounts and as otherwise indicated.) (Due to rounding, numbers presented may not foot.) Years ended December 31, 2019 and 2018
50
(m) Income taxes
Income tax expense comprises current and deferred tax. Current tax and deferred tax are recognized in profit or loss except to the extent that it relates to a business combination, or items recognized directly in equity or in other comprehensive income.
Current tax is the expected taxes payable or receivable on the taxable income or loss for the period, using tax rates enacted or substantively enacted at the reporting date, and any adjustment to taxes payable in respect of previous years.
Deferred tax is recognized in respect of temporary differences between the carrying amounts of assets and liabilities for financial reporting purposes and the amounts used for taxation purposes. Deferred tax is not recognized for temporary differences relating to investments in subsidiaries to the extent that it is probable that they will not reverse in the foreseeable future. In addition, deferred tax is not recognized for taxable temporary differences arising on the initial recognition of goodwill.
Deferred tax is measured at tax rates that are expected to be applied to temporary differences when they reverse, based on the laws that have been enacted or substantively enacted by the reporting date. Deferred tax assets and liabilities are offset if there is a legally enforceable right to offset current tax liabilities and assets, and they relate to income taxes levied by the same tax authority on the same taxable entity, or on different tax entities, but we intend to settle current tax liabilities and assets on a net basis or their tax assets and liabilities will be realized simultaneously.
A deferred tax asset is recognized for unused tax losses, tax credits, difference in tax bases in the purchaser's tax jurisdiction and its cost as reported in the consolidated financial statements as a result of an intra-group transfer of assets and deductible temporary differences, to the extent that it is probable that future taxable profits will be available against which they can be utilized. Deferred tax assets are reviewed at each reporting date and are reduced to the extent that it is no longer probable that the related tax benefit will be realized.
(n) Investment tax credits
The Company is entitled to both non-refundable and refundable investment tax credits for qualifying research and development activities. Investment tax credits are included within “Other, net” for items of a period expense nature or as a reduction of property and equipment for items of a capital nature when the amount is reliably estimable and the Company has reasonable assurance regarding compliance with the relevant objective conditions and that the credit will be realized.
(o) Segment reporting
An operating segment is a component of the Company that engages in business activities from which it may earn revenues and incur expenses, including revenues and expenses that relate to transactions with any of the Company’s other components. The operating results of all operating segments are reviewed regularly by the Company’s President and Chairman of the Board of Directors to make decisions about resources to be allocated to the segment and assessing their performance.
The Company has six operating segments, referred to as Operating Groups by the Company, being Volaris, Harris, Total Specific Solutions, Jonas, Perseus, and Vela. The operating segments are aggregated by applying the aggregation criteria in IFRS 8, Operating Segments, into two reportable segments Public (Volaris, Harris, TSS

CONSTELLATION SOFTWARE INC. Notes to Consolidated Financial Statements (In millions of U.S. dollars, except per share amounts and as otherwise indicated.) (Due to rounding, numbers presented may not foot.) Years ended December 31, 2019 and 2018
51
Operating Groups) and Private (Jonas, Perseus, Vela Operating Groups). To the extent there have been transfers of business units between our Public and Private segments, we have restated the comparatives for these transfers.
Segment operating results, assets and liabilities include items directly attributable to a segment as well as those that can be allocated on a reasonable basis. Unallocated items comprise mainly interest-bearing borrowings and related expenses, and corporate assets and expenses and are included as part of the other segment when reconciling to the Company’s consolidated totals.
Segment capital expenditures are the total costs incurred during the period to acquire segment assets, being property and equipment and intangible assets that are expected to be used for more than one year.
(p) Earnings per share
The Company presents basic and diluted earnings per share data for its ordinary shares, being common shares. Basic earnings per share is calculated by dividing the profit or loss attributable to ordinary shareholders of the Company by the weighted average number of ordinary shares outstanding during the period, adjusted for treasury shares held. Diluted earnings per share is determined by dividing the profit or loss attributable to shareholders of ordinary shares by the weighted average number of shares outstanding, adjusted for the effects of all dilutive potential ordinary shares.
(q) Short-term employee benefits
Short-term employee benefit obligations, including wages, benefits, incentive compensation, and compensated absences are measured on an undiscounted basis and are expensed as the related service is provided. A liability is recognized for the amount expected to be paid and settled under the Company's employee incentive compensation plan if the Company has legal or constructive obligation to pay this amount at the time bonuses are paid as a result of past service provided by the employee, and the obligation can be estimated reliably.
(r) Leases
At inception of a contract, the Company assesses whether a contract is, or contains, a lease based on whether the contract conveys the right to control the use of an identified asset for a period of time in exchange for consideration. The Company recognizes a right-of-use asset and a lease liability at the lease commencement date. The right-of-use asset is initially measured based on the initial amount of the lease liability adjusted for any lease payments made at or before the commencement date, plus any initial direct costs incurred and an estimate of costs to dismantle and remove the underlying asset or to restore the underlying asset or the site on which it is located, less any lease incentives received. The assets are depreciated to the earlier of the end of the useful life of the right-of-use asset or the lease term using the straight-line method as this most closely reflects the expected pattern of consumption of the future economic benefits. The lease term includes periods covered by an option to extend if the Company is reasonably certain to exercise that option. In addition, the right-of-use asset can be periodically reduced by impairment losses, if any, and adjusted for certain remeasurements of the lease liability. The lease liability is initially measured at the present value of the lease payments that are not paid at the commencement date, discounted using the interest rate implicit in the lease or, if that rate cannot be readily determined, the Company’s incremental borrowing rate. Generally, the Company uses its incremental borrowing rate as the discount rate.
The lease liability is measured at amortized cost using the effective interest method. It is remeasured when there is a change in future lease payments arising from a change in an index or rate, if there is a change in the Company’s estimate of the amount expected to be payable under a residual value guarantee, or if the Company changes its assessment of whether it will exercise a purchase, extension or termination option. When the lease liability is

CONSTELLATION SOFTWARE INC. Notes to Consolidated Financial Statements (In millions of U.S. dollars, except per share amounts and as otherwise indicated.) (Due to rounding, numbers presented may not foot.) Years ended December 31, 2019 and 2018
52
remeasured in this way, a corresponding adjustment is made to the carrying amount of the right-of-use asset, or is recorded in profit or loss if the carrying amount of the right-of-use asset has been reduced to zero. The Company has elected to apply the practical expedient not to recognize right-of-use assets and lease liabilities for short-term leases that have a lease term of 12 months or less and leases of low value assets. The lease payments associated with these leases is recognized as an expense on a straight-line basis over the lease term.
(s) New standards and interpretations adopted
IFRS 16 Leases
The Company has adopted IFRS 16 with an initial adoption date of January 1, 2019. The Company utilized the modified retrospective method to adopt the new standard and therefore, the comparative information has not been restated and continues to be reported under IAS 17, Leases and related interpretations.
IFRS 16 specifies how leases will be recognized, measured, presented and disclosed and it provides a single lessee model, requiring lessees to recognize right-of-use assets and lease liabilities for all major leases. The impact of the transition to IFRS 16 is shown in Note 31.
4. Business acquisitions
(a) During the year ended December 31, 2019, the Company completed a number of acquisitions for aggregate cash consideration of $549 plus cash holdbacks of $102 and contingent consideration with an estimated fair value of $37 resulting in total consideration of $688. The contingent consideration is payable on the achievement of certain financial targets in the post-acquisition periods. The obligation for contingent consideration for acquisitions during the year ended December 31, 2019 has been recorded at its estimated fair value at the various acquisition dates. The estimated fair value of the applicable contingent consideration is calculated using the estimated financial outcome and resulting expected contingent consideration to be paid and inclusion of a discount rate as appropriate. For these arrangements, which include both maximum, or capped, and unlimited contingent consideration amounts, the estimated increase to the unpaid initial consideration is not expected to exceed a maximum of $95. Aggregate contingent consideration of $59 (December 31, 2018 - $19) has been reported in the consolidated statement of financial position at its estimated fair value relating to applicable acquisitions completed in the current and prior periods. Changes made to the estimated fair value of contingent consideration are included in other, net in the consolidated statements of income. An expense of $9 was recorded for the year ended December 31, 2019, as a result of such changes (recovery of $2 for the year ended December 31, 2018).
There were no acquisitions during the year that were deemed to be individually significant. Just over half of the total businesses acquired during the year were acquisitions of shares and the remainder were asset acquisitions. The cash holdbacks are generally payable over a two-year period and are adjusted, as necessary, for such items as working capital or net tangible asset assessments, as defined in the agreements, and claims under the respective representations and warranties of the purchase and sale agreements.
The acquisitions during the year ended December 31, 2019 include software companies catering to the following markets: communications, event management, automotive, public housing authorities, local government, manufacturing plant performance, public transit operators, distillery, healthcare, asset management, real estate brokers and agents, attractions, small and medium sized businesses, court, homebuilders, retail management and distribution, advertising and marketing, hospitality, financial services, public safety, construction, legal, project management, grocery, quality management, mining, accountancy, salons and spas, education, compliance, human resources and payroll, aerospace, parking, manufacturing design, field service, marinas, notaries, agriculture equipment dealers, not-for-profit organizations, insurance, catering, inspections and management, and oil and gas

CONSTELLATION SOFTWARE INC. Notes to Consolidated Financial Statements (In millions of U.S. dollars, except per share amounts and as otherwise indicated.) (Due to rounding, numbers presented may not foot.) Years ended December 31, 2019 and 2018
53
all of which are software businesses similar to existing businesses operated by the Company. The acquisitions have been accounted for using the acquisition method with the results of operations included in these consolidated financial statements from the date of each acquisition.
The goodwill recognized in connection with these acquisitions is primarily attributable to the application of Constellation’s best practices to improve the operations of the companies acquired, synergies with existing businesses of Constellation, and other intangibles that do not qualify for separate recognition including assembled workforce. Goodwill in the amount of $5 is expected to be deductible for income tax purposes.
The gross contractual amounts of acquired receivables was $83; however, the Company has recorded an allowance of $4 as part of the acquisition accounting to reflect contractual cash flows that are not expected to be collected.
Due to the complexity and timing of certain acquisitions made, the Company is in the process of determining and finalizing the estimated fair value of the net assets acquired as part of the acquisitions closed during 2019. The amounts determined on a provisional basis generally relate to net asset assessments and measurement of the assumed liabilities, including acquired contract liabilities. The cash consideration associated with these provisional estimates totals $549.
$30 of the total bargain purchase gain recorded during the period relates to an acquisition where the seller will continue as a minority partner in the business. The seller contributed $17 into the partnership.
The aggregate impact of acquisition accounting applied in connection with business acquisitions in the year ended December 31, 2019 is as follows:

CONSTELLATION SOFTWARE INC. Notes to Consolidated Financial Statements (In millions of U.S. dollars, except per share amounts and as otherwise indicated.) (Due to rounding, numbers presented may not foot.) Years ended December 31, 2019 and 2018
54
(b) The 2019 business acquisitions contributed revenue and net income of $267 and $3 during the year ended December 31, 2019. If these acquisitions had occurred on January 1, 2019, the Company estimates that consolidated revenue would have been $3,816 and consolidated net income for the year ended December 31, 2019 would have been $314 as compared to the amounts reported in the statement of income for the same period. In determining these amounts, the Company has assumed that the fair values of the net assets acquired that were estimated and accounted for on the dates of acquisition would have been the same as if the acquisitions had occurred on January 1, 2019. The net income from acquisitions includes the associated amortization of acquired intangible assets recognized as if the acquisitions had occurred on January 1, 2019.
Public Sector Private Sector Consolidated
Assets acquired:
Cash 108$ 10$ 118$
Accounts receivable 64 15 79
Other current assets 30 3 33
Property and equipment 17 2 18
Other non-current assets 35 5 40
Deferred income taxes 7 (1) 6
Technology assets 276 94 369
Customer assets 278 65 343
814 193 1,006
Liabilities assumed:
Current liabilities 75 12 88
Deferred revenue 92 21 114
Deferred income taxes 97 9 106
Other non-current liabilities 32 5 37
297 48 345
Goodwill 51 7 58
Bargain purchase gain (30) (2) (32)
Total consideration 538$ 150$ 688$

CONSTELLATION SOFTWARE INC. Notes to Consolidated Financial Statements (In millions of U.S. dollars, except per share amounts and as otherwise indicated.) (Due to rounding, numbers presented may not foot.) Years ended December 31, 2019 and 2018
55
5. Inventories
No inventories were carried at fair value less cost to sell, and the carrying amount of inventories subject to retention of title clauses was $nil as at December 31, 2019 and 2018.
Raw materials (which consists primarily of hardware components) and changes in finished goods and work in progress recognized as hardware expenses in the consolidated statements of income amounted to $92 (2018: $87). The write-downs of inventories to net realizable value amounted to $4 (2018: $1). The reversals of write-downs amounted to $1 (2018: $1). Write-downs and reversals of write-downs are based on the Company’s projected sales. The write-downs and reversals are included in hardware expenses.
6. Other assets and liabilities
(a) Other assets
(b) Other liabilities
December 31, 2019
December 31, 2018
Raw materials 13$ 16$
Work in progress 3 7
Finished goods 14 12
Total 31$ 34$
December 31, 2019 December 31, 2018
Prepaid and other current assets 96$ 74$
Investment tax credits recoverable 26 26
Sales tax receivable 18 10
Equity securities held for trading 10 -
Other receivables 34 32
Total other current assets 184$ 143$
Investment tax credits recoverable 13$ 11$
Costs to obtain a contract 37 34
Non-current trade and other receivables and other assets 20 17
Equity accounted investees 2 3
Total other non-current assets 72$ 64$
December 31, 2019 December 31, 2018
Contingent consideration 42$ 13$
Deferred revenue 41 43
Other non-current liabilities 17 19
Total other non-current liabilities 101$ 74$

CONSTELLATION SOFTWARE INC. Notes to Consolidated Financial Statements (In millions of U.S. dollars, except per share amounts and as otherwise indicated.) (Due to rounding, numbers presented may not foot.) Years ended December 31, 2019 and 2018
56
7. Property and equipment
Computer hardwareComputer software
Furniture and equipment
Leasehold improvements
Building and land Total
Cost
Balance at January 1, 2018 50$ 24$ 29$ 21$ 4$ 129$
Additions 12 5 4 5 - 25
Acquisitions through business combinations 5 3 4 2 3 17
Disposals / retirements (6) (1) (2) (1) (0) (10)
Effect of movements in foreign exchange and other (2) (1) (1) (1) (0) (6)
Balance at December 31, 2018 59$ 29$ 34$ 26$ 7$ 155$
Balance at January 1, 2019 59$ 29$ 34$ 26$ 7$ 155$
Additions 14 4 5 12 0 34
Acquisitions through business combinations 11 (2) 2 2 2 15
Disposals / retirements (7) (2) (3) (4) (3) (19)
Effect of movements in foreign exchange and other 0 (0) (0) 0 (0) 1
Balance at December 31, 2019 77$ 30$ 37$ 35$ 6$ 186$
Depreciation and impairment losses
Balance at January 1, 2018 29$ 20$ 15$ 11$ 1$ 75$
Depreciation charge for the year 13 5 6 3 0 27
Disposals / retirements (6) (1) (2) (1) - (10)
Effect of movements in foreign exchange and other (2) (1) (1) (1) - (5)
Balance at December 31, 2018 34$ 22$ 18$ 13$ 1$ 88$
Balance at January 1, 2019 34$ 22$ 18$ 13$ 1$ 88$
Depreciation charge for the year 18 5 6 5 0 34
Disposals / retirements (6) (2) (3) (3) (0) (14)
Effect of movements in foreign exchange and other (0) (0) (1) 1 0 0
Balance at December 31, 2019 46$ 25$ 21$ 15$ 1$ 108$
Carrying amounts:
At January 1, 2018 21$ 4$ 15$ 10$ 4$ 54$
At December 31, 2018 25$ 7$ 16$ 13$ 7$ 67$
At January 1, 2019 25$ 7$ 16$ 13$ 7$ 67$
At December 31, 2019 32$ 5$ 16$ 20$ 5$ 78$

CONSTELLATION SOFTWARE INC. Notes to Consolidated Financial Statements (In millions of U.S. dollars, except per share amounts and as otherwise indicated.) (Due to rounding, numbers presented may not foot.) Years ended December 31, 2019 and 2018
57
8. Right of use assets
The following table presents the right-of-use assets for the Company:
Computer hardware Vehicles
Furniture and equipment Building Other Total
Cost
Balance at January 1, 2019 -$ -$ -$ -$ -$ -$
Adoption of IFRS 16 (note 31) 9 11 2 185 1 208
Additions 3 6 0 46 2 56
Acquisitions through business combinations 0 1 1 37 0 40
Disposals / retirements (0) (0) (0) (9) (0) (10)
Effect of movements in foreign exchange and other (0) (0) 0 (0) (0) (0)
Balance at December 31, 2019 12$ 17$ 3$ 258$ 3$ 294$
Depreciation and impairment losses
Balance at January 1, 2019 -$ -$ -$ -$ -$ -$
Depreciation charge for the year 4 5 1 48 0 58
Disposals / retirements (0) 0 0 1 (0) 2
Effect of movements in foreign exchange and other (0) 0 0 0 (0) 0
Balance at December 31, 2019 4$ 5$ 1$ 49$ 0$ 60$
Carrying amounts:
At January 1, 2019 -$ -$ -$ -$ -$ -$
At December 31, 2019 8$ 12$ 3$ 209$ 2$ 234$

CONSTELLATION SOFTWARE INC. Notes to Consolidated Financial Statements (In millions of U.S. dollars, except per share amounts and as otherwise indicated.) (Due to rounding, numbers presented may not foot.) Years ended December 31, 2019 and 2018
58
9. Intangible assets and goodwill
Impairment testing for cash-generating units containing goodwill
The annual impairment test of goodwill was performed as of December 31, 2019 and 2018 and did not result in any significant impairment loss. For the purpose of impairment testing, goodwill is allocated to the Company’s business units included in each operating segment, which represent the lowest level within the Company at which goodwill is monitored for internal purposes. There was no goodwill reallocated to the Company’s CGUs that was deemed to be significant in comparison to the carrying amount of goodwill as at December 31, 2019.
The Company has three CGUs whereby the total goodwill allocated is significant in comparison to the Company’s total carrying amount of goodwill. The total goodwill allocated to each of these CGUs as at December 31, 2019 is
Technology Assets
Customer Assets Backlog
Non-compete agreements Trademarks Goodwill Total
Cost
Balance at January 1, 2018 1,450$ 732$ 16$ 3$ 8$ 259$ 2,467$
Acquisitions through business combinations 383 261 - - - 54 698
Effect of movements in foreign exchange (39) (29) - - (0) (11) (80)
Balance at December 31, 2018 1,793$ 964$ 16$ 3$ 7$ 302$ 3,085$
Balance at January 1, 2019 1,793$ 964$ 16$ 3$ 7$ 302$ 3,085$
Acquisitions through business combinations 368 344 0 - - 59 770
Effect of movements in foreign exchange 8 1 0 0 (0) 0 10
Balance at December 31, 2019 2,169$ 1,309$ 16$ 3$ 7$ 361$ 3,865$
Accumulated amortization and impairment losses
Balance at January 1, 2018 945$ 320$ 16$ 3$ 2$ -$ 1,286$
Amortization for the period 200 79 - - 0 - 279
Effect of movements in foreign exchange (21) (8) - - - - (29)
Balance at December 31, 2018 1,124$ 391$ 16$ 3$ 2$ -$ 1,536$
Balance at January 1, 2019 1,124$ 391$ 16$ 3$ 2$ -$ 1,536$
Amortization for the period 226 104 0 (0) 0 - 331
Impairment charge - - - - - - -
Effect of movements in foreign exchange 1 0 (0) 0 - - 2
Balance at December 31, 2019 1,351$ 495$ 16$ 3$ 2$ -$ 1,868$
Carrying amounts
At January 1, 2018 505$ 412$ -$ -$ 6$ 259$ 1,181$
At December 31, 2018 669$ 573$ -$ -$ 6$ 302$ 1,549$
At January 1, 2019 669$ 573$ -$ -$ 6$ 302$ 1,549$
At December 31, 2019 817$ 813$ (0)$ 0$ 5$ 361$ 1,997$

CONSTELLATION SOFTWARE INC. Notes to Consolidated Financial Statements (In millions of U.S. dollars, except per share amounts and as otherwise indicated.) (Due to rounding, numbers presented may not foot.) Years ended December 31, 2019 and 2018
59
$25, $25 and $26. In determining the recoverable amount, the Company applied an estimated market valuation multiple to the business unit's most recent annual recurring revenues, which are derived from combined software/support contracts, transaction revenues, and hosted products. Valuation multiples, which are Level 3 inputs, applied by the Company for this purpose reflect current market conditions specific to the business unit and are assessed for reasonability by comparison to the Company's current and past acquisition experience involving ranges of revenue-based multiples required to acquire representative software companies.
10. CSI Facility
On December 13, 2019, Constellation completed an amendment and restatement of its revolving credit facility agreement (the “CSI Facility”), with a syndicate of Canadian chartered banks, U.S. banks, and a Japanese bank in the amount of $700, extending its maturity date to December 2024. The CSI Facility bears a variable interest rate with no fixed repayments required over the term to maturity. Interest rates are calculated at standard U.S. and Canadian reference rates plus interest rate spreads based on a leverage table. The CSI Facility is currently collateralized by the majority of the Company’s assets including the assets of certain material subsidiaries. The CSI Facility contains standard events of default which if not remedied within a cure period would trigger the repayment of any outstanding balance. As at December 31, 2019, $65 (December 31, 2018 – $nil) had been drawn from this credit facility, and letters of credit totaling $21 (December 31, 2018 - $21) were issued, which limits the borrowing capacity on a dollar-for-dollar basis. Transaction costs associated with the CSI Facility are included in the carrying value of the CSI Facility in the consolidated statement of financial position as at December 31, 2019 and are being amortized through profit or loss using the effective interest rate method. As at December 31, 2019 the carrying amount of such costs is $2 (December 31, 2018 - $2, included in other assets).
11. Debt without recourse to CSI
Certain of CSI’s subsidiaries have entered into term debt facilities and revolving credit facilities with various financial institutions. CSI does not guarantee the debt of its subsidiaries, nor are there any cross-guarantees between subsidiaries. The credit facilities are collateralized by substantially all of the assets of the borrowing entity and its subsidiaries. The credit facilities typically bear interest at a rate calculated using an interest rate index plus a margin. The financing arrangements for each subsidiary typically contain certain restrictive covenants, which may include limitations or prohibitions on additional indebtedness, payment of cash dividends, redemption of capital, capital spending, making of acquisitions and sales of assets. In addition, certain financial covenants must be met by those subsidiaries that have outstanding debt.
Debt without recourse to CSI comprises the following:
Revolving Credit Facilities Term Debt Facilities Total
Principal outstanding at December 31, 2019 (and equal to fair value) 56$ 159$ 215$
Deduct: Carrying value of transaction costs included in debt balance (1) (4) (5)
Carrying value at December 31, 2019 55 155 210
Current portion 55 2 57
Non-current portion - 153 153

CONSTELLATION SOFTWARE INC. Notes to Consolidated Financial Statements (In millions of U.S. dollars, except per share amounts and as otherwise indicated.) (Due to rounding, numbers presented may not foot.) Years ended December 31, 2019 and 2018
60
The annual minimum repayment requirements for the term facilities without recourse to CSI is as follows:
12. Debentures
On October 1, 2014 and November 19, 2014, the Company issued debentures with a total principal value of C$96 for total proceeds of C$91. On September 30, 2015, the Company issued another tranche of debentures (collectively with the 2014 issuances called the “Debentures”) with a total principal value of C$186 for total proceeds of C$214.
The Debentures have a maturity date of March 31, 2040 (the “Maturity Date”). The interest rate from and including March 31, 2017 to but excluding March 31, 2018 is 7.9%. The rate from and including March 31, 2018 to but excluding March 31, 2019 is 8.1%. The rate from and including March 31, 2019 to but excluding March 31, 2020 is 8.8%. The rate from and including March 31, 2020 to but excluding March 31, 2021 is 8.6%. From and including March 31, 2021 to but excluding the Maturity Date, the interest rate applicable to the Debentures will be reset on an annual basis on March 31 of each year, at a rate equal to the annual average percentage change in the All-items Consumer Price Index during the 12-month period ending on December 31 in the prior year (which amount may be positive or negative) plus 6.5%. Notwithstanding the foregoing, the interest rate applicable to the debentures will not be less than 0%. The Company may, subject to certain approvals, elect the Payment in Kind election (“PIK Election”), in lieu of paying interest in cash, to satisfy all or any portion of its interest obligation payable on an interest payment date by issuing to each Debenture holder PIK Debentures equal to the amount of the interest obligation to be satisfied. The PIK Debentures will have the same terms and conditions as the Debentures and will form part of the principal amount of the Debentures. If, on any interest payment date, the Company fails to pay the amount of interest owing on the Debentures in full in cash, the Company will not (A) declare or pay dividends of any kind on the Common Shares, nor (B) participate in any share buyback or redemption involving the Common Shares, until the date on which the Company pays such interest (or the unpaid portion thereof) in cash to holders of the Debentures; however, where the Company has issued PIK Debentures in respect of all or a portion of the amount of interest owing on the Debentures on an interest payment date, the Company may resume declaring or paying dividends of any kind on the Common Shares and participating in any share buyback or redemption involving the Common Shares beginning on the next earlier of (i) the interest payment date of which the Company pays the amount of interest owing on the Debentures in full in cash and (ii) the date on which the Company repays all amounts owing under the PIK Debenture. All payments in respect of the Debentures will be subordinated in right of payment to the prior payment in full of all senior indebtedness of the Company.
The Debentures will be redeemable in certain circumstances at the option of the Company or the holder. During the period beginning on March 16 and ending on March 31 of each year, the Company will have the right, at its option, to give notice to holders of Debentures of its intention to redeem the Debentures, in whole or in part, on March 31 in the year that is five years following the year in which notice is given, at a price equal to the principal
Year Term Debt Facilities
2020 2
2021 2
2022 2
2023 107
2024 1
2025 45
159

CONSTELLATION SOFTWARE INC. Notes to Consolidated Financial Statements (In millions of U.S. dollars, except per share amounts and as otherwise indicated.) (Due to rounding, numbers presented may not foot.) Years ended December 31, 2019 and 2018
61
amount thereof plus accrued and unpaid interest up to but excluding the date fixed for redemption. During the period beginning on March 1 and ending on March 15 of each year, holders of Debentures will also have the right, at their option, to give notice to the Company of their intention to require the Company to repurchase (or to “put”) the Debentures, in whole or in part, on March 31 in the year that is five years following the year in which notice is given, at a price equal to the principal amount thereof plus accrued and unpaid interest up to but excluding the date fixed for repurchase.
During the years ended December 31, 2019 and December 31, 2018, no notices for redemption of the Debentures were received or given by the Company.
The fair value of the debentures as at December 31, 2019 was $286 (December 31, 2018 - $251).
13. TSS Membership Liability
On December 23, 2014, in accordance with the terms of the purchase and sale agreement for the TSS acquisition, and on the basis of the term sheets attached thereto, Constellation and the sellers of TSS along with members of TSS’ executive management team (collectively, the “minority owners”) entered into a Members Agreement pursuant to which the minority owners acquired 33.29% of the voting interests in Constellation Software Netherlands Holding Cooperatief U.A. (“CNH”), a subsidiary of Constellation and the indirect owner of 100% of TSS. Total proceeds from this transaction was €39,375 ($48,503).
Commencing any time after December 31, 2014, each of the minority owners may exercise a put option to sell all or a portion of their interests in CNH back to Constellation for an amount calculated in accordance with a valuation methodology described within the Members Agreement. Accordingly, the Company classified the proceeds from the Members Agreement as a liability. The main valuation driver in such calculation is the maintenance and other recurring revenue of CNH. Upon the exercise of a put option, Constellation would be obligated to redeem up to 33.33% of the minority owners’ interests put, no later than 30 business days from the date notice is received, and up to 33.33% on each of the first and second anniversary of the date the first redemption payment is made. In determining the valuation of the liability at each reporting period, the Company assumes the minority owners exercised their put option on the last day of the current reporting period, and redeemed 33.33% of their interests on exercise (which is classified as a current liability), and will redeem 33.33% on each of the first and second anniversary dates. Maintenance and recurring revenue of CNH for the trailing twelve months determined at the end of the current reporting period was used as the basis for valuing the interests at each redemption date. Any increase or decrease in the value of the membership liability is recorded as an expense or income in the consolidated statements of income for the period.
The seller of TSS also has an option available to it to sell approximately 68% of its interests in CNH, for an amount calculated in accordance with a valuation methodology described within the Members Agreement, in the event that Robin Van Poelje, TSS’ CEO, is no longer employed by TSS. The remaining interest of approximately 32% can be sold via the put option described above.
In the event of a change of control in Constellation, the minority owners would have the option to sell 100% of their interests in CNH for an amount calculated in accordance with a valuation methodology described within the Members Agreement. Constellation would be obligated to remit payment in respect thereof no later than 30 business days from the date notice is given.
Commencing at any time after December 31, 2023, Constellation may exercise a call option to purchase all of the minority owners’ interests in CNH, for an amount calculated in accordance with a valuation methodology described

CONSTELLATION SOFTWARE INC. Notes to Consolidated Financial Statements (In millions of U.S. dollars, except per share amounts and as otherwise indicated.) (Due to rounding, numbers presented may not foot.) Years ended December 31, 2019 and 2018
62
within the Members Agreement. Upon exercise of the call option, the full purchase price will be paid within 30 business days of the notice date, following which the minority owners’ membership in CNH will be terminated.
If any of TSS’ executive management team that participate in the Members Agreement are terminated for urgent cause as defined in Section 7:678 of the Dutch Civil Code, Constellation shall have the right to purchase all of the interests beneficially owned by the terminated executive for an amount calculated in accordance with a valuation methodology described within the Members Agreement. The full purchase price will be paid within 30 business days from the date notice is given, following which the terminated executive’s membership in CNH will be terminated. An option does exist for the terminated executive to elect to be paid in annual installments of 33.33% of his interests in CNH over a 3-year period. The valuation of the interests being purchased will be calculated at each reporting period. During the years ended December 31, 2019 and December 31, 2018, no options were exercised.
14. Provisions
The provisions balance is comprised of various individual provisions for severance costs and other estimated liabilities of the Company of uncertain timing or amount.
15. Lease obligations
The following table presents the expected maturity of the undiscounted cash flows for lease obligations as at December 31, 2019:
At January 1, 2019 9$
Reversal (4)
Provisions recorded during the period 32
Provisions used during the period (20)
Effect of movements in foreign exchange and other (0)
At December 31, 2019 16$
Provisions classified as current liabilities 13
Provisions classified as other non-current liabilities 3

CONSTELLATION SOFTWARE INC. Notes to Consolidated Financial Statements (In millions of U.S. dollars, except per share amounts and as otherwise indicated.) (Due to rounding, numbers presented may not foot.) Years ended December 31, 2019 and 2018
63
The expense relating to variable lease payments not included in the measurement of lease obligations was $6. This consists primarily of variable lease payments for property taxes. Expenses relating to short-term leases were $14, expenses relating to leases of low value assets were $1 and sublease income was $1. Total cash outflow for leases was $78.
16. Income taxes
(a) Tax recognized in profit or loss
December 31, 2019
Less than 1 year 67$ Between 1 and 5 years 158 More than 5 years 50
Total 275$
Less: Impact of discounting (25)
Leases obligation recorded on balance sheet 250$
2019 2018
Tax recognized in profit or loss
Current tax expense (recovery)
Current year 165 121 Adjustment for prior years (1) 5
164 127
Deferred tax expense (recovery)
Origination and reversal of temporary differences (45) (8) Effect of change in future tax rates 3 (8) Change in recognized temporary differences and unrecognized tax losses 7 (1) Adjustment for prior years (6) (3)
(41) (20)
Total tax expense (recovery) 123 106

CONSTELLATION SOFTWARE INC. Notes to Consolidated Financial Statements (In millions of U.S. dollars, except per share amounts and as otherwise indicated.) (Due to rounding, numbers presented may not foot.) Years ended December 31, 2019 and 2018
64
(b) Reconciliation of effective tax rate
Constellation is subject to tax audits in the countries in which the Company does business globally. These tax audits could result in additional tax expense in future periods relating to historical filings. Reviews by tax authorities generally focus on, but are not limited to, the validity of the Company’s inter-company transactions, including financing and transfer pricing policies which generally involve subjective areas of taxation and a significant degree of judgment. If any of these tax authorities are successful with their challenges, the Company’s income tax expense may be adversely affected and Constellation could also be subject to interest and penalty charges.
17. Deferred tax assets and liabilities
(a) Unrecognized deferred tax liabilities The aggregate amount of temporary differences associated with investments in subsidiaries for which we have not recognized deferred tax liabilities is $763 (2018: $733) as the Company ultimately controls whether the liability will be incurred and it is satisfied that it will not be incurred in the foreseeable future. The temporary differences relate to undistributed earnings of the Company's subsidiaries. Dividends declared would be subject to withholding tax in the range of 0-15% depending on the jurisdiction of the subsidiary. (b) Unrecognized deferred tax assets
Non-capital tax losses of $183 expire between 2020 and 2039 and $142 can be carried forward indefinitely. Included in the non-capital tax losses expiring between 2020 and 2039 is $140 of losses that are not expected to be used to offset future taxable profit as a result of legislative restrictions in the jurisdiction where those losses exist. The deductible temporary differences and capital losses do not expire under current tax legislation. Deferred tax assets have not been recognized in respect of those items because it is not probable that future taxable profit will be available in those jurisdictions against which the Company can utilize these benefits.
2018
Net income for the year 333 379
Total tax expense 123 106
Net income before tax 456 486
Income tax expense using the Company's statutory tax rate of 26.5% (2018 - 26.5%) 121 129
Impact on taxes from:
Foreign tax rate differential (6) (2)
Other, including non deductible expenses and non taxable income 5 (14)
Change in recognized temporary differences and unrecognized tax losses 7 (1)
Effect of change in future tax rates 3 (8)
Under (over) provisions in prior years (7) 2
123 106
2019
2019 2018
Deductible temporary differences, including capital losses $ 56 $ 21
Non capital tax losses $ 325 $ 139

CONSTELLATION SOFTWARE INC. Notes to Consolidated Financial Statements (In millions of U.S. dollars, except per share amounts and as otherwise indicated.) (Due to rounding, numbers presented may not foot.) Years ended December 31, 2019 and 2018
65
(c) Recognized deferred tax assets and liabilities
This reclassification relates to the offsetting of deferred tax assets and deferred tax liabilities to the extent that they relate to the same taxing authorities and there is a legally enforceable right to do so. (d) Movement in deferred tax balances during the year
2019 2018 2019 2018 2019 2018
Property, plant and equipment 6 4 (3) (2) 3 2
Intangible assets 89 83 (327) (268) (238) (185)
Reserves 18 13 (1) (1) 17 12
Non capital loss carryforwards 26 26 - - 26 26
SR&ED expenditure pool 0 1 (0) - 0 1
Deferred revenue 26 23 (4) (1) 22 22
Tax credits - - (6) (6) (6) (6)
Other, including capital losses, withholding tax and foreign exchange (1) 3 (24) (20) (25) (17)
Tax assets (liabilities) 164 153 (365) (298) (201) (145)
Reclassification (119) (106) 119 106
Net tax assets (liabilities) 45 47 (246) (192) (201) (145)
Assets Liabilities Net
Balance January 1, 2019
Recognized in profit or loss
Recognized in other comprehensive
income
Acquired in business
combinations Other
Balance December 31,
2019
Property, plant and equipment 2 ‐ - 1 3
Intangible assets (185) 55 - (108) 1 (238)
Reserves 12 4 - 0 17
Non-capital loss carryforwards 26 (8) - 7 1 26
SR&ED expenditure pool 1 (1) - 0 0
Deferred revenue 22 ‐ - 0 22
Tax credits (6) ‐ - (0) (6)
Other, including capital losses, withholding tax and foreign exchange (17) (9) (0) 0 1 (25)
(145) 41 (0) (100) 3 (201)
Balance January 1, 2018
Recognized in profit or loss
Recognized in other comprehensive
income
Acquired in business
combinations Other
Balance December 31,
2018
Property, plant and equipment 2 (0) - 0 - 2
Intangible assets (136) 29 - (84) 6 (185)
Reserves 10 1 - 1 - 12
Non-capital loss carryforwards 17 (2) - 12 - 26
SR&ED expenditure pool - (0) - 1 - 1
Deferred revenue 7 2 - 5 9 22
Tax credits (4) (1) - (1) - (6)
Other, including capital losses, withholding tax and foreign exchange (7) (7) (0) (1) (2) (17)
(111) 20 (0) (66) 12 (145)

CONSTELLATION SOFTWARE INC. Notes to Consolidated Financial Statements (In millions of U.S. dollars, except per share amounts and as otherwise indicated.) (Due to rounding, numbers presented may not foot.) Years ended December 31, 2019 and 2018
66
18. Capital and other components of equity
Capital Stock
At December 31, 2019 and December 31, 2018, the authorized share capital of Constellation consisted of an unlimited number of voting common shares and a limited number of non-voting preferred shares (there are no preferred shares outstanding).
Accumulated other comprehensive income (loss)
Accumulated other comprehensive income (loss) is comprised of the following separate components of equity: Cumulative translation account The cumulative translation account comprises all foreign currency differences arising from the translation of the financial statements of foreign operations, as well as foreign exchange gains and losses arising from monetary items that form part of the net investment in the foreign operation. Amounts related to derivatives designated as hedges The portion of the gain or loss on derivatives designated as hedges that are determined to be an effective hedge are recognized directly in other comprehensive income, and the ineffective portion in the statement of income. The gains or losses deferred in other comprehensive income in this way are subsequently recognized in the statement of income in the same period in which the hedged underlying transaction or firm commitment is recognized in the statement of income. Dividends During the three months ended March 31, 2019, the Company declared a $1.00 per share dividend and a $20.00 per share special dividend to all common shareholders of record at close of business on March 16, 2019. The dividends declared in the quarter ended March 31, 2019 representing $445 were paid and settled on April 5, 2019. During the three months ended June 30, 2019, the Company declared a $1.00 per share dividend to all common shareholders of record at close of business on June 14, 2019. The dividends declared in the quarter ended June 30, 2019 representing $21 were paid and settled on July 8, 2019. During the three months ended September 30, 2019, the Company declared a $1.00 per share dividend to all common shareholders of record at close of business on September 16, 2019. The dividends declared in the quarter ended September 30, 2019 representing $21 were paid and settled on October 7, 2019. During the three months ended December 31, 2019, the Company declared a $1.00 per share dividend to all common shareholders of record at close of business on
Number Amount
December 31, 2019 21,191,530 99$
December 31, 2018 21,191,530 99$
Common Shares

CONSTELLATION SOFTWARE INC. Notes to Consolidated Financial Statements (In millions of U.S. dollars, except per share amounts and as otherwise indicated.) (Due to rounding, numbers presented may not foot.) Years ended December 31, 2019 and 2018
67
December 16, 2019. The dividends declared in the quarter ended December 31, 2019 representing $21 were paid and settled on January 8, 2020. A dividend of $1.00 per share representing $21 were accrued as at December 31, 2018 and subsequently paid and settled on January 4, 2019.
19. Finance and other income and finance costs
Included in finance and other income is a $8 adjustment which was made during the year ended December 31, 2018 relating to the acquired net tangible assets of an acquisition which closed in a previous year.
20. Earnings per share
Basic and diluted earnings per share
2019 2018
Interest income on cash (3)$ (5)$
(Increase) decrease in the fair value of equity securities held for trading (0) -
Share in net (income) loss of equity investee 1 (1)
Finance and other income (2) (11)
Finance and other expense (income) (4)$ (17)$
Interest expense on debt and debentures 31$ 25$
Interest expense on lease obligations 7 -
Amortization of debt related transaction costs 1 1
Amortization of debenture discount (premium) and associated rights offering, net (4) (4)
Other finance costs 6 4
Finance costs 42$ 26$
Years ended December 31,
2019 2018
Numerator:
Net income 333$ 379$
Denominator:
Basic and diluted shares outstanding 21,191,530 21,191,530
Earnings per share
Basic and diluted 15.73$ 17.91$
Years ended December 31,

CONSTELLATION SOFTWARE INC. Notes to Consolidated Financial Statements (In millions of U.S. dollars, except per share amounts and as otherwise indicated.) (Due to rounding, numbers presented may not foot.) Years ended December 31, 2019 and 2018
68
21. Capital risk management
The Company's objectives in managing capital are to ensure sufficient liquidity to pursue its strategy of organic growth combined with strategic acquisitions and to provide returns to its shareholders. The Company manages its capital with the objective of ensuring that there are adequate capital resources while maximizing the return to shareholders through the optimization of the debt and equity balance. The capital structure of the Company consists of cash, CSI facility, Debt without recourse to CSI, Debentures, TSS membership liability and components of shareholders' equity including retained earnings and capital stock.
The Company is subject to certain covenants on its CSI facility. The covenants include a leverage ratio and an interest coverage ratio. The Debt without recourse to CSI is also subject to certain covenants. The Company monitors the ratios on a quarterly basis. As at December 31, 2019 and 2018, the Company is in compliance with its debt covenants. Other than the covenants required for the CSI facility and the Debt without recourse to CSI, the Company is not subject to any externally imposed capital requirements.
The Board of Directors determine if and when dividends should be declared and paid based on all relevant circumstances, including the desirability of financing further growth of the Company and its financial position at the relevant time. The Board of Directors has adopted a policy to pay quarterly dividends, which commenced in 2012. Constellation intends to declare a regular quarterly dividend to allow shareholders to participate in its free cash flow, while retaining sufficient capital to invest in acquisitions and organic growth. There is no guarantee that dividends will continue to be declared and paid in the future.
The Company makes adjustments to its capital structure in light of general economic conditions, the risk characteristics of the underlying assets and the Company's working capital requirements. In order to maintain or adjust its capital structure, the Company, upon approval from its Board of Directors, may increase or decrease dividends, increase or decrease the line of credit or undertake other activities as deemed appropriate under the specific circumstances. The Board of Directors reviews and approves any material transactions not in the ordinary course of business, as well as significant acquisitions and other major investments above pre-determined quantitative thresholds.
22. Financial risk management and financial instruments
Overview
The Company is exposed to risks of varying degrees of significance which could affect its ability to achieve its strategic objectives for growth. The main objectives of the Company's risk management process are to ensure that risks are properly identified and that the capital base is adequate in relation to those risks. The principal financial risks to which the Company is exposed are described below.
Market risk
Market risk is the risk that changes in market prices, such as fluctuations in foreign exchange rates and interest rates, will affect the Company's income or the value of its financial instruments.
The Company is exposed to interest rate risk on the utilized portion of its CSI facility and its Debentures and does not currently hold any financial instruments that mitigate this risk. If there was a 1% increase in the interest rate on the Debentures, there would be a corresponding decrease in income before tax of $2. There would be an equal and opposite impact if there was a 1% decrease in the interest rate.

CONSTELLATION SOFTWARE INC. Notes to Consolidated Financial Statements (In millions of U.S. dollars, except per share amounts and as otherwise indicated.) (Due to rounding, numbers presented may not foot.) Years ended December 31, 2019 and 2018
69
The Company is also exposed to interest rate risk on the utilized portion of the Debt without recourse to CSI. If there was a 1% increase in the interest rate on the Debt without recourse to CSI, there would be a corresponding decrease in income before tax of $2. There would be an equal and opposite impact if there was a 1% decrease in the interest rate.
The Company operates internationally, giving rise to exposure to market risks from changes in foreign exchange rates which impact sales and purchases that are denominated in a currency other than the respective functional currencies of certain of its subsidiaries. The Company currently does not typically use derivative instruments to hedge its exposure to those risks. Most of the Company's businesses are organized geographically so that many of its expenses are incurred in the same currency as its revenues thus mitigating some of its exposure to currency fluctuations.
Foreign currency sensitivity analysis:
Foreign currency risk arises on financial instruments that are denominated in a currency other than the functional currency in which they are measured. The Company’s primary exposure with respect to foreign currencies is through the Canadian dollar denominated Debentures (note 12). The carrying value of the Debentures at December 31, 2019 is $222 (C$288) (December 31, 2018 - $215 (C$293)). If there was a 1% strengthening of the Canadian dollar against the U.S. dollar, there would be a corresponding decrease in income before tax of $2. There would be an equal and opposite impact if there was a 1% weakening of the Canadian dollar against the U.S. dollar.
Liquidity risk
Liquidity risk is the risk that the Company is not able to meet its financial obligations as they fall due or can do so only at excessive cost. The Company manages liquidity risk through the management of its capital structure and financial leverage, as outlined in note 21 to the consolidated financial statements. The Company's growth is financed through a combination of cash flows from operations and borrowing under the CSI facility, Debt without recourse to CSI, TSS Membership Liability and Debentures. One of the Company’s primary goals is to maintain an optimal level of liquidity through the active management of the assets and liabilities as well as the cash flows from operations. The details of the Company's CSI facility, Debt without recourse to CSI, Debentures, and TSS membership liability are disclosed in note 10, note 11, note 12 and note 13 to the consolidated financial statements. As at December 31, 2019, available credit in respect of the Company's CSI facility was $614.
The majority of the Company's financial liabilities recorded in accounts payable and accrued liabilities are due within 60 days. The Company also has payment processing liabilities which are settled within a few days of year-end. Included in cash is an equivalent cash balance of $11 (December 31, 2018 - $14) that is held to settle these payment processing liabilities as they become due. Holdbacks payable related to business acquisitions are generally due within six months to two years.
Given the Company's available liquid resources and credit capacity as compared to the timing of the payments of liabilities, the Company assesses its liquidity risk to be low.
Credit risk
Credit risk represents the financial loss that the Company would experience if a counterparty to a financial instrument, in which the Company has an amount owing from the counterparty failed to meet its obligations in accordance with the terms and conditions of its contracts with the Company. The carrying amount of the Company's financial assets, including receivables from customers, represents the Company's maximum credit exposure.

CONSTELLATION SOFTWARE INC. Notes to Consolidated Financial Statements (In millions of U.S. dollars, except per share amounts and as otherwise indicated.) (Due to rounding, numbers presented may not foot.) Years ended December 31, 2019 and 2018
70
The majority of the accounts receivable balance relates to maintenance invoices to customers that have a history of payment. In addition, a large proportion of the Company's accounts receivable are with public sector government agencies where the credit risk has historically been assessed to be low.
The maximum exposure to credit risk for accounts receivable at the reporting date by geographic region was:
The maximum exposure to credit risk for accounts receivable at the reporting date by reportable segment was:
December 31, 2019
December 31, 2018
United States 176$ 162$
Canada 43 40
United Kingdom 44 29
Europe 126 107
Other 34 24
422$ 362$
December 31, 2019
December 31, 2018
Public 297$ 253$
Private 125 109
422$ 362$

CONSTELLATION SOFTWARE INC. Notes to Consolidated Financial Statements (In millions of U.S. dollars, except per share amounts and as otherwise indicated.) (Due to rounding, numbers presented may not foot.) Years ended December 31, 2019 and 2018
71
The aging of accounts receivables at the reporting date was:
An allowance account for accounts receivable is used to record impairment losses unless the Company is satisfied that no recovery of the amount owing is possible; at which point the amounts are considered to be uncollectible and are written off against the specific accounts receivable amount attributable to a customer. The number of days outstanding of an individual receivable balance is the key indicator for determining whether an account is at risk of being impaired.
The movement in the allowance for impairment in respect of accounts receivable during the year ended:
December 31, 2019
December 31, 2018
Current
Gross 337$ 297$
Impairment (1) (1)
Net 337 296
90-180 days
Gross 60 45
Impairment (2) (2)
Net 58 43
More than 180 days
Gross 55 47
Impairment (28) (25)
Net 27 22
Total accounts receivable
Gross 452$ 389$
Impairment (31) (27)
Net 422 362

CONSTELLATION SOFTWARE INC. Notes to Consolidated Financial Statements (In millions of U.S. dollars, except per share amounts and as otherwise indicated.) (Due to rounding, numbers presented may not foot.) Years ended December 31, 2019 and 2018
72
There is no concentration of credit risk because of the Company's diverse and disparate number of customers with individual receivables that are not significant to the Company on a consolidated basis. In addition, the Company typically requires up front deposits from customers to protect against credit risk.
The Company manages credit risk related to cash by maintaining the majority of the Company’s bank accounts with Schedule 1 banks.
In the ordinary course of business, the Company and its subsidiaries have provided performance bonds and other guarantees for the completion of certain customer contracts. The Company has not experienced a loss to date and future losses are not anticipated; therefore, no liability has been recorded in the consolidated statements of financial position related to these types of indemnifications or guarantees at December 31, 2019.
Fair values versus carrying amounts
The carrying values of cash, accounts receivable, accounts payable, accrued liabilities, dividends payable, income taxes payable, the majority of acquisition holdbacks, debt without recourse to CSI and the CSI Facility, approximate their fair values due to the short-term nature of these instruments. Bank debt and debt without recourse to CSI is subject to market interest rates.
Reconciliation of cash flows from financing activities
The following table reconciles the changes in cash flows from financing activities for the CSI facility, Debt without recourse to CSI, TSS Membership Liability, and Debentures that is outstanding as at December 31:
2019 2018
Aggregate balance at January 1 27$ 22$
Increase from business acquisitions 4 7
Impairment loss recognized 18 17
Impairment loss reversed (9) (13)
Amounts written off (10) (6)
Other movements (0) 1
Aggregate balance at December 31 31$ 27$
Allowance for doubtful accounts arising from business combinations 9$ 8$

CONSTELLATION SOFTWARE INC. Notes to Consolidated Financial Statements (In millions of U.S. dollars, except per share amounts and as otherwise indicated.) (Due to rounding, numbers presented may not foot.) Years ended December 31, 2019 and 2018
73
Fair value hierarchy
The table below analyzes financial instruments carried at fair value, by valuation method.
level 1 inputs are quoted prices (unadjusted) in active markets for identical assets or liabilities; level 2 inputs are inputs other than quoted prices included in level 1 that are observable for the asset or
liability either directly (i.e. prices) or indirectly (i.e. derived from prices); and level 3 inputs are inputs for the asset or liability that are not based on observable market data (i.e.
unobservable inputs).
In the table below, the Company has segregated all financial assets and liabilities that are measured at fair value into the most appropriate level within the fair value hierarchy based on the inputs used to determine the fair value at the measurement date.
Financial assets and financial liabilities measured at fair value as at December 31, 2019 and December 31, 2018 in the financial statements are summarized below. The Company has no additional financial liabilities measured at fair value initially other than those recognized in connection with business combinations.
CSI facility
Debt without recorse to CSI
TSS Membership Liability Debentures Lease liability Dividends
Balance at January 1, 2019 -$ $ 154 $ 184 $ 215 $ - $ 21
IFRS 16 adjustment - - - - 216 -
Reclassification of deferred financing fees from other assets (2) - - - - -
Increase (decrease) in revolving credit under debt facilities without recourse to CSI - 5 - - - -
Proceeds from issuance of term debt under facilities without recourse to CSI - 49 - - - -
Repayments of term debt under facilities without recourse to CSI - (1) - - - -
Increase (decrease) in the CSI facility 65 - - - - -
Distribution to TSS minority owners - - (11) - - -
Payments of lease obligations - - - - (56) -
Dividends paid - - - - - (509)
Credit facility transaction costs (0) (2) - - - -
Total financing cash flow activities 65 50 (11) - (56) (509)
Amortization of debt discounts and premiums - - - (3) - -
Amortization of debt related transaction costs 0 1 - - - -
TSS membership liability revaluation charge - - 52 - - -
New leases, net of terminations and modifications - - - - 89 -
Dividends declared - - - - - 509
Foreign exchange loss (gain) - - - 10 - 0
Foreign currency translation differences from foreign operations - 5 (3) - 0 -
Total financing non-cash activities 0 6 48 7 89 509
Balance at December 31, 2019 63$ 210$ 221$ 222$ 250$ 21$

CONSTELLATION SOFTWARE INC. Notes to Consolidated Financial Statements (In millions of U.S. dollars, except per share amounts and as otherwise indicated.) (Due to rounding, numbers presented may not foot.) Years ended December 31, 2019 and 2018
74
There were no transfers of fair value measurements between level 1, 2 and level 3 of the fair value hierarchy in the years ended December 31, 2019 and 2018.
The following table shows a reconciliation from the beginning balances to the ending balances for fair value measurements in Level 3 of the fair value hierarchy.
Estimates of the fair value of contingent consideration is performed by the Company on a quarterly basis. Key unobservable inputs include revenue growth rates and the discount rates applied (7% to 11%). The estimated fair value increases as the annual growth rate increases and as the discount rate decreases and vice versa.
23. Revenue
The following tables provides information about unbilled revenue (contract asset) and deferred revenue (contract liability).
Level 1 Level 2 Level 3 Total Level 1 Level 2 Level 3 Total
Assets:
Equity securities held for trading 10$ -$ -$ 10$ -$ -$ -$ -$
10 - - 10 - - - -
Liabilities:
Contingent consideration -$ -$ 59$ 59$ -$ -$ 19$ 19$
- - 59 59 - - 19 19
December 31, 2019 December 31, 2018
Balance at January 1, 2019 19$
Increase from business acquisitions 37 Cash recoveries (payments) (8) Charges through profit or loss 11 Foreign exchange and other movements 1
Balance at December 31, 2019 59
Contingent consideration classified as current liabilities 18 Contingent consideration classified as other non-current liabilities 42

CONSTELLATION SOFTWARE INC. Notes to Consolidated Financial Statements (In millions of U.S. dollars, except per share amounts and as otherwise indicated.) (Due to rounding, numbers presented may not foot.) Years ended December 31, 2019 and 2018
75
Unbilled Revenue:
Deferred Revenue:
The amount of revenue recognized in the year ended December 31, 2019 from performance obligations satisfied in previous periods was $0 (December 31, 2018 - $3).
Revenue allocated to remaining performance obligations represents contracted revenue that has not yet been recognized (“contracted not yet recognized”) and includes unearned revenue and amounts that will be invoiced and
2019 2018
At January 1 83$ 64$
Increase from IFRS 15 opening balance sheet adjustments - 10
Increase from business acquisitions 11 14
Decrease from transfers to accounts receivable (262) (251)
Increase from changes as a result of the measure of progress 280 248
Foreign exchange and other movements 1 (2)
At December 31 112$ 83$
Unbilled revenue classified as a current asset 110$ 80$
Unbilled revenue classified as a other non-current asset 3 3
2019 2018
At January 1 700$ 543$
Increase from IFRS 15 opening balance sheet adjustments - 74
Increase from business acquisitions 114 93
(638) (512)
(66) (62)
716 578
Foreign exchange and other movements 4 (15)
At December 31 828$ 700$
Deferred revenue classified as a current liability 788 657
Deferred revenue classified as a other non-current liability 41 43
Decrease from revenue recognized that was included in the deferred revenue balance at the beginning of the period
Increase due to cash received, excluding amounts recognized as revenue during the period
Decrease from revenue recognized that arose from acquired deferred revenue balances in the current year

CONSTELLATION SOFTWARE INC. Notes to Consolidated Financial Statements (In millions of U.S. dollars, except per share amounts and as otherwise indicated.) (Due to rounding, numbers presented may not foot.) Years ended December 31, 2019 and 2018
76
recognized as revenue in future periods. Contracted not yet recognized revenue was approximately $1,900 as of December 31, 2019, of which we expect to recognize an estimated 70% of the revenue over the next 12 months and the remainder thereafter.
Costs to obtain a contract with a customer:
The Company has capitalized and amortized incremental commission costs on a systematic basis, consistent with the pattern of transfer of the good(s) or service(s) to which the commission relates as the Company believes these costs are recoverable. The total capitalized commission costs as of December 31, 2019 is $67 (December 31, 2018 - $49). The amount of amortization expense for the year ended December 31, 2019 was $14 (December 31, 2018 - $15) and there was no impairment loss in relation to the costs capitalized.
24. Operating segments
Segment information is presented in respect of the Company's business and geographical segments. The accounting policies of the segments are the same as those described in the significant accounting policies section of these consolidated financial statements.
Reportable segments
The Company has six operating segments, referred to as Operating Groups by the Company, being Volaris, Harris, TSS, Jonas, Perseus, and Vela. The operating segments are aggregated into two reportable segments in accordance with IFRS 8 Operating Segments. The Company‘s Public Sector segment develops and distributes software solutions primarily to government and government-related customers. The Company‘s Private Sector segment develops and distributes software solutions primarily to commercial customers. While the operating groups in the public sector are comprised of businesses that primarily serve government and government-related customers, they also include businesses that serve commercial customers, and similarly the operating groups in the private sector are comprised of businesses that primarily serve commercial customers but also include businesses that serve government and government-related customers. For the fiscal years ended December 31, 2018 and 2019 approximately 30% and 35% respectively of the revenue in in the public sector reportable segment is generated from commercial customers, and 16% and 15% respectively of revenue in the private sector reportable segment is generated from government and government-related customers.
The Operating Groups exhibit similar economic characteristics (such as gross and earnings before income tax and amortization (“EBITA”) margins) and are substantially similar in relation to the nature of products and services, the nature of production processes, and the methods used to distribute products; however, the determination that the Company has two reportable segments is based primarily on the assessment that differences in economic cycles and procedures for securing contracts between our governmental clients and commercial, or private sector clients, are significant, thus warranting distinct segmented disclosures. Volaris, Harris and TSS have been aggregated into the Public Sector segment. Jonas, Perseus and Vela have been aggregated into the Private Sector segment.
Intercompany expenses (income) primarily represent Constellation head office management fees and intercompany interest charged on related borrowings to the reportable segments.

CONSTELLATION SOFTWARE INC. Notes to Consolidated Financial Statements (In millions of U.S. dollars, except per share amounts and as otherwise indicated.) (Due to rounding, numbers presented may not foot.) Years ended December 31, 2019 and 2018
77
Year ended December 31, 2019 Public Sector Private Sector Other Consolidated
Total
Revenue
License 143$ 83$ -$ 226$
Professional services 522 151 - 673
Hardware and other 143 30 - 173
Maintenance and other recurring 1,544 873 - 2,417
2,353 1,138 - 3,490
Expenses
Staff 1,217 575 5 1,797
Hardware 83 19 - 101
Third party licenses, maintenance and professional services 184 115 - 300
Occupancy 21 13 0 35
Travel, telecommunications, supplies, software and equipment 144 55 1 201
Professional fees 35 13 2 49
Other, net 37 36 1 73
Depreciation 64 27 1 92
Amortization of intangible assets 230 100 - 331
2,016 953 10 2,979
Foreign exchange (gain) loss 5 7 (1) 11
TSS membership liability revaluation charge 52 - - 52
Finance and other expense (income) (1) (0) (2) (4)
Bargain purchase (gain) (41) (4) - (45)
Finance costs 21 4 17 42
Intercompany expenses (income) 26 12 (38) -
61 18 (24) 55
Income before income taxes 276 167 14 456
Current income tax expense (recovery) 108 51 5 164
Deferred income tax expense (recovery) (35) (13) 6 (41)
Income tax expense (recovery) 74 38 11 123
Net income 202$ 128$ 3$ 333$
December 31, 2019 Public Sector Private Sector Other Consolidated
Total
Current assets 719 237 107 1,062
Current liabilities 1,188 467 76 1,732

CONSTELLATION SOFTWARE INC. Notes to Consolidated Financial Statements (In millions of U.S. dollars, except per share amounts and as otherwise indicated.) (Due to rounding, numbers presented may not foot.) Years ended December 31, 2019 and 2018
78
Year ended December 31, 2018
Public Sector
Private Sector Other
Consolidated Total
Revenue
License 121$ 77$ -$ 198$
Professional services 471 144 - 616
Hardware and other 146 28 - 175 Maintenance and other recurring 1,309 763 - 2,072
2,047 1,013 - 3,060
Expenses
Staff 1,038 522 5 1,565
Hardware 78 18 - 96
Third party licenses, maintenance and professional services 162 102 - 265
Occupancy 50 28 0 78
Travel, telecommunications, supplies, software and equipment 131 50 1 181
Professional fees 27 10 2 39
Other, net 22 29 1 52
Depreciation 20 7 0 27
Amortization of intangible assets 186 93 - 279
1,715 859 9 2,582
Foreign exchange (gain) loss 3 (3) (3) (3)
TSS membership liability revaluation charge 55 - - 55
Finance and other expense (income) (12) (0) (5) (17)
Bargain purchase (gain) (64) (4) - (69)
Finance costs 9 2 15 26
Intercompany expenses (income) 16 11 (27) -
7 5 (20) (8)
Income before income taxes 326 149 11 486
Current income tax expense (recovery) 79 46 2 127
Deferred income tax expense (recovery) (15) (8) 3 (20)
Income tax expense (recovery) 64 37 5 106
Net income 262 111 6 379
December 31, 2018 Public Sector
Private Sector Other
Consolidated Total
Current assets 591 206 410 1,207
Current liabilities 938 389 17 1,344

CONSTELLATION SOFTWARE INC. Notes to Consolidated Financial Statements (In millions of U.S. dollars, except per share amounts and as otherwise indicated.) (Due to rounding, numbers presented may not foot.) Years ended December 31, 2019 and 2018
79
Geographical segments
The public and private sector segments are managed on a worldwide basis, but operate in three principal geographical areas, Canada, USA, and UK/Europe.
In presenting information on the basis of geographical segments, segment revenue is based on the region in which the revenue is transacted and intellectual property is located. Segment assets are based on the geographic locations of the assets.
Major customers
No customer represents revenue in excess of 5% of total revenue in both years ended December 31, 2019 and 2018.
25. Contingencies
In the normal course of operations, the Company is subject to litigation and claims from time to time. The Company may also be subject to lawsuits, investigations and other claims, including environmental, labour, income and sales tax, product, customer disputes and other matters. The Company believes that adequate provisions have been recorded in the accounts where required. Although it is not always possible to estimate the extent of potential costs, if any, the Company believes that the ultimate resolution of such contingencies will not have a material adverse impact on the results of operations, financial position or liquidity of the Company.
26. Guarantees
(a) In the ordinary course of business the Company and its subsidiaries have provided performance bonds, letters of credit issued that do not limit the borrowing capacity of the CSI Facility, and other guarantees for the completion of certain customer contracts. The total obligations of the Company pursuant to such bonds and related contingencies total $72 (2018 - $64). No liability has been recorded in the consolidated financial statements.
Year ended December 31, 2019 Canada USA UK/Europe Other Total
Revenue 481$ 1,532$ 1,185$ 292$ 3,490$
Non-current assets 472 710 968 275 2,425
Year ended December 31, 2018 Canada USA UK/Europe Other Total
Revenue 440$ 1,369$ 1,032$ 220$ 3,060$
Non-current assets 463 424 676 165 1,728

CONSTELLATION SOFTWARE INC. Notes to Consolidated Financial Statements (In millions of U.S. dollars, except per share amounts and as otherwise indicated.) (Due to rounding, numbers presented may not foot.) Years ended December 31, 2019 and 2018
80
(b) As at December 31, 2019, in the normal course of business, the Company has outstanding letters of credit with the CSI Facility totalling $21 (2018 - $21) which limits the borrowing capacity of the CSI Facility on a dollar-for-dollar basis.
(c) In the normal course of business, some of the Company's subsidiaries entered into lease agreements for
facilities. As the joint lessees, the subsidiaries agree to indemnify the lessor for liabilities that may arise from the use of the leased facility. The maximum amount potentially payable under the foregoing indemnity cannot be reasonably estimated. The subsidiaries have liability insurance that relates to the indemnifications.
(d) The Company and its subsidiaries have provided routine indemnifications to some of its customers against
liability if the Company's product infringes on a third party's intellectual property rights. The maximum exposure from the indemnifications cannot be reasonably estimated.
27. Changes in non-cash operating working capital
28. Related parties
Key management personnel compensation
The key management personnel of the Company, inclusive of the operating segments, are the members of the Company’s executive management team at the Company operating segments and head office and Board of Directors.
2019 2018
Decrease (increase) in current accounts receivable 10$ 47$
Decrease (increase) in current unbilled revenue (19) 3
Decrease (increase) in other current assets (36) (11)
Decrease (increase) in inventories 5 (9)
Decrease (increase) in other non-current assets (6) (1)
Increase (decrease) in other non-current liabilities 1 (14)
Increase (decrease) in current accounts payable and accrued liabilities,
excluding holdbacks from acquisitions (1) (18)
Increase (decrease) in current deferred revenue 15 22
Increase (decrease) in current provisions 4 (4)
Change in non-cash operating working capital (28)$ 14$
Year ended
December 31,

CONSTELLATION SOFTWARE INC. Notes to Consolidated Financial Statements (In millions of U.S. dollars, except per share amounts and as otherwise indicated.) (Due to rounding, numbers presented may not foot.) Years ended December 31, 2019 and 2018
81
There were no significant post-employment benefits, other long-term benefits, or share-based payments attributed to the key management personnel in 2019 and 2018.
29. Subsequent events
On February 13, 2020, the Company declared a $1.00 per share dividend payable on April 7, 2020 to all common shareholders of record at close of business on March 16, 2020.
Subsequent to December 31, 2019, the Company completed or entered into agreements to acquire a number of businesses for aggregate cash consideration of $63 on closing plus cash holdbacks of $32 and contingent consideration with an estimated fair value of $10 for total consideration of $104. The business acquisitions include companies catering primarily to the aerospace, school and special library, mining, asset management, automotive, communications, healthcare, education, hospitality, private clubs and daily fee golf courses, construction and waste management systems verticals and are all software companies similar to the existing business of the Company.
30. Comparative Figures
Constellation has presented these consolidated financial statements in millions of dollars. Prior year figures and information have been adjusted to conform to the current year presentation in millions of dollars and certain amounts presented in previous years may not agree to the current year presentation as a result of rounding. Furthermore, due to rounding, numbers presented may not foot.
31. Explanation of adoption of IFRS 16
The Company adopted IFRS 16 using the modified retrospective approach and accordingly the information presented for 2018 has not been restated. It remains as previously reported under IAS 17 and related interpretations. On initial application, the Company has elected to record right-of-use assets based on the corresponding lease liability, adjusted by the amount of any prepaid or accrued lease payments. Right-of-use assets and lease obligations of $216 were recorded as of January 1, 2019, with no net impact on retained earnings. When measuring lease liabilities, the Company discounted lease payments using its incremental borrowing rate at January 1, 2019. The weighted-average rate applied is approximately 3%. The Company has elected to apply the practical expedient to account for leases for which the lease term ends within 12 months of the date of initial application as short-term leases. The Company has elected to apply the practical expedient to grandfather the assessment of which transactions are leases on the date of initial application, as previously assessed under IAS 17 and IFRIC 4. The Company applied the definition of a lease under IFRS 16 to contracts entered into or changed on or after January 1, 2019.
The following table reconciles the Company’s operating lease obligations at December 31, 2018, as previously disclosed in the Company’s consolidated financial statements, to the lease obligations recognized on initial application of IFRS 16 at January 1, 2019.
2019 2018
Salaries, bonus and employee benefits 11$ 13$
Total 11$ 13$
Years ended December 31,

CONSTELLATION SOFTWARE INC. Notes to Consolidated Financial Statements (In millions of U.S. dollars, except per share amounts and as otherwise indicated.) (Due to rounding, numbers presented may not foot.) Years ended December 31, 2019 and 2018
82
The following tables summarizes the impacts of adopting IFRS 16 on the Company’s consolidated statement of income for the year ended December 31, 2019:
Aggregate lease commitments as disclosed at December 31, 2018 274$
Less: Recognition exemption short-term leases (leases that expire on or prior to December 31, 2019) (11)
Less: Recognition exemption for low-value leases (1)
Add: Extension options reasonably certain to be exercised 13
Less: Non-lease component of contractual arrangement that has been split out and excluded from the IFRS 16 opening adjustment (31)
Less: Foreign exchange and other adjustments (7)
Adjusted lease commitments 237
Less: Impact of present value (21)
Opening IFRS 16 lease liability as at January 1, 2019 216

CONSTELLATION SOFTWARE INC. Notes to Consolidated Financial Statements (In millions of U.S. dollars, except per share amounts and as otherwise indicated.) (Due to rounding, numbers presented may not foot.) Years ended December 31, 2019 and 2018
83
As a result of adopting IFRS 16, lease payments (comprised of principal and interest payments on lease obligations) are now classified as financing cash flows instead of operating cash flows. The following table summarizes the impacts of adopting IFRS 16 on the Company’s consolidated statement of cash flow for the year ended December 31, 2019.
Year ended December 31, 2019
As reported Adjustments
Year ended December 31, 2019 without
adoption of IFRS 16
RevenueLicense 226$ -$ 226$ Professional services 673 - 673 Hardware and other 173 - 173 Maintenance and other recurring 2,417 - 2,417
3,490 - 3,490
ExpensesStaff 1,797 4 1,802 Hardware 101 0 102 Third party license, maintenance and professional services 300 0 300 Occupancy 35 52 87 Travel, telecomunications, supplies, software and equipment 201 6 207 Professional fees 49 - 49 Other, net 73 (0) 73 Depreciation 92 (58) 34 Amortization of intangible assets 331 - 331
2,979 5 2,984
Foreign exchange loss (gain) 11 (1) 10 TSS membership liability revaluation charge 52 - 52 Finance and other expense (income) (4) - (4) Bargain purchase gain (45) - (45) Finance costs 42 (7) 34
55 (9) 47
Income before income taxes 456 4 460
Current income tax expense (recovery) 164 0 164 Deferred income tax expense (recovery) (41) 1 (40) Income tax expense (recovery) 123 1 124
Net income 333 3$ 336$
Earnings per shareBasic and diluted 15.73$ 0.14$ 15.87$

CONSTELLATION SOFTWARE INC. Notes to Consolidated Financial Statements (In millions of U.S. dollars, except per share amounts and as otherwise indicated.) (Due to rounding, numbers presented may not foot.) Years ended December 31, 2019 and 2018
84
Year ended December 31,
2019 As reported Adjustments
Year ended December 31
without adoption of IFRS 16
Net cash flows from operating activities 767$ (59) 708$
Net cash flows from (used in) in financing activities (496) 59 (437)