consolidation properties
TRANSCRIPT

SOILCONSOLIDATION
Settlement
Submitted toProfessor Myoung Soo Won
By Sanchari Halder
LOADS

Consolidation: When water drains from the soil pores, the load is gradually shifted from water to soil
particles. For fully saturated soils, the load transfer is accompanied by a volume change equal to the volume of drained water. This process is known as CONSOLIDATION.
W W W
(a) (b) (c)
Figure : Terzaghi Spring analogy.
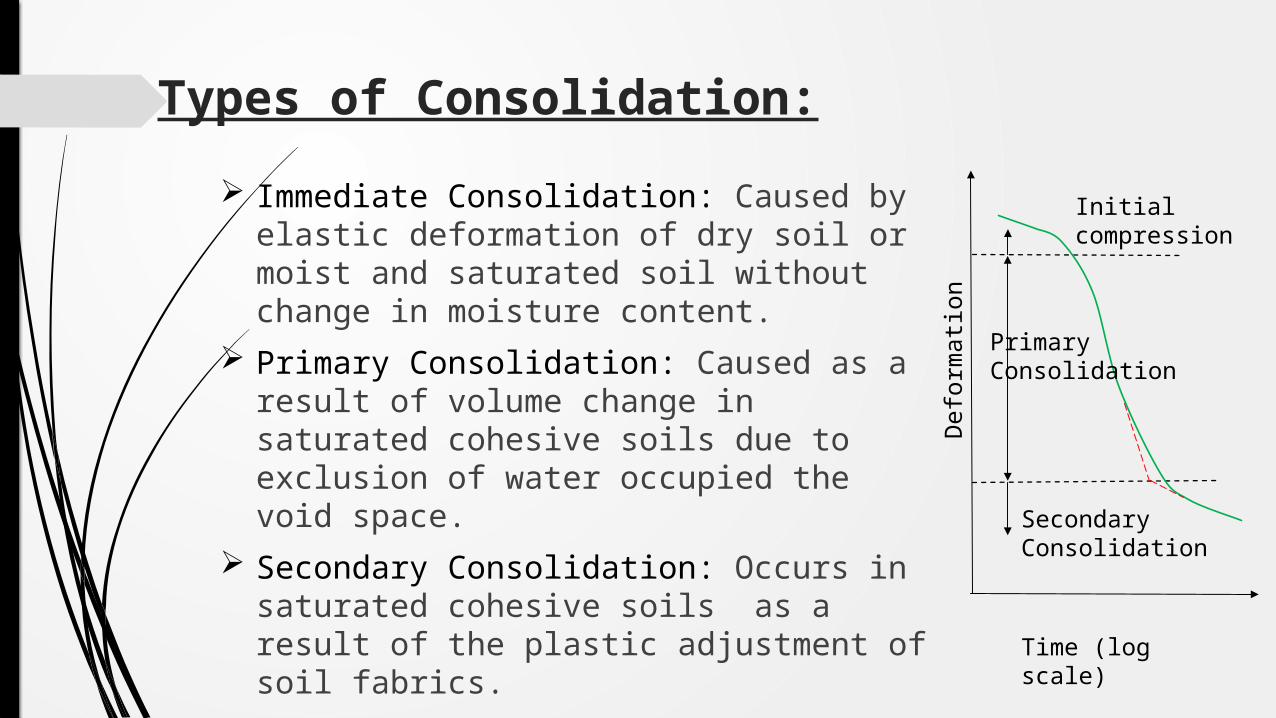
Types of Consolidation: Immediate Consolidation: Caused by
elastic deformation of dry soil or moist and saturated soil without change in moisture content.
Primary Consolidation: Caused as a result of volume change in saturated cohesive soils due to exclusion of water occupied the void space.
Secondary Consolidation: Occurs in saturated cohesive soils as a result of the plastic adjustment of soil fabrics.
Initial compression
Primary Consolidation
Secondary Consolidation
Time (log scale)
Defo
rmat
ion
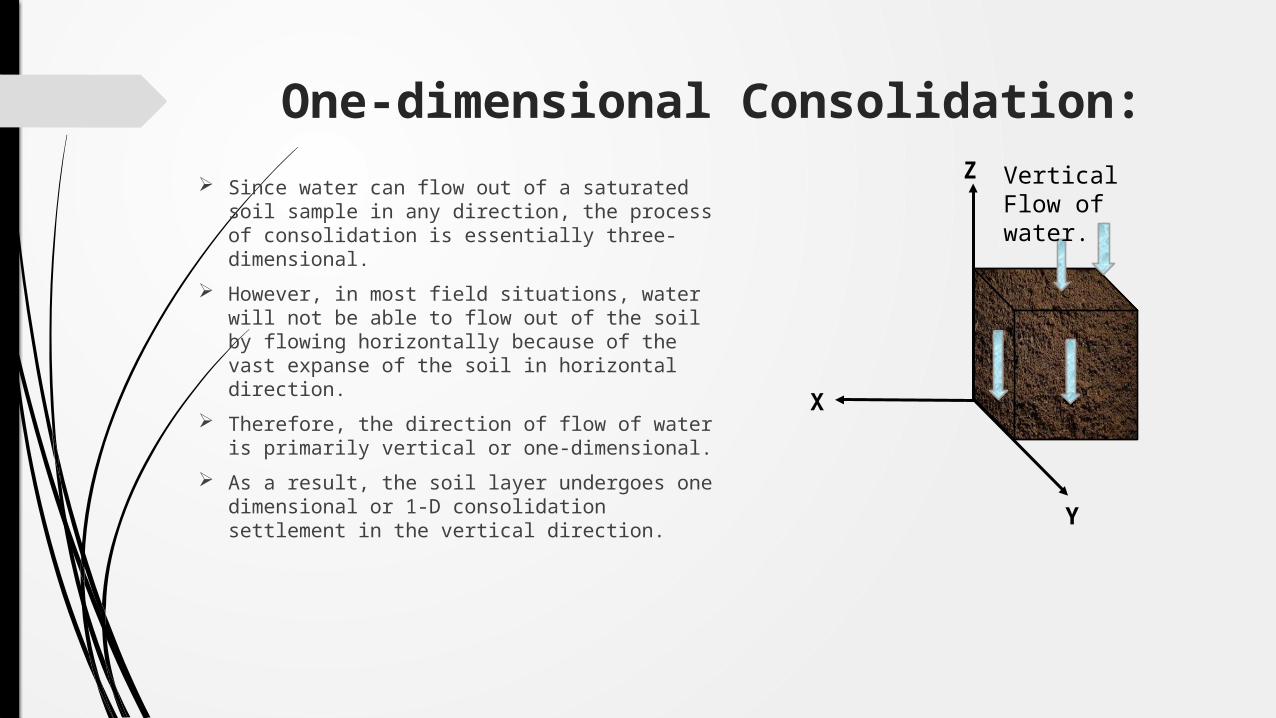
One-dimensional Consolidation: Since water can flow out of a saturated soil
sample in any direction, the process of consolidation is essentially three-dimensional.
However, in most field situations, water will not be able to flow out of the soil by flowing horizontally because of the vast expanse of the soil in horizontal direction.
Therefore, the direction of flow of water is primarily vertical or one-dimensional.
As a result, the soil layer undergoes one dimensional or 1-D consolidation settlement in the vertical direction.
X
Z
Y
Vertical Flow of water.

Terzaghi's theory of one-dimensional consolidation:
All quantifiable changes in stress to a soil are a direct result of a change in effective stress
Total Stress, σ = Effective Stress,σ´ + Pore Pressure, u
Assumptions of Terzaghi's Principle σ The soil is homogenous & is laterally confined The soil is fully saturated. The solid particles and water are incompressible. Compression and flow are one-dimensional. Soil’s own weight is relatively small. Darcy's Law is valid for all hydraulic gradients. σ The coefficient of permeability, k and the coefficient of volume compressibility, mv
remain constant. The relationship between the void ratio, e and effective stress σ is linear during a stress
increment.
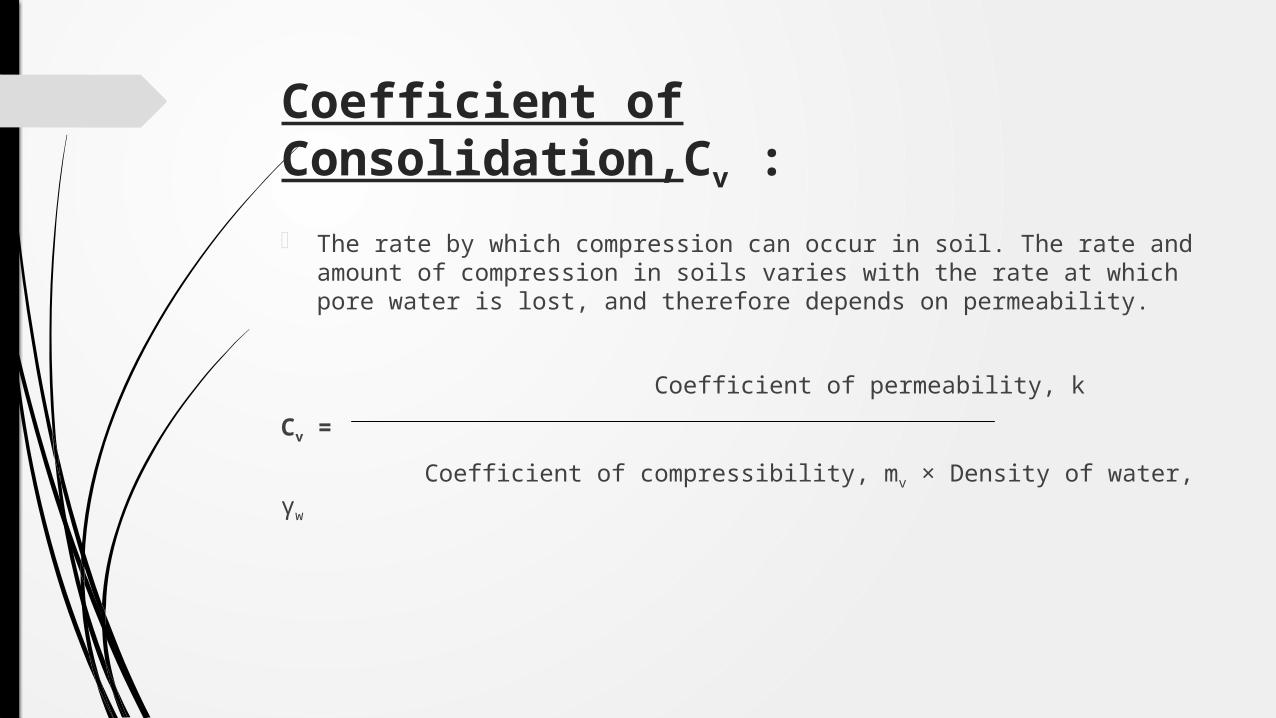
Coefficient of Consolidation,Cv :
The rate by which compression can occur in soil. The rate and amount of compression in soils varies with the rate at which pore water is lost, and therefore depends on permeability.
Coefficient of permeability, kCv = Coefficient of compressibility, mv × Density of water, γw

Determination of Consolidation Coefficient,Cv during Primary Consolidation:
Log-Time Method Square-Root-Time Method
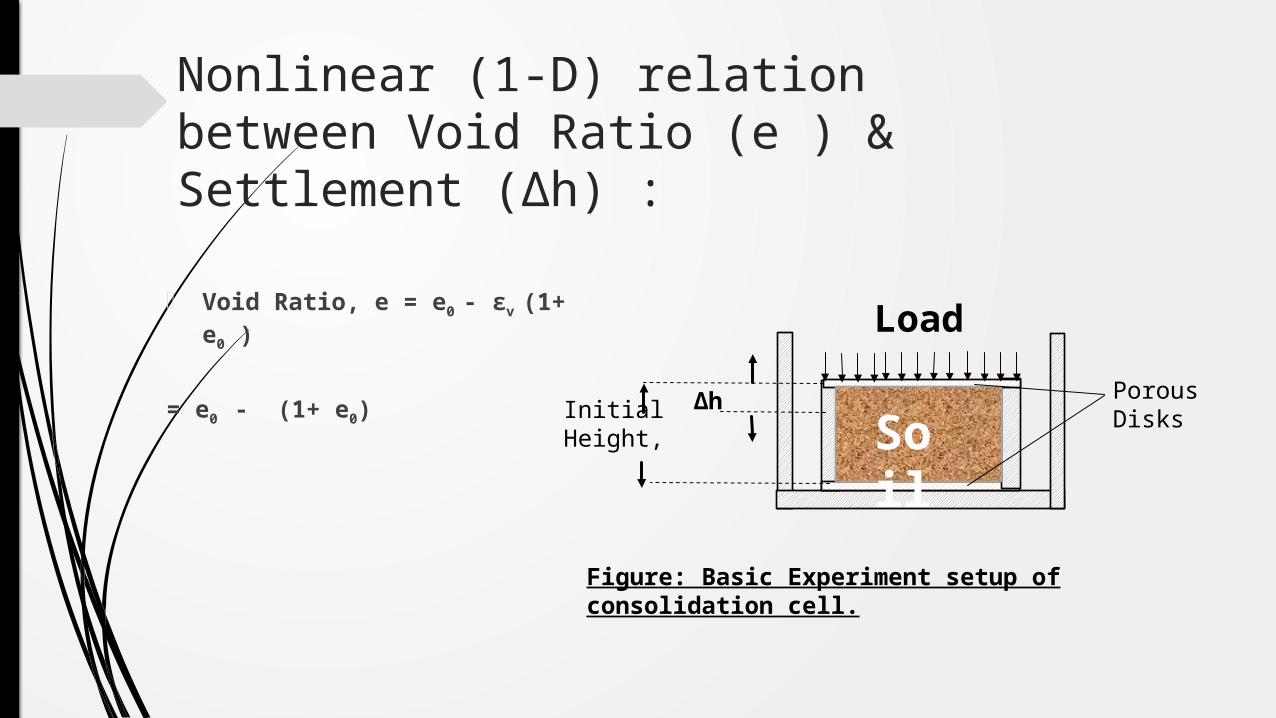
Nonlinear (1-D) relation between Void Ratio (e ) & Settlement (Δh) :
Void Ratio, e = e0 - εv (1+ e0 )
= e0 - (1+ e0) Soi
l
Load
Initial Height,
Δh Porous Disks
Figure: Basic Experiment setup of consolidation cell.

Void Ratio,e Vs Effective Stress, σ Curves:
Void ratio-effective stress and compression-time plots for Sand
Void ratio-effective stress and compression-time plots for Clay
Effective Stress
Effective Stress Time (min)
Time (min)
Void
Rat
ioVo
id R
atio
Com
pres
sion
Com
pres
sion

Normally Consolidated Soils: It is a soil deposit that has never subjected to a vertical effective stress greaterthan the present vertical stress.
Over Consolidated Soils: It is a soil deposit that has been subjected to vertical effective stress greater thanthe present vertical effective stress.
Figure: Void ratio versus effective stress (log scale)
Figure: Void ratio versus effective stress (log scale)
σpc´ σ2´ Log σv
σ2A´ σ2B´ σpc´ Log σv
A B C
Void Ratio
Void Ratio
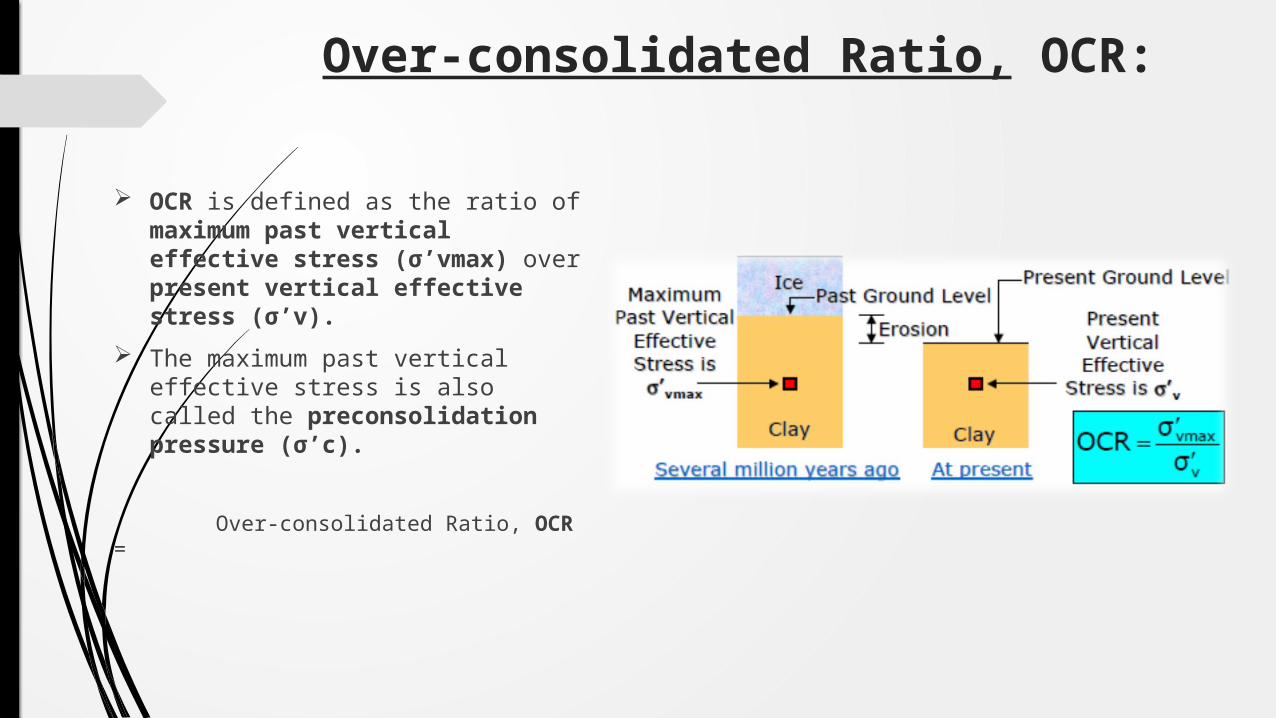
Over-consolidated Ratio, OCR:
OCR is defined as the ratio of maximum past vertical effective stress (σ’vmax) over present vertical effective stress (σ’v).
The maximum past vertical effective stress is also called the preconsolidation pressure (σ’c).
Over-consolidated Ratio, OCR =
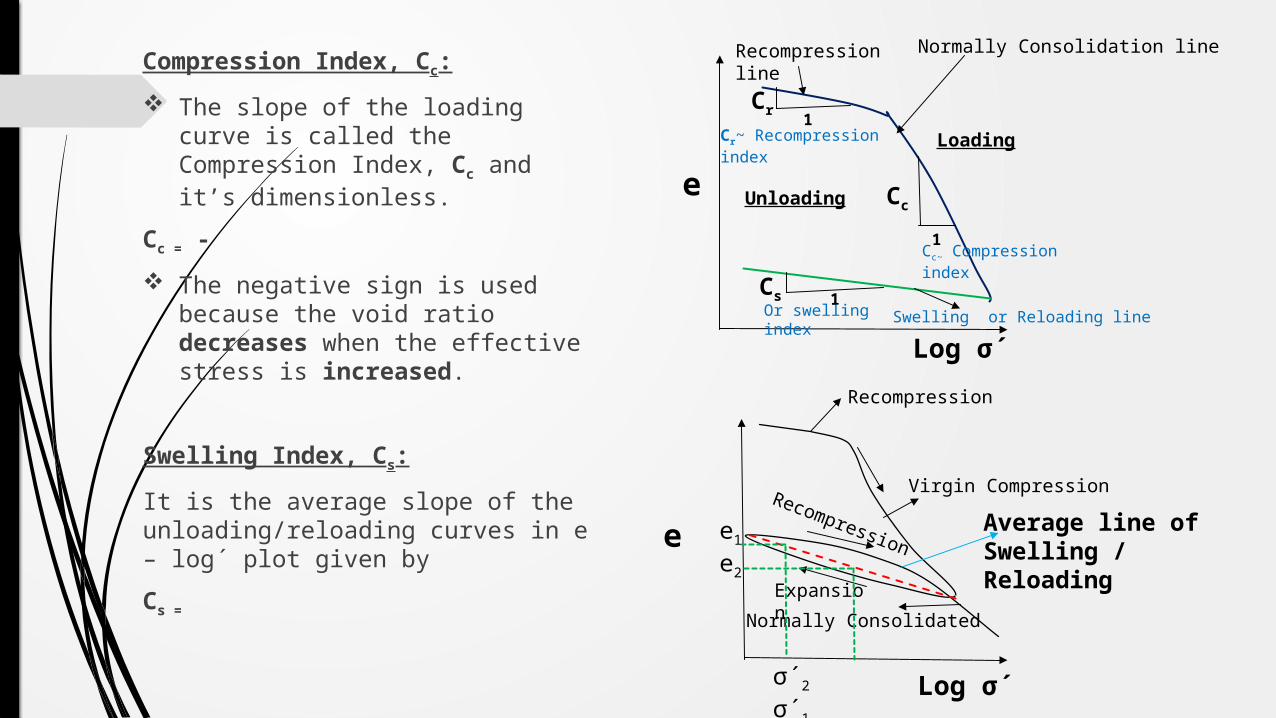
Compression Index, Cc:
The slope of the loading curve is called the Compression Index, Cc and it’s dimensionless.
Cc = - The negative sign is used because
the void ratio decreases when the effective stress is increased.
Swelling Index, Cs:It is the average slope of the unloading/reloading curves in e – log´ plot given byCs =
Recompression
Virgin CompressionRecompression
Normally ConsolidatedExpansion
Average line of Swelling / Reloading
Log σ´
e1 e2
σ´2 σ´1
e
e
Log σ´
CsOr swelling index
Cc~ Compression index
Recompression lineNormally Consolidation line
Swelling or Reloading line
Cc
Loading
Unloading
CrCr~ Recompression index
1
1
1

Coefficient of compressibility, mv:
The coefficient of volume compressibility mv is defined as the ratio of volumetric strain over change in effective stress.
The units for mv are the inverse of pressure, i.e. m²/kN and its value depends on the stress range over which it is calculated.

Consolidation Test(1-D Oedometer Test):
This test is performed to determine the magnitude and rate of volume decrease that a laterally confined soil specimen undergoes when subjected to different vertical pressures.
From the measured data, the consolidation curve (pressure-void ratio relationship) can be plotted.
This data is useful in determining the compression index Cc, the recompression index Cr and the preconsolidation pressure (or maximum past pressure) of the soil.
In addition, the data obtained can also be used to determine the coefficient of consolidation Cv and the coefficient of secondary compression mv of the soil.
Equipment: Consolidation device (including ring, porous stones, water reservoir, and load plate), Dial gauge (0.0001 inch = 1.0 on dial), Sample trimming device, glass plate, Metal straight edge, Clock, Moisture can, Filter paper.
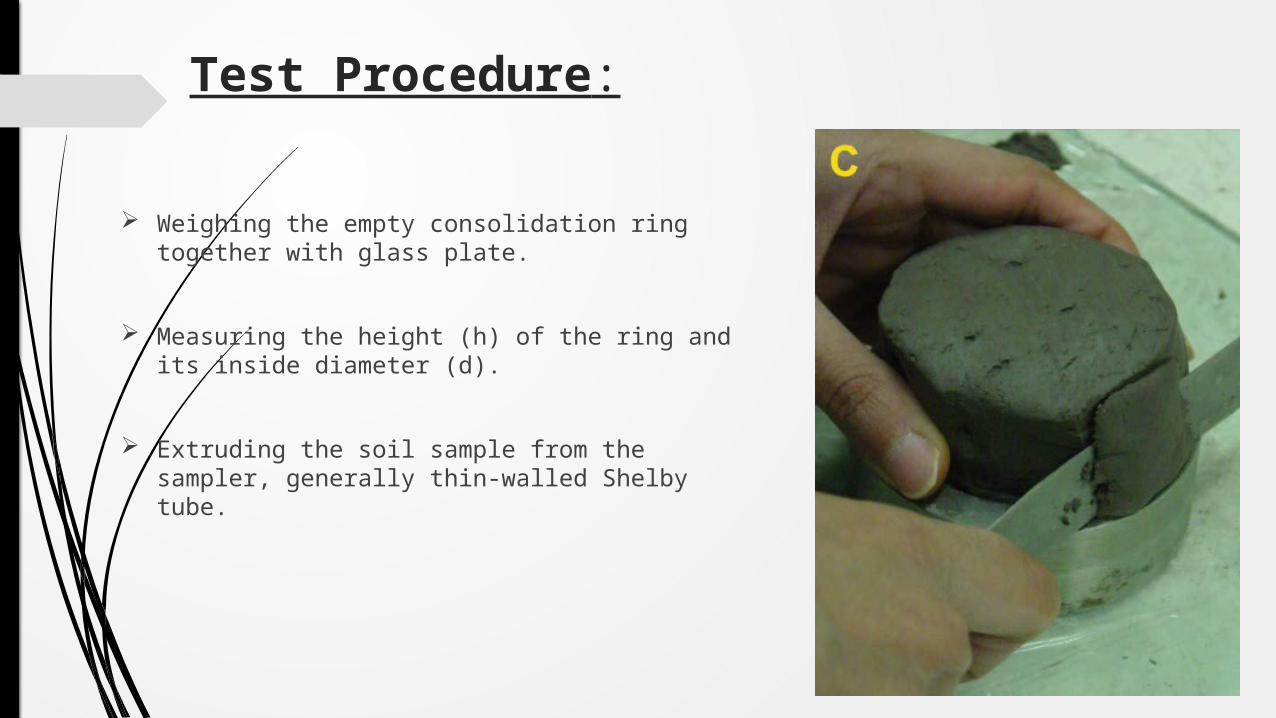
Test Procedure:
Weighing the empty consolidation ring together with glass plate.
Measuring the height (h) of the ring and its inside diameter (d).
Extruding the soil sample from the sampler, generally thin-walled Shelby tube.
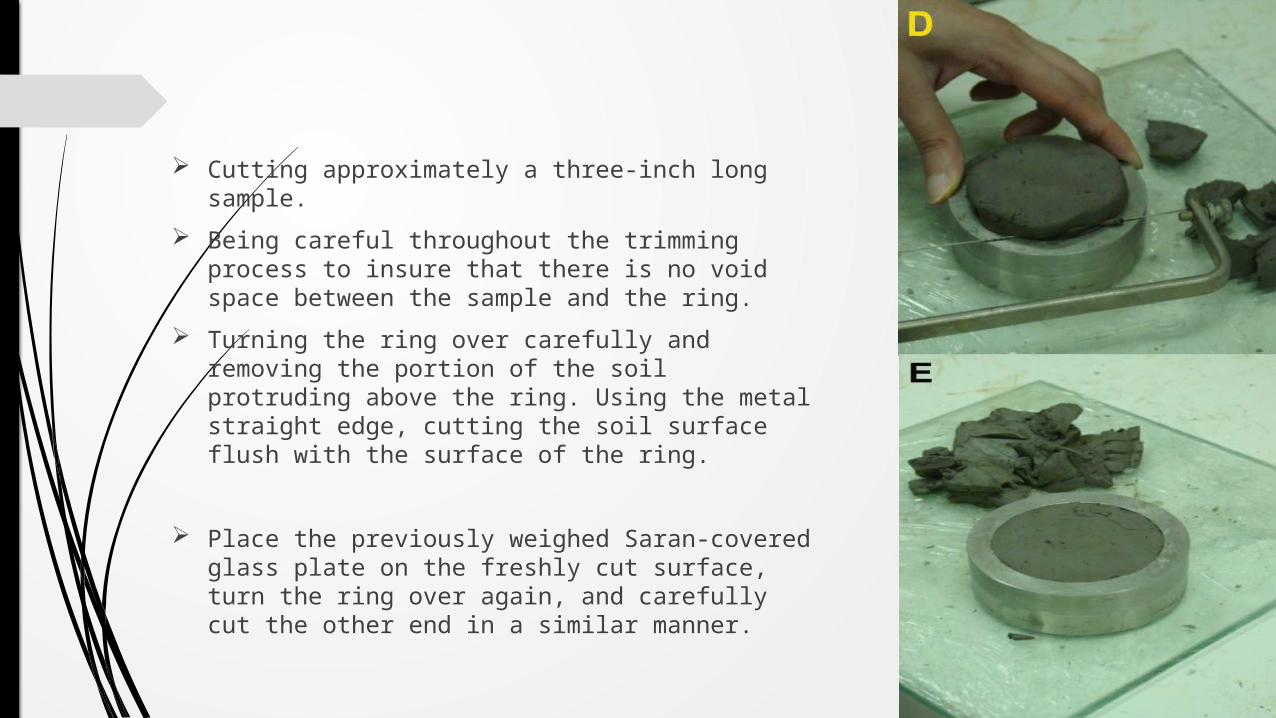
Cutting approximately a three-inch long sample. Being careful throughout the trimming process to
insure that there is no void space between the sample and the ring.
Turning the ring over carefully and removing the portion of the soil protruding above the ring. Using the metal straight edge, cutting the soil surface flush with the surface of the ring.
Place the previously weighed Saran-covered glass plate on the freshly cut surface, turn the ring over again, and carefully cut the other end in a similar manner.

Weigh the specimen plus ring plus glass plate.
Carefully remove the ring with specimen from the Saran-covered glass plate and peel the Saran from the specimen surface.
Adjust the dial gauge to a zero reading. set the pressure gauge dial (based on calibration curve) to result in an applied pressure of 0.5 tsf (tons per square foot).
Record the consolidation dial readings at the elapsed times given on the data sheet. & Etc.

Calculation:
Determine the height of solids (Hs ) of the specimen in the mold
Hs =
Determine the change in height (ΔH)
Determine the final specimen height, (Ht(f))
Determine the height of voids (Hv ) Hv = Ht(f) - Hs
Determine the final void ratio e=
Calculate the coefficient of consolidation (Cv ) from t90
Tv =
Calculate the coefficient of consolidation (Cv ) from t50
Tv =
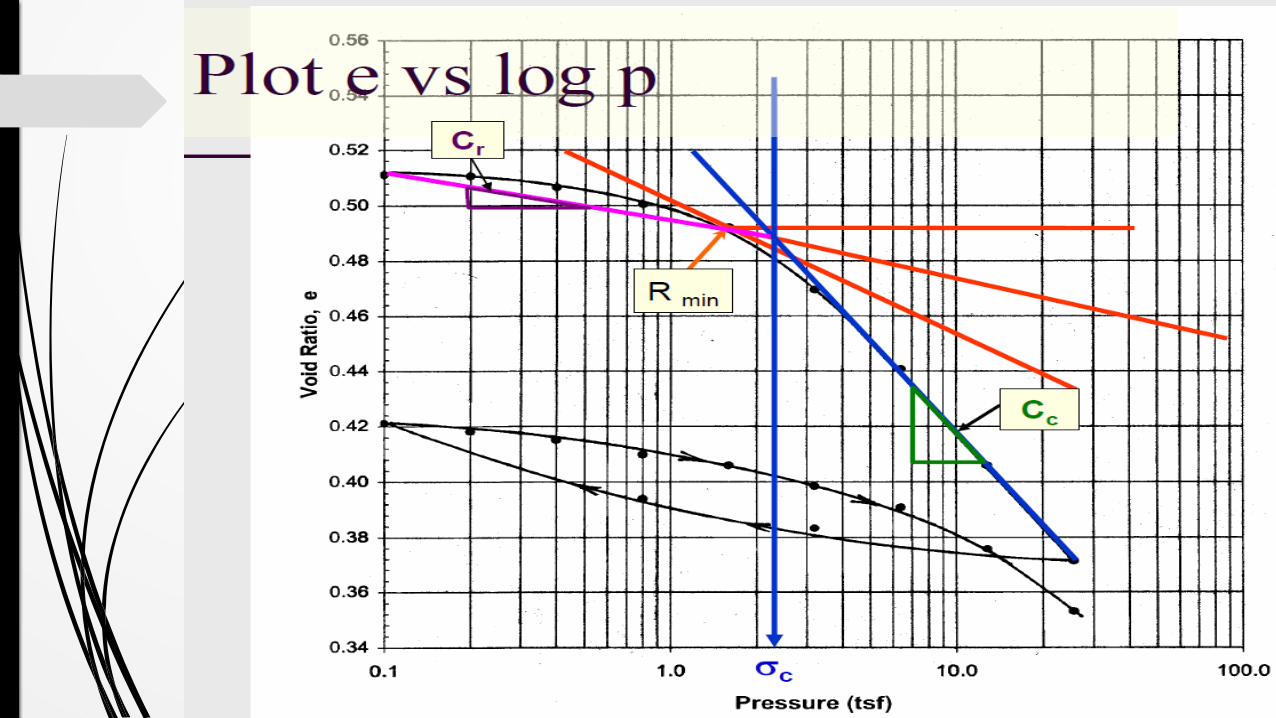
Plot e-log p curve and find: σc, Cc, Cr
Plot σc – log p curves

Example:

Thank you all……….