consolidated state performance … state performance report: parts i and ii for state formula grant...
TRANSCRIPT

CONSOLIDATED STATE PERFORMANCE REPORT: Parts I and II
for STATE FORMULA GRANT PROGRAMS
under the ELEMENTARY AND SECONDARY EDUCATION ACT
As amended in 2001
For reporting on School Year 2012-13
NEW JERSEY
PART I DUE FRIDAY, DECEMBER 20, 2013 PART II DUE FRIDAY, FEBRUARY 14, 2014
U.S. DEPARTMENT OF EDUCATION WASHINGTON, DC 20202

INTRODUCTION
Sections 9302 and 9303 of the Elementary and Secondary Education Act (ESEA), as amended in 2001 provide to States the option of applying for and reporting on multiple ESEA programs through a single consolidated application and report. Although a central, practical purpose of the Consolidated State Application and Report is to reduce "red tape" and burden on States, the Consolidated State Application and Report are also intended to have the important purpose of encouraging the integration of State, local, and ESEA programs in comprehensive planning and service delivery and enhancing the likelihood that the State will coordinate planning and service delivery across multiple State and local programs. The combined goal of all educational agencies–State, local, and Federal–is a more coherent, well-integrated educational plan that will result in improved teaching and learning. The Consolidated State Application and Report includes the following ESEA programs:
OMB NO. 1810-0614 Page 2
o Title I, Part A – Improving Basic Programs Operated by Local Educational Agencies
o Title I, Part B, Subpart 3 – William F. Goodling Even Start Family Literacy Programs
o Title I, Part C – Education of Migratory Children (Includes the Migrant Child Count)
o Title I, Part D – Prevention and Intervention Programs for Children and Youth Who Are Neglected, Delinquent, or At-Risk
o Title II, Part A – Improving Teacher Quality State Grants (Teacher and Principal Training and Recruiting Fund)
o Title III, Part A – English Language Acquisition, Language Enhancement, and Academic Achievement Act
o Title IV, Part A, Subpart 1 – Safe and Drug-Free Schools and Communities State Grants
o Title IV, Part A, Subpart 2 – Safe and Drug-Free Schools and Communities National Activities (Community Service Grant Program)
o Title V, Part A – Innovative Programs
o Title VI, Section 6111 – Grants for State Assessments and Related Activities
o Title VI, Part B – Rural Education Achievement Program
o Title X, Part C – Education for Homeless Children and Youths

The ESEA Consolidated State Performance Report (CSPR) for school year (SY) 2012-13 consists of two Parts, Part I and Part II. PART I Part I of the CSPR requests information related to the five ESEA Goals, established in the June 2002 Consolidated State Application, and information required for the Annual State Report to the Secretary, as described in Section 1111(h)(4) of the ESEA. The five ESEA Goals established in the June 2002 Consolidated State Application are:
Beginning with the CSPR SY 2005-06 collection, the Education of Homeless Children and Youths was added. The Migrant Child count was added for the SY 2006-07 collection.
PART II
Part II of the CSPR consists of information related to State activities and outcomes of specific ESEA programs. While the information requested varies from program to program, the specific information requested for this report meets the following criteria:
1. The information is needed for Department program performance plans or for other program needs. 2. The information is not available from another source, including program evaluations pending full implementation
of required EDFacts submission. 3. The information will provide valid evidence of program outcomes or results.
OMB NO. 1810-0614 Page 3
● Performance Goal 1: By SY 2013-14, all students will reach high standards, at a minimum attaining proficiency or better in reading/language arts and mathematics.
● Performance Goal 2: All limited English proficient students will become proficient in English and reach high academic standards, at a minimum attaining proficiency or better in reading/language arts and mathematics.
● Performance Goal 3: By SY 2005-06, all students will be taught by highly qualified teachers.
● Performance Goal 4: All students will be educated in learning environments that are safe, drug free, and conducive to learning.
● Performance Goal 5: All students will graduate from high school.
GENERAL INSTRUCTIONS AND TIMELINES
All States that received funding on the basis of the Consolidated State Application for the SY 2012-13 must respond to this Consolidated State Performance Report (CSPR). Part I of the Report is due to the Department by Friday, December 20, 2013. Part II of the Report is due to the Department by Friday, February 14, 2014. Both Part I and Part II should reflect data from the SY 2012-13, unless otherwise noted. The format states will use to submit the Consolidated State Performance Report has changed to an online submission starting with SY 2004-05. This online submission system is being developed through the Education Data Exchange Network (EDEN) and will make the submission process less burdensome. Please see the following section on transmittal instructions for more information on how to submit this year's Consolidated State Performance Report.
TRANSMITTAL INSTRUCTIONS The Consolidated State Performance Report (CSPR) data will be collected online from the SEAs, using the EDEN web site. The EDEN web site will be modified to include a separate area (sub-domain) for CSPR data entry. This area will utilize EDEN formatting to the extent possible and the data will be entered in the order of the current CSPR forms. The data entry screens will include or provide access to all instructions and notes on the current CSPR forms; additionally, an effort will be made to design the screens to balance efficient data collection and reduction of visual clutter. Initially, a state user will log onto EDEN and be provided with an option that takes him or her to the "SY 2012-13 CSPR". The main CSPR screen will allow the user to select the section of the CSPR that he or she needs to either view or enter data. After selecting a section of the CSPR, the user will be presented with a screen or set of screens where the user can input the data for that section of the CSPR. A user can only select one section of the CSPR at a time. After a state has included all available data in the designated sections of a particular CSPR Part, a lead state user will certify that Part and transmit it to the Department. Once a Part has been transmitted, ED will have access to the data. States may still make changes or additions to the transmitted data, by creating an updated version of the CSPR. Detailed instructions for transmitting the SY 2012-13 CSPR will be found on the main CSPR page of the EDEN web site (https://EDEN.ED.GOV/EDENPortal/).
OMB NO. 1810-0614 Page 4

OMB NO. 1810-0614 Page 5
OMB Number: 1810-0614 Expiration Date: 11/30/2013
Consolidated State Performance Report For
State Formula Grant Programs under the
Elementary And Secondary Education Act as amended in 2001
Check the one that indicates the report you are submitting: Part I, 2012-13 X Part II, 2012-13
Name of State Educational Agency (SEA) Submitting This Report: New Jersey Address: 100 River View Plaza Trenton, New Jersey 08625
Person to contact about this report: Name: Clare Barrett Telephone: (609) 292-5408 Fax: (609) 633-6874 e-mail: [email protected] Name of Authorizing State Official: (Print or Type): Bari Erlichson
Friday, April 4, 2014, 3:27:20 PM Signature Date

CONSOLIDATED STATE PERFORMANCE REPORT PART II
For reporting on School Year 2012-13
PART II DUE FEBRUARY 17, 2012 5PM EST
OMB NO. 1810-0614 Page 6

2.1 IMPROVING BASIC PROGRAMS OPERATED BY LOCAL EDUCATIONAL AGENCIES (TITLE I, PART A) This section collects data on Title I, Part A programs. 2.1.1 Student Achievement in Schools with Title I, Part A Programs The following sections collect data on student academic achievement on the State's assessments in schools that receive Title I, Part A funds and operate either Schoolwide programs or Targeted Assistance programs.
OMB NO. 1810-0614 Page 7
2.1.1.1 Student Achievement in Mathematics in Schoolwide Schools (SWP)
In the format of the table below, provide the number of students in SWP schools who completed the assessment and for whom a proficiency level was assigned, in grades 3 through 8 and high school, on the State's mathematics assessments under Section 1111(b)(3) of ESEA. Also, provide the number of those students who scored at or above proficient. The percentage of students who scored at or above proficient is calculated automatically.
Grade
# Students Who Completed the Assessment and
for Whom a Proficiency Level Was Assigned # Students Scoring at or
above Proficient Percentage at or above Proficient
3 24,625 14,619 59.37 4 23,583 14,198 60.20 5 23,102 14,365 62.18 6 23,317 14,145 60.66 7 22,215 8,772 39.49 8 21,718 10,106 46.53
High School 12,807 7,594 59.30 Total 151,367 83,799 55.36
Comments:
2.1.1.2 Student Achievement in Reading/Language Arts in Schoolwide Schools (SWP)
This section is similar to 2.1.1.1. The only difference is that this section collects data on performance on the State's reading/language arts assessment in SWP.
Grade
# Students Who Completed the Assessment and
for Whom a Proficiency Level Was Assigned # Students Scoring at or
above Proficient Percentage at or above Proficient
3 24,526 11,273 45.96 4 23,487 8,192 34.88 5 23,004 8,552 37.18 6 23,255 9,470 40.72 7 22,110 8,448 38.21 8 21,720 13,260 61.05
High School 12,845 9,933 77.33 Total 150,947 69,128 45.80
Comments:

OMB NO. 1810-0614 Page 8
2.1.1.3 Student Achievement in Mathematics in Targeted Assistance Schools (TAS)
In the table below, provide the number of all students in TAS who completed the assessment and for whom a proficiency level was assigned, in grades 3 through 8 and high school, on the State's mathematics assessments under Section 1111(b)(3) of ESEA. Also, provide the number of those students who scored at or above proficient. The percentage of students who scored at or above proficient is calculated automatically.
Grade
# Students Who Completed the Assessment and
for Whom a Proficiency Level Was Assigned # Students Scoring at or
above Proficient Percentage at or above Proficient
3 43,961 34,826 79.22 4 46,095 36,632 79.47 5 46,280 37,704 81.47 6 45,525 37,266 81.86 7 45,533 30,168 66.26 8 45,957 32,853 71.49
High School 31,509 25,725 81.64 Total 304,860 235,174 77.14
Comments:
2.1.1.4 Student Achievement in Reading/Language Arts in Targeted Assistance Schools (TAS)
This section is similar to 2.1.1.3. The only difference is that this section collects data on performance on the State"s reading/language arts assessment by all students in TAS.
Grade
# Students Who Completed the Assessment and
for Whom a Proficiency Level Was Assigned # Students Scoring at or
above Proficient Percentage at or above Proficient
3 43,847 29,456 67.18 4 45,987 28,134 61.18 5 46,173 29,038 62.89 6 45,445 31,926 70.25 7 45,436 31,066 68.37 8 45,918 38,825 84.55
High School 31,555 29,394 93.15 Total 304,361 217,839 71.57
Comments:
2.1.2 Title I, Part A Student Participation The following sections collect data on students participating in Title I, Part A by various student characteristics.
OMB NO. 1810-0614 Page 9
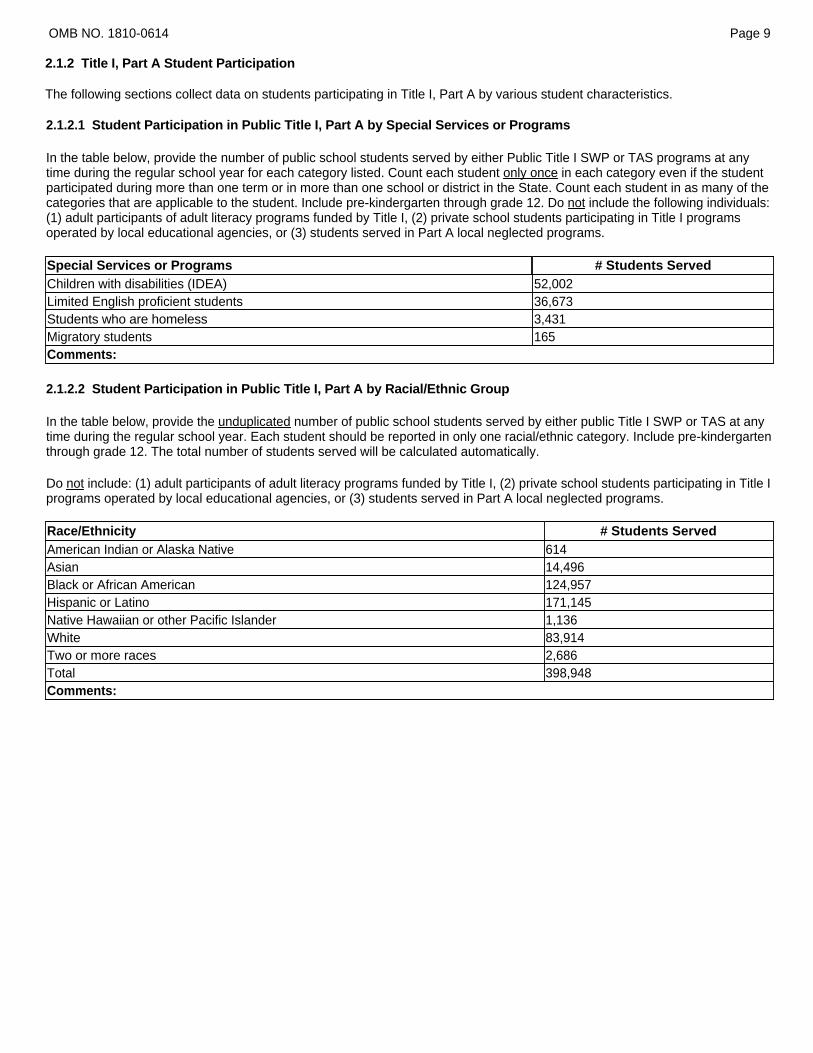
2.1.2.1 Student Participation in Public Title I, Part A by Special Services or Programs
In the table below, provide the number of public school students served by either Public Title I SWP or TAS programs at any time during the regular school year for each category listed. Count each student only once in each category even if the student participated during more than one term or in more than one school or district in the State. Count each student in as many of the categories that are applicable to the student. Include pre-kindergarten through grade 12. Do not include the following individuals: (1) adult participants of adult literacy programs funded by Title I, (2) private school students participating in Title I programs operated by local educational agencies, or (3) students served in Part A local neglected programs. Special Services or Programs # Students Served Children with disabilities (IDEA) 52,002 Limited English proficient students 36,673 Students who are homeless 3,431 Migratory students 165 Comments:
2.1.2.2 Student Participation in Public Title I, Part A by Racial/Ethnic Group
In the table below, provide the unduplicated number of public school students served by either public Title I SWP or TAS at any time during the regular school year. Each student should be reported in only one racial/ethnic category. Include pre-kindergarten through grade 12. The total number of students served will be calculated automatically.
Do not include: (1) adult participants of adult literacy programs funded by Title I, (2) private school students participating in Title I programs operated by local educational agencies, or (3) students served in Part A local neglected programs. Race/Ethnicity # Students Served American Indian or Alaska Native 614 Asian 14,496 Black or African American 124,957 Hispanic or Latino 171,145 Native Hawaiian or other Pacific Islander 1,136 White 83,914 Two or more races 2,686 Total 398,948 Comments:
OMB NO. 1810-0614 Page 10
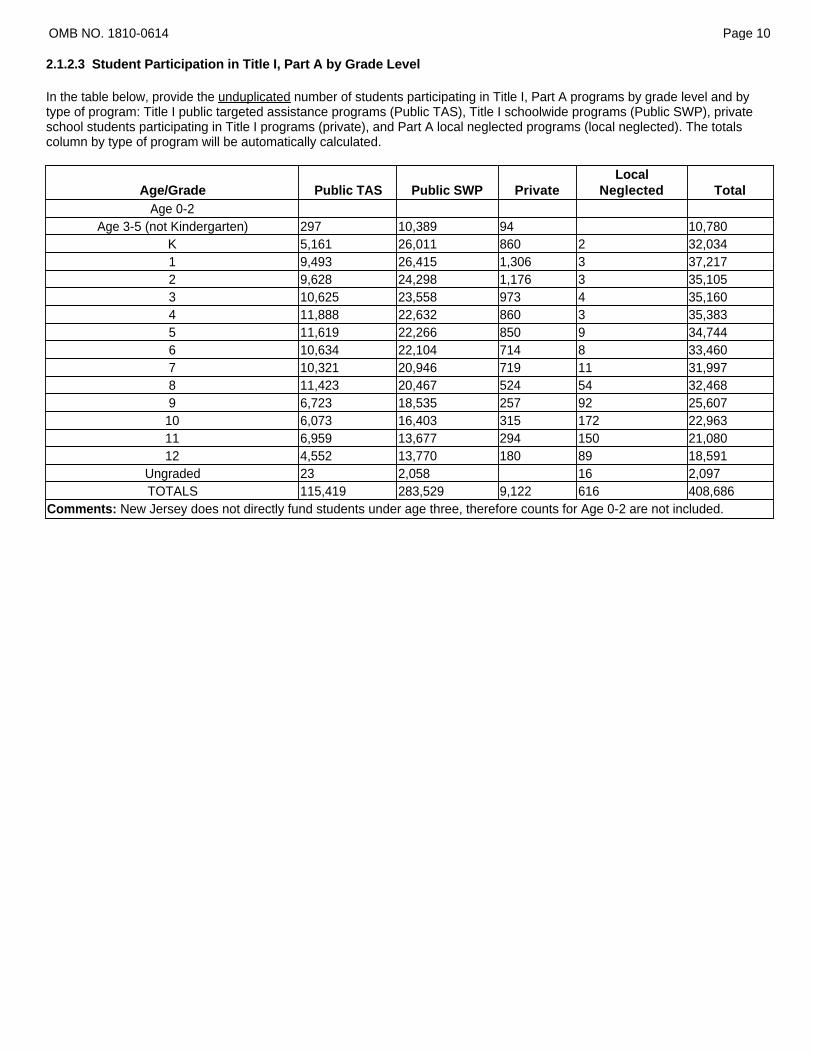
2.1.2.3 Student Participation in Title I, Part A by Grade Level
In the table below, provide the unduplicated number of students participating in Title I, Part A programs by grade level and by type of program: Title I public targeted assistance programs (Public TAS), Title I schoolwide programs (Public SWP), private school students participating in Title I programs (private), and Part A local neglected programs (local neglected). The totals column by type of program will be automatically calculated.
Age/Grade Public TAS Public SWP Private Local
Neglected Total Age 0-2
Age 3-5 (not Kindergarten) 297 10,389 94 10,780 K 5,161 26,011 860 2 32,034 1 9,493 26,415 1,306 3 37,217 2 9,628 24,298 1,176 3 35,105 3 10,625 23,558 973 4 35,160 4 11,888 22,632 860 3 35,383 5 11,619 22,266 850 9 34,744 6 10,634 22,104 714 8 33,460 7 10,321 20,946 719 11 31,997 8 11,423 20,467 524 54 32,468 9 6,723 18,535 257 92 25,607 10 6,073 16,403 315 172 22,963 11 6,959 13,677 294 150 21,080 12 4,552 13,770 180 89 18,591
Ungraded 23 2,058 16 2,097 TOTALS 115,419 283,529 9,122 616 408,686
Comments: New Jersey does not directly fund students under age three, therefore counts for Age 0-2 are not included.

2.1.2.4 Student Participation in Title I, Part A Targeted Assistance Programs by Instructional and Support Services The following sections collect data about the participation of students in TAS.
OMB NO. 1810-0614 Page 11
2.1.2.4.1 Student Participation in Title I, Part A Targeted Assistance Programs by Instructional Services
In the table below, provide the number of students receiving each of the listed instructional services through a TAS program funded by Title I, Part A. Students may be reported as receiving more than one instructional service. However, students should be reported only once for each instructional service regardless of the frequency with which they received the service. TAS instructional service # Students Served Mathematics 66,376 Reading/language arts 85,748 Science 2,399 Social studies 865 Vocational/career 2,006 Other instructional services 345 Comments:
2.1.2.4.2 Student Participation in Title I, Part A Targeted Assistance Programs by Support Services
In the table below, provide the number of students receiving each of the listed support services through a TAS program funded by Title I, Part A. Students may be reported as receiving more than one support service. However, students should be reported only once for each support service regardless of the frequency with which they received the service. TAS Suport Service # Students Served Health, dental, and eye care 30 Supporting guidance/advocacy 708 Other support services 59 Comments:

OMB NO. 1810-0614 Page 12
2.1.3 Staff Information for Title I, Part A Targeted Assistance Programs (TAS)
In the table below, provide the number of full-time equivalent (FTE) staff funded by a Title I, Part A TAS in each of the staff categories. For staff who work with both TAS and SWP, report only the FTE attributable to their TAS responsibilities.
For paraprofessionals only, provide the percentage of paraprofessionals who were qualified in accordance with Section 1119 (c) and (d) of ESEA.
See the FAQs following the table for additional information.
Staff Category Staff FTE Percentage
Qualified Teachers 1,143
Paraprofessionals1 109 97.30
Other paraprofessionals (translators, parental involvement, computer assistance)2 17 Clerical support staff 19 Administrators (non-clerical) 29 Comments: FAQs on staff information
a. What is a "paraprofessional?" An employee of an LEA who provides instructional support in a program supported with Title I, Part A funds. Instructional support includes the following activities: (a) Providing one-on-one tutoring for eligible students, if the tutoring is scheduled at a time when a student would not otherwise receive instruction from a teacher; (b) Providing assistance with classroom management, such as organizing instructional and other materials; (c) Providing assistance in a computer laboratory; (d) Conducting parental involvement activities; (e) Providing support in a library or media center; (f) Acting as a translator; or (g) Providing instructional services to students.
b. What is an "other paraprofessional?" Paraprofessionals who do not provide instructional support, for example, paraprofessionals who are translators or who work with parental involvement or computer assistance.
c. Who is a qualified paraprofessional? A paraprofessional who has (1) completed 2 years of study at an institution of higher education; (2) obtained an associate's (or higher) degree; or (3) met a rigorous standard of quality and been able to demonstrate, through a formal State or local academic assessment, knowledge of and the ability to assist in instructing reading, writing, and mathematics (or, as appropriate, reading readiness, writing readiness, and mathematics readiness) (Sections 1119(c) and (d).) For more information on qualified paraprofessionals, please refer to the Title I paraprofessionals Guidance, available at: http://www.ed.gov/policy/elsec/guid/paraguidance.doc
1 Consistent with ESEA, Title I, Section 1119(g)(2).
2 Consistent with ESEA, Title I, Section 1119(e).
OMB NO. 1810-0614 Page 13
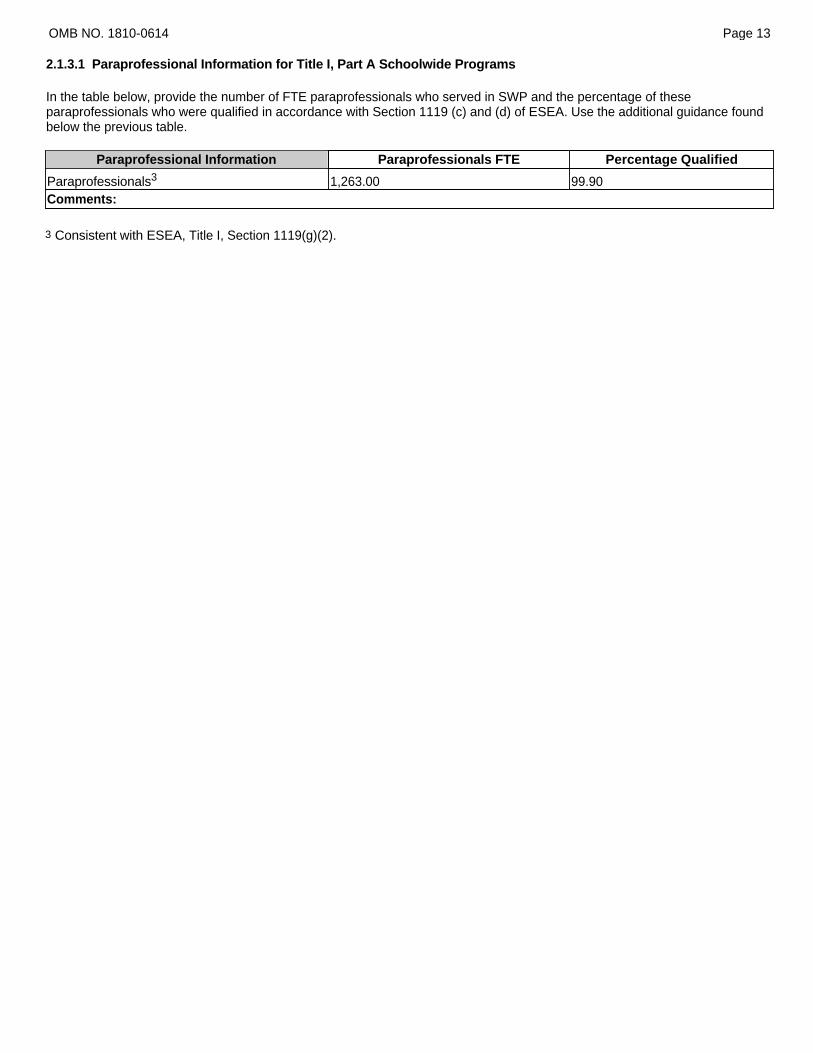
2.1.3.1 Paraprofessional Information for Title I, Part A Schoolwide Programs
In the table below, provide the number of FTE paraprofessionals who served in SWP and the percentage of these paraprofessionals who were qualified in accordance with Section 1119 (c) and (d) of ESEA. Use the additional guidance found below the previous table.
Paraprofessional Information Paraprofessionals FTE Percentage Qualified
Paraprofessionals3 1,263.00 99.90 Comments:
3 Consistent with ESEA, Title I, Section 1119(g)(2).

OMB NO. 1810-0614 Page 15
2.1.4 Parental Involvement Reservation Under Title I, Part A In the table below provide information on the amount of Title I, Part A funds reserved by LEAs for parental involvement activities under Section 1118 (a)(3) of the ESEA. The percentage of LEAs FY 2012 Title I Part A allocations reserved for parental involvement will be automatically calculated from the data entered in Rows 2 and 3.
Parental Involvement Reservation
LEAs that Received a Federal Fiscal Year (FY) 2012 (School Year 2012−2013) Title I,
Part A Allocation of $500,000 or less
LEAs that Received a Federal fiscal year (FY) 2012 (School Year 2012−2013) Title I,
Part A Allocation of more than $500,000
Number of LEAs* 504 100 Sum of the amount reserved by LEAs for parental Involvement 232,721 3,522,094 Sum of LEAs' FY 2012 Title I, Part A allocations 68,148,518 216,777,261 Percentage of LEA's FY 2012 Title I, Part A allocations reserved for parental involvment 0.30 1.60 *The sum of Column 2 and Column 3 should equal the number of LEAs that received an FY 2012 Title I, Part A allocation. In the comment box below, provide examples of how LEAs in your State used their Title I Part A, set-aside for parental involvement during SY 2012−2013. This response is limited to 8,000 characters. The districts in New Jersey engaged in varying parental involvement actvities that speak to the diverse needs of their educational communities while encouraging academic schievement in and outside of the classroom. The parental engagement activities districts conducted included but were not limited to the following: test-taking strategy workshops, parent literacy nights, math concepts and skill building nights, technology training, and parent universities for parenting and life skills.

2.3 EDUCATION OF MIGRANT CHILDREN (TITLE I, PART C) This section collects data on the Migrant Education Program (Title I, Part C) for the performance period of September 1, 2012 through August 31, 2013. This section is composed of the following subsections:
● Population data of eligible migrant children ● Academic data of eligible migrant students ● Participation data of migrant children served during either the regular school year, summer/intersession term, or program
year ● School data ● Project data ● Personnel data
Where the table collects data by age/grade, report children in the highest age/grade that they attained during the performance period. For example, a child who turns 3 during the performance period would only be performance in the "Age 3 through 5 (not Kindergarten)" row.
OMB NO. 1810-0614 Page 16
2.3.1 Migrant Child Counts
This section collects the Title I, Part C, Migrant Education Program (MEP) child counts which States are required to provide and may be used to determine the annual State allocations under Title I, Part C. The child counts should reflect the performance period of September 1, 2012 through August 31, 2013. This section also collects a report on the procedures used by States to produce true, reliable, and valid child counts.
To provide the child counts, each SEA should have sufficient procedures in place to ensure that it is counting only those children who are eligible for the MEP. Such procedures are important to protecting the integrity of the State's MEP because they permit the early discovery and correction of eligibility problems and thus help to ensure that only eligible migrant children are counted for funding purposes and are served. If an SEA has reservations about the accuracy of its child counts, it must inform the Department of its concerns and explain how and when it will resolve them in the box below, which precedes Section 2.3.1.1 Category 1 Child Count.
Note: In submitting this information, the Authorizing State Official must certify that, to the best of his/her knowledge, the child counts and information contained in the report are true, reliable, and valid and that any false Statement provided is subject to fine or imprisonment pursuant to 18 U.S.C. 1001.
FAQs on Child Count:
1. How is "out-of-school" defined? Out-of-school means children up through age 21 who are entitled to a free public education in the State but are not currently enrolled in a K-12 institution. This could include students who have dropped out of school in the previous performance period (September 1, 2011 v August 31, 2012), youth who are working on a GED outside of a K-12 institution, and youth who are "here-to-work" only. It does not include preschoolers, who are counted by age grouping. Children who were enrolled in school for at least one day, but dropped out of school during the performance period should be counted in the highest age/grade level attained during the performance period.
2. How is "ungraded" defined? Ungraded means the children are served in an educational unit that has no separate grades. For example, some schools have primary grade groupings that are not traditionally graded, or ungraded groupings for children with learning disabilities. In some cases, ungraded students may also include special education children, transitional bilingual students, students working on a GED through a K-12 institution, or those in a correctional setting. (Students working on a GED outside of a K-12 institution are counted as out-of-school youth.)
In the space below, discuss any concerns about the accuracy of the reported child counts or the underlying eligibility determinations on which the counts are based and how and when these concerns will be resolved. The response is limited to 8,000 characters. Comments:
2.3.1.1 Category 1 Child Count (Eligible Migrant Children) In the table below, enter the unduplicated statewide number by age/grade of eligible migrant children age 3 through 21 who, within 3 years of making a qualifying move, resided in your State for one or more days during the performance period of September 1, 2012 through August 31, 2013. This figure includes all eligible migrant children who may or may not have participated in MEP services. Count a child who moved from one age/grade level to another during the performance period only once in the highest age/grade that he/she attained during the performance period. The unduplicated statewide total count is

calculated automatically.
Do not include:
● Children age birth through 2 years ● Children served by the MEP (under the continuation of services authority) after their period of eligibility has expired when
other services are not available to meet their needs ● Previously eligible secondary-school children who are receiving credit accrual services (under the continuation of
services authority).
Age/Grade Eligible Migrant Children Age 3 through 5 (not Kindergarten) 152
K 112 1 122 2 124 3 98 4 89 5 75 6 64 7 52 8 41 9 31 10 27 11 27 12 10
Ungraded 0 Out-of-school 509
Total 1,533 Comments:
2.3.1.1.1 Category 1 Child Count Increases/Decreases
In the space below, explain any increases or decreases from last year in the number of students reported for Category 1 greater than 10 percent.
The response is limited to 8,000 characters. Comments: N/A
2.3.1.1.2 Birth through Two Child Count
In the table below, enter the unduplicated statewide number of eligible migrant children from age birth through age 2 who, within 3 years of making a qualifying move, resided in your State for one or more days during the performance period of September 1, 2012 through August 31, 2013.
Age/Grade Eligible Migrant Children
Age birth through 2 67 Comments:
OMB NO. 1810-0614 Page 17
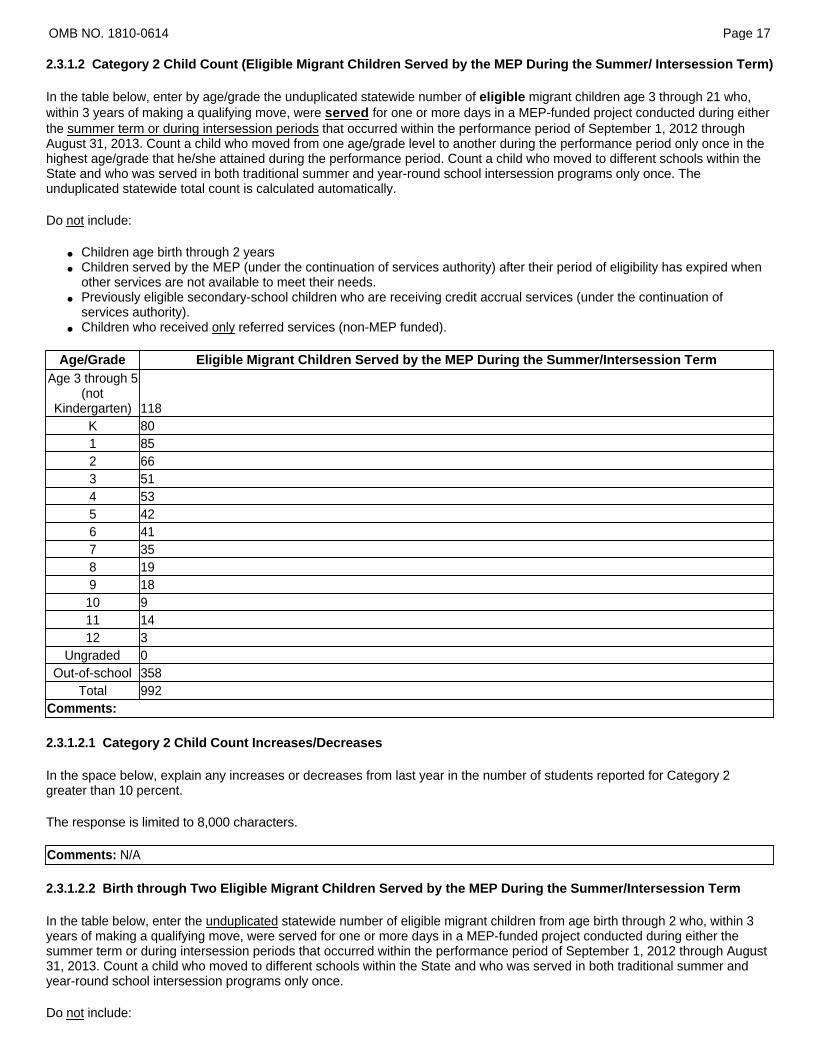
2.3.1.2 Category 2 Child Count (Eligible Migrant Children Served by the MEP During the Summer/ Intersession Term)
In the table below, enter by age/grade the unduplicated statewide number of eligible migrant children age 3 through 21 who, within 3 years of making a qualifying move, were served for one or more days in a MEP-funded project conducted during either the summer term or during intersession periods that occurred within the performance period of September 1, 2012 through August 31, 2013. Count a child who moved from one age/grade level to another during the performance period only once in the highest age/grade that he/she attained during the performance period. Count a child who moved to different schools within the State and who was served in both traditional summer and year-round school intersession programs only once. The unduplicated statewide total count is calculated automatically.
Do not include:
● Children age birth through 2 years ● Children served by the MEP (under the continuation of services authority) after their period of eligibility has expired when
other services are not available to meet their needs. ● Previously eligible secondary-school children who are receiving credit accrual services (under the continuation of
services authority). ● Children who received only referred services (non-MEP funded).
Age/Grade Eligible Migrant Children Served by the MEP During the Summer/Intersession Term
Age 3 through 5 (not
Kindergarten) 118 K 80 1 85 2 66 3 51 4 53 5 42 6 41 7 35 8 19 9 18 10 9 11 14 12 3
Ungraded 0 Out-of-school 358
Total 992 Comments:
2.3.1.2.1 Category 2 Child Count Increases/Decreases
In the space below, explain any increases or decreases from last year in the number of students reported for Category 2 greater than 10 percent.
The response is limited to 8,000 characters. Comments: N/A
2.3.1.2.2 Birth through Two Eligible Migrant Children Served by the MEP During the Summer/Intersession Term
In the table below, enter the unduplicated statewide number of eligible migrant children from age birth through 2 who, within 3 years of making a qualifying move, were served for one or more days in a MEP-funded project conducted during either the summer term or during intersession periods that occurred within the performance period of September 1, 2012 through August 31, 2013. Count a child who moved to different schools within the State and who was served in both traditional summer and year-round school intersession programs only once.
Do not include:

● Children who received only referred services (non-MEP funded).
Age/Grade Eligible Migrant Children Served by the MEP During the Summer/Intersession Term Age birth through 2 0
Comments:

2.3.1.3 Child Count Calculation and Validation Procedures The following questions request information on the State's MEP child count calculation and validation procedures.
OMB NO. 1810-0614 Page 18
2.3.1.3.1 Student Information System
In the space below, respond to the following questions: What system did the State use to compile and generate the Category 1 child count for this performance period? Please check the box that applies.
Student Information System (Yes/No) NGS No MIS 2000 No COEStar Yes MAPS No Other Student Information System. Please identify the system: No
Student Information System (Yes/No) Was the Category 2 child count for this performance period generated using the same system? Yes If the State's Category 2 count was generated using a different system than the Category 1 count please identify the specific system that generates the Category 2 count. The response is limited to 8,000 characters.
2.3.1.3.2 Data Collection and Management Procedures
In the space below, please respond to the following question:
Data Collection and Management Procedures (Yes/No)
Does the State collect all the required data elements and data sections on the National Certificate of Eligibility (COE)? Yes

OMB NO. 1810-0614 Page 19
2.3.1.3.3 Methods Used To Count Children
In the space below, please describe the procedures and processes at the State level used to ensure all eligible children are accounted for in the performance period . In particular, describe how the State includes and counts only:
● Children who were age 3 through 21 ● Children who met the program eligibility criteria (e.g., were within 3 years of a qualifying move, had a qualifying activity) ● Children who were resident in your State for at least 1 day during the performance period (September 1 through August
31) ● Children who – in the case of Category 2 – were served for one or more days in a MEP-funded project conducted during
either the summer term or during intersession periods ● Children counted once per age/grade level for each child count category ● Children two years of age that turned three years old during the performance period.
The response is limited to 8,000 characters. Tne NJ MEP uses COEstar system to compile and generate data related to migrant students in both Category I and II programs. Child counts for the last reporting period were generated using the same system (COE Star). How does the State ensure that the system that transmits migrant data to the Department accurately accounts for all the migrant children in every EDFacts data file? In order to verify that children included in the two Child counts meet the eligibility criteria; according to 34 CFR22.40, all COEs are reviewed and approved by regional project directors before data is entered into the student information system. For children enrolled in a prior year but still eligible to be counted safeguards are built into the COEstar system to ensure that no child is counted who reached end of eligibility prior to the beginning of the service period. As part of mass enrollment lists of preschoolers and nonattending young adults are generated and recruiters must verify by home visit or telephone that these children and youth are still residing in the area as of September 1. Training is provided to data managers/specialists by their respective program directors. In addition the New Jersey Department of Education's contract with TROMIK Technology includes extensive and ongoing training and technical assistance to the regional subgrantees in the area of data collection. The COE is a standard document used by our MEP subgrantees in both the northern and southern regions of the state which allows a level of conformity between the two regions and throughout the state. Finally the state has provided written guidance on eligibility; which is reviewed annually and reinforced during trainings and monitors the regional migrant programs which includes conducting random audits of COEs and migrant lists for eligibility determinations. *We should note that COEstar mimics paper COE collection methods. Once verified each COE can be marked as verified and locked; invalid COEs can be marked ineligible and locked to prevent changes. New Jersey uses TROMIK Technology Corporation's Performance Reporter to process the annual performance report. Although COEstar and the associated Performance Reporter are very accurate and reliable numbers are double checked concurrently by state staff regional project staff and TROMIK against other sources to ensure accuracy. Potential errors are identified investigated and corrected as needed. In addition reports are run throughout the year to monitor Childcounts as part of the quality control process. Use of MSIX to Verify Data Quality (Yes/No) Does the State use data in the Migrant Student Information Exchange (MSIX) to verify the quality of migrant data? No If MSIX is utilized, please explain how. The response is limited to 8,000 characters.

OMB NO. 1810-0614 Page 20
2.3.1.3.4 Quality Control Processes
In the space below, respond to the following questions : Quality Control Processes Yes/No
Is student eligibility based on a personal interview (face-to-face or phone call) with a parent, guardian, or other responsible adult, or youth-as-worker? Yes Do the SEA and/or regional offices train recruiters at least annually on eligibility requirements, including the basic eligibility definition, economic necessity, temporary vs. seasonal, processing, etc.? Yes Does the SEA have a formal process, beyond the recruiter's determination, for reviewing and ensuring the accuracy of written eligibility information [e.g., COEs are reviewed and initialed by the recruiter's supervisor and/or other reviewer(s)]? Yes Are incomplete or otherwise questionable COEs returned to the recruiter for correction, further explanation, documentation, and/or verification? Yes Does the SEA provide recruiters with written eligibility guidance (e.g., a handbook)? Yes Does the SEA review student attendance at summer/inter-session projects? Yes Does the SEA have both a local and state-level process for resolving eligibility questions? Yes Are written procedures provided to regular school year and summer/intersession personnel on how to collect and report pupil enrollment and withdrawal data? Yes Are records/data entry personnel provided training on how to review regular school year and summer/inter-session site records, input data, and run reports used for child count purposes? Yes In the space below, describe the results of any re-interview processes used by the SEA during the performance period to test the accuracy of the State's MEP eligibility determinations.
Results # The number of eligibility determinations sampled. 50 The number of eligibility determinations sampled for which a re-interview was completed. 50 The number of eligibility determinations sampled for which a re-interview was completed and the child was found eligible. 45 Describe any reasons children were determined ineligible in the re-interviewing process. The response is limited to 8,000 characters. At this time there are 5 non- eligible determinations. The local program (Region II) is collecting requested clarifying information on 4 of these. It is anticipated that the information provided will be sufficient to "overturn" the determinations.
Procedures Yes/No Was the sampling of eligible children random? Yes Was the sampling statewide? Yes If the sampling was stratified by group/area please describe the procedures. The response is limited to 8,000 characters. N/A Please describe the sampling replacement by the State. The response is limited to 8,000 characters. N/A
Obtaining Data From Families Check the applicable box to indicate how the re-interviews were conducted
Face-to-face re-interviews
Face-to-face re-interviews
Phone Interviews Both
Obtaining Data From Families Yes/No Was there a standard instrument used? Yes Was there a protocol for verifying all information used in making the original eligibility

determination? Yes Were re-interviewers trained and provided instruments? Yes Did the recruitment personnel who made the initial eligibility determinations also conduct the re-interviews with the same families? No When were the most recent independent re-interviews completed (i.e., interviewers were neither SEA or LOA staff members responsible for administering or operating the MEP, nor any other persons who worked on the initial eligibility determinations being tested)? (MM/YY) 08/13 If you did conduct independent re-interviews in this performance period, describe how you ensured that the process was independent. The response is limited to 8,000 characters. The SEA set aside funds to contract with an independent contractor to conduct re-interviews. The funds were awarded only after a competitive bidding process. Additionally, the individuals conducting the re-interviews have no responsibility to the SEA or the regional MEPs and are not employees of either. In the space below, refer to the results of any re-interview processes used by the SEA, and if any of the migrant children were found ineligible, describe those corrective actions or improvements that will be made by the SEA to improve the accuracy of its MEP eligibility determinations. The response is limited to 8,000 characters. The SEA will use information gained from all ineligible determinations to guide targeted assistance to individuals with identification and recruitment responsibilities at the regional MEPs. A plan of corrective action and improvements will be made to improve the accuracy of subsequent eligibility determinations.
2.3.2 Eligible Migrant Children
OMB NO. 1810-0614 Page 21
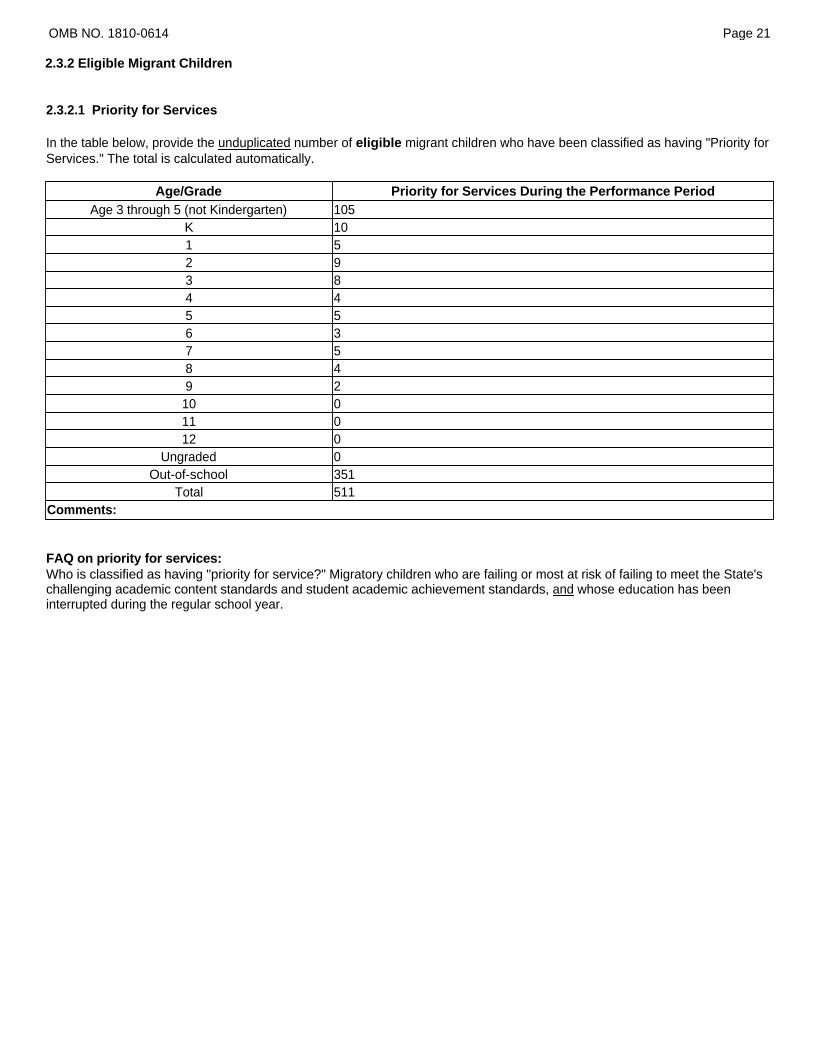
2.3.2.1 Priority for Services
In the table below, provide the unduplicated number of eligible migrant children who have been classified as having "Priority for Services." The total is calculated automatically.
Age/Grade Priority for Services During the Performance Period Age 3 through 5 (not Kindergarten) 105
K 10 1 5 2 9 3 8 4 4 5 5 6 3 7 5 8 4 9 2 10 0 11 0 12 0
Ungraded 0 Out-of-school 351
Total 511 Comments: FAQ on priority for services: Who is classified as having "priority for service?" Migratory children who are failing or most at risk of failing to meet the State's challenging academic content standards and student academic achievement standards, and whose education has been interrupted during the regular school year.

OMB NO. 1810-0614 Page 22
2.3.2.2 Limited English Proficient
In the table below, provide the unduplicated number of eligible migrant children who are also limited English proficient (LEP). The total is calculated automatically.
Age/Grade Limited English Proficient (LEP) During the Performance Period Age 3 through 5 (not Kindergarten) 107
K 66 1 64 2 50 3 37 4 30 5 31 6 20 7 23 8 9 9 9 10 8 11 9 12 1
Ungraded Out-of-school 309
Total 773 Comments: The rationale for the 58% increase of LEP children from last year is that the methodology for identification for LEP students has been changed to include data elements pertaining to LEP status on attendance records (Region I) and on a Parent Survey/Questionnaire (Region II), as well as, other improvements made to the LEP identification process. Additionally, in the 2012-2013 school year, LEP preschoolers were included in the count unlike in previous years.
OMB NO. 1810-0614 Page 23
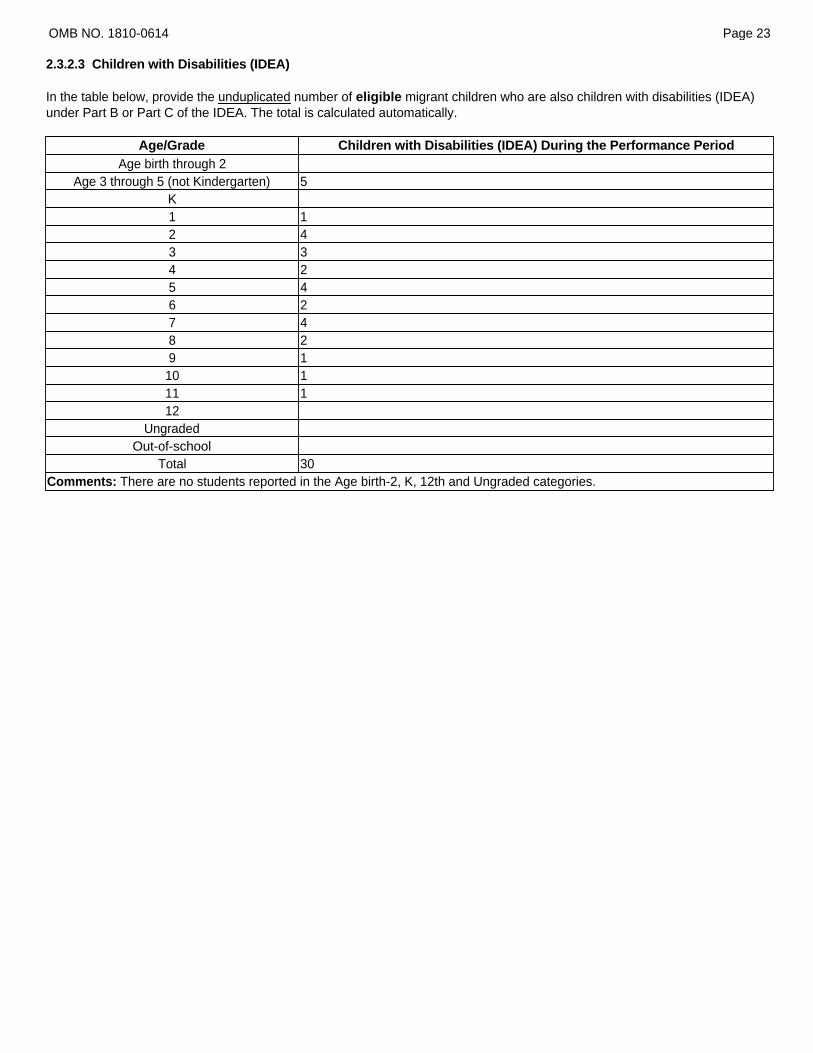
2.3.2.3 Children with Disabilities (IDEA)
In the table below, provide the unduplicated number of eligible migrant children who are also children with disabilities (IDEA) under Part B or Part C of the IDEA. The total is calculated automatically.
Age/Grade Children with Disabilities (IDEA) During the Performance Period Age birth through 2
Age 3 through 5 (not Kindergarten) 5 K 1 1 2 4 3 3 4 2 5 4 6 2 7 4 8 2 9 1 10 1 11 1 12
Ungraded Out-of-school
Total 30 Comments: There are no students reported in the Age birth-2, K, 12th and Ungraded categories.

OMB NO. 1810-0614 Page 24
2.3.2.4 Qualifying Arrival Date (QAD)
In the table below, provide the unduplicated number of eligible migrant children whose qualifying arrival date (QAD) occurred within 12 months from the last day of the performance period, August 31, 2013 (i.e., QAD during the performance period). The total is calculated automatically.
Age/Grade Qualifying Arrival Date During the Performance Period Age birth through 2 58
Age 3 through 5 (not Kindergarten) 112 K 63 1 58 2 39 3 32 4 28 5 23 6 21 7 22 8 13 9 15
10 10 11 12 12 2
Ungraded Out-of-school 371
Total 879 Comments: There are no students reported in the Ungraded category.

OMB NO. 1810-0614 Page 25
2.3.2.5 Qualifying Arrival Date During the Regular School Year
In the table below, provide the unduplicated number of eligible migrant children whose most recent qualifying arrival date occurred during the performance period's regular school year (i.e., QAD during the 2012-13 regular school year) The total is calculated automatically.
Age/Grade Qualifying Arrival Date During the Regular School Year Age birth through 2 10
Age 3 through 5 (not Kindergarten) 24 K 35 1 42 2 56 3 48 4 39 5 31 6 34 7 19 8 16 9 9
10 14 11 12 12 7
Ungraded Out-of-school 176
Total 572 Comments: There are no students reported Ungraded category.

OMB NO. 1810-0614 Page 26
2.3.2.6 Referrals — During the Regular School Year
In the table below, provide the unduplicated number of eligible migrant children who, during the regular school year, received an educational or educationally related service funded by a non-MEP program/organization that they would not have otherwise received without efforts supported by MEP funds. Children should be reported only once regardless of the frequency with which they received a referred service. Include children who received a referral only or who received both a referral and MEP-funded services. Do not include children who received a referral from the MEP, but did not receive services from the non-MEP program/organization to which they were referred. The total is calculated automatically.
Age/Grade Referrals During the Regular School Year
Age birth through 2 4 Age 3 through 5 (not Kindergarten) 9
K 10 1 3 2 6 3 4 4 1 5 9 6 1 7 3 8 1 9
10 1 11 2 12 1
Ungraded Out-of-school
Total 55 Comments: There are no students reported in the Ungraded and Out-of-School categories.
OMB NO. 1810-0614 Page 27
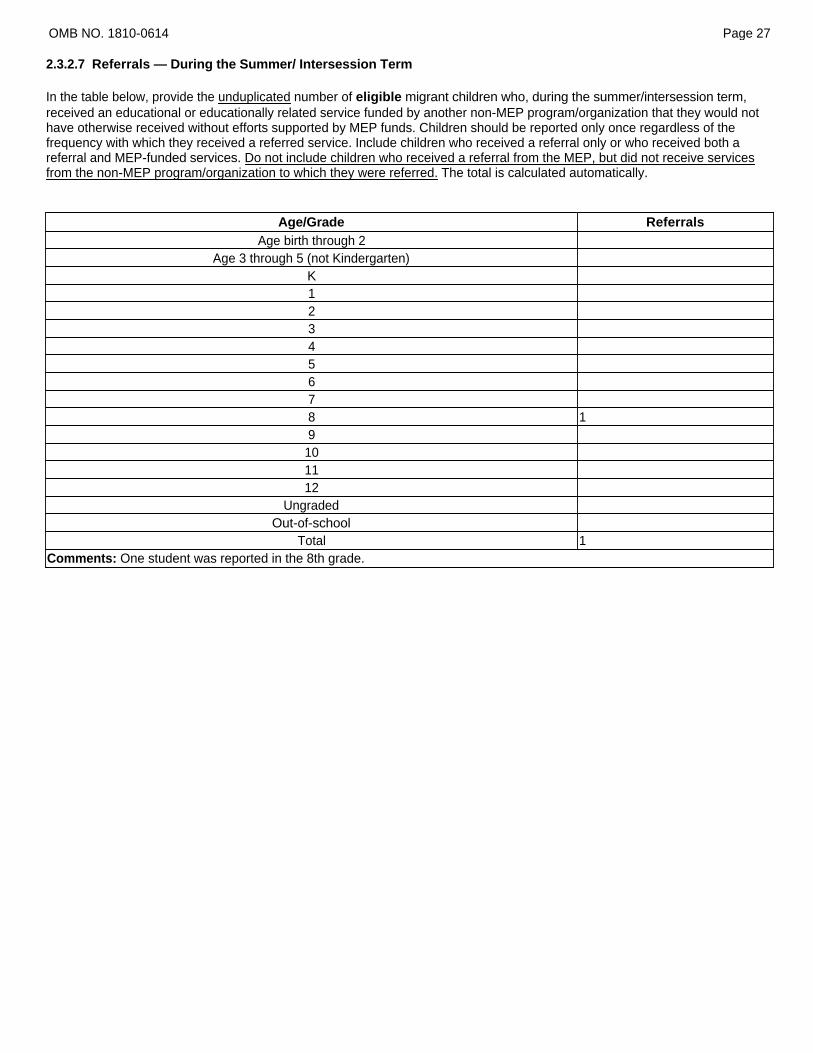
2.3.2.7 Referrals — During the Summer/ Intersession Term
In the table below, provide the unduplicated number of eligible migrant children who, during the summer/intersession term, received an educational or educationally related service funded by another non-MEP program/organization that they would not have otherwise received without efforts supported by MEP funds. Children should be reported only once regardless of the frequency with which they received a referred service. Include children who received a referral only or who received both a referral and MEP-funded services. Do not include children who received a referral from the MEP, but did not receive services from the non-MEP program/organization to which they were referred. The total is calculated automatically.
Age/Grade Referrals
Age birth through 2 Age 3 through 5 (not Kindergarten)
K 1 2 3 4 5 6 7 8 1 9 10 11 12
Ungraded Out-of-school
Total 1 Comments: One student was reported in the 8th grade.

2.3.2.8 Academic Status
The following questions collect data about the academic status of eligible migrant students.
OMB NO. 1810-0614 Page 28
2.3.2.8.1 Dropouts
In the table below, provide the unduplicated number of eligible migrant students who dropped out of school. The total is calculated automatically.
Grade Dropouts During the Performance Period 7 0 8 0 9 0 10 3 11 1 12 0
Ungraded 0 Total 4
Comments: In NJ, students are not considered dropouts until grade nine. FAQ on Dropouts: How is "drop outs of school" defined? The term used for students, who, during the performance period, were enrolled in a public school for at least one day, but who subsequently left school with no plans on returning to enroll in a school and continue toward a high school diploma. Students who dropped out-of-school prior to the 2011-12 performance period should be classified NOT as "drop-outs" but as "out-of-school youth."
2.3.2.8.2 GED
In the table below, provide the total unduplicated number of eligible migrant students who obtained a General Education Development (GED) Certificate in your State. Obtained GED # Obtained a GED in your State During the Performance Period 0 Comments:

2.3.3 MEP Participation Data – Regular School Year The following questions collect data about the participation of migrant children in MEP-funded services during the regular school year.
Participating migrant children include:
● Children who received instructional or support services funded in whole or in part with MEP funds. ● Eligible migrant children and children who continued to receive MEP-funded services: (1) during the term their eligibility
ended, (2) for one additional school year after their eligibility ended, if comparable services were not available through other programs, and (3) in secondary school after their eligibility ended, and served through credit accrual programs until graduation [e.g., children served under the continuation of services authority, Section 1304(e) (1–3)].
Do not include:
● Children who were served through a Title I Schoolwide Program (SWP) where MEP funds were consolidated with those of other programs.
● Children who received only referred services (non-MEP funded). ● Children who were only served during the summer/intersession term.
FAQ on Services: What are services? Services are a subset of all allowable activities that the MEP can provide through its programs and projects. "Services" are those educational or educationally related activities that: (1) directly benefit a migrant child; (2) address a need of a migrant child consistent with the SEA's comprehensive needs assessment and service delivery plan; (3) are grounded in scientifically based research or, in the case of support services, are a generally accepted practice; and (4) are designed to enable the program to meet its measurable outcomes and contribute to the achievement of the State's performance targets. Activities related to identification and recruitment activities, parental involvement, program evaluation, professional development, or administration of the program are examples of allowable activities that are not considered services. Other examples of an allowable activity that would not be considered a service would be the one-time act of providing instructional packets to a child or family, and handing out leaflets to migrant families on available reading programs as part of an effort to increase the reading skills of migrant children. Although these are allowable activities, they are not services because they do not meet all of the criteria above.
OMB NO. 1810-0614 Page 29
2.3.3.1 MEP Children Served During the Regular School Year
In the table below, provide the unduplicated number of participating migrant children who received MEP-funded instructional or support services during the regular school year. Do not count the number of times an individual child received a service intervention. The total number of students served is calculated automatically.
Age/Grade Served During the Regular School Year Age Birth through 2 5
Age 3 through 5 (not Kindergarten) 25 K 40 1 39 2 38 3 31 4 25 5 24 6 16 7 18 8 13 9 8
10 15 11 16 12 5
Ungraded 0 Out-of-school 48
Total 366 Comments: It has been reported anecdotally that fewer individuals are migrating across state lines due to concerns and fear around the anti-immigration sentiment being expressed nationally. In addition, this sentiment lends to individuals not wanting to

be identified. Subsequent to this, it has also been reported that more individuals who previously migrated are remaining in and seeking work in Mexico.

OMB NO. 1810-0614 Page 30
2.3.3.2 Priority for Services – During the Regular School Year
In the table below, provide the unduplicated number of participating migrant children who have been classified as having "priority for services" and who received MEP funded instructional or support services during the regular school year. The total is calculated automatically. Age/Grade Priority for Services During the Regular School Year
Age 3 through 5 5
K 8 1 5 2 9 3 8 4 4 5 5 6 3 7 5 8 3 9 2 10 0 11 0 12 0
Ungraded 0 Out-of-school 47 Total 104
Comments:

OMB NO. 1810-0614 Page 31
2.3.3.3 Continuation of Services – During the Regular School Year
In the table below, provide the unduplicated number of participating migrant children who received instructional or support services during the regular school year under the continuation of services authority Sections 1304(e)(2–3). Do not include children served under Section 1304(e)(1), which are children whose eligibility expired during the school term. The total is calculated automatically.
Age/Grade Continuation of Services During the Regular School Year Age 3 through 5 (not Kindergarten) 2
K 3 1 4 2 5 3 3 4 3 5 4 6 1 7 1 8 4 9 0 10 0 11 0 12 0
Ungraded 0 Out-of-school 0
Total 30 Comments:
OMB NO. 1810-0614 Page 31
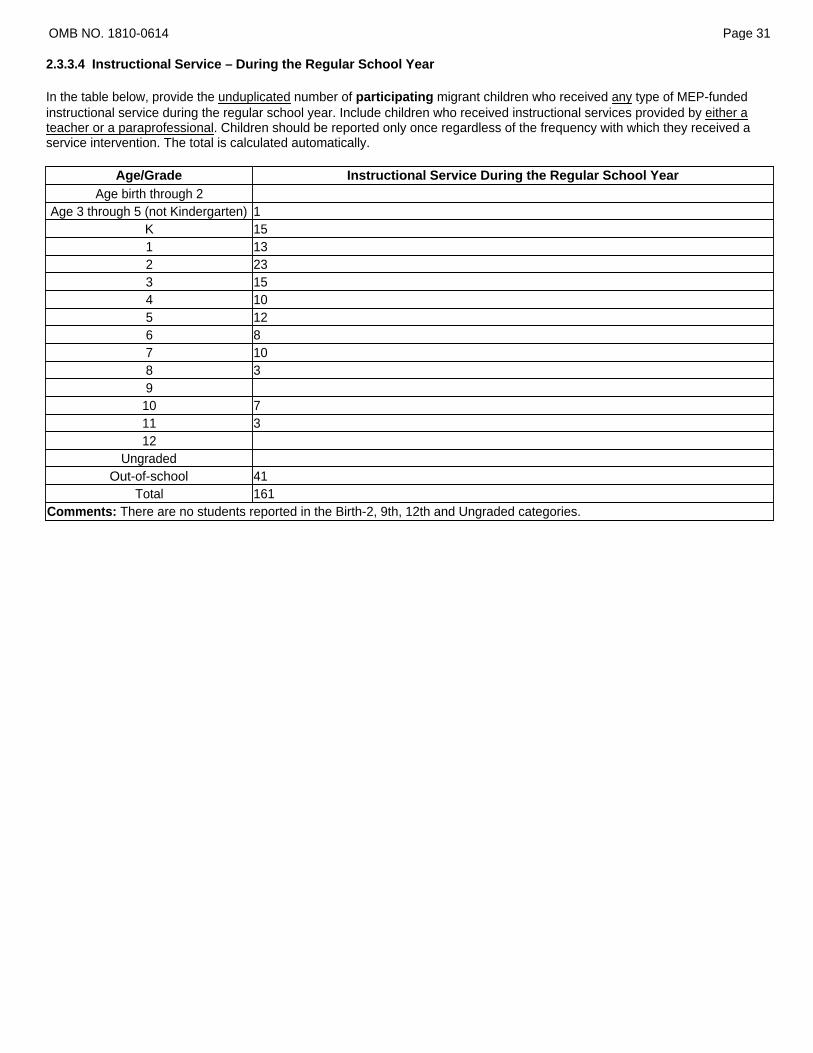
2.3.3.4 Instructional Service – During the Regular School Year
In the table below, provide the unduplicated number of participating migrant children who received any type of MEP-funded instructional service during the regular school year. Include children who received instructional services provided by either a teacher or a paraprofessional. Children should be reported only once regardless of the frequency with which they received a service intervention. The total is calculated automatically.
Age/Grade Instructional Service During the Regular School Year Age birth through 2
Age 3 through 5 (not Kindergarten) 1 K 15 1 13 2 23 3 15 4 10 5 12 6 8 7 10 8 3 9 10 7 11 3 12
Ungraded Out-of-school 41
Total 161 Comments: There are no students reported in the Birth-2, 9th, 12th and Ungraded categories.

OMB NO. 1810-0614 Page 32
2.3.3.4.1 Type of Instructional Service – During the Regular School Year
In the table below, provide the number of participating migrant children reported in the table above who received reading instruction, mathematics instruction, or high school credit accrual during the regular school year. Include children who received such instructional services provided by a teacher only. Children may be reported as having received more than one type of instructional service in the table. However, children should be reported only once within each type of instructional service that they received regardless of the frequency with which they received the instructional service. The totals are calculated automatically.
Age/Grade Reading Instruction During
the Regular School Year Mathematics Instruction During
the Regular School Year
High School Credit Accrual During the Regular School
Year Age birth through 2
Age 3 through 5 (not Kindergarten) 1 1
K 14 14 1 13 13 2 23 23 3 15 15 4 10 10 5 12 12 6 8 8 7 10 10 8 3 3 9 10 11 12
Ungraded Out-of-school 1 41
Total 110 150 Comments: There are no students reported in the Birth-2, 9-12th and Ungraded categories. FAQ on Types of Instructional Services: What is "high school credit accrual"? Instruction in courses that accrue credits needed for high school graduation provided by a teacher for students on a regular or systematic basis, usually for a predetermined period of time. Includes correspondence courses taken by a student under the supervision of a teacher.

OMB NO. 1810-0614 Page 32
2.3.3.4.2 Support Services with Breakout for Counseling Service – During the Regular School Year
In the table below, in the column titled Support Services, provide the unduplicated number of participating migrant children who received any MEP-funded support service during the regular school year. In the column titled Counseling Service, provide the unduplicated number of participating migrant children who received a counseling service during the regular school year. Children should be reported only once in each column regardless of the frequency with which they received a support service intervention. The totals are calculated automatically.
Age/Grade Support Services During the Regular
School Year Breakout of Counseling Service During the
Regular School Year Age birth through 2 5 0
Age 3 through 5 (not Kindergarten) 24 1
K 38 0 1 37 0 2 37 0 3 29 0 4 24 1 5 23 0 6 16 0 7 18 0 8 13 0 9 8 0 10 15 0 11 16 0 12 5 0
Ungraded 0 Out-of-school 47 1
Total 355 3 Comments: The decrease in students receiving supportive services during the regular year is consistent with the decrease in the total number of students served during the regular school year as explained in 2.3.3.1. FAQs on Support Services:
a. What are support services? These MEP-funded services include, but are not limited to, health, nutrition, counseling, and social services for migrant families; necessary educational supplies, and transportation. The one-time act of providing instructional or informational packets to a child or family does not constitute a support service.
b. What are counseling services? Services to help a student to better identify and enhance his or her educational, personal, or occupational potential; relate his or her abilities, emotions, and aptitudes to educational and career opportunities; utilize his or her abilities in formulating realistic plans; and achieve satisfying personal and social development. These activities take place between one or more counselors and one or more students as counselees, between students and students, and between counselors and other staff members. The services can also help the child address life problems or personal crisis that result from the culture of migrancy.

2.3.4 MEP Participation – Summer/Intersession Term
The questions in this subsection are similar to the questions in the previous section with one difference. The questions in this subsection collect data on the summer/intersession term instead of the regular school year.
OMB NO. 1810-0614 Page 33
2.3.4.1 MEP Students Served During the Summer/Intersession Term
In the table below, provide the unduplicated number of participating migrant children who received MEP-funded instructional or support services during the summer/intersession term. Do not count the number of times an individual child received a service intervention. The total number of students served is calculated automatically.
Age/Grade Served During the Summer/Intersession Term Age Birth through 2 0
Age 3 through 5 (not Kindergarten) 119 K 81 1 85 2 67 3 53 4 53 5 42 6 42 7 36 8 20 9 18 10 9 11 14 12 3
Ungraded 0 Out-of-school 358
Total 1,000 Comments:

OMB NO. 1810-0614 Page 34
2.3.4.2 Priority for Services – During the Summer/Intersession Term
In the table below, provide the unduplicated number of participating migrant children who have been classified as having "priority for services" and who received MEP- funded instructional or support services during the summer/intersession term. The total is calculated automatically. Age/Grade Priority for Services During the Summer/Intersession Term
Age 3 through 5 103
K 2 1 0 2 0 3 0 4 0 5 0 6 0 7 0 8 1 9 0 10 0 11 0 12 0
Ungraded 0 Out-of-school 264 Total 370
Comments:
OMB NO. 1810-0614 Page 35
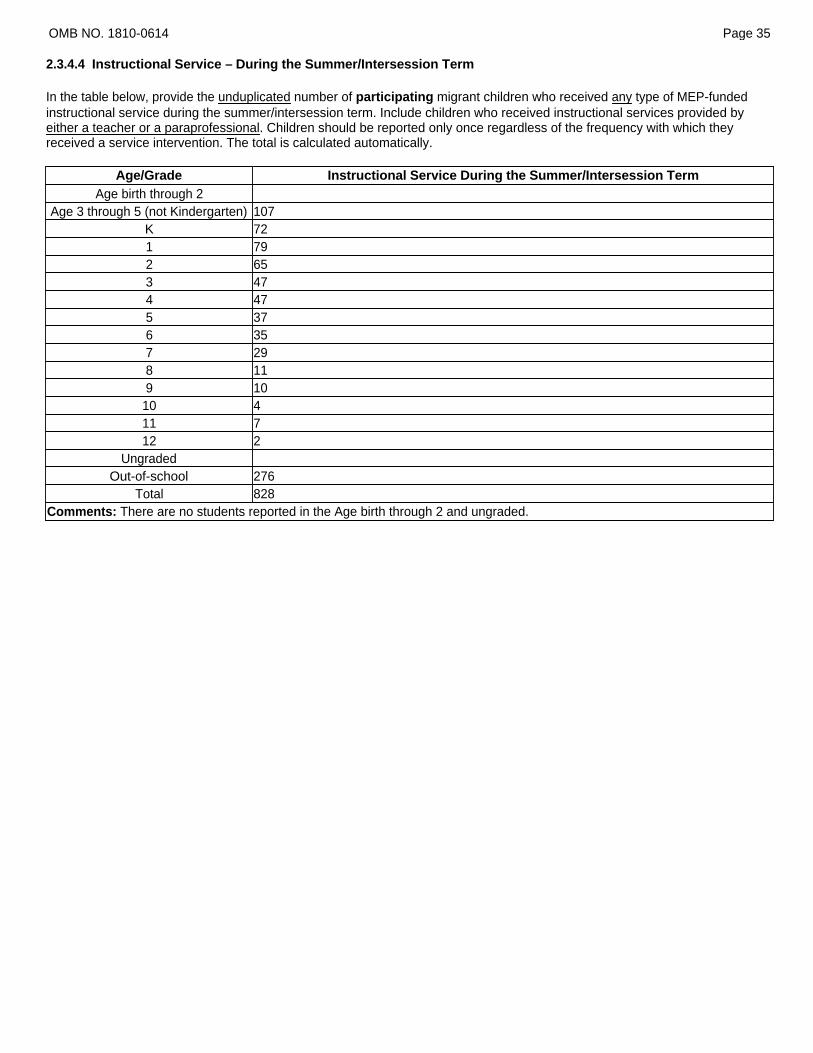
2.3.4.4 Instructional Service – During the Summer/Intersession Term
In the table below, provide the unduplicated number of participating migrant children who received any type of MEP-funded instructional service during the summer/intersession term. Include children who received instructional services provided by either a teacher or a paraprofessional. Children should be reported only once regardless of the frequency with which they received a service intervention. The total is calculated automatically.
Age/Grade Instructional Service During the Summer/Intersession Term Age birth through 2
Age 3 through 5 (not Kindergarten) 107 K 72 1 79 2 65 3 47 4 47 5 37 6 35 7 29 8 11 9 10 10 4 11 7 12 2
Ungraded Out-of-school 276
Total 828 Comments: There are no students reported in the Age birth through 2 and ungraded.

OMB NO. 1810-0614 Page 36
2.3.4.4.1 Type of Instructional Service
In the table below, provide the number of participating migrant children reported in the table above who received reading instruction, mathematics instruction, or high school credit accrual during the summer/intersession term. Include children who received such instructional services provided by a teacher only. Children may be reported as having received more than one type of instructional service in the table. However, children should be reported only once within each type of instructional service that they received regardless of the frequency with which they received the instructional service. The totals are calculated automatically.
Age/Grade
Reading Instruction During the Summer/ Intersession
Term Mathematics Instruction During the Summer/ Intersession Term
High School Credit Accrual During the Summer/ Intersession Term
Age birth through 2 Age 3 through 5 (not
Kindergarten) 107 107 K 72 72 1 79 79 2 65 65 3 47 47 4 47 47 5 37 36 6 35 35 7 29 29 8 11 11 9 10 10 10 4 4 11 7 7 12 2 2
Ungraded Out-of-school 274 12
Total 826 563 Comments: There are no students reported in the Age birth through 2 and ungraded. FAQ on Types of Instructional Services: What is "high school credit accrual"? Instruction in courses that accrue credits needed for high school graduation provided by a teacher for students on a regular or systematic basis, usually for a predetermined period of time. Includes correspondence courses taken by a student under the supervision of a teacher.

OMB NO. 1810-0614 Page 36
2.3.4.4.2 Support Services with Breakout for Counseling Service – During the Summer/Intersession Term
In the table below, in the column titled Support Services, provide the unduplicated number of participating migrant children who received any MEP-funded support service during the summer/intersession term. In the column titled Counseling Service, provide the unduplicated number of participating migrant children who received a counseling service during the summer/intersession term. Children should be reported only once in each column regardless of the frequency with which they received a support service intervention. The totals are calculated automatically.
Age/Grade Support Services During the Summer/Intersession Term
Breakout of Counseling Service During the Summer/Intersession Term
Age birth through 2 0 Age 3 through 5 (not
Kindergarten) 112 107 K 74 67 1 79 71 2 65 54 3 49 36 4 48 36 5 37 25 6 38 24 7 30 21 8 13 6 9 14 9 10 7 4 11 10 7 12 2 0
Ungraded 0 Out-of-school 284 274
Total 862 741 Comments: There are no students reported in the Age birth through 2 and ungraded. Onsite classroom-based group counseling was provided by Child Assault Prevention in the area of conflict resolution, anger management and HIB. Sessions were provided in each grade level, which justifies the 91% increase over last year. FAQs on Support Services:
a. What are support services? These MEP-funded services include, but are not limited to, health, nutrition, counseling, and social services for migrant families; necessary educational supplies, and transportation. The one-time act of providing instructional or informational packets to a child or family does not constitute a support service.
b. What are counseling services? Services to help a student to better identify and enhance his or her educational, personal, or occupational potential; relate his or her abilities, emotions, and aptitudes to educational and career opportunities; utilize his or her abilities in formulating realistic plans; and achieve satisfying personal and social development. These activities take place between one or more counselors and one or more students as counselees, between students and students, and between counselors and other staff members. The services can also help the child address life problems or personal crisis that result from the culture of migrancy.
OMB NO. 1810-0614 Page 37
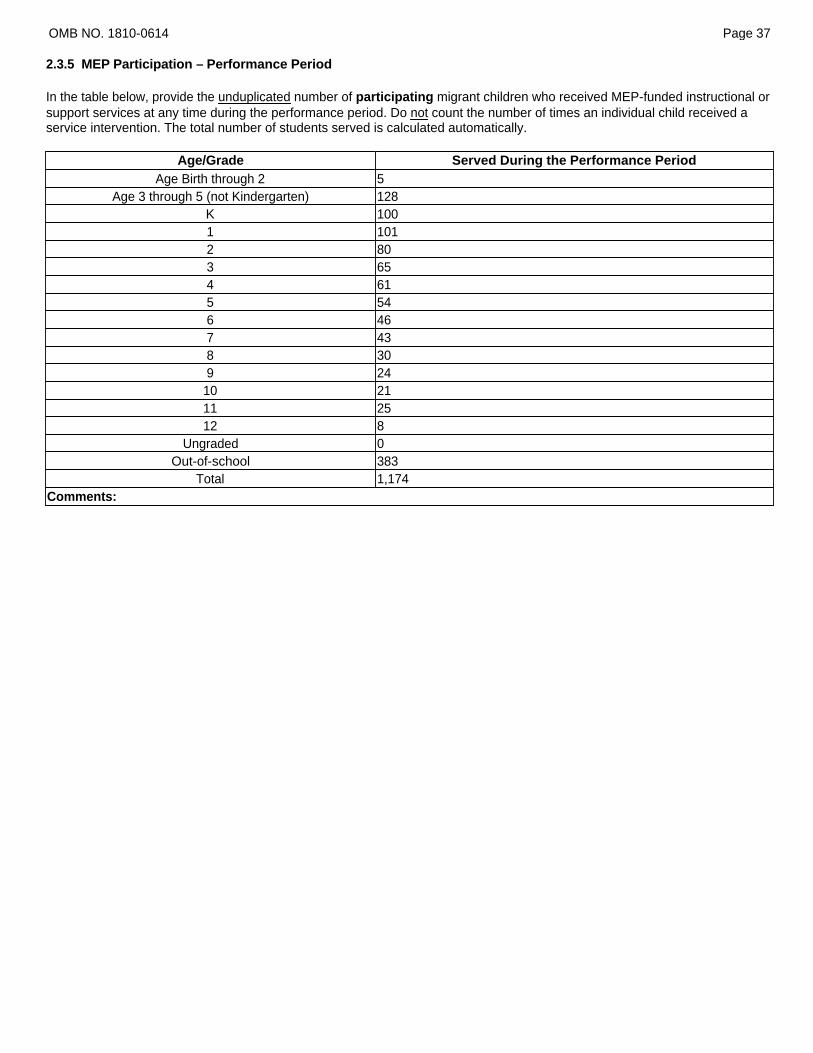
2.3.5 MEP Participation – Performance Period
In the table below, provide the unduplicated number of participating migrant children who received MEP-funded instructional or support services at any time during the performance period. Do not count the number of times an individual child received a service intervention. The total number of students served is calculated automatically.
Age/Grade Served During the Performance Period Age Birth through 2 5
Age 3 through 5 (not Kindergarten) 128 K 100 1 101 2 80 3 65 4 61 5 54 6 46 7 43 8 30 9 24
10 21 11 25 12 8
Ungraded 0 Out-of-school 383
Total 1,174 Comments:

2.3.6 School Data - During the Regular School Year
The following questions are about the enrollment of eligible migrant children in schools during the regular school year.
OMB NO. 1810-0614 Page 38
2.3.6.1 Schools and Enrollment - During the Regular School Year
In the table below, provide the number of public schools that enrolled eligible migrant children at any time during the regular school year. Schools include public schools that serve school age (e.g., grades K through 12) children. Also, provide the number of eligible migrant children who were enrolled in those schools. Since more than one school in a State may enroll the same migrant child at some time during the regular school year, the number of children may include duplicates. Schools # Number of schools that enrolled eligible migrant children 79 Number of eligible migrant children enrolled in those schools 469 Comments:
2.3.6.2 Schools Where MEP Funds Were Consolidated in School Wide Programs (SWP) – During the Regular School Year
In the table below, provide the number of schools where MEP funds were consolidated in an SWP. Also, provide the number of eligible migrant children who were enrolled in those schools at any time during the regular school year. Since more than one school in a State may enroll the same migrant child at some time during the regular school year, the number of children may include duplicates. Schools # Number of schools where MEP funds were consolidated in a schoolwide program Number of eligible migrant children enrolled in those schools Comments:

2.3.7 MEP Project Data
The following questions collect data on MEP projects.
OMB NO. 1810-0614 Page 39
2.3.7.1 Type of MEP Project
In the table below, provide the number of projects that are funded in whole or in part with MEP funds. A MEP project is the entity that receives MEP funds from the State or through an intermediate entity that receives the MEP funds from the State and provides services directly to the migrant child. Do not include projects where MEP funds were consolidated in SWP.
Also, provide the number of migrant children participating in the projects. Since children may participate in more than one project, the number of children may include duplicates.
Type of MEP Project Number of MEP
Projects Number of Migrant Children Participating in the
Projects Regular school year - school day only 0 0 Regular school year - school day/extended day 0 0 Summer/intersession only 0 0 Year round 2 1,533 Comments: FAQs on type of MEP project:
a. What is a project? A project is any entity that receives MEP funds and provides services directly to migrant children in accordance with the State Service Delivery Plan and State approved subgrant applications or contracts. A project's services may be provided in one or more sites. Each project should be counted once, regardless of the number of sites in which it provides services.
b. What are Regular School Year – School Day Only projects? Projects where all MEP services are provided during the school day during the regular school year.
c. What are Regular School Year – School Day/Extended Day projects? Projects where some or all MEP services are provided during an extended day or week during the regular school year (e.g., some services are provided during the school day and some outside of the school day; e.g., all services are provided outside of the school day).
d. What are Summer/Intersession Only projects? Projects where all MEP services are provided during the summer/intersession term.
e. What are Year Round projects? Projects where all MEP services are provided during the regular school year and summer/intersession term.

2.3.8 MEP Personnel Data
The following questions collect data on MEP personnel data.
OMB NO. 1810-0614 Page 40
2.3.8.1 MEP State Director
In the table below, provide the FTE amount of time the State director performs MEP duties (regardless of whether the director is funded by State, MEP, or other funds) during the performance period (e.g., September 1 through August 31). State Director FTE 0.40 Comments: FAQs on the MEP State director
a. How is the FTE calculated for the State director? Calculate the FTE using the number of days worked for the MEP. To do so, first define how many full-time days constitute one FTE for the State director in your State for the performance period. To calculate the FTE number, sum the total days the State director worked for the MEP during the performance period and divide this sum by the number of full-time days that constitute one FTE in the performance period.
b. Who is the State director? The manager within the SEA who administers the MEP on a Statewide basis.

OMB NO. 1810-0614 Page 41
2.3.8.2 MEP Staff
In the table below, provide the headcount and FTE by job classification of the staff funded by the MEP. Do not include staff employed in SWP where MEP funds were combined with those of other programs.
Job Classification Regular School Year Summer/Intersession Term Headcount FTE Headcount FTE
Teachers 44 3 49 37 Counselors 2 0 1 0 All paraprofessionals 0 0 20 13 Recruiters 20 6 20 19 Records transfer staff 5 2 6 4 Administrators 5 1 8 5 Comments: Note: The Headcount value displayed represents the greatest whole number submitted in file specification N/X065 for the corresponding Job Classification. For example, an ESS submitted value of 9.8 will be represented in your CSPR as 9. FAQs on MEP staff:
a. How is the FTE calculated? The FTE may be calculated using one of two methods:1. To calculate the FTE, in each job category, sum the percentage of time that staff were funded by the MEP and
enter the total FTE for that category. 2. Calculate the FTE using the number of days worked. To do so, first define how many full-time days constitute one
FTE for each job classification in your State for each term. (For example, one regular-term FTE may equal 180 full-time (8 hour) work days; one summer term FTE may equal 30 full-time work days; or one intersession FTE may equal 45 full-time work days split between three 15-day non-contiguous blocks throughout the year.) To calculate the FTE number, sum the total days the individuals worked in a particular job classification for a term and divide this sum by the number of full-time days that constitute one FTE in that term.
b. Who is a teacher? A classroom instructor who is licensed and meets any other teaching requirements in the State.
c. Who is a counselor? A professional staff member who guides individuals, families, groups, and communities by assisting
them in problem-solving, decision-making, discovering meaning, and articulating goals related to personal, educational, and career development.
d. Who is a paraprofessional? An individual who: (1) provides one-on-one tutoring if such tutoring is scheduled at a time when a student would not otherwise receive instruction from a teacher; (2) assists with classroom management, such as organizing instructional and other materials; (3) provides instructional assistance in a computer laboratory; (4) conducts parental involvement activities; (5) provides support in a library or media center; (6) acts as a translator; or (7) provides instructional support services under the direct supervision of a teacher (Title I, Section 1119(g)(2)). Because a paraprofessional provides instructional support, he/she should not be providing planned direct instruction or introducing to students new skills, concepts, or academic content. Individuals who work in food services, cafeteria or playground supervision, personal care services, non-instructional computer assistance, and similar positions are not considered paraprofessionals under Title I.
e. Who is a recruiter? A staff person responsible for identifying and recruiting children as eligible for the MEP and documenting their eligibility on the Certificate of Eligibility.
f. Who is a record transfer staffer? An individual who is responsible for entering, retrieving, or sending student records from or to another school or student records system.
g. Who is an administrator? A professional staff member, including the project director or regional director. The SEA MEP Director should not be included.

OMB NO. 1810-0614 Page 41
2.3.8.3 Qualified Paraprofessionals
In the table below, provide the headcount and FTE of the qualified paraprofessionals funded by the MEP. Do not include staff employed in SWP where MEP funds were combined with those of other programs.
Type of Professional funded by MEP Regular School Year Summer/Intersession Term Headcount FTE Headcount FTE
Qualified Paraprofessionals 0 0.00 17 12.40 Comments: FAQs on qualified paraprofessionals:
a. How is the FTE calculated? The FTE may be calculated using one of two methods:1. To calculate the FTE, sum the percentage of time that staff were funded by the MEP and enter the total FTE for that
category. 2. Calculate the FTE using the number of days worked. To do so, first define how many full-time days constitute one
FTE in your State for each term. (For example, one regular-term FTE may equal 180 full-time (8 hour) work days; one summer term FTE may equal 30 full-time work days; or one intersession FTE may equal 45 full-time work days split between three 15-day non-contiguous blocks throughout the year.) To calculate the FTE number, sum the total days the individuals worked for a term and divide this sum by the number of full-time days that constitute one FTE in that term.
b. Who is a qualified paraprofessional? A qualified paraprofessional must have a secondary school diploma or its
recognized equivalent and have (1) completed 2 years of study at an institution of higher education; (2) obtained an associate's (or higher) degree; or (3) met a rigorous standard of quality and be able to demonstrate, through a formal State or local academic assessment, knowledge of and the ability to assist in instructing reading, writing, and mathematics (or, as appropriate, reading readiness, writing readiness, and mathematics readiness) (Sections 1119(c) and (d) of ESEA).

2.4 PREVENTION AND INTERVENTION PROGRAMS FOR CHILDREN AND YOUTH WHO ARE NEGLECTED, DELINQUENT, OR AT RISK (TITLE I,
PART D, SUBPARTS 1 AND 2) This section collects data on programs and facilities that serve students who are neglected, delinquent, or at risk under Title I, Part D, and characteristics about and services provided to these students.
Throughout this section:
● Report data for the program year of July 1, 2012 through June 30, 2013. ● Count programs/facilities based on how the program was classified to ED for funding purposes. ● Do not include programs funded solely through Title I, Part A. ● Use the definitions listed below:
❍ Adult Corrections: An adult correctional institution is a facility in which persons, including persons 21 or under, are confined as a result of conviction for a criminal offense.
❍ At-Risk Programs: Programs operated (through LEAs) that target students who are at risk of academic failure, have a drug or alcohol problem, are pregnant or parenting, have been in contact with the juvenile justice system in the past, are at least 1 year behind the expected age/grade level, have limited English proficiency, are gang members, have dropped out of school in the past, or have a high absenteeism rate at school.
❍ Juvenile Corrections: An institution for delinquent children and youth is a public or private residential facility other than a foster home that is operated for the care of children and youth who have been adjudicated delinquent or in need of supervision. Include any programs serving adjudicated youth (including non-secure facilities and group homes) in this category.
❍ Juvenile Detention Facilities: Detention facilities are shorter-term institutions that provide care to children who require secure custody pending court adjudication, court disposition, or execution of a court order, or care to children after commitment.
❍ Neglected Programs: An institution for neglected children and youth is a public or private residential facility, other than a foster home, that is operated primarily for the care of children who have been committed to the institution or voluntarily placed under applicable State law due to abandonment, neglect, or death of their parents or guardians.
❍ Other: Any other programs, not defined above, which receive Title I, Part D funds and serve non-adjudicated children and youth.
OMB NO. 1810-0614 Page 42

2.4.1 State Agency Title I, Part D Programs and Facilities – Subpart 1 The following questions collect data on Title I, Part D, Subpart 1 programs and facilities.
OMB NO. 1810-0614 Page 43
2.4.1.1 Programs and Facilities - Subpart 1
In the table below, provide the number of State agency Title I, Part D, Subpart 1 programs and facilities that serve neglected and delinquent students and the average length of stay by program/facility type, for these students. Report only programs and facilities that received Title I, Part D, Subpart 1 funding during the reporting year. Count a facility once if it offers only one type of program. If a facility offers more than one type of program (i.e., it is a multipurpose facility), then count each of the separate programs. The total number of programs/facilities will be automatically calculated. Below the table is a FAQ about the data collected in this table.
State Program/Facility Type # Programs/Facilities Average Length of Stay in Days Neglected programs 27 260 Juvenile detention 0 0 Juvenile corrections 13 105 Adult corrections 3 220 Other 0 0 Total 43 Comments: No Subpart 1 funds for juvenile detention or other types of programs in NJ FAQ on Programs and Facilities - Subpart I: How is average length of stay calculated? The average length of stay should be weighted by number of students and should include the number of days, per visit, for each student enrolled during the reporting year, regardless of entry or exit date. Multiple visits for students who entered more than once during the reporting year can be included. The average length of stay in days should not exceed 365.
2.4.1.1.1 Programs and Facilities That Reported - Subpart 1
In the table below, provide the number of State agency Title I, Part D, Subpart 1 programs/facilities that reported data on neglected and delinquent students.
The total row will be automatically calculated. State Program/Facility Type # Reporting Data Neglected Programs 27 Juvenile Detention 0 Juvenile Corrections 13 Adult Corrections 3 Other 0 Total 43 Comments:

OMB NO. 1810-0614 Page 44
2.4.1.2 Students Served – Subpart 1
In the tables below, provide the number of neglected and delinquent students served in State agency Title I, Part D, Subpart 1 programs and facilities. Report only students who received Title I, Part D, Subpart 1 services during the reporting year. In the first table, provide in row 1 the unduplicated number of students served by each program, and in row 2, the total number of students in row 1 who are long-term. In the subsequent tables provide the number of students served by disability (IDEA) and limited English proficiency (LEP), by race/ethnicity, by sex, and by age. The total number of students by race/ethnicity, by sex and by age will be automatically calculated.
# of Students Served Neglected Programs
Juvenile Detention
Juvenile Corrections
Adult Corrections
Other Programs
Total Unduplicated Students Served 872 1,294 238 Total Long Term Students Served 745 535 166
Student Subgroups Neglected Programs
Juvenile Detention
Juvenile Corrections
Adult Corrections
Other Programs
Students with disabilities (IDEA) 518 382 150 LEP Students 0 8 0
Race/Ethnicity Neglected Programs
Juvenile Detention
Juvenile Corrections
Adult Corrections
Other Programs
American Indian or Alaskan Native 0 0 0 Asian 12 1 1 Black or African American 415 974 170 Hispanic or Latino 188 250 42 Native Hawaiian or other Pacific Islander 0 0 0 White 257 69 11 Two or more races 0 0 14 Total 872 1,294 238
Sex Neglected Programs
Juvenile Detention
Juvenile Corrections
Adult Corrections
Other Programs
Male 420 1,243 234 Female 452 51 4 Total 872 1,294 238
Age Neglected Programs
Juvenile Detention
Juvenile Corrections
Adult Corrections
Other Programs
3 through 5 0 0 0 6 2 0 0 7 8 0 0 8 16 0 0 9 14 0 0 10 18 0 0 11 18 0 0 12 20 0 0 13 23 0 0 14 44 9 0 15 74 67 1 16 115 216 1 17 173 364 5 18 189 382 18 19 103 200 83 20 37 51 90 21 18 5 40
Total 872 1,294 238

If the total number of students differs by demographics, please explain in comment box below. This response is limited to 8,000 characters. Comments: FAQ on Unduplicated Count: What is an unduplicated count? An unduplicated count is one that counts students only once, even if they were admitted to a facility or program multiple times within the reporting year. FAQ on long-term: What is long-term? Long-term refers to students who were enrolled for at least 90 consecutive calendar days from July 1, 2012 through June 30, 2013.
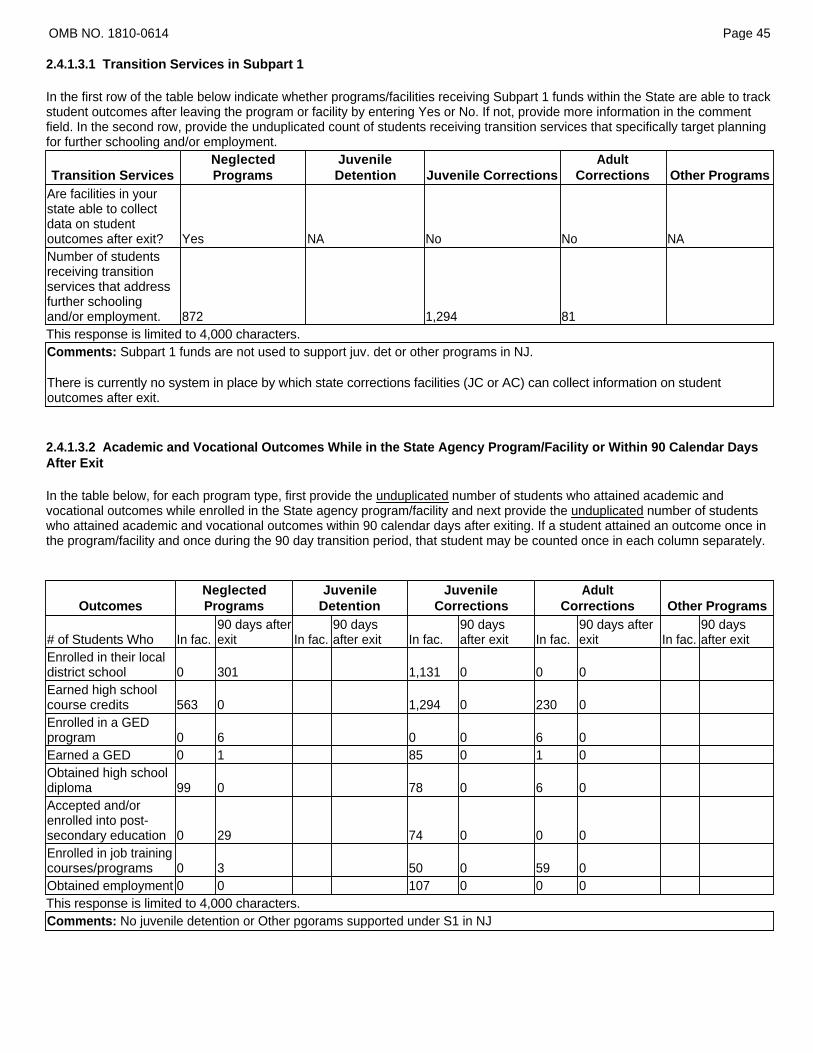
OMB NO. 1810-0614 Page 45
2.4.1.3.1 Transition Services in Subpart 1
In the first row of the table below indicate whether programs/facilities receiving Subpart 1 funds within the State are able to track student outcomes after leaving the program or facility by entering Yes or No. If not, provide more information in the comment field. In the second row, provide the unduplicated count of students receiving transition services that specifically target planning for further schooling and/or employment.
Transition Services Neglected Programs
Juvenile Detention Juvenile Corrections
Adult Corrections Other Programs
Are facilities in your state able to collect data on student outcomes after exit? Yes NA No No NA Number of students receiving transition services that address further schooling and/or employment. 872 1,294 81 This response is limited to 4,000 characters. Comments: Subpart 1 funds are not used to support juv. det or other programs in NJ. There is currently no system in place by which state corrections facilities (JC or AC) can collect information on student outcomes after exit.
2.4.1.3.2 Academic and Vocational Outcomes While in the State Agency Program/Facility or Within 90 Calendar Days After Exit
In the table below, for each program type, first provide the unduplicated number of students who attained academic and vocational outcomes while enrolled in the State agency program/facility and next provide the unduplicated number of students who attained academic and vocational outcomes within 90 calendar days after exiting. If a student attained an outcome once in the program/facility and once during the 90 day transition period, that student may be counted once in each column separately.
Outcomes Neglected Programs
Juvenile Detention
Juvenile Corrections
Adult Corrections Other Programs
# of Students Who In fac. 90 days after exit In fac.
90 days after exit In fac.
90 days after exit In fac.
90 days after exit In fac.
90 days after exit
Enrolled in their local district school 0 301 1,131 0 0 0 Earned high school course credits 563 0 1,294 0 230 0 Enrolled in a GED program 0 6 0 0 6 0 Earned a GED 0 1 85 0 1 0 Obtained high school diploma 99 0 78 0 6 0 Accepted and/or enrolled into post-secondary education 0 29 74 0 0 0 Enrolled in job training courses/programs 0 3 50 0 59 0 Obtained employment 0 0 107 0 0 0 This response is limited to 4,000 characters. Comments: No juvenile detention or Other pgorams supported under S1 in NJ

2.4.1.6 Academic Performance – Subpart 1 The following questions collect data on the academic performance of neglected and delinquent students served by Title I, Part D, Subpart 1 in reading and mathematics.
OMB NO. 1810-0614 Page 46
2.4.1.6.1 Academic Performance in Reading – Subpart 1
In the tables below, provide the unduplicated number of long-term students served by Title I, Part D, Subpart 1, who participated in reading testing. In the first table, report the number of students who tested below grade level upon entry based on their pre-test. A post-test is not required to answer this item. Then, indicate the number of students who completed both a pre-test and a post-test. In the second table, report only students who participated in both pre-and post-testing. Students should be reported in only one of the four change categories in the second table below. Report only information on a student's most recent testing data. Students who were pre-tested prior to July 1, 2012, may be included if their post-test was administered during the reporting year. Students who were post-tested after the reporting year ended should be counted in the following year.Below the tables is an FAQ about the data collected in these tables.
Performance Data (Based on most recent
testing data) Neglected Programs
Juvenile Detention
Juvenile Corrections
Adult Corrections
Other Programs
Long-term students who tested below grade level upon entry 511 504 163 Long-term students who have complete pre- and post-test results (data) 517 52 71 Of the students reported in the second row above, indicate the number who showed:
Performance Data (Based on most recent
pre/post-test data) Neglected Programs
Juvenile Detention
Juvenile Corrections
Adult Corrections
Other Programs
Negative grade level change from the pre- to post-test exams 165 12 22 No change in grade level from the pre- to post-test exams 63 8 2 Improvement up to one full grade level from the pre- to post-test exams 129 12 13 Improvement of more than one full grade level from the pre- to post-test exams 160 20 34 Comments: FAQ on long-term students: What is long-term? Long-term refers to students who were enrolled for at least 90 consecutive calendar days from July 1, 2012 through June 30, 2013.

OMB NO. 1810-0614 Page 47
2.4.1.6.2 Academic Performance in Mathematics – Subpart 1
This section is similar to 2.4.1.6.1. The only difference is that this section collects data on mathematics performance.
Performance Data (Based on most recent
testing data) Neglected Programs
Juvenile Detention
Juvenile Corrections
Adult Corrections
Other Programs
Long-term students who tested below grade level upon entry 520 513 165 Long-term students who have complete pre- and post-test results (data) 516 53 70 Of the students reported in the second row above, indicate the number who showed:
Performance Data (Based on most recent
pre/post-test data) Neglected Programs
Juvenile Detention
Juvenile Corrections
Adult Corrections
Other Programs
Negative grade level change from the pre- to post-test exams 167 13 13 No change in grade level from the pre- to post-test exams 79 11 2 Improvement up to one full grade level from the pre- to post-test exams 120 12 18 Improvement of more than one full grade level from the pre- to post-test exams 150 17 37 Comments:

2.4.2 LEA Title I, Part D Programs and Facilities – Subpart 2 The following questions collect data on Title I, Part D, Subpart 2 programs and facilities.
OMB NO. 1810-0614 Page 48
2.4.2.1 Programs and Facilities – Subpart 2
In the table below, provide the number of LEA Title I, Part D, Subpart 2 programs and facilities that serve neglected and delinquent students and the yearly average length of stay by program/facility type for these students.Report only the programs and facilities that received Title I, Part D, Subpart 2 funding during the reporting year. Count a facility once if it offers only one type of program. If a facility offers more than one type of program (i.e., it is a multipurpose facility), then count each of the separate programs.The total number of programs/ facilities will be automatically calculated. Below the table is an FAQ about the data collected in this table.
LEA Program/Facility Type # Programs/Facilities Average Length of Stay (# days) At-risk programs 0 0 Neglected programs 0 0 Juvenile detention 10 43 Juvenile corrections 0 0 Other 0 0 Total 10 Comments: S2 funds are used to support locally run juvenile detention centers only in NJ FAQ on average length of stay: How is average length of stay calculated? The average length of stay should be weighted by number of students and should include the number of days, per visit for each student enrolled during the reporting year, regardless of entry or exit date. Multiple visits for students who entered more than once during the reporting year can be included. The average length of stay in days should not exceed 365.
2.4.2.1.1 Programs and Facilities That Reported - Subpart 2
In the table below, provide the number of LEA Title I, Part D, Subpart 2 programs and facilities that reported data on neglected and delinquent students.
The total row will be automatically calculated. LEA Program/Facility Type # Reporting Data At-risk programs 0 Neglected programs 0 Juvenile detention 10 Juvenile corrections 0 Other 0 Total 10 Comments:

OMB NO. 1810-0614 Page 49
2.4.2.2 Students Served – Subpart 2
In the tables below, provide the number of neglected and delinquent students served in LEA Title I, Part D, Subpart 2 programs and facilities. Report only students who received Title I, Part D, Subpart 2 services during the reporting year. In the first table, provide in row 1 the unduplicated number of students served by each program, and in row 2, the total number of students in row 1 who are long-term. In the subsequent tables, provide the number of students served by disability (IDEA), and limited English proficiency (LEP), by race/ethnicity, by sex, and by age. The total number of students by race/ethnicity, by sex, and by age will be automatically calculated.
# of Students Served At-Risk
Programs Neglected Programs
Juvenile Detention
Juvenile Corrections
Other Programs
Total Unduplicated Students Served 3,166 Total Long Term Students Served 451
Student Subgroups At-Risk
Programs Neglected Programs
Juvenile Detention
Juvenile Corrections
Other Programs
Students with disabilities (IDEA) 1,246 LEP Students 24
Race/Ethnicity At-Risk
Programs Neglected Programs
Juvenile Detention
Juvenile Corrections
Other Programs
American Indian or Alaska Native 0 Asian 6 Black or African American 1,714 Hispanic or Latino 911 Native Hawaiian or other Pacific Islander 0 White 503 Two or more races 32 Total 3,166
Sex At-Risk
Programs Neglected Programs
Juvenile Detention
Juvenile Corrections
Other Programs
Male 2,844 Female 322 Total 3,166
Age At-Risk
Programs Neglected Programs
Juvenile Detention
Juvenile Corrections
Other Programs
3-5 6 7 8 9 10 0 11 2 12 17 13 76 14 182 15 658 16 937 17 688 18 464 19 105 20 31 21 6

Total 3,166 If the total number of students differs by demographics, please explain. The response is limited to 8,000 characters. FAQ on Unduplicated Count: What is an unduplicated count? An unduplicated count is one that counts students only once, even if they were admitted to a facility or program multiple times within the reporting year. FAQ on long-term: What is long-term? Long-term refers to students who were enrolled for at least 90 consecutive calendar days from July 1, 2012 through June 30, 2013.

OMB NO. 1810-0614 Page 50
2.4.2.3.1 Transition Services in Subpart 2
In the first row of the table below indicate whether programs/facilities receiving Subpart 2 funds within the State are able to track student outcomes after leaving the program or facility by entering Yes or No. If not, provide more information in the comment field. In the second row, provide the unduplicated count of students receiving transition services that specifically target planning for further schooling and/or employment.
Transition Services At-Risk
Programs Neglected Programs
Juvenile Detention
Juvenile Corrections Other Programs
Are facilities in your state able to collect data on student outcomes after exit? NA NA YES NA NA Number of students receiving transition services that address further schooling and/or employment. 172 This response is limited to 4,000 characters. Comments:
2.4.2.3.2 Academic and Vocational Outcomes While in the LEA Program/Facility or Within 90 Calendar Days After Exit
In the table below, for each program type, first provide the unduplicated number of students who attained academic and vocational outcomes while enrolled in the LEA program/facility and next provide the unduplicated number of students who attained academic and vocational outcomes within 90 calendar days after exiting. If a student attained an outcome once in the program/facility and once during the 90 day transition period, that student may be counted once in each column separately.
Outcomes At-Risk Programs Neglected Programs Juvenile Detention
Juvenile Corrections Other Programs
# of Students Who In fac. 90 days after exit In fac.
90 days after exit In fac.
90 days after exit In fac.
90 days after exit In fac.
90 days after exit
Enrolled in their local district school 249 1,232 Earned high school course credits 1,743 0 Enrolled in a GED program 76 Earned a GED 12 Obtained high school diploma 8 1 Accepted and/or enrolled into post-secondary education 9 Enrolled in job training courses/programs 5 Obtained employment 2 This response is limited to 4,000 characters. Comments: There is currently no system in place by which student outcomes can be tracked effectively once students leave the juvenile detention center.
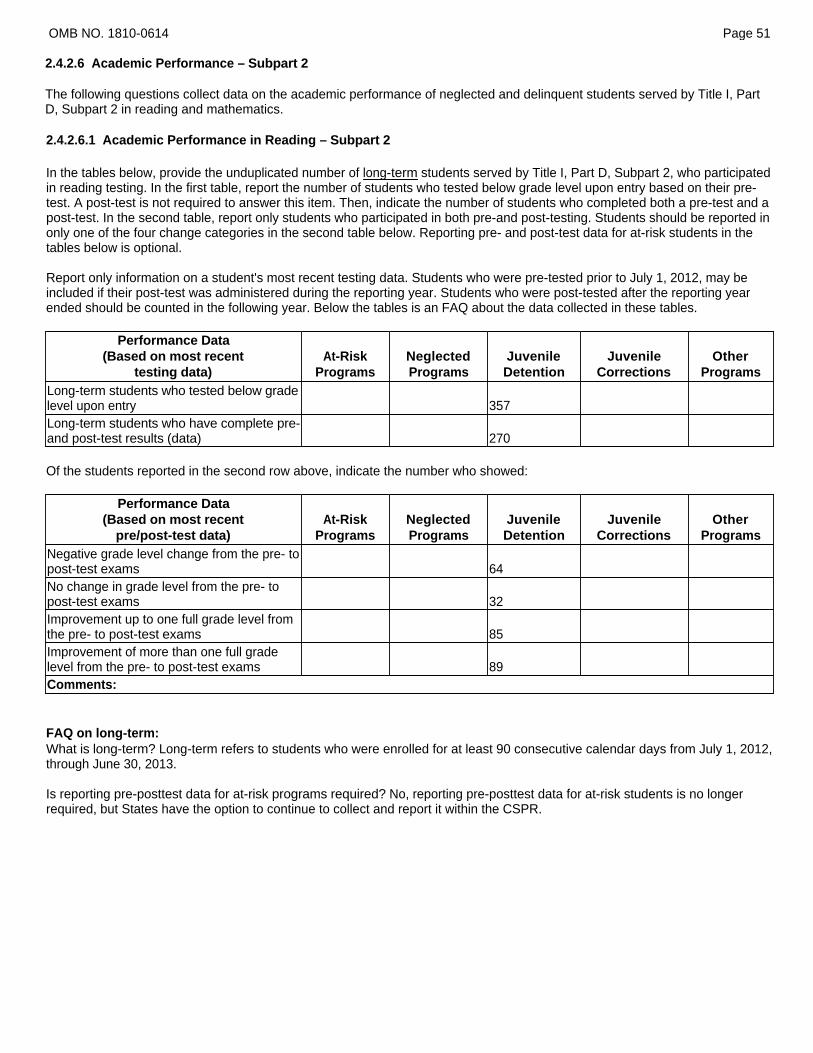
2.4.2.6 Academic Performance – Subpart 2 The following questions collect data on the academic performance of neglected and delinquent students served by Title I, Part D, Subpart 2 in reading and mathematics.
OMB NO. 1810-0614 Page 51
2.4.2.6.1 Academic Performance in Reading – Subpart 2
In the tables below, provide the unduplicated number of long-term students served by Title I, Part D, Subpart 2, who participated in reading testing. In the first table, report the number of students who tested below grade level upon entry based on their pre-test. A post-test is not required to answer this item. Then, indicate the number of students who completed both a pre-test and a post-test. In the second table, report only students who participated in both pre-and post-testing. Students should be reported in only one of the four change categories in the second table below. Reporting pre- and post-test data for at-risk students in the tables below is optional. Report only information on a student's most recent testing data. Students who were pre-tested prior to July 1, 2012, may be included if their post-test was administered during the reporting year. Students who were post-tested after the reporting year ended should be counted in the following year. Below the tables is an FAQ about the data collected in these tables.
Performance Data (Based on most recent
testing data) At-Risk
Programs Neglected Programs
Juvenile Detention
Juvenile Corrections
Other Programs
Long-term students who tested below grade level upon entry 357 Long-term students who have complete pre- and post-test results (data) 270 Of the students reported in the second row above, indicate the number who showed:
Performance Data (Based on most recent
pre/post-test data) At-Risk
Programs Neglected Programs
Juvenile Detention
Juvenile Corrections
Other Programs
Negative grade level change from the pre- to post-test exams 64 No change in grade level from the pre- to post-test exams 32 Improvement up to one full grade level from the pre- to post-test exams 85 Improvement of more than one full grade level from the pre- to post-test exams 89 Comments: FAQ on long-term: What is long-term? Long-term refers to students who were enrolled for at least 90 consecutive calendar days from July 1, 2012, through June 30, 2013. Is reporting pre-posttest data for at-risk programs required? No, reporting pre-posttest data for at-risk students is no longer required, but States have the option to continue to collect and report it within the CSPR.

OMB NO. 1810-0614 Page 52
2.4.2.6.2 Academic Performance in Mathematics – Subpart 2
This section is similar to 2.4.2.6.1. The only difference is that this section collects data on mathematics performance.
Performance Data (Based on most recent
testing data) At-Risk
Programs Neglected Programs
Juvenile Detention
Juvenile Corrections
Other Programs
Long-term students who tested below grade level upon entry 400 Long-term students who have complete pre- and post-test results (data) 272 Of the students reported in the second row above, indicate the number who showed:
Performance Data (Based on most recent
pre/post-test data) At-Risk
Programs Neglected Programs
Juvenile Detention
Juvenile Corrections
Other Programs
Negative grade level change from the pre- to post-test exams 80 No change in grade level from the pre- to post-test exams 32 Improvement up to one full grade level from the pre- to post-test exams 98 Improvement of more than one full grade level from the pre- to post-test exams 62 Comments: FAQ on long-term: What is long-term? Long-term refers to students who were enrolled for at least 90 consecutive calendar days from July 1, 2012, through June 30, 2013. Is reporting pre/post-test data for at-risk programs required? No, reporting pre/post-test data for at-risk students is no longer required, but States have the option to continue to collect and report it within the CSPR.

2.7 SAFE AND DRUG FREE SCHOOLS AND COMMUNITIES ACT (TITLE IV, PART A) This section collects data on student behaviors under the Safe and Drug-Free Schools and Communities Act.
OMB NO. 1810-0614 Page 53
2.7.1 Performance Measures
In the table below, provide actual performance data.
Performance Indicator Instrument/ Data Source
Frequency of
Collection
Year of most
recent collection Targets
Actual Performance Baseline
Year Baseline
Established
30-day use of alcohol, grade 10
YRBS 2001 NJSHS (2003,2005, 2007,2009, 2011,2013) Biennial 2012-2013
2010-11: 43% 2010-11: 41%
57% 2001
2011-12: NA 2011-12: NA 2012-13: 40%
2012-13: 34%
2013-14: NA 2014-15: 33%
Comments: Indicator data (YRBS/NJSHS) is collected every two years(e.g., 2001, 2003, 2005, 2007, 2009, 2011, 2013).
Performance Indicator Instrument/ Data Source
Frequency of
Collection
Year of most
recent collection Targets
Actual Performance Baseline
Year Baseline
Established
30-day use of alcohol, grade 12
YRBS 2001 NJSHS(2003,2005, 2007,2009, 2011,2013) Biennial 2012-13
2010-11: 54% 2010-11: 58%
63% 2001
2011-12: NA 2011-12: NA 2012-13: 55%
2012-13: 60%
2013-14: NA 2014-15: 58%
Comments: Indicator data (YRBS/NJSHS) is collected every two years(e.g., 2001, 2003, 2005, 2007, 2009, 2011, 2013).
Performance Indicator Instrument/ Data Source
Frequency of
Collection
Year of most
recent collection Targets
Actual Performance Baseline
Year Baseline
Established
30-day use of marijuana, grade 10
YRBS 2001 NJSHS(2003,2005, 2007,2009, 2011,2013) Biennial 2012-13
2010-11: 14% 2010-11: 19%
22% 2001
2011-12: NA 2011-12: NA 2012-13: 16%
2012-13: 16%
2013-14: NA 2014-15: 15%
Comments: Indicator data (YRBS/NJSHS) is collected every two years(e.g., 2001, 2003, 2005, 2007, 2009, 2011, 2013).
Performance Indicator Instrument/ Data Source
Frequency of
Collection
Year of most
recent collection Targets
Actual Performance Baseline
Year Baseline
Established 2010-11: 26% 2010-11: 33%

30-day use of marijuana, grade 12
YRBS 2001 NJSHS(2003,2005, 2007,2009, 2011,2013) Biennial 2012-13 29% 2001
2011-12: NA 2011-12: NA 2012-13: 26%
2012-13: 30%
2013-14: NA 2014-15: 28%
Comments: Indicator data (YRBS/NJSHS) is collected every two years(e.g., 2001, 2003, 2005, 2007, 2009, 2011, 2013).
Performance Indicator Instrument/ Data Source
Frequency of
Collection
Year of most
recent collection Targets
Actual Performance Baseline
Year Baseline
Established
30-day use of tobacco (smoking cigarettes), grade 10
YRBS 2001 NJSHS(2003,2005, 2007,2009, 2011,2013) Biennial 2012-13
2010-11: 13% 2010-11: 12%
24% 2001
2011-12: NA 2011-12: NA 2012-13: 11%
2012-13: 11%
2013-14: NA 2014-15: 10%
Comments: Indicator data (YRBS/NJSHS) is collected every two years(e.g., 2001, 2003, 2005, 2007, 2009, 2011, 2013).
Performance Indicator Instrument/ Data Source
Frequency of
Collection
Year of most
recent collection Targets
Actual Performance Baseline
Year Baseline
Established
Substance abuse incidents on school grounds EVVRS Annual 2012-13
2010-11: 2,200 2010-11: 3,559
3,956 2001
2011-12: 2,200 2011-12: 3,482 2012-13: 2,200
2012-13: 3,358
2013-14: 3,300 2014-15: 3,200
Comments: Electronic Violence and Vandalism Reporting System (EVVRS)- http://homeroom.state.nj.us.
Performance Indicator Instrument/ Data Source
Frequency of
Collection
Year of most
recent collection Targets
Actual Performance Baseline
Year Baseline
Established
Age of onset (use by age 14 or younger)-alcohol
YRBS 2001 NJSHS(2003,2005, 2007,2009, 2011,2013) Biennial 2012-13
2010-11: 42% 2010-11: 40%
62% 2001
2011-12: NA 2011-12: NA 2012-13: 40%
2012-13: 40%
2013-14: NA 2014-15: 38%
Comments: Indicator data (YRBS/NJSHS) is collected every two years(e.g., 2001, 2003, 2005, 2007, 2009, 2011, 2013). Target data for 2012-13 and Actual Performance data for 2010-11 have been revised. The prior submission had reported data for "prior to age 13"; the current submission uses "by age 14 or younger," the indicator for the baseline measure.
Performance Indicator Instrument/ Data Source
Frequency of
Collection
Year of most
recent collection Targets
Actual Performance Baseline
Year Baseline
Established 2010-

Age of onset (use by age 14 or younger)-marijuana
YRBS 2001 NJSHS(2003,2005, 2007,2009, 2011,2013) Biennial 2012-13
11: 10% 2010-11: 16%
29% 2001
2011-12: NA 2011-12: NA 2012-13: 15%
2012-13: 19%
2013-14: NA 2014-15: 17%
Comments: Indicator data (YRBS/NJSHS) is collected every two years(e.g., 2001, 2003, 2005, 2007, 2009, 2011, 2013). Target data for 2012-13 and Actual Performance data for 2010-11 have been revised. The prior submission had reported data for "prior to age 13"; the current submission uses "by age 14 or younger," the indicator for the baseline measure.
Performance Indicator Instrument/ Data Source
Frequency of
Collection
Year of most
recent collection Targets
Actual Performance Baseline
Year Baseline
Established
Age of onset (use by age 14 or younger)-tobacco
YRBS 2001 NJSHS(2003,2005, 2007,2009, 2011,2013) Biennial 2012-13
2010-11: 16% 2010-11: 15%
39% 2001
2011-12: NA 2011-12: NA 2012-13: 14%
2012-13: 14%
2013-14: NA 2014-15: 13%
Comments: Indicator data (YRBS/NJSHS) is collected every two years(e.g., 2001, 2003, 2005, 2007, 2009, 2011, 2013). Target data for 2012-13 and Actual Performance data for 2010-11 have been revised. The prior submission had reported data for "prior to age 13"; the current submission uses "by age 14 or younger," the indicator for the baseline measure.
Performance Indicator Instrument/ Data Source
Frequency of
Collection
Year of most
recent collection Targets
Actual Performance Baseline
Year Baseline
Established
Violence on school grounds EVVRS Annual 2012-13
2010-11: 10,000
2010-11: 10,928
15971 2001
2011-12: 9,500 2011-12: 8,252 2012-13: 8,000
2012-13: 7,895
2013-14: 7,800 2014-15: 7,700
Comments: Electronic Violence and Vandalism Reporting System (EVVRS)- http://homeroom.state.nj.us. Incidents of harassment, intimidation and bullying were removed from the violence category in 2011-12.
Performance Indicator Instrument/ Data Source
Frequency of
Collection
Year of most
recent collection Targets
Actual Performance Baseline
Year Baseline
Established
Weapons incidents on school grounds EVVRS Annual 2012-13
2010-11: 1,000 2010-11: 1,227
1523 2001
2011-12: 950 2011-12: 1,125 2012-13: 950
2012-13: 1,048
2013-14: 1,000 2014-15: 900
Comments: Electronic Violence and Vandalism Reporting System (EVVRS)- http://homeroom.state.nj.us.

2.7.2 Out-of-School Suspensions and Expulsions The following questions collect data on the out-of-school suspension and expulsion of students by grade level (e.g., K through 5, 6 through 8, 9 through 12) and type of incident (e.g., violence, weapons possession, alcohol-related, illicit drug-related).
OMB NO. 1810-0614 Page 54
2.7.2.1 State Definitions
In the spaces below, provide the State definitions for each type of incident. Incident Type State Definition Alcohol related Use, Possession, Sale/Distribution Illicit drug related Use, Possession, Sale/Distribution Violent incident without physical injury Incident of violence with no minor or major injury indicated. Violent incident with physical injury Incident of violence with minor or major injury caused/incurred by offender or incurred by
victim. Weapons possession Firearms (including bombs), knives, clubs, spray, other Comments:

2.7.2.2 Out-of-School Suspensions and Expulsions for Violent Incident Without Physical Injury The following questions collect data on violent incident without physical injury.
OMB NO. 1810-0614 Page 55
2.7.2.2.1 Out-of-School Suspensions for Violent Incident Without Physical Injury
In the table below, provide the number of out-of-school suspensions for violent incident without physical injury by grade level. Also, provide the number of LEAs that reported data on violent incident without physical injury, including LEAs that report no incidents.
Grades # Suspensions for Violent Incident Without Physical Injury # LEAs Reporting K through 5 1,099 585 6 through 8 2,898 585 9 through 12 4,074 328
Comments:
2.7.2.2.2 Out-of-School Expulsions for Violent Incident Without Physical Injury
In the table below, provide the number of out-of school expulsions for violent incident without physical injury by grade level. Also, provide the number of LEAs that reported data on violent incident without physical injury, including LEAs that report no incidents.
Grades # Expulsions for Violent Incident Without Physical Injury # LEAs Reporting K through 5 0 585 6 through 8 5 585 9 through 12 0 328
Comments:

2.7.2.3 Out-of-School Suspensions and Expulsions for Violent Incident with Physical Injury The following questions collect data on violent incident with physical injury.
OMB NO. 1810-0614 Page 56
2.7.2.3.1 Out-of-School Suspensions for Violent Incident with Physical Injury
In the table below, provide the number of out-of-school suspensions for violent incident with physical injury by grade level. Also, provide the number of LEAs that reported data on violent incident with physical injury, including LEAs that report no incidents.
Grades # Suspensions for Violent Incident with Physical Injury # LEAs Reporting K through 5 374 585 6 through 8 781 585 9 through 12 1,591 328
Comments:
2.7.2.3.2 Out-of-School Expulsions for Violent Incident with Physical Injury
In the table below, provide the number of out-of school expulsions for violent incident with physical injury by grade level. Also, provide the number of LEAs that reported data on violent incident with physical injury, including LEAs that report no incidents.
Grades # Expulsions for Violent Incident with Physical Injury # LEAs Reporting K through 5 0 585 6 through 8 0 585 9 through 12 4 328
Comments:

2.7.2.4 Out-of-School Suspensions and Expulsions for Weapons Possession The following sections collect data on weapons possession.
OMB NO. 1810-0614 Page 57
2.7.2.4.1 Out-of-School Suspensions for Weapons Possession
In the table below, provide the number of out-of-school suspensions for weapons possession by grade level. Also, provide the number of LEAs that reported data on weapons possession, including LEAs that report no incidents.
Grades # Suspensions for Weapons Possession # LEAs Reporting K through 5 213 585 6 through 8 316 585 9 through 12 351 328
Comments:
2.7.2.4.2 Out-of-School Expulsions for Weapons Possession
In the table below, provide the number of out-of-school expulsions for weapons possession by grade level. Also, provide the number of LEAs that reported data on weapons possession, including LEAs that report no incidents.
Grades # Expulsion for Weapons Possession # LEAs Reporting K through 5 0 585 6 through 8 2 585 9 through 12 0 328
Comments:

2.7.2.5 Out-of-School Suspensions and Expulsions for Alcohol-Related Incidents The following questions collect data on alcohol-related incidents.
OMB NO. 1810-0614 Page 58
2.7.2.5.1 Out-of-School Suspensions for Alcohol-Related Incidents
In the table below, provide the number of out-of-school suspensions for alcohol-related incidents by grade level. Also, provide the number of LEAs that reported data on alcohol-related incidents, including LEAs that report no incidents.
Grades # Suspensions for Alcohol-Related Incidents # LEAs Reporting K through 5 3 585 6 through 8 93 585 9 through 12 436 328
Comments:
2.7.2.5.2 Out-of-School Expulsions for Alcohol-Related Incidents
In the table below, provide the number of out-of-school expulsions for alcohol-related incidents by grade level. Also, provide the number of LEAs that reported data on alcohol-related incidents, including LEAs that report no incidents.
Grades # Expulsion for Alcohol-Related Incidents # LEAs Reporting K through 5 0 585 6 through 8 0 585 9 through 12 0 328
Comments:

2.7.2.6 Out-of-School Suspensions and Expulsions for Illicit Drug-Related Incidents The following questions collect data on illicit drug-related incidents.
OMB NO. 1810-0614 Page 59
2.7.2.6.1 Out-of-School Suspensions for Illicit Drug-Related Incidents
In the table below, provide the number of out-of-school suspensions for illicit drug-related incidents by grade level. Also, provide the number of LEAs that reported data on illicit drug-related incidents, including LEAs that report no incidents.
Grades # Suspensions for Illicit Drug-Related Incidents # LEAs Reporting K through 5 7 585 6 through 8 301 585 9 through 12 2,186 328
Comments:
2.7.2.6.2 Out-of-School Expulsions for Illicit Drug-Related Incidents
In the table below, provide the number of out-of-school expulsions for illicit drug-related incidents by grade level. Also, provide the number of LEAs that reported data on illicit drug-related incidents, including LEAs that report no incidents.
Grades # Expulsion for Illicit Drug-Related Incidents # LEAs Reporting K through 5 0 585 6 through 8 0 585 9 through 12 2 328
Comments:

OMB NO. 1810-0614 Page 60
2.7.3 Parent Involvement
In the table below, provide the types of efforts your State uses to inform parents of, and include parents in, drug and violence prevention efforts. Place a check mark next to the five most common efforts underway in your State. If there are other efforts underway in your State not captured on the list, add those in the other specify section. Yes/No Parental Involvement Activities
Yes Information dissemination on Web sites and in publications, including newsletters, guides, brochures, and "report cards" on school performance
No Training and technical assistance to LEAs on recruiting and involving parents Yes State requirement that parents must be included on LEA advisory councils No State and local parent training, meetings, conferences, and workshops No Parent involvement in State-level advisory groups Yes Parent involvement in school-based teams or community coalitions No Parent surveys, focus groups, and/or other assessments of parent needs and program effectiveness
No
Media and other campaigns (Public service announcements, red ribbon campaigns, kick-off events, parenting awareness month, safe schools week, family day, etc.) to raise parental awareness of drug and alcohol or safety issues
Yes Other Specify 1 Yes Other Specify 2 In the space below, specify 'other' parental activities. The response is limited to 8,000 characters. 1-Parent involvement is in the development of Board of Education policies. 2-Parent involvement is in the annual review of school bullying programs.

2.9 RURAL EDUCATION ACHIEVEMENT PROGRAM (REAP) (TITLE VI, PART B, SUBPARTS 1 AND 2) This section collects data on the Rural Education Achievement Program (REAP) Title VI, Part B, Subparts 1 and 2.
OMB NO. 1810-0614 Page 61
2.9.2 LEA Use of Rural Low-Income Schools Program (RLIS) (Title VI, Part B, Subpart 2) Grant Funds
In the table below, provide the number of eligible LEAs that used RLIS funds for each of the listed purposes.
Purpose # LEAs Teacher recruitment and retention, including the use of signing bonuses and other financial incentives 0 Teacher professional development, including programs that train teachers to utilize technology to improve teaching and to train special needs teachers 0 Educational technology, including software and hardware as described in Title II, Part D 1 Parental involvement activities 0 Activities authorized under the Safe and Drug-Free Schools Program (Title IV, Part A) 0 Activities authorized under Title I, Part A 0 Activities authorized under Title III (Language instruction for LEP and immigrant students) 0 Comments: Only one LEA in NJ is eligible for these funds.

OMB NO. 1810-0614 Page 62
2.9.2.1 Goals and Objectives
In the space below, describe the progress the State has made in meeting the goals and objectives for the Rural Low-Income Schools (RLIS) Program as described in its June 2002 Consolidated State application. Provide quantitative data where available.
The response is limited to 8,000 characters. Only one LEA is eligible for these funds. The stated goals and objectives are being met.

2.10 FUNDING TRANSFERABILITY FOR STATE AND LOCAL EDUCATIONAL AGENCIES (TITLE VI, PART A, SUBPART 2)
OMB NO. 1810-0614 Page 63
2.10.1 State Transferability of Funds In the table below, indicate whether the state transferred funds under the state transferability authority. State Transferability of Funds Yes/No Did the State transfer funds under the State Transferability authority of Section 6123(a) during SY 2012-13? No Comments:
2.10.2 Local Educational Agency (LEA) Transferability of Funds In the table below, indicate the number of LEAs that notified that state that they transferred funds under the LEA transferability authority. LEA Transferability of Funds # LEAs that notified the State that they were transferring funds under the LEA Transferability authority of Section 6123(b). 16 Comments:
2.10.2.1 LEA Funds Transfers
In the table below, provide the total number of LEAs that transferred funds from an eligible program to another eligible program.
Program
# LEAs Transferring Funds FROM Eligible
Program
# LEAs Transferring Funds TO Eligible
Program Improving Teacher Quality State Grants (Section 2121) 16 0 Educational Technology State Grants (Section 2412(a)(2)(A)) 0 0 Safe and Drug-Free Schools and Communities (Section 4112(b)(1)) 0 0 State Grants for Innovative Programs (Section 5112(a)) 0 0 Title I, Part A, Improving Basic Programs Operated by LEAs 16 In the table below provide the total amount of FY 2012 appropriated funds transferred from and to each eligible program.
Program
Total Amount of Funds Transferred FROM Eligible
Program
Total Amount of Funds Transferred TO Eligible
Program Improving Teacher Quality State Grants (Section 2121) 290,456.00 0.00 Educational Technology State Grants (Section 2412(a)(2)(A)) 0.00 0.00 Safe and Drug-Free Schools and Communities (Section 4112(b)(1)) 0.00 0.00 State Grants for Innovative Programs (Section 5112(a)) 0.00 0.00 Title I, Part A, Improving Basic Programs Operated by LEAs 290,456.00 Total 290,456.00 290,456.00 Comments: The Department plans to obtain information on the use of funds under both the State and LEA Transferability Authority through evaluation studies.

2.11 GRADUATION RATES 4
This section collects graduation rates.
4 The "Asian/Pacific Islander" row in the tables below represent either the value reported by the state to the Department of Education for the major racial and ethnic group "Asian/Pacific Islander" or an aggregation of values reported by the state for the major racial and ethnic groups "Asian" and "Native Hawaiian/Other Pacific Islander or Pacific Islander" (and "Filipino" in the case of California). When the values reported in the Asian/Pacific Islander row represent the U. S. Department of Education aggregation of other values reported by the state, the detail for "Asian" and "Native Hawaiian or Other Pacific Islander" are also included in the following rows. Disaggregated reporting for the adjusted cohort graduation rate data is done according to the provisions outlined within each state's Accountability Workbook. Accordingly, not every state uses major racial and ethnic groups which enable detail of Asian American/Pacific Islander (AAPI) populations.
OMB NO. 1810-0614 Page 64
2.11.1 Regulatory Adjusted Cohort Graduation Rates In the table below, provide the graduation rates calculated using the methodology that was approved as part of the State's accountability plan for the current school year (SY 2012-13). Below the table are FAQs about the data collected in this table. Note: States are not required to report these data by the seven (7) racial/ethnic groups; instead, they are required to report these data by the major racial and ethnic groups that are identified in their Accountability Workbooks. The charts below display racial/ethnic data that has been mapped back from the major racial and ethnic groups identified in their workbooks, to the 7 racial/ethnic groups to allow for the examination of data across states.
Student Group Graduation Rate All Students 87.50 American Indian or Alaska Native 76.06 Asian or Pacific Islander 95.82 Asian 95.93 Native Hawaiian or Other Pacific Islander 91.73 Black or African American 76.38 Hispanic or Latino 78.62 White 93.14 Two or more races 88.83 Children with disabilities (IDEA) 75.90 Limited English proficient (LEP) students 70.48 Economically disadvantaged students 77.07 FAQs on graduation rates: What is the regulatory adjusted cohort graduation rate? For complete definitions and instructions, please refer to the non-regulatory guidance, which can be found here: http://www2.ed.gov/policy/elsec/guid/hsgrguidance.pdf. The response is limited to 8,000 characters.

2.12 LISTS OF SCHOOLS AND DISTRICTS This section contains data on school statuses. States with approved ESEA Flexibility requests should follow the instructions in sections 2.12.1 and 2.12.3. All other states should follow the instructions in sections 2.12.2 and 2.12.4. These tables will be generated based on data submitted to EDFacts and included as part of each state's certified report; states will no longer upload their lists separately. Data will be generated into separate reports for each question listed below.
2.12.1 List of Schools for ESEA Flexibility States
OMB NO. 1810-0614 Page 65
2.12.1.1 List of Reward Schools
Instructions for States that identified reward schools6 under ESEA flexibility for SY 2013-14 : Provide the information listed in the bullets below for those schools.
● District Name ● District NCES ID Code ● School Name ● School NCES ID Code ● Whether the school met the proficiency target in reading/language arts in accordance with the State's approved ESEA
flexibility request ● Whether the school met the 95 percent participation rate target for the reading/language arts assessment ● Whether the school met the proficiency target in mathematics in accordance with the State's approved ESEA flexibility
request ● Whether the school met the 95 percent participation rate target for the mathematics assessment ● Whether the school met the other academic indicator for elementary/middle schools (if applicable) in accordance with the
State's approved ESEA flexibility request ● Whether the school met the graduation rate goal or target for high schools (if applicable) in accordance with the State's
approved ESEA flexibility request ● If applicable, State-specific status in addition to reward (e.g., grade, star, or level) ● Whether the school was identified as a high progress or high performing reward school ● Whether (yes or no) the school is a Title I school (This information must be provided by all States.) ● Whether (yes or no) the school was provided assistance through 1003(a). ● Whether (yes or no) the school was provided assistance through 1003(g).
The data for this question are reported through EDFacts files and compiled in the EDEN030 "List of Reward Schools÷ report in the EDFacts Reporting System (ERS). The EDFacts files and data groups used in this report are listed in the CSPR Crosswalk. The CSPR Data Key contains more detailed information on how the data are populated into the report.
Before certifying Part II of the CSPR, a state user must run the EDEN030 report in ERS and verify that the state's data are correct . The final, certified data from this report will be made publicly available alongside the state's certified CSPR PDF.
6 The definition of reward schools is provided in the document titled, ESEA Flexibility. This document may be accessed on the Department's Web page at http://www.ed.gov/esea/flexibility/documents/esea-flexibility.doc

OMB NO. 1810-0614 Page 66
2.12.1.2 List of Priority and Focus Schools
Instructions for States that identified priority and focus schools 8 under ESEA flexibility for SY 2013-14 : Provide the information listed in the bullets below for those schools.
● District Name ● District NCES ID Code ● School Name ● School NCES ID Code ● Whether the school met the proficiency target in reading/language arts in accordance with the State's approved ESEA
flexibility request ● Whether the school met the 95 percent participation rate target for the reading/language arts assessment ● Whether the school met the proficiency target in mathematics in accordance with the State's approved ESEA flexibility
request ● Whether the school met the 95 percent participation rate target for the mathematics assessment ● Whether the school met the other academic indicator for elementary/middle schools (if applicable) in accordance with the
State's approved ESEA flexibility request ● Whether the school met the graduation rate goal or target for high schools (if applicable) in accordance with the State's
approved ESEA flexibility request ● Status for SY 2013-14 (Use one of the following status designations: priority or focus) ● If applicable, State-specific status in addition to priority or focus (e.g., grade, star, or level) ● Whether (yes or no) the school is a Title I school (This information must be provided by all States.) ● Whether (yes or no) the school was provided assistance through Section 1003(a). ● Whether (yes or no) the school was provided assistance through Section 1003(g).
The data for this question are reported through EDFacts files and compiled in the EDEN031 "List of Priority and Focus Schools" report in the EDFacts Reporting System (ERS). The EDFacts files and data groups used in this report are listed in the CSPR Crosswalk. The CSPR Data Key contains more detailed information on how the data are populated into the report.
Before certifying Part II of the CSPR, a state user must run the EDEN031 report in ERS and verify that the state's data are correct . The final, certified data from this report will be made publicly available alongside the state's certified CSPR PDF.
8 The definitions of priority and focus schools are provided in the document titled, ESEA Flexibility. This document may be accessed on the Department's Web page at http://www.ed.gov/esea/flexibility/documents/esea-flexibility.doc
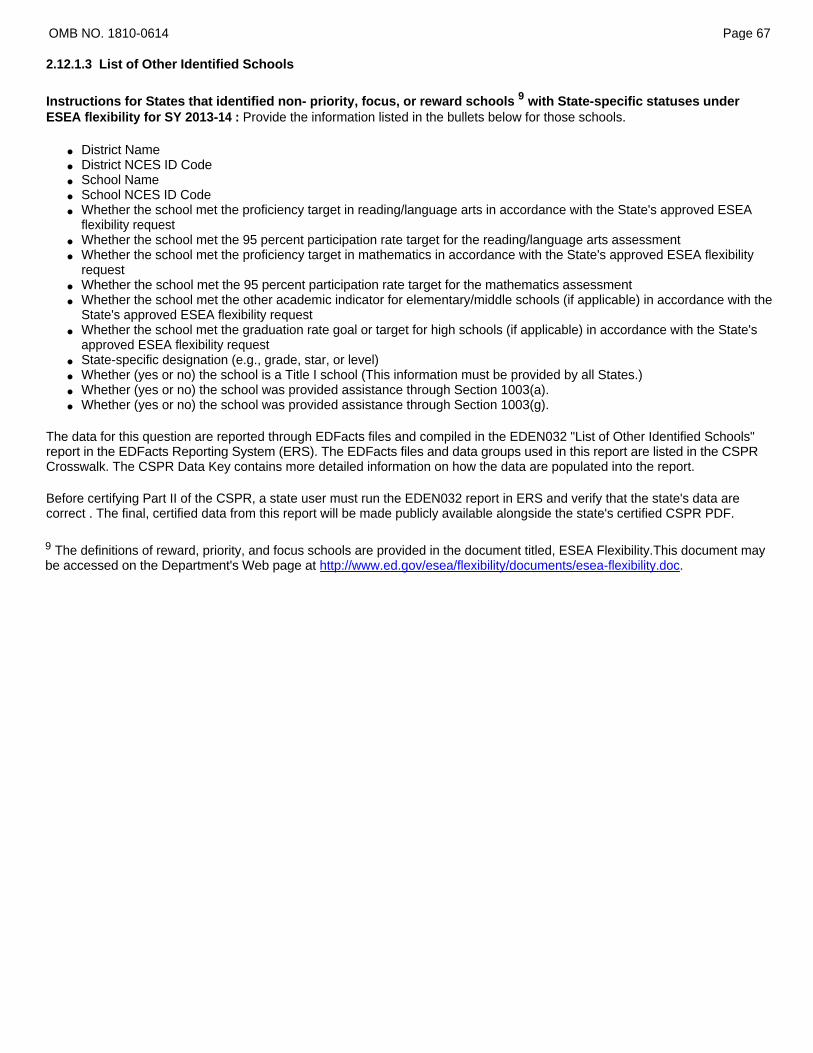
OMB NO. 1810-0614 Page 67
2.12.1.3 List of Other Identified Schools
Instructions for States that identified non- priority, focus, or reward schools 9 with State-specific statuses under ESEA flexibility for SY 2013-14 : Provide the information listed in the bullets below for those schools.
● District Name ● District NCES ID Code ● School Name ● School NCES ID Code ● Whether the school met the proficiency target in reading/language arts in accordance with the State's approved ESEA
flexibility request ● Whether the school met the 95 percent participation rate target for the reading/language arts assessment ● Whether the school met the proficiency target in mathematics in accordance with the State's approved ESEA flexibility
request ● Whether the school met the 95 percent participation rate target for the mathematics assessment ● Whether the school met the other academic indicator for elementary/middle schools (if applicable) in accordance with the
State's approved ESEA flexibility request ● Whether the school met the graduation rate goal or target for high schools (if applicable) in accordance with the State's
approved ESEA flexibility request ● State-specific designation (e.g., grade, star, or level) ● Whether (yes or no) the school is a Title I school (This information must be provided by all States.) ● Whether (yes or no) the school was provided assistance through Section 1003(a). ● Whether (yes or no) the school was provided assistance through Section 1003(g).
The data for this question are reported through EDFacts files and compiled in the EDEN032 "List of Other Identified Schools" report in the EDFacts Reporting System (ERS). The EDFacts files and data groups used in this report are listed in the CSPR Crosswalk. The CSPR Data Key contains more detailed information on how the data are populated into the report.
Before certifying Part II of the CSPR, a state user must run the EDEN032 report in ERS and verify that the state's data are correct . The final, certified data from this report will be made publicly available alongside the state's certified CSPR PDF.
9 The definitions of reward, priority, and focus schools are provided in the document titled, ESEA Flexibility.This document may be accessed on the Department's Web page at http://www.ed.gov/esea/flexibility/documents/esea-flexibility.doc.

2.12.2 List of Schools for All Other States
OMB NO. 1810-0614 Page 68
2.12.2.1 Instructions for States that identified schools for improvement, corrective action, or restructuring under ESEA section 1116 for SY 2013-14: Provide the information listed in the bullets below for those schools.
● District Name ● District NCES ID Code ● School Name ● School NCES ID Code ● Whether the school met the proficiency target in reading/language arts in accordance with the State's Accountability Plan ● Whether the school met the 95 percent participation rate target for the reading/language arts assessmentWhether the
school met the proficiency target in mathematics in accordance with the State's Accountability Plan ● Whether the school met the 95 percent participation rate target for the mathematics assessment ● Whether the school met the other academic indicator for elementary/middle schools (if applicable) in accordance with the
State's Accountability Plan ● Whether the school met the graduation rate target for high schools (if applicable) in accordance with the State's
Accountability Plan ● Status for SY 2013-14 (Use one of the following status designations: School Improvement – Year 1, School Improvement
– Year 2, Corrective Action, Restructuring Year 1 (planning), or Restructuring Year 2 (implementing)10
● Whether (yes or no) the school is a Title I school (This information must be provided by all States.) ● Whether (yes or no) the school was provided assistance through Section 1003(a). ● Whether (yes or no) the school was provided assistance through Section 1003(g).
The data for this question are reported through EDFacts files and compiled in the EDEN033 "List of Schools Identified for Improvement" report in the EDFacts Reporting System (ERS). The EDFacts files and data groups used in this report are listed in the CSPR Crosswalk. The CSPR Data Key contains more detailed information on how the data are populated into the report.
Before certifying Part II of the CSPR, a state user must run the EDEN033 report in ERS and verify that the state's data are correct . The final, certified data from this report will be made publicly available alongside the state's certified CSPR PDF.
10 The school improvement statuses are defined in LEA and School Improvement Non-Regulatory Guidance. This document may be accessed on the Department's Web page at http://www.ed.gov/policy/elsec/guid/schoolimprovementguid.doc.

2.12.3 List of Districts for ESEA Flexibility States
OMB NO. 1810-0614 Page 69
2.12.3.1 List of Identified Districts with State Specific Statuses
Instructions for States that identified school districts with State-specific statuses under ESEA Flexibility for SY 2013-14: Provide the information listed in the bullets below for those districts.
● District Name ● District NCES ID Code ● Whether the district met the proficiency target in reading/language arts in accordance with the State's approved ESEA
Flexibility request ● Whether the district met the 95 percent participation rate target for the reading/language arts assessment Whether the
district met the proficiency target in mathematics in accordance with the State's approved ESEA Flexibility request ● Whether the district met the 95 percent participation rate target for the mathematics assessment ● Whether the district met the other academic indicator for elementary/middle schools (if applicable) in accordance with the
State's approved ESEA Flexibility request ● Whether the district met the graduation rate for high schools (if applicable) in accordance with the State's approved ESEA
Flexibility request ● State-specific status for SY 2013-14 (e.g., grade, star, or level) ● Whether the district received Title I funds.
The data for this question are reported through EDFacts files and compiled in the EDEN034 "List of Identified Districts with State Specific Statuse's report in the EDFacts Reporting System (ERS). The EDFacts files and data groups used in this report are listed in the CSPR Crosswalk. The CSPR Data Key contains more detailed information on how the data are populated into the report.
Before certifying Part II of the CSPR, a state user must run the EDEN034 report in ERS and verify that the state's data are correct . The final, certified data from this report will be made publicly available alongside the state's certified CSPR PDF.

2.12.4 List of Districts for All Other States
OMB NO. 1810-0614 Page 70
2.12.4.1 List of Districts Identified for Improvement
Instructions for States that identified school districts for improvement or corrective action11 under ESEA section 1116 for SY 2013-14: Provide the information listed in the bullets below for those districts.
● District Name ● District NCES ID Code ● Whether the district met the proficiency target in reading/language arts as outlined in the State's Accountability Plan ● Whether the district met the participation rate target for the reading/language arts assessment ● Whether the district met the proficiency target in mathematics as outlined in the State's Accountability Plan ● Whether the district met the participation rate target for the mathematics assessment ● Whether the district met the other academic indicator for elementary/middle schools (if applicable) as outlined in the
State's Accountability Plan ● Whether the district met the graduation rate for high schools (if applicable) as outlined in the State's Accountability Plan ● Improvement status for SY 2013-14 (Use one of the following improvement status designations: Improvement or
Corrective Action) ● Whether the district received Title I funds.
The data for this question are reported through EDFacts files and compiled in the EDEN035 "List of Districts Identified for Improvement" report in the EDFacts Reporting System (ERS). The EDFacts files and data groups used in this report are listed in the CSPR Crosswalk. The CSPR Data Key contains more detailed information on how the data are populated into the report.
Before certifying Part II of the CSPR, a state user must run the EDEN035 report in ERS and verify that the state's data are correct . The final, certified data from this report will be made publicly available alongside the state's certified CSPR PDF.
11 The school improvement statuses are defined in LEA and School Improvement Non-Regulatory Guidance. This document may be accessed on the Department's Web page at http://www.ed.gov/policy/elsec/guid/schoolimprovementguid.doc.