consolidated state performance report: parts i and ii - ed.gov · consolidated state performance...
TRANSCRIPT
CONSOLIDATED STATE PERFORMANCE REPORT: Parts I and II
for STATE FORMULA GRANT PROGRAMS
under the ELEMENTARY AND SECONDARY EDUCATION ACT
As amended in 2001
For reporting on School Year 2014-15
PART I DUE THURSDAY, DECEMBER 17, 2015 PART II DUE THURSDAY, FEBRUARY 11, 2016
U.S. DEPARTMENT OF EDUCATION WASHINGTON, DC 20202
PRIVACY PROTECTED VERSION SOME DATA IN THIS REPORT HAVE BEEN SUPPRESSED OR BLURRED TO PROTECT STUDENT PRIVACY.

OMB NO. 1810-0724 Page 2
INTRODUCTION
Sections 9302 and 9303 of the Elementary and Secondary Education Act (ESEA), as amended in 2001 provide to States the option of applying for and reporting on multiple ESEA programs through a single consolidated application and report. Although a central, practical purpose of the Consolidated State Application and Report is to reduce "red tape" and burden on States, the Consolidated State Application and Report are also intended to have the important purpose of encouraging the integration of State, local, and ESEA programs in comprehensive planning and service delivery and enhancing the likelihood that the State will coordinate planning and service delivery across multiple State and local programs. The combined goal of all educational agencies–State, local, and Federal–is a more coherent, well-integrated educational plan that will result in improved teaching and learning. The Consolidated State Application and Report includes the following ESEA programs:
o Title I, Part A – Improving Basic Programs Operated by Local Educational Agencies
o Title I, Part B, Subpart 3 – William F. Goodling Even Start Family Literacy Programs
o Title I, Part C – Education of Migratory Children (Includes the Migrant Child Count)
o Title I, Part D – Prevention and Intervention Programs for Children and Youth Who Are Neglected, Delinquent, or At-Risk
o Title II, Part A – Improving Teacher Quality State Grants (Teacher and Principal Training and Recruiting Fund)
o Title III, Part A – English Language Acquisition, Language Enhancement, and Academic Achievement Act
o Title IV, Part A, Subpart 1 – Safe and Drug-Free Schools and Communities State Grants
o Title IV, Part A, Subpart 2 – Safe and Drug-Free Schools and Communities National Activities (Community Service Grant Program)
o Title V, Part A – Innovative Programs
o Title VI, Section 6111 – Grants for State Assessments and Related Activities
o Title VI, Part B – Rural Education Achievement Program
o Title X, Part C – Education for Homeless Children and Youths

OMB NO. 1810-0724 Page 3
The ESEA Consolidated State Performance Report (CSPR) for school year (SY) 2014-15 consists of two Parts, Part I and Part II.
PART I
Part I of the CSPR requests information related to the five ESEA Goals, established in the June 2002 Consolidated State Application, and information required for the Annual State Report to the Secretary, as described in Section 1111(h)(4) of the ESEA. The five ESEA Goals established in the June 2002 Consolidated State Application are:
� Performance Goal 1: By SY 2013 -14, all students will reach high standards, at a minimum attaining proficiency or better in reading/language arts and mathematics.
� Performance Goal 2: All limited English proficient students will become proficient in English and reach high academic standards, at a minimum attaining proficiency or better in reading/language arts and mathematics.
� Performance Goal 3: By SY 2005 -06, all students will be taught by highly qualified teachers.
� Performance Goal 4: All students will be educated in learning environments that are safe, drug free, and conducive to learning.
� Performance Goal 5: All students will graduate from high school.
Beginning with the CSPR SY 2005-06 collection, the Education of Homeless Children and Youths was added. The Migrant Child count was added for the SY 2006-07 collection.
PART II
Part II of the CSPR consists of information related to State activities and outcomes of specific ESEA programs. While the information requested varies from program to program, the specific information requested for this report meets the following criteria:
1. The information is needed for Department program performance plans or for other program needs. 2. The information is not available from another source, including program evaluations pending full implementation
of required EDFacts submission. 3. The information will provide valid evidence of program outcomes or results.

OMB NO. 1810-0724 Page 4
GENERAL INSTRUCTIONS AND TIMELINES
All States that received funding on the basis of the Consolidated State Application for the SY 2014-15 must respond to this Consolidated State Performance Report (CSPR). Part I of the Report is due to the Department by Thursday, December 17, 2015. Part II of the Report is due to the Department by Thursday, February 11, 2016. Both Part I and Part II should reflect data from the SY 2014-15, unless otherwise noted.
The format states will use to submit the Consolidated State Performance Report has changed to an online submission starting with SY 2004-05. This online submission system is being developed through the Education Data Exchange Network (EDEN) and will make the submission process less burdensome. Please see the following section on transmittal instructions for more information on how to submit this year's Consolidated State Performance Report.
TRANSMITTAL INSTRUCTIONS
The Consolidated State Performance Report (CSPR) data will be collected online from the SEAs, using the EDEN web site. The EDEN web site will be modified to include a separate area (sub-domain) for CSPR data entry. This area will utilize EDEN formatting to the extent possible and the data will be entered in the order of the current CSPR forms. The data entry screens will include or provide access to all instructions and notes on the current CSPR forms; additionally, an effort will be made to design the screens to balance efficient data collection and reduction of visual clutter.
Initially, a state user will log onto EDEN and be provided with an option that takes him or her to the "SY 2014-15 CSPR". The main CSPR screen will allow the user to select the section of the CSPR that he or she needs to either view or enter data. After selecting a section of the CSPR, the user will be presented with a screen or set of screens where the user can input the data for that section of the CSPR. A user can only select one section of the CSPR at a time. After a state has included all available data in the designated sections of a particular CSPR Part, a lead state user will certify that Part and transmit it to the Department. Once a Part has been transmitted, ED will have access to the data. States may still make changes or additions to the transmitted data, by creating an updated version of the CSPR. Detailed instructions for transmitting the SY 2014-15 CSPR will be found on the main CSPR page of the EDEN web site (https://EDEN.ED.GOV/EDENPortal/).

OMB NO. 1810-0724 Page 5
OMB Number: 1810-0724 Expiration Date: 5/31/2018
Consolidated State Performance Report For
State Formula Grant Programs under the
Elementary And Secondary Education Act as amended in 2001
Check the one that indicates the report you are submitting: X Part I, 2014-15 Part II, 2014-15
Name of State Educational Agency (SEA) Submitting This Report: West Virginia Address: 1900 Kanawha Blvd Charleston, WV 25305
Person to contact about this report: Name: Robert Surface Telephone: 304-558-7881 Fax: 304-558-1613 e-mail: [email protected] Name of Authorizing State Official: (Print or Type): Michael J. Martirano, ED.D.
Thursday, April 14, 2016, 5:29:57 PM Signature Date

OMB NO. 1810-0724 Page 6
CONSOLIDATED STATE PERFORMANCE REPORT PART I
For reporting on School Year 2014-15
PART I DUE DECEMBER 17, 2015 5PM EST

OMB NO. 1810-0724 Page 7
1.1 STANDARDS AND ASSESSMENT DEVELOPMENT
STANDARDS OF ASSESSMENT DEVELOPMENT
This section requests descriptions of the State's implementation of the Elementary and Secondary Education Act, as amended (ESEA) academic content standards, academic achievement standards and assessments to meet the requirements of Section 1111(b)(1) of ESEA.
1.1.1 Academic Content Standards
Indicate below whether your state has made or is planning to make revisions to or change the State's academic content standards in mathematics, reading/language arts or science since the State's content standards were most recently approved through ED's peer review process for State assessment systems. If yes, indicate specifically in what school year your State implemented or will implement the revisions or changes.
Response OptionsNo revisions or changes to academic content standards in mathematics,reading/language arts or science made or planned.
State has revised or changed its academic content standards in mathematics, reading/language arts or science or is planning to make revisions to or change its academic content standards in mathematics, reading/language arts or science. Indicate below the year these changes were or will be implemented or "Not Applicable" to
State has revised or changed indicate that changes were not made or will not be made in the subject area. Acceptable responses are a school year (e.g., 2014-15) or Not Applicable.
Mathematics Reading/Language Arts Science Academic Content Standards SY 2014-15 SY 2014-15 SY 2016-17
If the responses above do not fully describe revisions or changes to your State's academic content standards, describe the revisions or changes below.
The response is limited to 1,000 characters. In school year 2014-15, West Virginia fully implemented the Next Generation Content Standards and Objectives in English language arts/literacy and mathematics. New Next Generation Content Standards for science go into effect July 1, 2016.

OMB NO. 1810-0724 Page 8
1.1.1.1 Academic Achievement Standards in Mathematics, Reading/Language Arts and Science
Indicate below whether your state has changed or is planning to change the State's academic achievement standards in mathematics, reading/language arts or science since the State's academic achievement standards were most recently approved through ED's peer review process for State assessment systems. If yes, indicate specifically in what school year your State implemented or will implement the changes.
As applicable, include changes to academic achievement standards based on any assessments (e.g., alternate assessments based on alternate achievement standards, alternate assessments based on modified achievement standards, native language assessments, or others) implemented to meet the assessment requirements under Section 1111(b)(3) of ESEA.
Response OptionsNo revisions or changes to academic achievement standards in mathematics,reading/language arts or science made or planned.
State has changed its academic achievement standards or is planning to change its academic achievement standards in mathematics, reading/language arts or science. Indicate below either the school year in which these changes were or will be implemented or "Not Applicable" to
State has revised or changed indicate that changes were not made or will not be made in the subject area. Acceptable responses are a school year (e.g., 2014-15) or Not Applicable. Academic Achievement Standards for Mathematics Reading/Language Arts Science Regular Assessments in Grades 3-8 SY 2014-15 SY 2014-15 SY 2017-18 Regular Assessments in High School SY 2014-15 SY 2014-15 SY 2017-18 Alternate Assessments Based on Grade-Level Achievement Standards (if applicable) N/A N/A N/A Alternate Assessments Based on Modified Achievement Standards (if applicable) N/A N/A N/A Alternate Assessments Based on Alternate Achievement Standards SY 2014-15 SY 2014-15 SY 2015-16
If the responses above do not fully describe revisions or changes to your State's academic achievement standards, describe the revisions or changes below.
The response is limited to 1,000 characters. In school year 2014-15, the academic achievement standards were changed for both West Virginia's regular and alternate English/language arts (ELA) and mathematics assessments in grades 3-8 and high school to correspond to the Next Generation Content Standards and Objectives, which were fully implemented in 2014-15. The academic achievement standards for the state's regular science assessment remained the same in 2014-15 but will change in 2017-18 when a new regular science assessment aligned to the new Next Generation Science Standards becomes operational. The academic achievement standards for the state's alternate science assessment remained the same in 2014-15 but will change in 2015-16 when a new alternate science assessment becomes operational.
OMB NO. 1810-0724 Page 9
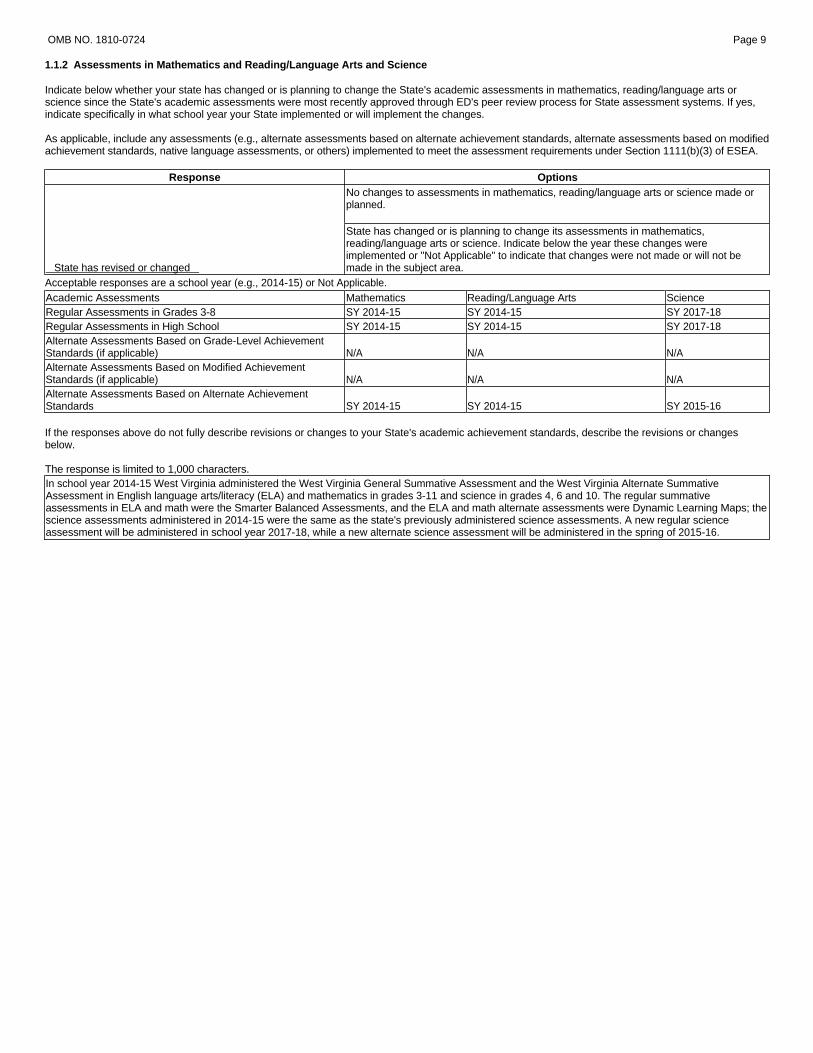
1.1.2 Assessments in Mathematics and Reading/Language Arts and Science
Indicate below whether your state has changed or is planning to change the State's academic assessments in mathematics, reading/language arts or science since the State's academic assessments were most recently approved through ED's peer review process for State assessment systems. If yes, indicate specifically in what school year your State implemented or will implement the changes.
As applicable, include any assessments (e.g., alternate assessments based on alternate achievement standards, alternate assessments based on modified achievement standards, native language assessments, or others) implemented to meet the assessment requirements under Section 1111(b)(3) of ESEA.
Response OptionsNo changes to assessments in mathematics, reading/language arts or science made or planned.
State has changed or is planning to change its assessments in mathematics, reading/language arts or science. Indicate below the year these changes were implemented or "Not Applicable" to indicate that changes were not made or will not be
State has revised or changed made in the subject area. Acceptable responses are a school year (e.g., 2014-15) or Not Applicable. Academic Assessments Mathematics Reading/Language Arts Science Regular Assessments in Grades 3-8 SY 2014-15 SY 2014-15 SY 2017-18 Regular Assessments in High School SY 2014-15 SY 2014-15 SY 2017-18 Alternate Assessments Based on Grade-Level Achievement Standards (if applicable) N/A N/A N/A Alternate Assessments Based on Modified Achievement Standards (if applicable) N/A N/A N/A Alternate Assessments Based on Alternate Achievement Standards SY 2014-15 SY 2014-15 SY 2015-16
If the responses above do not fully describe revisions or changes to your State's academic achievement standards, describe the revisions or changes below.
The response is limited to 1,000 characters. In school year 2014-15 West Virginia administered the West Virginia General Summative Assessment and the West Virginia Alternate Summative Assessment in English language arts/literacy (ELA) and mathematics in grades 3-11 and science in grades 4, 6 and 10. The regular summative assessments in ELA and math were the Smarter Balanced Assessments, and the ELA and math alternate assessments were Dynamic Learning Maps; the science assessments administered in 2014-15 were the same as the state's previously administered science assessments. A new regular science assessment will be administered in school year 2017-18, while a new alternate science assessment will be administered in the spring of 2015-16.
OMB NO. 1810-0724 Page 10
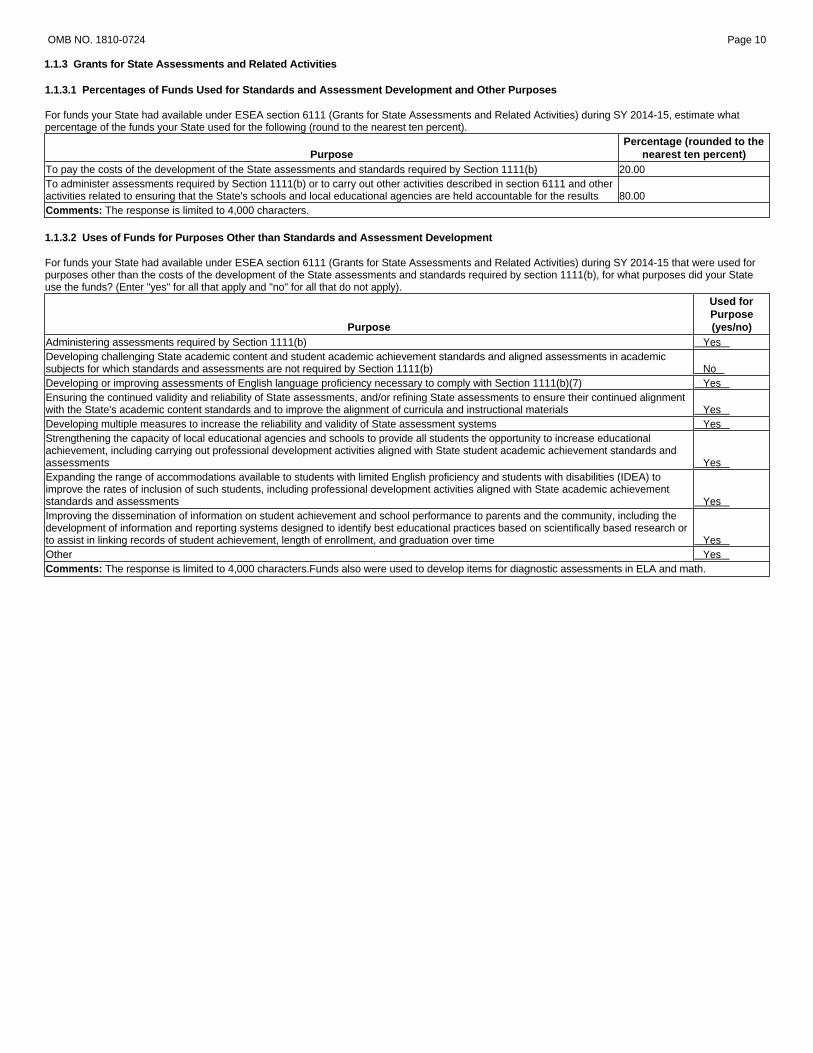
1.1.3 Grants for State Assessments and Related Activities
1.1.3.1 Percentages of Funds Used for Standards and Assessment Development and Other Purposes
For funds your State had available under ESEA section 6111 (Grants for State Assessments and Related Activities) during SY 2014-15, estimate what percentage of the funds your State used for the following (round to the nearest ten percent).
Percentage (rounded to the Purpose nearest ten percent)
To pay the costs of the development of the State assessments and standards required by Section 1111(b) 20.00 To administer assessments required by Section 1111(b) or to carry out other activities described in section 6111 and other activities related to ensuring that the State's schools and local educational agencies are held accountable for the results 80.00 Comments: The response is limited to 4,000 characters.
1.1.3.2 Uses of Funds for Purposes Other than Standards and Assessment Development
For funds your State had available under ESEA section 6111 (Grants for State Assessments and Related Activities) during SY 2014-15 that were used for purposes other than the costs of the development of the State assessments and standards required by section 1111(b), for what purposes did your State use the funds? (Enter "yes" for all that apply and "no" for all that do not apply).
Purpose
Used for Purpose (yes/no)
Administering assessments required by Section 1111(b) Yes Developing challenging State academic content and student academic achievement standards and aligned assessments in academic subjects for which standards and assessments are not required by Section 1111(b) No Developing or improving assessments of English language proficiency necessary to comply with Section 1111(b)(7) Yes Ensuring the continued validity and reliability of State assessments, and/or refining State assessments to ensure their continued alignment with the State's academic content standards and to improve the alignment of curricula and instructional materials Yes Developing multiple measures to increase the reliability and validity of State assessment systems Yes Strengthening the capacity of local educational agencies and schools to provide all students the opportunity to increase educational achievement, including carrying out professional development activities aligned with State student academic achievement standards and assessments Yes Expanding the range of accommodations available to students with limited English proficiency and students with disabilities (IDEA) to improve the rates of inclusion of such students, including professional development activities aligned with State academic achievement standards and assessments Yes Improving the dissemination of information on student achievement and school performance to parents and the community, including the development of information and reporting systems designed to identify best educational practices based on scientifically based research or to assist in linking records of student achievement, length of enrollment, and graduation over time Yes Other Yes Comments: The response is limited to 4,000 characters. Funds also were used to develop items for diagnostic assessments in ELA and math.
OMB NO. 1810-0724 Page 11
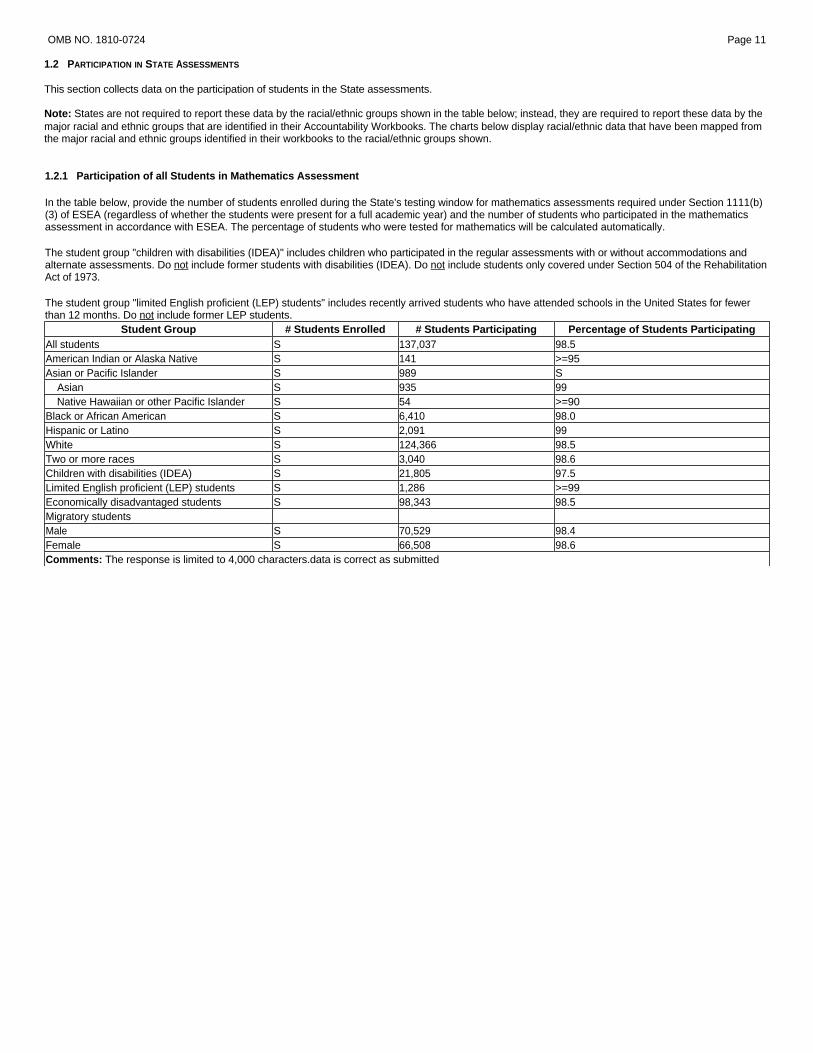
1.2 PARTICIPATION IN STATE ASSESSMENTS
This section collects data on the participation of students in the State assessments.
Note: States are not required to report these data by the racial/ethnic groups shown in the table below; instead, they are required to report these data by the major racial and ethnic groups that are identified in their Accountability Workbooks. The charts below display racial/ethnic data that have been mapped from the major racial and ethnic groups identified in their workbooks to the racial/ethnic groups shown.
1.2.1 Participation of all Students in Mathematics Assessment
In the table below, provide the number of students enrolled during the State's testing window for mathematics assessments required under Section 1111(b) (3) of ESEA (regardless of whether the students were present for a full academic year) and the number of students who participated in the mathematics assessment in accordance with ESEA. The percentage of students who were tested for mathematics will be calculated automatically.
The student group "children with disabilities (IDEA)" includes children who participated in the regular assessments with or without accommodations and alternate assessments. Do not include former students with disabilities (IDEA). Do not include students only covered under Section 504 of the Rehabilitation Act of 1973.
The student group "limited English proficient (LEP) students" includes recently arrived students who have attended schools in the United States for fewer than 12 months. Do not include former LEP students.
Student Group # Students Enrolled # Students Participating Percentage of Students Participating 98.5 >=95 S 99 >=90 98.0 99 98.5 98.6 97.5 >=99 98.5
98.4 98.6
All students S 137,037 American Indian or Alaska Native S 141 Asian or Pacific Islander S 989
Asian S 935 Native Hawaiian or other Pacific Islander S 54
Black or African American S 6,410 Hispanic or Latino S 2,091 White S 124,366 Two or more races S 3,040 Children with disabilities (IDEA) S 21,805 Limited English proficient (LEP) students S 1,286 Economically disadvantaged students S 98,343 Migratory students Male S 70,529 Female S 66,508 Comments: The response is limited to 4,000 characters. data is correct as submitted
OMB NO. 1810-0724 Page 12
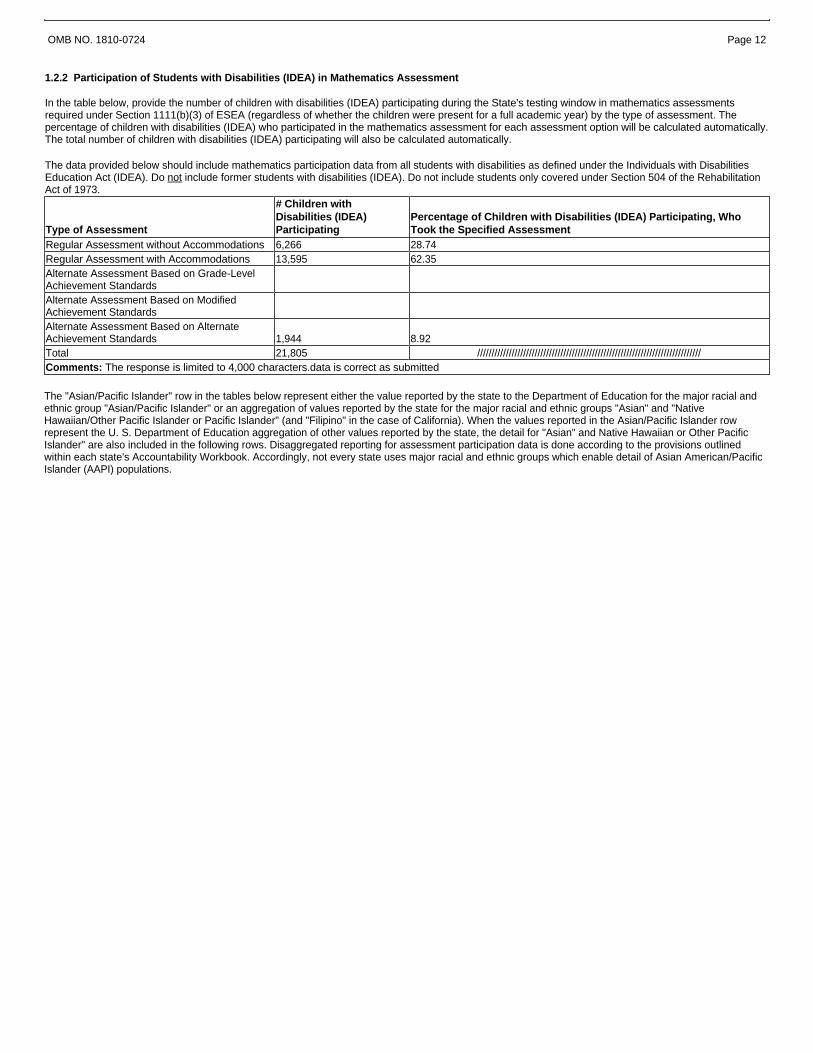
1.2.2 Participation of Students with Disabilities (IDEA) in Mathematics Assessment
In the table below, provide the number of children with disabilities (IDEA) participating during the State's testing window in mathematics assessments required under Section 1111(b)(3) of ESEA (regardless of whether the children were present for a full academic year) by the type of assessment. The percentage of children with disabilities (IDEA) who participated in the mathematics assessment for each assessment option will be calculated automatically. The total number of children with disabilities (IDEA) participating will also be calculated automatically.
The data provided below should include mathematics participation data from all students with disabilities as defined under the Individuals with Disabilities Education Act (IDEA). Do not include former students with disabilities (IDEA). Do not include students only covered under Section 504 of the Rehabilitation Act of 1973.
Type of Assessment
# Children with Disabilities (IDEA) Participating
Percentage of Children with Disabilities (IDEA) Participating, Who Took the Specified Assessment
Regular Assessment without Accommodations 6,266 28.74 Regular Assessment with Accommodations 13,595 62.35 Alternate Assessment Based on Grade-Level Achievement Standards Alternate Assessment Based on Modified Achievement Standards Alternate Assessment Based on Alternate Achievement Standards 1,944 8.92 Total 21,805 ////////////////////////////////////////////////////////////////////////////// Comments: The response is limited to 4,000 characters. data is correct as submitted
The "Asian/Pacific Islander" row in the tables below represent either the value reported by the state to the Department of Education for the major racial and ethnic group "Asian/Pacific Islander" or an aggregation of values reported by the state for the major racial and ethnic groups "Asian" and "Native Hawaiian/Other Pacific Islander or Pacific Islander" (and "Filipino" in the case of California). When the values reported in the Asian/Pacific Islander row represent the U. S. Department of Education aggregation of other values reported by the state, the detail for "Asian" and Native Hawaiian or Other Pacific Islander" are also included in the following rows. Disaggregated reporting for assessment participation data is done according to the provisions outlined within each state's Accountability Workbook. Accordingly, not every state uses major racial and ethnic groups which enable detail of Asian American/Pacific Islander (AAPI) populations.
OMB NO. 1810-0724 Page 13
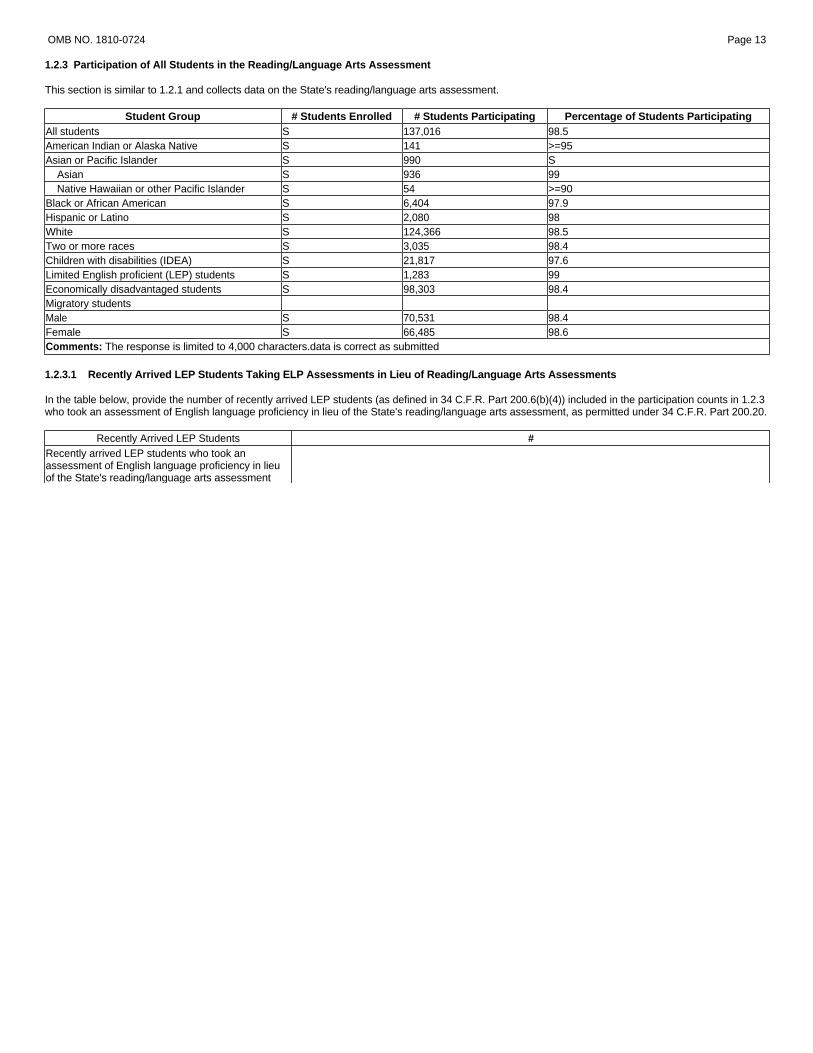
1.2.3 Participation of All Students in the Reading/Language Arts Assessment
This section is similar to 1.2.1 and collects data on the State's reading/language arts assessment.
Student Group # Students Enrolled # Students Participating Percentage of Students Participating 98.5 >=95 S 99 >=90 97.9 98 98.5 98.4 97.6 99 98.4
98.4 98.6
All students S 137,016 American Indian or Alaska Native S 141 Asian or Pacific Islander S 990
Asian S 936 Native Hawaiian or other Pacific Islander S 54
Black or African American S 6,404 Hispanic or Latino S 2,080 White S 124,366 Two or more races S 3,035 Children with disabilities (IDEA) S 21,817 Limited English proficient (LEP) students S 1,283 Economically disadvantaged students S 98,303 Migratory students Male S 70,531 Female S 66,485 Comments: The response is limited to 4,000 characters. data is correct as submitted
1.2.3.1 Recently Arrived LEP Students Taking ELP Assessments in Lieu of Reading/Language Arts Assessments
In the table below, provide the number of recently arrived LEP students (as defined in 34 C.F.R. Part 200.6(b)(4)) included in the participation counts in 1.2.3 who took an assessment of English language proficiency in lieu of the State's reading/language arts assessment, as permitted under 34 C.F.R. Part 200.20.
Recently Arrived LEP Students # Recently arrived LEP students who took an assessment of English language proficiency in lieu of the State's reading/language arts assessment

OMB NO. 1810-0724 Page 14
1.2.4 Participation of Students with Disabilities (IDEA) in Reading/Language Arts Assessment
This section is similar to 1.2.2 and collects data on the State's reading/language arts assessment.
The data provided should include reading/language arts participation data from all students with disabilities as defined under the Individuals with Disabilities Education Act (IDEA). Do not include former students with disabilities (IDEA). Do not include students only covered under Section 504 of the Rehabilitation Act of 1973. Note: For this question only, report on students with disabilities (IDEA) who are also LEP students in the U.S. less than 12 months who took the ELP in lieu of the statewide reading/language arts assessment.
Type of Assessment
# Children with Disabilities (IDEA) Participating
Percentage of Children with Disabilities (IDEA) Participating, Who Took the Specified Assessment
Regular Assessment without Accommodations 6,268 28.73 Regular Assessment with Accommodations 13,606 62.36 Alternate Assessment Based on Grade-Level Achievement Standards Alternate Assessment Based on Modified Achievement Standards Alternate Assessment Based on Alternate Achievement Standards 1,943 8.91 LEP < 12 months, took ELP Total 21,817 ////////////////////////////////////////////////////////////////////////////// Comments: The response is limited to 4,000 characters. data is correct as submitted
OMB NO. 1810-0724 Page 15
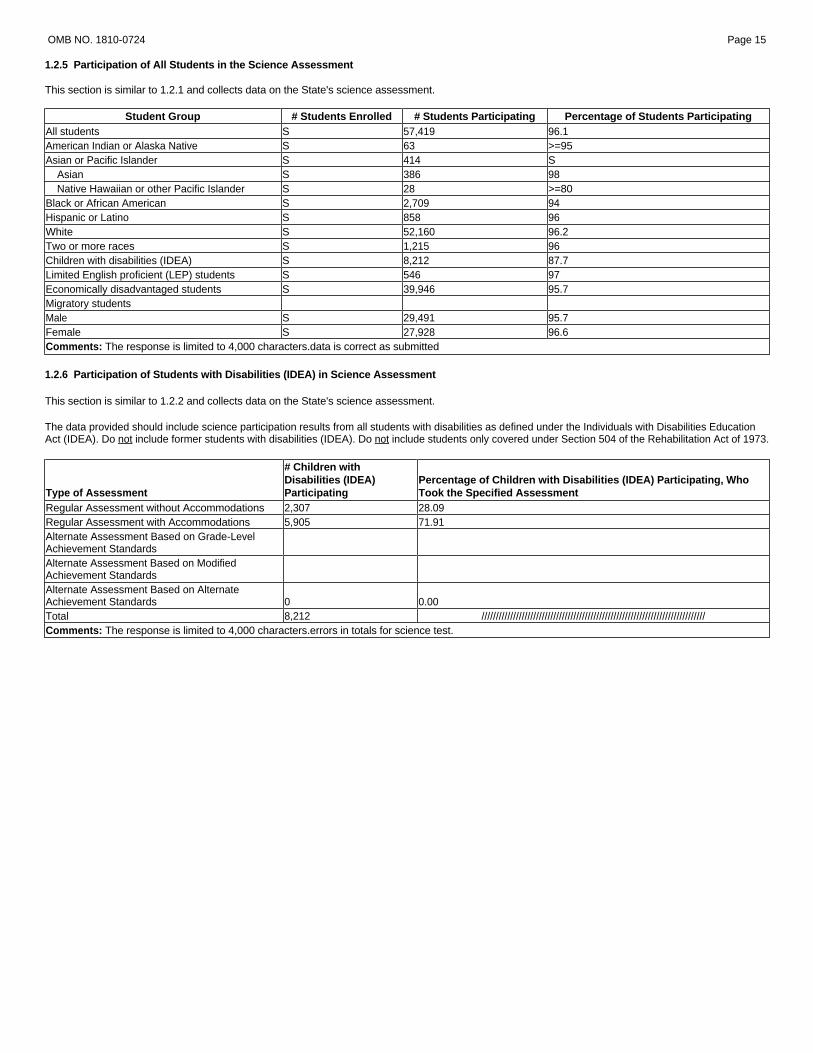
1.2.5 Participation of All Students in the Science Assessment
This section is similar to 1.2.1 and collects data on the State's science assessment.
Student Group # Students Enrolled # Students Participating Percentage of Students Participating 96.1 >=95 S 98 >=80 94 96 96.2 96 87.7 97 95.7
95.7 96.6
All students S 57,419 American Indian or Alaska Native S 63 Asian or Pacific Islander S 414
Asian S 386 Native Hawaiian or other Pacific Islander S 28
Black or African American S 2,709 Hispanic or Latino S 858 White S 52,160 Two or more races S 1,215 Children with disabilities (IDEA) S 8,212 Limited English proficient (LEP) students S 546 Economically disadvantaged students S 39,946 Migratory students Male S 29,491 Female S 27,928 Comments: The response is limited to 4,000 characters. data is correct as submitted
1.2.6 Participation of Students with Disabilities (IDEA) in Science Assessment
This section is similar to 1.2.2 and collects data on the State's science assessment.
The data provided should include science participation results from all students with disabilities as defined under the Individuals with Disabilities Education Act (IDEA). Do not include former students with disabilities (IDEA). Do not include students only covered under Section 504 of the Rehabilitation Act of 1973.
Type of Assessment
# Children with Disabilities (IDEA) Participating
Percentage of Children with Disabilities (IDEA) Participating, Who Took the Specified Assessment
Regular Assessment without Accommodations 2,307 28.09 Regular Assessment with Accommodations 5,905 71.91 Alternate Assessment Based on Grade-Level Achievement Standards Alternate Assessment Based on Modified Achievement Standards Alternate Assessment Based on Alternate Achievement Standards 0 0.00 Total 8,212 ////////////////////////////////////////////////////////////////////////////// Comments: The response is limited to 4,000 characters. errors in totals for science test.
OMB NO. 1810-0724 Page 16
1.3 STUDENT ACADEMIC ACHIEVEMENT
This section collects data on student academic achievement on the State assessments.
Note: States are not required to report these data by the racial/ethnic groups shown in the table below; instead, they are required to report these data by the major racial and ethnic groups that are identified in their Accountability Workbooks. The charts below display racial/ethnic data that have been mapped from the major racial and ethnic groups identified in their workbooks to the racial/ethnic groups shown.
1.3.1 Student Academic Achievement in Mathematics
In the format of the table below, provide the number of students who received a valid score on the State assessment(s) in mathematics implemented to meet the requirements of Section 1111(b)(3) of ESEA (regardless of whether the students were present for a full academic year) and for whom a proficiency level was assigned, and the number of these students who scored at or above proficient, in grades 3 through 8 and high school. The percentage of students who scored at or above proficient is calculated automatically.
The student group "children with disabilities (IDEA)" includes children who participated, and for whom a proficiency level was assigned in the regular assessments with or without accommodations and alternate assessments. Do not include former students with disabilities (IDEA). The student group "limited English proficient (LEP) students" does include recently arrived students who have attended schools in the United States for fewer than 12 months. Do not include former LEP students.
1.3.2 Student Academic Achievement in Reading/Language Arts
This section is similar to 1.3.1. The only difference is that this section collects data on the State's reading/language arts assessment, and the difference noted in the paragraph below.
The student group "limited English proficient (LEP) students" does not include recently arrived students who have attended schools in the United States for fewer than 12 months and who took an assessment of English language proficiency in lieu of the State's reading/language arts assesment. Do not include former LEP students.
1.3.3 Student Academic Achievement in Science
This section is similar to 1.3.1. The only difference is that this section collects data on the State's science assessment administered at least once in each of the following grade spans: 3 through 5, 6 through 9, and 10 through 12.
Limited English Proficient (LEP) students include recently arrived students who have attended schools in the United States for fewer than 12 months. Do not include former LEP students.
The "Asian/Pacific Islander" row in the tables below represent either the value reported by the state to the Department of Education for the major racial and ethnic group "Asian/Pacific Islander" or an aggregation of values reported by the state for the major racial and ethnic groups "Asian" and "Native Hawaiian/Other Pacific Islander or Pacific Islander" (and "Filipino" in the case of California). When the values reported in the Asian/Pacific Islander row represent the U. S. Department of Education aggregation of other values reported by the state, the detail for "Asian" and Native Hawaiian or Other Pacific Islander" are also included in the following rows. Disaggregated reporting for assessment participation data is done according to the provisions outlined within each state's Accountability Workbook. Accordingly, not every state uses major racial and ethnic groups which enable detail of Asian American/Pacific Islander (AAPI) populations.

OMB NO. 1810-0724 Page 17
1.3.1.1 Student Academic Achievement in Mathematics - Grade 3
Grade 3
# Students Who Received a Valid Score and for Whom a Proficiency
Level Was Assigned
# Students Scoring at or
Above Proficient
Percentage of Students
Scoring at or Above Proficient
43.7 <=20 S 80 S 29 35 44.5 38 21.0 47 39.5
43.7 43.7
All students 19,746 S American Indian or Alaska Native 20 S Asian or Pacific Islander 148 S
Asian 131 S Native Hawaiian or other Pacific Islander 17 S
Black or African American 866 S Hispanic or Latino 326 S White 17,722 S Two or more races 664 S Children with disabilities (IDEA) 3,997 S Limited English proficient (LEP) students 206 S Economically disadvantaged students 15,834 S Migratory students Male 10,222 S Female 9,524 S Comments: The response is limited to 4,000 characters. data is correct as submitted
1.3.2.1 Student Academic Achievement in Reading/Language Arts - Grade 3
Grade 3
# Students Who Received a Valid Score and for Whom a Proficiency
Level Was Assigned
# Students Scoring at or
Above Proficient
Percentage of Students
Scoring at or Above Proficient
45.6 35 68 68 65 33 40 46.3 42 19.6 45 41.3
40.6 51.0
All students 19,744 S American Indian or Alaska Native 20 S Asian or Pacific Islander 148 S
Asian 131 S Native Hawaiian or other Pacific Islander 17 S
Black or African American 864 S Hispanic or Latino 325 S White 17,723 S Two or more races 664 S Children with disabilities (IDEA) 3,998 S Limited English proficient (LEP) students 205 S Economically disadvantaged students 15,830 S Migratory students Male 10,224 S Female 9,520 S Comments: The response is limited to 4,000 characters. data is correct as submitted

OMB NO. 1810-0724 Page 18
1.3.3.1 Student Academic Achievement in Science - Grade 3
Grade 3
# Students Who Received a Valid Score and for Whom a Proficiency
Level Was Assigned
# Students Scoring at or
Above Proficient
Percentage of Students
Scoring at or Above Proficient
All students 0 American Indian or Alaska Native 0 Asian or Pacific Islander 0
Asian 0 Native Hawaiian or other Pacific Islander 0
Black or African American 0 Hispanic or Latino 0 White 0 Two or more races 0 Children with disabilities (IDEA) 0 Limited English proficient (LEP) students 0 Economically disadvantaged students 0 Migratory students Male 0 Female 0 Comments: The response is limited to 4,000 characters. WV does not test science in 3rd grade

OMB NO. 1810-0724 Page 19
1.3.1.2 Student Academic Achievement in Mathematics - Grade 4
Grade 4
# Students Who Received a Valid Score and for Whom a Proficiency
Level Was Assigned
# Students Scoring at or
Above Proficient
Percentage of Students
Scoring at or Above Proficient
35.5 <=20 S 71 <50 22 24 36.5 27 15.1 31 31.2
36.0 35.0
All students 19,932 S American Indian or Alaska Native 22 S Asian or Pacific Islander 138 S
Asian 126 S Native Hawaiian or other Pacific Islander 12 S
Black or African American 867 S Hispanic or Latino 352 S White 17,969 S Two or more races 584 S Children with disabilities (IDEA) 3,762 S Limited English proficient (LEP) students 231 S Economically disadvantaged students 15,778 S Migratory students Male 10,439 S Female 9,493 S Comments: The response is limited to 4,000 characters. data is correct as submitted
1.3.2.2 Student Academic Achievement in Reading/Language Arts - Grade 4
Grade 4
# Students Who Received a Valid Score and for Whom a Proficiency
Level Was Assigned
# Students Scoring at or
Above Proficient
Percentage of Students
Scoring at or Above Proficient
45.0 45 71 S >=50 33 38 45.6 42 17.1 37 40.7
40.2 50.3
All students 19,932 S American Indian or Alaska Native 22 S Asian or Pacific Islander 138 S
Asian 126 S Native Hawaiian or other Pacific Islander 12 S
Black or African American 869 S Hispanic or Latino 350 S White 17,969 S Two or more races 584 S Children with disabilities (IDEA) 3,760 S Limited English proficient (LEP) students 230 S Economically disadvantaged students 15,779 S Migratory students Male 10,444 S Female 9,488 S Comments: The response is limited to 4,000 characters. data is correct as submitted
OMB NO. 1810-0724 Page 20
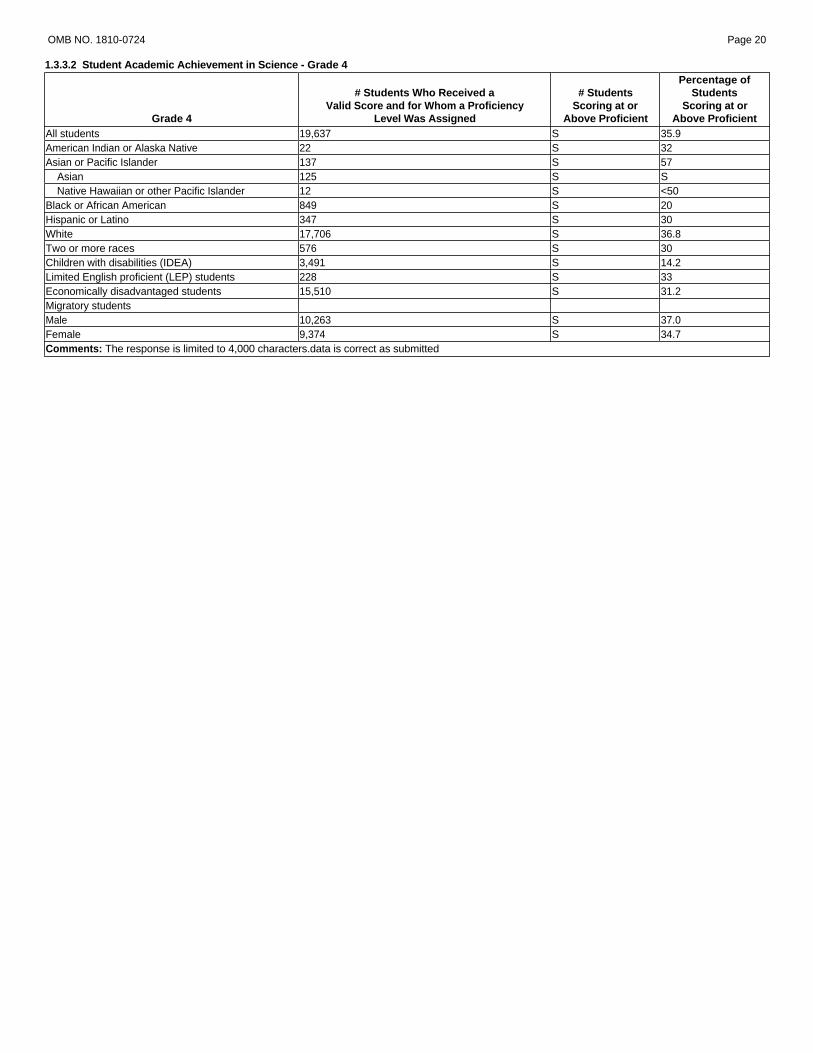
1.3.3.2 Student Academic Achievement in Science - Grade 4
Grade 4
# Students Who Received a Valid Score and for Whom a Proficiency
Level Was Assigned
# Students Scoring at or
Above Proficient
Percentage of Students
Scoring at or Above Proficient
35.9 32 57 S <50 20 30 36.8 30 14.2 33 31.2
37.0 34.7
All students 19,637 S American Indian or Alaska Native 22 S Asian or Pacific Islander 137 S
Asian 125 S Native Hawaiian or other Pacific Islander 12 S
Black or African American 849 S Hispanic or Latino 347 S White 17,706 S Two or more races 576 S Children with disabilities (IDEA) 3,491 S Limited English proficient (LEP) students 228 S Economically disadvantaged students 15,510 S Migratory students Male 10,263 S Female 9,374 S Comments: The response is limited to 4,000 characters. data is correct as submitted
OMB NO. 1810-0724 Page 21
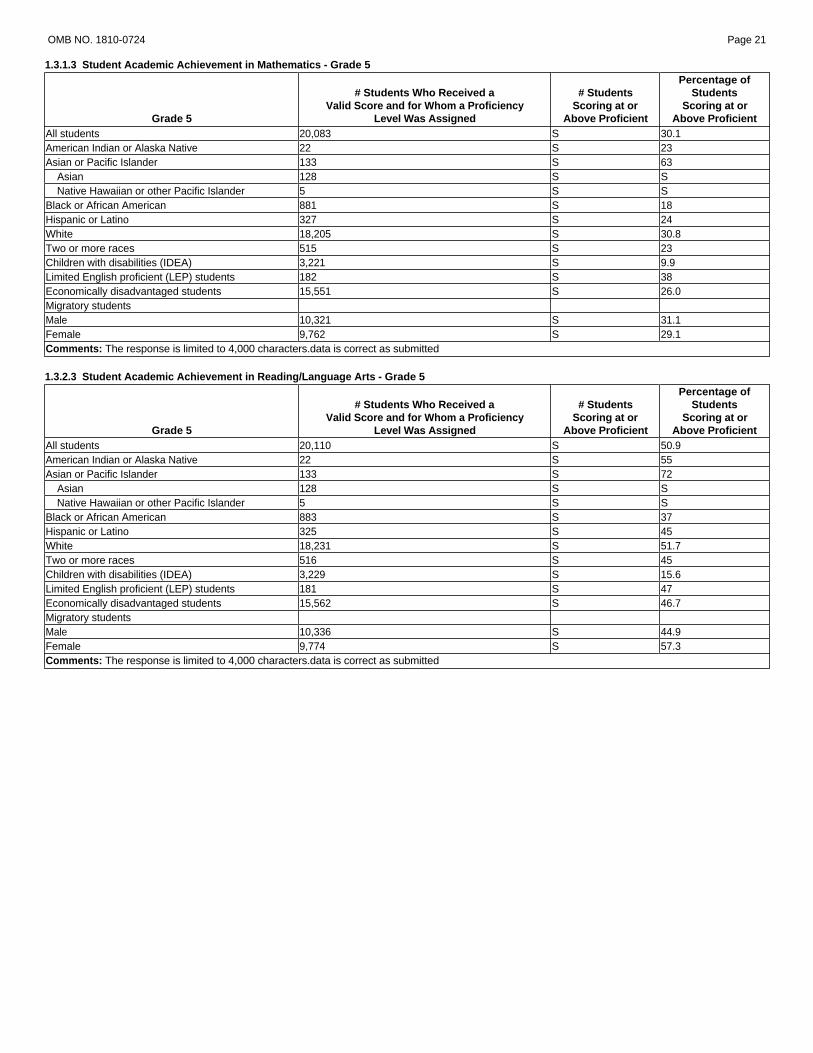
1.3.1.3 Student Academic Achievement in Mathematics - Grade 5
Grade 5
# Students Who Received a Valid Score and for Whom a Proficiency
Level Was Assigned
# Students Scoring at or
Above Proficient
Percentage of Students
Scoring at or Above Proficient
30.1 23 63 S S 18 24 30.8 23 9.9 38 26.0
31.1 29.1
All students 20,083 S American Indian or Alaska Native 22 S Asian or Pacific Islander 133 S
Asian 128 S Native Hawaiian or other Pacific Islander 5 S
Black or African American 881 S Hispanic or Latino 327 S White 18,205 S Two or more races 515 S Children with disabilities (IDEA) 3,221 S Limited English proficient (LEP) students 182 S Economically disadvantaged students 15,551 S Migratory students Male 10,321 S Female 9,762 S Comments: The response is limited to 4,000 characters. data is correct as submitted
1.3.2.3 Student Academic Achievement in Reading/Language Arts - Grade 5
Grade 5
# Students Who Received a Valid Score and for Whom a Proficiency
Level Was Assigned
# Students Scoring at or
Above Proficient
Percentage of Students
Scoring at or Above Proficient
50.9 55 72 S S 37 45 51.7 45 15.6 47 46.7
44.9 57.3
All students 20,110 S American Indian or Alaska Native 22 S Asian or Pacific Islander 133 S
Asian 128 S Native Hawaiian or other Pacific Islander 5 S
Black or African American 883 S Hispanic or Latino 325 S White 18,231 S Two or more races 516 S Children with disabilities (IDEA) 3,229 S Limited English proficient (LEP) students 181 S Economically disadvantaged students 15,562 S Migratory students Male 10,336 S Female 9,774 S Comments: The response is limited to 4,000 characters. data is correct as submitted

OMB NO. 1810-0724 Page 22
1.3.3.3 Student Academic Achievement in Science - Grade 5
Grade 5
# Students Who Received a Valid Score and for Whom a Proficiency
Level Was Assigned
# Students Scoring at or
Above Proficient All students American Indian or Alaska Native Asian or Pacific Islander
Asian Native Hawaiian or other Pacific Islander
Black or African American Hispanic or Latino White Two or more races Children with disabilities (IDEA) Limited English proficient (LEP) students Economically disadvantaged students Migratory students Male Female Comments: The response is limited to 4,000 characters. student reported is in error WV does not test students in science in grade 5
Percentage of Students
Scoring at or Above Proficient

OMB NO. 1810-0724 Page 23
1.3.1.4 Student Academic Achievement in Mathematics - Grade 6
Grade 6
# Students Who Received a Valid Score and for Whom a Proficiency
Level Was Assigned
# Students Scoring at or
Above Proficient
Percentage of Students
Scoring at or Above Proficient
26.0 29 59 S <50 14 22 26.5 22 8 21 20.3
25.2 26.8
All students 19,852 S American Indian or Alaska Native 17 S Asian or Pacific Islander 143 S
Asian 135 S Native Hawaiian or other Pacific Islander 8 S
Black or African American 950 S Hispanic or Latino 283 S White 18,021 S Two or more races 438 S Children with disabilities (IDEA) 2,959 S Limited English proficient (LEP) students 181 S Economically disadvantaged students 13,997 S Migratory students Male 10,244 S Female 9,608 S Comments: The response is limited to 4,000 characters. data is correct as submitted
1.3.2.4 Student Academic Achievement in Reading/Language Arts - Grade 6
Grade 6
# Students Who Received a Valid Score and for Whom a Proficiency
Level Was Assigned
# Students Scoring at or
Above Proficient
Percentage of Students
Scoring at or Above Proficient
43.1 35 69 S >=50 29 45 43.7 40 13 33 36.2
36.6 50.1
All students 19,843 S American Indian or Alaska Native 17 S Asian or Pacific Islander 143 S
Asian 135 S Native Hawaiian or other Pacific Islander 8 S
Black or African American 955 S Hispanic or Latino 280 S White 18,014 S Two or more races 434 S Children with disabilities (IDEA) 2,959 S Limited English proficient (LEP) students 181 S Economically disadvantaged students 13,994 S Migratory students Male 10,239 S Female 9,604 S Comments: The response is limited to 4,000 characters. data is correct as submitted

OMB NO. 1810-0724 Page 24
1.3.3.4 Student Academic Achievement in Science - Grade 6
Grade 6
# Students Who Received a Valid Score and for Whom a Proficiency
Level Was Assigned
# Students Scoring at or
Above Proficient
Percentage of Students
Scoring at or Above Proficient
39.4 35 62 S >=50 21 37 40.3 34 9 29 32.5
39.8 38.9
All students 19,517 S American Indian or Alaska Native 17 S Asian or Pacific Islander 141 S
Asian 133 S Native Hawaiian or other Pacific Islander 8 S
Black or African American 925 S Hispanic or Latino 279 S White 17,721 S Two or more races 434 S Children with disabilities (IDEA) 2,660 S Limited English proficient (LEP) students 178 S Economically disadvantaged students 13,719 S Migratory students Male 10,015 S Female 9,502 S Comments: The response is limited to 4,000 characters. data is correct as submitted

OMB NO. 1810-0724 Page 25
1.3.1.5 Student Academic Achievement in Mathematics - Grade 7
Grade 7
# Students Who Received a Valid Score and for Whom a Proficiency
Level Was Assigned
# Students Scoring at or
Above Proficient
Percentage of Students
Scoring at or Above Proficient
25.6 <=20 S 63 S 16 17 26.0 21 7 30 19.4
25.6 25.5
All students 20,241 S American Indian or Alaska Native 20 S Asian or Pacific Islander 142 S
Asian 138 S Native Hawaiian or other Pacific Islander 4 S
Black or African American 994 S Hispanic or Latino 285 S White 18,462 S Two or more races 338 S Children with disabilities (IDEA) 2,949 S Limited English proficient (LEP) students 179 S Economically disadvantaged students 13,926 S Migratory students Male 10,486 S Female 9,755 S Comments: The response is limited to 4,000 characters. data is correct as submitted
1.3.2.5 Student Academic Achievement in Reading/Language Arts - Grade 7
Grade 7
# Students Who Received a Valid Score and for Whom a Proficiency
Level Was Assigned
# Students Scoring at or
Above Proficient
Percentage of Students
Scoring at or Above Proficient
45.0 50 77 S S 32 36 45.6 40 14 45 38.0
38.1 52.3
All students 20,232 S American Indian or Alaska Native 20 S Asian or Pacific Islander 143 S
Asian 139 S Native Hawaiian or other Pacific Islander 4 S
Black or African American 991 S Hispanic or Latino 285 S White 18,456 S Two or more races 337 S Children with disabilities (IDEA) 2,948 S Limited English proficient (LEP) students 179 S Economically disadvantaged students 13,917 S Migratory students Male 10,478 S Female 9,754 S Comments: The response is limited to 4,000 characters. data is correct as submitted
OMB NO. 1810-0724 Page 26
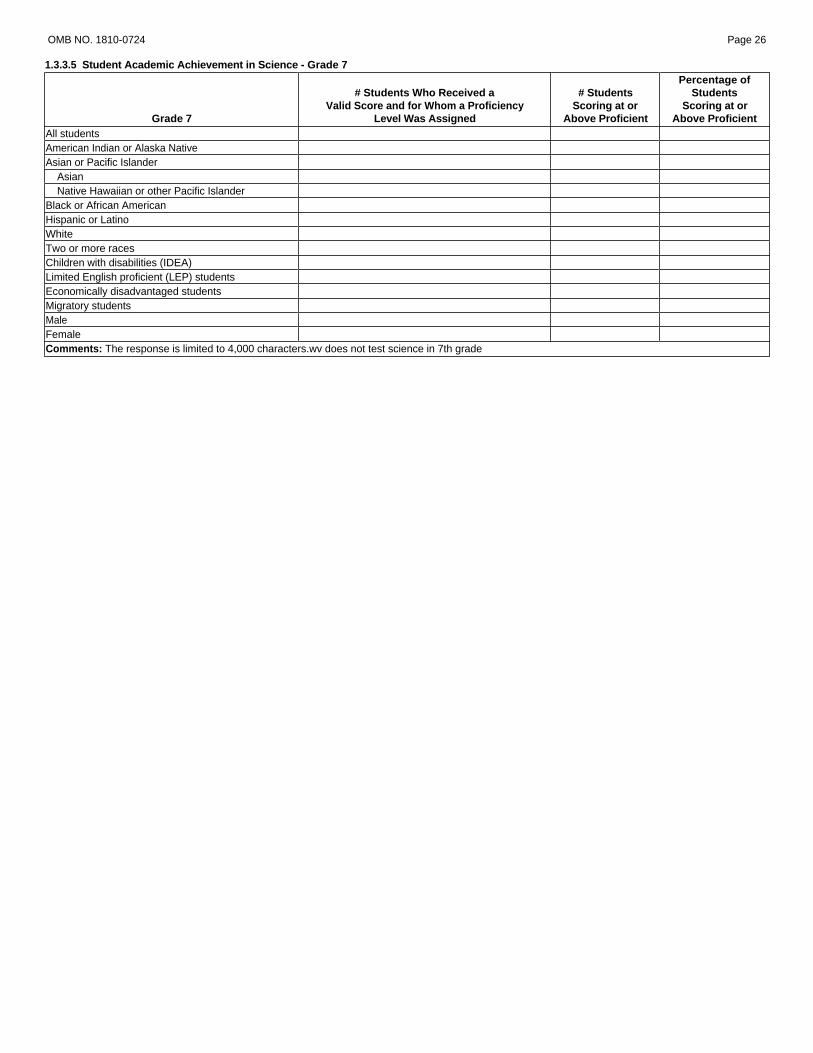
1.3.3.5 Student Academic Achievement in Science - Grade 7
Grade 7
# Students Who Received a Valid Score and for Whom a Proficiency
Level Was Assigned
# Students Scoring at or
Above Proficient
Percentage of Students
Scoring at or Above Proficient
All students American Indian or Alaska Native Asian or Pacific Islander
Asian Native Hawaiian or other Pacific Islander
Black or African American Hispanic or Latino White Two or more races Children with disabilities (IDEA) Limited English proficient (LEP) students Economically disadvantaged students Migratory students Male Female Comments: The response is limited to 4,000 characters. wv does not test science in 7th grade

OMB NO. 1810-0724 Page 27
1.3.1.6 Student Academic Achievement in Mathematics - Grade 8
Grade 8
# Students Who Received a Valid Score and for Whom a Proficiency
Level Was Assigned
# Students Scoring at or
Above Proficient
Percentage of Students
Scoring at or Above Proficient
24.9 <=20 S 60 S 14 24 25.4 20 7 24 18.0
23.9 26.0
All students 20,106 S American Indian or Alaska Native 18 S Asian or Pacific Islander 136 S
Asian 132 S Native Hawaiian or other Pacific Islander 4 S
Black or African American 1,017 S Hispanic or Latino 302 S White 18,300 S Two or more races 333 S Children with disabilities (IDEA) 2,830 S Limited English proficient (LEP) students 177 S Economically disadvantaged students 13,576 S Migratory students Male 10,300 S Female 9,806 S Comments: The response is limited to 4,000 characters. data is correct as submitted
1.3.2.6 Student Academic Achievement in Reading/Language Arts - Grade 8
Grade 8
# Students Who Received a Valid Score and for Whom a Proficiency
Level Was Assigned
# Students Scoring at or
Above Proficient
Percentage of Students
Scoring at or Above Proficient
43.5 22 68 S S 31 49 44.0 41 14 41 36.4
35.7 51.7
All students 20,069 S American Indian or Alaska Native 18 S Asian or Pacific Islander 136 S
Asian 132 S Native Hawaiian or other Pacific Islander 4 S
Black or African American 1,007 S Hispanic or Latino 300 S White 18,277 S Two or more races 331 S Children with disabilities (IDEA) 2,826 S Limited English proficient (LEP) students 177 S Economically disadvantaged students 13,540 S Migratory students Male 10,287 S Female 9,782 S Comments: The response is limited to 4,000 characters. data is correct as submitted

OMB NO. 1810-0724 Page 28
1.3.3.6 Student Academic Achievement in Science - Grade 8
Grade 8
# Students Who Received a Valid Score and for Whom a Proficiency
Level Was Assigned
# Students Scoring at or
Above Proficient
Percentage of Students
Scoring at or Above Proficient
All students American Indian or Alaska Native Asian or Pacific Islander
Asian Native Hawaiian or other Pacific Islander
Black or African American Hispanic or Latino White Two or more races Children with disabilities (IDEA) Limited English proficient (LEP) students Economically disadvantaged students Migratory students Male Female Comments: The response is limited to 4,000 characters. data is correct as submitted

OMB NO. 1810-0724 Page 29
1.3.1.7 Student Academic Achievement in Mathematics - High School
High School
# Students Who Received a Valid Score and for Whom a Proficiency
Level Was Assigned
# Students Scoring at or
Above Proficient
Percentage of Students
Scoring at or Above Proficient
19.6 27 59 S S 12 18 19.8 10 3 22 12.3
18.9 20.3
All students 17,077 S American Indian or Alaska Native 22 S Asian or Pacific Islander 149 S
Asian 145 S Native Hawaiian or other Pacific Islander 4 S
Black or African American 835 S Hispanic or Latino 216 S White 15,687 S Two or more races 168 S Children with disabilities (IDEA) 2,087 S Limited English proficient (LEP) students 130 S Economically disadvantaged students 9,681 S Migratory students Male 8,517 S Female 8,560 S Comments: The response is limited to 4,000 characters. data is correct as submitted
1.3.2.7 Student Academic Achievement in Reading/Language Arts - High School
High School
# Students Who Received a Valid Score and for Whom a Proficiency
Level Was Assigned
# Students Scoring at or
Above Proficient
Percentage of Students
Scoring at or Above Proficient
47.5 59 76 S S 34 47 48.0 38 13 39 38.5
38.8 56.1
All students 17,086 S American Indian or Alaska Native 22 S Asian or Pacific Islander 149 S
Asian 145 S Native Hawaiian or other Pacific Islander 4 S
Black or African American 835 S Hispanic or Latino 215 S White 15,696 S Two or more races 169 S Children with disabilities (IDEA) 2,097 S Limited English proficient (LEP) students 130 S Economically disadvantaged students 9,681 S Migratory students Male 8,523 S Female 8,563 S Comments: The response is limited to 4,000 characters. data is correct as submitted
OMB NO. 1810-0724 Page 30
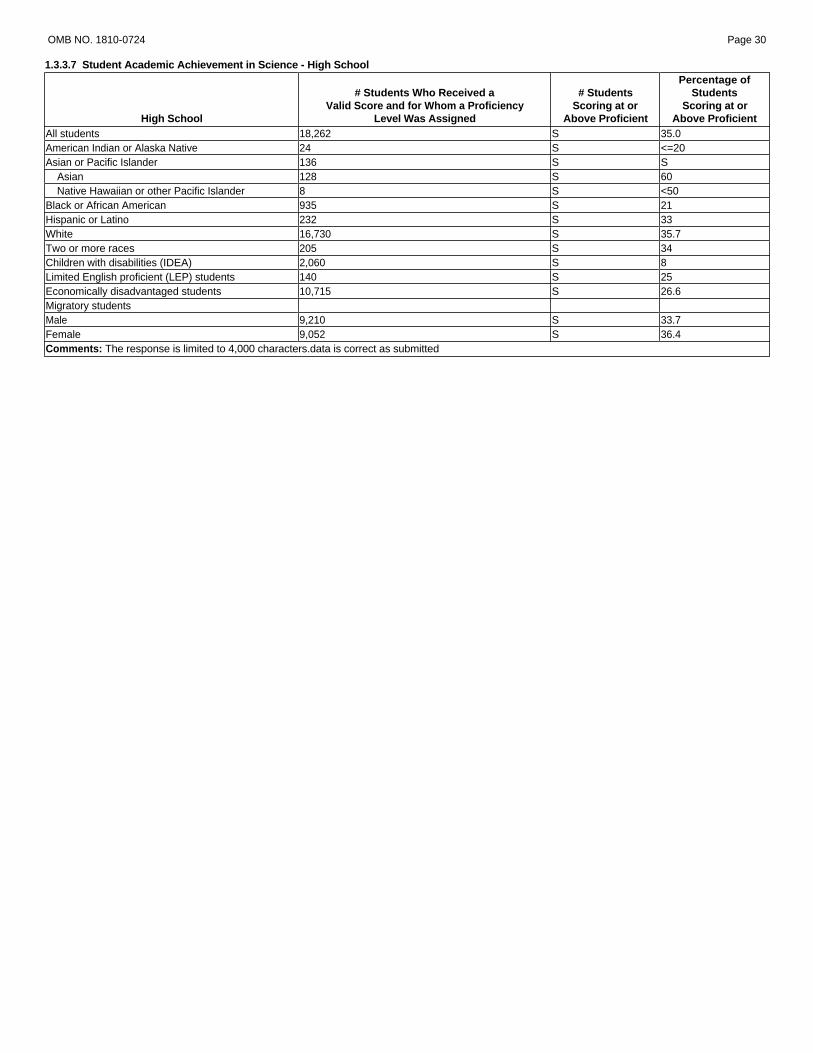
1.3.3.7 Student Academic Achievement in Science - High School
High School
# Students Who Received a Valid Score and for Whom a Proficiency
Level Was Assigned
# Students Scoring at or
Above Proficient
Percentage of Students
Scoring at or Above Proficient
35.0 <=20 S 60 <50 21 33 35.7 34 8 25 26.6
33.7 36.4
All students 18,262 S American Indian or Alaska Native 24 S Asian or Pacific Islander 136 S
Asian 128 S Native Hawaiian or other Pacific Islander 8 S
Black or African American 935 S Hispanic or Latino 232 S White 16,730 S Two or more races 205 S Children with disabilities (IDEA) 2,060 S Limited English proficient (LEP) students 140 S Economically disadvantaged students 10,715 S Migratory students Male 9,210 S Female 9,052 S Comments: The response is limited to 4,000 characters. data is correct as submitted

OMB NO. 1810-0724 Page 31
1.4 SCHOOL AND DISTRICT ACCOUNTABILITY
This section collects data on the Adequate Yearly Progress (AYP) status of schools and districts.
1.4.1 All Schools and Districts Accountability
For an SEA that has not received ESEA flexibility, or an SEA that received ESEA flexibility without the optional waiver to not make AYP determinations for LEAs and schools:
In the table below, provide the total number of public elementary and secondary schools and districts in the State, including charters, and the total number of those schools and districts that made AYP based on data for SY 2014-15. The percentage that made AYP will be calculated automatically.
Entity Total # Total # that Made AYP
in SY 2014-15 Percentage that Made
AYP in SY 2014-15 Schools Districts Comments: The response is limited to 4,000 characters. West Virginia received ESEA Flexibility in May 2013.
For an SEA with an approved ESEA flexibility request that includes the optional waiver to not make AYP determinations for LEAs and schools:
In the table below, provide the total number of public elementary and secondary schools and districts in the State, including charters, and the total number of
those schools and districts that made all of their AMOs, the 95 percent participation rate, and other academic indicator 3 based on data for SY 2014-15. The percentage will be calculated automatically.
Total # that Met All AMOs, 95 Percent Participation Rate, and Percentage that Met All AMOs, 95 Percent Participation Rate Entity Total # Other Academic Indicator in SY 2014-15 and Other Academic Indicator in SY 2014-15
Schools 739 Districts 57 Comments: The response is limited to 4,000 characters. West Virginia Flexibility Renewal (6 -23-15) approved a pause for measuring AMO's for the 14-15 school year because of assessment transition. 3 For a high school, the other academic indicator is always graduation rate.
1.4.2 Title I School Accountability
For an SEA that has not received ESEA flexibility, or an SEA that received ESEA flexibility without the optional waiver to not make AYP determinations for LEAs and schools:
In the table below, provide the total number of public Title I schools by type and the total number of those schools that made AYP based on data for SY 201415. Include only public Title I schools. Do not include Title I programs operated by local educational agencies in private schools. The percentage that made AYP will be calculated automatically.
Title I School # Title I Schools
# Title I Schools that Made AYP in SY 2014-15
Percentage of Title I Schools that Made AYP in SY 2014-15
All Title I schools Schoolwide (SWP) Title I schools Targeted assistance (TAS) Title I schools Comments: The response is limited to 4,000 characters. West Virginia received ESEA Flexibility in May 2013.
For an SEA with an approved ESEA flexibility request that includes the optional waiver to not make AYP determinations for LEAs and schools:
In the table below, provide the total number of public Title I schools by type and the total number of those schools that made all of their AMOs, the 95 percent
participation rate, and the other academic indicator 4 based on data for SY 2014-15. Include only public Title I schools. Do not include Title I programs operated by LEAs in private schools. The percentage will be calculated automatically.
Title I School # Title I Schools
# Title I Schools that Met All AMOs, 95 Percent Participation Rate, and Other
Academic Indicator in SY 2014-15
Percentage of Title I Schools that Met All AMOs, 95 Percent Participation Rate, and Other Academic Indicator in SY 2014-15
All Title I schools 338 Schoolwide (SWP) Title I schools 334 Targeted assistance (TAS) Title I schools 4 Comments: The response is limited to 4,000 characters. West Virginia Flexibility Renewal (6 -23-15) approved a pause for measuring AMO's for the 14-15 school year because of assessment transition. 4 For a high school, the other academic indicator is always graduation rate.
1.4.3 Accountability of Districts That Received Title I Funds
For an SEA that has not received ESEA flexibility, or an SEA that received ESEA flexibility without the optional waiver to not make AYP determinations for LEAs and schools:
In the table below, provide the total number of districts that received Title I funds and the total number of those districts that made AYP based on data for SY 2014-15. The percentage that made AYP will be calculated automatically.
# Districts That Received Title I Funds in
SY 2014-15 # Districts That Received Title I Funds and Made AYP in
SY 2014-15 Percentage of Districts That Received Title I Funds and
Made AYP in SY 2014-15

55
Comments: The response is limited to 4,000 characters. West Virginia received ESEA Flexibility in May 2013.
For an SEA with an approved ESEA flexibility request that includes the optional waiver to not make AYP determinations for LEAs and schools:
In the table below, provide the total number of districts that received Title I funds and the total number of those districts that met all of their AMOs, the 95
percent participation rate, and other academic indicator 5 based on data for SY 2014-15. The percentage will be calculated automatically.
# Districts That # Districts That Received Title I Funds and Met All Percentage of Districts That Received Title I Funds and Met Received Title I Funds in AMOs, 95 percent Participation Rate, and Other All AMOs, 95 percent Participation Rate, and Other Academic
SY 2014-15 Academic Indicator in SY 2014-15 Indicator in SY 2014-15
Comments: The response is limited to 4,000 characters. West Virginia Flexibility Renewal (6 -23-15) approved a pause for measuring AMO's for the 14-15 school year because of assessment transition. 5 For a high school, the other academic indicator is always graduation rate.

OMB NO. 1810-0724 Page 32
1.4.4.3 Corrective Action
In the table below, for schools in corrective action, provide the number of schools for which the listed corrective actions under ESEA were implemented in SY 2014-15 (based on SY 2013-14 assessments under Section 1111 of ESEA).
Corrective Action Required implementation of a new research-based curriculum or instructional program Extension of the school year or school day Replacement of staff members, not including the principal, relevant to the school's low performance Significant decrease in management authority at the school level Replacement of the principal Restructuring the internal organization of the school Appointment of an outside expert to advise the school
# of Title I Schools in Corrective Action in Which the Corrective Action was Implemented in SY 2014-15
Comments: The response is limited to 4,000 characters. West Virginia received ESEA Flexibility in May 2013.
1.4.4.4 Restructuring – Year 2
In the table below, for schools in restructuring – year 2 (implementation year), provide the number of schools for which the listed restructuring actions under ESEA were implemented in SY 2014-15 (based on SY 2013-14 assessments under Section 1111 of ESEA).
Restructuring Action Replacement of all or most of the school staff (which may include the principal) Reopening the school as a public charter school Entering into a contract with a private entity to operate the school Takeover the school by the State Other major restructuring of the school governance
# of Title I Schools in Restructuring in Which Restructuring Action Is Being Implemented
Comments: The response is limited to 4,000 characters. West Virginia received ESEA Flexibility in May 2013.
In the space below, list specifically the "other major restructuring of the school governance" action(s) that were implemented.
The response is limited to 8,000 characters.
West Virginia received ESEA Flexibility in May 2013.

OMB NO. 1810-0724 Page 33
1.4.5.2 Actions Taken for Districts That Received Title I Funds and Were Identified for Improvement
In the space below, briefly describe the measures being taken to address the achievement problems of districts identified for improvement or corrective action. Include a discussion of the technical assistance provided by the State (e.g., the number of districts served, the nature and duration of assistance provided, etc.).
The response is limited to 8,000 characters.
West Virginia received ESEA Flexibility in May 2013.
OMB NO. 1810-0724 Page 34
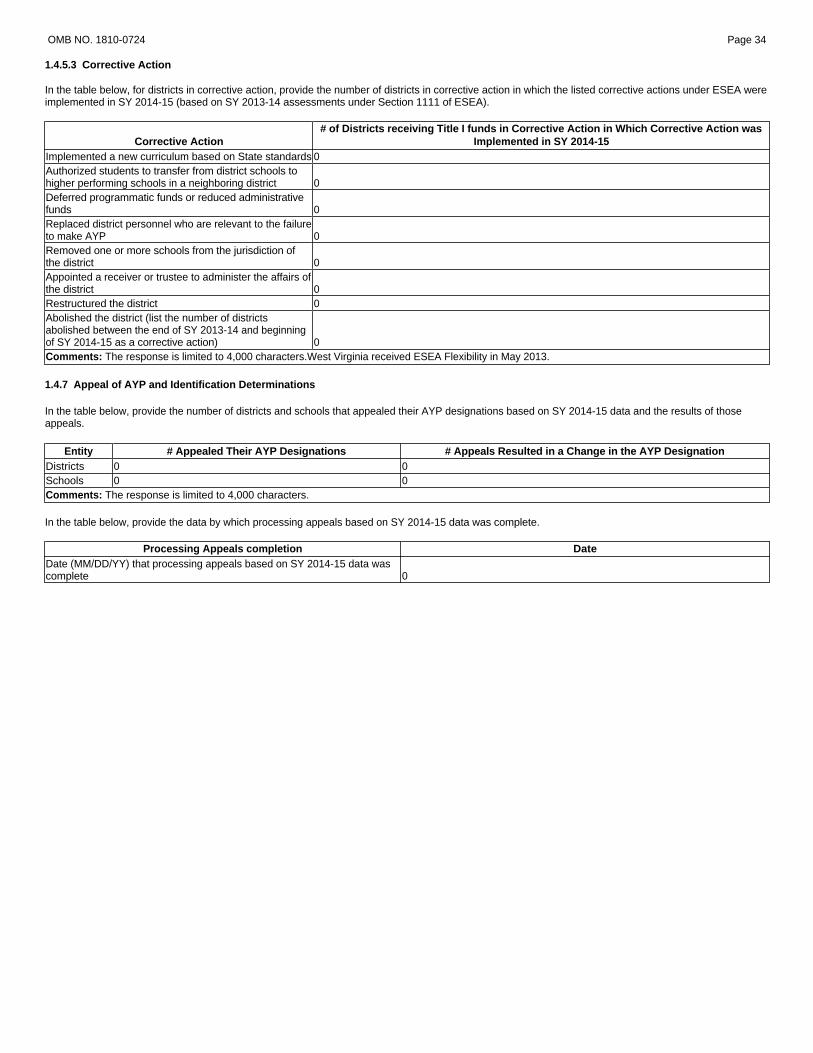
1.4.5.3 Corrective Action
In the table below, for districts in corrective action, provide the number of districts in corrective action in which the listed corrective actions under ESEA were implemented in SY 2014-15 (based on SY 2013-14 assessments under Section 1111 of ESEA).
# of Districts receiving Title I funds in Corrective Action in Which Corrective Action was Corrective Action Implemented in SY 2014-15
Implemented a new curriculum based on State standards 0 Authorized students to transfer from district schools to higher performing schools in a neighboring district 0 Deferred programmatic funds or reduced administrative funds 0 Replaced district personnel who are relevant to the failure to make AYP 0 Removed one or more schools from the jurisdiction of the district 0 Appointed a receiver or trustee to administer the affairs of the district 0 Restructured the district 0 Abolished the district (list the number of districts abolished between the end of SY 2013-14 and beginning of SY 2014-15 as a corrective action) 0 Comments: The response is limited to 4,000 characters. West Virginia received ESEA Flexibility in May 2013.
1.4.7 Appeal of AYP and Identification Determinations
In the table below, provide the number of districts and schools that appealed their AYP designations based on SY 2014-15 data and the results of those appeals.
Entity # Appealed Their AYP Designations 0 0
# Appeals Resulted in a Change in the AYP Designation Districts 0 Schools 0 Comments: The response is limited to 4,000 characters.
In the table below, provide the data by which processing appeals based on SY 2014-15 data was complete.
Processing Appeals completion Date Date (MM/DD/YY) that processing appeals based on SY 2014-15 data was complete 0
OMB NO. 1810-0724 Page 35
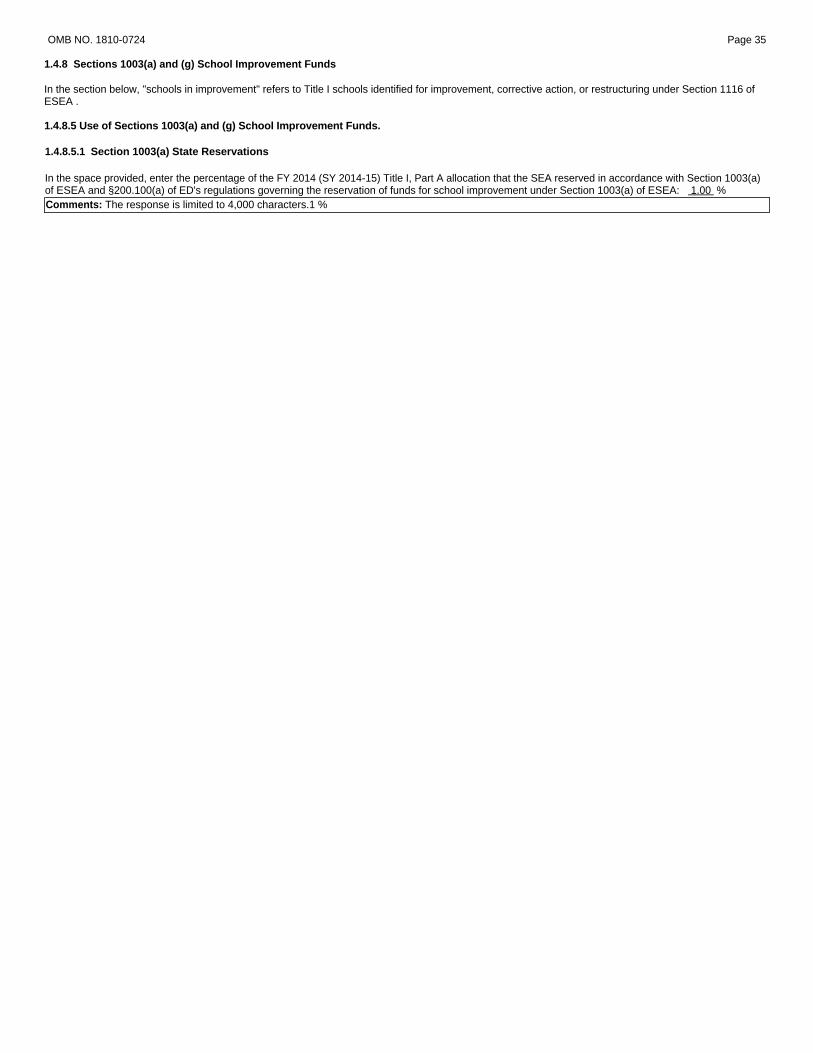
1.4.8 Sections 1003(a) and (g) School Improvement Funds
In the section below, "schools in improvement" refers to Title I schools identified for improvement, corrective action, or restructuring under Section 1116 of ESEA .
1.4.8.5 Use of Sections 1003(a) and (g) School Improvement Funds.
1.4.8.5.1 Section 1003(a) State Reservations
In the space provided, enter the percentage of the FY 2014 (SY 2014-15) Title I, Part A allocation that the SEA reserved in accordance with Section 1003(a) of ESEA and §200.100(a) of ED's regulations governing the reservation of funds for school improvement under Section 1003(a) of ESEA: 1.00 % Comments: The response is limited to 4,000 characters. 1 %
OMB NO. 1810-0724 Page 36
1.4.8.5.2 Section 1003(a) and 1003(g) Allocations to LEAs and Schools
The data for this question are reported through EDFacts files and compiled in the EDEN012 "Section 1003(a) and 1003(g) Allocations to LEAs and Schools" report in the EDFacts Reporting System (ERS). The EDFacts files and data groups used in this report are listed in the CSPR Crosswalk. The CSPR Data Key contains more detailed information on how the data are populated into the report.
Before certifying Part I of the CSPR, a state user must run the EDEN012 report in ERS and verify that the state's data are correct. The final, certified data from this report will be made publicly available alongside the state's certified CSPR PDF.

OMB NO. 1810-0724 Page 37
1.4.8.5.3 Use of Section 1003(g)(8) Funds for Evaluation and Technical Assistance
Section 1003(g)(8) of ESEA allows States to reserve up to five percent of Section 1003(g) funds for administration and to meet the evaluation and technical assistance requirements for this program. In the space below, identify and describe the specific Section 1003(g) evaluation and technical assistance activities that your State conducted during SY 2014-15.
This response is limited to 8,000 characters.
The 1003(g) administration funds supported a .5 FTE salary and fixed charges for a coordinator in the Office of Data Management. The coordinator works in direct associate with the Title I staff and the school receiving the 1003 (g) school improvement grants to assist in data collection and analysis associated with the 1003 (g) grants. School Improvement Coordinators provide site-based technical assistance and monitor the implementation of each grant. The remaining balance of administration funds were to be braided with the 4% allowable reserve from the 1003(a) funds to provide technical assistance in implementing and monitoring the results of the implementation of the activities identified in the 1003 (g) school improvement grants. Specifically, technical assistance and professional development have been aligned to the WV Standards for High Quality Schools to guide the process of state intervention in low-achieving schools.

OMB NO. 1810-0724 Page 38
1.4.8.6 Actions Taken for Title I Schools Identified for Improvement Supported by Funds Other than Those of Section 1003(a) and 1003(g).
In the space below, describe actions (if any) taken by your State in SY 2014-15 that were supported by funds other than Section 1003(a) and 1003(g) funds to address the achievement problems of schools identified for improvement, corrective action, or restructuring under Section 1116 of ESEA.
The response is limited to 8,000 characters.
N/A

OMB NO. 1810-0724 Page 39
1.4.9 Public School Choice and Supplemental Educational Services
This section collects data on public school choice and supplemental educational services.
1.4.9.1 Public School Choice
This section collects data on public school choice. FAQs related to the public school choice provisions are at the end of this section.
1.4.9.1.2 Public School Choice – Students
In the table below, provide the number of students who were eligible for public school choice, the number of eligible students who applied to transfer, and the number who transferred under the provisions for public school choice under Section 1116 of ESEA. The number of students who were eligible for public school choice should include:
1. All students currently enrolled in a Title I school identified for improvement, corrective action or restructuring. 2. All students who transferred in the current school year under the public school choice provisions of Section 1116, and 3. All students who previously transferred under the public school choice provisions of Section 1116 and are continuing to transfer for the current school
year under Section 1116.
The number of students who applied to transfer should include:
1. All students who applied to transfer in the current school year but did not or were unable to transfer. 2. All students who transferred in the current school year under the public school choice provisions of Section 1116; and 3. All students who previously transferred under the public school choice provisions of Section 1116 and are continuing to transfer for the current school
year under Section 1116.
For any of the respective student counts, States should indicate in the Comment section if the count does not include any of the categories of students discussed above.
Public School Choice # Students Eligible for public school choice Applied to transfer Transferred to another school under the Title I public school choice provisions Comments: The response is limited to 4,000 characters. West Virginia received ESEA Flexibility in May 2013.

OMB NO. 1810-0724 Page 40
1.4.9.1.3 Funds Spent on Public School Choice
In the table below, provide the total dollar amount spent by LEAs on transportation for public school choice under Section 1116 of ESEA. Transportation for Public School Choice Dollars Spent
Dollars spent by LEAs on transportation for public school choice $
1.4.9.1.4 Availability of Public School Choice Options
In the table below provide the number of LEAs in your State that are unable to provide public school choice to eligible students due to any of the following reasons:
1. All schools at a grade level in the LEA are in school improvement, corrective action, or restructuring. 2. LEA only has a single school at the grade level of the school at which students are eligible for public school choice. 3. LEA's schools are so remote from one another that choice is impracticable.
Unable to Provide Public School Choice # LEAs LEAs Unable to Provide Public School Choice 0 FAQs about public school choice:
a. How should States report data on Title I public school choice for those LEAs that have open enrollment and other choice programs? For those LEAs that implement open enrollment or other school choice programs in addition to public school choice under Section 1116 of ESEA, the State may consider a student as having applied to transfer if the student meets the following:
� Has a "home" or "neighborhood" school (to which the student would have been assigned, in the absence of a school choice program) that receives Title I funds and has been identified, under the statute, as in need of improvement, corrective action, or restructuring; and
� Has elected to enroll, at some point since July 1, 2002 (the effective date of the Title I choice provisions), and after the home school has been identified as in need of improvement, in a school that has not been so identified and is attending that school; and
� Is using district transportation services to attend such a school. In addition, the State may consider costs for transporting a student meeting the above conditions towards the funds spent by an LEA on transportation for public school choice if the student is using district transportation services to attend the non-identified school.
b. How should States report on public school choice for those LEAs that are not able to offer public school choice? In the count of LEAS that are not able to offer public school choice (for any of the reasons specified in 1.4.9.1.4), States should include those LEAs that are unable to offer public school choice at one or more grade levels. For instance, if an LEA is able to provide public school choice to eligible students at the elementary level but not at the secondary level, the State should include the LEA in the count. States should also include LEAs that are not able to provide public school choice at all (i.e., at any grade level). States should provide the reason(s) why public school choice was not possible in these LEAs at the grade level(s) in the Comment section. In addition, States may also include in the Comment section a separate count just of LEAs that are not able to offer public school choice at any grade level.
For LEAs that are not able to offer public school choice at one or more grade levels, States should count as eligible for public school choice (in 1.4.9.1.2) all students who attend identified Title I schools regardless of whether the LEA is able to offer the students public school choice.
Comments: The response is limited to 4,000 characters. West Virginia received ESEA Flexibility in May 2013.

OMB NO. 1810-0724 Page 41
1.4.9.2 Supplemental Educational Services
This section collects data on supplemental educational services.
1.4.9.2.2 Supplemental Educational Services – Students
In the table below, provide the number of students who were eligible for, who applied for, and who received supplemental educational services under Section 1116 of ESEA.
The number of students who received supplemental educational services should include all students who were enrolled with a provider and participated in some hours of services. States and LEAs have the discretion to determine the minimum number of hours of participation needed by a student to be considered as having received services.
Supplemental Educational Services # Students Eligible for supplemental educational services Applied for supplemental educational services Received supplemental educational services Comments: The response is limited to 4,000 characters. West Virginia received ESEA Flexibility in May 2013.
1.4.9.2.3 Funds Spent on Supplemental Educational Services
In the table below, provide the total dollar amount spent by LEAs on supplemental educational services under Section 1116 of ESEA.
Spending on Supplemental Educational Services Dollars Spent Dollars spent by LEAs on supplemental educational services $ Comments: The response is limited to 4,000 characters. West Virginia received ESEA Flexibility in May 2013.
OMB NO. 1810-0724 Page 42
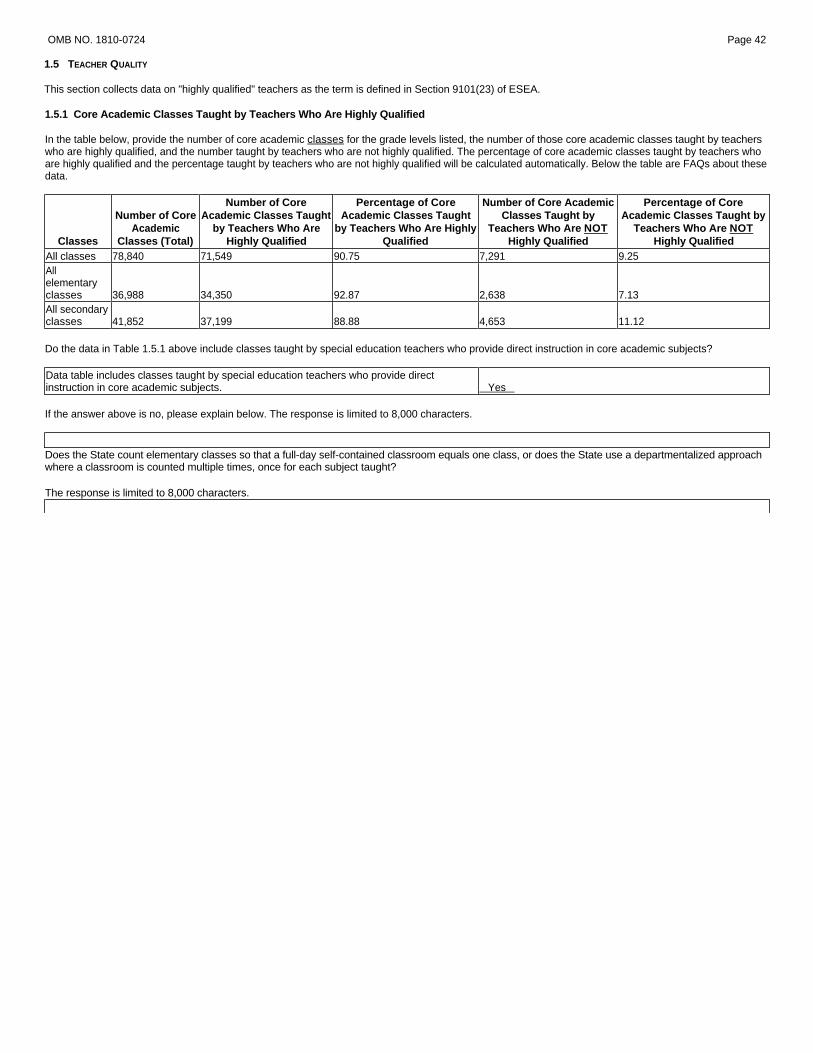
1.5 TEACHER QUALITY
This section collects data on "highly qualified" teachers as the term is defined in Section 9101(23) of ESEA.
1.5.1 Core Academic Classes Taught by Teachers Who Are Highly Qualified
In the table below, provide the number of core academic classes for the grade levels listed, the number of those core academic classes taught by teachers who are highly qualified, and the number taught by teachers who are not highly qualified. The percentage of core academic classes taught by teachers who are highly qualified and the percentage taught by teachers who are not highly qualified will be calculated automatically. Below the table are FAQs about these data.
Number of Core Percentage of Core Number of Core Academic Number of Core Academic Classes Taught Academic Classes Taught Classes Taught by
Academic by Teachers Who Are by Teachers Who Are Highly Teachers Who Are NOT Classes Classes (Total) Highly Qualified Qualified Highly Qualified
All classes 78,840 71,549 90.75 7,291 All elementary classes 36,988 34,350 92.87 2,638 All secondary classes 41,852 37,199 88.88 4,653
Percentage of Core Academic Classes Taught by
Teachers Who Are NOT Highly Qualified
9.25
7.13
11.12
Do the data in Table 1.5.1 above include classes taught by special education teachers who provide direct instruction in core academic subjects?
Data table includes classes taught by special education teachers who provide direct instruction in core academic subjects. Yes
If the answer above is no, please explain below. The response is limited to 8,000 characters.
Does the State count elementary classes so that a full-day self-contained classroom equals one class, or does the State use a departmentalized approach where a classroom is counted multiple times, once for each subject taught?
The response is limited to 8,000 characters.
OMB NO. 1810-0724 Page 43
FAQs about highly qualified teachers and core academic subjects:
a. What are the core academic subjects? English, reading/language arts, mathematics, science, foreign languages, civics and government, economics, arts, history, and geography [Title IX, Section 9101(11)]. While the statute includes the arts in the core academic subjects, it does not specify which of the arts are core academic subjects; therefore, States must make this determination.
b. How is a teacher defined? An individual who provides instruction in the core academic areas to kindergarten, grades 1 through 12, or ungraded classes, or individuals who teach in an environment other than a classroom setting (and who maintain daily student attendance records) [from NCES, CCD, 2001-02]
c. How is a class defined? A class is a setting in which organized instruction of core academic course content is provided to one or more students (including cross-age groupings) for a given period of time. (A course may be offered to more than one class.) Instruction, provided by one or more teachers or other staff members, may be delivered in person or via a different medium. Classes that share space should be considered as separate classes if they function as separate units for more than 50% of the time [from NCES Non-fiscal Data Handbook for Early Childhood, Elementary, and Secondary Education, 2003].
d. Should 6th-, 7th-, and 8th-grade classes be reported in the elementary or the secondary category? States are responsible for determining whether the content taught at the middle school level meets the competency requirements for elementary or secondary instruction. Report classes in grade 6 through 8 consistent with how teachers have been classified to determine their highly qualified status, regardless of whether their schools are configured as elementary or middle schools.
e. How should States count teachers (including specialists or resource teachers) in elementary classes? States that count self-contained classrooms as one class should, to avoid over-representation, also count subject-area specialists (e.g., mathematics or music teachers) or resource teachers as teaching one class. On the other hand, States using a departmentalized approach to instruction where a self-contained classroom is counted multiple times (once for each subject taught) should also count subject-area specialists or resource teachers as teaching multiple classes.
f. How should States count teachers in self-contained multiple-subject secondary classes? Each core academic subject taught for which students are receiving credit toward graduation should be counted in the numerator and the denominator. For example, if the same teacher teaches English, calculus, history, and science in a self-contained classroom, count these as four classes in the denominator. If the teacher is Highly Qualified to teach English and history, he/she would be counted as Highly Qualified in two of the four subjects in the numerator.
g. What is the reporting period? The reporting period is the school year. The count of classes must include all semesters, quarters, or terms of the school year. For example, if core academic classes are held in summer sessions, those classes should be included in the count of core academic classes. A state determines into which school year classes fall.

OMB NO. 1810-0724 Page 44
1.5.2 Reasons Core Academic Classes Are Taught by Teachers Who Are Not Highly Qualified
In the tables below, estimate the percentages for each of the reasons why teachers who are not highly qualified teach core academic classes. For example, if 900 elementary classes were taught by teachers who are not highly qualified, what percentage of those 900 classes falls into each of the categories listed below? If the three reasons provided at each grade level are not sufficient to explain why core academic classes at a particular grade level are taught by teachers who are not highly qualified, use the row labeled "other" and explain the additional reasons. The total of the reasons is calculated automatically for each grade level and must equal 100% at the elementary level and 100% at the secondary level.
Note: Use the numbers of core academic classes taught by teachers who are not highly qualified from 1.5.1 for both elementary school classes (1.5.2.1) and for secondary school classes (1.5.2.2) as your starting point.
1.5.2.1 Elementary School Classes
Elementary School Classes Percentage Elementary school classes taught by certified general education teachers who did not pass a subject-knowledge test or (if eligible) have not demonstrated subject-matter competency through HOUSSE 35.10 Elementary school classes taught by certified special education teachers who did not pass a subject-knowledge test or have not demonstrated subject-matter competency through HOUSSE 6.50 Elementary school classes taught by teachers who are not fully certified (and are not in an approved alternative route program) 58.40 Other (please explain in comment box below) 0.00 Total 100.00
The response is limited to 8,000 characters.
1.5.2.2 Secondary School Classes
Secondary School Classes Percentage Secondary school classes taught by certified general education teachers who have not demonstrated subject-matter knowledge in those subjects (e.g., out-of-field teachers) 16.60 Secondary school classes taught by certified special education teachers who have not demonstrated subject-matter competency in those subjects 11.40 Secondary school classes taught by teachers who are not fully certified (and are not in an approved alternative route program) 72.00 Other (please explain in comment box below) 0.00 Total 100.00
The response is limited to 8,000 characters.

OMB NO. 1810-0724 Page 45
1.5.3 Poverty Quartiles and Metrics Used
In the table below, provide the number of core academic classes for each of the school types listed and the number of those core academic classes taught by teachers who are highly qualified. The percentage of core academic classes taught by teachers who are highly qualified will be calculated automatically. The percentages used for high- and low-poverty schools and the poverty metric used to determine those percentages are reported in the second table. Below the tables are FAQs about these data.
NOTE: No source of classroom-level poverty data exists, so States may look at school-level data when figuring poverty quartiles. Because not all schools have traditional grade configurations, and because a school may not be counted as both an elementary and as a secondary school, States may include as elementary schools all schools that serve children in grades K through 5 (including K through 8 or K through 12 schools).
This means that for the purpose of establishing poverty quartiles, some classes in schools where both elementary and secondary classes are taught would be counted as classes in an elementary school rather than as classes in a secondary school in 1.5.3. This also means that such a 12th grade class would be in a different category in 1.5.3 than it would be in 1.5.1.
School Type Number of Core Academic Classes
(Total)
Number of Core Academic Classes
Taught by Teachers Who Are Highly Qualified
Percentage of Core Academic Classes
Taught by Teachers Who Are Highly Qualified
Elementary Schools High Poverty Elementary Schools Low-poverty Elementary Schools 36,900 34,268 92.87 Secondary Schools High Poverty secondary Schools Low-Poverty secondary Schools 41,758 37,107 88.86
1.5.3.1 Poverty Quartile Breaks
In the table below, provide the poverty quartiles breaks used in determining high- and low-poverty schools and the poverty metric used to determine the poverty quartiles. Below the table are FAQs about the data collected in this table.
High-Poverty Schools (more than what %)
51.00
45.30
Low-Poverty Schools (less than what %)
Elementary schools 75.00 Poverty metric used low ses
67.00Secondary schools Poverty metric used low ses
OMB NO. 1810-0724 Page 46
FAQs on poverty quartiles and metrics used to determine poverty
a. What is a "high-poverty school"? Section 1111(h)(1)(C)(viii) defines "high-poverty" schools as schools in the top quartile of poverty in the State.
b. What is a "low-poverty school"? Section 1111(h)(1)(C)(viii) defines "low-poverty" schools as schools in the bottom quartile of poverty in the State.
c. How are the poverty quartiles determined? Separately rank order elementary and secondary schools from highest to lowest on your percentage poverty measure. Divide the list into four equal groups. Schools in the first (highest group) are high-poverty schools. Schools in the last group (lowest group) are the low-poverty schools. Generally, States use the percentage of students who qualify for the free or reduced-price lunch program for this calculation.
d. Since the poverty data are collected at the school and not classroom level, how do we classify schools as either elementary or secondary for this purpose? States may include as elementary schools all schools that serve children in grades K through 5 (including K through 8 or K through 12 schools) and would therefore include as secondary schools those that exclusively serve children in grades 6 and higher.

OMB NO. 1810-0724 Page 47
1.6 TITLE III AND LANGUAGE INSTRUCTIONAL PROGRAMS
This section collects annual performance and accountability data on the implementation of Title III programs.
1.6.1 Language Instruction Educational Programs
In the table below, place a check next to each type of language instruction educational programs implemented in the State, as defined in Section 3301(8), as required by Sections 3121(a)(1), 3123(b)(1), and 3123(b)(2).
Table 1.6.1 Definitions:
1. Types of Programs = Types of programs described in the subgrantee's local plan (as submitted to the State or as implemented) that is closest to the descriptions in http://www.ncela.gwu.edu/files/rcd/BE021775/Glossary_of_Terms.pdf.
2. Other Language = Name of the language of instruction, other than English, used in the programs.
Check Types of Programs Type of Program No Dual language No Two-way immersion No Transitional bilingual programs No Developmental bilingual No Heritage language Yes Sheltered English instruction No Structured English immersion
Specially designed academic instruction delivered in English No (SDAIE) Yes Content-based ESL Yes Pull-out ESL No Response Other (explain in comment box below)
Other Language
////////////////////////////////////////////////////////////////////////////////////////////////////////////////////////////////////////////////////////////
////////////////////////////////////////////////////////////////////////////////////////////////////////////////////////////////////////////////////////////////////////////////////////////////////////////////////////////////////////////////////////////////////////////////////////////////////////////////////////
The response is limited to 8,000 characters.

OMB NO. 1810-0724 Page 48
1.6.2 Student Demographic Data
1.6.2.1 Number of ALL LEP Students in the State
In the table below, provide the October 1 count of ALL LEP students in the State who meet the LEP definition under Section 9101(25).
� Include newly enrolled (recent arrivals to the U.S.) and continually enrolled LEP students, whether or not they receive services in a Title III language instruction educational program.
� Do not include Former LEP students (as defined in Section 200.20(f)(2) of the Title I regulation) and monitored Former LEP students (as defined under Section 3121(a)(4) of Title III) in the ALL LEP student count in this table.
Number of ALL LEP students in the State 2,862 Comments: The response is limited to 4,000 characters. WVDE continues the initiative to improve data accuracy. Title III Directors worked between October2015 and the time the English language proficiency test to ensure student were correctly identified as ELL.
1.6.2.2 Number of LEP Students Who Received Title III Language Instruction Educational Program Services
In the table below, provide the October 1 count of LEP students in the State who received services in Title III language instructional education programs.
LEP Students Receiving Services # LEP students who received services in a Title III language instruction educational program in grades K through 12 for this reporting year. 2,825 Comments: The response is limited to 4,000 characters. WVDE continues the initiative to improve data accuracy. Title III Directors worked between October2015 and the time the English language proficiency test to ensure student were correctly identified as ELL.
1.6.2.3 Most Commonly Spoken Languages in the State
In the table below, provide the five most commonly spoken languages, other than English, in the State (for all LEP students, not just LEP students who received Title III services). The top five languages should be determined by the highest number of students speaking each of the languages listed.
Language # LEP Students Spanish; Castilian 1,316 Arabic 347 Chinese 270 Vietnamese 117 Korean 42
Report additional languages with significant numbers of LEP students in the comment box below.
The response is limited to 8,000 characters.
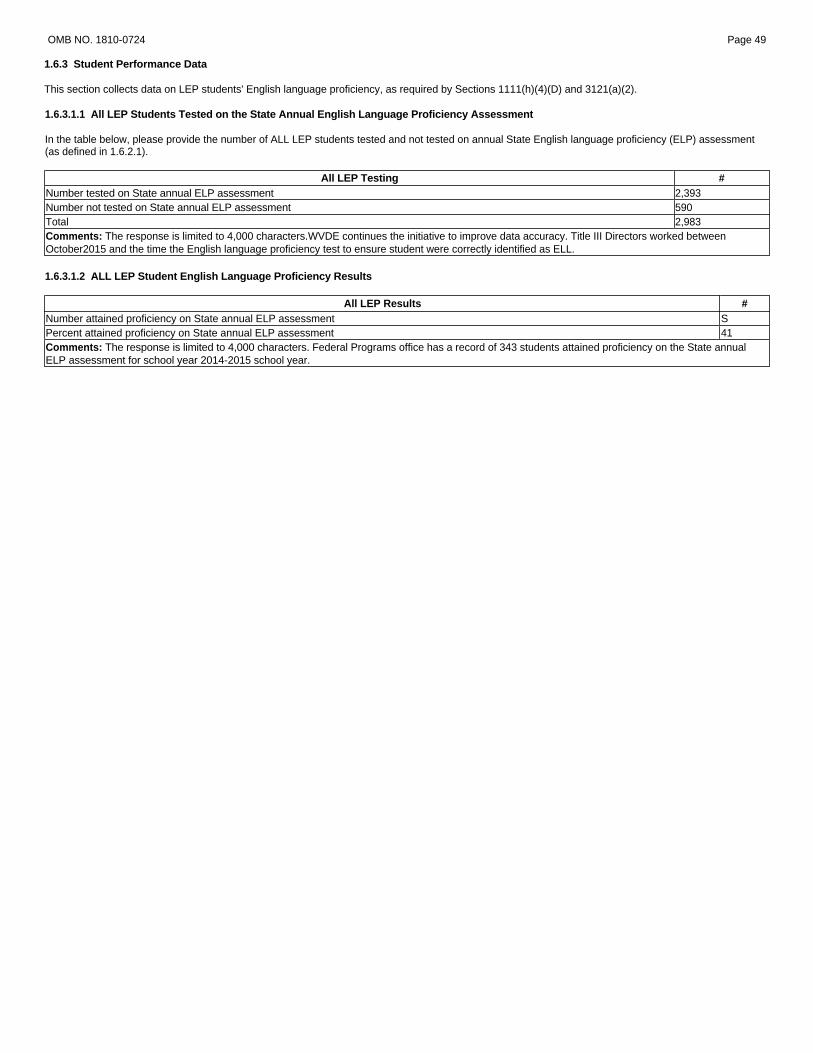
OMB NO. 1810-0724 Page 49
1.6.3 Student Performance Data
This section collects data on LEP students' English language proficiency, as required by Sections 1111(h)(4)(D) and 3121(a)(2).
1.6.3.1.1 All LEP Students Tested on the State Annual English Language Proficiency Assessment
In the table below, please provide the number of ALL LEP students tested and not tested on annual State English language proficiency (ELP) assessment (as defined in 1.6.2.1).
All LEP Testing # Number tested on State annual ELP assessment 2,393 Number not tested on State annual ELP assessment 590 Total 2,983 Comments: The response is limited to 4,000 characters. WVDE continues the initiative to improve data accuracy. Title III Directors worked between October2015 and the time the English language proficiency test to ensure student were correctly identified as ELL.
1.6.3.1.2 ALL LEP Student English Language Proficiency Results
All LEP Results # Number attained proficiency on State annual ELP assessment S Percent attained proficiency on State annual ELP assessment 41 Comments: The response is limited to 4,000 characters. Federal Programs office has a record of 343 students attained proficiency on the State annual ELP assessment for school year 2014-2015 school year.
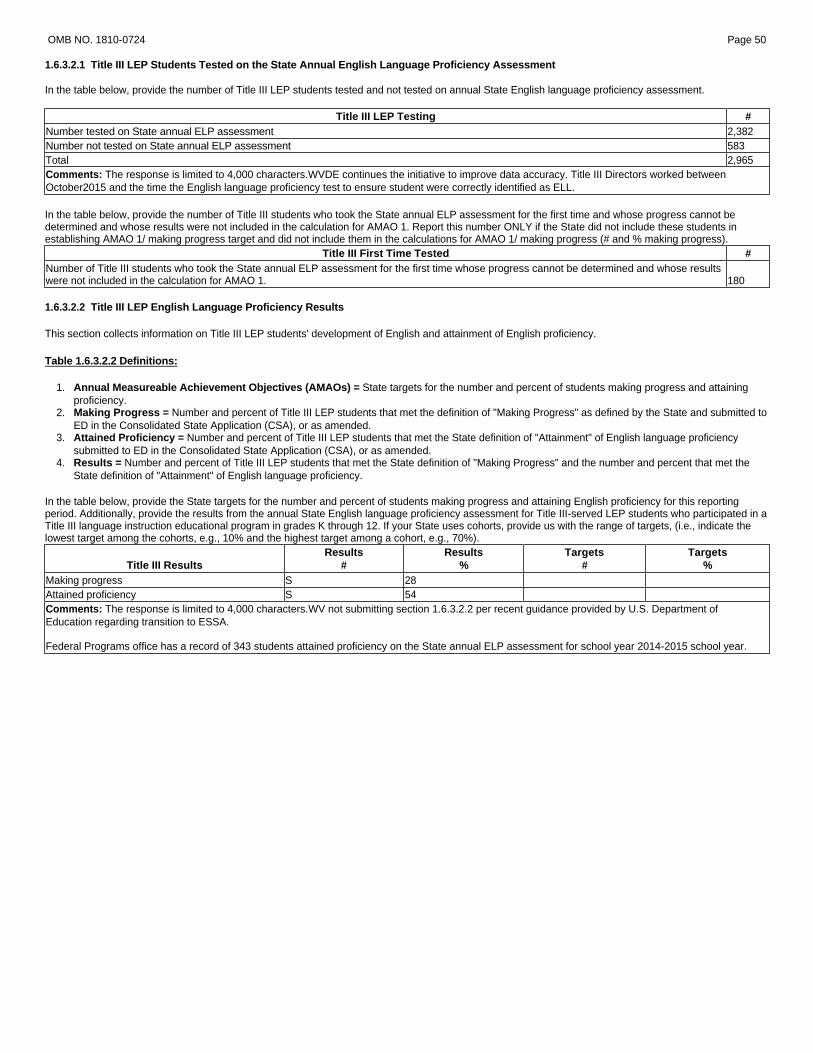
OMB NO. 1810-0724 Page 50
1.6.3.2.1 Title III LEP Students Tested on the State Annual English Language Proficiency Assessment
In the table below, provide the number of Title III LEP students tested and not tested on annual State English language proficiency assessment.
Title III LEP Testing # Number tested on State annual ELP assessment 2,382 Number not tested on State annual ELP assessment 583 Total 2,965 Comments: The response is limited to 4,000 characters. WVDE continues the initiative to improve data accuracy. Title III Directors worked between October2015 and the time the English language proficiency test to ensure student were correctly identified as ELL.
In the table below, provide the number of Title III students who took the State annual ELP assessment for the first time and whose progress cannot be determined and whose results were not included in the calculation for AMAO 1. Report this number ONLY if the State did not include these students in establishing AMAO 1/ making progress target and did not include them in the calculations for AMAO 1/ making progress (# and % making progress).
Title III First Time Tested # Number of Title III students who took the State annual ELP assessment for the first time whose progress cannot be determined and whose results were not included in the calculation for AMAO 1. 180
1.6.3.2.2 Title III LEP English Language Proficiency Results
This section collects information on Title III LEP students' development of English and attainment of English proficiency.
Table 1.6.3.2.2 Definitions:
1. Annual Measureable Achievement Objectives (AMAOs) = State targets for the number and percent of students making progress and attaining proficiency.
2. Making Progress = Number and percent of Title III LEP students that met the definition of "Making Progress" as defined by the State and submitted to ED in the Consolidated State Application (CSA), or as amended.
3. Attained Proficiency = Number and percent of Title III LEP students that met the State definition of "Attainment" of English language proficiency submitted to ED in the Consolidated State Application (CSA), or as amended.
4. Results = Number and percent of Title III LEP students that met the State definition of "Making Progress" and the number and percent that met the State definition of "Attainment" of English language proficiency.
In the table below, provide the State targets for the number and percent of students making progress and attaining English proficiency for this reporting period. Additionally, provide the results from the annual State English language proficiency assessment for Title III-served LEP students who participated in a Title III language instruction educational program in grades K through 12. If your State uses cohorts, provide us with the range of targets, (i.e., indicate the lowest target among the cohorts, e.g., 10% and the highest target among a cohort, e.g., 70%).
Title III Results Results
# Results
% Targets
# Targets
% Making progress S 28 Attained proficiency S 54 Comments: The response is limited to 4,000 characters. WV not submitting section 1.6.3.2.2 per recent guidance provided by U.S. Department of Education regarding transition to ESSA.
Federal Programs office has a record of 343 students attained proficiency on the State annual ELP assessment for school year 2014-2015 school year.

OMB NO. 1810-0724 Page 51
1.6.3.5 Native Language Assessments
This section collects data on LEP students assessed in their native language (Section 1111(b)(6)) to be used for AYP determinations.
1.6.3.5.1 LEP Students Assessed in Native Language
In the table below, check "Yes" if the specified assessment is used for AYP purposes.
State offers the State reading/language arts content tests in the students' native language(s). No Yes No
State offers the State mathematics content tests in the students' native language(s). State offers the State science content tests in the students' native language(s). Comments: The response is limited to 4,000 characters. Stacked translations provided in Spanish language only.
1.6.3.5.2 Native Language of Mathematics Tests Given
In the table below, report the language(s) in which native language assessments are given for ESEA accountability determinations for mathematics.
Language(s) Spanish
Comments: The response is limited to 4,000 characters. Stacked translations provided in Spanish only for mathematics.

OMB NO. 1810-0724 Page 52
1.6.3.5.3 Native Language of Reading/Language Arts Tests Given
In the table below, report the language(s) in which native language assessments are given for ESEA accountability determinations for reading/language arts.
Language(s) NotApplicable
Comments: The response is limited to 4,000 characters. Test is currently only available in English
1.6.3.5.4 Native Language of Science Tests Given
In the table below, report the language(s) in which native language assessments are given for ESEA accountability determinations for science.
Language(s) NotApplicable
Comments: The response is limited to 4,000 characters. Test is currently only available in English

OMB NO. 1810-0724 Page 53
1.6.3.6 Title III Served Monitored Former LEP (MFLEP) Students
This section collects data on the performance of former LEP students as required by Sections 3121(a)(4) and 3123(b)(8).
1.6.3.6.1 Title III Served MFLEP Students by Year Monitored
In the table below, report the unduplicated count of monitored former LEP students during the two consecutive years of monitoring, which includes both MFLEP students in AYP grades and in non-AYP grades.
Monitored Former LEP (MFLEP) students include:
� Students who have transitioned out of a language instruction educational program. � Students who are no longer receiving LEP services and who are being monitored for academic content achievement for 2 years after the transition.
Table 1.6.3.6.1 Definitions:
1. # Year One = Number of former LEP students in their first year of being monitored. 2. # Year Two = Number of former LEP students in their second year of being monitored. 3. Total = Number of monitored former LEP students in year one and year two. This is automatically calculated.
# Year One # Year Two Total 92 67 159 Comments: The response is limited to 4,000 characters. WVDE continues the initiative to improve data accuracy. Title III Directors continue to correct identify students who are being monitored.
1.6.3.6.2 MFLEP Students Results for Mathematics
In the table below, report the number of MFLEP students who took the annual mathematics assessment. Please provide data only for those students who transitioned out of language instruction educational programs and who no longer received services under Title III in this reporting year. These students include both students who are monitored former LEP students in their first year of monitoring, and those in their second year of monitoring. Table 1.6.3.6.2 Definitions:
1. # Tested = State-aggregated number of MFLEP students who were tested in mathematics in all AYP grades. 2. # At or Above Proficient = State-aggregated number of MFLEP students who scored at or above proficient on the State annual mathematics
assessment. 3. % Results = Automatically calculated based on number who scored at or above proficient divided by the number tested. 4. # Below proficient = State-aggregated number of MFLEP students who did not score proficient on the State annual mathematics assessment. This
will be automatically calculated.
# Tested # At or Above Proficient % Results S
# Below Proficient 103 S 75 Comments: The response is limited to 4,000 characters.

OMB NO. 1810-0724 Page 54
1.6.3.6.3 MFLEP Students Results for Reading/Language Arts
In the table below, report results for MFLEP students who took the annual reading/language arts assessment. Please provide data only for those students who transitioned out of language instruction educational programs and who no longer received services under Title III in this reporting year. These students include both students who are monitored former LEP students in their first year of monitoring, and those in their second year of monitoring.
Table 1.6.3.6.3 Definitions:
1. # Tested = State-aggregated number of MFLEP students who were tested in reading/language arts in all AYP grades. 2. # At or Above Proficient = State-aggregated number of MFLEP students who scored at or above proficient on the State annual reading/language arts
assessment. 3. % Results = Automatically calculated based on number who scored at or above proficient divided by the total number tested. This will be
automatically calculated. 4. # Below proficient = State-aggregated number MFLEP students who did not score proficient on the State annual reading/language arts assessment.
# Tested # At or Above Proficient % Results S
# Below Proficient 101 S 86 Comments: The response is limited to 4,000 characters.
1.6.3.6.4 MFLEP Students Results for Science
In the table below, report results for MFLEP students who took the annual science assessment. Please provide data only for those students who transitioned out of language instruction educational programs and who no longer received services under Title III in this reporting year. These students include both students who are MFLEP students in their first year of monitoring, and those in their second year of monitoring.
Table 1.6.3.6.4 Definitions:
1. # Tested = State-aggregated number of MFLEP students who were tested in science. 2. # At or Above Proficient = State-aggregated number of MFLEP students who scored at or above proficient on the State annual science assessment. 3. % Results = Automatically calculated based on number who scored at or above proficient divided by the total number tested. This will be
automatically calculated. 4. # Below proficient = State-aggregated number MFLEP students who did not score proficient on the State annual science assessment.
# Tested # At or Above Proficient % Results # Below Proficient 37 S 73 S Comments: The response is limited to 4,000 characters. Science testing was only administered at grade levels 04, 06, and 10.

13
OMB NO. 1810-0724 Page 55
1.6.4 Title III Subgrantees
This section collects data on the performance of Title III subgrantees.
1.6.4.1 Title III Subgrantee Performance
In the table below, report the number of Title III subgrantees meeting the criteria described in the table. Do not leave items blank. If there are zero subgrantees who met the condition described, put a zero in the number (#) column. Do not double count subgrantees by category.
Note: Do not include number of subgrants made under Section 3114(d)(1) from funds reserved for education programs and activities for immigrant children and youth. (Report Section 3114(d)(1) subgrants in 1.6.5.1 ONLY.)
Title III Subgrantees # Total number of subgrantees for the year
////////////////////////////////////////////////////////////////////////////////////////////////////////////////////////////////////////////////////////////////////////////////////////////////////////////////////////////////////////////////// Number of subgrantees that met all three Title III AMAOs Number of subgrantees that met AMAO 1 Number of subgrantees that met AMAO 2 Number of subgrantees that met AMAO 3
////////////////////////////////////////////////////////////////////////////////////////////////////////////////////////////////////////////////////////////////////////////////////////////////////////////////////////////////////////////////// Number of subgrantees that did not meet any Title III AMAOs 0
////////////////////////////////////////////////////////////////////////////////////////////////////////////////////////////////////////////////////////////////////////////////////////////////////////////////////////////////////////////////// Number of subgrantees that did not meet Title III AMAOs for two consecutive years (SYs 2013 -14 and 2014-15) 0 Number of subgrantees implementing an improvement plan in SY 2014-15 for not meeting Title III AMAOs for two consecutive years 0 Number of subgrantees that have not met Title III AMAOs for four consecutive years (SYs 2011-12, 2012-13, 2013-14, and 2014-15) 0
Provide information on how the State counted consortia members in the total number of subgrantees and in each of the numbers in table 1.6.4.1. If applicable, also please note if this method is the same or different from the previous year.
The response is limited to 4,000 characters. Comments: The response is limited to 4,000 characters. WV not submitting section 1.6.4.1 per recent guidance provided by U.S. Department of Education regarding transition to ESSA.
1.6.4.3 Termination of Title III Language Instruction Educational Programs
This section collects data on the termination of Title III programs or activities as required by Section 3123(b)(7).
Were any Title III language instruction educational programs or activities terminated for failure to reach program goals? No If yes, provide the number of language instruction educational programs or activities for immigrant children and youth terminated. Comments: The response is limited to 4,000 characters.

OMB NO. 1810-0724 Page 56
1.6.5 Education Programs and Activities for Immigrant Students
This section collects data on education programs and activities for immigrant students.
Note: All immigrant students are not LEP students.
1.6.5.1 Immigrant Students
In the table below, report the unduplicated number of immigrant students enrolled in schools in the State and who participated in qualifying educational programs under Section 3114(d)(1).
Table 1.6.5.1 Definitions:
1. Immigrant Students Enrolled = Number of students who meet the definition of immigrant children and youth under Section 3301(6) and enrolled in the elementary or secondary schools in the State.
2. Students in 3114(d)(1) Program = Number of immigrant students who participated in programs for immigrant children and youth funded under Section 3114(d)(1), using the funds reserved for immigrant education programs/activities. This number should not include immigrant students who only receive services in Title III language instructional educational programs under Sections 3114(a) and 3115(a).
3. 3114(d)(1)Subgrants = Number of subgrants made in the State under Section 3114(d)(1), with the funds reserved for immigrant education programs/activities. Do not include Title III Language Instruction Educational Program (LIEP) subgrants made under Sections 3114(a) and 3115(a) that serve immigrant students enrolled in them.
# Immigrant Students Enrolled # Students in 3114(d)(1) Program # of 3114(d)(1) Subgrants 1,316 1
If state reports zero (0) students in programs or zero (0) subgrants, explain in comment box below.
The response is limited to 8,000 characters.

OMB NO. 1810-0724 Page 57
1.6.6 Teacher Information and Professional Development
This section collects data on teachers in Title III language instruction educational programs as required under Section 3123(b)(5).
1.6.6.1 Teacher Information
This section collects information about teachers as required under Section 3123 (b)(5).
In the table below, report the number of teachers who are working in the Title III language instruction educational programs as defined under Section 3301(8) and reported in 1.6.1 (Types of language instruction educational programs) even if they are not paid with Title III funds.
Note: Section 3301(8) – The term ‘ Language instruction educational program ’ means an instruction course – (A) in which a limited English proficient child is placed for the purpose of developing and attaining English proficiency, while meeting challenging State academic content and student academic achievement standards, as required by Section 1111(b)(1); and (B) that may make instructional use of both English and a child's native language to enable the child to develop and attain English proficiency and may include the participation of English proficient children if such course is designed to enable all participating children to become proficient in English as a second language.
Title III Teachers Number of all certified/licensed teachers currently working in Title III language instruction educational programs. Estimate number of additional certified/licensed teachers that will be needed for Title III language instruction educational programs in the next 5 years*.
# 36
60
Explain in the comment box below if there is a zero for any item in the table above.
The response is limited to 8,000 characters.
* This number should be the total additional teachers needed for the next 5 years, not the number needed for each year. Do not include the number of teachers currently working in Title III English language instruction educational programs.
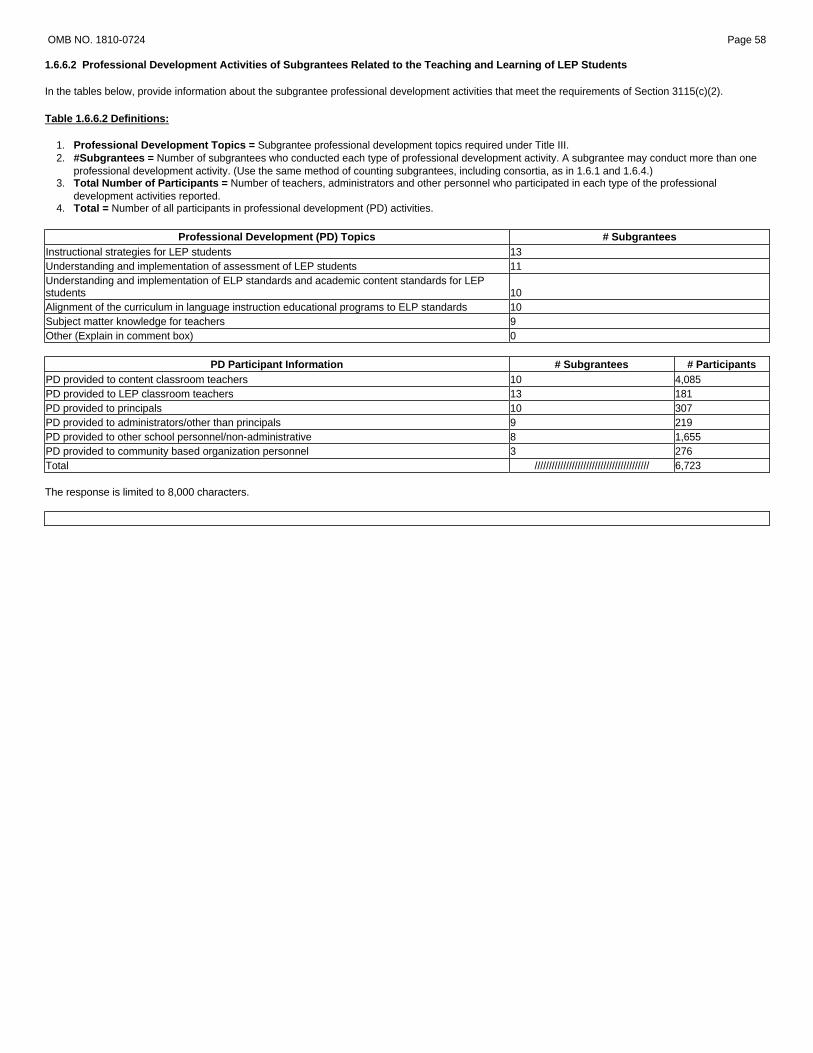
OMB NO. 1810-0724 Page 58
1.6.6.2 Professional Development Activities of Subgrantees Related to the Teaching and Learning of LEP Students
In the tables below, provide information about the subgrantee professional development activities that meet the requirements of Section 3115(c)(2).
Table 1.6.6.2 Definitions:
1. Professional Development Topics = Subgrantee professional development topics required under Title III. 2. #Subgrantees = Number of subgrantees who conducted each type of professional development activity. A subgrantee may conduct more than one
professional development activity. (Use the same method of counting subgrantees, including consortia, as in 1.6.1 and 1.6.4.) 3. Total Number of Participants = Number of teachers, administrators and other personnel who participated in each type of the professional
development activities reported. 4. Total = Number of all participants in professional development (PD) activities.
Professional Development (PD) Topics # Subgrantees Instructional strategies for LEP students 13 Understanding and implementation of assessment of LEP students 11 Understanding and implementation of ELP standards and academic content standards for LEP students 10 Alignment of the curriculum in language instruction educational programs to ELP standards 10 Subject matter knowledge for teachers 9 Other (Explain in comment box) 0
PD Participant Information # Subgrantees # Participants PD provided to content classroom teachers 10 4,085 PD provided to LEP classroom teachers 13 181 PD provided to principals 10 307 PD provided to administrators/other than principals 9 219 PD provided to other school personnel/non-administrative 8 1,655 PD provided to community based organization personnel 3 276 Total //////////////////////////////////////// 6,723
The response is limited to 8,000 characters.

OMB NO. 1810-0724 Page 59
1.6.7 State Subgrant Activities
This section collects data on State grant activities.
1.6.7.1 State Subgrant Process
In the table below, report the time between when the State receives the Title III allocation from ED, normally on July 1 of each year for the upcoming school year, and the time when the State distributes these funds to subgrantees for the intended school year. Dates must be submitted using the MM/DD/YY format.
Table 1.6.7.1 Definitions:
1. Date State Received Allocation = Annual date the State receives the Title III allocation from US Department of Education (ED). 2. Date Funds Available to Subgrantees = Annual date that Title III funds are available to approved subgrantees. 3. # of Days/$$ Distribution = Average number of days for States receiving Title III funds to make subgrants to subgrantees beginning from July 1 of
each year, except under conditions where funds are being withheld.
Example: State received SY 2014-15 funds July 1, 2014, and then made these funds available to subgrantees on August 1, 2014, for SY 2014-15 programs. Then the "# of days/$$ Distribution" is 30 days.
Date State Received Allocation Date Funds Available to Subgrantees # of Days/$$ Distribution 7/02/14 7/14/14 12 Comments: The response is limited to 4,000 characters.
1.6.7.2 Steps To Shorten the Distribution of Title III Funds to Subgrantees
In the comment box below, describe how your State can shorten the process of distributing Title III funds to subgrantees.
The response is limited to 8,000 characters.
The SEA significantly reduced the time in which subgrantees received funds this year. The SEA will continue to provide advanced technical assistance to support LEA's in completing their applications within an appropriate timeframe.
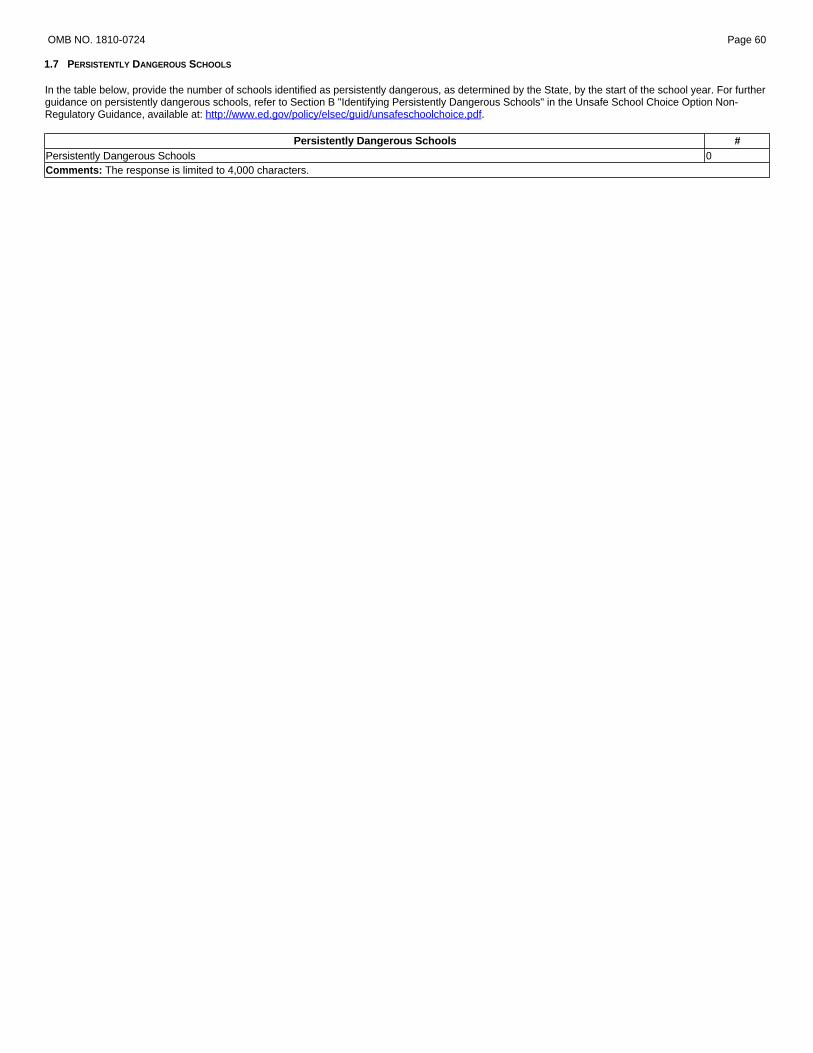
OMB NO. 1810-0724 Page 60
1.7 PERSISTENTLY DANGEROUS SCHOOLS
In the table below, provide the number of schools identified as persistently dangerous, as determined by the State, by the start of the school year. For further guidance on persistently dangerous schools, refer to Section B "Identifying Persistently Dangerous Schools" in the Unsafe School Choice Option Non-Regulatory Guidance, available at: http://www.ed.gov/policy/elsec/guid/unsafeschoolchoice.pdf.
Persistently Dangerous Schools # Persistently Dangerous Schools 0 Comments: The response is limited to 4,000 characters.
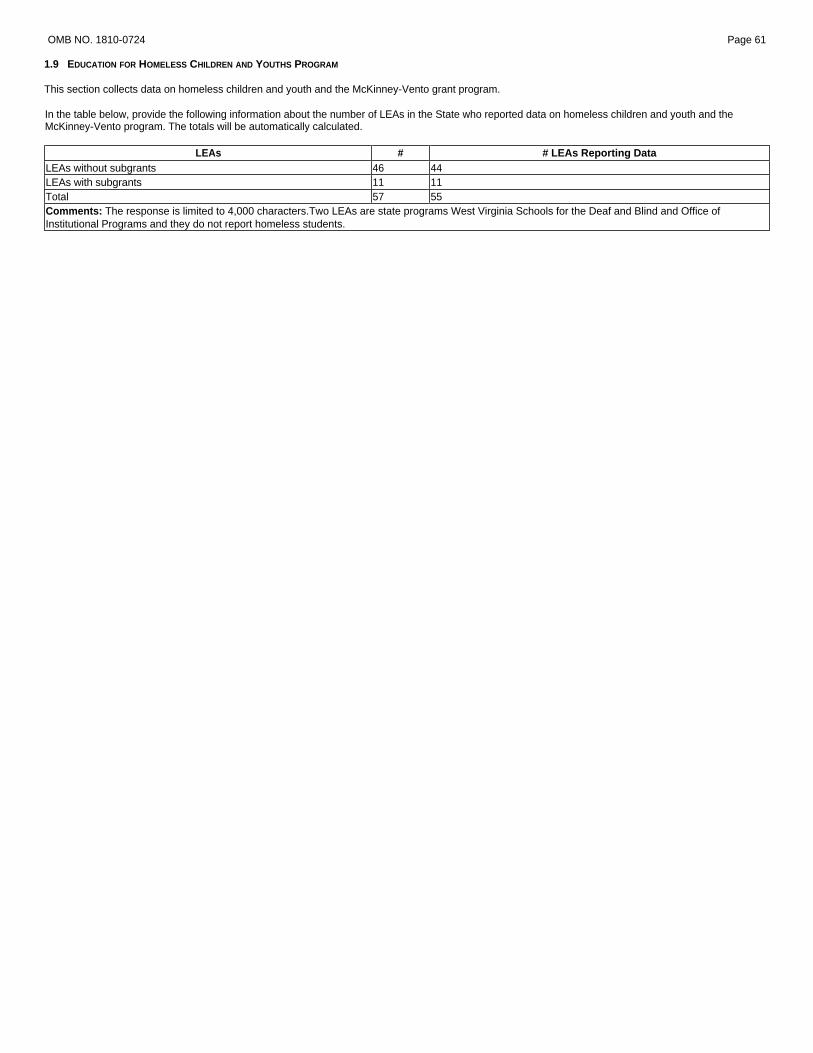
OMB NO. 1810-0724 Page 61
1.9 EDUCATION FOR HOMELESS CHILDREN AND YOUTHS PROGRAM
This section collects data on homeless children and youth and the McKinney-Vento grant program.
In the table below, provide the following information about the number of LEAs in the State who reported data on homeless children and youth and the McKinney-Vento program. The totals will be automatically calculated.
LEAs # # LEAs Reporting Data LEAs without subgrants 46 44 LEAs with subgrants 11 11 Total 57 55 Comments: The response is limited to 4,000 characters. Two LEAs are state programs West Virginia Schools for the Deaf and Blind and Office of Institutional Programs and they do not report homeless students.
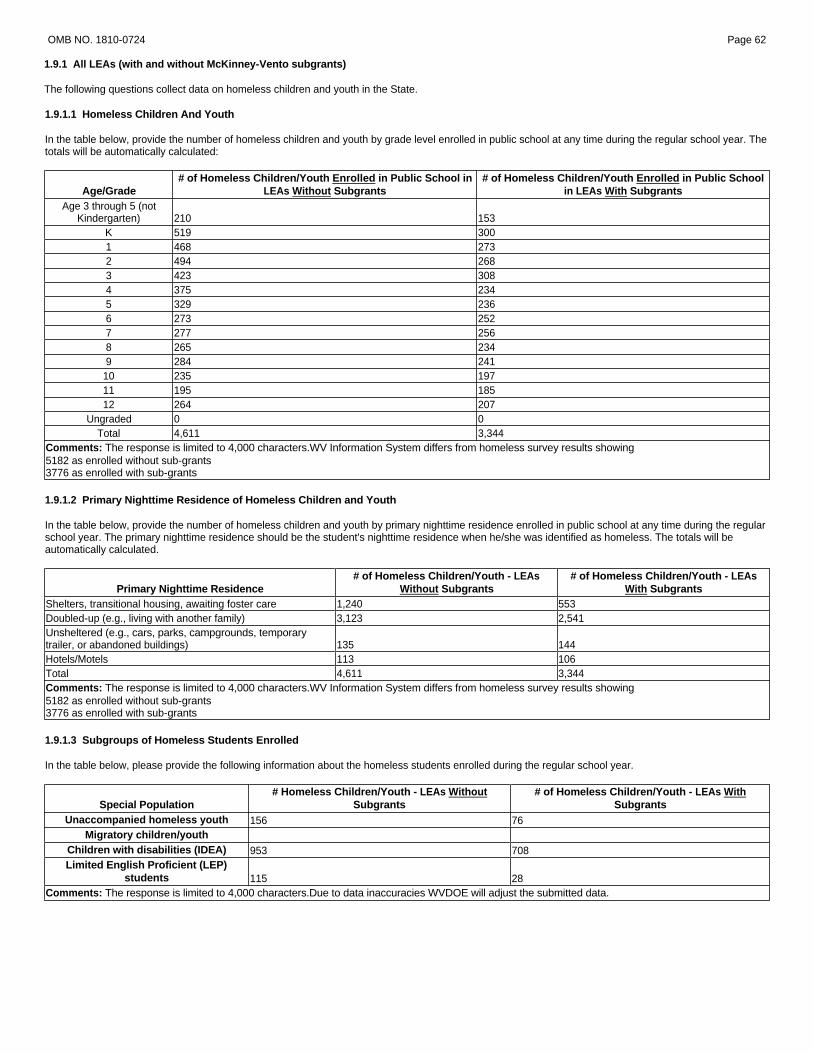
OMB NO. 1810-0724 Page 62
1.9.1 All LEAs (with and without McKinney-Vento subgrants)
The following questions collect data on homeless children and youth in the State.
1.9.1.1 Homeless Children And Youth
In the table below, provide the number of homeless children and youth by grade level enrolled in public school at any time during the regular school year. The totals will be automatically calculated:
Age/Grade Age 3 through 5 (not
Kindergarten) K 1 2 3 4 5 6 7 8 9 10 11 12
Ungraded Total
# of Homeless Children/Youth Enrolled in Public School in # of Homeless Children/Youth Enrolled in Public School LEAs Without Subgrants in LEAs With Subgrants
210 153 519 300 468 273 494 268 423 308 375 234 329 236 273 252 277 256 265 234 284 241 235 197 195 185 264 207 0 0 4,611 3,344
Comments: The response is limited to 4,000 characters. WV Information System differs from homeless survey results showing 5182 as enrolled without sub-grants 3776 as enrolled with sub-grants
1.9.1.2 Primary Nighttime Residence of Homeless Children and Youth
In the table below, provide the number of homeless children and youth by primary nighttime residence enrolled in public school at any time during the regular school year. The primary nighttime residence should be the student's nighttime residence when he/she was identified as homeless. The totals will be automatically calculated.
Primary Nighttime Residence # of Homeless Children/Youth - LEAs
Without Subgrants # of Homeless Children/Youth - LEAs
With Subgrants Shelters, transitional housing, awaiting foster care 1,240 553 Doubled-up (e.g., living with another family) 3,123 2,541 Unsheltered (e.g., cars, parks, campgrounds, temporary trailer, or abandoned buildings) 135 144 Hotels/Motels 113 106 Total 4,611 3,344 Comments: The response is limited to 4,000 characters. WV Information System differs from homeless survey results showing 5182 as enrolled without sub-grants 3776 as enrolled with sub-grants
1.9.1.3 Subgroups of Homeless Students Enrolled
In the table below, please provide the following information about the homeless students enrolled during the regular school year.
Special Population # Homeless Children/Youth - LEAs Without
Subgrants # of Homeless Children/Youth - LEAs With
Subgrants Unaccompanied homeless youth 156 76
Migratory children/youth Children with disabilities (IDEA) 953 708 Limited English Proficient (LEP)
students 115 28 Comments: The response is limited to 4,000 characters. Due to data inaccuracies WVDOE will adjust the submitted data.

OMB NO. 1810-0724 Page 63
1.9.2 LEAs with McKinney-Vento Subgrants
The following sections collect data on LEAs with McKinney-Vento subgrants.
1.9.2.1 Homeless Children and Youth Served by McKinney-Vento Subgrants
In the table below, provide the number of homeless children and youth by grade level who were served by McKinney-Vento subgrants during the regular school year. The total will be automatically calculated.
Age/Grade # Homeless Children/Youth Served by Subgrants Age Birth Through 2 0
Age 3 through 5 (not Kindergarten) 153 K 316 1 285 2 275 3 298 4 234 5 236 6 254 7 268 8 246 9 283
10 226 11 199 12 208
Ungraded 0 Total 3,481
Comments: The response is limited to 4,000 characters. Student Information System differs from Homeless Survey which shows 3776 as #homeless children/youth served by sub-grants.
1.9.2.2 Subgroups of Homeless Students Served
In the table below, please provide the following information about the homeless students served during the regular school year.
Subgroup # Homeless Students Served 85 0 671 28
Unaccompanied homeless youth Migratory children/youth Children with disabilities (IDEA) Limited English Proficient (LEP) students Comments: The response is limited to 4,000 characters.

OMB NO. 1810-0724 Page 64
1.9.3 Academic Achievement of Homeless Students
The following questions collect data on the academic achievement of enrolled homeless children and youth.
1.9.3.1 Reading Assessment
In the table below, provide the number of enrolled homeless children and youth who were tested on the State reading/language arts assessment and the number and percentage of those tested who scored at or above proficient. Provide data for grades 9 through 12 only for those grades tested for ESEA.
Grade
LEAs Without Subgrants # of Homeless Students Who Received a Valid Score and for Whom a Proficiency Level Was
Assigned
LEAs Without Subgrants - # of
Homeless Students Scoring
at or above Proficient
LEAs Without Subgrants - % of
Homeless Students Scoring at or
above Proficient
LEAs With Subgrants - # of Homeless Students Who Received a Valid Score and for Whom a Proficiency Level Was
Assigned
LEAs With Subgrants - # of
Homeless Students Scoring
at or above Proficient
LEAs With Subgrants - % of
Homeless Students Scoring
at or above Proficient
�� 2� 3� 3� 2� 2� 35
3 368 6 �� 254 6 4 321 6 3� 195 6 5 289 6 �� 199 6 6 234 6 3� 201 6 7 237 6 32 209 6 8 238 6 27 183 6
High School 142 6 3� 147 6 Comments: The response is limited to 4,000 characters.
1.9.3.2 Mathematics Assessment
This section is similar to 1.9.3.1. The only difference is that this section collects data on the State mathematics assessment.
Grade
LEAs Without Subgrants # of Homeless Students Who Received a Valid Score and for Whom a Proficiency Level Was
Assigned
LEAs Without Subgrants - # of
Homeless Students Scoring
at or above Proficient
LEAs Without Subgrants - % of
Homeless Students Scoring at or
above Proficient
LEAs With Subgrants - # of Homeless Students Who Received a Valid Score and for Whom a Proficiency Level Was
Assigned
LEAs With Subgrants - # of
Homeless Students Scoring
at or above Proficient
LEAs With Subgrants - % of
Homeless Students Scoring
at or above Proficient
29 24 22 12 12 17 8
3 368 S 31 252 72 4 322 S 23 195 46 5 292 S 16 198 44 6 234 S 18 201 24 7 238 S 17 208 25 8 239 S 10 184 31
High School 142 S 7 146 12 Comments: The response is limited to 4,000 characters.
1.9.3.3 Science Assessment
This section is similar to 1.9.3.1. The only difference is that this section collects data on the State science assessment.
Grade
LEAs Without Subgrants # of Homeless Students Who Received a Valid Score and for Whom a Proficiency Level Was
Assigned
LEAs Without Subgrants - # of
Homeless Students Scoring
at or above Proficient
LEAs Without Subgrants - % of
Homeless Students Scoring at or
above Proficient
LEAs With Subgrants - # of Homeless Students Who Received a Valid Score and for Whom a Proficiency Level Was
Assigned
LEAs With Subgrants - # of
Homeless Students Scoring
at or above Proficient
LEAs With Subgrants - % of
Homeless Students Scoring
at or above Proficient
26
23
25
3 0 0 4 319 S 25 185 S 5 6 230 S 28 199 S 7 8
High School 177 S 24 158 S Comments: The response is limited to 4,000 characters. Due to data inaccuracies WVDOE will adjust the submitted data.