consolidated monthly bulletins 2000 · consolidated monthly bulletins 2000 vol 37. nos. 1-12...
TRANSCRIPT

Government of the Republic of Trinidad and Tobago
MINISTRY OF ENERGY & ENERGY INDUSTRIES
CONSOLIDATED MONTHLY BULLETINS
2000 VOL 37. Nos. 1-12 January-December 2000

Government of Trinidad and Tobago Ministry of Energy and Energy Industries
DISCLAIMER
LIST OF ABBREVIATIONS USED
1 CRUDE OIL PRODUCTION 1.1 TABLE 1A CRUDE OIL PRODUCTION
2 DRILLING, COMPLETIONS AND WORKOVERS 2.1 TABLE 2A RIGS IN USE
2.2 TABLE 2B RIG DAYS
2.3 TABLE 2C DEPTH DRILLED
2.4 TABLE 2D WELLS OF INTEREST
2.5 TABLE 2E WELL COMPLETIONS
2.6 TABLE 2F MEEI APPROVED WORKOVERS COMPLETED
3 NATURAL GAS PRODUCTION AND UTILIZATION 3.1 TABLE 3A NATURAL GAS PRODUCTION BY COMPANY
3.2 TABLE 3B NATURAL GAS UTILIZATION BY SECTOR
4 CRUDE OIL - IMPORTS, EXPORTS AND REFINING 4.1 TABLE 4A CRUDE OIL IMPORTS
4.2 TABLE 4B CRUDE OIL EXPORTS
4.3 TABLE 4C REFINERY SALES
4.4 TABLE 4D REFINERY OUTPUT
4.5 TABLE 4E REFINERY THROUGHPUT
5 NATURAL GAS PROCESSING & 5.1 TABLE 5A PRODUCTION AND EXPORT OF NGLS FROM PPGPL
CONVERSION TO PETROCHEMICALS 5.2 TABLE 5B PRODUCTION AND EXPORT OF AMMONIA AND UREA
5.3 TABLE 5C PRODUCTION AND EXPORT OF METHANOL
5.4 TABLE 5D LNG PRODUCTION FROM ATLANTIC LNG
5.5 TABLE 5E LNG & NGL SALES FROM ATLANTIC LNG
TABLE OF CONTENTS
MEEI Bulletins Vol 37 Nos. 1-12 January - December 2000

Government of Trinidad and Tobago Ministry of Energy and Energy Industries
DISCLAIMER FOR MEEI CONSOLIDATED BULLETINS
The Ministry of Energy & Energy Industries (MEEI) does not accept responsibility for the accuracy, correctness or completeness of the contents of the
Bulletins and shall not be liable for any loss or damage that may be a consequence of direct or indirect use of, or reliance on, the publication.
The MEEI takes reasonable measures to ensure the quality of the data contained in the publication at the time of distribution. However, data values in future
Bulletins relating to previous periods are subject to amendment without notice. Organisations or individuals are asked to avail themselves of the most recent
version of the Bulletin at the time when it is required.
The MEEI makes no assertions that this document is free of infection by computer viruses or other contamination and will not be held responsible for such
losses and damages as a result of the infection.
MEEI Bulletins Vol 37 Nos. 1-12 January - December 2000

Government of Trinidad and Tobago Ministry of Energy and Energy Industries
1) Company and Facility Names
ADRIA7 - GSF Adriatic VII { drilling rig} NHETT - New Horizon Energy Trinidad and Tobago Ltd
ALNG - Atlantic LNG Company of Trinidad and Tobago Ltd OA - Ocean America {drilling rig}
ATGBV - Amoco Trinidad Gas B.V. PCS 01,02,03,04 - PCS Nitrogen Ammonia Plants 1, 2, 3, 4
BG - British Gas Trinidad and Tobago Limited PCS (Urea) - PCS Nitrogen Urea Plant
BP AMOCO - British Petroleum - AMOCO PKOOL - Petrokool
(changed to BPTT in late 2000) PTRIN - Petroleum Company of Trinidad and Tobago Ltd
BHP - BHP Petroleum Trinidad Limited POMS - Primera Oilfield Management Services
CDTO - Cliffs Drilling Trinidad Offshore Ltd PPGPL - Phoenix Park Gas Processors Ltd
CII - Coastline International Inc. PRIM - Primera Oil and Gas Ltd (formerly PCOL)
CMC (M2) - Caribbean Methanol Company Ltd {Methanol Plant} SUPSUN 10 - Super Sundowner Rig #10 {drilling rig}
EEPTL - Exxon Exploration & Production Trinidad Ltd TED - Trinidad Exploration and Development Limited
EOG - EOG Resources Trinidad Ltd TERL - Tracmac Energy Resources Trinidad Ltd
(formerly Enron Oil & Gas) TITAN - Titan Methanol Plant
FMCL - Farmland MissChem Ltd {Ammonia Plant} TRINGEN I & II - Trinidad Nitrogen Company Ltd Plants I & II
GLOMAR - Global Marine {rig contractor} TRINMAR - Petrotrin-Trinmar Strategic Business Unit
GSF - Global Santa Fe (rig contractor) TTMC I (M1) - Trinidad and Tobago Methanol Company Ltd {Methanol Plant I}
HATL - Hydro Agri Trinidad Ltd {Ammonia Plant} TTMC II (M3) - Trinidad and Tobago Methanol Company Ltd{ Methanol Plant II}
ISS - International Snubbing Services Ltd VOGTL - Vermilion Oil and Gas Trinidad Limited
LAB-1 Labrador #1 {drilling rig} VPTL - Venture Production Trinidad Ltd
LOL - Lease Operators Ltd WOWS - Water & Oilwell Services Company Ltd
M IV (M4) - Methanol IV Company Ltd Plant WSL - Well Services Petroleum Company Limited
MORA - Mora Oil Ventures Limited
NABSUN 801 - Nabors Sundowner 801 {drilling rig}
NGC - The National Gas Company of Trinidad & Tobago Ltd
LIST OF ABBREVIATIONS USED
MEEI Bulletins Vol 37 Nos. 1-12 January - December 2000

Government of Trinidad and Tobago Ministry of Energy and Energy Industries
2) Units 4) Other
BBLS - Barrels ATD - Authorised Total Depth
BCPD - Barrels of condensate per day DEV - Development
BOPD - Barrels of oil per day ECMA - East Coast Marine Area
BPCD - Barrels per calendar day EXPL - Exploration
FT - Feet FO - Farmouts
M^3 - Cubic Metres KOP - Kick-off Point
MMBTU - Millions of British Thermal Units LO - Lease Operators
MMSCF - Millions of Standard Cubic feet NCMA - North Coast Marine Area
MMSCF/D - Millions of Standard Cubic Feet per day PAP - Pointe-a-Pierre
MSCF - Thousands of Standard Cubic Feet ST - Sidetrack
MT - Metric Tonnes TD - Total Depth
wef - with effect from
3) Products wo - workover
LNG - Liquefied Natural Gas
LPG - Liquefied Petroleum Gas
NGLs - Natural Gas Liquids
LIST OF ABBREVIATIONS USED
MEEI Bulletins Vol 37 Nos. 1-12 January - December 2000
Government of Trinidad and Tobago Ministry of Energy and Energy Industries
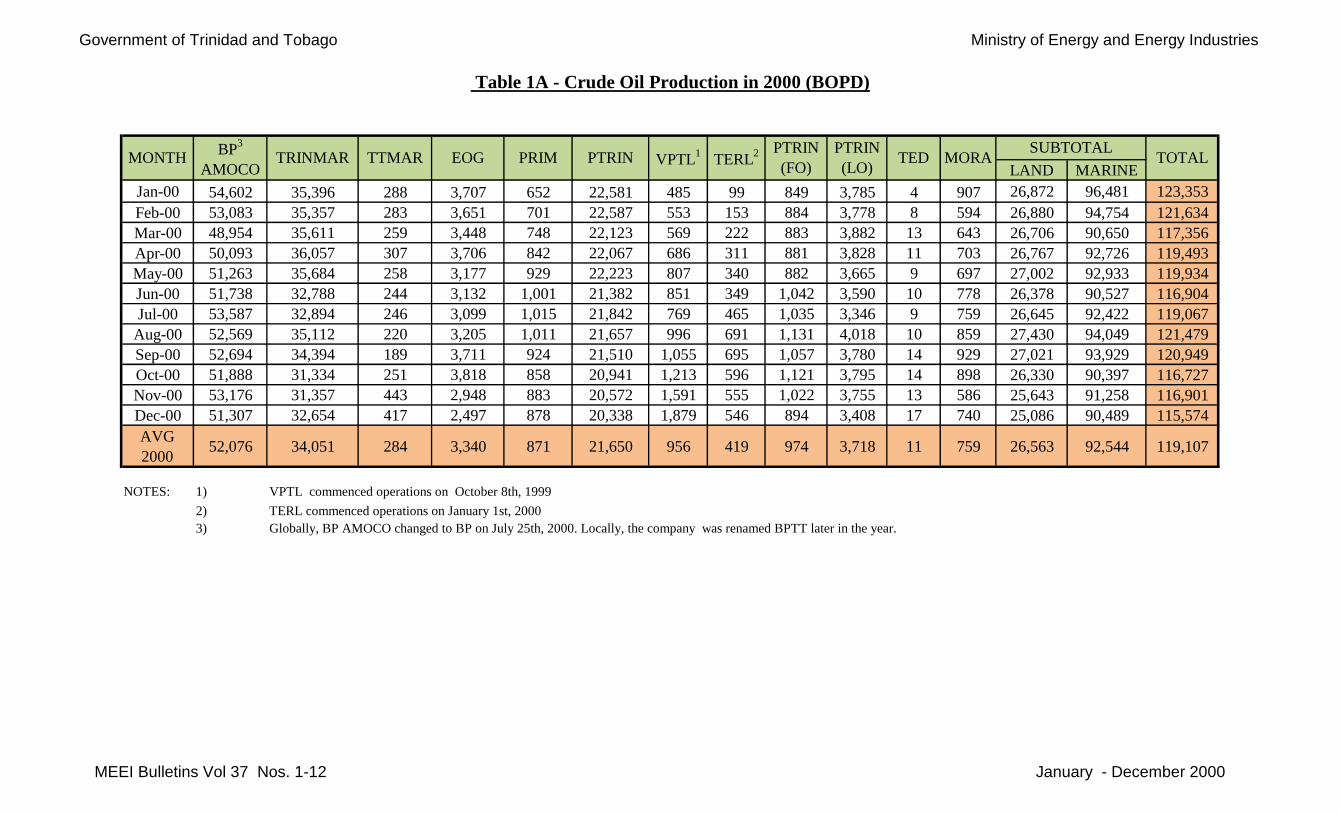
LAND MARINE
Jan-00 54,602 35,396 288 3,707 652 22,581 485 99 849 3,785 4 907 26,872 96,481 123,353
Feb-00 53,083 35,357 283 3,651 701 22,587 553 153 884 3,778 8 594 26,880 94,754 121,634
Mar-00 48,954 35,611 259 3,448 748 22,123 569 222 883 3,882 13 643 26,706 90,650 117,356
Apr-00 50,093 36,057 307 3,706 842 22,067 686 311 881 3,828 11 703 26,767 92,726 119,493
May-00 51,263 35,684 258 3,177 929 22,223 807 340 882 3,665 9 697 27,002 92,933 119,934
Jun-00 51,738 32,788 244 3,132 1,001 21,382 851 349 1,042 3,590 10 778 26,378 90,527 116,904
Jul-00 53,587 32,894 246 3,099 1,015 21,842 769 465 1,035 3,346 9 759 26,645 92,422 119,067
Aug-00 52,569 35,112 220 3,205 1,011 21,657 996 691 1,131 4,018 10 859 27,430 94,049 121,479
Sep-00 52,694 34,394 189 3,711 924 21,510 1,055 695 1,057 3,780 14 929 27,021 93,929 120,949
Oct-00 51,888 31,334 251 3,818 858 20,941 1,213 596 1,121 3,795 14 898 26,330 90,397 116,727
Nov-00 53,176 31,357 443 2,948 883 20,572 1,591 555 1,022 3,755 13 586 25,643 91,258 116,901
Dec-00 51,307 32,654 417 2,497 878 20,338 1,879 546 894 3,408 17 740 25,086 90,489 115,574
AVG
200052,076 34,051 284 3,340 871 21,650 956 419 974 3,718 11 759 26,563 92,544 119,107
NOTES: 1) VPTL commenced operations on October 8th, 1999
2) TERL commenced operations on January 1st, 2000
3) Globally, BP AMOCO changed to BP on July 25th, 2000. Locally, the company was renamed BPTT later in the year.
Table 1A - Crude Oil Production in 2000 (BOPD)
PRIMTRINMARBP
3
AMOCOMONTH TTMAR TEDEOG PTRIN VPTL
1 PTRIN
(FO)TERL
2 TOTALPTRIN
(LO)MORA
SUBTOTAL
MEEI Bulletins Vol 37 Nos. 1-12 January - December 2000

Government of Trinidad and Tobago Ministry of Energy and Energy Industries
BP AMOCO EOG ATGBV BHP TRINMAR PTRIN PTRIN (LO & FO) PRIM TERL
Jan-00 ISS 460 K ADRIA7 OA -CDTO RIG
#110WSL RIG #10
WSL RIG #14; WSL RIG
#10- -
Feb-00 ISS 460 K ADRIA7 OA -CDTO RIG
#110- WSL RIG #14 PKOOL RIG #1 -
Mar-00 - - OA -CDTO RIG
#110WSL RIG #1 WSL RIG #14
PKOOL RIG #1;
POMS RIG#1-
Apr-00 - - - ADRIA7CDTO RIG
#110WSL RIG #1 WSL RIG #14
PKOOL RIG #1;
POMS RIG#1 -
May-00 - - - ADRIA7CDTO RIG
#110WSL RIG #1
WSL RIG #14;WSL RIG
#1; LOL RIG #1
PKOOL RIG #1;
POMS RIG#1 -
Jun-00 SUPSUN; ADRIA7 - - ADRIA7CDTO RIG
#110-
WSL RIG #1; LOL RIG
#1- -
Jul-00 SUPSUN 10; ADRIA7;CDTO RIG #3 - - -CDTO RIG
#110-
WSL RIG #1; LOL RIG
#1-
POMS
RIG#1
Aug-00SUPSUN 10; ADRIA7;
CDTO RIG #3; NABSUN 801
GLOMAR
LAB 1- -
CDTO RIG
#110PTRIN RIG #1 WSL RIG #1 -
POMS
RIG#1
Sep-00SUPSUN 10; ADRIA7;
CDTO RIG #3; NABSUN 801
GLOMAR
LAB 1- -
CDTO RIG
#110PTRIN RIG #1 WSL RIG #1 -
POMS
RIG#1
Oct-00SUPSUN 10; ADRIA7;
CDTO RIG #3; NABSUN 801
GLOMAR
LAB 1- -
CDTO RIG
#110PTRIN RIG #1
WSL RIG #15;
WSL RIG #1-
POMS
RIG#1
Nov-00SUPSUN 10; ADRIA7;
CDTO RIG #3; NABSUN 801
GLOMAR
LAB 1- -
CDTO RIG
#110PTRIN RIG #1
WSL RIG #15;
WSL RIG #1- -
Dec-00SUPSUN 10; ADRIA7;
CDTO RIG #3; NABSUN 10
GLOMAR
LAB 1- -
CDTO RIG
#110PTRIN RIG #1 WSL RIG #1 - -
Table 2A - Drilling & Workover Rigs in Use in 2000
MARINE LANDMONTH
MEEI Bulletins Vol 37 Nos. 1-12 January - December 2000

Government of Trinidad and Tobago Ministry of Energy and Energy Industries
MONTHBP
AMOCOTERL ATGBV TRINMAR PTRIN
PTRIN (LO
& FO)VPTL EOG PRIM BHP TOTAL
Jan-00 31 - 31 31 14 46 - 31 - - 184
Feb-00 29 - 29 29 - 29 - 11 23 - 150
Mar-00 - - 31 31 19 31 - - 72 - 184
Apr-00 - - - 30 30 24 - - 78 - 162
May-00 - - - 31 25 72 - - 41 285 454
Jun-00 23 27 - 30 - 53 - - - 24 157
Jul-00 73 22 - 31 - 27 - - - - 153
Aug-00 111 31 - 31 24 27 - 21 - - 245
Sep-00 109 27 - 30 30 28 - 30 - - 254
Oct-00 82 - - 26 31 52 - 31 - - 221
Nov-00 90 - - 30 24 39 8 30 - - 221
Dec-00 80 - - 31 24 19 31 31 - - 216
TOTAL 627 107 91 361 221 446 39 185 214 309 2,600
Table 2B - Rig Days in 2000
MEEI Bulletins Vol 37 Nos. 1-12 January - December 2000

Government of Trinidad and Tobago Ministry of Energy and Energy Industries
MONTHBP
AMOCOVPTL PRIM TRINMAR PTRIN
PTRIN
(LO)
PTRIN
(FO)BHP TERL EOG ATGBV TOTAL
Jan-00 2,279 - - 11,639 2,841 6,654 - - - 9,157 7,411 39,981
Feb-00 - - 3,910 16,703 - 3,375 - - - 570 7,860 32,418
Mar-00 - - 19,422 10,015 6,650 330 - - - - 3,300 39,717
Apr-00 - - 20,422 5,194 4,020 4,405 - - - - - 34,041
May-00 - - 7,741 4,704 4,870 10,236 6,680 6,680 - - - 40,911
Jun-00 650 - - 6,500 - - - - 4,870 - - 12,020
Jul-00 19,695 8,726 - 7,353 - 8,726 - - 5,473 - - 49,973
Aug-00 24,333 - - 7,500 4,840 9,171 - - 5,589 6,295 - 57,728
Sep-00 11,045 - - 6,950 5,541 9,320 - - 2,346 8,045 - 43,247
Oct-00 19,514 - - 7,424 6,756 11,482 - - - 549 - 45,725
Nov-00 17,538 1,367 - 9,129 4,194 7,445 - - - 484 - 40,157
Dec-00 6,890 5,584 - 5,320 2,203 5,971 - - - 677 - 26,645
TOTAL 101,944 15,677 51,495 98,431 41,915 77,115 6,680 6,680 18,278 25,777 18,571 462,563
Table 2C - Depth Drilled in 2000 (FT)
MEEI Bulletins Vol 37 Nos. 1-12 January - December 2000

Government of Trinidad and Tobago Ministry of Energy and Energy Industries
SOLDADO 795 CDTO RIG #110 DEV 6050 5648
SOLDADO 796 CDTO RIG #110 DEV 4100 3268
SOLDADO 797 CDTO RIG #110 DEV 3350 3286
SOLDADO 798 CDTO RIG #110 DEV 4650 4560
SOLDADO 799 CDTO RIG #110 DEV 4015 4355
SOLDADO 800 CDTO RIG #110 DEV 4500 4736
SOLDADO 801 CDTO RIG #110 DEV 4528 4750
SOLDADO 802 CDTO RIG #110 DEV 3840 3743
SOLDADO 803 CDTO RIG #110 DEV 3944 1608
SOLDADO 804 CDTO RIG #110 DEV 6550 6600
SOLDADO 805 CDTO RIG #110 DEV 7150 7150
SOLDADO 806 CDTO RIG #110 DEV 6550 6500
SOLDADO 807 CDTO RIG #110 DEV 4050 3900
SOLDADO 808 CDTO RIG #110 DEV 3550 3453
SOLDADO 809 CDTO RIG #110 DEV 7582 7500
SOLDADO 810 CDTO RIG #110 DEV 7150 6950
SOLDADO 811 CDTO RIG #110 DEV 7492 7424
SOLDADO 308XST CDTO RIG #110 DEV 4425 4600
SOLDADO 404X CDTO RIG #110 DEV 5900 5900/6000
SOLDADO 812 CDTO RIG #110 DEV 6550 6550/6810
SOLDADO 813 CDTO RIG #110 DEV 7350 5320
TANAGER 1 ADRIA EXPL (A-3) 18000 17627
OSPREY OA-2 (ST-3) GLOMAR LAB #1 SEMI-EXPL(A2b) 19119 16050
FOREST RESERVE 1612 WSL RIG #10 DEV 4000 3976
FOREST RESERVE 1613 WSL RIG #1 DEV 1810 1810
FOREST RESERVE 1614 WSL RIG #1 DEV 5450 5381
FOREST RESERVE 1615 WSL RIG #1 DEV 2800 3479
FOREST RESERVE 1616 ST WSL RIG #1 DEV 5450 5381
FOREST RESERVE 1618 GBS #1 DEV 1000 1000
POINT FORTIN CENTRAL 437 PTRIN RIG #1 DEV 3700 3840
POINT FORTIN CENTRAL 438 PTRIN RIG #1 DEV 3500 815
POINT FORTIN CENTRAL 439 PTRIN RIG #1 DEV 4150 4726
POINT FORTIN CENTRAL 439X PTRIN RIG #1 DEV 4000 4000
POINT FORTIN CENTRAL 440 PTRIN RIG #1 DEV 3900 3956
FOREST RESERVE 1619 ST PTRIN RIG #1 DEV 4450 4505
FOREST RESERVE 1620 PTRIN RIG #1 DEV 1600 1600
FOREST RESERVE 1621 PTRIN RIG #1 DEV 1825 292
TABAQUITE 231X ST2 WSL RIG #14 DEV 2481 2006
TABAQUITE 241 WSL RIG #14 DEV 2747 2150
FOREST RESERVE 1611 ST WSL RIG #14 DEV 4400 4300
PALO SECO 1468 WSL RIG #10 DEV 4150 4175
TABAQUITE 241X ST2 WSL RIG #14 DEV 2229 2200
TABAQUITE 242XST4 WSL RIG #14 DEV 2010 1780
TABAQUITE 243 WSL RIG #14 EXPL (A-1) 2500 2500
TABAQUITE 244 ST WSL RIG #14 DEV 1600 1905
MORNE DIABLO 77 LOL RIG #1 DEV 320 305
MORNE DIABLO 78 LOL RIG #1 DEV 350 330
MORNE DIABLO 79 LOL RIG #1 DEV 380 350
MORNE DIABLO 80 LOL RIG #1 DEV 380 350
MORNE DIABLO 81 LOL RIG #1 DEV 380 350
MORNE DIABLO 82 LOL RIG #1 DEV 380 350
MORNE DIABLO 83 LOL RIG #1 DEV 380 350
MORNE DIABLO 84 LOL RIG #1 DEV 380 350
TRINMAR
PTRIN
EOG
Table 2D - Wells Started in 2000
COMPANY /
OPERATORRIG NAME CLASSIFICATION ATD (ft)TD (ft)WELL NUMBER
PTRIN
(LO/FO)
MEEI Bulletins Vol 37 Nos. 1-12 January - December 2000

Government of Trinidad and Tobago Ministry of Energy and Energy Industries
Table 2D - Wells Started in 2000
COMPANY /
OPERATORRIG NAME CLASSIFICATION ATD (ft)TD (ft)WELL NUMBER
MORNE DIABLO 85 LOL RIG #1 DEV 350 350
MORNE DIABLO 86 LOL RIG #1 DEV 350 380
PTRIN
(LO/FO)
MEEI Bulletins Vol 37 Nos. 1-12 January - December 2000

Government of Trinidad and Tobago Ministry of Energy and Energy Industries
PTRIN TERL TRINMARBP
AMOCO
PTRIN
(LO &
FO)
PRIMTOTAL
OIL
BP
AMOCOTOTAL GAS ATGBV
BP
AMOCO
TOTAL
OTHER
Jan-00 - - - - - - 0 - 0 1 - 1 1
Feb-00 1 - - 1 - 1 3 - 0 - - 0 3
Mar-00 - - 4 - 3 4 11 - 0 - - 0 11
Apr-00 - - 1 - 6 9 16 - 0 1 - 1 17
May-00 - - 1 - 2 6 9 - 0 - - 0 9
Jun-00 3 - 1 - 1 - 5 - 0 - - 0 5
Jul-00 1 2 2 - 29 - 34 - 0 - 1 1 35
Aug-00 - 1 1 1 1 - 4 - 0 - - 0 4
Sep-00 1 2 1 - 2 - 6 - 0 - 1 1 7
Oct-00 - 1 1 1 1 - 4 2 2 - - 0 6
Nov-00 3 1 1 - 1 - 6 - 0 - - 0 6
Dec-00 1 - 1 1 - - 3 2 2 - - 0 5
TOTAL 10 7 14 4 46 20 101 4 4 2 2 4 109
NOTE: * INCLUDES ABANDONMENTS
Table 2E - Well Completions in 2000
MONTH
WELL COMPLETIONS - OIL
TOTAL
COMPLETIONS
* WELL COMPLETIONS -
OTHER
WELL COMPLETIONS -
GAS
MEEI Bulletins Vol 37 Nos. 1-12 January - December 2000

Government of Trinidad and Tobago Ministry of Energy and Energy Industries
MONTHBP
AMOCOMORA PRIM TRINMAR PTRIN
PTRIN
(LO)
PTRIN
(FO)VPTL TED
TOTAL
Workovers
Completed
Jan-00 - - - 3 10 2 1 - - 16
Feb-00 - - 1 2 5 2 - - - 10
Mar-00 3 - 2 2 7 1 - - - 15
Apr-00 3 1 1 5 9 5 - - - 24
May-00 - 1 - 3 12 2 - - - 18
Jun-00 2 - 3 - 10 1 - - - 16
Jul-00 1 - 4 1 6 3 - - - 15
Aug-00 - 1 - 3 11 5 1 - - 21
Sep-00 - - - 3 3 3 - - 1 10
Oct-00 2 - 1 2 13 3 - 3 - 24
Nov-00 3 - 1 3 15 4 - - - 26
Dec-00 1 - 2 2 9 5 - 1 3 23
TOTAL 15 3 15 29 110 36 2 4 4 218
Table 2F - MEEI Approved Workovers Completed in 2000
MEEI Bulletins Vol 37 Nos. 1-12 January - December 2000

Government of Trinidad and Tobago Ministry of Energy and Energy Industries
COMPANY Jan-00 Feb-00 Mar-00 Apr-00 May-00 Jun-00 Jul-00 Aug-00 Sep-00 Oct-00 Nov-00 Dec-00 AVG 2000
BP AMOCO 972 911 962 972 883 1,066 1,073 1,129 1,163 1,141 1179 1,201 1,054
TRINMAR 45 40 45 42 48 43 40 42 42 39 37 42 42
PTRIN 15 14 15 15 15 14 15 17 17 17 17 17 16
EOG 152 153 153 138 137 137 141 151 182 183 141 126 150
BG 226 210 210 236 280 280 270 228 229 214 244 191 235
CII 1 1 1 1 1 - 1 1 1 1 1 - 1
MORA 1 1 1 1 1 1 1 1 1 1 - - 1
TOTAL 1,412 1,330 1,387 1,405 1,365 1,541 1,541 1,569 1,635 1,596 1,619 1,577 1,498
SECTOR Jan-00 Feb-00 Mar-00 Apr-00 May-00 Jun-00 Jul-00 Aug-00 Sep-00 Oct-00 Nov-00 Dec-00 AVG 2000
Power Generation 180 179 167 174 192 202 196 187 191 196 195 180 186
Ammonia Manufacture 295 297 293 303 289 349 408 372 397 398 404 405 351
Methanol Manufacture 189 191 204 211 212 239 240 248 291 285 270 281 238
Refinery 47 46 39 37 51 51 49 51 50 53 49 40 47
Iron & Steel Manufacture 61 50 52 63 55 47 70 64 65 66 60 51 59
Cement Manufacture 13 13 12 13 14 12 12 12 12 11 14 10 12
Urea Manufacture 9 10 10 11 11 11 10 11 11 10 10 10 10
Small Consumers 14 17 15 16 17 18 12 10 11 10 13 10 14
Gas Processing 11 12 10 11 10 21 24 24 26 26 24 27 19
Liquefied Natural Gas (LNG) 467 381 432 447 401 468 399 452 447 441 449 440 435
TOTAL 1,286 1,197 1,234 1,286 1,252 1,418 1,419 1,431 1,501 1,497 1,486 1,455 1,372
Table 3A - Natural Gas Production By Company in 2000 (MMSCF/D)
Table 3B - Natural Gas Utilization By Sector in 2000 (MMSCF/D)
MEEI Bulletins Vol 37 Nos. 1-12 January - December 2000

Government of Trinidad and Tobago Ministry of Energy and Energy Industries
CRUDE TYPE COUNTRY Jan-00 Feb-00 Mar-00 Apr-00 May-00 Jun-00 Jul-00 Aug-00 Sep-00 Oct-00 Nov-00 Dec-00 TOTAL
Cano Limon Colombia - 552,151 - - 1,098,897 - 552,765 - - - 433,534 424,332 3,061,679
Mandji Crude Gabon - - 738,539 737,782 738,884 - 749,706 - 755,806 - 733,072 - 4,453,789
Marlim Crude Brazil - - - - - - - - - - 521,167 548,543 1,069,710
Mesa Venezuela 2,106,194 2,187,958 1,094,292 1,098,745 1,098,682 1,639,903 1,649,946 1,145,727 1,661,296 2,164,462 1,070,511 1,647,862 18,565,578
Ogeundjo Blend Gabon - - - - - - - - - - - 552,479 552,479
Oriente Ecuador 378,751 - - - - - - - - - 376,320 - 755,071
Saramacca Suriname 76,543 32,592 74,885 80,034 94,950 41,054 132,226 94,258 44,679 84,545 40,073 39,591 835,430
Vasconia Colombia 1,045,884 482,606 - - 524,382 1,073,707 523,509 500,273 522,277 551,034 573,733 5,797,405
Woodbourne Barbados 42,298 43,757 43,349 44,465 42,972 43,577 42,167 40,743 45,019 44,247 43,427 89,545 565,566
TOTAL 3,649,670 3,299,064 1,951,065 1,961,026 3,598,767 2,798,241 3,650,319 1,781,001 2,506,800 2,815,531 3,769,138 3,876,085 35,656,707
CRUDE TYPE Jan-00 Feb-00 Mar-00 Apr-00 May-00 Jun-00 Jul-00 Aug-00 Sep-00 Oct-00 Nov-00 Dec-00 TOTAL
Galeota Mix 1,217,045 1,511,537 1,906,209 1,171,864 1,570,084 1,557,732 1,703,595 1,700,771 1,753,000 1,681,795 1,694,949 1,725,500 19,194,081
Table 4A - Crude Oil Imports in 2000 (BBLs)
Table 4B - Crude Oil Exports in 2000 (BBLs)
MEEI Bulletins Vol 37 Nos. 1-12 January - December 2000
Government of Trinidad and Tobago Ministry of Energy and Energy Industries
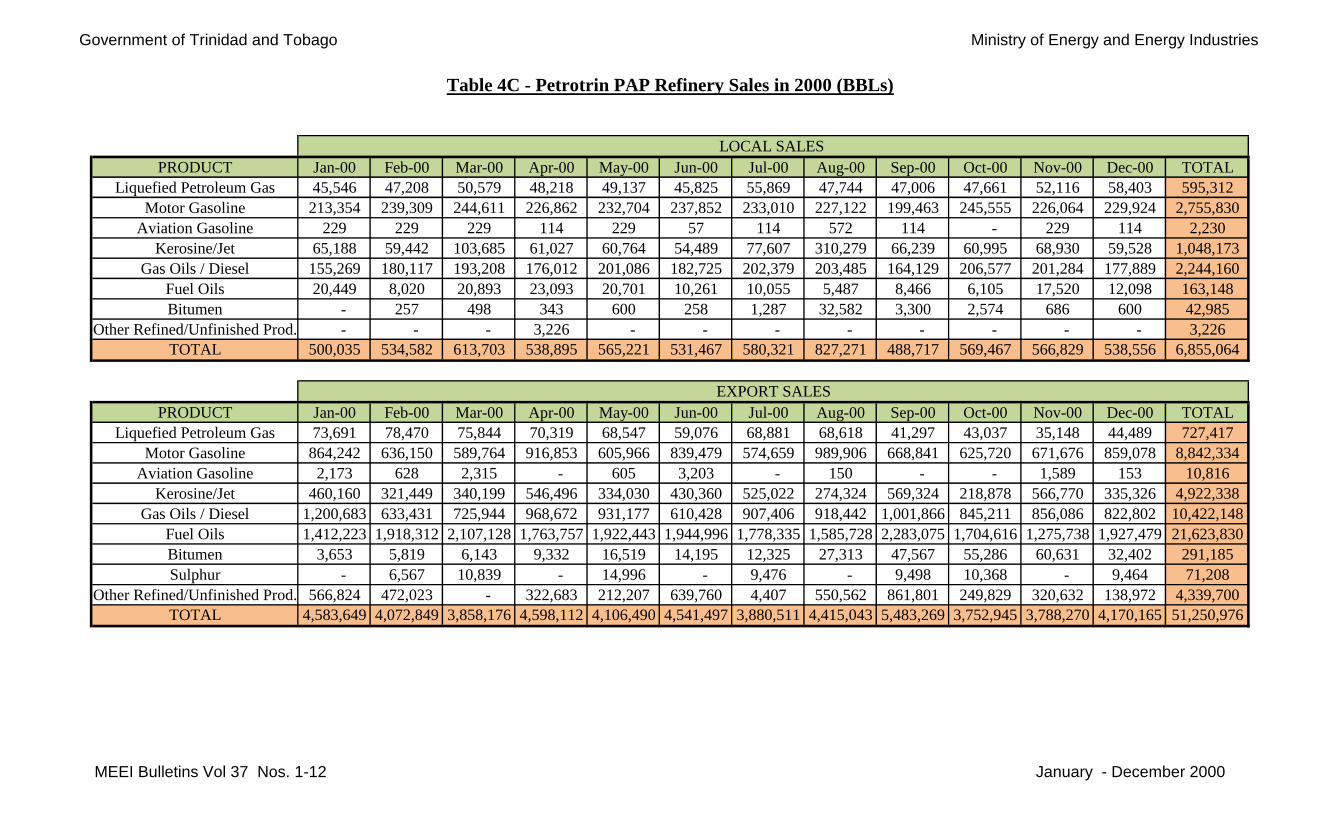
PRODUCT Jan-00 Feb-00 Mar-00 Apr-00 May-00 Jun-00 Jul-00 Aug-00 Sep-00 Oct-00 Nov-00 Dec-00 TOTAL
Liquefied Petroleum Gas 45,546 47,208 50,579 48,218 49,137 45,825 55,869 47,744 47,006 47,661 52,116 58,403 595,312
Motor Gasoline 213,354 239,309 244,611 226,862 232,704 237,852 233,010 227,122 199,463 245,555 226,064 229,924 2,755,830
Aviation Gasoline 229 229 229 114 229 57 114 572 114 - 229 114 2,230
Kerosine/Jet 65,188 59,442 103,685 61,027 60,764 54,489 77,607 310,279 66,239 60,995 68,930 59,528 1,048,173
Gas Oils / Diesel 155,269 180,117 193,208 176,012 201,086 182,725 202,379 203,485 164,129 206,577 201,284 177,889 2,244,160
Fuel Oils 20,449 8,020 20,893 23,093 20,701 10,261 10,055 5,487 8,466 6,105 17,520 12,098 163,148
Bitumen - 257 498 343 600 258 1,287 32,582 3,300 2,574 686 600 42,985
Other Refined/Unfinished Prod. - - - 3,226 - - - - - - - - 3,226
TOTAL 500,035 534,582 613,703 538,895 565,221 531,467 580,321 827,271 488,717 569,467 566,829 538,556 6,855,064
PRODUCT Jan-00 Feb-00 Mar-00 Apr-00 May-00 Jun-00 Jul-00 Aug-00 Sep-00 Oct-00 Nov-00 Dec-00 TOTAL
Liquefied Petroleum Gas 73,691 78,470 75,844 70,319 68,547 59,076 68,881 68,618 41,297 43,037 35,148 44,489 727,417
Motor Gasoline 864,242 636,150 589,764 916,853 605,966 839,479 574,659 989,906 668,841 625,720 671,676 859,078 8,842,334
Aviation Gasoline 2,173 628 2,315 - 605 3,203 - 150 - - 1,589 153 10,816
Kerosine/Jet 460,160 321,449 340,199 546,496 334,030 430,360 525,022 274,324 569,324 218,878 566,770 335,326 4,922,338
Gas Oils / Diesel 1,200,683 633,431 725,944 968,672 931,177 610,428 907,406 918,442 1,001,866 845,211 856,086 822,802 10,422,148
Fuel Oils 1,412,223 1,918,312 2,107,128 1,763,757 1,922,443 1,944,996 1,778,335 1,585,728 2,283,075 1,704,616 1,275,738 1,927,479 21,623,830
Bitumen 3,653 5,819 6,143 9,332 16,519 14,195 12,325 27,313 47,567 55,286 60,631 32,402 291,185
Sulphur - 6,567 10,839 - 14,996 - 9,476 - 9,498 10,368 - 9,464 71,208
Other Refined/Unfinished Prod. 566,824 472,023 - 322,683 212,207 639,760 4,407 550,562 861,801 249,829 320,632 138,972 4,339,700
TOTAL 4,583,649 4,072,849 3,858,176 4,598,112 4,106,490 4,541,497 3,880,511 4,415,043 5,483,269 3,752,945 3,788,270 4,170,165 51,250,976
Table 4C - Petrotrin PAP Refinery Sales in 2000 (BBLs)
EXPORT SALES
LOCAL SALES
MEEI Bulletins Vol 37 Nos. 1-12 January - December 2000

Government of Trinidad and Tobago Ministry of Energy and Energy Industries
PRODUCT Jan-00 Feb-00 Mar-00 Apr-00 May-00 Jun-00 Jul-00 Aug-00 Sep-00 Oct-00 Nov-00 Dec-00 TOTAL
Liquefied Petroleum Gas 112,324 127,620 128,671 115,755 118,015 100,167 133,792 107,623 93,939 86,610 83,944 102,216 1,310,676
Motor Gasoline 921,380 1,026,053 1,089,032 902,364 881,675 990,233 1,016,044 888,160 849,488 917,675 956,070 1,127,871 11,566,045
Aviation Gasoline (119) (899) (231) (471) (12) (781) (874) 5,987 (3,345) 5,209 (1,633) (1,499) 1,332
Kerosine/Jet 516,882 459,520 325,094 606,024 503,340 496,364 558,199 466,175 500,558 479,677 461,573 560,490 5,933,896
Gas Oils / Diesel 989,622 1,079,003 990,580 858,190 1,035,953 1,016,296 1,245,898 1,186,987 1,027,956 1,121,553 1,130,154 1,107,703 12,789,895
Fuel Oils 1,899,716 1,705,084 2,026,610 1,773,587 2,277,533 1,903,686 1,728,870 1,648,196 1,930,293 1,496,389 1,644,632 1,967,235 22,001,831
Bitumen 23 3,371 8,169 9,902 17,698 14,324 14,688 30,182 56,156 52,261 63,525 37,716 308,015
Sulphur 3,979 4,833 9,848 1,639 3,443 4,054 9,443 3,943 2,860 3,709 3,716 838 52,305
Other Refined/Unfinished Prod. 302,690 395,856 260,590 290,572 158,427 117,047 464,302 361,471 376,174 241,786 321,303 317,419 3,607,637
Refinery Gas and Loss/(Gain) 109,659 79,777 216,756 101,891 93,735 197,923 116,788 86,296 6,635 65,352 181,483 131,045 1,387,340
TOTAL 4,856,156 4,880,218 5,055,119 4,659,453 5,089,807 4,839,313 5,287,150 4,785,020 4,840,714 4,470,221 4,844,767 5,351,034 58,958,972
Jan-00 Feb-00 Mar-00 Apr-00 May-00 Jun-00 Jul-00 Aug-00 Sep-00 Oct-00 Nov-00 Dec-00 AVG
Throughput (BBLs) 4,856,156 4,880,218 5,055,119 4,659,453 5,089,807 4,839,313 5,287,150 4,785,020 4,840,714 4,470,221 4,844,767 5,351,034 4,913,248
Throughput (BOPD) 156,650 174,294 163,068 155,315 164,187 161,310 170,553 154,355 161,357 144,201 161,492 172,614 161,616
Table 4D - Petrotrin PAP Refinery Output in 2000 (BBLs)
Table 4E - Petrotrin PAP Refinery Throughput in 2000 (BOPD)
MEEI Bulletins Vol 37 Nos. 1-12 January - December 2000

Government of Trinidad and Tobago Ministry of Energy and Energy Industries
Jan-00 Feb-00 Mar-00 Apr-00 May-00 Jun-00 Jul-00 Aug-00 Sep-00 Oct-00 Nov-00 Dec-00 TOTAL
Propane 228,091 212,044 230,117 227,189 216,930 249,991 255,992 247,334 266,773 272,666 239,748 254,410 2,901,285
Butane 150,407 140,866 151,413 147,779 143,086 161,121 174,637 164,031 183,990 183,349 169,727 174,968 1,945,374
Natural
Gasoline155,989 148,127 161,043 157,580 150,657 170,485 186,505 190,898 193,124 197,887 178,969 194,277 2,085,541
TOTAL 534,487 501,037 542,573 532,548 510,673 581,597 617,134 602,263 643,887 653,902 588,444 623,655 6,932,200
Propane 248,366 189,590 266,125 188,155 246,534 172,334 243,145 243,145 224,777 240,846 270,683 295,780 2,829,480
Butane 234,127 77,614 153,859 172,552 103,521 110,322 176,962 176,962 143,243 120,203 42,916 167,212 1,679,493
Natural
Gasoline0 79,825 245,195 231,946 235,431 0 200,418 221,703 115,256 293,041 220,608 303,837 2,147,260
TOTAL 482,493 347,029 665,179 592,653 585,486 282,656 620,525 641,810 483,276 654,090 534,207 766,829 6,656,233
NOTE:
PRODUCTION
of NGLs
(in BBLs)
EXPORT of
NGLs
(in BBLs)
Table 5A - Production and Export of NGLs from PPGPL in 2000
Local NGL sales from ALNG are to mainly PPGPL. These sold NGL volumes have been included in PPGPL's production data.
MEEI Bulletins Vol 37 Nos. 1-12 January - December 2000

Government of Trinidad and Tobago Ministry of Energy and Energy Industries
Production of
Ammonia (MT)Jan-00 Feb-00 Mar-00 Apr-00 May-00 Jun-00 Jul-00 Aug-00 Sep-00 Oct-00 Nov-00 Dec-00 TOTAL
HATL 27,389 25,618 23,206 26,518 27,500 26,585 27,488 27,824 27,124 23,218 26,159 24,040 312,669
Tringen I 42,030 39,905 39,361 41,305 41,963 41,055 41,504 41,608 39,621 42,423 41,076 32,412 484,263
Tringen II 47,820 44,715 46,181 46,220 43,232 46,307 45,644 45,777 45,100 48,937 47,182 45,122 552,237
PCS (01,02,03 & 04) 81,758 57,946 64,191 73,101 56,064 89,700 154,195 114,946 144,075 142,834 144,823 153,871 1,277,504
FMCL 38,483 41,891 56,955 55,973 57,929 52,989 58,492 49,554 53,242 55,366 54,784 51,555 627,214
TOTAL 237,480 210,075 229,895 243,116 226,688 256,636 327,323 279,709 309,162 312,778 314,024 307,001 3,253,887
Production of Urea
(MT)Jan-00 Feb-00 Mar-00 Apr-00 May-00 Jun-00 Jul-00 Aug-00 Sep-00 Oct-00 Nov-00 Dec-00 TOTAL
PCS (Urea) 33,688 39,508 40,154 49,618 39,317 50,337 50,702 53,768 51,586 56,743 44,658 55,051 565,130
Export of Ammonia
(MT)Jan-00 Feb-00 Mar-00 Apr-00 May-00 Jun-00 Jul-00 Aug-00 Sep-00 Oct-00 Nov-00 Dec-00 TOTAL
HATL 13,000 43,654 22,920 18,533 33,946 20,812 31,863 21,859 31,839 22,885 11,792 34,061 307,164
Tringen I 42,820 47,668 32,484 33,900 66,314 31,837 23,561 60,315 48,337 34,636 42,985 20,739 485,596
Tringen II 69,934 14,985 34,157 68,414 45,675 37,848 36,627 35,772 52,423 65,453 37,361 54,422 553,071
PCS (01,02,03 & 04) 97,131 23,772 54,684 41,429 30,312 30,060 109,766 77,232 150,268 91,952 112,276 138,742 957,624
FMCL 41,283 44,229 77,637 57,990 60,932 44,226 60,930 44,225 44,229 57,988 30,462 74,686 638,817
TOTAL 264,169 174,308 221,882 220,266 237,179 164,783 262,747 239,403 327,096 272,914 234,876 322,650 2,942,272
Export of Urea (MT) Jan-00 Feb-00 Mar-00 Apr-00 May-00 Jun-00 Jul-00 Aug-00 Sep-00 Oct-00 Nov-00 Dec-00 TOTAL
PCS (Urea) 51,306 31,892 44,203 43,859 39,572 49,775 42,179 58,222 31,483 41,114 43,314 38,605 515,525
Table 5B - Production and Export of Ammonia and Urea in 2000 (MT)
MEEI Bulletins Vol 37 Nos. 1-12 January - December 2000

Government of Trinidad and Tobago Ministry of Energy and Energy Industries
Production of
Methanol (MT)Jan-00 Feb-00 Mar-00 Apr-00 May-00 Jun-00 Jul-00 Aug-00 Sep-00 Oct-00 Nov-00 Dec-00 TOTAL
TTMC I 37,253 28,234 35,385 36,719 35,735 33,245 43,613 40,534 41,995 42,505 40,927 41,977 458,122
CMC 35,193 33,045 35,035 33,073 21,884 43,860 49,892 49,191 48,112 41,654 45,280 49,023 485,241
TTMC II 50,658 47796,09 49,728 47,732 48,548 48,828 50,591 47,971 48,875 49,257 49,091 49,766 541,045
MIV 40,604 46,430 48,160 49,540 47,878 48,709 50,763 48,653 48,982 50,505 48,175 47,524 575,924
Titan - - - - - 26,476 21,844 33,155 73,348 78,718 54,125 67,707 355,373
TOTAL 163,709 107,709 168,308 167,063 154,045 201,118 216,703 219,504 261,312 262,638 237,599 255,997 2,415,704
Export of
Methanol (MT)Jan-00 Feb-00 Mar-00 Apr-00 May-00 Jun-00 Jul-00 Aug-00 Sep-00 Oct-00 Nov-00 Dec-00 TOTAL
TTMC I 18,989 33,705 30,276 38,201 36,248 28,604 38,252 40,949 46,116 44,664 40,443 38,567 435,014
CMC 18,740 35,422 24,893 28,905 13,157 32,460 39,055 62,015 53,073 54,560 41,451 41,829 445,561
TTMC II 33,990 48,899 49,577 52,198 48,864 36,349 39,055 62,015 53,073 54,560 42,361 40,967 561,907
MIV 41,283 21,305 48,299 21,627 44,269 58,662 40,806 44503.23 57,452 39,361 41,726 52,759 512,053
Titan - - - - - 17,202 32,449 8,401 54,809 103,320 55,818 46,759 318,759
TOTAL 113,002 139,331 153,044 140,932 142,539 173,277 189,617 217,883 264,523 296,465 221,798 220,881 2,273,293
Table 5C - Production and Export of Methanol in 2000 (MT)
MEEI Bulletins Vol 37 Nos. 1-12 January - December 2000

Government of Trinidad and Tobago Ministry of Energy and Energy Industries
Jan-00 Feb-00 Mar-00 Apr-00 May-00 Jun-00 Jul-00 Aug-00 Sep-00 Oct-00 Nov-00 Dec-00 TOTAL
LNG Train 1 584,596 464,793 546,747 541,612 501,515 563,819 521,038 564,339 540,425 552,854 548,659 553,247 6,483,644
Production
(M^3) TOTAL 584,596 464,793 546,747 541,612 501,515 563,819 521,038 564,339 540,425 552,854 548,659 553,247 6,483,644
Jan-00 Feb-00 Mar-00 Apr-00 May-00 Jun-00 Jul-00 Aug-00 Sep-00 Oct-00 Nov-00 Dec-00 TOTAL
LNG Sales Train 1 11,064,024 24,856,457 11,733,146 14,202,485 12,676,513 10,688,493 12,279,016 13,880,976 10,261,320 15,455,951 8,904,600 13,872,901 159,875,882
&
Deliveries
(MMBTU) TOTAL 11,064,024 24,856,457 11,733,146 14,202,485 12,676,513 10,688,493 12,279,016 13,880,976 10,261,320 15,455,951 8,904,600 13,872,901 159,875,882
NGL Train 1 157,905 122,850 157,501 160,248 155,384 179,722 166,078 167,670 162,783 162,783 148,956 156,431 1,898,311
Sales &
Deliveries
(BBLs) TOTAL 157,905 122,850 157,501 160,248 155,384 179,722 166,078 167,670 162,783 162,783 148,956 156,431 1,898,311
NOTE:
Table 5E - LNG and NGL Sales, Deliveries & Redeliveries from ALNG in 2000 (MMBTU & BBLS)
Table 5D - Production of LNG from ALNG in 2000 (M^3)
Local NGL sales from ALNG are to mainly PPGPL. Local NGL deliveries are to Petrotrin. Sold & delivered NGL volumes have been included in both PPGPL's & Petrotrin's production data.
MEEI Bulletins Vol 37 Nos. 1-12 January - December 2000