consolidated interim report at 30th september...
TRANSCRIPT

CONSOLIDATED INTERIM REPORT AT 30TH SEPTEMBER 2015
(COURTESY TRANSLATION FOR THE CONVENIENCE OF INTERNATIONAL READERS)

CONSOLIDATED INTERIM REPORT AT 30TH SEPTEMBER 2015
1
CONTENTS
CORPORATE DETAILS . . . . . . . . . . . . . . . . . . . . . . . . . . . . . . . . . . . . . . . . . . . . . . . . . . . . . . . . . . . . . . . . . . . . . . . . . . . . . . 3
CORPORATE GOVERNANCE BODIES . . . . . . . . . . . . . . . . . . . . . . . . . . . . . . . . . . . . . . . . . . . . . . . . . . . . . . . . . . . . . . . . 4
THE BRUNELLO CUCINELLI GROUP . . . . . . . . . . . . . . . . . . . . . . . . . . . . . . . . . . . . . . . . . . . . . . . . . . . . . . . . . . . . . . . . . 5
GROUP STRUCTURE . . . . . . . . . . . . . . . . . . . . . . . . . . . . . . . . . . . . . . . . . . . . . . . . . . . . . . . . . . . . . . . . . . . . . . . . . . . . . . . 6
DISTRIBUTION . . . . . . . . . . . . . . . . . . . . . . . . . . . . . . . . . . . . . . . . . . . . . . . . . . . . . . . . . . . . . . . . . . . . . . . . . . . . . . . . . . . . 7
INTERIM REPORT ON OPERATIONS
COMPANY INFORMATION . . . . . . . . . . . . . . . . . . . . . . . . . . . . . . . . . . . . . . . . . . . . . . . . . . . . . . . . . . . . . . . . . . . . . . . . . 10
SUMMARY DATA . . . . . . . . . . . . . . . . . . . . . . . . . . . . . . . . . . . . . . . . . . . . . . . . . . . . . . . . . . . . . . . . . . . . . . . . . . . . . . . . . 15
THE GROUP’S RESULTS . . . . . . . . . . . . . . . . . . . . . . . . . . . . . . . . . . . . . . . . . . . . . . . . . . . . . . . . . . . . . . . . . . . . . . . . . . . 17
ANALYSIS OF REVENUES . . . . . . . . . . . . . . . . . . . . . . . . . . . . . . . . . . . . . . . . . . . . . . . . . . . . . . . . . . . . . . . . . . . . . . . . . 18
ANALYSIS OF THE INCOME STATEMENT . . . . . . . . . . . . . . . . . . . . . . . . . . . . . . . . . . . . . . . . . . . . . . . . . . . . . . . . . . . . 25
ANALYSIS OF NET WORKING CAPITAL, CAPEX AND FINANCING ACTIVITIES . . . . . . . . . . . . . . . . . . . . . . . . . . . . 30
PERFORMANCE OF THE COMPANY’S SHARE . . . . . . . . . . . . . . . . . . . . . . . . . . . . . . . . . . . . . . . . . . . . . . . . . . . . . . . 35
SIGNIFICANT EVENTS DURING THE PERIOD . . . . . . . . . . . . . . . . . . . . . . . . . . . . . . . . . . . . . . . . . . . . . . . . . . . . . . . . 36
SIGNIFICANT SUBSEQUENT EVENTS . . . . . . . . . . . . . . . . . . . . . . . . . . . . . . . . . . . . . . . . . . . . . . . . . . . . . . . . . . . . . . . 38
BUSINESS OUTLOOK . . . . . . . . . . . . . . . . . . . . . . . . . . . . . . . . . . . . . . . . . . . . . . . . . . . . . . . . . . . . . . . . . . . . . . . . . . . . . 38
BASIS OF PREPARATION OF THE CONSOLIDATED INTERIM REPORT . . . . . . . . . . . . . . . . . . . . . . . . . . . . . . . . . . 38
SCOPE OF CONSOLIDATION . . . . . . . . . . . . . . . . . . . . . . . . . . . . . . . . . . . . . . . . . . . . . . . . . . . . . . . . . . . . . . . . . . . . . . . 39
ACCOUNTING STANDARDS . . . . . . . . . . . . . . . . . . . . . . . . . . . . . . . . . . . . . . . . . . . . . . . . . . . . . . . . . . . . . . . . . . . . . . . 39
DISCRETIONAL MEASUREMENTS AND SIGNIFICANT ACCOUNTING ESTIMATES . . . . . . . . . . . . . . . . . . . . . . . 39
RELATED PARTY TRANSACTIONS . . . . . . . . . . . . . . . . . . . . . . . . . . . . . . . . . . . . . . . . . . . . . . . . . . . . . . . . . . . . . . . . . . 42

CONSOLIDATED INTERIM REPORT AT 30TH SEPTEMBER 2015
2
FINANCIAL STATEMENTS
CONSOLIDATED STATEMENT OF FINANCIAL POSITION . . . . . . . . . . . . . . . . . . . . . . . . . . . . . . . . . . . . . . . . . . . . . . 44
CONSOLIDATED INCOME STATEMENT . . . . . . . . . . . . . . . . . . . . . . . . . . . . . . . . . . . . . . . . . . . . . . . . . . . . . . . . . . . . . 46
CONSOLIDATED STATEMENT OF COMPREHENSIVE INCOME . . . . . . . . . . . . . . . . . . . . . . . . . . . . . . . . . . . . . . . . . 47
CONSOLIDATED CASH FLOW STATEMENT . . . . . . . . . . . . . . . . . . . . . . . . . . . . . . . . . . . . . . . . . . . . . . . . . . . . . . . . . . 48
CONSOLIDATED STATEMENT OF CHANGES IN EQUITY . . . . . . . . . . . . . . . . . . . . . . . . . . . . . . . . . . . . . . . . . . . . . . 49
CERTIFICATION PURSUANT TO ARTICLE 154-BIS, PARAGRAPH 2 OF THE CONSOLIDATED FINANCIAL
LAW (TUF) . . . . . . . . . . . . . . . . . . . . . . . . . . . . . . . . . . . . . . . . . . . . . . . . . . . . . . . . . . . . . . . . . . . . . . . . . . . . . . . . . . . . . . . 50

RESOCONTO INTERMEDIO AL 30 SETTEMBRE 2015
3
CORPORATE DETAILS
Registered office of the Holding Company
Brunello Cucinelli S .p .A .Via dell’Industria, 5, frazione SolomeoCorciano – Perugia – Italy
Legal information of the Holding Company
Approved share capital € 13,600,000Subscribed and fully paid-up share capital €13,600,000Perugia companies register, no . 01886120540
Official website: http://investor.brunellocucinelli.com/eng/
Nature does nothing in vain— ARISTOTELE —

CONSOLIDATED INTERIM REPORT AT 30TH SEPTEMBER 2015
4
CORPORATE GOVERNANCE BODIES AT 30TH SEPTEMBER 2015
Board of Directors Brunello Cucinelli (1) Chairman and CEO Moreno Ciarapica (1) Executive director Riccardo Stefanelli (1) Executive director Giovanna Manfredi (1) Director Camilla Cucinelli (1) Director Giuseppe Labianca (1) Director Candice Koo (1) Independent director Andrea Pontremoli (1) Independent director Matteo Marzotto (1) Independent director
Lead Independent Director Andrea Pontremoli
Control and Risks Committee Andrea Pontremoli Chairman Matteo Marzotto
Candice Koo
Remuneration Committee Matteo Marzotto Chairman Andrea Pontremoli
Candice Koo
Board of Statutory Auditors Gerardo Longobardi (1) Chairman Alessandra Stabilini (1) Standing auditor Lorenzo Lucio Livio Ravizza (1) Standing auditor Guglielmo Castaldo (1) Substitute auditor Francesca Morbidelli (1) Substitute auditor
External Auditors Reconta Ernst &Young S,p,A,
Manager in charge of preparing the corporate accounting documents Moreno Ciarapica
(1) Appointed by shareholders at the ordinary meeting of 23rd April 2014 and will remain in office until the date of the shareholders’ meeting called to approve the financial statements for the year ending 31st December 2016 .

RESOCONTO INTERMEDIO AL 30 SETTEMBRE 2015
5
THE BRUNELLO CUCINELLI GROUP AT 30TH SEPTEMBER 2015
100% 100%
Brunello CucinelliEurope S.r.l.
Brunello CucinelliJapan Co. Ltd.
Brunello CucinelliBrasil, LTDA
Brunello CucinelliLessin (Sichuan)Fashion Co. Ltd.
Brunello CucinelliUSA Inc.
95%(*) 98%(*)
70% 98%(*)
70%
98%(*)
98%(*)
98%(*)
100%
51%
51%
70%
98%(*)
Brunello CucinelliLessin (Macau)
Fashion Co., Ltd.
51% 51%
70,3%75%
Brunello CucinelliHong Kong, Ltd.
98%2%
Brunello CucinelliS.p.A.
Brunello CucinelliRetail Spain SL
Brunello CucinelliSuisse S.A.
Brunello CucinelliFrance S.a.r.l.
70%
51%
Cucinelli HoldingCo LLC
Brumas Inc.
Brunello CucinelliNetherlands B.V.
Brunello CucinelliHellas S.A.
Max VannucciS.r.l.
Pinturicchio S.r.l.
SAS White Flannel
Brunello CucinelliBelgium S.p.r.l.
SAS BrunelloCucinelli France
Resort(#)
Brunello CucinelliRetail Deutschland
G.m.b.H.
Brunello CucinelliAustria Gmbh
Brunello CucinelliEngland, Ltd.
Brunello CucinelliG.m.b.H.
70%
Brunello CucinelliCanada Limited
70%
68,67%SAM BrunelloCucinelli Monaco
(*) The remaining percentage is held by Brunello Cucinelli S .p .A .(#) The company has been formed but is not yet operative at the date of this interim report .

CONSOLIDATED INTERIM REPORT AT 30TH SEPTEMBER 2015
6
GROUP STRUCTURE AT 30TH SEPTEMBER 2015
Company name Registered officeBrunello Cucinelli S .p .A . Corciano, frazione Solomeo (PG) – ItalyBrunello Cucinelli USA, Inc . New York – USACucinelli Holding Co, LLC New York – USABrunello Cucinelli Europe S .r .l . Corciano, frazione Solomeo (PG) – ItalyBrumas Inc . New York – USABrunello Cucinelli Suisse S .A . Lugano – SwitzerlandBrunello Cucinelli Retail Spain SL Madrid – SpainBrunello Cucinelli GmbH Munich – GermanyBrunello Cucinelli France Sarl Paris– FranceBrunello Cucinelli Belgium S .p .r .l . Brussels – BelgiumMax Vannucci S .r .l . Perugia – ItalyBrunello Cucinelli Japan Co ., Ltd Tokyo – JapanBrunello Cucinelli Retail Deutschland GmbH Munich – Germany Brunello Cucinelli Netherlands B .V . Amsterdam – HollandBrunello Cucinelli Lessin (Sichuan) Fashion Co ., Ltd . Chengdu - ChinaBrunello Cucinelli Hellas S .A . Athens - GreeceBrunello Cucinelli Austria GmbH Vienna – AustriaBrunello Cucinelli England Ltd . London – United KingdomBrunello Cucinelli Hong Kong Ltd . Hong KongBrunello Cucinelli Lessin (Macau) Fashion Co ., Ltd . MacauPinturicchio S .r .l . Carrara – ItalyBrunello Cucinelli Brasil Ltda . San Paolo – BrazilSAS White Flannel Cannes – FranceSAM Brunello Cucinelli Monaco Principality of MonacoBrunello Cucinelli Canada Limited Vancouver – CanadaSAS Brunello Cucinelli France Resort Courchevel – France

CONSOLIDATED INTERIM REPORT AT 30TH SEPTEMBER 2015
7
DISTRIBUTION
From the standpoint of the end user, the Group is present on the market as follows:– the retail distribution channel, namely the direct distribution (retail) channel, for which the Group uses the
services of Directly Operated Stores or DOS . In certain countries local operators also have an equity interest in the Group company running the DOS, thereby bringing in their specific experience of the market. From 1st September 2014 the retail channel also includes the sales points in the Japanese department stores which are operated under the Group’s responsibility using direct staff employed there;
– the wholesale monobrand channel, consisting of monobrand stores operated under commercial distribution agreements . The Group uses intermediaries represented by monobrand stores for sales to end users, with the result that in this case these are the Group’s customers;
– the wholesale multibrand channel, which consists of independent multibrand stores and dedicated spaces in department stores (shop-in-shops) . In this channel the Group uses intermediaries represented by independent multibrand stores for sales to end users, i .e . department stores, with the result that in this case these are the Group’s customers .
The Group uses a network of agents and distributors for sales to a number of monobrand and multibrand wholesale customers .
For all distribution channels the Group ensures that the brand image and the Brunello Cucinelli style are transmitted in the areas and stores dedicated to the sale of its products .
A summary is provided below of the Brunello Cucinelli Group’s monobrand sales network at 30th September 2015, 31st December 2014 and 30th September 2014:
Points of sale 30th September 2015 31st December 2014 30th September 2014
DOS 78 71 70
WHOLESALE MONOBRAND 38 34 34
The following table provides an analysis of the location of points of sale by geographical area at 30th September 2015:
Sales points Italy Europe North America
Greater China
Rest of the World (RoW)
Total
DOS 11 26 20 16 5 78WHOLESALE MONOBRAND 6 20 1 3 8 38TOTAL 17 46 21 19 13 116

CONSOLIDATED INTERIM REPORT AT 30TH SEPTEMBER 2015
8
The figure below sets out the DOS and wholesale monobrand points of sale at 30th September 2015 together with their geographical location:
16 DOS
3 WHS MONOBRAND
5 DOS1 Latin America; 4 Asia Pacific;8 WHS MONOBRAND2 Latin America; 4 Asia Pacific;2 Middle East
Rest of World (RoW)Italy
11 DOS6 WHS MONOBRAND
Europe26 DOS1 Austria; 2 Belgium; 5 France; 5 Germany; 1 Greece; 1 Netherlands;5 Spain; 4 Switzerland; 2 UK20 WHS MONOBRAND1 Azerbaijan; 1 Bulgaria; 1 Denmark;1 France; 1 Germany; 1 Lithuania;1 Kazakhstan; 1 Romania; 6 Russia;2 Switzerland; 1 Turkey; 3 Ukraine;
North America
20 DOS1 WHS MONOBRAND
Greater China
Since 1st September 2014 the revenues of the 13 Japanese sales points, which are located inside department stores and operated under the Group’s responsibility, employing direct staff, are included in the retail channel .

CONSOLIDATED INTERIM REPORT AT 30TH SEPTEMBER 2015
9
INTERIM REPORT ON OPERATIONS AT 30TH SEPTEMBER 2015

CONSOLIDATED INTERIM REPORT AT 30TH SEPTEMBER 2015
10
COMPANY INFORMATION
OUR COMPANY
Brunello Cucinelli S .p .A . is a company registered as a legal entity under the laws of the Republic of Italy and has its registered office at Via dell’Industria 5, Corciano – Frazione Solomeo (PG), Italy.The Group’s product range focuses on a single brand: Brunello Cucinelli, internationally recognized as one of the finest examples of absolute luxury, combining exclusive “Made in Italy” features with the ability to innovate and identify new trends .The brand’s distinctive elements are quality, craftsmanship, creativity, exclusivity, and beauty, plus a remarkable ability to “listen to” the market and its new trends. The result is a line of casual chic prêt-à-porter products that satisfy the tastes of young and less-young customers while retaining value over time . Merging old and new, business goals and human needs: the secret of a company whose innovative capacity is looked upon with interest from all sides as well as being a case study in modern economy illustrated at prestigious universities .
PRODUCT
The daily alchemy between tradition and research as a trail-blazer for new creationsThe collections assert a new balance in the 2015-2016 fall/winter and 2016 spring/summer seasons, where the luxury of refined materials is exalted by creativity and workmanship to dress the man and the woman for all occasions, from business dress to jet-setting elegance and above all around that casual attitude associated with knitwear that has always defined the Brunello Cucinelli character.
Lifestyle from gym to dinner where the exploration of the various nuances and ways of wearing and matching clothes aims at a complete style for everyday wear .
A tight bond between craftsmanship and research across all the various types from men’s suits to knitwear, from informal items to elegance for the evening. Precious fibers and natural materials blend together or are reinvented by means of original processes, tested within an attentive mingling of tradition and research that moves our creations .
Knitwear is once again the star of the collections and a fundamental pivot of the look with new elements, yarns and innovative techniques extending the line and multiplying the combinations. The noble fiber of cashmere becomes a meeting point of modern elegance, in a balance between identity and innovation .

CONSOLIDATED INTERIM REPORT AT 30TH SEPTEMBER 2015
11
VISUAL MERCHANDISING
In keeping with the changes in the collections, moving in the direction of modern taste, a significant development in visual merchandising criteria has been seen over the past year .A move has been made from research to the creation, design and production of unique items capable of narrating and expressing the theme of the collections, in harmony in their colors, shapes and materials .From the tale of the world that is told in Solomeo, visual merchandising develops a new form of setting that is directly connected with the product . Presentation becomes a harmonic sounding board where the constant exchange of materials, ideas and creations produces new and unique articles, which renew themselves spontaneously with the evolution of taste and the collections .
The display and settings define a line of continuity that makes every display window, boutique and environment a unique item, a place where the creative spirit can be recognized, perfectly placed within the brand’s philosophy and traditions .
A young and qualified team structured on a geographical basis looks after the features and needs of every single boutique as it does those of the multibrand stores . From the sales campaign to displaying the collections it responds reactively and consistently to creative stimuli and the specific requirements of spaces, cultures and tastes .
The organization is responsible for:– development of store design and display systems in harmony with the brand’s image;– coordinated management of merchandising and assortments consistent with the reference market;– harmonization of communication and of visual elements in each store .
COMMUNICATION
SThe attention placed by the Italian and international media on the elements making up the identity of the Solomeo company is once again proven, a “young” identity but one solidly rooted in the traditional values for which we want to be the “guardian” for future generations.The brand image arises directly from the philosophy underlying the “Humanistic Enterprise” project, based on the timeless values of the dignity of man and work, and demonstrates the commitment that actively links the Company to the culture of craftsmanship, landscape and art to be found in Umbria .
The specific attention given to all the various operations that accompany the presentation of the collections responds to the idea of the brand’s own elegance, which renews itself thanks to a skillful balance of tradition and innovation .An agile, young and reactive communications office has grown at the Solomeo headquarters over the seasons to the point of achieving a high level of specialization that organically covers all the stages involved in presenting the collections, talking in a direct and immediate manner about the environment and the philosophy of which it represents the cradle .

CONSOLIDATED INTERIM REPORT AT 30TH SEPTEMBER 2015
12
DISTRIBUTION
The brand reached an important symbolical goal in 2014: over 100 monobrand boutiques located in key points throughout the world spread the products and values that grow in Solomeo, while constantly maintaining the character of exclusivity and rarity for the diffusion of a product that is increasingly “unique” in being associated with savoir-faire and Italian and Umbrian artisan tradition .
ExpansionThe Company continues to spread its presence throughout the world in a balanced and attentive manner, with new boutiques strategically placed in the heart of Europe, in the large oriental metropolises and in the symbolic cities of America .
Consolidation and enlargementDirectly operated stores (DOS), partnerships and joint ventures contribute to defining the variety of operations taking place on a global scale, enabling the Company to closely follow its diffusion and presence at that level and responding with key operations for consolidating and enlarging on the central fashion markets such as Paris, New York, Beverly Hills, Rome and London to name but a few of the most significant locations.
31st December 2014 30th September 2014
Total monobrandpoints of sale
WHS monobrand
Retail DOS
104
34
70
105
34
71
116
38
78
30th September 2015
– The retail channel consists of the monobrand stores and DOS (directly operated stores), some of which are operated in partnership with experts at the location . From 1st September 2014 the retail channel also includes the sales points in the Japanese department stores which are operated under the Group’s responsibility using direct staff employed there;
– The wholesale monobrand channel refers to monobrand boutiques which for strategic reasons are operated through consolidated commercial relationships with local operators;
– The wholesale multibrand channel consists of approximately 650 selected multibrand customers .
The world’s most prestigious department stores form part of the multibrand network, with increasingly important dedicated spaces .

CONSOLIDATED INTERIM REPORT AT 30TH SEPTEMBER 2015
13
PRODUCTION
Responding to the gracious and constant growth in the diffusion of the product throughout the world is a constant emphasis on the quality of the work, in line with the brand’s “Humanistic Enterprise” philosophy, which has always sought the first real source of creativity in the dignity of work. The enlargement of the Company’s business complex has enabled it to unite all the different departments in the green area lying at the foot of the Solomeo hill, thus enhancing the value of the cohesion and harmony to be found in the process of creating the collections .
The close relationship that binds the Company to over 300 small and tiny Italian manufacturing craftwork firms has enabled a perfect matching of intent to be created in terms of the quality of the workmanship, a quality that has grown over time into strong loyalty and mutual trust .
The extremely high proportion of façonisti situated in Umbria, around 80%, enables the management of production to be perfectly coordinated and above all allows the Company to keep complete control of all the stages of production with an attention to detail, always one of the brand’s winning elements .
The new balance and interpenetration between creations of a casual nature and sartorial elements enables the Cucinelli brand to spread its artisan and innovative character across all its products, from clothing to accessories, blending the features of every type into a unique image .

CONSOLIDATED INTERIM REPORT AT 30TH SEPTEMBER 2015
14
THE SOLOMEO SCHOOL
The Crafts School opened in September 2013 provides a series of courses on the crafts inherent in the Company’s activities, such as the techniques of knitting or cutting and assembling organized and supported by the Company . A new course on tailoring began in July 2014, another symbolic discipline of that Italian excellence and handicraft renowned throughout the world . The School then provides a series of courses dedicated to the craft-based and traditional arts and disciplines such as horticulture, gardening and the masonry arts, fostered and supported by the “Brunello e Federica Cucinelli” Foundation.
The course sessions have also continued in 2015 with new youngsters enthusiastically coming closer to the craft-based trades that make the Made in Italy sector famous throughout the world .
All the School’s courses take place in the ancient hamlet, inside or close to the castle which is now discovering a new life. After its first existence in olden days, linked to an important past, and its reconstruction as the headquarters of a modern Italian business, the Hamlet of Solomeo is now looking towards the future as a place for teaching young people .

CONSOLIDATED INTERIM REPORT AT 30TH SEPTEMBER 2015
15
INTRODUCTION
This Interim Financial Report at 30th September 2015 has been drawn up pursuant to Legislative Decree no . 58/1998 as amended and the Issuers’ Regulations published by Consob . The report has been prepared in accordance with the International Financial Reporting Standards (“IFRS”) issued by the International Accounting Standards Board (“IASB”) and adopted by the European Union and in accordance with IAS 34 Interim Financial Reporting, applying the same accounting principles as those used to prepare the consolidated financial statements at 31st December 2014 .
SUMMARY DATA AT 30TH SEPTEMBER 2015
The following tables provide: (i) a summarized consolidated income statement for the nine months ended 30th September 2015 with comparative figures for the nine months ended 30th September 2014, (ii) a consolidated balance sheet reclassified by sources and applications at 30th September 2015 with comparative figures at 31st December 2014 and (iii) figures for capital expenditure and operating cash flows for the nine months ended 30th September 2015 with comparative figures at 31st December 2014 and 30th September 2014 .
Summarized consolidated income statement(In thousands of Euro) 30th September Change
2015 % of revenues 2014 % of revenues 2015 vs. 2014 2015 vs. 2014 %
Revenues 318,009 100 .0% 278,724 100 .0% 39,285 +14 .1%EBITDA(1) 53,867 16 .9% 48,803 17 .5% 5,064 +10 .4%Operating income 40,204 12 .6% 39,353 14 .1% 851 +2 .2%Net income for the period 25,698 8 .1% 25,905 9 .3% (207) -0 .8%Normalized revenues(2) 318,009 100 .0% 277,969 100 .0% 40,040 +14 .4%Normalized EBITDA(2) 53,867 16 .9% 48,048 17 .3% 5,819 +12 .1%Normalized operating income(2) 40,204 12 .6% 38,598 13 .9% 1,606 +4 .2%Normalized net income for the period(2) 25,698 8 .1% 25,387 9 .1% 311 +1 .2%
(1) We define EBITDA as operating income before depreciation and amortization. EBITDA defined in this way is a measure used by our management to monitor and assess our operating performance . EBITDA is not an accounting measure in the context of IFRS and accordingly should not be considered as an alternative for assessing trends in the Group’s operating income . Since the composition of EBITDA is not regulated by the accounting principles adopted, the means of calculating this figure used by us might not be consistent with that used by others and might therefore not be comparable.
(2) The “normalized” figures for revenues, EBITDA, operating income and net income for the period exclude the capital gain of € 755 thousand recognized on the sale of a property from the results for the nine months ended 30th September 2014 .

CONSOLIDATED INTERIM REPORT AT 30TH SEPTEMBER 2015
16
Consolidated balance sheet reclassified by sources and applications:(In thousands of Euro) At Change
30th September 2015 31st December 2014 2015 vs. 2014 2015 vs. 2014 %
Net working capital 135,065 97,507 37,558 +38 .5%Fixed assets 134,273 114,592 19,681 +17 .2%Other non-current assets/(liabilities) 5,393 862 4,531 >+100%Net invested capital 274,731 212,961 61,770 +29.0%Net debt (3) 83,704 42,636 41,068 +96 .3%Shareholders’ equity 191,027 170,325 20,702 +12 .2%Sources of funding 274,731 212,961 61,770 +29.0%
(3) Net debt is calculated as the sum of cash and cash equivalents, current financial assets, non-current financial liabilities, the fair value of hedging instruments and other non-current financial assets.
Other summary data:(In thousands of Euro) 30th September 2015 31st December 2014 30th September 2014
Capex(4) 32,428 39,661 31,134Cash flows from (used by) operating activities
(2,217) 13,771 (2,543)
(4) Capex refers to gross investments in intangible, tangible and financial fixed assets.

CONSOLIDATED INTERIM REPORT AT 30TH SEPTEMBER 2015
17
THE GROUP’S RESULTS AT AT 30TH SEPTEMBER 2015
The company continues to pursue sustainable growth despite the volatility of the sector and the particular economic environment, thanks to the strength of the brand, its position in the high-end luxury segment and its collections designed for a contemporary and sophisticated lifestyle . Sales in the first nine months of 2015, along the growth recorded during the period, confirm the trends seen earlier this year; the identification of the brand as symbol of absolute luxury reinforces the positivity surrounding the brand, which is recognized worldwide for its unique styles, supreme quality and the excellence in craftsmanship and manual skills .The macroeconomic, political and monetary dynamics over recent months had a marginal impact on top-end customer choices, which was confirmed by the fact that they continue to increasingly seek increasingly exclusive prêt-à-porter items distributed selectively, in line with the company’s market approach.The results achieved are also supported by customer loyalty and a sharing of values with them, while respecting the economic and moral dignity of our employees, stakeholders and local community .
The Group posted revenues of € 318,009 thousand in the nine months ended 30th September 2015, a rise of 14 .1% over the corresponding period of the previous year .Revenues for the first nine months of 2014 were affected by the income arising from the sale of a property to the parent Fedone S .r .l . (in turn controlled by Cav . Lav . Brunello Cucinelli) that is not situated in the proximity of the Company’s manufacturing and logistical facilities, which led to a capital gain of € 755 thousand, recognized as other income . Excluding the effect of this transaction revenues rose by 14 .4% .
The Group posted net revenues of € 317,558 thousand for the nine months, a rise of 14.5% over the figure of € 277,346 thousand at 30th September 2014 .
EBITDA reached € 53,867 thousand at 30th September 2015, or 16 .9% of revenues, an increase of 12 .1% compared to normalized EBITDA of € 48,048 thousand for the nine months ended 30th September 2014 (17 .3% of revenues) .The first nine months of 2015 were characterized by a decrease in production costs for raw materials and outsourced work as a percentage of revenues, arising mostly from changes between the quarters and the higher proportion of revenues generated by the retail distribution channel where the development and expansion of the directly operated sales points however led to an increase in rental expense and payroll costs as a percentage of revenues compared to the first nine months of 2014, thereby offsetting the effect.
Net income of € 25,698 thousand for the nine months ended 30th September 2015, corresponding to 8 .1% of revenues, posted an increase of € 311 thousand or 1.2% over the normalized figure for the first nine months of 2014.Depreciation and amortization represented a higher percentage of revenues in the first nine months of 2015 compared to the first nine months of 2014 as a result of the considerable investments made by the Company.
The results of the individual quarters are affected by the timing of the deliveries of collections and whether these fall at the end of one quarter or the beginning of the next, thereby making a reading of the half-year’s results representative of the changes underlying the business . While not showing sharp seasonal or cyclical variations in total annual sales, the Group’s business is affected in the course of the various quarters of the year by revenues and costs arising mainly from industrial operations that are not perfectly homogeneous . Consequently, any analysis of interim results and financial and profitability indicators cannot be considered as fully representative, and it is therefore not advisable to consider the period indicators as a proportional share of the full year .

CONSOLIDATED INTERIM REPORT AT 30TH SEPTEMBER 2015
18
ANALYSIS OF REVENUES
The Group’s consolidated turnover for the first nine months of the year amounted to € 317,558 thousand, a rise of 14.5% over the same period in 2014. The sales trend not only confirms the solidity of the business’s development path but further testifies to the stability of the trend in the growth of purchases on all the international markets, with local customers and top-end tourist flows being increasingly less subject to market volatility and macroeconomic dynamics .At constant exchange rates, meaning at the same average rates as those used for the first nine months of 2014, revenues would have amounted to € 303,407 thousand .
303.4317.6
30th September 2015 constant exchange rates
277.3
30th September 2015 30th September 2014
+9.4% +14.5%
The overall increase in net revenues amounted to € 26,061 thousand at constant exchange rates (+9 .4%), mainly due to organic growth in the retail channel arising from the development of existing points of sale, the opening of new direct points of sale (DOS) in all geographical areas and the growth of the wholesale multibrand and monobrand channel compared to the corresponding period of the previous year . The difference between the figures for growth at current exchange rates (+14.5%) and at constant exchange rates (+9.4%) is mainly due to the change in the exchange rate between the euro and the US dollar over the two corresponding nine month periods .

CONSOLIDATED INTERIM REPORT AT 30TH SEPTEMBER 2015
19
REVENUES BY DISTRIBUTION CHANNEL
Increases in revenues were posted in all distribution channels in the first nine months of 2015, as a consequence of the results achieved by the existing boutiques and locations, the new selected openings and the Group’s presence in the most prestigious spaces in the Luxury Department Stores .The following table provides details of the net revenues earned by the Group in the nine months ended 30th September 2015 and 2014, analyzed by distribution channel .
(In thousands of Euro) Nine months ended 30th September Change
2015 % 2014 % 2015 vs. 2014 2015 vs. 2014 %
Retail 135,818 42 .8% 100,969 36 .4% 34,849 +34 .5%
Wholesale monobrand 28,204 8 .9% 27,957 10 .1% 247 +0 .9%
Wholesale multibrand 153,536 48 .3% 148,420 53 .5% 5,116 +3 .4%
Total 317,558 100.0% 277,346 100.0% 40,212 +14.5%
317.6
Total
WHS Multibrand
WHS Monobrand
Retail DOS
153.6
28.2
135.8
30th September 2014 30th September 2015
277.3
148.4
27.9
101.0
30th September 2015
42.8%
8.9%
48.3%
CONSOLIDATED INTERIM REPORT AT 30TH SEPTEMBER 2015
20
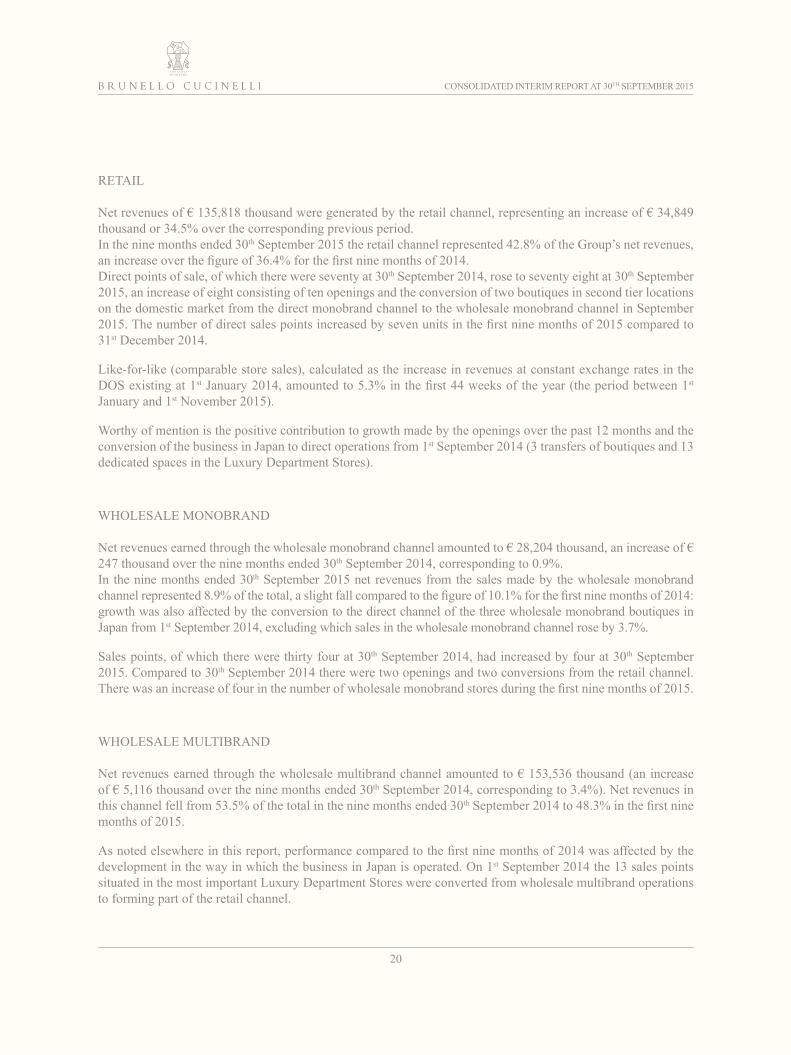
RETAIL
Net revenues of € 135,818 thousand were generated by the retail channel, representing an increase of € 34,849 thousand or 34 .5% over the corresponding previous period .In the nine months ended 30th September 2015 the retail channel represented 42 .8% of the Group’s net revenues, an increase over the figure of 36.4% for the first nine months of 2014.Direct points of sale, of which there were seventy at 30th September 2014, rose to seventy eight at 30th September 2015, an increase of eight consisting of ten openings and the conversion of two boutiques in second tier locations on the domestic market from the direct monobrand channel to the wholesale monobrand channel in September 2015. The number of direct sales points increased by seven units in the first nine months of 2015 compared to 31st December 2014 .
Like-for-like (comparable store sales), calculated as the increase in revenues at constant exchange rates in the DOS existing at 1st January 2014, amounted to 5.3% in the first 44 weeks of the year (the period between 1st January and 1st November 2015) .
Worthy of mention is the positive contribution to growth made by the openings over the past 12 months and the conversion of the business in Japan to direct operations from 1st September 2014 (3 transfers of boutiques and 13 dedicated spaces in the Luxury Department Stores) .
WHOLESALE MONOBRAND
Net revenues earned through the wholesale monobrand channel amounted to € 28,204 thousand, an increase of € 247 thousand over the nine months ended 30th September 2014, corresponding to 0 .9% .In the nine months ended 30th September 2015 net revenues from the sales made by the wholesale monobrand channel represented 8.9% of the total, a slight fall compared to the figure of 10.1% for the first nine months of 2014: growth was also affected by the conversion to the direct channel of the three wholesale monobrand boutiques in Japan from 1st September 2014, excluding which sales in the wholesale monobrand channel rose by 3 .7% .
Sales points, of which there were thirty four at 30th September 2014, had increased by four at 30th September 2015 . Compared to 30th September 2014 there were two openings and two conversions from the retail channel . There was an increase of four in the number of wholesale monobrand stores during the first nine months of 2015.
WHOLESALE MULTIBRAND
Net revenues earned through the wholesale multibrand channel amounted to € 153,536 thousand (an increase of € 5,116 thousand over the nine months ended 30th September 2014, corresponding to 3 .4%) . Net revenues in this channel fell from 53 .5% of the total in the nine months ended 30th September 2014 to 48.3% in the first nine months of 2015 .
As noted elsewhere in this report, performance compared to the first nine months of 2014 was affected by the development in the way in which the business in Japan is operated . On 1st September 2014 the 13 sales points situated in the most important Luxury Department Stores were converted from wholesale multibrand operations to forming part of the retail channel .

CONSOLIDATED INTERIM REPORT AT 30TH SEPTEMBER 2015
21
REVENUES BY GEOGRAPHICAL AREA
The Brunello Cucinelli Group achieved considerable growth in all international markets in the first nine months of 2015; these represented 81 .1% of net revenues for the period and posted an increase of 17 .9% over the corresponding period of 2014. The Italian market also reported an interesting and significant rise of 1.9% in revenues, with healthy and sustainable results .The following table provides details of revenues for the nine months ended 30th September 2015 analyzed by geographical area, with comparative figures for the corresponding period of the previous year.
(In thousands of Euro) Nine months ended 30th September Change
2015 % 2014 % 2015 vs. 2014 2015 vs. 2014 %
Italy 59,878 18 .9% 58,769 21 .2% 1,109 +1 .9%Europe 98,174 30 .9% 91,883 33 .1% 6,291 +6 .8%North America 114,295 36 .0% 91,117 32 .9% 23,178 +25 .4%Greater China 18,054 5 .7% 15,257 5 .5% 2,797 +18 .3%Rest of the World (RoW) 27,157 8 .5% 20,320 7 .3% 6,837 +33 .6%Total 317,558 100.0% 277,346 100.0% 40,212 +14.5%
Total
ROW
Greater China
North America
Europe
Italy
27.2
18.0
114.3
98.2
59.9
317.6
30th September 201530th September 201430th September 2015
20.3
15.2
91.1
91.9
58.8
277.3
8.5%
36.0%
5.7% 18.9%
30.9%

CONSOLIDATED INTERIM REPORT AT 30TH SEPTEMBER 2015
22
The following is an analysis of the increase in net revenues by geographical area .
ItalyNet revenues for “Italy” represented 18.9% of total revenues (21.2% in the same period of the previous year), continuing the encouraging growth trend experienced in the first half of the year, with an increase of € 1,109 thousand, or 1 .9%, over the period ended 30th September 2014 (€ 59,878 thousand in 2015 and € 58,769 thousand in 2014) .
The positive results were driven by growth in both monobrand boutiques and the top-end multibrand stores where the brand is positioned, along with significant increases in the country’s major cities and resorts.Purchases made by local customers and the growing traffic of top-end tourists, including visitors from Asia and the Middle East, supported the results achieved .
There were eleven boutiques in the direct monobrand network at 30th September 2015 and six in the wholesale monobrand channel .
EuropeNet revenues for “Europe” represented 30.9% of total revenues (33.1% in the same period of the previous year), rising by € 6,291 thousand in absolute terms, or 6 .8%, from € 91,883 thousand to € 98,174 thousand .
This growth was driven by the consistency of the demand from both local customers and the increasing number of top-end tourists, especially from Asia, with particularly good results in the boutiques and sales spaces in major cities and prestigious resorts .
Solid results were reported in all countries in the European market, thereby confirming the limited impact of the many changes in the economic and financial environment on top-end customers.
Sales were strong at existing spaces; the five selective openings during the past 12 months contributed to the growth experienced in the first nine months of the year.
The direct monobrand network consisted of twenty six boutiques at 30th September 2015 while the wholesale monobrand network consisted of twenty boutiques .

CONSOLIDATED INTERIM REPORT AT 30TH SEPTEMBER 2015
23
North AmericaNet revenues for “North America” represented 36.0% of total revenues (32.9% in the same period of the previous year), rising by € 23,178 thousand, or 25 .4%, from € 91,117 thousand to € 114,295 thousand .
Revenues increased both in the exclusive boutiques of the direct channel and in the most important spaces of Luxury Department Stores, which are gradually expanding the most prestigious brand specific sales areas to meet the growing demand for “exclusive” prêt-à-porter designs and “superior craftsmanship and manual skills”.The trend reflects the increase in demand by local customers, who have always been identified in the “traditional” customer, and luxury-seeking tourists .Positive sales figures were achieved in both the monobrand and multibrand distribution channels, the latter of which was characterized by its presence in the most important Luxury Department Stores, which are gradually expanding the offer for top-end customers .
Growth in the retail monobrand channel was supported by the results achieved by existing boutiques, thanks to sell-outs and the contribution of the three new openings carried out over the past 12 months .
There were twenty one boutiques in the monobrand network at 30th September 2015 .
Greater ChinaNet revenues for “Greater China” represented 5.7% of total revenues (5.5% in the same period of the previous year), rising by € 2,797 thousand (+18 .3%) from € 15,257 thousand to € 18,054 thousand .
The increase in revenues arises from the positive performance of the exclusive and limited existing network, unchanged over the past 12 months, with growth reported in Mainland China and the other areas of Greater China .
Asian consumers, affluent and sophisticated, have once again demonstrated the solidity of their purchasing habits, despite the macroeconomic dynamics and stock market performance that have been a feature of recent months .
The number of boutiques and selling spaces remained unchanged during the first nine months of 2015, consisting of sixteen direct monobrand boutiques and three wholesale monobrand boutiques .

CONSOLIDATED INTERIM REPORT AT 30TH SEPTEMBER 2015
24
Rest of the WorldNet revenues for the “Rest of the World” in the first nine months of 2015 increased by 33.6% over the corresponding period of the previous year, rising from € 20,320 thousand to € 27,157 thousand .
In line with the dynamics described in the first half of the year, the results were affected by the conversion of the business in Japan to direct management on 1st September 2014; the basis for comparing sales in Japan has only been homogeneous since 1st September 2015, with growth trends expected to “normalize” in the coming quarters.
There were thirteen monobrand stores at 30th September 2015, including the key opening in Tokyo/Ginza in September 2015 .
REVENUES BY PRODUCT LINE AND END CUSTOMER
The following is a graphical representation of the composition of the Brunello Cucinelli Group’s revenues for the nine months ended 30th September 2015, analyzed by product line and end customer:
Women
Men
Clothing
Accessories
30th September 2015
84.9%
15.1%
30th September 2015
67.9%
32.1%

CONSOLIDATED INTERIM REPORT AT 30TH SEPTEMBER 2015
25
ANALYSIS OF THE INCOME STATEMENT
Set out below is a graphical representation of the income statement for the nine months ended 30th September 2015, representing the Group’s performance for the period:
Revenues
318.0
(17.4%)
Materials
(55.5)
(151.5)
(47.6%)
Services
(16.9%)
Payroll
(53.7)
(1.1%)
Other costs
(3.4)
16.9%
EBITDA
53.9
(4.3%)
Depreciationandamortization
(13.7)
12.6%
Operatingincome
40.2 (3.4)
(1.1%)
Netfinancialexpense
36.8
11.6%
Incomebeforetaxation
(11.1)
(3.5%)
Taxation
25.7
8.1%
Netincome
OPERATING RESULTS
As noted earlier the first nine months of 2014 were affected by the income arising from the sale of a property to the parent Fedone S .r .l . (in turn controlled by Cav . Lav . Brunello Cucinelli), not situated in the proximity of the Company’s manufacturing and logistical facilities, which led to the realization of a capital gain of € 755 thousand, recognized as other income. The figures for the first nine months of 2014 have been “normalized” in this interim report by excluding this transaction so that a homogeneous and consistent comparison may be made with the Group’s performance for the current period .

CONSOLIDATED INTERIM REPORT AT 30TH SEPTEMBER 2015
26
The following table provides a summary of operating income and operating profitability (EBITDA):
(In thousands of Euro) Nine months ended 30th September Change
2015 % of revenues 2014 normalized(2)
% of revenues 2015 vs. 2014 2015 vs. 2014 %
Operating income 40,204 12.6% 38,598 13.9% 1,606 +4.2%+ Depreciation and amortization 13,663 4 .3% 9,450 3 .4% 4,213 +44 .6%EBITDA (1) 53,867 16.9% 48,048 17.3% 5,819 +12.1%
(1) EBITDA is calculated as operating income before depreciation and amortization. EBITDA defined in this way is a measure used by Company management to monitor and assess operating performance . EBITDA is not an IFRS accounting measure and accordingly should not be considered as an alternative for assessing trends in the Group’s operating income. Since the composition of EBITDA is not regulated by the Group’s accounting principles, the way in which the Group calculates this figure may not be consistent with that used by others and may therefore not be comparable .
(2) The figures for operating income and EBITDA for the nine months ended 30th September 2014 have been “normalized” to exclude the capital gain of € 755 thousand recognized in the first half of 2014 and enable a homogenous and consistent comparison to be made with the figures for the current period.
EBITDA reached € 53,867 thousand at 30th September 2015, or 16 .9% of revenues, an increase of 12 .1% over the normalized figure for the corresponding period in 2014 (17.5% of revenues).The first nine months of 2015 were characterized by a decrease in production costs for raw materials and outsourced work as a percentage of revenues, arising mostly from changes between the quarters and the higher proportion of revenues generated by the retail distribution channel where the development and expansion of the directly operated sales points however led to an increase in other operating costs as a percentage of revenues, in particular rental expense and payroll costs .
Operating income amounted to € 40,204 thousand in the nine months ended 30th September 2015, representing 12.6% of revenues, an increase of 4.2% over the normalized figure for the corresponding period in 2014. As a result of the investments made depreciation and amortization had a significant effect, representing 4.3% of revenues in the nine months ended 30th September 2015 compared to 3.4% in the first nine months of 2014 (an increase of € 4,213 thousand in absolute terms) .
The following table sets out trends in the Group’s EBITDA and operating income for the nine months ended 30th September 2015 and 30th September 2014 in graphical form:
Operating income (€ m) Operating income (%)EBITDA (€ m) EBITDA (%)
30th September 2015 30th September 2014 ADJ 30th September 2014 ADJ
53.948.0
16.9% 17.3%
30th September 2015
40.2 38.6
12.6% 13.9%
As can be seen EBITDA fell from a normalized 17.3% in the first nine months of 2014 to 16.9% in the first nine months of 2015, increasing in absolute terms by € 5,819 thousand .

CONSOLIDATED INTERIM REPORT AT 30TH SEPTEMBER 2015
27
The economic dynamics that characterized the first nine months of 2015 consisted first and foremost in an increase in the net revenues posted by the retail distribution channel as a proportion of total net revenues for the period (42 .8% for the nine months ended 30th September 2015 against 36 .4% at 30th September 2014) . This increase is due to organic growth in existing points of sale (like-for-like of 5 .3%) and the development of the store network (78 boutiques at 30th September 2015 compared to 70 boutiques at 30th September 2014), as well as the passage of the business in Japan from 1st September 2014 to direct management (3 boutiques and 13 sales points in the Japanese Luxury Department Stores) .
Commercial expansion in the first nine months of 2015 accordingly led to an increase in certain operating costs as a percentage of revenues (emphasized also by the effect of the translation rate between the Euro and the currencies in the non-EU area, especially the US dollar), and more specifically rental expense (which in addition to the openings and conversions of boutiques was affected by the increases generated by the repositioning and extension of some of the more important boutiques, the renegotiation of expiring contracts, the opening of the new show-room in Tokyo and the repositioning of the key showroom in New York) and payroll costs (resulting from an increase in the workforce, mostly in sales staff) .
The above changes led to the following, in line with the situation for the six months ended 30th June 2015:
1 . a decrease in costs for raw materials and consumables and outsourced manufacturing costs as a percentage of total revenues (36 .3% for the nine months ended 30th September 2015 compared to 39 .9% at 30th September 2014); this figure is affected by the fact that revenues and costs are not perfectly homogenous during the various quarters of the year. The corresponding figure for costs for raw materials and consumables and outsourced manufacturing costs for the year ended 31st December 2014 was 37 .1% .
(In thousands of Euro) Nine months ended 30th September Change
2015 % of revenues 2014 % of revenues 2015 vs. 2014 2015 vs. 2014 %
Costs for raw materials and consumables 59,626 18 .7% 56,392 20 .2% 3,234 +5 .7%Change in inventories (4,146) -1 .3% (4,846) -1 .7% 700 -14 .4%Outsourced manufacturing costs 59,951 18 .9% 59,551 21 .4% 400 +0 .7%Total 115,431 36.3% 111,097 39.9% 4,334 +3.9%
The percentage change of +3.9% for the present period is in line with the figure of +2.4% posted at 30th June 2015 .
2 . an increase in rental expense as a percentage of total revenues (10 .9% for the nine months ended 30th September 2015 compared to 7 .3% at 30th September 2014) and by € 14,199 thousand in absolute terms over the first nine months of the previous year. The corresponding figure for the year ended 31st December 2014 was 8 .1% .
(In thousands of Euro) Nine months ended 30th September Change
2015 % of revenues 2014 % of revenues 2015 vs. 2014 2015 vs. 2014 %
Rental expense 34,582 10 .9% 20,383 7 .3% 14,199 +69 .7%
The percentage change of +69.7% for the present period is in line with the figure of +74.2% posted at 30th June 2015 .

CONSOLIDATED INTERIM REPORT AT 30TH SEPTEMBER 2015
28
3 . an increase in payroll costs as a percentage of total revenues (16 .9% in the nine months ended 30th September 2015 compared to 15 .9% at 30th September 2014), which amounted to € 53,696 thousand compared to € 44,447 thousand in the corresponding period in the previous year representing a rise of € 9,249 thousand in absolute terms. The percentage change of +20.8% for the present period is in line with the figure of +22.3% posted at 30th June 2015 .
There were 1,365 .8 full time equivalent staff (FTE) at 30th September 2015 compared to 1,213 .3 at 30th September 2014 (+152 .5), with the rise mainly due to the increase in sales personnel resulting from the expansion of the directly operated sales point network .
The percentage of total revenues for the year ended 31st December 2014 was 17 .4% .
Payroll costs (€m)
53.7
16.9% 15.9%
1,365.8
469.2
846.9
49.7
1,213.3
461.3
709.5
42.530th September 2015 30th September 201530th September 2014 30th September 2014
Payroll costs (%)
Managers and middlemanagementOffice and sales staff
Factory workers
44.5 Total
Having looked at the main changes taking place in production costs, rental expense and payroll costs, brief comments follow on the other main items making up operating costs:– Commissions and accessory costs, being the commissions payable to the network of agents, which were in
line with the first nine months of 2014 (3.4% in 2015, 3.2% in 2014);– Advertising and other marketing costs, which rose by € 1,723 thousand or 10 .8% and represented 5 .5% of
revenues in the nine months ended 30th September 2015 compared to 5 .7% at 30th September 2014 . These costs relate to the promotional activities carried out by the Group to disseminate its image and philosophy throughout the world (more specifically these are mainly costs incurred for the production of catalogues, advertising campaigns and fairs and exhibitions organized in Italy and abroad) . Communication and image costs amounted to 5 .5% of revenues in the year ended 31st December 2014;
– Transport and duties, which amounted to 3.6% of revenues in 2015, a decrease over the figure of 4.5% in 2014;
– Credit card charges, which rose by 31.4% over the first nine months of 2014, a figure closely linked with the growth of the retail channel .

CONSOLIDATED INTERIM REPORT AT 30TH SEPTEMBER 2015
29
The following table provides a summary of these items for the first nine months of 2015 and 2014 including the figure for these costs as a percentage of revenues.
(In thousands of Euro) Nine months ended 30th September Change
2015 % of revenues 2014 % of revenues 2015 vs. 2014 2015 vs. 2014 %
Commissions and accessory costs 10,769 3 .4% 9,028 3 .2% 1,741 +19 .3%Advertising and other marketing expenses 17,633 5 .5% 15,910 5 .7% 1,723 +10 .8%Transport and duties 11,567 3 .6% 12,438 4 .5% (871) -7 .0%Credit card charges 2,479 0 .8% 1,887 0 .7% 592 +31 .4%
CONSOLIDATED INTERIM REPORT AT 30TH SEPTEMBER 2015
30
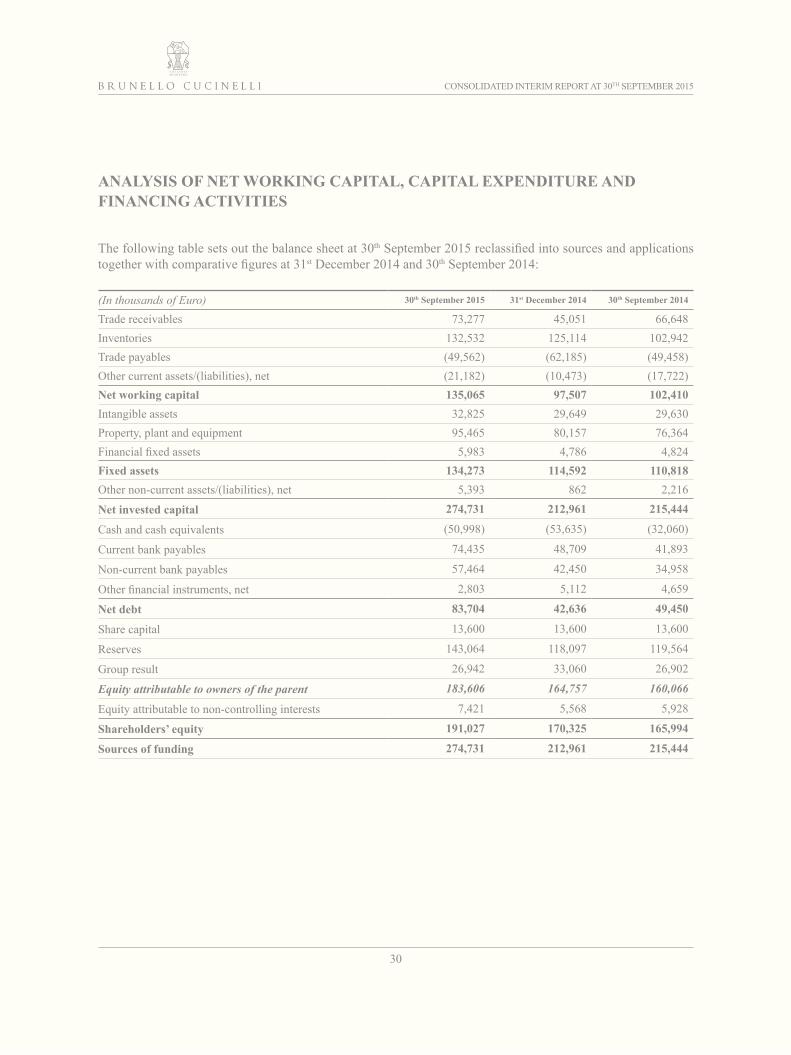
ANALYSIS OF NET WORKING CAPITAL, CAPITAL EXPENDITURE AND FINANCING ACTIVITIES
The following table sets out the balance sheet at 30th September 2015 reclassified into sources and applications together with comparative figures at 31st December 2014 and 30th September 2014:
(In thousands of Euro) 30th September 2015 31st December 2014 30th September 2014
Trade receivables 73,277 45,051 66,648Inventories 132,532 125,114 102,942Trade payables (49,562) (62,185) (49,458)Other current assets/(liabilities), net (21,182) (10,473) (17,722)Net working capital 135,065 97,507 102,410Intangible assets 32,825 29,649 29,630Property, plant and equipment 95,465 80,157 76,364Financial fixed assets 5,983 4,786 4,824Fixed assets 134,273 114,592 110,818Other non-current assets/(liabilities), net 5,393 862 2,216
Net invested capital 274,731 212,961 215,444
Cash and cash equivalents (50,998) (53,635) (32,060)
Current bank payables 74,435 48,709 41,893
Non-current bank payables 57,464 42,450 34,958
Other financial instruments, net 2,803 5,112 4,659
Net debt 83,704 42,636 49,450
Share capital 13,600 13,600 13,600
Reserves 143,064 118,097 119,564
Group result 26,942 33,060 26,902
Equity attributable to owners of the parent 183,606 164,757 160,066
Equity attributable to non-controlling interests 7,421 5,568 5,928
Shareholders’ equity 191,027 170,325 165,994
Sources of funding 274,731 212,961 215,444

CONSOLIDATED INTERIM REPORT AT 30TH SEPTEMBER 2015
31
NET WORKING CAPITAL
Given the “seasonality” referred to above, the following comments on net working capital compare the situation at 30th September 2015 with that at 30th September 2014 for a better understanding of the main changes that have occurred .
Net working capital at 30th September 2015 rose by € 32,655 thousand over the balance at 30th September 2014 .This difference mainly arises from the combined effect of the following:– an increase in “Inventories” of € 29,590 thousand, with the period end balance equivalent to 33.5% of
net revenues for the past 12 months (35 .2% at 31st December 2014) . This is mainly due to the new direct management of sales points that has taken place over the past twelve months, as discussed elsewhere in these financial statements, as well as business development over the period. The balance of € 132.5 million at 30th September 2015 is lower than that of € 141 .9 million at 30th June 2015, consistent with last year’s trend when inventories fell from € 107 .3 million at 30th June 2014 to € 102 .9 million at 30th September 2014;
– an increase in “Trade receivables” of € 6,629 thousand (€ 73,277 thousand at 30th September 2015 compared to € 66,648 thousand at 30th September 2014) . This is principally due to changes arising from business growth as well as the translation into Euro of receivables in foreign currency, which are affected by difference in the period end exchange rate at 30th September 2015 compared to that at 30th September 2014;
– the balance of “Trade payables”, relating mainly to the parent company’s activities (and therefore expressed in Euro and not affected by the period end exchange rate), which is essentially consistent with business trends, being € 49,562 thousand at 30th September 2015 compared to € 49,458 thousand at 30th September 2014;
– the balance of “Other net liabilities” of € 21,182 thousand at 30th September 2015 compared to € 17,722 thousand at 30th September 2014, mainly due to the fair value measurement of the derivative instruments hedging the currency risk arising from commercial transactions not carried out in Euro . In this respect it is recalled that the Group uses cash flow hedge accounting to account for these derivative instruments, by which the fair value of the instruments is recognized as an asset or a liability (“Derivative instruments – current assets” or “Derivative instruments – current liabilities”) with a counter-entry made to an equity reserve for the effective portion of the change in fair value of the derivative instruments which is reclassified into profit or loss, as revenues, on recognition of the hedged transactions .

CONSOLIDATED INTERIM REPORT AT 30TH SEPTEMBER 2015
32
CAPEX
The Group made investments in fixed assets amounting to € 32,428 thousand in the nine months ended 30th September 2015, of which € 6,707 thousand in intangible assets, € 23,912 thousand in property, plant and equipment and € 1,809 thousand in financial fixed assets (guarantee deposits).Total investments made in the past twelve months amount to € 40,955 thousand .The following table sets out the capital expenditure made by the Group in the first nine months of 2015 and 2014 and in the past twelve months (30th September 2014 to 30th September 2015), analyzed by type and category .
(In thousands of Euro) 30th September 2015 30th September 2014 from 30th September 2014to 30th September 2014
Capex in intangible assets 6,707 6,179 8,079Capex in property, plant and equipment 23,912 23,622 30,941Capex in financial fixed assets 1,809 1,333 1,935Total capex 32,428 31,134 40,955
The most significant investments made were for the opening and structuring of points of sale, to a large extent due to the entry into the consolidation scope of SAM Brunello Cucinelli Monaco, which will operate the Monte Carlo boutique, and the opening of new stores directly operated by the Group in Europe, North America and the Rest of the World .
Other important investments regarded the purchase of the property complex located in the Avenza district in the Municipality of Carrara where the Brunello Cucinelli Group produces menswear (through the subsidiary Pinturicchio S .r .l .) .
Investments were additionally made in information technology for a total of € 3,117 thousand, of which € 1,997 thousand recognized as intangible assets and € 1,120 thousand as property, plant and equipment .
Below is a graphical representation of the capital expenditure made by the Group in the nine months ended 30th September 2015, analyzed by investment type:
Exclusive salespoints
16.5 1.8
Financialinvestments
4.5
Key money Total investmentsin production, logisticsand IT/Digital
9.6
3%
32.4
Totalinvestments
10.2%
22.8
Total netcommercialinvestments
7.2%

CONSOLIDATED INTERIM REPORT AT 30TH SEPTEMBER 2015
33
Depreciation and amortization (€ 13,663 thousand for the nine months ended 30th September 2015 and € 9,450 thousand for the corresponding period of the previous year) amounted to 4.3% of revenues for the first nine months of 2015 and 3.4% for the first nine months of 2014; the increase of € 4,213 thousand in absolute terms is mainly due to the investments made .
FINANCING ACTIVITIES
The following table provides details of net debt at 30th September 2015, 31st December 2014 and 30th September 2014 .
NET DEBT:
(In thousands of Euro) 30th September 2015 31st December 2014 30th September 2014
A . Cash (216) (158) (152)B . Cash equivalents (50,782) (53,477) (31,908)C. Cash and cash equivalents (A)+(B) (50,998) (53,635) (32,060)D. Current financial receivables (46) (44) (33)E . Current bank payables 74,435 48,709 41,893F. Other current financial liabilities 645 2,026 564G. Current payables (E)+(F) 75,080 50,735 42,457H. Net current debt (G)+(D)+(C) 24,036 (2,944) 10,364I . Non-current bank payables 57,464 42,450 34,958J. Other non-current financial liabilities 2,204 3,130 4,128K. Non-current debt (I)+(J) 59,668 45,580 39,086L. Net debt (H) + (K)(1) 83,704 42,636 49,450(1) Current and non-current debt are not IFRS accounting measures. The way in which the Group calculates this figure may not be consistent with that used by
others and may therefore not be comparable .
The net debt of the Brunello Cucinelli Group at 30th September 2015 amounted to € 83,704 thousand (€ 42,636 thousand at 31st December 2014) compared to € 49,450 thousand at 30th September 2014 (€ 16,101 thousand at 31st December 2013) . This increase is due to capex dynamics and business seasonality, with the usual peak in the year’s net financial position being reached between June and September.
Comparing the net financial position at 30th September 2015 (€ 83,704 thousand) with that at 30th September 2014 (€ 49,450 thousand), the increase is consistent with the dynamics of the first half year, when the net financial position increased from € 46,108 thousand at 30th June 2014 to € 78,281 thousand at 30th June 2015 .
CONSOLIDATED INTERIM REPORT AT 30TH SEPTEMBER 2015
34
In addition:– in the same way as at 31st December 2014, during the first nine months of 2015 the Group took out new
loans for a total of € 56,682 thousand and extinguished loans for a total of € 31,787 thousand in order to reformulate its long term debt at interest rates that are more advantageous than those charged previously . More specifically, new loans of approximately € 12.5 million taken out during the first half of 2015 and obtained under more favorable conditions were used to make early repayment of previously contracted debt;
– “other non-current financial liabilities” consist of the liability arising from the loan obtained from the minority shareholder of the subsidiary Brunello Cucinelli Hong Kong Ltd ., to the extent of the portion attributable . Reference should be made to the section “Significant events during the period” for a discussion of the put option previously held by the shareholders of Brunello Cucinelli England Ltd . .
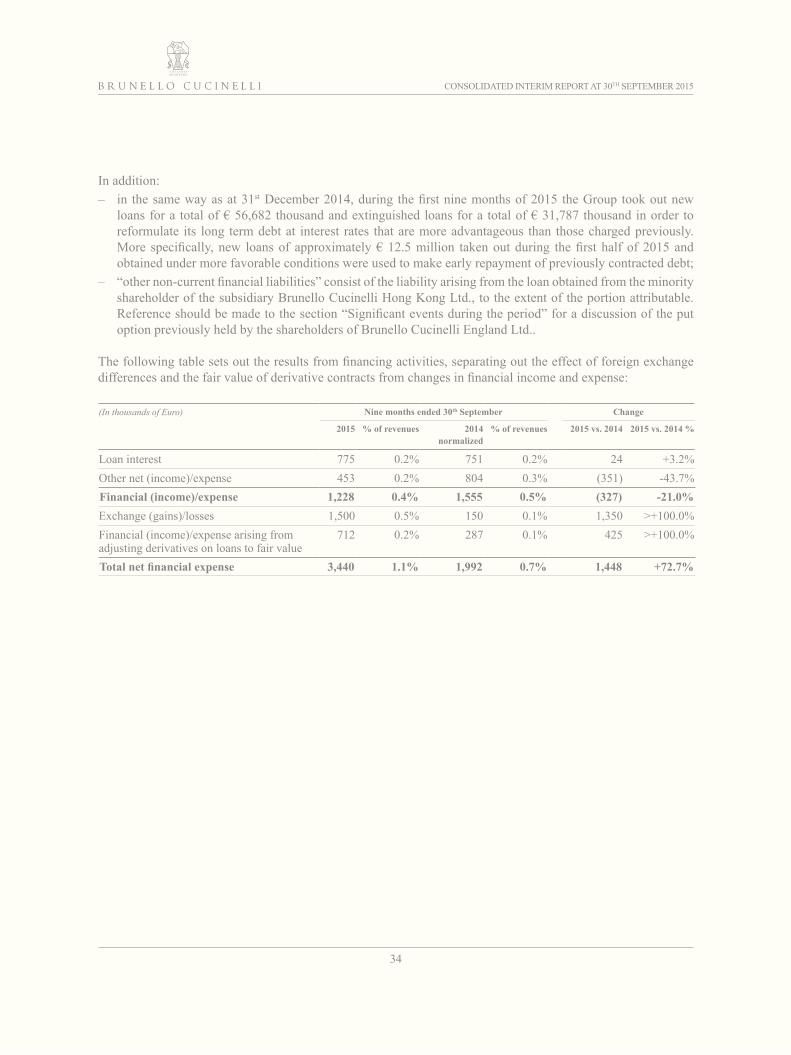
The following table sets out the results from financing activities, separating out the effect of foreign exchange differences and the fair value of derivative contracts from changes in financial income and expense:
(In thousands of Euro) Nine months ended 30th September Change
2015 % of revenues 2014 normalized
% of revenues 2015 vs. 2014 2015 vs. 2014 %
Loan interest 775 0 .2% 751 0 .2% 24 +3 .2%Other net (income)/expense 453 0 .2% 804 0 .3% (351) -43 .7%Financial (income)/expense 1,228 0.4% 1,555 0.5% (327) -21.0%Exchange (gains)/losses 1,500 0 .5% 150 0 .1% 1,350 >+100 .0%Financial (income)/expense arising from adjusting derivatives on loans to fair value
712 0 .2% 287 0 .1% 425 >+100 .0%
Total net financial expense 3,440 1.1% 1,992 0.7% 1,448 +72.7%

CONSOLIDATED INTERIM REPORT AT 30TH SEPTEMBER 2015
35
PERFORMANCE OF THE COMPANY’S SHARE
On 30th September 2015, the final trading day for the period, the official closing price of the Brunello Cucinelli share was € 16 .22 (+109 .3% compared to the € 7 .75 per share set for the IPO, -12 .5% compared to the price of € 18 .53 at the end of 2014) . Market capitalization at 30th September 2015 was € 1,102,960 thousand .
The following table provides details of the company’s share price and the share’s performance between 1st January and 30th September 2015:
Euro Date
IPO price 7 .75 –
Minimum price (1) 15 .57 24-Aug-14
Maximum price (1) 20 .14 27-Jan-15
Official price 16 .22 30-Sep-15
Capitalization 1,102,960,000 30-Sep-15
Number of outstanding shares 25,772,000 30-Sep-15
Free float 418,021,840 30-Sep-15
(1) Minimum and maximum prices recorded during daily trading which therefore do not necessarily coincide with the official reference prices for the day.
18
16
14
10
12
8
6
4
2
0
22
20
Price per share (Euro)
2-Ja
n
16-J
an
30-J
an
13-F
eb
27-F
eb
13-M
ar
27-M
ar
14-A
pr
28-A
pr
13-M
ay
27-M
ay
10-J
un
24-J
un
8-Ju
l
22-J
ul
30-S
ep
5-Au
g
19-A
ug
2-Se
p
16-S
ep

CONSOLIDATED INTERIM REPORT AT 30TH SEPTEMBER 2015
36
SIGNIFICANT EVENTS DURING THE PERIOD
Finalization of the purchase of the property complex from Spring Immobiliare S.r.l. as part of the agreements with d’Avenza Fashion S.p.A.On 15th January 2015 the Company finalized the purchase from Spring Immobiliare S.r.l. (a company belonging to the group of which d’Avenza Fashion S .p .A . forms part), at a price of € 2,770,000, of the property complex located in the Avenza district in the Municipality of Carrara, where the Brunello Cucinelli Group produces menswear (through the subsidiary Pinturicchio S .r .l .) . This acquisition completes the implementation of the agreements originally reached with d’Avenza Fashion S .p .A . .
Increase in share capital by Brunello Cucinelli Lessin Sichuan Fashion Co., Ltd.In January 2015, March 2015 and September 2015 the Company made capital payments of 30 million, 25 million and 10 million Renminbi (RMB) respectively as part of a fully reserved increase of the share capital of Brunello Cucinelli Lessin Sichuan Fashion Co ., Ltd . totaling 100 million RMB (the company’s share capital will therefore rise from 100 million RMB to 200 million RMB) . On completion of the entire capital payment, the Company’s interest in Brunello Cucinelli Lessin Sichuan Fashion Co ., Ltd . will increase to 75 .5% . This operation forms part of the logic of providing support and development on the Chinese market, which has considerable importance for the Company from a prospective standpoint .
Formation of SAM Brunello Cucinelli MonacoOn 6th February 2015 the formation of SAM Brunello Cucinelli Monaco was completed . The Company has a 68 .67% interest in the new entity, while an independent third party holds 30% . The new boutique in Monaco - Monte Carlo was opened on 18th April 2015 .
Sale of the Company’s shares by Fedone S.r.l.On 29th January 2015 Fedone S .r .l ., the Company’s controlling shareholder, sold 3,494,000 of the Company’s shares, corresponding to 5 .14% of its share capital, through an accelerated book building offering reserved for institutional investors . BofA Merrill Lynch acted as sole bookrunner for the placement . As part of the same transaction Fundita S .r .l . sold 350,000 shares to Fedone S .r .l . . Following this operation Fedone S .r .l . and Fundita S .r .l . hold 57% and 2% respectively of the share capital of Brunello Cucinelli S .p .A . . As announced to the market on the same date, Fedone has confirmed its commitment to remain the controlling shareholder of the Company in the very long term .
Formation of Brunello Cucinelli Canada LimitedBrunello Cucinelli Canada Limited was formed on 9th February 2015 . The Company holds a 70% interest in the new entity with the remaining 30% held by IMC Retail Inc . (a company headed by Mr . Massimo Ignazio Caronna, a former partner of the Brunello Cucinelli Group in Cucinelli Holding Co, LLC) . Brunello Cucinelli Canada Limited will run the monobrand store to be opened in Vancouver in the fourth quarter of 2015 and will also be in charge of managing the Brunello Cucinelli multibrand business in Canada .

CONSOLIDATED INTERIM REPORT AT 30TH SEPTEMBER 2015
37
Increase in share capital by Brunello Cucinelli Brasil Ltda.In May 2015 the Brazilian subsidiary Brunello Cucinelli Brasil Ltda . increased its share capital by Reais 2,400,000 (equivalent to € 698 thousand) . The aim of the capital increase is to support the subsidiary, which operates the monobrand store in the well-known Cidade Jardim shopping mall in San Paolo, during its start-up phase .
New agreement Brunello Cucinelli EnglandIn September 2015 the Brunello Cucinelli Group and Mr . Charles Rambaud, the managing director of Brunello Cucinelli (England) Ltd . and owner of 30% of that company’s share capital signed a new agreement which, amending the put and call option arranged on the acquisition of Brunello Cucinelli (England) Ltd ., provides solely for a call option in favour of the Brunello Cucinelli Group, which may be exercised in several circumstances including on the fifth or tenth anniversary of the new agreement.
Formation of SAS Brunello Cucinelli France ResortIn September 2015 SAS Brunello Cucinelli France Resort was formed (of which 70% is held by Brunello Cucinelli Europe S .r .l . and 30% by an independent third party); the company will run the direct monobrand local boutiques .
CONSOLIDATED INTERIM REPORT AT 30TH SEPTEMBER 2015
38
SIGNIFICANT SUBSEQUENT EVENTS
No significant events occurred in the period between the balance sheet date and the date on which this interim report was approved by the Board of Directors .
BUSINESS OUTLOOK
The current year is about to end with “beautiful” results and constant, solid and fair growth. A growth which regards both revenues and profitability ratios and is in line with the results for the nine months ended 30th September 2015 .
The sell-out of the winter 2015 collections is performing very well . We are about to complete the great 2013-2015 investment plan that has helped us build an even stronger and more robust company for the years to come . The spring/summer sales campaign ended with “excellent” results and very special feedback from both multibrands and the specialized press . Therefore on the back of these results we envisage a very positive 2016, with double-digit gracious growth .
Our tasks lies as always in collecting stimuli, inspirations and indications from the world (especially from the web) and translating them into reality, day by day . We increasingly think of the physical and digital worlds as a single, integrated entity so that we can combine identity and projects in a consistent manner . The “Great Internet Project” for upgrading the information technology platform and managing the brand’s digital presence, which started in 2014 with the creation of an especially dedicated structure, will continue strengthening the online boutique and warehouse management in Solomeo . This important project in terms of both the human resources and the investments involved, is consistent with the strategic decision to have an exclusive presence in the digital world and with our idea to be “artisans and humanists” of the web. The goal is to make both the “traditional” boutique channel and the “online” channel a unique experience representing the quintessence of the Bruello Cucinelli lifestyle, the experience of the hamlet of Solomeo, the exclusive positioning and the personalized experience we provide for each of our end customers .
BASIS OF PREPARATION OF THE CONSOLIDATED INTERIM REPORT
The Group’s interim report for the nine months ended 30th September 2015 has been prepared in accordance with article 154-ter, paragraph 5 of the Consolidated Finance Law (TUF) introduced by Legislative Decree no . 195/2007 in implementation of Directive 2004/109/EC .The Board of Directors of Brunello Cucinelli S .p .A approved this consolidated interim report on 10th November 2015 and authorized its distribution to the public at the same date .

CONSOLIDATED INTERIM REPORT AT 30TH SEPTEMBER 2015
39
SCOPE OF CONSOLIDATION
The scope of consolidation for the nine months ended 30th September 2015 was extended following the formation of SAM Brunello Cucinelli Monaco, Brunello Cucinelli Canada Limited and SAS Brunello Cucinelli France Resort, as discussed in the section “Significant events during the period”. The latter company was not yet operative at the date of this interim report .
ACCOUNTING STANDARDS
The Group’s financial position, results and cash flows for the nine months ended 30th September 2015 have been prepared in accordance with the International Accounting Standards (IAS), the International Financial Reporting Standards (IFRS) and the related interpretations issued by the IASB and adopted by the European Union that are applicable at the balance sheet date . The accounting standards used to prepare these statements are the same as those used to prepare the consolidated financial statements at 31st December 2014 .
DISCRETIONAL MEASUREMENTS AND SIGNIFICANT ACCOUNTING ESTIMATES
While not showing sharp seasonal or cyclical variations in total annual sales, the Group’s business is affected in the course of the various quarters of the year by revenues and costs arising mainly from industrial operations that are not perfectly homogeneous. Consequently, any analysis of interim results and financial and profitability indicators cannot be considered as fully representative, and it is therefore not advisable to consider the period indicators as a proportional share of the full year .
The preparation of the interim report also requires the parent company’s directors to make discretional measurements, estimates and assumptions that affect the amounts of revenues, expenses, assets and liabilities and the disclosure of contingent liabilities at the reporting date . The actual results could differ from these estimates . The main discretional estimates and measurements relate to the recognition and measurement of the following items .
Deferred tax assetsDeferred tax assets are recognized for deductible temporary differences between the carrying amounts of assets and liabilities in the financial statements and their corresponding tax bases and for unused tax losses to the extent that it is probable that sufficient taxable profit will be available against which these losses can be utilized. A discretional assessment is required by the directors to determine the amount of deferred tax assets that can be recognized, which is based on an estimate of the likely timing and amount of future taxable profits.

CONSOLIDATED INTERIM REPORT AT 30TH SEPTEMBER 2015
40
Liabilities for employee benefits (the employees’ termination indemnity or “TFR”) and the agents’ supplementary termination indemnity provisionThe employees’ termination indemnity (TFR) and the agents’ supplementary termination indemnity provision for the Group’s Italian companies are measured using actuarial valuations . These valuations require assumptions to be made about discount rates, future salary increases (only for the TFR), staff turnover and mortality rates . Because of the long-term nature of these plans, these estimates are subject to a significant degree of uncertainty.
Allowance for doubtful debtsThe allowance for doubtful debts represents management’s best estimate, on the basis of information available at the date of preparation of the financial statements, of the amount required to adjust receivables to their estimated realizable value .
Useful lives of property, plant and equipment and intangible fixed assetsThe directors are required to make discretional estimates to determine the useful lives of property, plant and equipment and intangible assets with a finite useful life. Such estimates are reviewed at every balance sheet date to ensure that the carrying amounts reflect the best estimates of the costs to be incurred by the Group, and in the case of any significant differences the amounts for depreciation and amortization are revised and updated .
Derivative instrumentsThe measurement of derivatives as assets and liabilities requires the use of estimates and assumptions . These estimates and assumptions are constantly reviewed and the effects of any changes are immediately recognized in the financial statements.
The directors make estimates and assumptions with the support of the company functions and, where appropriate, independent professionals .
The Brunello Cucinelli Group only uses derivative instruments for hedging the financial risks arising from changes in interest rates on bank loans and changes in exchange rates on commercial tranbsactions in foreign currency. More specifically, in order to limit the exposure to the currency risk arising from its commercial activity, the Brunello Cucinelli Group enters derivative contracts (forward currency sales contracts) designed to establish in advance the translation rate or a pre-determined range of translation rates at a future date . The Group uses cash flow hedge accounting to account for derivative contracts entered to hedge the currency risk arising from commercial transactions in foreign currency that are considered to be highly probable . As a consequence of this, the highly effective portion of the change in fair value of the derivative instruments taken out to hedge highly probable transactions in foreign currency is recognized directly in equity . The amounts recognized in equity are reclassified into profit or loss as revenues when the hedged transactions are recognized for accounting purposes. The ineffective portion of the change in fair value is recognized in profit or loss as financial income or expense. Any changes in fair value after the recognition of the hedged transactions for accounting purposes are recognized in profit or loss as financial income or expense in accordance with the method adopted for accounting for hedged items .

CONSOLIDATED INTERIM REPORT AT 30TH SEPTEMBER 2015
41
The exchange rates used for translating the financial statements of subsidiaries denominated in a foreign currency into Euro are shown in the following table (currency per 1 Euro):
Average exchange rate End of period exchange rate
30th September 2015 30th September 2014 30th September 2015 31st December
201430th September
2014
US dollar 1 .114359 1 .35487 1 .1203 1 .2141 1 .2583Swiss franc 1 .062106 1 .218013 1 .0915 1 .2024 1 .2063Japanese yen 134 .777591 139 .485916 134 .69 145 .23 138 .11Renmimbi (yuan) 6 .964135 8 .354406 7 .1206 7 .5358 7 .7262British pound 0 .727149 0 .81182 0 .7385 0 .7789 0 .7773Hong Kong dollar 8 .6397 10 .506656 8 .6824 9 .417 9 .774Real 3 .525728 3 .102823 4 .4808 3 .2207 3 .0821Canadian dollar 1 .403842 (*) 1 .5034 (*) (*)
(*) Exchange rate not used in the period stated .

CONSOLIDATED INTERIM REPORT AT 30TH SEPTEMBER 2015
42
RELATED PARTY TRANSACTIONS
Except for the matters discussed in the section “Significant events during the period” no other related party transactions were performed during the nine months ended 30th September 2015 which had unusual features or involved significant amounts, other than those carried out on a continuing basis.
Cav. Lav. Brunello Cucinelli Chairman of the Board of Directors

CONSOLIDATED INTERIM REPORT AT 30TH SEPTEMBER 2015
43
FINANCIAL STATEMENTS AT 30TH SEPTEMBER 2015
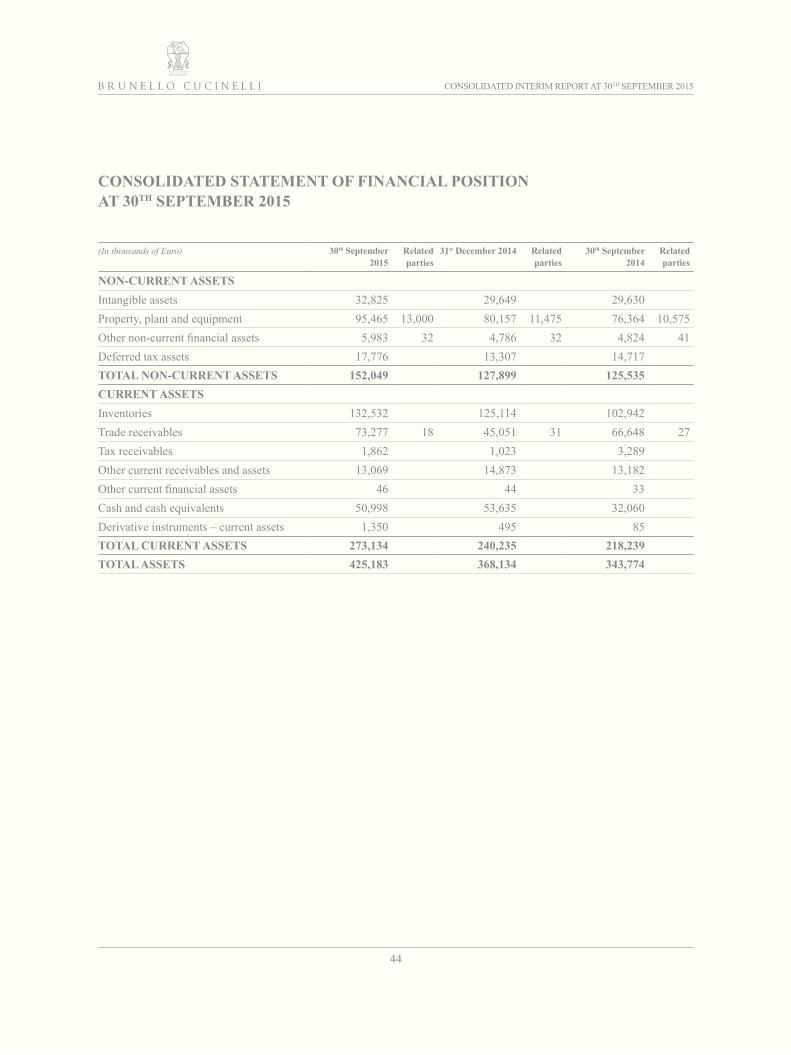
CONSOLIDATED INTERIM REPORT AT 30TH SEPTEMBER 2015
44
CONSOLIDATED STATEMENT OF FINANCIAL POSITION AT 30TH SEPTEMBER 2015
(In thousands of Euro) 30th September 2015
Related parties
31st December 2014 Related parties
30th September 2014
Related parties
NON-CURRENT ASSETSIntangible assets 32,825 29,649 29,630Property, plant and equipment 95,465 13,000 80,157 11,475 76,364 10,575Other non-current financial assets 5,983 32 4,786 32 4,824 41Deferred tax assets 17,776 13,307 14,717TOTAL NON-CURRENT ASSETS 152,049 127,899 125,535 CURRENT ASSETSInventories 132,532 125,114 102,942Trade receivables 73,277 18 45,051 31 66,648 27Tax receivables 1,862 1,023 3,289Other current receivables and assets 13,069 14,873 13,182Other current financial assets 46 44 33Cash and cash equivalents 50,998 53,635 32,060Derivative instruments – current assets 1,350 495 85TOTAL CURRENT ASSETS 273,134 240,235 218,239 TOTAL ASSETS 425,183 368,134 343,774

CONSOLIDATED INTERIM REPORT AT 30TH SEPTEMBER 2015
45
(In thousands of Euro) 30th September 2015
Related parties
31st December 2014
Related parties
30th September 2014
Related parties
SHAREHOLDERS’ EQUITYATTRIBUTABLE TO OWNERS OF THE PARENTShare capital 13,600 13,600 13,600Share premium reserve 57,915 57,915 57,915Other reserves 85,149 60,182 61,649Net income for the period attributable to owners of the parent 26,942 33,060 26,902
TOTAL SHAREHOLDERS’ EQUITY ATTRIBUTABLE TO OWNERS OF THE PARENT 183,606 164,757 160,066
TOTAL SHAREHOLDERS’ EQUITY ATTRIBUTABLE TO NON-CONTROLLING INTERESTSCapital and reserves attributable to non-controlling interests 8,665 6,841 6,925
Net income for the period attributable to non-controlling interests (1,244) (1,273) (997)
TOTAL SHAREHOLDERS’ EQUITY ATTRIBUTABLE TO NON-CONTROLLING INTERESTS
7,421 5,568 5,928
TOTAL SHAREHOLDERS’ EQUITY 191,027 170,325 165,994NON-CURRENT LIABILITIESEmployees’ termination indemnities 3,132 3,310 3,278Provisions for risks and charges 591 947 813Non-current bank debt 57,464 42,450 34,958Non-current financial liabilities 1,798 2,663 3,709Other non-current liabilities 6,949 4,908 4,703Deferred tax liabilities 1,711 3,280 3,707Derivative instruments – non-current liabilities 406 467 419TOTAL NON-CURRENT LIABILITIES 72,051 58,025 51,587CURRENT LIABILITIESTrade payables 49,562 685 62,185 625 49,458 571Current bank debt 74,435 48,709 41,893Current financial liabilities 200 1,682 215Tax payables 11,772 1,152 10,675Derivative instruments – current liabilities 3,709 6,244 3,977Other current liabilities 22,427 19,812 19,975TOTAL CURRENT LIABILITIES 162,105 139,784 126,193 TOTAL LIABILITIES 234,156 197,809 177,780 TOTAL SHAREHOLDERS’ EQUITY AND LIABILITIES 425,183 368,134 343,774

CONSOLIDATED INTERIM REPORT AT 30TH SEPTEMBER 2015
46
CONSOLIDATED INCOME STATEMENT FOR THE NINE MONTHS ENDED 30TH SEPTEMBER 2015
(In thousands of Euro) Nine months ended 30th September
2015 Related parties
2014 Related parties
Net revenues 317,558 18 277,346 9Other operating income 451 28 1,378 781Revenues 318,009 278,724Costs for raw materials and consumables (55,480) (12) (51,546) (68)Costs for services (151,494) (1,541) (131,417) (1,336)Payroll costs (53,696) (206) (44,447) (181)Other operating costs (3,151) (2,165) (7)Own work capitalized 677 738Depreciation and amortization (13,663) (9,450)Impairment of assets and other allocations (998) (1,084)Total operating costs (277,805) (239,371) Operating income 40,204 39,353 Financial expense (24,330) (5,637)Financial income 20,890 3,645Income before taxation 36,764 37,361 Income taxes (11,066) (11,456)Net income for the period 25,698 25,905 Net income for the period attributable to owners of the parent 26,942 26,902Net income for the period attributable to non-controlling interests (1,244) (997) Basic earnings per share (Euro) 0 .39621 0 .39562Diluted earnings per share (Euro) 0 .39621 0 .39562

CONSOLIDATED INTERIM REPORT AT 30TH SEPTEMBER 2015
47
CONSOLIDATED STATEMENT OF COMPREHENSIVE INCOME FOR THE NINE MONTHS ENDED 30TH SEPTEMBER 2015
(In thousands of Euro) Nine months ended 30th September
2015 2014
Net income for the period (A) 25,698 25,905Other components of comprehensive income:Items that may be reclassified subsequently to profit or loss 1,666 (717)Gains/(losses) on cash flow hedges 1,259 (3,102)Tax effect (346) 853Total gains/(losses) on cash flow hedges 913 (2,249)Exchange differences on translating foreign operations 753 1,532Items that will not be reclassified to profit or loss 114 (69)Employees’ termination indemnities (IAS 19 revised) 157 (95)Tax effect (43) 26Total other gains/(losses) net of tax (B) 1,780 (786)Total comprehensive income net of tax (A) + (B) 27,478 25,119Attributable to: Owners of the parent 28,636 25,794Non-controlling interests (1,158) (675)
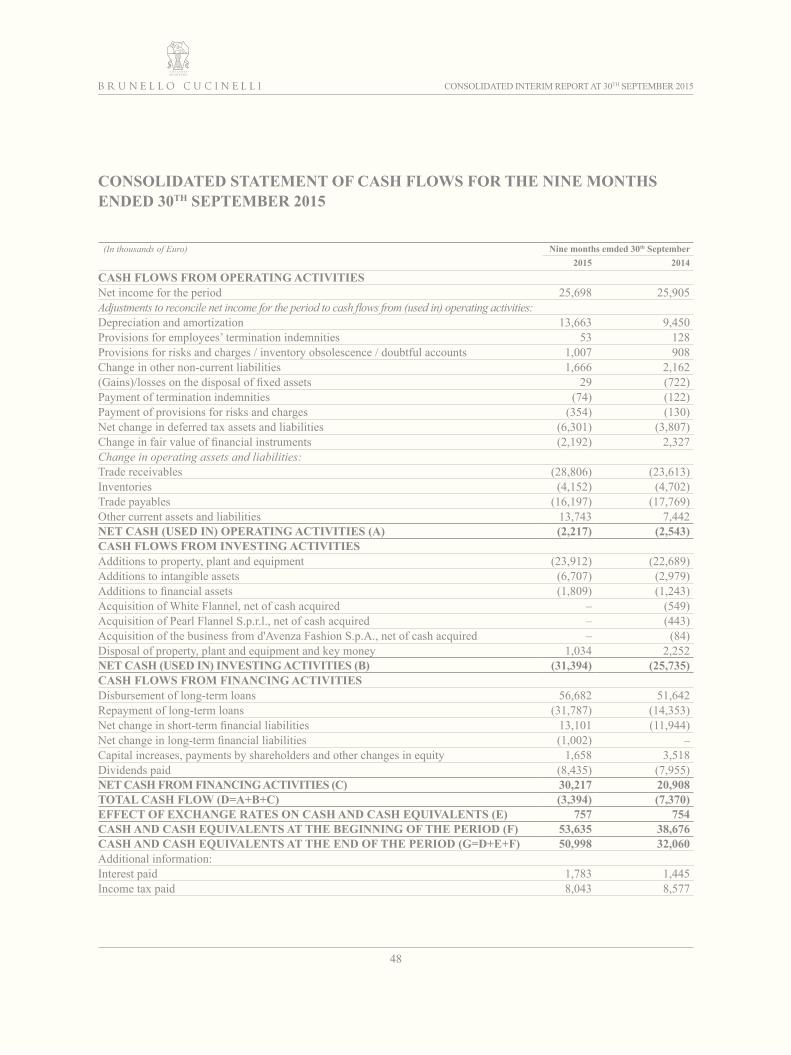
CONSOLIDATED INTERIM REPORT AT 30TH SEPTEMBER 2015
48
CONSOLIDATED STATEMENT OF CASH FLOWS FOR THE NINE MONTHS ENDED 30TH SEPTEMBER 2015
(In thousands of Euro) Nine months emded 30th September 2015 2014
CASH FLOWS FROM OPERATING ACTIVITIESNet income for the period 25,698 25,905Adjustments to reconcile net income for the period to cash flows from (used in) operating activities:Depreciation and amortization 13,663 9,450Provisions for employees’ termination indemnities 53 128Provisions for risks and charges / inventory obsolescence / doubtful accounts 1,007 908Change in other non-current liabilities 1,666 2,162(Gains)/losses on the disposal of fixed assets 29 (722)Payment of termination indemnities (74) (122)Payment of provisions for risks and charges (354) (130)Net change in deferred tax assets and liabilities (6,301) (3,807)Change in fair value of financial instruments (2,192) 2,327Change in operating assets and liabilities:Trade receivables (28,806) (23,613)Inventories (4,152) (4,702)Trade payables (16,197) (17,769)Other current assets and liabilities 13,743 7,442NET CASH (USED IN) OPERATING ACTIVITIES (A) (2,217) (2,543)CASH FLOWS FROM INVESTING ACTIVITIESAdditions to property, plant and equipment (23,912) (22,689)Additions to intangible assets (6,707) (2,979)Additions to financial assets (1,809) (1,243)Acquisition of White Flannel, net of cash acquired – (549)Acquisition of Pearl Flannel S .p .r .l ., net of cash acquired – (443)Acquisition of the business from d'Avenza Fashion S .p .A ., net of cash acquired – (84)Disposal of property, plant and equipment and key money 1,034 2,252NET CASH (USED IN) INVESTING ACTIVITIES (B) (31,394) (25,735)CASH FLOWS FROM FINANCING ACTIVITIESDisbursement of long-term loans 56,682 51,642Repayment of long-term loans (31,787) (14,353)Net change in short-term financial liabilities 13,101 (11,944)Net change in long-term financial liabilities (1,002) –Capital increases, payments by shareholders and other changes in equity 1,658 3,518Dividends paid (8,435) (7,955)NET CASH FROM FINANCING ACTIVITIES (C) 30,217 20,908TOTAL CASH FLOW (D=A+B+C) (3,394) (7,370)EFFECT OF EXCHANGE RATES ON CASH AND CASH EQUIVALENTS (E) 757 754CASH AND CASH EQUIVALENTS AT THE BEGINNING OF THE PERIOD (F) 53,635 38,676CASH AND CASH EQUIVALENTS AT THE END OF THE PERIOD (G=D+E+F) 50,998 32,060Additional information: Interest paid 1,783 1,445Income tax paid 8,043 8,577

CO
NSO
LID
ATE
D S
TAT
EM
EN
T O
F C
HA
NG
ES
IN S
HA
RE
HO
LD
ER
S’ E
QU
ITY
FO
R T
HE
NIN
E
MO
NT
HS
EN
DE
D 3
0TH S
EPT
EM
BE
R 2
015
(In
thou
sand
s of E
uro)
Shar
e ca
pita
lL
egal
re
serv
eSh
are
prem
ium
re
serv
e
Add
ition
al
paid
-in
capi
tal
Tran
slat
ion
rese
rve
Oth
er
rese
rves
Net
inco
me
for
the
peri
od
Tota
l Gro
up
equi
tyTo
tal n
on-
cont
rolli
ng
inte
rest
s’ eq
uity
Tota
l sh
areh
olde
rs’
equi
ty
31st D
ecem
ber
2014
13,6
002,
720
57,9
15–
1,17
956
,283
33,0
6016
4,75
75,
568
170,
325
Net
inco
me
for t
he p
erio
d26
,942
26,9
42(1
,244
)25
,698
Oth
er g
ains
/(los
ses)
668
1,02
71,
695
851,
780
Tota
l com
preh
ensi
ve in
com
e–
––
–66
81,
027
26,9
4228
,637
(1,1
59)
27,4
78A
lloca
tion
of n
et in
com
e33
,060
(33,
060)
––
–D
ivid
ends
pai
d(8
,160
)(8
,160
)(2
75)
(8,4
35)
Incr
ease
in e
quity
for a
mou
nts p
aid
in b
y no
n-co
ntro
lling
inte
rest
s–
611
611
Cha
nge
in c
onso
lidat
ion
scop
e an
d un
der
com
mon
con
trol o
pera
tions
(1,6
28)
(1,6
28)
2,67
51,
047
Oth
er c
hang
es–
11
30th
Sep
tem
ber
2015
13,6
002,
720
57,9
15–
1,84
780
,582
26,9
4218
3,60
67,
421
191,
027
(In
thou
sand
s of E
uro)
Shar
e ca
pita
lL
egal
re
serv
eSh
are
prem
ium
re
serv
e
Add
ition
al
paid
-in
capi
tal
Tran
slat
ion
rese
rve
Oth
er
rese
rves
Net
inco
me
for
the
peri
od
Tota
l Gro
up
equi
tyTo
tal n
on-
cont
rolli
ng
inte
rest
s’ eq
uity
Tota
l sh
areh
olde
rs’
equi
ty
31st D
ecem
ber
2013
13,6
002,
361
57,9
15–
(240
)37
,942
30,4
7614
2,05
43,
160
145,
214
Net
inco
me
for t
he p
erio
d26
,902
26,9
02(9
97)
25,9
05O
ther
gai
ns/(l
osse
s)1,
210
(2,3
18)
(1,1
08)
322
(786
)To
tal c
ompr
ehen
sive
inco
me
––
––
1,21
0(2
,318
)26
,902
25,7
94(6
75)
25,1
19A
lloca
tion
of n
et in
com
e35
930
,117
(30,
476)
––
–D
ivid
ends
pai
d(7
,480
)(7
,480
)(4
75)
(7,9
55)
Incr
ease
in e
quity
for a
mou
nts p
aid
in b
y no
n-co
ntro
lling
inte
rest
s–
3,51
93,
519
Cha
nge
in c
onso
lidat
ion
scop
e an
d un
der
com
mon
con
trol o
pera
tions
(233
)(2
33)
399
166
Oth
er c
hang
es(6
9)(6
9)–
(69)
30th
Sep
tem
ber
2014
13,6
002,
720
57,9
15–
970
57,9
5926
,902
160,
066
5,92
816
5,99
4
49
REL
AZI
ON
E FI
NA
NZI
AR
IA S
EMES
TRA
LE A
L 30
GIU
GN
O 2
015

CONSOLIDATED INTERIM REPORT AT 30TH SEPTEMBER 2015
50
CERTIFICATION PURSUANT TO ARTICLE 154-BIS, PARAGRAPH 2 OF THE CONSOLIDATED FINANCE LAW (TUF)
Pursuant to article 154-bis, paragraph 2 of the Consolidated Finance Law (TUF) the manager in charge of the corporate accounting documents hereby declares that the accounting information contained in this document corresponds to the documentary evidence and to the accounting books and records .
Moreno Ciarapica Manager in charge of the corporate accounting documents