consolidated interim financial report … interim financial report for the ... consolidated...
TRANSCRIPT
― 1 ―
January 24, 2007
CONSOLIDATED INTERIM FINANCIAL REPORT FOR THE FISCAL YEAR ENDING MAY 31, 2007
(SIX-MONTH PERIOD ENDED NOVEMBER 30, 2006) Pasona Inc. is listed on the First Section of the Tokyo Stock Exchange with the securities code number 4332, and on the Nippon New Market “Hercules,” Osaka Securities Exchange. (URL: http://www.pasona.co.jp/) Representative: Group CEO and President Yasuyuki Nambu For further information contact: Yoshimichi Kawasaki Managing Director and CFO Director, Corporate Strategy & Planning Department Tel: +81-3-6734-1100 Date of Board of Directors’ meeting to approve interim financial statements: January 24, 2007 U.S. GAAP: Not applied PERFORMANCE (1) Consolidated Interim Business Results
1H of the FY Ending 2007 (June 1, 2006 to November 30, 2006) (Millions of yen rounded down unless otherwise stated)
Net Sales Operating Income Ordinary Income % % %Six Months Ended Nov. 30, 2006
113,202 15.2 4,314 38.1 4,392 41.5
Six Months Ended Nov. 30, 2005
98,247 12.9 3,123 (21.6) 3,103 (22.2)
FY Ended May 31, 2006
203,815 13.8 7,745 (6.0) 7,844 (5.4)
Net Income Net Income per Share Diluted Net Income per Share
% Yen YenSix Months Ended Nov. 30, 2006
2,073 39.8 4,896.12 4,877.69
Six Months Ended Nov. 30, 2005
1,482 (36.1) 3,427.77 3,413.85
FY Ended May 31, 2006
3,588 (17.8) 8,292.17 8,221.12
Notes: 1. Equity in earnings (losses) of unconsolidated subsidiaries and affiliates
Six Months Ended November 30, 2006: ¥ 43 million Six Months Ended November 30, 2005: ¥(21) million Fiscal Year Ended May 31, 2006: ¥ 57 million
2. Average number of shares outstanding (consolidated) Six Months Ended November 30, 2006: 423,427 shares Six Months Ended November 30, 2005: 432,616 shares Fiscal Year Ended May 31, 2006: 432,782 shares
3. Changes in accounting policies: None 4. Percentages shown for net sales, operating income, ordinary income and net income are the rates of increase
and decrease compared with the corresponding period of the previous fiscal year.

― 2 ―
(2) Consolidated Financial Position As of November 30, 2006 and 2005, and May 31, 2006
(Millions of yen rounded down unless otherwise stated)
Total Assets Net Assets Equity Ratio Net Assets per Share of
Common Stock % YenNovember 30, 2006 49,918 24,573 41.3 49,581.02November 30, 2005 43,526 21,509 49.4 49,707.75May 31, 2006 51,931 27,634 45.5 54,599.58Note: Number of shares outstanding at the end of the term (consolidated)
As of November 30, 2006: 415,721 shares As of November 30, 2005: 432,725 shares As of May 31, 2006: 433,080 shares
(3) Consolidated Cash Flows
1H of the FY Ending 2007 (June 1, 2006 to November 30, 2006) (Millions of yen rounded down unless otherwise stated)
Operating Activities Investing Activities Financing Activities
Cash and Cash Equivalents, End of
Period Six Months Ended Nov. 30, 2006
(91) (1,778) (2,172) 10,629
Six Months Ended Nov. 30, 2005
406 (2,076) (712) 9,856
FY Ended May 31, 2006
6,895 (4,341) (164) 14,656
(4) Consolidated Subsidiaries and Application of the Equity Method
Number of consolidated subsidiaries: 41 Number of non-consolidated subsidiaries accounted for by the equity method: — Number of affiliated companies accounted for by the equity method: 9 (5) Changes in the Scope of Consolidation and Application of the Equity Method Newly consolidated companies: 2 Consolidated companies removed: 2 New companies accounted for by the Companies accounted for by the equity equity method: 1 method removed: 1
FORECAST OF RESULTS FOR THE FISCAL YEAR ENDING MAY 31, 2007 (June 1, 2006 to May 31, 2007)
(Millions of yen rounded down unless otherwise stated) Net Sales Ordinary Income Net Income
Full Year
235,900
9,150
4,470
(Reference) Estimated net income per common share for the year (Consolidated): ¥10,752.40 Note: Forecast of results are rounded down to the nearest ten million yen.
Cautionary Statement The aforementioned forecasts are based on assumptions and beliefs in light of information available to management at the time of document preparation. Readers are advised that actual results may differ materially from forecasts due to a variety of factors. Please refer to page 14 for items relating to the aforementioned forecasts.

― 3 ―
INFORMATION ON GROUP COMPANIES
(1) New companies included in the scope of consolidation and application of the equity method
Name Location Capital (Millions of yen) Main business Voting rights
held (%) Relationship with
Pasona Inc.
(Consolidated Subsidiaries)
Pasona Human Resources (Shanghai) Co., Ltd. (Note 3)
Shanghai, China
125 thousandUnited States
Dollars
Temporary staffing / Contracting, Placement / Recruiting
70.00 (70.00) 1 concurrent director
Global Healthcare, Inc. (Note 4) Chuo-ku, Tokyo 72 Outsourcing 70.43
(38.88) ―
(Affiliated Companies accounted for by the Equity Method)
execube Inc. (Note 5) Chuo-ku, Osaka 118 Outsourcing 35.03
(19.33) ―
Notes: 1. The “Main business” column contains details for consolidated subsidiaries and affiliated companies accounted
for by the equity method in line with the Company’s business segment classification. 2. Figures in parentheses ( ) in the “Voting rights held” column represent the percentage of voting rights held
indirectly. 3. Pasona Human Resources (Shanghai) Co., Ltd. was newly included in the Company’s scope of consolidation as
a subsidiary company due to its growing importance. 4. Global Healthcare, Inc., previously an affiliated company accounted for by the equity method, was newly
included in the Company’s scope of consolidation as a subsidiary company through the acquisition of additional stock.
5. execube Inc. was newly included in the Company’s scope of consolidation as an affiliated company accounted for by the equity method due to the acquisition of stock.
(2) Companies removed from the scope of consolidation and application of the equity method Home Computing Network Inc. was removed from the Company’s scope of consolidation as a subsidiary company due to the sale of its shares and its reduced importance to the Group. In addition, Pasona ai Inc., previously a subsidiary company, was removed from the Company’s scope of consolidation following the transfer of its entire business to Pasona On Inc. (currently Pasona YOUTH Inc.), a subsidiary company included in Pasona’s scope of consolidation, and its subsequent liquidation. Furthermore, Global Healthcare, Inc., previously an affiliated company accounted for by the equity method, was included in the Company’s scope of consolidation as a subsidiary company.
― 4 ―
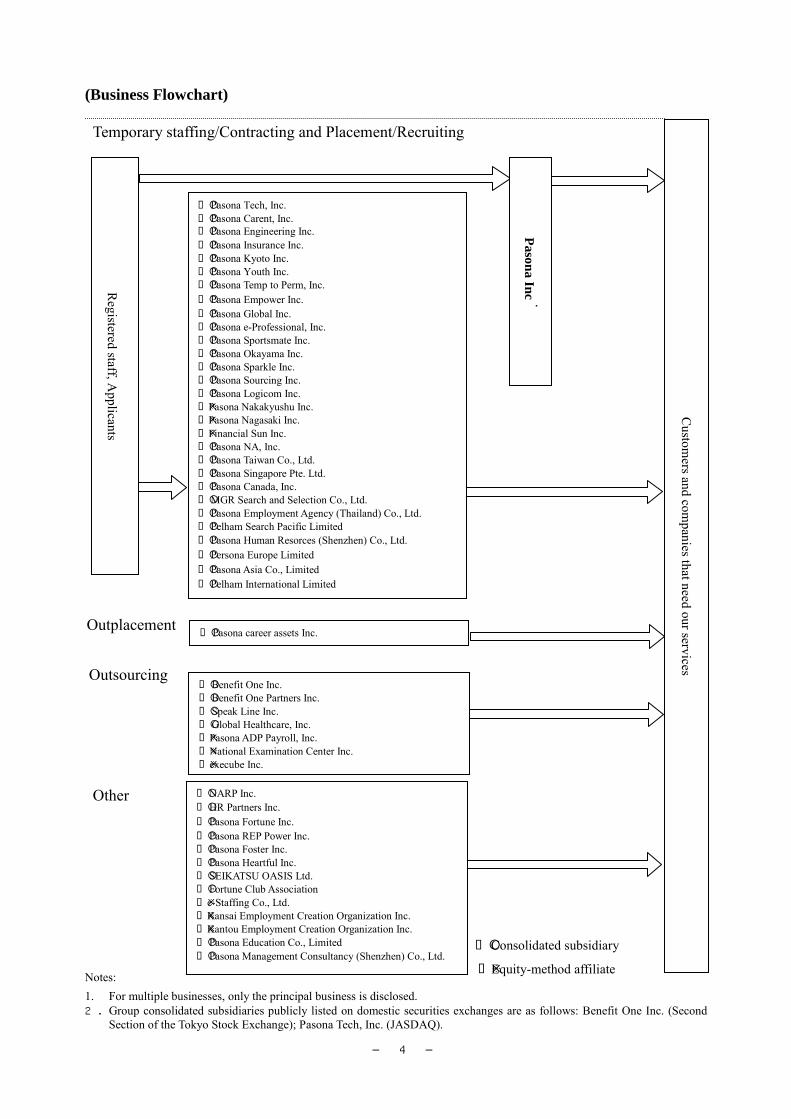
(Business Flowchart)
Notes: 1. For multiple businesses, only the principal business is disclosed. 2. Group consolidated subsidiaries publicly listed on domestic securities exchanges are as follows: Benefit One Inc. (Second
Section of the Tokyo Stock Exchange); Pasona Tech, Inc. (JASDAQ).
Custom
ers and companies that need our services
Temporary staffing/Contracting and Placement/Recruiting
Outplacement
Outsourcing
Other
Pasona career assets Inc.
Pasona Inc.
Registered staff, A
pplicants
Pasona Tech, Inc. Pasona Carent, Inc. Pasona Engineering Inc. Pasona Insurance Inc. Pasona Kyoto Inc. Pasona Youth Inc. Pasona Temp to Perm, Inc. Pasona Empower Inc. Pasona Global Inc. Pasona e-Professional, Inc. Pasona Sportsmate Inc. Pasona Okayama Inc. Pasona Sparkle Inc. Pasona Sourcing Inc. Pasona Logicom Inc. Pasona Nakakyushu Inc. Pasona Nagasaki Inc. Financial Sun Inc. Pasona NA, Inc. Pasona Taiwan Co., Ltd. Pasona Singapore Pte. Ltd. Pasona Canada, Inc. MGR Search and Selection Co., Ltd. Pasona Employment Agency (Thailand) Co., Ltd. Pelham Search Pacific Limited Pasona Human Resorces (Shenzhen) Co., Ltd. Persona Europe Limited Pasona Asia Co., Limited Pelham International Limited
Benefit One Inc. Benefit One Partners Inc. Speak Line Inc. Global Healthcare, Inc. Pasona ADP Payroll, Inc. National Examination Center Inc. execube Inc.
NARP Inc. HR Partners Inc. Pasona Fortune Inc. Pasona REP Power Inc. Pasona Foster Inc. Pasona Heartful Inc. SEIKATSU OASIS Ltd. Fortune Club Association e-Staffing Co., Ltd. Kansai Employment Creation Organization Inc. Kantou Employment Creation Organization Inc. Pasona Education Co., Limited Pasona Management Consultancy (Shenzhen) Co., Ltd.
Consolidated subsidiary
Equity-method affiliate

― 5 ―
Management Policies 1) Basic Management Policy of the Company Based on the corporate philosophy and social mission of providing “Solutions to Society's Problems,” the Pasona Group strives to realize the dreams of each and every individual in their efforts to reenter the workforce, seek new challenges, achieve new goals by solving the diverse employment issues that confront job seekers and to cultivate new employment opportunities where individuals can create their own comfortable lifestyles and freely choose the kind of work they wish to do. To realize this vision, the Company implements the following basic management measures. 1. Establishing and developing an employment infrastructure that caters to all job seekers
including temporary staff and also allows each individual to fulfill his or her potential. At the same time, improving the working environment and employment conditions. Through these means, the Company strives to increase brand power and credibility, and to build a structure that can sustain long-term growth by securing stable employment for all job seekers.
2. Recognizing the Group’s position as the industry leader, to leverage core competencies in the temporary staffing business and concentrate management resources into human resource-related fields with the aim of proactively cultivating new business. Based on these measures, the Company will enhance its ability to respond to job seeker and customer needs and to reinforce its business platform.
3. Positioning an acute awareness of society’s problems, a commitment to efforts that consistently benefit society, and the proactive resolve to uncover best-fit solutions, at the heart of management’s spirit and principles. Through these means, the Pasona Group will continue to expand employment opportunities and realize a better society that allows individuals to achieve their full potential.
2) Policy on Appropriation of Profits From the fiscal year ending May 31, 2007, Pasona has decided to distribute a cash dividend twice each fiscal year comprising an interim cash dividend and a fiscal year-end cash dividend. Accordingly, for the fiscal year under review, the Company plans to distribute an interim cash dividend of ¥1,000 per share and a fiscal year-end cash dividend of ¥1,000 per share for a full fiscal year cash dividend of ¥2,000 per share. This represents an increase of ¥200 per share compared the fiscal year ended May 31, 2006.
With regard to future dividends, management will base its decision on a variety of factors including new business and capital investment aimed at fulfilling Pasona’s responsibilities to continuously develop the human resource market, the Company’s operating performance and financial standing, and providing acceptable returns to its shareholders. Based on these considerations, Pasona has established a non-consolidated dividend payout target of 30%. In an effort to pursue a flexible capital policy, the Company acquired treasury stock on August 22, 2006. Going forward, Pasona will ensure optimal balance between the Company’s
― 6 ―
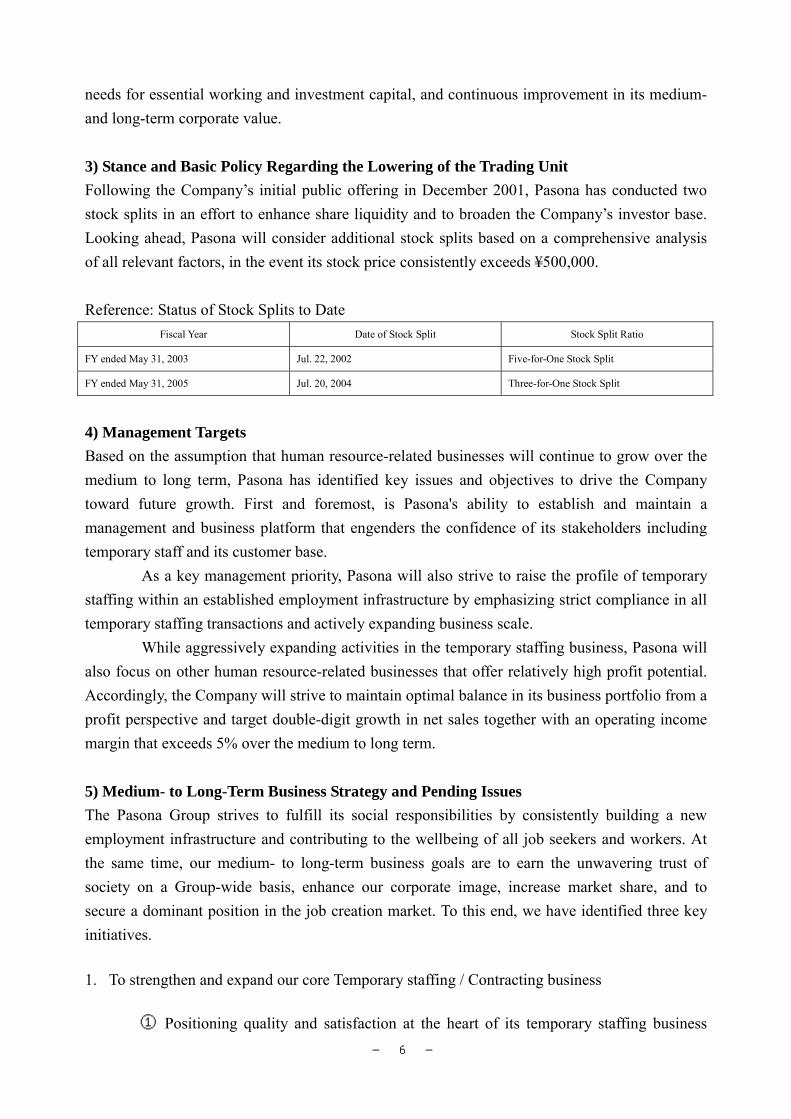
needs for essential working and investment capital, and continuous improvement in its medium- and long-term corporate value. 3) Stance and Basic Policy Regarding the Lowering of the Trading Unit Following the Company’s initial public offering in December 2001, Pasona has conducted two stock splits in an effort to enhance share liquidity and to broaden the Company’s investor base. Looking ahead, Pasona will consider additional stock splits based on a comprehensive analysis of all relevant factors, in the event its stock price consistently exceeds ¥500,000. Reference: Status of Stock Splits to Date
Fiscal Year Date of Stock Split Stock Split Ratio
FY ended May 31, 2003 Jul. 22, 2002 Five-for-One Stock Split
FY ended May 31, 2005 Jul. 20, 2004 Three-for-One Stock Split
4) Management Targets Based on the assumption that human resource-related businesses will continue to grow over the medium to long term, Pasona has identified key issues and objectives to drive the Company toward future growth. First and foremost, is Pasona's ability to establish and maintain a management and business platform that engenders the confidence of its stakeholders including temporary staff and its customer base. As a key management priority, Pasona will also strive to raise the profile of temporary staffing within an established employment infrastructure by emphasizing strict compliance in all temporary staffing transactions and actively expanding business scale. While aggressively expanding activities in the temporary staffing business, Pasona will also focus on other human resource-related businesses that offer relatively high profit potential. Accordingly, the Company will strive to maintain optimal balance in its business portfolio from a profit perspective and target double-digit growth in net sales together with an operating income margin that exceeds 5% over the medium to long term. 5) Medium- to Long-Term Business Strategy and Pending Issues The Pasona Group strives to fulfill its social responsibilities by consistently building a new employment infrastructure and contributing to the wellbeing of all job seekers and workers. At the same time, our medium- to long-term business goals are to earn the unwavering trust of society on a Group-wide basis, enhance our corporate image, increase market share, and to secure a dominant position in the job creation market. To this end, we have identified three key initiatives. 1. To strengthen and expand our core Temporary staffing / Contracting business
① Positioning quality and satisfaction at the heart of its temporary staffing business

― 7 ―
activities, Pasona endeavors to establish and develop a comprehensive after-care, education and training and welfare benefits structure and system in an effort to secure a strong bond of trust with its temporary staff.
② The Company places significant emphasis on education and training with the aim of addressing strong demand for specialist temporary staffing services.
③ Pasona thoroughly implements measures to promote compliance. ④ The Company is active in business infrastructure investment including IT systems
and branch network expenditure. 2. To build a high growth-oriented business portfolio
① Optimizing Group synergies, Pasona works tirelessly to cultivate businesses in each operating domain.
② Pasona is focusing on expanding its service lineup in new human resource-related fields.
③ The Company strives to consistently expand its business scope and to promote high value added through prudent M&A and business collaboration.
3. To further maximize corporate value.
① Conditions in Japan’s labor market continue to confront a harsh environment. These problems are exacerbated by the pending retirement of the baby-boomer generation and the declining birthrate. Faced with a declining working population, Pasona is creating new employment opportunities for the elderly and supporting the young with training and practical experience opportunities to find work in the agricultural field. The Company is also active in supporting women in the workforce such as creating opportunities for housewives. Leveraging the Group’s employment creation capabilities and know-how accumulated over a number of years, the Company is taking bold strides to develop a new employment infrastructure.
② Through every facet of its business activities, Pasona is also endeavoring to contribute to society and promote environmental protection and conservation. In an effort to remain an integral member of society and to secure sustainable growth over the long term, the Company is strengthening its corporate governance structure and implementing comprehensive corporate social responsibility activities.
③ Pasona remains committed to ensuring adequate balance between growth-oriented retained earnings, an appropriate level of returns to shareholders and maintaining a stable and robust financial position.
6) Pending Issues As the leading company in the industry, Pasona continues to implement measures that contribute to improving temporary staff satisfaction. These measures include efforts to enhance temporary staff welfare benefit systems and initiatives to raise unit prices at the payment level. Through these means, the Pasona Group is making significant strides in securing a stable and extensive pool of highly qualified and capable temporary staff, while raising the profile of temporary staff within the overall employment market. Pasona is also focusing on expanding the human resources-related domain and proactively pursuing business in placement and recruiting, outplacement and outsourcing, areas

― 8 ―
that exhibit substantial profit growth potential. In addition to M&A, the Company is undertaking business reorganization within the Group in an effort to enhance competitiveness. Pasona is also working to raise the status of each of its businesses within the market while building a balanced Group business portfolio. 7) Matters Relating to the Parent Company There were no significant matters relating to the parent company. 8) Other Important Issues Relating to the Company’s Management There were no significant other important matters relating to the Company’s management. Note: Identified under the Worker Dispatch Law as “dispatch worker.” Pasona on the other hand uses “temporary staff.”

― 9 ―
Business Performance 1) Results In the first half of the fiscal year ending May 31, 2007 (June 1, 2006 to November 30, 2006), the Japanese economy continued its growth trajectory led by the corporate sector and particularly the strong performance by large companies. In addition to an increase in export activity and capital investment, overall employment conditions remained robust. While there were no signs of a significant upswing in employment compensation a modest decline in the unemployment rate did emerge. Against this backdrop, the corporate sector experienced a persistent sense of insufficient labor supply.
Under these circumstances, demand for both full-time and temporary staff remained strong. Buoyed by an increase in temporary staff employment, the Pasona Group enjoyed robust conditions in its mainstay business. At the same time, results in the placement and recruiting as well as the outplacements businesses exceeded initial forecasts. Accounting for these factors, net sales for the period totaled ¥113,202 million, a double-digit percentage increase of 15.2% compared with the corresponding period of the previous fiscal year.
On the earnings front, the Group’s performance was boosted by growth in the relatively high-profit placement and recruiting and outplacement businesses. At the same time, results benefited from the unexpected deferral of certain selling, general and administrative (SG&A) expenses payment to the second half of the fiscal year ending May 31, 2007. As a result, consolidated operating income amounted to ¥4,314 million, a significant improvement of 38.1% compared with the corresponding period of the previous fiscal year. Consolidated ordinary income surged 41.5% year on year to ¥4,392 million and net income climbed 39.8% to ¥2,073 million. These figures represented a substantial increase over forecasts at the beginning of the period. On a non-consolidated basis, Pasona incurred an extraordinary loss of ¥2,436 million for
the first half of the fiscal year ending May 31, 2007. This was mainly attributed to a remarkable drop in the closing price of shares of Pasona Tech, Inc. as of November 30, 2006 compared with their acquisition costs. As a result, the parent company reported a net loss of ¥730 million for the period under review. There was, however, no effect on consolidated interim results.
(Millions of yen unless otherwise stated) 1st Half, FY ended 2006
(June 1, 2005 to November 30, 2005)
1st Half, FY ending 2007
(June 1, 2006 to November 30, 2006) YoY
Net sales 98,247 113,202 15.2%
Operating income 3,123 4,314 38.1%
Ordinary income 3,103 4,392 41.5%
Net income 1,482 2,073 39.8%
Performance by business segment including intersegment sales and transfers for the first half of the fiscal year ending May 31, 2007 was as follows: 1. Temporary staffing / Contracting and Placement / Recruiting
Net sales: ¥105,158 million Operating income: ¥3,487 million
Temporary staffing / Contracting

― 10 ―
Net sales: ¥101,937 million Demand remained strong in the manufacturing industry including the electric appliance, automobile and other sectors, and the finance industry. In addition, demand for personnel was high from the telecommunications industry following the introduction of the number portability system for mobile phones in the second quarter. By job type, both clerical staff (general office work) and technical staff including specialists in financial administration and telemarketing experienced double-digit percentage growth. From a geographical perspective, results were steady in the Tokyo Metropolitan area and the Tokai region. The Pasona Group worked tirelessly to expand the scope of employee welfare benefits and further enhance treatment. Accordingly, the Group was successful in containing the number of temporary staff contract completions. As a result of these efforts, the Company experienced growth in the number of temporary staff contract starts as well as long-term temporary staff. In addition to the procurement of new registrants, Pasona also increased the number of long-term temporary staff through the detailed implementation of job opportunities to existing registrants. In specific terms, net sales in the Temporary staffing / Contracting segment rose 13.8% compared with the corresponding period of the previous fiscal year to ¥101,937 million. This was attributed to the aforementioned factors, the strong performance by temporary staffing business subsidiaries and the contribution from Socio Inc., following the merger with the Company at the end of the previous fiscal year. Placement / Recruiting Net sales: ¥3,220 million In the Placement and Recruiting segment there was strong demand for mid-career hiring with persistent interest particularly from the finance, IT-related and other sectors. Fueled by the sharp increase in new graduate employment as well as graduate employees with limited work experience, the market experienced a further pickup in inexperienced employees based on potential. The Pasona Group engages in placement and recruiting activities mainly through its specialist subsidiary Pasona Carent, Inc. (currently Pasona Career, Inc.). This company strives to expand its business in support of highly experienced persons seeking a career change while at the same time providing valuable support to women and the young age group. As a result of these efforts, net sales in the Placement and Recruiting segment were ¥1,876 million, up 41.0% compared with the corresponding period of the previous fiscal year. Turning to the Group’s overseas operations in Placement and Recruiting, Pasona enjoyed steady growth in Europe and the United States. Results were also supported by subsidiary companies throughout Asia newly included in Pasona’s scope of consolidation. Accounting for these factors, net overseas sales in the Placement and Recruiting segment totaled ¥1,344 million, a substantial jump of 83.7% year on year. Combining domestic and overseas results, total net sales in this segment climbed 56.1% compared with the corresponding period of the previous fiscal year to ¥3,220 million. From a profit perspective, the margin between unit prices at the invoice level and unit prices at the payment level in the temporary staffing business saw a modest improvement. Despite this positive trend, however, the gross profit margin on temporary staffing activities declined year on year. This was attributed to a review of the rate applicable to employee pensions and the rise in statutory welfare expenses, which reflected the increase in social insurance subscribers and the trend toward long-term temporary staffing contracts. Lower gross profit margins in the temporary staffing business were absorbed by

― 11 ―
significant improvements in the relatively high-profit placement and recruiting business. On a combined basis, net sales in temporary staffing / contracting and placement / recruiting amounted to ¥105,158 million, an increase of 14.7% compared with the corresponding period of the previous fiscal year. Operating income for the period under review climbed 23.2% year on year to ¥3,487 million. 2. Outplacement
Net sales: ¥2,589 million Operating income: ¥802 million
The Pasona Group recognizes a shift in its outplacement business from conventional outplacement services to welfare benefit type outplacement services. In addition to the broadening scope of activities, the Company is pursuing measures in response to optional retirement systems and voluntary early retirement programs, supporting those seeking a second life in rural areas, and providing human resource services to the middle aged and elderly including the baby boomer generation. Pasona benefited from large-scale orders in the second half of the previous fiscal year. The broadening of human resource services and outplacement orders from local public authorities also boosted results. Accordingly, net sales in the Outplacement segment rose 36.4% compared with the corresponding period of the previous fiscal year to ¥2,589 million in the first half of the fiscal year ending May 31, 2007. In addition to this substantial improvement in revenues, the Company experienced an increase in office and consulting operating rate. Accounting for these factors, operating income for the period under review surged 64.7% year on year to ¥802 million. 3. Outsourcing
Net sales: ¥4,918 million Operating income: ¥221 million
The Pasona Group enjoyed continued demand for employee benefit outsourcing services not only from its mainstay large corporate customers, public authorities, but also small and medium-sized venture companies. This was attributed to the growing recognition by employers for the need to enhance employee benefit systems and programs and to raise the level of employee satisfaction. Under these circumstances, the Pasona Group, as the leading provider of employee benefit outsourcing services in its industry, worked diligently to provide an employee benefit menu that accurately matched employee needs with value. At the same time, Pasona strengthened its cafeteria plan (selection-type employee benefit programs and actively promoted sales activities). As a result of these efforts, the Company secured large-scale customers in both the private and public sectors and successfully increased the number of members. In the area of small and medium-sized companies, Pasona utilized proprietary customer development measures as well as the agency services of financial and other institutions. In the Outsourcing business, Pasona developed the “Customer Loyalty Program,” a members-only shopping business, in an effort to restructure the service contents of benefit programs, raise corporate customer satisfaction and cultivate new businesses. Results in this business have progressed at a slower than expected pace with the timing of service commencement for certain client firms delayed to the second half of the fiscal year under review. As a result, net sales in the Outsourcing segment increased 21.0% compared with the

― 12 ―
corresponding period of the previous fiscal year to ¥4,918 million. Buoyed by improvements in the operating income margin reflecting the upswing in revenues from the highly profitable employee benefit services business and cost control initiatives favorably impacting SG&A expenses, operating income nearly doubled to ¥221 million, a 99.6% year-on-year increase. 4. Other
Net sales: ¥992 million Operating loss: ¥196 million
Conditions remained steady in the child-care and nursing care businesses. In its Internet-based recruitment advertising business, Pasona successfully narrowed its operating loss through the effective use of established know-how, and efforts to curtail investment in promotion costs reflecting the change of business to complement existing human resource-related businesses. In contrast to these positive circumstances, the Company was impacted by delays associated with the full-fledged start of certain new businesses and the sale of a subsidiary engaged in the management and operation of personal computer (PC) training classes at the beginning of the fiscal year under review. Accounting for these factors, net sales in the other segment in the first half of the fiscal year ending May 31, 2007 declined 3.1% compared with the corresponding period of the previous fiscal year to ¥992 million. As mentioned, the operating loss was ¥196 million, down from ¥302 million in the first half of the fiscal year ended May 31, 2006. 2) Analysis of Results Net Sales For the first half of the fiscal year ending May 31, 2007, net sales climbed ¥14,955 million compared with the corresponding period of the previous fiscal year to ¥113,202 million. In the mainstay temporary staffing / contracting business, Pasona enjoyed a ¥12,326 million year-on-year increase due to growth in non-consolidated operations, improvements in temporary staffing subsidiary companies and contributions following the merger with Socio Inc. at the end of the previous fiscal year. Pasona also experienced double-digit percentage year-on-year revenue growth from its placement and recruiting, outplacement and outsourcing businesses. This reflects the steady performance in non-temporary staffing human resource-related fields. Operating Income Operating income in the period under review rose ¥1,191 million year on year to ¥4,314 million. The gross profit margin for the period climbed 0.5 of a percentage point compared with the corresponding period of the previous fiscal year to 20.3% reflecting significant improvement in the highly profitable placement and recruiting and outplacement businesses. Turning to SG&A expenses, on the one hand, Pasona undertook aggressive investments in nationwide events and incurred personnel expenses in line with business expansion as well as promotional expenses relating to temporary staff recruitment. In IT-related expenses, the Company decided to defer SG&A expenses budgeted for the first half to the second half of the fiscal year under review. As a result, the ratio of SG&A expenses to net sales contracted 0.1 of a percentage point year on year to 16.5%. Net Income In the first half of the fiscal year ending May 31, 2007, net income increased ¥590 million

― 13 ―
compared with the corresponding period of the previous fiscal year to ¥2,073 million. As a result, earnings per share climbed ¥1,468.35 year on year to ¥4,896.12. 3) Financial Condition and Cash Flows (1) Financial Condition Total assets as of November 30, 2006 stood at ¥49,918 million, a drop of ¥2,012 million, or 3.9%, compared with the end of the previous fiscal year. Net assets also contracted ¥3,060 million, or 11.1%, compared with May 31, 2006 to ¥24,573 million reflecting the acquisition of 17,500 share of treasury stock at an acquisition cost of ¥4,287 million as a part of the Company’s capital policy. Accounting for these factors, the shareholders’ equity ratio declined 4.2 percentage points compared with the previous fiscal year-end to 41.3%. Turning to principal increases and decreases within total assets, current assets fell ¥2,907 million, or 7.5%, compared with May 31, 2006 to ¥36,020 million. This was primarily attributed to the decline in cash and deposits to ¥10,349 million, a drop of ¥3,934 million, or 27.5%, reflecting the payment of mainly income taxes and dividends, which was partly offset by the increase in notes and accounts receivable — trade of ¥1,101 million, or 5.2%, to ¥22,123 million. Compared with the previous fiscal year-end, fixed assets rose ¥894 million, or 6.9%, to ¥13,897 million as of November 30, 2006. Major components were property and equipment, which increased ¥262 million, or 7.4%, to ¥3,826 million, and investments and other assets, which climbed ¥502 million, or 7.1%, to ¥7,550 million. Within total liabilities, current liabilities increased ¥855 million, or 3.8%, compared with the end of the previous fiscal year to ¥23,644 million. During the first half of the fiscal year ending May 31, 2007, Pasona undertook short-term loans payable totaling ¥3,275 million, a significant increase of ¥3,084 million, or 1,614.0% to fund the acquisition of treasury stock. Other components of current liabilities included consumption taxes payable, which declined ¥487 million, or 19.7%, to ¥1,993 million, and income taxes payable, which rose ¥465 million, or 17.7%, to ¥2,161 million. Total long-term liabilities stood at ¥1,700 million, an increase of ¥192 million, or 12.7%, compared with May 31, 2006. (2) Cash Flows On a consolidated basis, cash and cash equivalents totaled ¥10,629 million as of November 30, 2006, a decrease of ¥4,027 million (¥2,347 million decrease in the previous interim period). The principal components of cash flows were as follows. Cash Flows from Operating Activities Income before income taxes increased ¥1,235 million year on year to ¥4,274 million. On the other hand, accounts receivable — trade increased ¥1,158 million, accounts payable — trade decreased ¥874 million and income taxes paid totaled ¥2,523 million. As a result, net cash used in operating activities was ¥91 million, a turnaround from net cash provided by operating activities of ¥406 million in the corresponding period of the previous fiscal year. Cash Flows from Investing Activities Net cash used in investing activities was ¥1,778 million, down from ¥2,076 million year on year. Major cash outflows were payments for purchases of fixed assets of ¥560 million, payments for purchases of intangible assets totaling ¥476 million and payments for purchases of investment securities of ¥479 million.
― 14 ―
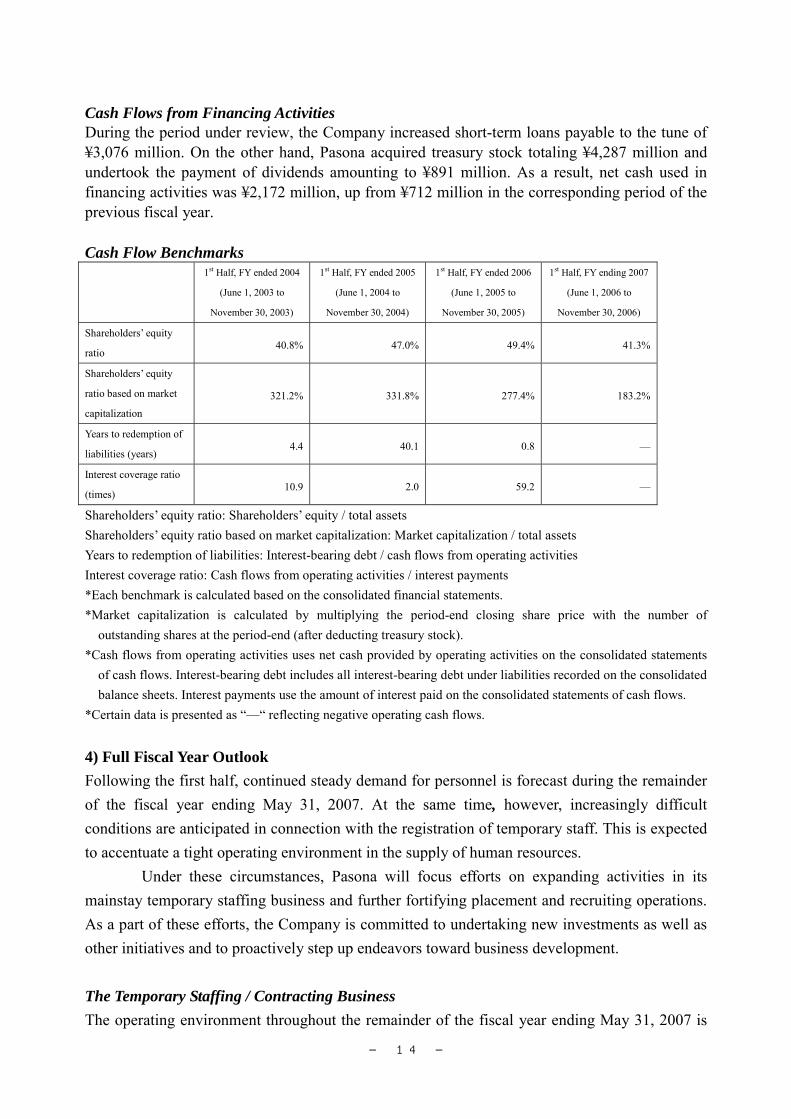
Cash Flows from Financing Activities During the period under review, the Company increased short-term loans payable to the tune of ¥3,076 million. On the other hand, Pasona acquired treasury stock totaling ¥4,287 million and undertook the payment of dividends amounting to ¥891 million. As a result, net cash used in financing activities was ¥2,172 million, up from ¥712 million in the corresponding period of the previous fiscal year. Cash Flow Benchmarks 1st Half, FY ended 2004
(June 1, 2003 to
November 30, 2003)
1st Half, FY ended 2005
(June 1, 2004 to
November 30, 2004)
1st Half, FY ended 2006
(June 1, 2005 to
November 30, 2005)
1st Half, FY ending 2007
(June 1, 2006 to
November 30, 2006)
Shareholders’ equity
ratio 40.8% 47.0% 49.4% 41.3%
Shareholders’ equity
ratio based on market
capitalization
321.2% 331.8% 277.4% 183.2%
Years to redemption of
liabilities (years) 4.4 40.1 0.8 —
Interest coverage ratio
(times) 10.9 2.0 59.2 —
Shareholders’ equity ratio: Shareholders’ equity / total assets Shareholders’ equity ratio based on market capitalization: Market capitalization / total assets Years to redemption of liabilities: Interest-bearing debt / cash flows from operating activities Interest coverage ratio: Cash flows from operating activities / interest payments *Each benchmark is calculated based on the consolidated financial statements. *Market capitalization is calculated by multiplying the period-end closing share price with the number of
outstanding shares at the period-end (after deducting treasury stock). *Cash flows from operating activities uses net cash provided by operating activities on the consolidated statements
of cash flows. Interest-bearing debt includes all interest-bearing debt under liabilities recorded on the consolidated balance sheets. Interest payments use the amount of interest paid on the consolidated statements of cash flows.
*Certain data is presented as “—“ reflecting negative operating cash flows. 4) Full Fiscal Year Outlook Following the first half, continued steady demand for personnel is forecast during the remainder of the fiscal year ending May 31, 2007. At the same time, however, increasingly difficult conditions are anticipated in connection with the registration of temporary staff. This is expected to accentuate a tight operating environment in the supply of human resources. Under these circumstances, Pasona will focus efforts on expanding activities in its mainstay temporary staffing business and further fortifying placement and recruiting operations. As a part of these efforts, the Company is committed to undertaking new investments as well as other initiatives and to proactively step up endeavors toward business development. The Temporary Staffing / Contracting Business The operating environment throughout the remainder of the fiscal year ending May 31, 2007 is
― 15 ―
therefore expected to experience continued growth in the demand for personnel from the corporate sector. As a result, the number of long-term staff is expected to increase steadily on the back of large-scale orders and a recovery in regional bases. At the unit price level, while the payment spread saw a moderate increase during the first half of the fiscal year under review, the overall spread during the second half is expected to shrink slightly compared with estimates at the beginning of the period impacted by certain large-scale orders. In its efforts to secure human resources, Pasona will continue to pursue existing measures, which include efforts to attract high-quality staff and to bolster employment introduction of existing registrants. In addition, the Company will work toward securing new registrants by opening new registration offices. As a part of these initiatives, Pasona will open a new registration office in Omotesando, Tokyo, an area which attracts a significant traffic flow, in spring 2007. Open 365 days a year, this office will accommodate the registration of job seekers on weekends, public holidays and late evenings. In this manner, the Company is working to increase the number of new registrants. Given the nature of the locality, this initiative is also expected to secure new registrants in the young age group and to bolster sales position temporary staffing. Furthermore, Pasona plans to open a registration office in Fuchu City, Tokyo in February 2007. Driven by the aforementioned proactive measures, Pasona is anticipating double-digit percentage revenue growth on a year-on-year basis in the temporary staffing business, in line with estimates at the beginning of the period. The Placement and Recruiting Business The drive to employ full-time staff is expected to increase during the second half of the fiscal year ending May 31, 2007. Against this backdrop, the Pasona Group established Pasona Youth Inc. through the integration of a subsidiary company in July 2006. As a result, the Group is developing human resource services targeting new graduates and workers with limited experience in an effort to reinforce its placement and recruiting activities among the young age group. In addition, Pasona merged Pasona Carent, Inc., a company that specializes in placement and recruiting with Pasona career assets Inc., a company engaged in outplacement activities in January 2007. Launched under a new name, Pasona Career, Inc. provides outplacement support to those seeking a career change and services the length and breadth of Japan. Committed to becoming the industry leader in the placement and recruiting field, Pasona will continue to aggressively expand its activities in this area. Impacted, however, by the slight delay in the employment of consultants during the second half compared with initial plans, the Company anticipates a modest decline in the pace of growth on an interim period basis. Accordingly, Pasona forecast results for the full fiscal year to essentially match estimates set at the beginning of the period. In the outplacement business, the Company experienced growth rates during the first half of the

― 16 ―
fiscal year ending May 31, 2007 that outstripped estimates at the beginning of the period. This is expected to fall back to a more moderate pace during the second half and essentially match initial plans on a full fiscal year basis. Pasona also forecasts similar conditions and results for the outsourcing business. As a part of the Company’s efforts to strengthen relations with its customers, Pasona plans to complete construction this spring of a presentation booth within the Shin Marunouchi Building in Tokyo. This booth will enable visitors to experience the full range of the Pasona Group’s services. In addition to building a structure and system that will showcase the Group’s comprehensive services from temporary staffing through personnel consulting and outsourcing, Pasona will also cement its position as a human resource partner to the corporate sector. At the same time, the Company is confident of expanding the number of registrants in specialist and executive level human resource fields due to the extremely attractive and prestigious location of the booth. From an earnings perspective, gross profit margins in the temporary staffing business are expected to decline slightly reflecting the increased burden of social insurance payments and the impact of certain large-scale orders. Furthermore, while profits in the first half of the fiscal year ending May 31, 2007 exceeded initial estimates, full fiscal year forecasts for revenues and earnings are not expected to change from initial estimates. This is attributed to the impact of new investment initiatives geared toward future growth and selling, general and administrative expenses deferred from the first half to the second half. On a non-consolidated basis for the full fiscal year ending May 31, 2007, the Company’s net income is expected to total ¥850 million, revised down from ¥3,140 million forecast at the beginning of the period. This reflects an extraordinary devaluation loss on shares of subsidiary companies including Pasona Tech, Inc. of ¥2,436 million. Pasona has not revised its initial estimates for net sales and ordinary income. On a consolidated basis, the aforementioned devaluation of subsidiary company shares is not expected to impact results. Forecasts of consolidated results for the fiscal year ending May 31, 2007 (June 1, 2006 to May 31, 2007)
(Millions of yen unless otherwise stated) Fiscal Year Ended
May 31, 2006
Fiscal Year Ending
May 31, 2007 YoY
Net sales 203,815 235,900 15.7%
Operating income 7,745 9,080 17.3%
Ordinary income 7,844 9,150 16.8%
Net income 3,588 4,470 24.8%
― 17 ―
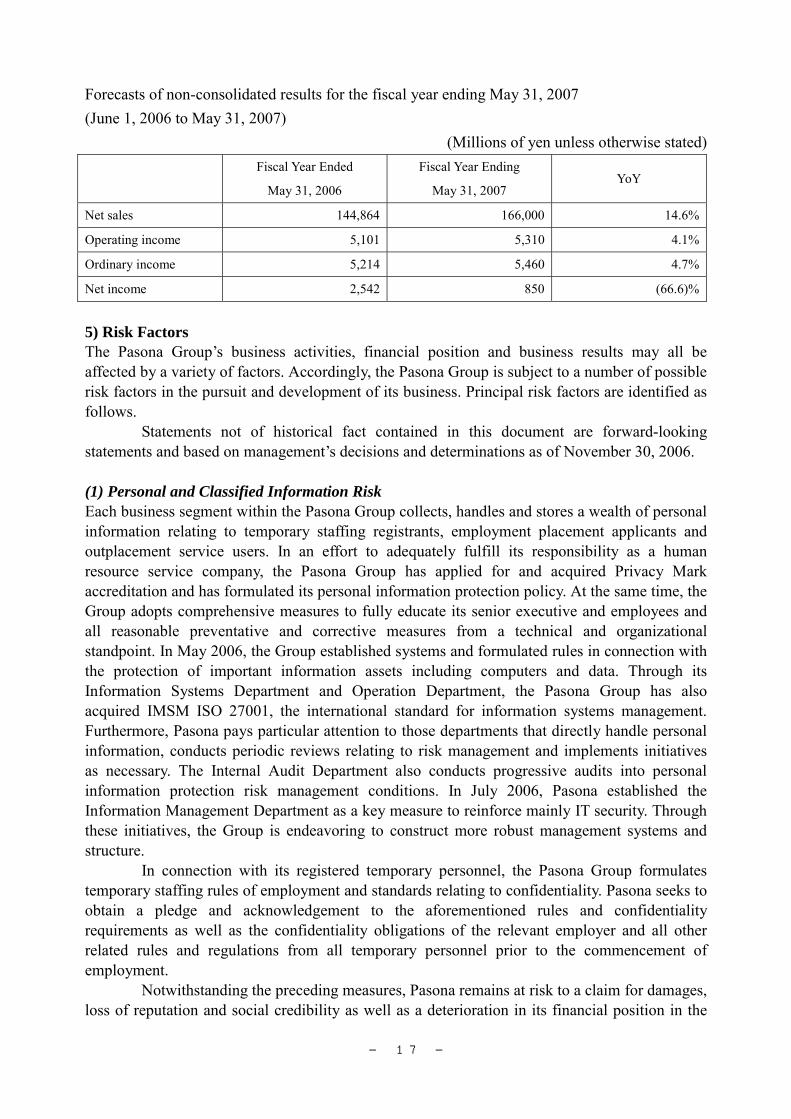
Forecasts of non-consolidated results for the fiscal year ending May 31, 2007 (June 1, 2006 to May 31, 2007)
(Millions of yen unless otherwise stated) Fiscal Year Ended
May 31, 2006
Fiscal Year Ending
May 31, 2007 YoY
Net sales 144,864 166,000 14.6%
Operating income 5,101 5,310 4.1%
Ordinary income 5,214 5,460 4.7%
Net income 2,542 850 (66.6)%
5) Risk Factors The Pasona Group’s business activities, financial position and business results may all be affected by a variety of factors. Accordingly, the Pasona Group is subject to a number of possible risk factors in the pursuit and development of its business. Principal risk factors are identified as follows. Statements not of historical fact contained in this document are forward-looking statements and based on management’s decisions and determinations as of November 30, 2006. (1) Personal and Classified Information Risk Each business segment within the Pasona Group collects, handles and stores a wealth of personal information relating to temporary staffing registrants, employment placement applicants and outplacement service users. In an effort to adequately fulfill its responsibility as a human resource service company, the Pasona Group has applied for and acquired Privacy Mark accreditation and has formulated its personal information protection policy. At the same time, the Group adopts comprehensive measures to fully educate its senior executive and employees and all reasonable preventative and corrective measures from a technical and organizational standpoint. In May 2006, the Group established systems and formulated rules in connection with the protection of important information assets including computers and data. Through its Information Systems Department and Operation Department, the Pasona Group has also acquired IMSM ISO 27001, the international standard for information systems management. Furthermore, Pasona pays particular attention to those departments that directly handle personal information, conducts periodic reviews relating to risk management and implements initiatives as necessary. The Internal Audit Department also conducts progressive audits into personal information protection risk management conditions. In July 2006, Pasona established the Information Management Department as a key measure to reinforce mainly IT security. Through these initiatives, the Group is endeavoring to construct more robust management systems and structure. In connection with its registered temporary personnel, the Pasona Group formulates temporary staffing rules of employment and standards relating to confidentiality. Pasona seeks to obtain a pledge and acknowledgement to the aforementioned rules and confidentiality requirements as well as the confidentiality obligations of the relevant employer and all other related rules and regulations from all temporary personnel prior to the commencement of employment. Notwithstanding the preceding measures, Pasona remains at risk to a claim for damages, loss of reputation and social credibility as well as a deterioration in its financial position in the

― 18 ―
event of a breach in the variety of rules and regulations outlined above or a leak in personal information due to unforeseen and other circumstances. (2) Temporary Staff Procurement Risk By its very nature, securing an ample pool of temporary staff is integral to the temporary staffing business. The Pasona Group strives to recruit temporary staff through the Internet, newspaper and magazine advertising as well as introductions from existing registrants. In addition to efforts to secure a stable supply of temporary staff, the Group is also actively engaged in endeavors to improve the location of registration offices and facilities, temporary staff remuneration, fringe benefits and to provide employment opportunities that accurately address the needs of each and every registrant. Pasona has also introduced the “My Coach” system and is expanding training and education. Collectively through these initiatives and measures, Pasona continues efforts to enhance the satisfaction of temporary staff. In addition, for those existing registrants not currently in employ, Pasona is making every effort to ensure their retention. Notwithstanding these efforts, however, in the event the demand for temporary staff exceeds the ability to secure temporary staff, the Group’s performance may be affected. (3) Temporary Staffing Payment Risk In the temporary staffing business, sales are recorded on a temporary staffing payment invoice basis to those companies to which temporary staff are dispatched. In this context, companies supplied with temporary staff are invoiced on either an hourly or monthly rate. In principle, cost of sales comprises payments to temporary staff on an hourly basis, which in turn reflects the relevant job description and skills as well as legal welfare, paid leave and other expenses. The Pasona Group is committed to securing reasonable and appropriate remuneration both at the invoice and payment levels and pursues negotiations with companies to which temporary staff are dispatched accordingly. The level of success in connection with negotiations relating to an increase in temporary staff remuneration may affect the Company’s performance. (4) Outplacement Risk In the outplacement business, Pasona provides a variety of services in an effort to help early retirees and those planning for retirement find reemployment. These services include support in the preparation of resumes and interviews, the provision of information on job openings and mental health care. In addition to providing a wealth of job information, Pasona also maintains a nationwide network of facilities and consultants to better address the needs of those seeking reemployment. The outplacement business is itself highly susceptible to changes in the economic environment with profitability impacted by order trends, changes in order rates and conditions that affect a quick and definitive turnaround in the placement of employees. In this context, the Pasona Group endeavors to actively pursue orders. In an effort to realize a quick and definitive turnaround in the placement of employees, Pasona allocates a consultant in charge to each client to accurately ascertain outplacement activity conditions and at the same time accumulate employment information. In the event, however, that Pasona is unable to maintain an effective network, flexibly adapt to changes in conditions, adequately allocate consultants and incurs a rise in operating expenses, the Company’s performance may be affected. (5) Outsourcing Risk Through its subsidiary Benefit One Inc., Pasona provides benefit-outsourcing services. Companies that contract with Benefit One become corporate members. Employees of corporate

― 19 ―
members receive access, at membership rates, to a variety of accommodation, sports club, school and other facility benefits. Benefit One receives a joining fee and a monthly membership fee depending on the number of individual members from corporate members. Benefit One also undertakes a subsidy payment to cover the use of facilities by employees based on the type of membership and course for each corporate member. While revenues increase relative to the increase in individual members, if subsidy payments rise higher than revenues the Group’s performance may be impacted. (6) Statutory and Regulatory Risk 1. Temporary staffing / Contracting, Placement / Recruiting a. Temporary staffing / Contracting i) Business Approvals and Licenses A mainstay activity of the Group, Pasona has been granted a temporary staffing business license by the Ministry of Health, Labour and Welfare. As a rule, temporary staffing activities in Japan are regulated by the Worker Dispatch Law, which serves to establish guidelines for the temporary staffing industry and parameters for disqualification, illegal activity, license cancellation and orders to terminate activities. Led by its CS Promotion Division, the Pasona Group has formulated guidelines for appropriate conduct and behavior in temporary staffing transactions. Underpinned by these guidelines, Pasona conducts comprehensive employee training, monitors the level of statutory compliance through internal auditing and other systems and implements preventive measures. Despite these endeavors, however, the Pasona Group remains at risk that the Company or a Group employee or director will materially contravene the Worker Dispatch Law or related laws and regulations leading to the cancellation of its license or an order for the termination of business. In addition, the Group’s performance may also be affected by amendments to the Worker Dispatch Law and related laws and regulations in line with changes in the labor market. ii) Types of Temporary Staffing Work Prior to an amendment to the Worker Dispatch Law in December 1999, temporary staffing activities were restricted to 26 specialist fields. Following further amendments, however, the temporary staffing industry was effectively deregulated with the exception of certain restricted activities including harbor transport, construction, security, medicine and related fields and manufacturing. Furthermore, in March 2004, restrictions were lifted on temporary staffing to the manufacturing industry as well as Temp to Perm, the placement of employees on a full-time basis following completion of a temporary staffing assignment, to the medical field. In April 2006, restrictions on the temporary staffing of medical practitioners to remote areas and replacement personnel for doctors, nurses and health workers taking either maternity or education leave were lifted. Currently, the key sectors in which the temporary staffing industry operates are deregulated. There are, however, sectors for which the industry is yet to receive approval and is restricted in its ability to operate. Future growth in the temporary staffing industry is in part subject to the level and type of regulatory restrictions. In this context, the Pasona Group’s performance may be affected. iii) Restrictions on Temporary Staffing Term In accordance with amendments to the Worker Dispatch Law in December 1999, and excluding specifically identified fields, the dispatch of temporary staff is in principle restricted to one year

― 20 ―
(this may be extended to a maximum of three years subject to an acknowledgement by a representative of a majority of the employees of the company to which temporary staff has been dispatched). For the manufacturing industry, temporary staff may not be dispatched for a period that exceeds one year. Furthermore, companies are restricted from accepting temporary staff on a continuous basis for the same position and duties on completion of an existing temporary staffing contract. The temporary staffing company shall inform the company accepting temporary staff and the temporary staff in question on the day prior to the conclusion of the restricted term. In the event the company continues to employ temporary staff beyond this term, the company shall be obligated to employ temporary staff on a permanent and full-time basis. In principle, there is no restriction on the temporary staffing term for the 26 fields identified prior to amendments to the Worker Dispatch Law in December 1999. In the event, however, that an employer after employing temporary staff for a continuous period exceeding three years seeks to employ full-time permanent staff for the subject position and duties, the temporary staff having been employed for a period of three years shall receive a first right of refusal. Impacted by restrictions on the term of temporary staffing and an increase in the number of companies shifting from temporary to permanent employment, the incidence of companies dealing directly with temporary staff is expected to grow. In the event the number of those seeking temporary employment declines, the Company’s performance may be affected. b. Placement / Recruiting As a fee-charging employment agency, the Pasona Group has received the approval of the Ministry of Health, Labour and Welfare to engage in placement and recruiting activities and is regulated by the Job Stabilization Law. In December 1999 following amendments to the Job Stabilization Law, the scope of placement and recruiting activities was expanded both in the number of industries covered and to include new graduates. At the same time, restrictions relating to placement fees were relaxed. In December 2000, further restrictions were lifted for both temporary placement and placement/recruiting activities heralding the birth of Temp to Perm. Companies engaged in placement and recruiting can be stripped of their license or ordered to cease business activities in the event they fail to meet certain conditions. Accordingly, the Company may come under the same risks as the aforementioned business. 2. Outplacement The profit structure and business model for the outplacement business differs from that of the placement and recruiting business. From the perspective of introducing job seekers to employers, however, the outplacement business is regulated, guided and monitored in the manner identified above for the placement and recruiting business. Accordingly, the Company may come under the same risks as the aforementioned business. (7) Social Insurance Responsibility Risk The Pasona Group adopts comprehensive measures to ensure that all eligible temporary staff join the current social insurance system. In the future, changes in insurance rates and the scope of persons insured due to further reforms of the social insurance system driven by shifts in socio-economic conditions may affect the Pasona Group’s performance.

― 21 ―
Following a reform of the pension system in fiscal 2004, the contribution by employers as a ratio of index monthly earnings is slated to rise from 6.967% as of the reporting date by 0.177% annually through to 2017 inclusive to a fixed contribution after 2017 of 9.15%. (8) Interested-Party Transaction Risk (relationships with companies in which either Yasuyuki Nambu, Group CEO & President, or his family members maintain an equity interest) Yasuyuki Nambu and his family members maintain a majority of voting rights in a number of companies collectively referred to as the Nambu Enterprise Group of Companies. As of November 30, 2006, the Nambu Enterprise Group of Companies held a 45.5% shareholding in the Company. The Pasona Group strives to ensure the appropriate management and operation of its business activities by continuously bolstering its corporate governance structures and systems and enhancing the corporate governance function. (9) Business Investment Risk 1. Investment in Subsidiary and Affiliated Companies As of November 30, 2006, the Pasona Group was comprised of 33 consolidated subsidiaries and eight affiliated companies accounted for under the equity method. As a result, equity in subsidiaries and affiliated companies represented 23.6% of total non-consolidated assets. Stock price of publicly listed subsidiaries may be impacted by market and other trends. Accordingly, the Company’s non-consolidated performance and asset balance may in future be affected by revaluation due to movements in related company share prices. In the first half of the fiscal year ending May 31, 2007, Pasona established two new companies, incorporating each new company into the scope of consolidation as subsidiaries. In this manner, the Pasona Group is committed to proactive investment in new businesses with the aim of better addressing the diverse needs of client firms and employees. The Pasona Group strives to monitor the progress of its ongoing business investments and to accelerate development through optimal use of existing Group infrastructure and marketing network. Despite these efforts, however, consolidated performance may be affected in the event new business earnings fail to meet expectations. 2. Corporate Acquisition The Pasona Group considers all opportunities including the acquisition of companies actively involved in the human resources industry as a means to effectively supplement and reinforce its mainstay activities. The acquisition of companies includes temporary staffing companies that were established mainly for the purpose of providing temporary staff at Group companies or associated companies of their parent company (in-house-type), temporary staffing companies that specialize in particular sectors and fields and leading companies in peripheral industries. Through these means, the Pasona Group strives to complement existing business domains and to enhance consolidated profitability. In line with the acquisition of other companies, the Pasona Group may incur significant demands for funds procurement. Acquisition will also generate an increase in amortization of goodwill and other items. All of the aforementioned may affect the Group’s performance. In addition, contributions to consolidated earnings through the acquisition of companies may not be achieved

― 22 ―
in the short-term and require a longer period.

― 23 ―
CONSOLIDATED BALANCE SHEETS
As of November 30, 2005 and 2006, and May 31, 2006
(Millions of yen)
1st Half, FY ended 2006 (as of November 30, 2005)
1st Half, FY ending 2007 (as of November 30, 2006)
FY ended 2006 (as of May 31, 2006)
Notes (%) (%) (%)
ASSETS
Current assets:
1. Cash and deposits 9,407 10,349 14,2842. Notes and accounts
receivable — trade 19,129 22,123 21,022
3. Marketable securities 461 361 461
4. Inventories 234 267 348
5. Deferred tax assets 757 964 950
6. Other current assets 1,736 2,039 1,934Less allowance for doubtful receivables (67) (85) (72)
Total current assets 31,660 72.7 36,020 72.2 38,928 75.0
Fixed assets:
1. Property and equipment: ※1
(1) Buildings 2,030 2,165 2,023
(2) Land 793 793 793 (3) Other tangible fixed
assets 685 3,509 8.1 867 3,826 7.7 746 3,563 6.8
2. Intangible assets:
(1) Software 1,409 1,838 1,713 (2) Consolidation adjustment account 717 ― 585
(3) Goodwill ― 598 ―
(4) Other intangibles 87 2,213 5.1 84 2,520 5.0 92 2,390 4.63. Investments and other
assets: (1) Investment
securities 1,193 1,779 1,523
(2) Long-term loans 243 129 165
(3) Deferred tax assets 601 967 907 (4) Lease guarantee
deposits 3,068 3,398 3,309
(5) Other investments 1,140 1,361 1,246 Less allowance for doubtful receivables
(105) 6,142 14.1 (85) 7,550 15.1 (103) 7,048 13.6
Total fixed assets 11,865 27.3 13,897 27.8 13,003 25.0
Total assets 43,526 100.0 49,918 100.0 51,931 100.0

― 24 ―
CONSOLIDATED BALANCE SHEETS
(Millions of yen)
1st Half, FY ended 2006 (as of November 30, 2005)
1st Half, FY ending 2007 (as of November 30, 2006)
FY ended 2006 (as of May 31, 2006)
Notes (%) (%) (%)
LIABILITIES
Current liabilities:
1. Accounts payable — trade 440 575 1,039
2. Short-term loans payable 310 3,275 191
3. Accounts payable — other 1,705 1,984 2,467
4. Accrued expenses 8,240 9,675 9,9445. Income taxes payable 1,520 2,161 2,6266. Consumption taxes
payable ※2 1,731 1,993 2,480
7. Reserve for bonus 1,247 1,538 1,2798. Reserve for directors’
bonus ― 32 128
9. Other current liabilities 2,199 2,408 2,631Total current liabilities 17,395 40.0 23,644 47.4 22,788 43.9
Long-term liabilities: 1. Long-term loans payable ― 11 ―2. Long-term payables —
other 24 70 31
3. Deferred tax liabilities 89 66 994. Allowance for
employees’ severance retirement benefits
492 649 570
5. Allowance for directors’ retirement benefits 716 883 794
6. Other long-term liabilities 14 19 12
Total long-term liabilities 1,337 3.1 1,700 3.4 1,508 2.9
Total liabilities 18,733 43.1 25,345 50.8 24,297 46.8
MINORITY INTERESTS Minority interests 3,283 7.5 ― ― ― ―
SHAREHOLDERS’
EQUITY
Common stock 8,297 19.0 ― ― ― ―
Capital surplus 7,432 17.1 ― ― ― ―
Retained earnings 5,562 12.8 ― ― ― ―
Net unrealized holding gain on other securities 188 0.4 ― ― ― ―
Foreign currency translation adjustment 28 0.1 ― ― ― ―
Total shareholders’ equity 21,509 49.4 ― ― ― ―
Total liabilities, minority interests and shareholders’ equity
43,526 100.0 ― ― ― ―

― 25 ―
CONSOLIDATED BALANCE SHEETS
(Millions of yen)
1st Half, FY ended 2006 (as of November 30, 2005)
1st Half, FY ending 2007 (as of November 30, 2006)
FY ended 2006 (as of May 31, 2006)
Notes (%) (%) (%)
NET ASSETS
I. Shareholders’ equity
1. Common stock ― ― 8,329 16.7 8,322 16.0 2. Capital surplus ― ― 7,464 14.9 7,457 14.4
3. Retained earnings ― ― 8,931 17.9 7,664 14.74. Treasury stock ― ― (4,287) (8.6) ― ―
Total shareholders’ equity ― ― 20,438 40.9 23,444 45.1
II. Valuation and conversions
1. Net unrealized holding gain on other securities ― ― 98 0.2 140 0.3
2. Foreign currency translations adjustment ― ― 74 0.2 61 0.1
Total valuation and conversions ― ― 173 0.4 201 0.4
III. Minority interests ― ― 3,961 7.9 3,988 7.7
Total net assets ― ― 24,573 49.2 27,634 53.2 Total liabilities and net
assets ― ― 49,918 100.0 51,931 100.0

― 26 ―
CONSOLIDATED STATEMENTS OF INCOME
1Hs of the fiscal years ended 2006 and ending 2007, and the full fiscal year ended 2006
(Millions of yen)
1st Half, FY ended 2006 (June 1, 2005 to November 30, 2005)
1st Half, FY ending 2007 (June 1, 2006 to November 30, 2006)
FY ended 2006 (June 1, 2005 to May 31, 2006)
Notes (%) (%) (%)
Net sales 98,247 100.0 113,202 100.0 203,815 100.0
Cost of sales 78,833 80.2 90,233 79.7 162,578 79.8
Gross profit 19,414 19.8 22,969 20.3 41,236 20.2Selling, general and administrative expenses ※1 16,290 16.6 18,654 16.5 33,491 16.4
Operating income 3,123 3.2 4,314 3.8 7,745 3.8
Non-operating income:
1. Interest income 7 17 21 2. Investment gain on the
equity method ― 43 57
3. Subsidy from government 10 8 20
4. Insurance fund receivable 8 15 48 5. Consumption tax and other
tax exemption income ― 14 ―
6. Other income 34 60 0.1 33 132 0.1 69 217 0.1
Non-operating expenses:
1. Interest expenses 6 16 18 2. Investment loss on
equity method 21 ― ― 3. Commitment line of
credit commission 21 14 35 4. Amortization of new share issuance expenses 1 ― 22 5. Amortization of share
delivery expenses ― 3 ― 6. Subsidiary Head office relocation expense ― 7 ―
7. Other expenses 29 80 0.1 13 55 0.0 42 118 0.1
Ordinary income 3,103 3.2 4,392 3.9 7,844 3.8
Extraordinary gains: 1. Gain on sales of
investment securities ― ― 6 2. Gain on sales of
investment in affiliated companies
― ― 3
3. Constructive gain on change in equity ― ― ― 0 0 0.0 223 233 0.1
Extraordinary losses: 1. Loss on disposal of fixed
assets ※2 60 28 98
2. Impairment loss ※3 ― 63 ― 3. Loss on sales of
investment in affiliated companies
― 25 ―
4. Valuation loss of investment securities ― ― 2
5. Constructive loss on change in equity of an affiliate
4 ― ―

― 27 ―
1st Half, FY ended 2006 (June 1, 2005 to November 30, 2005)
1st Half, FY ending 2007 (June 1, 2006 to November 30, 2006)
FY ended 2006 (June 1, 2005 to May 31, 2006)
Notes (%) (%) (%)
6. Amortization of consolidation adjustment account due to merger
― 64 0.1 ― 117 0.1 561 662 0.3
Income before income taxes and minority interests
3,038 3.1 4,274 3.8 7,415 3.6
Income taxes — current 1,426 2,077 3,856 Income taxes — deferred (20) 1,405 1.4 (64) 2,012 1.8 (473) 3,383 1.6
Minority interests 150 0.2 188 0.2 444 0.2
Net income 1,482 1.5 2,073 1.8 3,588 1.8

― 28 ―
CONSOLIDATED STATEMENTS OF RETAINED EARNINGS
1Hs of the fiscal year ended 2006
(Millions of yen)
1st Half, FY ended 2006
(June 1, 2005 to November 30, 2005)
Notes
CAPITAL SURPLUS
I. Capital surplus at the beginning of the period 7.420
II. Increase in capital surplus:
1. Increase due to new share issuance 12 12
III. Capital surplus at the end of the period 7,432
RETAINED EARNINGS
I. Retained earnings at the beginning of the period 4,821
II. Increase in retained earnings:
1. Net income 1,482 1,482
III. Decrease in retained earnings
1. Dividends 648
2. Bonuses for directors 92 741
IV. Retained earnings at the end of the period 5,562

― 29 ―
CONSOLIDATED STATEMENTS OF CHANGES IN SHAREHOLDERS’ EQUITY
For the 1st Half of the Fiscal Year ending May 31, 2007 (June 1, 2006 to November 30, 2006)
(Millions of yen)
Shareholders’ Equity
Common Stock Capital Surplus Retained Earnings
Treasury Stock Total
Shareholders’ Equity
Balance as of May 31, 2006 8,322 7,457 7,664 ― 23,444
Movements during the first half of the fiscal year ending May 31, 2007:
Issuance of new shares 7 7 ― ― 14
Distribution of surplus ― ― (779) ― (779)
Net income ― ― 2,073 ― 2,073
Payment of directors’ bonus ― ― (2) ― (2)
Acquisition of treasury stock ― ― ― (4,287) (4,287) Decrease due to the decrease in
subsidiary companies ― ― (23) ― (23) Net change in line items other than
shareholders’ equity ― ― ― ― ―
Total due to movements during the first half of the fiscal year ending May 31, 2007
7 7 1,267 (4,287) (3,005)
Balance as of November 30, 2006 8,329 7,464 8,931 (4,287) 20,438
Valuation and Conversions
Net Unrealized Holding Gain on Other Securities
Foreign Currency Translation Adjustment
Total Valuation and Conversions
Minority Interests
Total Net Assets
Balance as of May 31, 2006 140 61 201 3,988 27,634
Movements during the first half of the fiscal year ending May 31, 2007:
Issuance of new shares ― ― ― ― 14
Distribution of surplus ― ― ― ― (779)
Net income ― ― ― ― 2,073
Payment of directors’ bonus ― ― ― ― (2)
Acquisition of treasury stock ― ― ― ― (4,287) Decrease due to the decrease in
subsidiary companies ― ― ― ― (23) Net change in line items other than
shareholders’ equity (41) 13 (28) (26) (55)
Total due to movements during the first half of the fiscal year ending May 31, 2007
(41) 13 (28) (26) (3,060)
Balance as of November 30, 2006 98 74 173 3,961 24,573

― 30 ―
CONSOLIDATED STATEMENTS OF CHANGES IN SHAREHOLDERS’ EQUITY
Year ended May 31, 2006
(Millions of yen)
Shareholders’ Equity Valuation and Conversions
Common Stock
Capital surplus
Retained Earnings
Total Shareholders’
Equity
Net Unrealized
Holding Gain on Other Securities
Foreign Currency
Translation Adjustment
Total Valuation
and Conversions
Minority Interests
Total Net
Assets
Balance as of May, 31, 2005 8,285 7,420 4,821 20,526 124 (6) 118 3,135 23,780
Movements during the fiscal year ended May 31, 2006
Issuance of new shares 37 37 — 74 — — — — 74
Distribution of surplus — — (648) (648) — — — — (648)
Net Income — — 3,588 3,588 — — — — 3,588 Payment of directors’ bonus — — (92) (92) — — — — (92)
Decrease due to increase in affiliated companies accounted for by the equity method
— — (4) (4) — — — — (4)
Net change in line items other than shareholders’ equity
— — — — 15 67 83 852 936
Total due to movements during the fiscal year ended May 31, 2006
37 37 2,843 2,917 15 67 83 852 3,853
Balance as of May 31, 2006 8,322 7,457 7,664 23,444 140 61 201 3,988 27,634

― 31 ―
CONSOLIDATED STATEMENTS OF CASH FLOWS
1Hs of the fiscal years ended 2006 and ending 2007, and the full fiscal year ended 2006
(Millions of yen)
1st Half, FY ended 2006 (June 1, 2005 to November 30, 2005)
1st Half, FY ending 2007 (June 1, 2006 to November 30, 2006)
FY ended 2006 (June 1, 2005 to May 31, 2006)
Notes
Cash Flows from Operating Activities:
Income before income taxes 3,038 4,274 7,415Depreciation 437 525 939Impairment loss ― 63 ―
Amortization of others 6 5 17Amortization of consolidation adjustment
account (excess of costs over assets acquired)
22 ― 688
Amortization of goodwill ― 77 ―
Increase in allowance for doubtful receivables 31 18 34
Increase in reserve for bonus 63 267 83Increase (decrease) in reserve for
directors’ bonus ― (97) 128Increase in allowance for employees’ severance retirement benefits 94 79 169
Increase in allowance for directors’ retirement benefits 70 88 148
Interest and dividend income (9) (18) (25)Interest expenses 6 16 18Foreign exchange (gain) loss 7 (4) 5Investment loss (gain) on equity method 21 (43) (57)Constructive (gain) loss on change in
equity 4 (0) (223)
Loss on sale and disposal of fixed assets 60 28 98Gain on sale of investment securities ― ― (6)Valuation loss on investment securities ― ― 2Loss (gain) on sale of securities in
affiliated companies ― 25 (3)
Increase in accounts receivable — trade (1,129) (1,158) (2,388)Decrease (increase) in inventories 98 64 (11)Increase in other current assets (292) (241) (343)(Decrease) increase in accounts payable — trade (707) (874) 1,112
(Decrease) increase in consumption tax payable (332) (467) 385
Increase in other current liabilities 272 (197) 1,416Directors’ bonuses paid (107) (4) (107)
Subtotal 1,657 2,425 9,495Interest and dividends received 21 22 37Interest paid (6) (15) (18)Income taxes paid (1,266) (2,523) (2,618)Net cash used in (provided by) operating activities 406 (91) 6,895

― 32 ―
CONSOLIDATED STATEMENTS OF CASH FLOWS
(Millions of yen)
1st Half, FY ended 2006 (June 1, 2005 to November 30, 2005)
1st Half, FY ending 2007 (June 1, 2006 to November 30, 2006)
FY ended 2006 (June 1, 2005 to May 31, 2006)
Notes
Cash Flows from Investing Activities:
Decrease (increase) in time deposits 79 (12) (36)Payments for purchases of fixed assets (706) (560) (1,048)Proceeds from sale of fixed assets ― ― 3Payments for purchases of intangible
assets (472) (476) (933)Payments for purchases of investment
securities (7) (479) (177)Proceeds from sale of investment
securities ― ― 22Payments for purchase of securities
of subsidiaries due to change in consolidated subsidiaries
(36) (44) (858)
Proceeds from sale of securities of subsidiaries due to change in consolidated subsidiaries
― ― 6
Payments for sale of securities of Subsidiaries due to change in consolidated subsidiaries
― (91) ―
Payments for purchase of additional securities of subsidiaries (685) ― (761)
Proceeds from sale of a portion of securities of subsidiaries 18 ― 27
Payments for increase in loans receivable (133) (62) (229)Proceeds from collection of loans
receivable 36 96 104
Proceeds from other investment securities 130 68 259Payments for other investment securities (300) (217) (720)Net cash used in investing activities (2,076) (1,778) (4,341)Cash Flows from Financing Activities: Increase (decrease) in short-term loans
payable (4) 3,076 (122)
Repayment of financial lease (103) (102) (213)Proceeds from issuance of shares 25 14 74Proceeds from minority shareholder
payments 74 4 125Proceeds from issuance of shares to
minority shareholders 18 14 695
Payments for acquisition of treasury stock ― (4,287) ―
Payments for dividends by parent company (643) (775) (645)
Payments for dividends to minority shareholders (78) (116) (78)
Net cash used in financing activities (712) (2,172) (164)Effect of Exchange Rate Changes on Cash and Cash Equivalents 34 14 63
Net (decrease) increase in Cash and Cash Equivalents (2,347) (4,027) 2,452
Cash and Cash Equivalents at the Beginning of the Period 12,203 14,656 12,203
Cash and Cash Equivalents at the End of the Period ※1 9,856 10,629 14,656

― 33 ―
NOTES TO CONSOLIDATED FINANCIAL STATEMENTS
Basis of preparation of consolidated financial statements
1st Half, FY ended 2006
(June 1, 2005 to November 30, 2005)1st Half, FY ending 2007
(June 1, 2006 to November 30, 2006)FY ended 2006
(June 1, 2005 to May 31, 2006)
1. Scope of consolidation (1) Consolidated subsidiaries: 36 companies
Names of consolidated subsidiaries: Benefit One Inc. Pasona Tech, Inc. Pasona ai Inc. Pasona career assets Inc. Pasona Carent, Inc. Pasona Engineering Inc. NARP Inc. HR Partners Inc. Pasona Insurance Inc. Pasona Kyoto Inc. Home Computing Network Inc. Pasona On Inc. Pasona Temp to Perm, Inc. Pasona Empower Inc. Pasona Global Inc. Pasona Fortune Inc. Pasona Okayama Inc. Pasona Sparkle Inc. Pasona REP Power Inc. Pasona Sportsmate Inc. Pasona Sourcing Inc. Pasona Foster Inc. Pasona Logicom Inc. Pasona Heartful Inc. Pasona NA, Inc. Pasona Taiwan Co., Ltd. Pasona Singapore Pte. Ltd. Pasona Canada, Inc. MGR Search and Selection Co., Ltd.
Pasona Employment Agency (Thailand) Co., Ltd.
Pelham Search Pacific Limited Pasona Education Co. Limited Cannon-Persona Recruitment Limited Pasona Asia Co., Limited Pasona Management Consultancy (Shenzhen) Co., Ltd. Pelham International Limited HR Partners Inc., Pasona Temp to Perm, Inc., Pasona Fortune Inc. and Pasona Management Consultancy (Shenzhen) Co., Ltd. were newly incorporated as consolidated subsidiaries. Cannon-Persona Recruitment Limited, previously an affiliated company accounted for by the equity method, became a consolidated subsidiary through the acquisition of additional stock.
(1) Consolidated subsidiaries: 41 companies
Names of consolidated subsidiaries: Benefit One Inc. Pasona Tech, Inc. Pasona career assets Inc. Pasona Carent, Inc. Pasona Engineering Inc. NARP Inc. HR Partners Inc. Pasona Insurance Inc. Pasona Kyoto Inc. Pasona Youth Inc. Pasona Temp to Perm, Inc. Pasona Empower Inc. Pasona Global Inc. Pasona Fortune Inc. Pasona e-Professional, Inc. Pasona Sportsmate Inc. Pasona Okayama Inc. Pasona Sparkle Inc. Pasona REP Power Inc. Pasona Sourcing Inc. Pasona Foster Inc. Pasona Logicom Inc. Pasona Heartful Inc. Global Healthcare, Inc. Benefit One Partners Inc. Speak Line Inc. SEIKATSU OASIS Ltd. Fortune Club Association Pasona NA, Inc. Pasona Taiwan Co., Ltd. Pasona Singapore Pte. Ltd. Pasona Canada, Inc. MGR Search and Selection Co.,
Ltd. Pasona Employment Agency
(Thailand) Co., Ltd. Pelham Search Pacific Limited Pasona Education Co. Limited Pasona Human Resources (Shanghai)
Co., Ltd. Pasona Europe Limited Pasona Asia Co., Limited Pasona Management Consultancy (Shenzhen) Co., Ltd. Pelham International Limited Global Healthcare, Inc., previously an affiliated company accounted for by the equity method, became a consolidated subsidiary through the acquisition of additional stock. Pasona Human Resources (Shanghai) Co., Ltd., previously a non-consolidated subsidiary, became a consolidated subsidiary due to its growing importance. Home Computing Network Inc. was removed from the scope of consolidation following the sale of its shares. Pasona ai Inc. was removed from the scope of consolidation following the transfer of all of its business to Pasona On Inc. (currently Pasona Youth Inc.) and its subsequent liquidation. Profit and loss for the period up to the date of exclusion has been included in consolidated financial statements. Pasona On Inc. changed its name to Pasona Youth Inc.
(1) Consolidated subsidiaries: 41 companies
Names of consolidated subsidiaries: Benefit One Inc. Pasona Tech, Inc. Pasona ai Inc. Pasona career assets Inc. Pasona Carent, Inc. Pasona Engineering Inc. NARP Inc. HR Partners Inc. Pasona Insurance Inc. Pasona Kyoto Inc. Home Computing Network Inc. Pasona On Inc. Pasona Temp to Perm, Inc. Pasona Empower Inc. Pasona Global Inc. Pasona Fortune Inc. Pasona e-Professional, Inc. Pasona Okayama Inc. Pasona Sparkle Inc. Pasona REP Power Inc. Pasona Sportsmate Inc. Pasona Sourcing Inc. Pasona Foster Inc. Pasona Logicom Inc. Pasona Heartful Inc. Benefit One Partners Inc. Speak Line Inc. SEIKATSU OASIS Ltd. Fortune Club Association Pasona NA, Inc. Pasona Taiwan Co., Ltd. Pasona Singapore Pte. Ltd. Pasona Canada, Inc. MGR Search and Selection Co., Ltd. Pasona Employment Agency
(Thailand) Co., Ltd. Pelham Search Pacific Limited Pasona Education Co. Limited Pasona Europe Limited Pasona Asia Co., Limited Pasona Management Consultancy (Shenzhen) Co., Ltd. Pelham International Limited HR Partners Inc., Pasona Temp to Perm, Inc., Pasona Fortune Inc., Pasona e-Professional, Inc., Benefit One Partners Inc., Speak Line Inc., Fortune Club Association, and Pasona Management Consultancy (Shenzhen) Co., Ltd. were newly incorporated as consolidated subsidiaries. SEIKATSU OASIS Ltd. was newly acquired as a consolidated subsidiary. Pasona Europe Limited, previously an affiliated company accounted for by the equity method, became a consolidated subsidiary through the acquisition of additional stock. Socio Inc., previously a consolidated subsidiary due to the acquisition of new shares, was excluded from the scope of consolidation following a merger with Pasona Inc. Profit and loss for the period up to the date of exclusion has been included in consolidated financial statements. Cannon-Persona Recruitment Limited changed its name to Pasona Europe Limited.
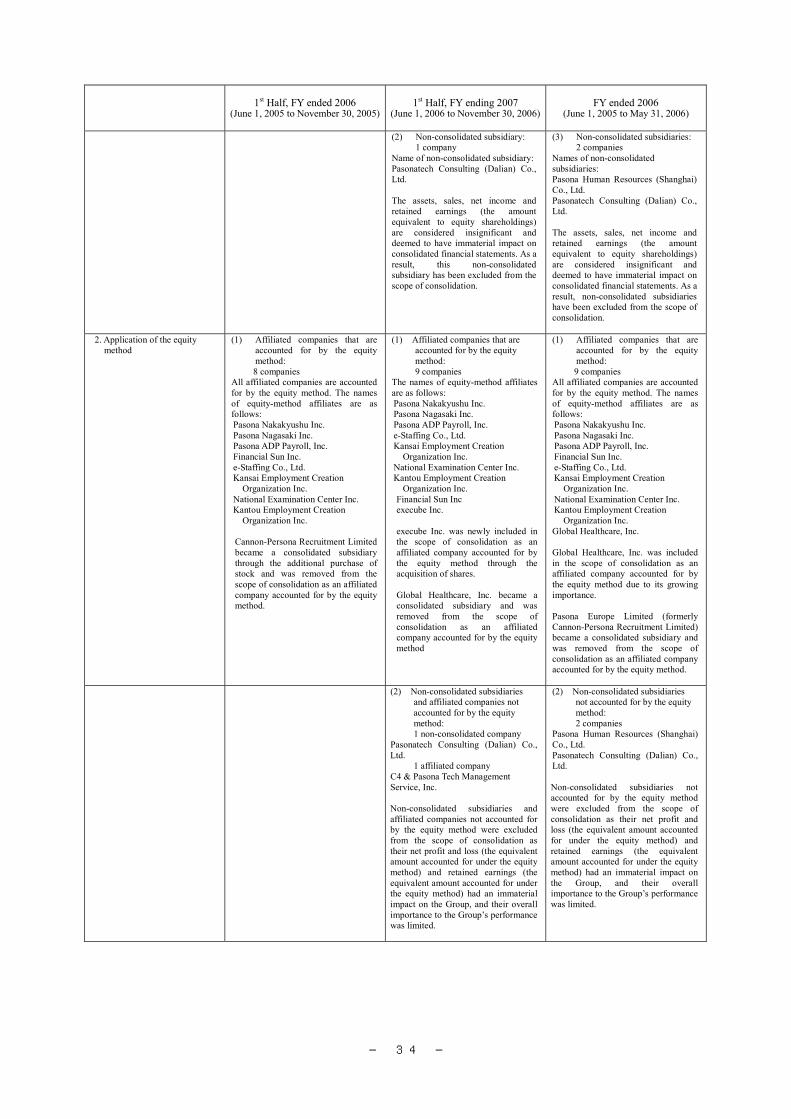
― 34 ―
1st Half, FY ended 2006 (June 1, 2005 to November 30, 2005)
1st Half, FY ending 2007 (June 1, 2006 to November 30, 2006)
FY ended 2006 (June 1, 2005 to May 31, 2006)
(2) Non-consolidated subsidiary: 1 company
Name of non-consolidated subsidiary: Pasonatech Consulting (Dalian) Co., Ltd. The assets, sales, net income and retained earnings (the amount equivalent to equity shareholdings) are considered insignificant and deemed to have immaterial impact on consolidated financial statements. As a result, this non-consolidated subsidiary has been excluded from the scope of consolidation.
(3) Non-consolidated subsidiaries: 2 companies
Names of non-consolidated subsidiaries: Pasona Human Resources (Shanghai) Co., Ltd. Pasonatech Consulting (Dalian) Co., Ltd. The assets, sales, net income and retained earnings (the amount equivalent to equity shareholdings) are considered insignificant and deemed to have immaterial impact on consolidated financial statements. As a result, non-consolidated subsidiaries have been excluded from the scope of consolidation.
2. Application of the equity
method (1) Affiliated companies that are
accounted for by the equity method: 8 companies
All affiliated companies are accounted for by the equity method. The names of equity-method affiliates are as follows: Pasona Nakakyushu Inc. Pasona Nagasaki Inc. Pasona ADP Payroll, Inc. Financial Sun Inc. e-Staffing Co., Ltd. Kansai Employment Creation
Organization Inc. National Examination Center Inc. Kantou Employment Creation
Organization Inc.
Cannon-Persona Recruitment Limited became a consolidated subsidiary through the additional purchase of stock and was removed from the scope of consolidation as an affiliated company accounted for by the equity method.
(1) Affiliated companies that are accounted for by the equity method: 9 companies The names of equity-method affiliates are as follows: Pasona Nakakyushu Inc. Pasona Nagasaki Inc. Pasona ADP Payroll, Inc. e-Staffing Co., Ltd. Kansai Employment Creation
Organization Inc. National Examination Center Inc. Kantou Employment Creation
Organization Inc. Financial Sun Inc execube Inc. execube Inc. was newly included in the scope of consolidation as an affiliated company accounted for by the equity method through the acquisition of shares. Global Healthcare, Inc. became a consolidated subsidiary and was removed from the scope of consolidation as an affiliated company accounted for by the equity method
(1) Affiliated companies that are accounted for by the equity method: 9 companies
All affiliated companies are accounted for by the equity method. The names of equity-method affiliates are as follows: Pasona Nakakyushu Inc. Pasona Nagasaki Inc. Pasona ADP Payroll, Inc. Financial Sun Inc. e-Staffing Co., Ltd. Kansai Employment Creation
Organization Inc. National Examination Center Inc. Kantou Employment Creation
Organization Inc. Global Healthcare, Inc. Global Healthcare, Inc. was included in the scope of consolidation as an affiliated company accounted for by the equity method due to its growing importance. Pasona Europe Limited (formerly Cannon-Persona Recruitment Limited) became a consolidated subsidiary and was removed from the scope of consolidation as an affiliated company accounted for by the equity method.
(2) Non-consolidated subsidiaries
and affiliated companies not accounted for by the equity
method: 1 non-consolidated company Pasonatech Consulting (Dalian) Co.,
Ltd. 1 affiliated company C4 & Pasona Tech Management
Service, Inc. Non-consolidated subsidiaries and affiliated companies not accounted for by the equity method were excluded from the scope of consolidation as their net profit and loss (the equivalent amount accounted for under the equity method) and retained earnings (the equivalent amount accounted for under the equity method) had an immaterial impact on the Group, and their overall importance to the Group’s performance was limited.
(2) Non-consolidated subsidiaries not accounted for by the equity method: 2 companies Pasona Human Resources (Shanghai) Co., Ltd. Pasonatech Consulting (Dalian) Co., Ltd. Non-consolidated subsidiaries not accounted for by the equity method were excluded from the scope of consolidation as their net profit and loss (the equivalent amount accounted for under the equity method) and retained earnings (the equivalent amount accounted for under the equity method) had an immaterial impact on the Group, and their overall importance to the Group’s performance was limited.

― 35 ―
1st Half, FY ended 2006 (June 1, 2005 to November 30, 2005)
1st Half, FY ending 2007 (June 1, 2006 to November 30, 2006)
FY ended 2006 (June 1, 2005 to May 31, 2006)
3. First-half-end of financial statements of consolidated subsidiaries
The first half-end of Cannon-Persona Recruitment Limited is February 28. The provisional financial statements of Cannon-Persona Recruitment Limited as of February 28 are used in the preparation of the consolidated financial statements. The first half-end of Pasona Management Consultancy (Shenzhen) Co., Ltd. is June 30. The provisional financial statements of Pasona Management Consultancy (Shenzhen) Co., Ltd. as of September 30 are used in the preparation of the consolidated financial statements. The first half-end of 34 other consolidated subsidiaries is September 30. The financial statements of these 34 other consolidated subsidiaries as of September 30 are used in the preparation of the consolidated financial statements. Where significant transactions have occurred during the period between these first half-ends and the consolidated first half-end, the consolidated financial statements are adjusted accordingly.
The first half-end of Pasona Europe Limited is February 28. The provisional financial statements of Pasona Europe Limited as of February 28 are used in the preparation of the consolidated financial statements. The first half-end of Pasona Management Consultancy (Shenzhen) Co., Ltd. is June 30. The provisional financial statements of Pasona Management Consultancy (Shenzhen) Co., Ltd. as of September 30 are used in the preparation of the consolidated financial statements. The first half-end of 39 other consolidated subsidiaries is September 30. The financial statements of these 39 other consolidated subsidiaries as of September 30 are used in the preparation of the consolidated financial statements. Where significant transactions have occurred during the period between these first half-ends and the consolidated first half-end, the consolidated financial statements are adjusted accordingly.
The fiscal year-end of Pasona Europe Limited is August 31. The provisional financial statements of Pasona Europe Limited as of August 31 are used in the preparation of the consolidated financial statements. The fiscal year-end of Pasona Management Consultancy (Shenzhen) Co., Ltd. is December 31. The provisional financial statements of Pasona Management Consultancy (Shenzhen) Co., Ltd. as of March 31 are used in the preparation of the consolidated financial statements. The fiscal year-end of 39 other consolidated subsidiaries is March 31. The financial statements of these 39 other consolidated subsidiaries as of March 31 are used in the preparation of the consolidated financial statements. Where significant transactions have occurred during the period between these year-ends and the consolidated year-end, the consolidated financial statements are adjusted accordingly.
4. Accounting policies (1) Valuation standard and
valuation method of important assets
A. Securities (other securities) 1.Securities with quoted market values Securities with quoted market value are stated at fair value as of the closing date of the first half. (Net unrealized gains and losses on other securities are reported, directly to shareholders’ equity. The cost of these securities is calculated based on the moving-average cost method.)
A. Securities (other securities) 1.Securities with quoted market values Securities with quoted market value are stated at fair value as of the closing date of the first half. (Net unrealized gains and losses on other securities are reported, directly to net assets. The cost of these securities is calculated based on the moving-average cost method.)
A. Securities (other securities) 1.Securities with quoted market values Securities with quoted market value are stated at fair value on the closing date. (Net unrealized gains and losses on other securities are reported, directly to net assets. Cost of these securities is calculated based on the moving-average cost method.)
2.Securities without quoted market values
Securities without quoted market value are stated on a cost basis using the moving-average cost method.
2.Securities without quoted market values
As left.
2.Securities without quoted market values
As left.
B. Valuation of inventories 1.Merchandise: Cost basis using the identified cost method 2.Stored goods: Cost basis at last invoice cost method
B. Valuation of inventories 1.Merchandise: Cost basis using the moving-average cost method
2.Stored goods:
As left.
B. Valuation of inventories 1.Merchandise: Cost basis using the identified cost method
2.Stored goods:
As left.
(2) Depreciation of important depreciable assets
A. Tangible fixed assets 1.Buildings (excluding associated
equipment and facilities): Straight-line method 2.Other tangible fixed assets: Declining balance method
A. Tangible fixed assets 1.Buildings (excluding associated
equipment and facilities):
As left. 2.Other tangible fixed assets:
As left.
A. Tangible fixed assets 1.Buildings (excluding associated
equipment and facilities):
As left. 2.Other tangible fixed assets:
As left.
B. Intangible fixed assets Software: Straight-line method over the useful life of the asset estimated by the Company (within five years)
B. Intangible fixed assets Software:
As left.
B. Intangible fixed assets Software:
As left.

― 36 ―
1st Half, FY ended 2006 (June 1, 2005 to November 30, 2005)
1st Half, FY ending 2007 (June 1, 2006 to November 30, 2006)
FY ended 2006 (June 1, 2005 to May 31, 2006)
(3) Accounting policies for important deferred assets
A. New share issuance expense Expenses relating to the issuance of new shares are charged to income in full when paid.
A. Share delivery expense
Expenses relating to the issuance of new shares are charged to income in full when paid.
A. New share issuance expense
Expenses relating to the issuance of new shares are charged to income in full when paid.
(4) Accounting policies for important provisions
A. Allowance for doubtful receivables
The Company and its consolidated subsidiaries provide for doubtful receivables based on the historical deterioration rate as for normal loans, and the amount deemed necessary to cover individual accounts estimated to be uncollectible.
A. Allowance for doubtful receivables
As left.
A. Allowance for doubtful receivables
As left.
B. Reserve for bonus The Company and its consolidated subsidiaries provide for employee bonus payments at an estimated amount to be paid for the period.
B. Reserve for bonus
As left.
B. Reserve for bonus
As left.
C. Reserve for directors’ bonus
—
C. Reserve for directors’ bonus The Company and its consolidated subsidiaries provide for directors’ bonus payments at an estimated amount to be paid for the period. The amounted that is deemed to have arisen as of November 30, 2006 is recorded in financial accounts.
C. Reserve for directors’ bonus
As left.
D. Allowance for employees’ severance retirement benefits The Company and its consolidated subsidiaries provide an allowance for severance retirement benefits for employees based on the calculated amount of accrued retirement funds and accrued pension assets as of the end of the first half under review. Actuarial gains and losses are recognized in expenses in the next fiscal year.
D. Allowance for employees’ severance retirement benefits
As left.
D. Allowance for employees’ severance retirement benefits The Company and its consolidated subsidiaries provide an allowance for severance retirement benefits for employees based on the calculated amount of accrued retirement funds and accrued pension assets as of the end of the fiscal period. Actuarial gains and losses are recognized in expenses in the next fiscal year.
E. Allowance for directors’ retirement benefits
The Company and its consolidated subsidiaries provide an allowance for retirement benefits for directors and executive officers in conformity with bylaws to meet obligations as of the end of the first half under review.
E. Allowance for directors’ retirement benefits
As left.
E. Allowance for directors’ retirement benefits
The Company and its consolidated subsidiaries provide an allowance for retirement benefits for directors and executive officers in conformity with bylaws to meet obligations as of the fiscal year-end.
(5) Accounting for lease transactions
Finance leases in which ownership is not transferred to a lessee are accounted for in the same manner as operating leases.
As left. As left.
(6) Other significant accounting policies for preparing consolidated financial statements
Consumption taxes Consumption taxes are separately recorded.
Consumption taxes
As left.
Consumption taxes
As left.
5. Scope for “Cash and Cash
Equivalents” in consolidated statements of cash flows
“Cash and cash equivalents” in the consolidated statements of cash flows includes cash on hand, readily available deposits, and short-term investments with original maturities not exceeding three months, which are highly liquid and virtually risk-free with respect to change of value.
As left. As left.
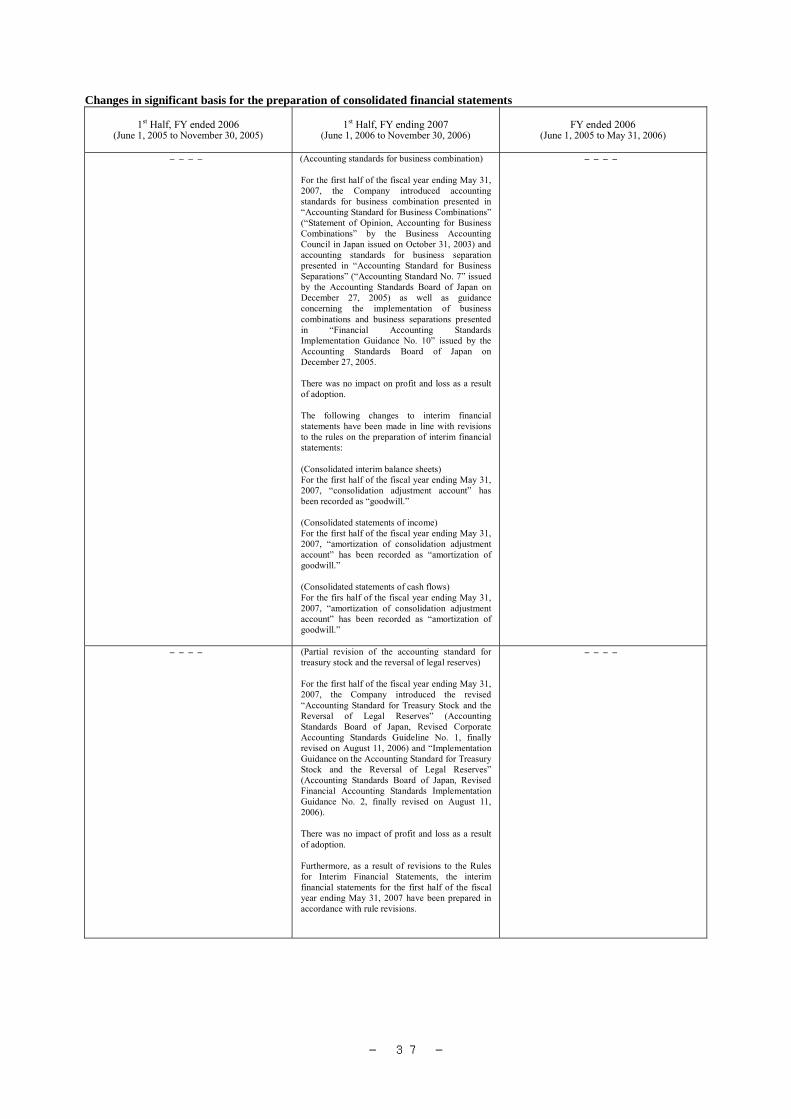
― 37 ―
Changes in significant basis for the preparation of consolidated financial statements
1st Half, FY ended 2006 (June 1, 2005 to November 30, 2005)
1st Half, FY ending 2007 (June 1, 2006 to November 30, 2006)
FY ended 2006 (June 1, 2005 to May 31, 2006)
――――
(Accounting standards for business combination) For the first half of the fiscal year ending May 31, 2007, the Company introduced accounting standards for business combination presented in “Accounting Standard for Business Combinations” (“Statement of Opinion, Accounting for Business Combinations” by the Business Accounting Council in Japan issued on October 31, 2003) and accounting standards for business separation presented in “Accounting Standard for Business Separations” (“Accounting Standard No. 7” issued by the Accounting Standards Board of Japan on December 27, 2005) as well as guidance concerning the implementation of business combinations and business separations presented in “Financial Accounting Standards Implementation Guidance No. 10” issued by the Accounting Standards Board of Japan on December 27, 2005. There was no impact on profit and loss as a result of adoption. The following changes to interim financial statements have been made in line with revisions to the rules on the preparation of interim financial statements: (Consolidated interim balance sheets) For the first half of the fiscal year ending May 31, 2007, “consolidation adjustment account” has been recorded as “goodwill.” (Consolidated statements of income) For the first half of the fiscal year ending May 31, 2007, “amortization of consolidation adjustment account” has been recorded as “amortization of goodwill.” (Consolidated statements of cash flows) For the firs half of the fiscal year ending May 31, 2007, “amortization of consolidation adjustment account” has been recorded as “amortization of goodwill.”
――――
―――― (Partial revision of the accounting standard for treasury stock and the reversal of legal reserves) For the first half of the fiscal year ending May 31, 2007, the Company introduced the revised “Accounting Standard for Treasury Stock and the Reversal of Legal Reserves” (Accounting Standards Board of Japan, Revised Corporate Accounting Standards Guideline No. 1, finally revised on August 11, 2006) and “Implementation Guidance on the Accounting Standard for Treasury Stock and the Reversal of Legal Reserves” (Accounting Standards Board of Japan, Revised Financial Accounting Standards Implementation Guidance No. 2, finally revised on August 11, 2006). There was no impact of profit and loss as a result of adoption. Furthermore, as a result of revisions to the Rules for Interim Financial Statements, the interim financial statements for the first half of the fiscal year ending May 31, 2007 have been prepared in accordance with rule revisions.
――――

― 38 ―
1st Half, FY ended 2006 (June 1, 2005 to November 30, 2005)
1st Half, FY ending 2007 (June 1, 2006 to November 30, 2006)
FY ended 2006 (June 1, 2005 to May 31, 2006)
――――
(Tentative solutions on accounting for deferred assets)
For the first half of the fiscal year ending May 31, 2007, the Company introduced the “Tentative Solution on Accounting for Deferred Assets” (practical solutions No. 19 issued by the Accounting Standards Board of Japan on August 11, 2006)
There was no impact on profit and loss as a result of adoption.
(Consolidated interim statements of income) From the first half of the fiscal year ending May 31, 2007, the Company recorded “Amortization of new share issuance expenses” as “Amortization of share delivery expenses.”
――――
(Accounting standard for the impairment of fixed assets)
For the first half of the fiscal year ended May 31, 2005, the Company introduced accounting standards for the impairment of fixed assets presented in the “Accounting Standard for Impairment of Fixed Assets” by the Business Accounting Council in Japan issued on August 9, 2002) and the “Guidance for Accounting Standard for the Impairment of Fixed Assets” (Accounting Standard Board of Japan, Financial Accounting Standards Implementation Guidance No. 6 issued on October 31, 2003).
There was no impact on profit and loss as a result of adoption.
――――
(Accounting standard for the impairment of fixed assets)
For the fiscal year ended May 31, 2006, the
Company introduced accounting standards for the impairment of fixed assets presented in the “Accounting Standard for Impairment of Fixed Assets” by the Business Accounting Council in Japan issued on August 9, 2002) and the “Guidance for Accounting Standard for the Impairment of Fixed Assets” (Accounting Standard Board of Japan, Financial Accounting Standards Implementation Guidance No. 6 issued on October 31, 2003).
There was no impact on profit and loss as a result of
adoption.
――――
――――
(Accounting standard for directors’ bonuses) From the fiscal year ended May 31, 2006, the
Company introduced accounting standards for directors’ bonuses presented in “Corporate Accounting Standards Guideline 4” issued on November 29, 2005.
In comparison with the previous method, operating
income, ordinary income and income before income taxes all decreased by ¥83 million, as a result of the introduction of relevant accounting standards.
――――
――――
(Accounting standard for the presentation of net assets on the balance sheet)
For the fiscal year ended May 31, 2006, the
Company introduced accounting standards for the presentation of net assets on the balance sheet presented in “Accounting Standard for the Presentation of Net Assets on the Balance Sheet No. 5” issued by the Accounting Standards Board of Japan on December 9, 2005 and “Guidance on the Accounting Standard for the Presentation of Net Assets on the Balance Sheet No. 8” issued by the Accounting Standards Board of Japan on December 9, 2005.
Under the previous standard, the total of
shareholders’ equity is ¥23,645 million. There was no impact on profit and loss as a result of adoption.
The balance sheet for the fiscal year ended May 31,
2006 has been prepared to include a section for net assets composed of line items consistent with revisions to standards relating to the preparation of financial statements.

― 39 ―
Change in method of presentation
1st Half, FY ended 2006 (June 1, 2005 to November 30, 2005)
1st Half, FY ending 2007 (June 1, 2006 to November 30, 2006)
(Interim consolidated balance sheets) For the first half of the fiscal year ended May 31, 2006, the Company classified and recorded investments in limited partnerships and similar entities (as defined under Article2.2 of the Securities and Exchange Law) as investment securities pursuant to amendments to the Securities and Exchange Law and other regulations (Law No. 97 of 2004) promulgated on June 9, 2004 and effective as of December 1, 2004, and “Practical Guidelines to Accounting for Financial Instruments” (the Japanese Institute of Certified Public Accountants Committee Report No. 14) amended on February 15, 2005. The amount of investment in limited partnerships and similar entities included in investment securities for the first half of the fiscal year ended May 31, 2006 was ¥9 million. An amount of ¥11 million representing investment in limited partnerships and similar entities was recorded in “Other assets” in the “Investment and other assets” section of the balance sheet as of November 30, 2005.
――――
(Consolidated statements of income) Non-operating income item “insurance fund receivable” for the six-month period ended November 30, 2005 was more than 10% of the total of “other income.” Accordingly, it was recorded as a separate item. For the previous interim period, “insurance fund receivable” was ¥0 million.
――――

― 40 ―
Additional information
1st Half, FY ended 2006 (June 1, 2005 to November 30, 2005)
1st Half, FY ending 2007 (June 1, 2006 to November 30, 2006)
FY ended 2006 (June 1, 2005 to May 31, 2006)
――――
(Accounting standard for the presentation of net assets on the balance sheet)
For the fiscal year ended May 31, 2006, the Company introduced accounting standards for the presentation of net assets on the balance sheet presented in “Accounting Standard for the Presentation of Net Assets on the Balance Sheet No. 5” issued by the Accounting Standards Board of Japan on December 9, 2005 and “Guidance on the Accounting Standard for the Presentation of Net Assets on the Balance Sheet No. 8” issued by the Accounting Standards Board of Japan on December 9, 2005.
Under the previous standard, the total of shareholders’ equity is ¥20,611 million. There was no impact on profit and loss as a result of adoption.
The balance sheet for the first half of the fiscal year ending May 31, 2007 has been prepared to include a section for net assets composed of line items consistent with revisions to standards relating to the preparation of interim financial statements.
――――

― 41 ―
Notes to consolidated balance sheets (Millions of yen)
1st Half, FY ended 2006 (as of November 30, 2005)
1st Half, FY ending 2007 (as of November 30, 2006)
FY ended 2006 (as of May 31, 2006)
1. Accumulated depreciation of tangible fixed assets
876
1. Accumulated depreciation of tangible fixed assets
1,348
1. Accumulated depreciation of tangible fixed assets
1,128
2. Consumption tax Consumption tax payable is recorded after
deducting for consumption tax receipts.
2. Consumption tax As left.
2. ――――
3. Contingent liability for guarantee For the following affiliate, the unpaid
balance on leasing expenses are guaranteed:
Pasona ADP Payroll, Inc. 62
3. Contingent liability for guarantee (1) For the following affiliate, the unpaid
balance on leasing expenses are guaranteed:
Pasona ADP Payroll, Inc. 39
(2) For the following individual, building
lease rentals are guaranteed: Koichi Yamanaka 388
3. Contingent liability for guarantee (1) For the following affiliate, the unpaid
balance on leasing expenses are guaranteed:
Pasona ADP Payroll, Inc. 50
(2) For the following individual, building lease
rentals are guaranteed:
Koichi Yamanaka 408

― 42 ―
Notes to consolidated statements of income
(Millions of yen)
1st Half, FY ended 2006 (June 1, 2005 to November 30, 2005)
1st Half, FY ending 2007 (June 1, 2006 to November 30, 2006)
FY ended 2006 (June 1, 2005 to May 31, 2006)
※1. Breakdown of major selling, general and administrative expenses:
Salaries and bonuses for employees 6,011
Accrual of bonuses 1,034
Provision for employees’ retirement benefits 129
Provision for director’s retirement benefits 119
Rent expenses 1,688
Depreciation and amortization 391
Provision for doubtful receivables 30
Amortization of consolidation adjustment account 22
※1. Breakdown of major selling, general and administrative expenses:
Salaries and bonuses for employees 6,692
Accrual of bonuses 1,228
Accrual of directors’ bonuses 32
Provision for employees’ retirement benefits 50
Provision for director’s retirement benefits 109
Rent expenses 1,817
Depreciation and amortization 457
Provision for doubtful receivables 18
Amortization of goodwill 77
※1. Breakdown of major selling, general and administrative expenses:
Salaries and bonuses for employees 13,026
Accrual of bonuses 1,139
Accrual of directors’ bonuses 128
Welfare benefits expenses 2,491
Provision for employees’ retirement benefits 273
Provision for director’s retirement benefits 201
Recruiting expenses 2,282
Rent expenses 3,482
Depreciation and amortization 819
Provision for doubtful receivables 43
Amortization of consolidation adjustment account 127
※2. Breakdown of loss on sales and disposal of
fixed assets: Loss on disposal
Buildings 53
Other tangible fixed assets 6
60
※2. Breakdown of loss on sales and disposal of
fixed assets: Loss on disposal
Buildings 13
Other tangible fixed assets 4
Software 10
Other intangible fixed assets 0
28
※2. Breakdown of loss on sales and disposal of
fixed assets: Loss on disposal
Buildings 73
Other tangible fixed assets 9
Software 8 Loss on sales
Buildings 5
Land 1
98

― 43 ―
(Millions of yen)
1st Half, FY ended 2006 (June 1, 2005 to November 30, 2005)
1st Half, FY ending 2007 (June 1, 2006 to November 30, 2006)
FY ended 2006 (June 1, 2005 to May 31, 2006)
※3 ――― ※3 Impairment loss For the first half of the fiscal year ending May 31, 2007, the Group reported impairment losses in connection the following asset groups: (1) Overview of asset groups in which impairment
losses were recognized: Location Application Type Shibuya-ku, Tokyo
Server Equipment, furniture and fixtures
Chiyoda-ku, Tokyo
Internet service
Software
Chiyoda-ku, Tokyo
Trademarks Other intangible fixed assets
(2) Background leading to the recognition of
impairment losses In principle, the Pasona Group adopts each individual company as the basic unit for assets groupings and the smallest unit in independent cash flow generation. Of the assets identified above, impairment losses have been recognized for equipment, furniture and fixtures that remain idle with no clear future plan for use. In addition, extraordinary impairment losses have been recognized for software and other intangible assets in connection with the transfer, sale and disposal of businesses. The impairment loss is the book value of each relevant asset written down to the amount estimated as recoverable. (3) Impairment loss Type Amount Equipment, furniture and fixtures
10
Software 50 Other intangible fixed assets
2
Total 63 The estimated recoverable amount for equipment, furniture and fixtures is zero reflecting the difficulty of their sale. The estimated recoverable amount for software is based on replacement costs, the average of future cash flow and an evaluation of future cash flows. The estimated recoverable amount for other intangible assets is based on replacement costs.
※3 ―――

― 44 ―
(Calculation Statement Relating to Changes in Consolidated Shareholders’ Equity) First Half of the Fiscal Year Ending May 31, 2007 (June 1, 2006 to November 30, 2006) 1. Matters Relating to Shares Issued and Outstanding
Type of Shares Number of Shares
As of May 31, 2006 Increase Decrease
Number of Shares As of November 30,
2006 Commons shares 433,080 141 — 433,221 (Overview) The increase of 141 shares is attributed to the exercise of warrants during the first half of the fiscal year ending May 31, 2007. 2. Matters Relating the Treasury Stock
Type of Shares Number of Shares
As of May 31, 2006 Increase Decrease
Number of Shares As of November 30,
2006 Commons shares — 17,500 — 17,500 (Overview) To enable the implementation of a flexible capital policy in line with changes in the business environment 3. Matters Relating the New Subscription Rights None. 4. Matters Relating to Dividends (1) Dividend payment amount
Resolution Type of Shares Total Cash
Dividends Paid(Millions of Yen)
Cash Dividend per Common Share (Yen)
Base Date Effective Date
Annual General Meeting of Shareholders held on August 24, 2006
Common shares 779 1,800 May 31, 2006 August 25, 2006
(2) Dividends for which the effective date falls after the first half of the fiscal year ending May 31, 2007 included in dividends for
which the base date falls within the first half of the fiscal year ending May 31, 2007
Resolution Type of Shares Source of Dividend Payment
Total Cash Dividends Paid
(Millions of Yen)
Cash Dividend per Common Share (Yen)
Base Date Effective Date
Board of Directors’ meeting held on January 24, 2007
Common shares
Retained earnings
415 1,000November 30, 2006
February 27, 2007

― 45 ―
Fiscal Year Ended May 31, 2006 (June 1, 2005 to May 31, 2006) 1. Matters Relating to Shares Issued and Outstanding
Type of Shares Number of Shares
As of May 31, 2005 Increase Decrease
Number of Shares As of May 31, 2006
Commons shares 432,560 520 — 433,080 (Overview) The increase of 520 shares is attributed to the exercise of new subscription rights and warrants during the fiscal year ended May 31, 2006. 2. Matters Relating the Treasury Stock None 3. Matters Relating the New Subscription Rights None. 4. Matters Relating to Dividends (1) Dividend payment amount
Resolution Type of Shares Total Cash
Dividends Paid(Millions of Yen)
Cash Dividend per Common Share (Yen)
Base Date Effective Date
Annual General Meeting of Shareholders held on August 25, 2005
Common shares 648 1,500 May 31, 2005 August 26, 2005
(2) Dividends for which the effective date falls in the next period included in dividends for which the base date falls within the
ended May 31, 2006
Resolution Type of Shares Source of Dividend Payment
Total Cash Dividends Paid
(Millions of Yen)
Cash Dividend per Common Share (Yen)
Base Date Effective Date
Annual General Meeting of Shareholders held on August 24, 2006
Common shares
Retained earnings
779 1,800 May 31, 2006 August 25, 2006

― 46 ―
Notes to consolidated statements of cash flows (Millions of yen)
1st Half, FY ended 2006 (June 1, 2005 to November 30, 2005)
1st Half, FY ending 2007 (June 1, 2006 to November 30, 2006)
FY ended 2006 (June 1, 2005 to May 31, 2006)
※1. Relationship between the balance of cash and cash equivalents at period-end and cash and deposits reported in the consolidated balance sheets.
As of November 30, 2005 Cash and deposits 9,407
Time deposits with deposit termexceeding three months (13)
Securities (MMF・FFF) 461
Cash and cash equivalents 9,856
※1. Relationship between the balance of cash and cash equivalents at period-end and cash and deposits reported in the consolidated balance sheets.
As of November 30, 2006 Cash and deposits 10,349
Time deposits with deposit term exceeding three months (81)
Securities (MMF・FFF) 361
Cash and cash equivalents 10,629
※1. Relationship between the balance of cash and cash equivalents at period-end and cash and deposits reported in the consolidated balance sheets.
As of May 31, 2006 Cash and deposits 14,284Time deposits with deposit termexceeding three months (89)
Securities (MMF・FFF) 461
Cash and cash equivalents 14,656

― 47 ―
Segment information 1st Half, FY ended 2006 (June 1, 2005 to November 30, 2005)
(Millions of yen)
Temporary
staffing/Contracting,
Placement/Recruiting
Outplacement Outsourcing Other Total Eliminations and
Corporate Consolidated
Net sales
(1) Sales to outside customers 91,535 1,893 3,934 883 98,247 ― 98,247
(2) Intersegment sales and
Transfers 138 4 130 140 414 (414) ―
Total 91,673 1,898 4,064 1,024 98,661 (414) 98,247
Operating expenses 88,842 1,411 3,953 1,326 95,533 (410) 95,123
Operating income (loss) 2,831 486 110 (302) 3,127 (4) 3,123
Notes: 1. Business segments are classified on the basis of operating markets and service details.
2. Principal components of each business segment
Business segment Principal services
Temporary staffing/Contracting, Placement/Recruiting Temporary staffing and contracting, placement and recruiting, other
Outplacement Outplacement support services
Outsourcing Employee welfare and benefit agency services
Other Computer school operation and management, child-care operation services, recruiting portal site management,
other
1st Half, FY ending 2007 (June 1, 2006 to November 30, 2006) (Millions of yen)
Temporary
staffing/Contracting,
Placement/Recruiting
Outplacement Outsourcing Other Total Eliminations and
Corporate Consolidated
Net sales
(1) Sales to outside customers 105,051 2,581 4,759 809 113,202 ― 113,202
(2) Intersegment sales and
transfers 106 7 159 183 456 (456) ―
Total 105,158 2,589 4,918 992 113,658 (456) 113,202
Operating expenses 101,671 1,786 4,697 1,189 109,345 (456) 108,888
Operating income (loss) 3,487 802 221 (196) 4,313 0 4,314
Notes: 1. Business segments are classified on the basis of operating markets and service details.
2. Principal components of each business segment
Business segment Principal services
Temporary staffing/Contracting, Placement/Recruiting Temporary staffing and contracting, placement and recruiting, other
Outplacement Outplacement support services
Outsourcing Employee welfare and benefit agency services
Other Child-care operation services, recruiting portal site management, other
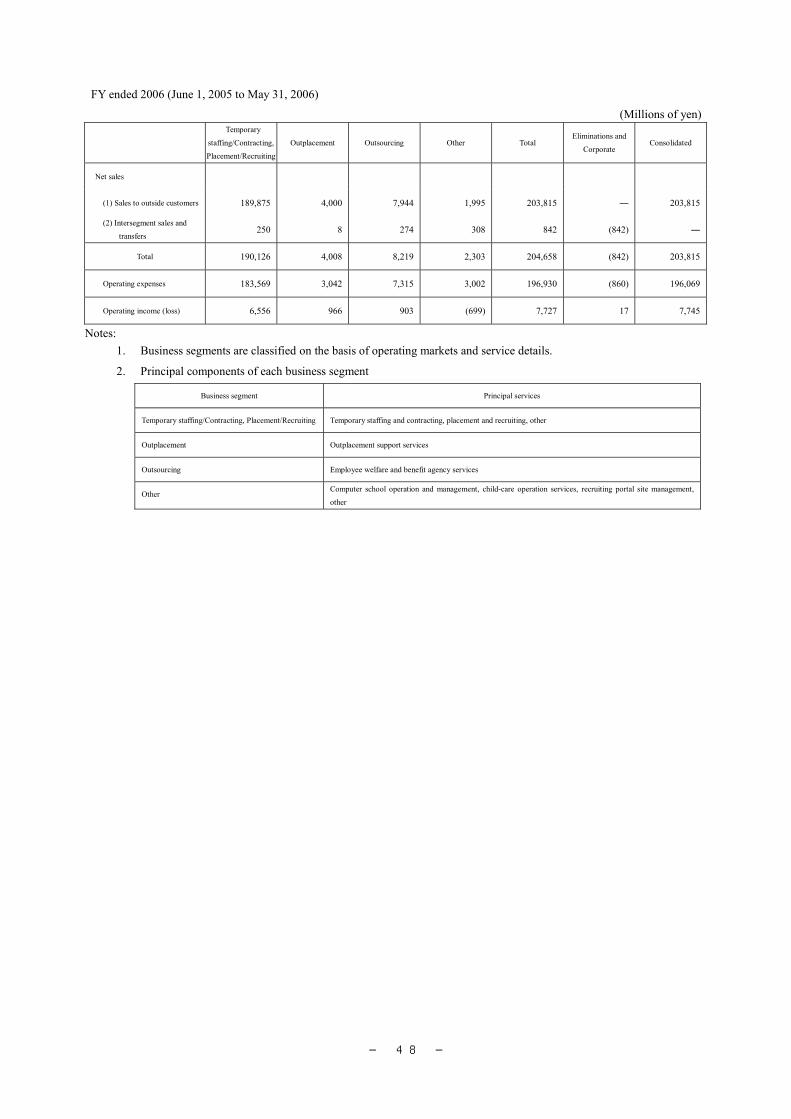
― 48 ―
FY ended 2006 (June 1, 2005 to May 31, 2006)
(Millions of yen)
Temporary
staffing/Contracting,
Placement/Recruiting
Outplacement Outsourcing Other Total Eliminations and
Corporate Consolidated
Net sales
(1) Sales to outside customers 189,875 4,000 7,944 1,995 203,815 ― 203,815
(2) Intersegment sales and
transfers 250 8 274 308 842 (842) ―
Total 190,126 4,008 8,219 2,303 204,658 (842) 203,815
Operating expenses 183,569 3,042 7,315 3,002 196,930 (860) 196,069
Operating income (loss) 6,556 966 903 (699) 7,727 17 7,745
Notes: 1. Business segments are classified on the basis of operating markets and service details.
2. Principal components of each business segment
Business segment Principal services
Temporary staffing/Contracting, Placement/Recruiting Temporary staffing and contracting, placement and recruiting, other
Outplacement Outplacement support services
Outsourcing Employee welfare and benefit agency services
Other Computer school operation and management, child-care operation services, recruiting portal site management,
other
― 49 ―
2. Information on geographic areas
1st Half, FY ended 2006 (June 1, 2005 to November 30, 2005) Since the percentage of total segment sales in Japan exceeds 90%, information on geographic areas is omitted from this report. 1st Half, FY ending 2007 (June 1, 2006 to November 30, 2006) Since the percentage of total segment sales in Japan exceeds 90%, information on geographic areas is omitted from this report. FY ended 2006 (June 1, 2005 to May 31, 2006) Since the percentage of total segment sales in Japan and the percentage of total segment assets in Japan exceed 90%, information on geographic areas is omitted in the report. 3. Overseas sales 1st Half, FY ended 2006 (June 1, 2005 to November 30, 2005) Since the percentage of overseas sales to total consolidated net sales is less than 10%, information on overseas sales is omitted in the report. 1st Half, FY ending 2007 (June 1, 2006 to November 30, 2006) Since the percentage of overseas sales to total consolidated net sales is less than 10%, information on overseas sales is omitted in the report. FY ended 2006 (June 1, 2005 to May 31, 2006) Since the percentage of overseas sales to total consolidated net sales is less than 10%, information on overseas sales is omitted in the report.

― 50 ―
Leases (Millions of yen)
1st Half, FY ended 2006 (June 1, 2005 to November 30, 2005)
1st Half, FY ending 2007 (June 1, 2006 to November 30, 2006)
FY ended 2006 (June 1, 2005 to May 31, 2006)
1. Finance leases other than those that transfer ownership to the lessee
1. Finance leases other than those that transfer ownership to the lessee
1. Finance leases other than those that transfer ownership to the lessee
(1) Acquisition cost, accumulated depreciation and period-end balance of lease assets
Acquisition cost
Accumulated depreciation
Period-end balance
Buildings 43 28 14
Other tangible assets
1,154 664 488
Software 827 518 306
Total 2,024 1,212 810
(1) Acquisition cost, accumulated depreciation and period-end balance of lease assets
Acquisition cost
Accumulated depreciation
Period-end balance
Buildings 38 21 17
Other tangible assets
834 404 430
Software 510 338 171
Total 1,383 764 619
(1) Acquisition cost, accumulated depreciation and period-end balance of lease assets
Acquisition cost
Accumulated depreciation
Period-end balance
Buildings 34 18 15
Other tangible assets
841 459 382
Software 807 569 237
Total 1,683 1,047 636
(2) Period-end balance of unpaid lease expenses Due within one year 386
Due after one year 442
Total 829
(2) Period-end balance of unpaid lease expenses Due within one year 293
Due after one year 341
Total 634
(2) Period-end balance of unpaid lease expenses Due within one year 297
Due after one year 350
Total 648 (3) Lease expense payments, depreciation, interest
expenses Lease expense payment 254
Accumulated depreciation 250
Interest expenses 10
(3) Lease expense payments, depreciation, interest expenses Lease expense payment 188
Accumulated depreciation 180
Interest expenses 7
(3) Lease expense payments, depreciation, interest expenses Lease expense payment 489
Accumulated depreciation 465
Interest expense 19
(4) Method of calculation for amortization Straight-line method over the useful life with no remaining value is used to calculate amortization.
(4) Method of calculation for amortization As left
(4) Method of calculation for amortization As left
(5) Method of calculation for interest The difference between total lease expenses and the acquisition cost of leased assets is considered as the interest portion and the allocation of this interest is calculated by the interest method
(5) Method of calculation for interest As left.
(5) Method of calculation for interest As left.
2. Operating lease Amount of unpaid lease expenses
Due within one year 1,424
Due after one year 923
Total 2,347 Impairment loss: There was no impairment loss allocated in lease assets.
2. Operating lease Amount of unpaid lease expenses
Due within one 894
Due after one year 127
Total 1,021
―――
2. Operating lease Amount of unpaid lease expenses
Due within one year 1,382
Due after one year 323
Total 1,705
―――

― 51 ―
Securities
1st Half, FY ended May 31, 2006 (as of November 30, 2005)
1. Other securities with quoted market value
(Millions of yen)
Type of security Acquisition cost Amount stated on consolidated balance sheet Difference
(1) Stocks 67 513 445
(2) Others 18 17 (0)
Total 86 531 444
2. Other securities without quoted market value
(Millions of yen)
Amount stated on consolidated
balance sheet
Other securities
Non-listed stocks (excludes over-the-counter stocks) 210
Money management fund (MMF) 301
Free financial fund (FFF) 160
1st Half, FY ending May 31, 2007 (as of November 30, 2006)
1. Other securities with quoted market value
(Millions of yen)
Type of security Acquisition cost Amount stated on consolidated balance sheet Difference
(1) Stocks 435 708 272
(2) Others 15 12 (2)
Total 450 720 269
2. Other securities without quoted market value
(Millions of yen)
Amount stated on consolidated
balance sheet
Other securities
Non-listed stocks (excludes over-the-counter stocks) 286
Money management fund (MMF) 200
Free financial fund (FFF) 160

― 52 ―
FY ended May 31, 2006 (as of May 31, 2006)
1. Other securities with quoted market value
(Millions of yen)
Type of security Acquisition cost Amount stated on consolidated balance sheet Difference
(1) Stocks 222 605 382
(2) Others 15 9 (5)
Total 237 614 377
2. Other securities without quoted market value
(Millions of yen)
Amount stated on consolidated
balance sheet
Other securities
Non-listed stocks (excludes over-the-counter stocks) 254
Money management fund (MMF) 301
Free financial fund (FFF) 160
Derivatives
1st Half, FY ended 2006 (June 1, 2005 to November 30, 2005)
1st Half, FY ending 2007 (June 1, 2006 to November 30, 2006)
FY ended 2006 (June 1, 2005 to May 31, 2006)
Since the Company and its consolidated subsidiaries
do not have any derivative transactions, there is no
applicable information.
As left. As left.

― 53 ―
Per share information
(Yen)
1st Half, FY ended 2006 (June 1, 2005 to November 30, 2005)
1st Half, FY ending 2007 (June 1, 2006 to November 30, 2006)
FY ended 2006 (June 1, 2005 to May 31, 2006)
Net assets per share 49,707.75
Net assets per share 49,581.02
Net assets per share 54,599.58
Earnings per share 3,427.77
Earnings per share 4,896.12
Earnings per share 8,292.17
Earnings per diluted share 3,413.85
Earnings per diluted share 4,877.69
Earnings per diluted share 8,221.12
Note: Net assets per share, earnings per share and earnings per diluted share are calculated on the following basis: 1. Net assets per share
(Millions of yen unless otherwise stated)
1st Half, FY ended 2006
(June 1, 2005 to November 30, 2005)1st Half, FY ending 2007
(June 1, 2006 to November 30, 2006)
FY ended 2006 (June 1, 2005 to May 31, 2006)
Total net assets ― 24,573 27,634
Amount deducted from total net assets Minority interests
― 3,961 3,988
Net assets applicable to common stock ― 20,611 23,645
Number of common stock issued and outstanding as of the end of the period (Shares) ― 433,221 433,080
Number of treasury stock (Shares) ― 17,500 ―
Number of common stock used in the calculation of net assets per share (Shares) ― 415,721 ―
2. Earnings per share and earnings per diluted share
(Millions of yen unless otherwise stated)
1st Half, FY ended 2006
(June 1, 2005 to November 30, 2005)1st Half, FY ending 2007
(June 1, 2006 to November 30, 2006)
FY ended 2006 (June 1, 2005 to May 31, 2006)
Earnings per share
Net income 1,482 2,073 3,588
Amount not applicable to shareholders of common stock
― ― ―
Net income applicable to common stock 1,482 2,073 3,588
Average number of shares for the period (Shares) 432,616 423,427 432,782
Earnings per diluted share
Net income adjustment amount 1 4 19
Increase in number of shares of common stock (Shares) 1,289 753 1,352
(Common stock with warrants) (351) (306) (349)
(Common stock acquisition rights as stock options) (938) (447) (1,003)
Since there was no effect on earnings per share after applying calculations adjusted for the dilution of stocks, per diluted share amounts have been omitted.
Type of stock options: 1
(number of the Rights: 3,708 shares)Type of stock options: 3 (number of the Rights: 8,792 shares)
Common stock acquisition rights as stock options resolution at the Annual General Meeting of Shareholders held on August 25, 2005 (number of the Rights: 4,848 shares)

― 54 ―
Important subsequent events
1st Half, FY ended 2006 (June 1, 2005 to November 30, 2005)
1st Half, FY ending 2007 (June 1, 2006 to November 30, 2006)
FY ended 2006 (June 1, 2005 to May 31, 2006)
1. Company and other purchases through the acquisition of shares. At a Board of Directors’ meeting held on October 26, 2005, Pasona resolved to acquire shares of Socio Inc., a subsidiary of ARBEIT-TIMES CO., LTD. A letter of understanding was executed on the same day. At a Board of Directors’ meeting held on January 25, 2006, Pasona resolved to execute and purchase and sale agreement in connection with the aforementioned acquisition of Socio Inc. shares. Pasona executed the subject purchase and sale agreement on the same day. In accordance with the purchase and sale agreement, Pasona acquired Socio Inc. shares on January 31, 2006. At a Board of Directors’ meeting held on February 7, 2006, Pasona resolved to spin off a portion of Socio Inc.’s temporary staffing and contracting operations (effective April 1, 2006). Furthermore, at a Board of Directors’ meeting held on February 22, 2006, the Company resolved to undertake a simple merger with Socio Inc. effective May 16, 2006. (1) Rationale To reinforce Pasona’s temporary staffing and placement businesses within Shizuoka Prefecture and to increase market share. (2) Seller of Socio Inc. shares ARBEIT-TIMES CO., LTD. (3) Name, business activities and profile of company to be purchased i) Company name
Socio Inc. ii) Business activities
Temporary staffing, fee-based permanent placement business
iii) Profile Paid-in Capital: ¥150 million Total assets: ¥964 million (As of February 28, 2005) Employees: 60 (As of August 31, 2005)
(4) Schedule for share acquisition Socio Inc. shares to be acquired on January 31, 2006. (5) Number of shares to be acquired, acquisition amount, percentage shareholding after share acquisition i) Number of shares to be acquired
3,000 shares ii) Acquisition amount
¥1.0 billion iii) Percentage shareholding after share acquisition 100%
――――― 1. Sale of consolidated subsidiary shares (1) Rationale for sale Home Computing Network Inc. was engaged in the management and operation of community-based personal computer (PC) training classes. In an effort to further develop HCN’s business activities, the decision was made to sell the company’s shares to ThreePro Group Inc., a company that is primarily engaged in PC-related support services. (2)Name of purchaser ThreePro Group Inc. (3)Date of share sale June 30, 2006 (4)Name of subsidiary company to be sold Home Computing Network Inc. (5)Business activities of subsidiary company Management and operation of PC training classes. (6)Transaction details with the Company There are no ongoing business transactions between HCN and Pasona. (7)Shareholder before sale 1,124 shares (79.49%) (8)Number of shares to be sold 1,339 shares (shareholding of Pasona and 258 shares transferred by other parties) (9)Shareholding after sale 43 share (3.04%) (10) Sales amount ¥507 million (11) Loss on sale ¥25 million

― 55 ―
1st Half, FY ended 2006 (June 1, 2005 to November 30, 2005)
1st Half, FY ending 2007 (June 1, 2006 to November 30, 2006)
FY ended 2006 (June 1, 2005 to May 31, 2006)
2. Consolidated subsidiary new share issuance
Benefit One Inc., a consolidated subsidiary, resolved at a Board of Directors’ meeting held on February 10, 2006 to issue new shares as a part of its initiative to publicly list on the Second Section of the Tokyo Stock Exchange (proposed listing date: March 3, 2006). Details of the resolution are briefly as follows: (1) Subscription method Public offering (2) Type and number of shares to be issued 1,000 shares of common stock (3) Issue price ¥558,150 per share (4) Issue amount ¥558 million (5) Amount of the issue price credited to paid-in capital ¥279,075 per share (6) Amount to be credited paid-in capital ¥279 million (7) Application date March 2, 2006 (8) Payment date
March 2, 2006 (9) Share certificate delivery date March 3, 2006 (10) Commencement date for the calculation of
dividends applicable to newly issued shares October 1, 2005 (11) Application of funds Capital expenditure and working capital
――――― 2. Acquisition of treasury stock Following a Board of Directors’ meeting held on August 21, 2006, the Company resolved to acquire treasury stock pursuant to Article 156 applied in accordance with Article 165 Paragraph 3 of the Corporation Law. Brief details are outlined as follows. (1) Details of the Board of Directors’ resolution in connection with the acquisition of treasury stock i) Rationale for the acquisition of treasury stock The decision to acquire treasury stock was made to enable the implementation of flexible capital policies in line with changes in the business environment. ii) Method of acquisition The Company placed a buy order outside trading session hours for its common stock (closing price order) via ToSTNet-2 (Tokyo Stock Exchange Trading Network System) iii) Type and number of shares to be acquired A maximum limit of 17,500 shares of common stock iv) Total acquisition amount A maximum amount of ¥4,287 million (2) Acquisition date August 22, 2006 (3) Type and number of shares acquired 17,500 shares of common stock (4) Acquisition amount ¥4,287 million

― 56 ―
5. Production, Orders and Sales 1) Results of production The Company and its consolidated subsidiaries provide human resources services mainly in Temporary staffing / Contracting, Placement / Recruiting, Outplacement, and Welfare Benefit Program Outsourcing. Therefore, due to the characteristics of these services, there is no information in the report under the “Results of production” section. 2) Results of orders For the reason mentioned in the above section, information on “Results of orders” is omitted. 3) Results of sales Sales amounts of each segment are shown below.
1st Half, FY ending 2007 (June 1, 2006 to November 30, 2006)
Consolidated sales (Millions of yen)
Share (%)
YoY (%)
Clerical 56,139 49.6 116.7
Technical 17,155 15.2 112.9
IT/Engineering 10,468 9.3 106.5
Others 17,938 15.8 110.7
Other related 129 0.1 83.5 Temporary staffing / Contracting 101,831 90.0 113.8
Placement / Recruiting 3,220 2.8 156.2
Temporary staffing / Contracting, Placement / Recruiting
105,051 92.8 114.8
Outplacement 2,581 2.3 136.3
Outsourcing 4,759 4.2 121.0
Other 809 0.7 91.6
Total 113,202 100.0 115.2
Notes: 1. Intersegment sales and transfers have been eliminated from the aforementioned figures. 2. Amounts are exclusive of consumption taxes.
Sales amounts of each area in Japan are shown as below. 1st Half, FY ending 2007
(June 1, 2006 to November 30, 2006)
Consolidated sales (Millions of yen)
Share (%)
YoY (%)
Hokkaido and Tohoku 2,459 2.2 103.2Kanto (excluding Tokyo) 11,402 10.1 110.0Tokyo 54,545 48.2 113.8Tokai and Hoku-shinetsu 13,273 11.7 138.1Kansai 19,160 16.9 105.0Chugoku, Shikoku and Kyusyu 10,142 8.9 121.6Overseas 2,218 2.0 160.5
Total 113,202 100.0 115.2 Monthly average number of contracts for registered temporary staff (Total of the Company and its consolidated subsidiaries)
1st Half, FY ended 2006 (June 1, 2005 to November 30, 2005)
1st Half, FY ending 2007 (June 1, 2006 to November 30, 2006)
FY ended 2006 (June 1, 2005 to May 31, 2006)
58,111 62,475 58,956