consolidated financial statements for the year ended · consolidated financial statements for the...
TRANSCRIPT

CONSOLIDATEDFINANCIAL STATEMENTSFOR THE YEAR ENDED31 DECEMBER 2013
LOGO CMKY60 C 20 M 92 C 60 M 40 C 50 Y 88 C 85 Y 27 LUGLIO 2010

2 CONSOLIDATED FINANCIAL STATEMENTS FOR THE YEAR ENDED 31 DECEMBER 2013
CONSOLIDATED STATEMENT OF FINANCIAL POSITION
(in thousands of Euro) NOTES 31 DECEMBER 2013 31 DECEMBER 2012
ASSETS
NON-‐CURRENT ASSETS
Property, plant and equipment 4 80,059 80,276 Property, plant and equipment under lease 4 3,598 5,996 Goodwill 5-‐6 416,141 418,724 Other intangible assets 5 29,064 26,919 Investments accounted for under the equity method 8 29,660 27,881 Other investments 8 3,038 3,041 Non-‐current financial assets 9 10,668 11,455 Other non-‐current assets 9 1,653 1,746 Deferred tax assets 31 24,129 23,550
TOTAL NON-‐CURRENT ASSETS 598,010 599,588
CURRENT ASSETS
Inventories 10 6,194 11,240 Trade receivables and advances to suppliers 11 696,677 655,497 Current tax receivables 31 16,548 24,747 Other current assets 11 29,650 23,690 Current financial assets 12 13,208 11,202 Cash and cash equivalents 12 185,293 51,987 TOTAL CURRENT ASSETS 947,570 778,363 Assets classified as held for sale 13 7,868 130
TOTAL ASSETS CLASSIFIED AS HELD FOR SALE 7,868 130
TOTAL ASSETS 1,553,448 1,378,081

3 CONSOLIDATED FINANCIAL STATEMENTS FOR THE YEAR ENDED 31 DECEMBER 2013
CONSOLIDATED STATEMENT OF FINANCIAL POSITION
(in thousands of Euro) NOTES 31 DECEMBER 2013 31 DECEMBER 2012
SHAREHOLDERS’ EQUITY
Share capital 109,150 109,150 Reserves 167,797 144,221 Retained earnings 33,606 23,540 Profit for the year attributable to equity holders of the parent 13,747 32,574 EQUITY ATTRIBUTABLE TO EQUITY HOLDERS OF THE PARENT 324,300 309,485 Capital and reserves attributable to non-‐controlling interests 1,611 1,772 Profit for the period attributable to non-‐controlling interests 344 728 EQUITY ATTRIBUTABLE TO NON-‐CONTROLLING INTERESTS 1,955 2,500
TOTAL SHAREHOLDERS’ EQUITY 14 326,255 311,985 NON-‐CURRENT LIABILITIES Employee termination indemnity 15 27,785 31,321 Provisions for risks and charges, non-‐current 16 11,715 11,797 Derivatives 17 0 1,222 Long-‐term debt 18 457,074 119,213 Deferred tax liabilities 31 12,156 12,006 Other non-‐current liabilities 8 7
TOTAL NON-‐CURRENT LIABILITIES 508,738 175,566
CURRENT LIABILITIES
Provisions for risks and charges, current 16 24,973 29,297 Trade payables and advances from customers 19 456,420 441,551 Current tax payables 31 227 2,922 Other current liabilities 19 148,535 148,362 Bank borrowings, including current portion of long-‐term debt, and other financial liabilities
18 85,880 268,334
TOTAL CURRENT LIABILITIES 716,035 890,466 Liabilities directly associated with non-‐current assets classified as held for sale
13 2,420 64
TOTAL LIABILITIES DIRECTLY ASSOCIATED WITH NON-‐CURRENT ASSETS CLASSIFIED AS HELD FOR SALE 2,420 64
TOTAL LIABILITIES 1,553,448 1,378,081

4 CONSOLIDATED FINANCIAL STATEMENTS FOR THE YEAR ENDED 31 DECEMBER 2013
CONSOLIDATED STATEMENT OF PROFIT OR LOSS
(amounts in Euro) 31 DECEMBER 2013 31 DECEMBER 2012
Basic earnings per share 0.126 0.298
Diluted earnings per share 0.126 0.298
Basic earnings per share from continuing operations 0.130 0.298
Diluted earnings per share from continuing operations 0.130 0.298
(in thousands of Euro) NOTES 31 DECEMBER 2013 31 DECEMBER 2012
REVENUE
Revenue from sales and services 21 1,077,932 1,070,328
Other revenue 22 2,665 2,301
TOTAL REVENUE
1,080,597 1,072,629 OPERATING COSTS
Costs of raw materials and consumables 23 (173,711) (163,168)
Costs for services and use of third party assets 24 (394,229) (419,981)
Personnel costs 25 (387,757) (365,285)
Other operating costs 26 (8,353) (10,313)
Capitalized internal construction costs 1,838 531
Amortization, depreciation, write-‐downs and write-‐ backs of assets 27 (43,205) (44,388)
Accrual of provisions for risks and charges 28 (11,105) (10,390)
TOTAL OPERATING COSTS
(1,016,522) (1,012,994)
OPERATING INCOME 20 64,075 59,635
FINANCIAL INCOME AND EXPENSES
Share of net profit of associates 8 2,592 3,251
Dividend and income (loss) from sale of investments 28 665 669
Financial income 29 2,713 3,280
Financial charges 30 (32,318) (23,700)
Gains / (losses) on exchange rate 0 (4)
PROFIT (LOSS) BEFORE TAXES
37,727 43,131 Income taxes 31 (23,211) (9,823)
PROFIT (LOSS) FROM CONTINUING OPERATIONS
14,516 33,308 Profit (loss) from discontinued operations 13 (425) (6)
NET PROFIT (LOSS) FOR THE YEAR 14,091 33,302
Net profit (loss) for the year attributable to non-‐ controlling interests (344) (728)
NET PROFIT (LOSS) FOR THE PERIOD ATTRIBUTABLE TO EQUITY HOLDERS OF THE PARENT
13,747 32,574

5 CONSOLIDATED FINANCIAL STATEMENTS FOR THE YEAR ENDED 31 DECEMBER 2013
CONSOLIDATED STATEMENT OF OTHER COMPREHENSIVE INCOME (*)
(in thousands of Euro) NOTES 31 DECEMBER 2013 31 DECEMBER 2012
NET PROFIT FOR THE YEAR 14,091 33,302 Other components of the comprehensive income, which will be subsequently reclassified under profit/loss for the year:
Differences arising from translation of financial statements in foreign currency
0 0
Net gain/(loss) on Cash Flow Hedge 1,222 207 Income taxes on Cash Flow Hedge (336) (57) Net effect on gains (losses) of cash flow hedge 14 886 150 Share of other comprehensive income of entities accounted for using the equity method, which will be subsequently reclassified under profit/loss for the year
14 668 (639)
Other components of the comprehensive income for the YEAR, which will be subsequently reclassified under profit/loss for the year 1,554 (489)
Other components of the comprehensive income, which will not be subsequently reclassified under profit/ loss for the year:
Actuarial gains (losses) on defined benefit plans 1,273 (3,294) Income taxes (350) 906 Net effect of actuarial gains/(losses) 14 923 (2,388) Share of other comprehensive income of entities accounted for using the equity method, which will not be subsequently reclassified under profit/loss for the year
59 (182)
Other components of the comprehensive income for the YEAR, which will not be subsequently reclassified under profit/loss for the year
982 (2,570)
TOTAL PROFIT (LOSS) IN THE STATEMENT OF COMPREHENSIVE INCOME, NET OF TAXES
2,536 (3,059)
TOTAL COMPREHENSIVE INCOME (LOSS), NET OF TAXES 16,627 30,243 Attributable to: Equity holders of the Parent 16,283 29,515 Non-‐controlling interests 344 728

6 CONSOLIDATED FINANCIAL STATEMENTS FOR THE YEAR ENDED 31 DECEMBER 2013
CONSOLIDATED STATEMENT OF CASH FLOWS
(in thousands of Euro) NOTES 31 DECEMBER 2013 31 DECEMBER 2012
Profit before taxes 37,727 43,131 Amortization, depreciation, write-‐downs and (write-‐backs) of assets
43,205 45,649
Accrual to provisions for risks and charges 11,105 10,390
Employee termination indemnity provision 1,788 1,996
Share of net profit of associates (855) (1,268)
Income tax paid (20,608) (29,935)
Cash flow from current operations 72,362 69,963
Decrease (increase) of inventories 4,964 1,349
Decrease (increase) of trade receivables and advances to suppliers (48,588) 16,048
Decrease (increase) of other current assets (6,236) (5,225) Increase (decrease) of trade payables and advances from customers
12,113 (22,302)
Increase (decrease) of other current liabilities 789 580
Payments of employee termination indemnity (4,247) (5,564)
Utilization of provisions (14,780) (13,151)
Change in operating assets and liabilities (55,984) (28,265)
Net cash flow from operating activities 16,378 41,698
Purchase of intangible assets, net of sales 5 (10,430) (8,197)
Purchase of property, plant and equipment 4 (25,259) (35,728) Proceeds from sales of property, plant and equipment 4 673 1,020 Acquisition of investments (194) (22,974) (Decrease) increase of financial assets 1,167 (110)
Net cash used in business combinations 3 (854) (6,796)
Gain/(loss) from sales of assets classified as held for sale 13 (8) (72) Net cash flow used in investing activities (34,905) (72,857) Proceeds from/reimburment borrowings 155,365 40,845
Dividends paid (565) (812) Acquisition/ transfer of minority interests in subsidiaries (1,792) 458
Reclassification of discontinued operations 13 (1,175) 0
Net cash flow from / (used in) financing activities 151,833 40,491
Changes in cash and cash equivalents 133,306 9,331
Cash and cash equivalents at the beginning of the year 51,987 42,656
Changes in cash and cash equivalents 133,306 9,331
Cash and cash equivalents at the end of the year 185,293 51,987
Details of cash and cash equivalents:
Cash and bank accounts 185,293 51,987
TOTAL CASH AND CASH EQUIVALENTS 185,293 51,987
Supplementary information
(in thousands of Euro) NOTES 31 DECEMBER 2013 31 DECEMBER 2012
Interest paid (16,079) (22,769)
Interest received 1,973 1,883
Dividends received 2,402 1,983

7 CONSOLIDATED FINANCIAL STATEMENTS FOR THE YEAR ENDED 31 DECEMBER 2013
CONSOLIDATED STATEMENT OF CHANGES IN SHAREHOLDERS’ EQUITY
(in thousands of Euro)
Share capital
Reserves Retained earnings
Result of the year
Total Shareholders’
equity attributable
to equity holders of the parent
Equity attributable
to non-‐controlling interests
Total shareholder
s’ equity
1 January 2013 109,150 144,221 23,540 32,574 309,485 2,500 311,985
Dividends distribution 0 (566) (566)
Allocation of previous year result 21,040 11,533 (32,574) 0 0 0 Acquisition/ transfer of minority interests in subsidiaries (1,467) (1,467) (325) (1,792)
Total comprehensive income 2,536 13,747 16,283 344 16,627
31 December 2013 109,150 167,797 33,606 13,747 324,300 1,955 326,255
(in thousands of Euro)
Share capital
Reserves Retained earnings
Result of the year
Total Shareholders’
equity attributable
to equity holders of the parent
Equity attributable
to non-‐controlling interests
Total shareholder
s’ equity
1 January 2012 109,150 139,053 20,185 11,124 279,512 13,242 292,754
Dividends distribution 0 (812) (812)
Allocation of previous year result 8,227 2,897 (11,124) 0 0 0 Acquisition/ transfer of minority interests in subsidiaries 458 458 (10,658) (10,200)
Total comprehensive income (3,059) 32,574 29,515 728 30,243
31 December 2012 109,150 144,221 23,540 32,574 309,485 2,500 311,985

8 CONSOLIDATED FINANCIAL STATEMENTS FOR THE YEAR ENDED 31 DECEMBER 2013
EXPLANATORY NOTES
1. GENERAL INFORMATION
The publication of the consolidated Financial Statements of Manutencoop Facility Management S.p.A.
Group (the “MFM Group” or the “Group”) for the year ended 31 December 2013 was authorized by
resolution of the Management Board of 24 March 2014.
The Group is 71.89% owned by Manutencoop Società Cooperativa, with registered office in Zola Predosa
(BO), which in turn exercises management and coordination activities over the Group. On 1 July 2013
the company acquired an additional stake of 7.028% with retention of title (“riserva di proprietà”),
whereby it is vested with related financial and administrative rights, pursuant to and for the purposes of
article 1523 of the Italian Civil Code.
1.1 The business
The Group is active in the management and provision of integrated services, to public and private
customers, targeted at properties, the area and to support so-‐called “Integrated Facility Management”
health care activities. In particular, the MFM Group provides a wide and coordinated range of integrated
services throughout Italy, aimed at rationalising and improving the quality of the non-‐strategic and
auxiliary activities of major private groups, public authorities and health care facilities.
At present the MFM Group is structured around a single operating holding company which combines so-‐
called “traditional” facility management production resources with those related to supporting the
whole Group’s business. At the same time a diversification strategy has been pursued which, through a
series of acquisitions, has placed some “specialist” facility management services beside the historical
core business (hygiene services, green spaces and technical and maintenance services): these services
involve fire prevention and safety products and systems, maintenance services for lifting equipment
(lifts and hoists), building activities and operating lighting systems, in addition to linen rental and
industrial laundering services and surgical instrument sterilization at healthcare facilities.
The Group now operates throughout the whole country through specific companies for each sector:

9 CONSOLIDATED FINANCIAL STATEMENTS FOR THE YEAR ENDED 31 DECEMBER 2013
The Facility Management segment offers a collection of logistic and organizational support services
targeted at users of properties and aimed at optimizing the management of property-‐related activities.
The so-‐called ‘‘traditional’’ Facility Management services provided by the MFM Group include the
following activities:
› Cleaning;
› Technical Services;
› Landscaping.
Cleaning activity includes cleaning and hygiene services, sanitation, disinfection, pest control and rat
extermination, collection, transport and disposal of hospital waste and employs the highest number of
Group employees.
The so-‐called Technical Services encompass the management, running and maintenance services of
property-‐related systems (including heating and air conditioning systems, electrical systems, lifts, fire
prevention and safety systems), including therein:
› design and implementation of redevelopment and adjustment work into line with the safety
legislation;
› design and installation of devices for energy saving and for the reduction of emissions of polluting
agents into the atmosphere.
Finally, a third type of activities attributable to the Facility Management service rendered by the Group
is the so-‐called Landscaping, i.e. a service for the maintenance of green spaces, which include both the
planning and implementation of maintenance of properties’ green areas, and services for the area.
Starting from 2008, as a consequence of the diversification and horizontal integration strategy, the
Group expanded its range of services through a series of acquisitions, providing certain specialist facility
management services alongside its ‘‘traditional’’ Facility Management services, such as:
› installation and maintenance services of elevating systems;
› services related to building security;
› public lighting services;
› mail services;
› document management.
The so-‐called Laundering/Sterilization is an industrial activity given in support of health care activities.
The activity, provided by the MFM Group, in particular through Servizi Ospedalieri S.p.A. and its
subsidiaries, mainly involves (i) the rental and industrial laundering of bed linens, packaged linen and
mattress provider (linen rental and industrial laundering), (ii) Sterilization of linen and (iii) Sterilization of
surgical equipment.
Laundering/Sterilization services provided by the Group also include the following activities:
› collection and distribution of linen in the individual departments;
› management of the linen rooms in the health care facilities;
› supply of disposable items;
› rental of linen with special materials for operating rooms;
› acceptance, treatment, sterilization and redelivery of surgical instruments;
› rental of surgical instruments;
› creation and management of sterilization systems.

10 CONSOLIDATED FINANCIAL STATEMENTS FOR THE YEAR ENDED 31 DECEMBER 2013
The so-‐called Project Management consists of a group of activities involving the technical design,
planning, procurement management and supervision of job orders for the construction, restructuring or
reconversion of properties. The so-‐called Energy Management consists of a group of activities involving
the technical design, construction and operation of photovoltaic and cogeneration plants, from the
feasibility study to completion, as well as the operation and maintenance of systems to provide
customers with energy efficiency solutions.
The Building activities consist of construction projects, which are not particularly significant in respect of
total Group production and which are also carried out on behalf of other Manutencoop Group
companies, as well as, on occasion, to support facility management activities where, as part of non-‐
ordinary maintenance works, small building works are also necessary.
It should be noted that the Management does not consider the Energy Management, Project
Management and Building activities to be strategic any longer. The Group has therefore decided not to
develop those areas of business any further, and it will just manage, in the near future, the
commitments it has already taken on with respect to ongoing contracts with customers until they will be
completed.
2. ACCOUNTING STANDARDS AND BASIS OF PRESENTATION
The consolidated Financial Statements at 31 December 2013 comprise the Consolidated Statement of
financial position, the Consolidated Statement of profit or loss, the Consolidated Statement of other
comprehensive income, the Consolidated Statement of Cash flows, the Consolidated Statement of
changes in Shareholders’ Equity and the related Explanatory Notes.
The consolidated Financial Statements at 31 December 2013 were prepared on a historical cost basis,
except for the derivative financial instruments that have been measured at fair value.
The consolidated Statement of Financial Position sets forth assets and liabilities distinguishing between
current and non-‐current. The consolidated Statement of profit or loss classifies costs by nature, while
the consolidated Statement of other comprehensive income sets forth the result for the period added
with income and expenses, that in accordance with IFRS, are directly recognized in the Shareholders’
Equity. The consolidated Statement of Cash flows has been prepared on the basis of the indirect method
and presented in accordance with IAS 7, distinguishing between cash flow from operating, investing and
financing activities.
The consolidated Financial Statements at 31 December 2013 have been presented in Euro, which is the
Group’s functional currency. All values showed in the statements and in the explanatory notes are in
thousands of Euro, unless otherwise stated.
2.2 Statement of compliance with international accounting standards (IFRS)
The consolidated Financial Statements at 31 December 2013 have been prepared in accordance with the
International Financial Reporting Standards (“IFRS”).
The MFM Group is subject to Letter f) of Article 2 under the Italian Legislative Decree no. 38 of 28
February 2005, which rules the exercise of the options provided for by the Article 5 of Regulation (EC)
1606/2002 about the International Financial Reporting Standards and, therefore, pursuant to Article 3,
paragraph 2, and Article 4, paragraph 5, of the aforesaid Italian Legislative Decree, the Group has
applied the IFRS as adopted by the European Union in the preparation of its consolidated and separate
Financial Statements as from the year ended 31 December 2005.

11 CONSOLIDATED FINANCIAL STATEMENTS FOR THE YEAR ENDED 31 DECEMBER 2013
2.3 Changes in accounting standards and disclosures
The criteria adopted for the preparation of the consolidated Financial Statements are consistent with
those used to prepare the consolidated Financial Statements of the previous year, with the exception of
the aspects detailed below for the standards and interpretations which are newly issued and applicable
from 1 January 2013.
New or revised IFRS and interpretations applicable as from 1 January 2013
A number of other new standards and amendments came into force in the 2013 financial year. These
include IAS 19 -‐ Employee Benefits, IFRS 13 -‐ Fair Value Measurement and the amendments to IAS 1 -‐
Presentation of Financial Statements, but they have had no significant impact on the Group’s
consolidated Financial Statements. The nature and impact of all new standards/amendments are listed
below.
IAS 1 Presentation of Financial Statements – Presentation of items of other comprehensive income (OCI).
The amendment to IAS introduces the grouping together of the items presented in items of other
comprehensive income. The items that might be reclassified in the income statement in future (e.g. net
profit on hedges of net investments, differences arising from translation of financial statements in
foreign currency, net profit on cash flow hedges and net profit/loss from financial assets available for
sale) must now be presented separately from the items that will never be reclassified (e.g. actuarial
gains/losses from defined-‐benefit plans and the revaluation of land and buildings). The amendment only
regards the method of presentation and has had no impact on the Group’s financial position or results.
IAS 12 Deferred Tax: Recovery of Underlying Assets. This amendment clarifies the calculation of deferred
tax on investment property measured at fair value. It introduces the rebuttable presumption that the
carrying amount of an investment property measured using the fair value model set out in IAS 40 must
be recovered through sale and, consequently, that the relative deferred tax should be calculated on a
sale basis. The presumption is rebutted if the investment property is depreciable and is held with the
aim of consuming all the rewards deriving from the investment itself over time instead of recovering
these rewards through sale. The amendment has had no impact on the Group’s financial position, its
results or its disclosures.
IFRS 7 Disclosures – Offsetting financial assets and liabilities – Amendments to IFRS 7. These
amendments require the entity to disclose information regarding rights of set-‐off and related
agreements (e.g. security). The information will give the reader of the financial statements the
necessary information for assessing the effect of offsetting agreements on the entity’s financial position.
The new disclosures are required for all financial instruments subject to offsetting in accordance with
IAS 32, Financial Instruments: Presentation. These disclosures are also required for financial instruments
that are subject to master netting agreements or similar arrangements regardless of whether they are or
are not offset in accordance with IAS 32. These amendments have had no impact on the Group’s
financial position or results.
IAS 19 (revised) – Employee Benefits. IAS 19 (revised) contains substantial amendments to accounting for
defined-‐benefit plans, including actuarial gains and losses, which are now obligatorily recognized under
items of other comprehensive income and are permanently excluded from the income statement. The
expected return on plan assets is no longer recognized in the income statement, while it is necessary to
12 CONSOLIDATED FINANCIAL STATEMENTS FOR THE YEAR ENDED 31 DECEMBER 2013
recognize interest on the net liabilities (assets) of the plan (interest that is to be calculated using the
same rate of interest as that applied to discount the obligation) and past-‐service cost, which is now
recognized in the income statement on the earlier of (i) the date on which the plan is subject to
amendments or curtailments; or (ii) the date on which the related costs for the restructuring or
termination of the employment relationship are recognized. Other amendments include new disclosures,
such as those regarding sensitive qualitative information.
The change to IAS 19 (revised) has had no impact on the net obligation of the defined-‐benefit plan
arising from the difference in accounting for interest on the plan assets and past service cost inasmuch
as, in the past, the MFM Group already chose the option of accounting for actuarial gains and losses
under items of other comprehensive income.
IFRS 13 Fair Value Measurement. IFRS 13 introduces unequivocal guidance for all fair value
measurements under IFRS. IFRS 13 does not affect cases in which the utilisation of fair value is required,
but provides guidance on how to measure fair value in the context of IFRS when the application of fair
value is required or allowed by these international accounting standards. The application of IFRS 13 has
not had any material impact on the fair value measurements carried out by the Group. IFRS 13 also
requires specific disclosures regarding fair value, some of which replace the information requirements at
present envisaged by other standards, including IFRS 7, Financial Instruments: Disclosures.
IFRIC 20 Stripping Costs in the Production Phase of a Surface Mine. This interpretation applies to
stripping costs in the production phase of a surface mine. The interpretation regards accounting for the
benefits arising from stripping activities. The new interpretation has not had any impact on the Group’s
consolidated Financial Statements.
Finally, in December 2013, the IASB issued two series of amendments to IFRS (series 2010-‐2012 and
series 2011-‐2013). The Annual improvement of international standards is the instrument by which the
IASB introduces amendments or improvements to the standards that are already being applied, thus
promoting the ongoing review of the accounting policies of the IAS adopters. Some amendments will be
immediately applicable and, in particular, those regarding IFRS 1 First-‐time Adoption of International
Financial Reporting Standards and, partly, IFRS13 Fair Value Measurement. The remaining
improvements will be applicable as from 1 June 2014 and concern IFRS2 Share-‐based Payment, IFRS3
Business Combinations, IFRS8 Operating Segments, IFRS13 Fair Value Measurement, IAS16 Property,
Plant and Equipment, IAS24 Related Party Disclosures, IAS38 Intangible Assets and IAS40 Investment
Property.
New or revised IFRS and interpretations applicable from subsequent years and not adopted by
the Group in advance
The Group did not provide for the early adoption of any standard, interpretation or improvement issued
but still not obligatorily in force. More specifically, the following accounting standards must be applied
starting from 1 January 2014, but on a voluntary basis starting from 1 January 2013:
› IFRS 10 – Consolidated Financial Statements. The new accounting standard redefines the concept of
control, expanding its scope and introducing new application rules for the identification of
companies that must be consolidated. New accounting rules are also established for the drafting of
the consolidated financial statements, replacing the so-‐called ‘‘proportional method’’.
› IFRS 11 – Joint Arrangements. The new standard requires an evaluation of the substance of entities
that were ‘‘jointly-‐controlled entities’’ according to IAS 31 and provides operating guidelines for

13 CONSOLIDATED FINANCIAL STATEMENTS FOR THE YEAR ENDED 31 DECEMBER 2013
performing said valuation. The accounting method used for the consolidation of joint-‐ventures is
the equity method.
› IFRS 12 -‐ Disclosure of Interests in Other Entities. The new standard provides a general overview of
the information relating to interests in other entities, such as joint arrangements, equity
investments in subsidiaries, associates and other interests not falling within the consolidation area.
Following the introduction of the new IFRS11 and IFRS12, IAS 28 has been renamed Investments in
Associates and Joint Ventures and describes the application of the equity method to investments in joint
ventures in addition to associates. The Group is currently analysing the standards listed above and
assessing their impact on its Consolidated Financial Statements. Finally, note the amendments to IAS 32
Offsetting financial assets and liabilities. The amendments clarify the meaning of “currently has a legally
enforceable right of set-‐off', as well as the application of the IAS 32 offsetting criteria to settlement
systems (e.g. central clearing house systems) which apply gross settlement mechanisms that are not
simultaneous. These amendments should not have any impact on the Group’s financial position or results.
2.4 Discretionary assessments and significant accounting assumptions
The preparation of the consolidated Financial Statements requires Management Boards to make
discretionary assessments, estimates and assumptions that affect the amounts of revenues, costs, assets
and liabilities, and the indication of contingent liabilities at the date of the financial statements.
However, the uncertainty of these assumptions and estimates could lead to outcomes which may
require a significant adjustment to the carrying amount of said assets and/or liabilities in the future.
Discretionary assessments
The main decisions taken by the Directors, on the basis of discretionary assessments (excluding those
relating to accounting estimates), in the application of the accounting standards of the Group, with a
significant effect on the values recognized in the accounts are the following:
› The adoption, starting from 2007, of the continuity of values principle for the recognition of
business combinations under common control.
› Application of this principle gives rise to the recognition in the statement of financial position of
values equal to those that would be recorded if the companies involved in the business
combination had always been combined. The net assets of the acquiree and of the acquiring entity
are therefore recorded on the basis of the carrying amounts included in their respective accounts
before the transaction.
› The application, starting from 2005 which was the first year in which the Group drafted
consolidated financial statements in compliance with IAS/IFRS, of the proportional consolidation
method to companies held under joint ventures with other shareholders, in accordance with IAS 31.
Uncertainty of estimates
The key assumptions regarding the future and other significant sources of uncertainty relating to
estimates as at the period ending date of the Consolidated Financial Statements are detailed below.
Impairment test
Goodwill is subject to impairment test at least annually, or more frequently if there is an indication of
potential impairment in the carrying amounts. This requires an estimate of the value in use of the CGU

14 CONSOLIDATED FINANCIAL STATEMENTS FOR THE YEAR ENDED 31 DECEMBER 2013
(cash-‐generating unit) to which the goodwill is allocated, in turn based on an estimate of expected cash
flows from the CGU and their discounting on the basis of a suitable discount rate.
At 31 December 2013, the carrying amount of the goodwill stood at € 416,141 thousand (31 December
2012: € 418,724 thousand). More details are given in note 5.
Recognition of the present value of liabilities for Put Options on minority shares of subsidiaries
and of the present value of liabilities for Earn-‐outs on acquisitions made
The Group holds majority interests in subsidiaries in relation to which the minority shareholders hold
PUT options, which can be exercised in the future at prices determined on the basis of certain
parameters that require estimates from management for the purposes of reliable valuation.
Similarly, the contract for the purchase of certain majority interests in subsidiaries provides for the
transferors, i.e. the current minority shareholders, to be granted an earn-‐out upon the fulfilment of
given conditions on a certain future date. In this case, the correct recognition in the financial statements
of the related liability requires management to make some estimates to determine the expected
relevant parameters.
Other financial position items
Management also needed to use estimates in determining:
› Deferred tax assets, in particular relating to the likelihood of these being reversed in the future;
› Accruals to bad debt provision and provisions for risks and charges;
› main assumptions applied to the actuarial valuation of the TFR (employee termination indemnity),
such as the future turnover rate and discount financial rates;
› Inventories of contract work in progress, particularly in relation to the total amount of estimated
final costs to be used to determine the percentage of completion.
Consolidation principles
The Consolidated Financial Statements include the financial statements of Manutencoop Facility
Management S.p.A. (the ‘‘Parent Company, “MFM S.p.A.” or simply “MFM”) and its subsidiaries,
prepared as at 31 December 2013. The financial statements of the subsidiaries have been prepared by
adopting for each closing date the same accounting standards as those applied for the parent company.
All Intra-‐Group balances and intercompany transactions, including unrealized profits and losses arising
from intra-‐Group transactions, which are recognized under assets, are eliminated in full.
Subsidiaries are consolidated on a line-‐by-‐line basis starting from the acquisition date, i.e. the date on
which the Group acquires control, and are deconsolidated on the date in which control is transferred
out of the Group. Acquisitions of subsidiaries, with the exception of those deriving from combinations of
entities subject to joint control, are accounted for using the purchase method. This involves the
allocation of the cost of the business combination to the fair values of assets, liabilities and contingent
liabilities acquired at the acquisition date and the inclusion of the result of the acquiree starting from
the date of acquisition until the end of the fiscal year. Joint-‐ventures with other shareholders are
consolidated on a proportional basis, whereas associates are accounted for under equity method.
Changes in the Group’s ownership interest in a subsidiary that do not result in a loss of control are
accounted for as equity transactions. Minority interests represent the portion of profits or losses and
net assets not held by the Group and are disclosed under a separate item in the consolidated Statement
of profit or loss and in the Consolidated Statement of Financial Position under Equity items, separately
from the Group’s Equity.
The consolidation area as at 30 December 2013 is shown below.

15 CONSOLIDATED FINANCIAL STATEMENTS FOR THE YEAR ENDED 31 DECEMBER 2013
16 CONSOLIDATED FINANCIAL STATEMENTS FOR THE YEAR ENDED 31 DECEMBER 2013
Below are reported the most significant changes within the Group:
› On 6 April 2013, the quotaholders' meeting of MIA Servizi Torino S.r.l. (a single quotaholder
company) resolved to change its company name to MIA Elevatori S.r.l. and moved its registered
office from Turin (TO) to Modena (MO).
› On 12 April 2013 the shareholders’ meeting of Energyproject S.p.A. (a sole-‐shareholder company)
resolved to transform the company into a Limited Liability Company (“Società a responsabilità
limitata”). The resolution became effective on 26 April 2013. On 5 July 2013 Energyproject S.r.l. also
acquired from Verde Vivo S.a.r.l. (a company incorporated under Luxembourg law) the total quota
in Mowbray S.r.l., a company incorporated under Italian law and with registered office in Milan,
which is active in the construction and operation of photovoltaic projects and plants. Currently this
company is the sole owner of the photovoltaic plant named “Modena Fiere Pensiline”, which is
operated by the same and which has been built and developed by Energyproject in its capacity as
an EPC contractor. The transfer of the quotas took place at an overall price of € 705 thousand.
› 5 July 2013 saw the incorporation of United Facility Solutions S.a., based in Brussels, of which MFM
S.p.A. as founder shareholder, together with its French partner Atalian Holding Development and
Strategy S.a.r.l. and its Spanish partner Clece S.a.. The aim of this special purpose vehicle is to foster
a European alliance among leading companies in their respective national facility management
markets that can capture market shares by acquiring customers with cross-‐border distribution
businesses, at the moment out of reach of single members or associates. The main commercial
targets are multinationals and transnational public customers (e.g. the European Community, the
United Nations, etc.).
› On 24 July 2013 the subsidiary MIA S.p.A. signed a deed of sale with the minority shareholders of
Lenzi S.p.A. for all the shares they held, partially amending and supplementing the investment
agreement executed during 2010. The new agreement set the price for the transfer of the shares at
€ 8.6 million, bearing interest at a rate of 7.9%. On 15 November, it was also agreed to provide for a
partial payment of € 962 thousand, plus interest of € 210 thousand, which accrued from the date of
execution of the agreement dated July 2013. After the execution of this agreement, MIA S.p.A.
acquired total control over Lenzi S.p.A.. Again on 24 July, 2013 MIA S.p.A. also signed a preliminary
agreement for the purchase of a business unit organised and managed by Lenzi Impianti S.r.l., a
company which manufactures, installs and sells elevators and hoists. The effective date of the
transfer was set as 1 August 2013. The price was initially set at € 820 thousand, subject to
adjustments, and it is to be paid within October 2014.
› 29 July 2013 saw the incorporation of EOS Hijyen Tesis Hizmetleri Saglik Insaat Servis Muhendislik
A.S., a company incorporated under Turkish law, with a share capital of 250,000 Turkish Liras, of
which the subsidiary Servizi Ospedalieri S.p.A. holds a stake of 50%. This project envisages a
partnership with a Turkish operator also working in the local healthcare sector in order to take part
in two projects for the construction and operation of hospital sterilization systems, with the
prospect of possible further activities in the Turkish public and private healthcare sterilization
sector.
› On 11 October 2013 the subsidiary Gruppo Sicura S.r.l. acquired the minority interests held in the
direct subsidiaries Sedda S.r.l., Securveneta S.r.l., Mako Engineering S.r.l., Antincendi Piave S.r.l. and
Sicurama S.r.l., thus becoming the sole quotaholder. The transaction, which entailed the Group’s
commitment to a total outlay of € 1.8 million (€ 358 thousand of which already paid to the
respective sellers), took its place in the broader-‐based corporate simplification project that will
involve the Sicura sub-‐group companies in the coming months.
17 CONSOLIDATED FINANCIAL STATEMENTS FOR THE YEAR ENDED 31 DECEMBER 2013
Lastly, mergers within the Group took place during the financial year, with a view to corporate
streamlining. In particular:
› On 13 December the merger of PIB S.r.l. by incorporation into Manutencoop Private Sector
Solutions S.p.A. became effective.
› On 31 December the merger of Lenzi S.p.A. by incorporation into MIA S.p.A. became effective.
› The month of December saw the filing of the deeds of merger of the companies Sedda S.r.l.,
Securveneta S.r.l., Mako Engineering S.r.l., Antincendi Piave S.r.l. and Sicurama S.r.l. by
incorporation into Sicura S.r.l., the effective date of which is set at 1 January 2014.
2.5 Summary of the main accounting criteria
Equity investments in joint ventures
The Group participates in numerous joint ventures classified as companies under joint control. A joint
venture is a contractual agreement whereby two or more parties undertake an economic activity subject
to joint control; a jointly controlled company is a joint venture that involves the setting up of a separate
company in which each participant holds interests.
Joint control is deemed to exist when 50% is held.
The Group consolidates its equity investments in joint ventures using the proportional method, adding
on a line by line basis its share in each asset, liability, revenues and costs of the jointly controlled
company to the respective items in the consolidated financial statements. Joint ventures draft financial
statements for the same financial year as the Parent Company and apply the same accounting standards.
Any inconsistencies between the accounting standards applied are corrected through adjustments.
When the Group contributes or sells assets to the joint venture, the recognition of profits or losses
deriving from the transaction reflects the content of the transaction itself. When the Group purchases
goods or services from the joint venture, it does not record its share of profit deriving from the
transaction until it resells said good or service to an independent third party.
Proportional consolidation of the joint venture is ended on the date on which the Group ceases to have
joint control over said entity.
Conversion of foreign currency items
The financial statements are presented in Euro, the Group’s functional currency.
Statements of financial position and income statements stated in foreign currency are converted to Euro
using the year-‐end exchange rates for financial statement items and average exchange rates for items in
the income statement.
Differences arising from the conversion of opening shareholders’ equity at year-‐end exchange rates are
charged to the currency conversion reserve, together with the difference emerging from the conversion
of the result for the period at year-‐end exchange rates with respect to the average exchange rate. The
conversion reserve is reserved to the income statement at the moment of the sale or liquidation of the
company that set up said reserve.
Property, plant and equipment
Property, plant and machinery are recorded at historical cost, net of ordinary maintenance costs, less
the associated accumulated depreciation and accumulated impairment losses. This cost includes the
costs for the replacement of part of the machinery and plants at the moment they are incurred if they
conform to the recognition criteria.

18 CONSOLIDATED FINANCIAL STATEMENTS FOR THE YEAR ENDED 31 DECEMBER 2013
Depreciation is calculated on a straight line basis in line with the estimated useful life of the asset,
starting from the date the asset becomes available for use, until the date it is sold or disposed of.
The carrying amount of the properties, plant and machinery is subject to impairment testing when
events or changes suggest that the carrying amount may not be recoverable.
A tangible asset is eliminated from the financial statements at the moment of sale or when no future
economic benefits are expected from its use or disposal. Any profits or losses (calculated as the
difference between net income from the sale and the carrying amount) are included in the income
statement in the year of the aforementioned elimination.
The residual value of the asset, useful life and method applied are reviewed annually and adjusted, if
necessary, at the end of each financial year.
The useful life of the various classes of tangible assets is estimated as shown below:
Types of plant and machinery Useful Life
Plant and machinery, maintenance and landscaping 11 years
Plant and machinery and construction of properties From 6.5 to 10 years
Telephone systems 4 years
Properties 33 years
Equipment for cleaning/landscaping activities 6.5 years
Equipment for technological system management 3 years
Equipment for building construction and maintenance 2.5 years
Other industrial and commercial equipment 10 years
Laundry equipment 8 years
Linen From 2.5 to 4 years
Vehicles From 4 to 5 years
Office furniture and equipment From 5 to 8 years
Improvements to third party assets (including plant and machinery) < between useful life and lease duration
The plant and machinery category includes not only plant and machinery in the strictest sense, but also
equipment, motor vehicles, office machines and furniture.
Financial charges deriving from the purchase is booked to the income statement except in the case in
which it is directly attributable to the acquisition, construction or production of an asset which justifies
their capitalisation (qualifying asset), in which case they are capitalised.
A qualifying asset is an asset that requires a certain period of time to be ready for use.
The capitalisation of financial charges ceases when all the activities needed to make the qualifying asset
ready for use have been completed.
Extraordinary maintenance expenses are only included in the carrying amount of the asset when the
company is likely to receive the associated economic benefits in the future and the cost can be reliably
measured. The costs of repairs, maintenance or other operations to ensure the functioning of the assets
are charged to the income statement in the year in which they are incurred.
Improvements to third party assets are classified, on the basis of the nature of the cost incurred, under
tangible fixed assets when they meet the capitalisation criteria set forth by IAS 16. The depreciation
period corresponds to the lower of the residual useful life of the tangible fixed asset and the residual
duration of lease.

19 CONSOLIDATED FINANCIAL STATEMENTS FOR THE YEAR ENDED 31 DECEMBER 2013
Goodwill
Goodwill, acquired in a business combination, is initially valued at cost, represented the excess of the
cost of the business combination with respect to the share pertaining to the Group in the net fair value
relating to the identifiable values of assets, liabilities and contingent liabilities. After the initial
recognition, goodwill is valued at cost less any accumulated impairment losses. Goodwill is subject to an
analysis of consistency on an annual basis, or more frequently if events or changes are identified which
may give rise to impairment losses.
For the purposes of this analysis of consistency, goodwill is allocated, from the date of acquisition, when
the allocation is possible without arbitrariness, to each of the cash-‐generating units of the Group which
believe that they will benefit from the synergies of the acquisition, irrespective of the allocation of other
assets or liabilities to said units. Each unit to which goodwill is allocated:
› represents the lowest level, within the Group, at which goodwill is monitored for internal
management purposes; and
› is not larger than the segments identified on the basis of either the primary of secondary
presentation layout as regards disclosures on the Group’s operating segments, based on IFRS 8 -‐
Operating Segments.
Impairment is determined by defining the recoverable value of the cash-‐generating unit (or group of
units) to which goodwill is allocated. When the recoverable value of the cash-‐generating unit (or group
of units) is lower than the carrying amount, an impairment loss is recorded.
The value of goodwill previously written down cannot be restored.
Other intangible assets
Intangible assets acquired separately are initially capitalised at cost, while those acquired through
business combinations of companies not subject to joint control are capitalised at fair value on the date
of acquisition. After initial recognition, intangible assets are recorded at cost net of amortisation and
accumulated impairment losses.
The useful life of the intangible assets is finite or indefinite.
Intangible assets with a finite useful life are amortised over their useful life and subject to consistency
tests when there is an indication of potential impairment losses. The amortisation period and method
applied are reviewed at the end of each financial year or more frequently if necessary. Changes in the
expected useful life or the methods with which the future economic benefits of the intangible asset are
achieved by the Group are recorded by modifying the amortisation period or method, as necessary, and
treated as changes in the accounting estimates. The amortisation charges of intangible assets with a
finite useful life are recorded in the income statement under the cost category ‘amortisation, write-‐
downs and write-‐backs of assets’.
The Group did not record any intangible assets with an indefinite useful life, with the exception of
goodwill.
The principles the Group applied for intangible assets are summarised below:
Concessions, licences, trademarks and similar Other intangible assets
Detail Software and Trademarks Contractual relations with customers
Useful Life Finite Finite

20 CONSOLIDATED FINANCIAL STATEMENTS FOR THE YEAR ENDED 31 DECEMBER 2013
Concessions, licences, trademarks and similar Other intangible assets
Method used
Amortisation in a straight line basis over the shortest time span between: legal duration of the right expected period of use.
Amortisation in proportion to consumption of backlog.
Produced internally or purchased Purchased Acquired in business combination.
Impairment tests / tests on recoverable value
Yearly or more frequently when there are signs of impairment.
Yearly or more frequently when there are signs of impairment.
Profits or losses deriving from the disposal of an intangible asset are measured as the difference
between the net sales revenue and the carrying amount of the asset, and are recognised in the income
statement at the moment of disposal.
Equity investments in associates
The Group’s equity investments in associates are valued using the equity method. An associate is a
company over which the Group exercises a significant influence and is not classified as a subsidiary or
joint venture.
An associate is a company in which a shareholding of 20% or more is held.
According to the equity method, the equity investment in an associate is recorded in the financial
statement at cost, increased by changes, after the acquisition, in the Group’s share of the associate’s net
assets. Goodwill relating to the associate is included in the carrying amount of the equity investment
and not subject to amortisation. Following application of the equity method, the Group determines
whether it is necessary to record any additional impairment losses with reference to the Group’s net
equity investment in the associate. The income statement reflects the Group’s share of the associate’s
result for the year. In the event in which the associate records adjustments directly in shareholders’
equity, the Group recognises its share, and presents this, where applicable, in the statement of changes
in shareholders’ equity.
In the majority of cases, the end of the associate’s financial year is the same as that of the Group. Where
this does not occur, in most cases, the associates prepare accounting statements at the close of the
Group’s financial year.
The accounting standards used conform to those used by the Group, for transactions and events of the
same nature and in similar circumstances.
Impairment of assets
At the close of each financial year, the Group assesses whether there are any indicators of impairment
of assets. In this case, or in the event an annual impairment test is required, the Group prepares an
estimate of the recoverable value. The recoverable value is the higher of the fair value of an asset or
cash-‐generating unit net of sales costs and its value in use is determined per individual asset, except
when said asset does not generate cash flows that are fully independent from those generated by other
assets or groups of assets. If the carrying amount of an asset is higher than its recoverable value, said
asset has been impaired and is subsequently written down to its recoverable value. In calculating the
value in use, the Group discounts estimated future cash flows at the current value by using a pre-‐tax

21 CONSOLIDATED FINANCIAL STATEMENTS FOR THE YEAR ENDED 31 DECEMBER 2013
discount rate which reflects the market valuations on the time value of money and the specific risks of
the asset.
Impairment losses of operating assets are recorded in the income statement under the category
‘amortisation, write-‐downs and write-‐backs of assets’.
At the close of each financial year, the Group also assesses the existence of indications that the
impairment losses recorded previously no longer exist (or have fallen) and, if said indications exist,
estimate the recoverable value. The value of an asset previously written down can only be restored if
there have been changes to the estimates used to calculate the recoverable value of the asset following
the latest recognition of an impairment loss. In said case, the carrying amount of the asset is adjusted to
the recoverable value, without, however, the increased value exceeding the carrying amount that would
have been determined, net of amortisation, if no impairment loss had been recognised in the preceding
years. Any write-‐back is recorded as income in the income statement, in the same category in which the
write-‐down was recorded, except where the asset is recognised in a revalued amount, in which case the
write-‐back is treated as a revaluation. After a write-‐back has been recorded, the amortisation charge of
the asset is adjusted in future periods, in order to break down the modified carrying amount, net of any
residual values, on a straight line basis over the remaining useful life.
Financial assets
IAS 39 makes provision for the following types of financial instruments:
› financial assets at fair value with changes booked to the income statement, a category which
includes the financial assets held for trading, i.e. all assets acquired for short-‐term sale;
› loans and receivables, defined as non-‐derivative financial assets with fixed or determinable
payments that are not listed on an active capital market;
› investments held to maturity, i.e. financial assets that are not derivative instruments and which are
characterised by fixed or determinable payments on maturity for which the owner has the intention
and capacity to hold them in the portfolio to maturity.
› available-‐for-‐sale financial assets, i.e. financial assets, excluding derivative financial instruments,
which have been designated as such or are not classified in one of the other three previous
categories.
All financial assets are initially recorded at fair value, increased, in the event of assets other than those
at fair value in the income statement, by accessory charges. Following the initial recognition, the Group
determines the classification of its financial assets and, where appropriate and permitted, reviews said
classification at the close of each financial year.
The financial assets held by the Group in the year just closed, equal to those held in the previous year,
relate exclusively to the two categories ‘loans and receivables’ and ‘available-‐for-‐sale financial assets’.
The valuation criteria applied by the Group are the following:
Loans and receivables
Loans and receivables are recorded according to the amortised cost criterion using the effective
discount rate method. Profits and losses are booked to the income statement when the loans and
receivables are eliminated for accounting purposes or when impairment losses occur, plus through the
amortisation process.
22 CONSOLIDATED FINANCIAL STATEMENTS FOR THE YEAR ENDED 31 DECEMBER 2013
Available-‐for-‐sale financial assets
Available-‐for-‐sale financial assets, following initial recognition at cost, must be valued at fair value and
profits and losses must be recorded in a separate shareholders’ equity item until the assets are
eliminated for accounting purposes or until it has been verified that they have been impaired; profits or
losses accumulated up until that moment in shareholders’ equity are then charged to the income
statement.
For the year closed however, as in the previous year, the Group classifies solely shareholdings of lower
than 20% in this category, which are valued at cost if the calculation of the fair value is not reliable. In
particular, consortium companies and consortia, which are not listed on regulated capital markets and
whose objective is to regulate relations as part of temporary associations of companies established for
the operational purposes of management of service contracts, are valued at cost, represented by the
portion of subscribed share capital.
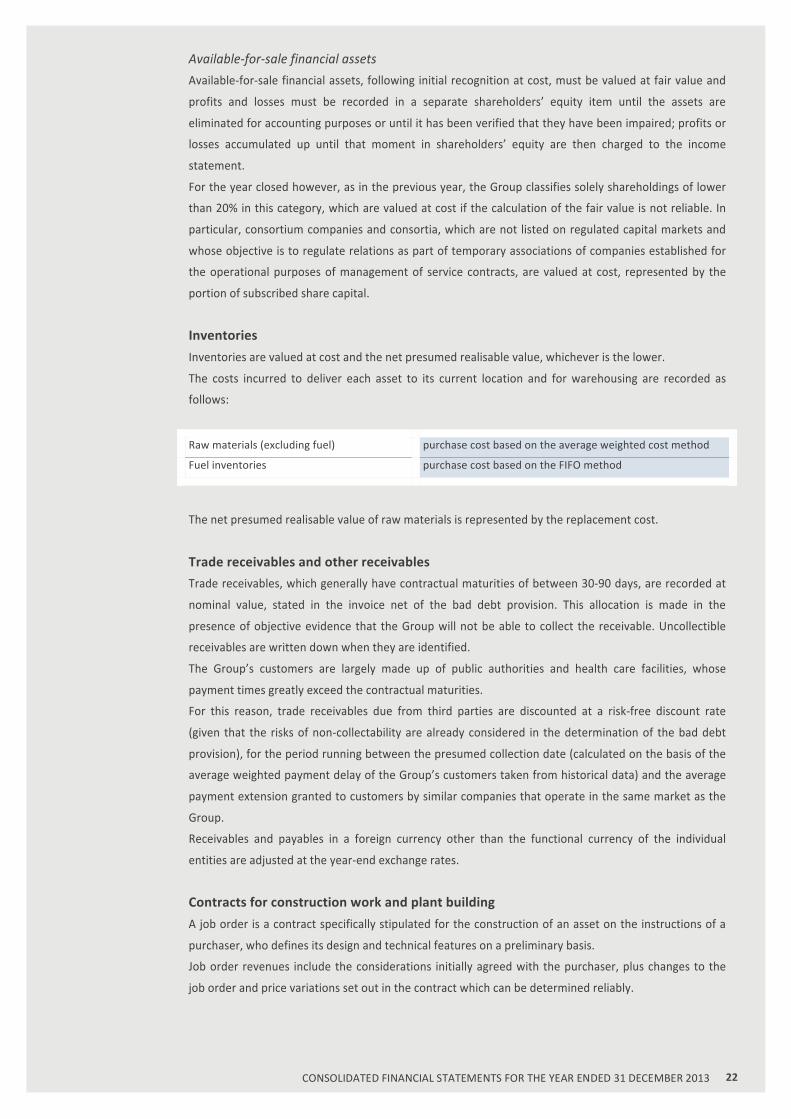
Inventories
Inventories are valued at cost and the net presumed realisable value, whichever is the lower.
The costs incurred to deliver each asset to its current location and for warehousing are recorded as
follows:
Raw materials (excluding fuel) purchase cost based on the average weighted cost method
Fuel inventories purchase cost based on the FIFO method
The net presumed realisable value of raw materials is represented by the replacement cost.
Trade receivables and other receivables
Trade receivables, which generally have contractual maturities of between 30-‐90 days, are recorded at
nominal value, stated in the invoice net of the bad debt provision. This allocation is made in the
presence of objective evidence that the Group will not be able to collect the receivable. Uncollectible
receivables are written down when they are identified.
The Group’s customers are largely made up of public authorities and health care facilities, whose
payment times greatly exceed the contractual maturities.
For this reason, trade receivables due from third parties are discounted at a risk-‐free discount rate
(given that the risks of non-‐collectability are already considered in the determination of the bad debt
provision), for the period running between the presumed collection date (calculated on the basis of the
average weighted payment delay of the Group’s customers taken from historical data) and the average
payment extension granted to customers by similar companies that operate in the same market as the
Group.
Receivables and payables in a foreign currency other than the functional currency of the individual
entities are adjusted at the year-‐end exchange rates.
Contracts for construction work and plant building
A job order is a contract specifically stipulated for the construction of an asset on the instructions of a
purchaser, who defines its design and technical features on a preliminary basis.
Job order revenues include the considerations initially agreed with the purchaser, plus changes to the
job order and price variations set out in the contract which can be determined reliably.
23 CONSOLIDATED FINANCIAL STATEMENTS FOR THE YEAR ENDED 31 DECEMBER 2013
When the result of the job order can be determined reliably, the job orders are valued on the basis of
the percentage completion method. The progress status is determined by making reference to the costs
of the job order incurred up to the balance sheet date as a percentage of total estimated costs for each
job order. The percentage of completion determined in this manner is then applied to the contract price
in order to determine the value of work in progress, classified under “Trade receivables”. When the
costs of the job order are likely to exceed total revenues, the expected loss is recorded immediately as a
provision. Should the amount of the contract price already invoiced exceed the estimated value of work
in progress, it must be recognised as a payable for the portion exceeding the value of the same and, as
such, must be classified under "Advances from customers ".
Cash and cash equivalents
Cash and cash equivalents and short-‐term deposits in the financial statement include cash at hand and
sight and short-‐term deposits, in the latter case with an original maturity of no more than three months.
Loans
All loans are initially recorded at the fair value of the consideration received net of accessory charges
involved in acquiring the loan.
After initial recognition, loans are valued according to the amortised cost criterion using the effective
interest rate method.
All profits or losses are recognised in the income statement when the liability is extinguished, plus
through the amortisation process.
Elimination of financial assets and liabilities
Financial assets
A financial asset (or, where applicable, part of a financial asset or parts of a group of similar financial
assets) is derecognised from the financial statements when:
› the contractual rights over cash flows deriving from financial assets have expired;
› the Group has transferred the financial asset (transferring the right to receive cash flows from the
asset or retaining the right to receive these but assuming the contractual obligation to pay them in
full and without delay to a third party) and has transferred substantially all risks and rewards of
ownership of the financial asset.
If, as a result of the transfer, a financial asset is completely eliminated, but the result is that the Group
obtains a new financial asset or assumes a new financial liability, the Group records the new financial
asset, financial liability or liability originating from service at fair value.
Financial liabilities
A financial liability is derecognised from the financial statements when the obligation underlying the
liability is extinguished, cancelled or fulfilled.
In cases where an existing financial liability is replaced by another of the same provider, under
essentially different conditions, or the conditions of an existing liability are essentially modified, said
exchange or modification is treated as derecognition of the original liability and the recognition of a new
liability, and any differences in the carrying amounts are booked to the income statement.
Impairment of financial assets
At the end of each financial year, the Group assesses whether a financial asset or group of financial
assets has incurred any impairment loss.
24 CONSOLIDATED FINANCIAL STATEMENTS FOR THE YEAR ENDED 31 DECEMBER 2013
Assets valued according to the amortised cost criteria
If objective evidence exists that a loan or receivable carried at amortised cost has suffered an
impairment loss, the amount of the loss is measured as the difference between the carrying amount of
the asset and the present value of estimated future cash flows (excluding future credit losses still not
incurred) discounted at the original effective interest rate of the financial asset (i.e. effective interest
rate calculated at the initial recognition date). The carrying amount of the asset will be reduced both
directly and through the use of a provision. The amount of the loss will be booked to the income
statement.
The Group firstly assesses the existence of objective evidence of an impairment loss at individual level,
for financial assets that are significant on an individual basis, and therefore at individual or collective
level for financial assets that are not significant on an individual basis. In the absence of objective
evidence of impairment of a financial asset valued individually, whether it is significant or not, said asset
is included in a group of financial assets with similar credit risk characteristics and said group is subject
to impairment testing in a collective fashion. The assets valued at individual level and for which an
impairment loss is recorded or continues to be recorded, will not be included in a collective valuation.
If, in a subsequent financial year, the size of the impairment loss falls and said reduction can be related
objectively to an event which occurred after the recognition of the impairment loss, the previously
reduced value can be written back. Any subsequent write-‐backs are booked to the income statement to
the extent the carrying amount does not exceed the amortised cost at the write-‐back date.
Assets recognised at cost
If there is objective evidence of an impairment of an unquoted equity instrument which is not
recognised at fair value since its fair value cannot be reliably measured, or of a derivative instrument
which is linked to said equity and has to be settled through the delivery of said instrument, the amount
of the impairment loss is measured by the difference between the carrying amount of the asset and the
present value of expected future cash flows and discounted at the current market rate of return for a
similar financial asset.
Available-‐for-‐sale financial assets
In the case of an impairment of an available-‐for-‐sale financial asset, a transfer from shareholders’ equity
to the income statement is effected of a value equal to the difference between its cost (net of the
repayment of capital and amortisation) and its present fair value, net of any impairment losses
recognised previously in the income statement. Write-‐backs of equities classified as available for sale
are not recognised in the income statement. Write-‐backs of debt instruments are recognised in the
income statement if the increase in the fair value of the instrument can be related objectively to an
event which occurred after the loss was recognised in the income statement.
Provisions for risks and charges
Allocations to provisions for risks and charges are made when the Group has to fulfil a current obligation
(legal or implicit) resulting from a past event, resources are likely to be sacrificed to meet said obligation
and its amount can be reliably estimated.
When the Group believes an allocation to the provision for risks and charges will be partially or fully
reimbursed, e.g. in the event of risks covered by insurance policies, the compensation is recorded
separately under assets only if it is virtually certain. In said case, the cost is stated in the income
statement of the associated allocation net of the amount recorded for the compensation.

25 CONSOLIDATED FINANCIAL STATEMENTS FOR THE YEAR ENDED 31 DECEMBER 2013
If the effect of discounting the value of money is significant, provisions are discounted using a pre-‐tax
discount rate which reflects, where appropriate, the specific risks of the liabilities. When discounting is
carried out, the increase in the provision due to the passing of time is recorded as a financial charge.
Provision for employee termination benefits
Liabilities in the form of employee termination benefits are only recorded when the Group is
demonstrably committed to: (a) terminate the employment of an employee or group of employees
before the normal pension date; or (b) provide termination benefits as a result of an offer made in order
to encourage voluntary redundancy. The Group is demonstrably committed to a termination only when
it has a detailed formal plan for the dismissal (termination of employment) and is without realistic
possibility of withdrawal from the plan.
Employee benefits
Italian legislation (art. 2120 of the Civil Code) requires that, on the date of termination of their
employment with the company, each employee receives compensation known as ESI (Employee
Severance Indemnity). Calculation of this indemnity is based on certain items that form the annual
employee remuneration for each year of employment (re-‐valued as necessary) and on the length of
service. According to statutory Italian legislation, said indemnity is reflected in the financial statements
according to a calculation method based on the indemnity accrued by each employee at the balance
sheet date, in the assumption that all employees end their employment at said date.
The IFRIC issued by the IASB tackled the issue of Italian ESI and concluded that, in application of IAS 19,
it falls within the scope of “defined benefit” plans, as regards post-‐employment benefits and, as such,
must be calculated using the Projected Unit Credit Method, in which the amount of liabilities in the form
of acquired benefits must reflect the expected date of termination and must be discounted.
Following the 2007 reform of national legislation which governs, for companies with more than 50
employees, ESI accruing from 1 January 2007, it is established as a “defined contribution” plan, whose
payments are booked directly to the income statement, as a cost, when recognised. ESI accrued up until
31.12.2006 remains a defined benefit plan, without future contributions.
The Group records actuarial gains or losses in the accounts deriving from the application of the
aforementioned method (Projected Unit Credit Method), in an appropriate shareholders’ equity reserve
according to the provisions of IAS 19 par. 120 and 128.
The actuarial valuation of the liability was entrusted to an independent actuary.
The Group has no other significant defined benefit pension plans.
Leasing
The definition of a contractual agreement as a leasing transaction (or containing a leasing transaction) is
based on the substance of the agreement and requires an assessment of whether fulfilment of the
contractual obligations depends on the use of one or more specific assets and whether the agreement
transfers the right to use said asset.
A review is carried out after the start of the contract only if one of the following conditions is met:
(a) there is a change in the contractual conditions, other than a contract renewal or extension;
(b) a renewal option is exercised or an extension granted, provided that the terms of the renewal or
extension were not initially included in the terms of the leasing transaction;
(c) there is a change in conditions according to which fulfilment of the contract depends on a specific
asset; or
(d) there is a substantial change in the asset.

26 CONSOLIDATED FINANCIAL STATEMENTS FOR THE YEAR ENDED 31 DECEMBER 2013
Where a review is carried out, accounting of the leasing will start or end from the date on which the
circumstances change which gave rise to the revision for cases a), c) or d) and on the renewal or
extension date for scenario b).
For contracts signed prior to 1 January 2005, the start date is considered 1 January 2005, in line with the
transitional provisions of IFRIC 4.
Financial leasing contracts, which substantially transfer all risks and rewards of the leased asset to the
Group, are capitalised at the date of the start of the lease at the fair value of the leased asset or, if lower,
at the present value of rental fees. Rental fees are split between the portions of principal and interest so
as to obtain the application of a constant interest rate on the residual debt balance. Financial charges
are charged directly to the income statement.
Capitalised leased assets are amortised over the estimated useful life of the asset and the duration of
the lease, whichever is the shorter, if there is no reasonable certainty that the Group will obtain
ownership of the asset at the end of the contract.
Operating lease rental fees are recorded as costs in the income statement on a straight line basis over
the duration of the contract.
Revenue recognition
Revenues are recorded to the extent in which it is likely that economic benefits can be achieved by the
Group and the associated amount can be reliably determined. The following specific revenue
recognition criteria must be adhered to before revenues are booked to the income statement:
Provision of services
The main types of service provided by the Group, separately or jointly as part of Integrated Services, are:
› management and maintenance of properties and plants, often associated with the provision of heat
(energy service);
› cleaning and environmental hygiene services;
› landscaping;
› project management services;
› linen rental and industrial laundering and sterilization services.
Revenues are recognised on the basis of the progress of the services underway at the balance sheet
date, measured as a percentage with reference to the different variables depending on the services
provided and the contracts stipulated with the customer (metres squared, hours, costs incurred,
hospital days).
The provision of services, which are still not complete at the balance sheet date, constitute contract
work in progress and are classified under trade receivables.
Revenues billed at the balance sheet date, which exceed the amount accrued on the basis of the
progress status of the service, are suspended under advances from customers, and classified under
trade payables.
The considerations, also as part of multi-‐service contracts, are, as a rule, defined separately by service
type and the amount of revenues to be attributed to the individual services is quantified at fair value.
When the outcome of a services transaction cannot be measured reliably, revenues are only recognised
to the extent it is believed the costs incurred can be recovered.

27 CONSOLIDATED FINANCIAL STATEMENTS FOR THE YEAR ENDED 31 DECEMBER 2013
Building activity
The Group records the revenues deriving from building contracts on the basis of the progress status of
the job order, measured as a percentage of the costs incurred with respect to the total estimated costs
for completing the work. When the outcome of a job order cannot be measured reliably, revenues are
only recognised to the extent it is believed the costs incurred can be recovered.
Sale of assets
The revenue is recognised when the company has transferred all significant risks and rewards related to
ownership of the asset to the acquirer.
Interest
Interest is recorded as financial income following the verification of interest income accrued (carried out
using the effective interest rate method which is the rate that accurately discounts expected future cash
flows based on the expected life of the financial instrument to the net carrying amount of the financial
asset).
Dividends
Revenues are recognised when the right of shareholders to receive the payment arises.
Government grants
Government grants are recorded when it is reasonably certain they will be received and all inherent
conditions are met. When grants are related to cost components, they are recorded as revenues, but are
systematically split over the financial years so they are commensurate with the costs they intend to
compensate. In the event the grant is related to an asset, the fair value is subtracted from the carrying
amount of the asset to which it is related and the release to the income statement occurs progressively
over the expected useful life of the asset on a straight line basis, through the systematic reduction of the
associated amortisation charges.
Income taxes
Current taxes
Current tax assets and liabilities for the period are valued by applying estimate criteria to determine the
amount pertaining to the period which is expected to be recovered or paid to the tax authorities. The
rates and tax legislation used to calculate the amount are those issued at the balance sheet date.
Deferred taxes
Deferred taxes are calculated on the temporary differences recorded at the balance sheet date between
the tax values taken as a reference for assets and liabilities and the values stated in the financial
statements.
Deferred tax liabilities are recorded against all temporary taxable differences, except:
› when deferred tax liabilities derive from the initial recognition of goodwill or of an asset or liability
in a transaction which is not a business combination and which, at the time of the transaction, does
not have any effect on the profit for the year calculated for financial statement purposes or the
profit or loss calculated for tax purposes;
› with reference to taxable temporary differences associated with equity investments in subsidiaries,
associates and joint ventures, in the event in which the reversal of the temporary differences can
be controlled and it is not likely to occur in the foreseeable future.

28 CONSOLIDATED FINANCIAL STATEMENTS FOR THE YEAR ENDED 31 DECEMBER 2013
Deferred tax assets are recognised against all deductible temporary differences and for tax assets and
liabilities carried forward, to the extent it is possible that there will be adequate future tax profits that
make the use of temporary deductible differences and tax assets and liabilities carried forward
applicable, except in the case in which:
› deferred tax assets connected to deductible temporary differences derive from the initial
recognition of an asset or liability in a transaction which is not a business combination and which, at
the time of the transaction, does not have any effect on the profit for the year calculated for
financial statement purposes or the profit or loss calculated for tax purposes;
› with reference to taxable temporary differences associated with equity investments in subsidiaries,
associates and joint ventures, deferred tax assets are recorded only to the extent in which it is likely
that the deductible temporary differences will be reversed in the immediate future and that
sufficient tax profits will be generated against which the temporary differences can be used.
The value of deferred tax assets to be recorded in the financial statements is reviewed at the close of
each financial year and reduced to the extent it is no longer likely that sufficient tax profits will be
available in the future to permit all or part of said receivable to be used. Unrecognised deferred tax
assets are reviewed annually at the balance sheet date and are recorded to the extent it has become
likely that the tax profit is sufficient to allow said deferred tax assets to be recovered.
Deferred tax assets and liabilities are measured on the basis of the tax rates that are expected to be
applied in the year in which said assets are sold or said liabilities are extinguished, considering the rates
in force and those already issued or substantially issued at the balance sheet date.
Income taxes relating to items recorded directly in shareholders’ equity are charged directly to
shareholders’ equity and not to the income statement.
Deferred tax assets and liabilities are offset, if there is a legal right to offset the current tax assets with
current tax liabilities and the deferred taxes refer to the same tax entity and the same tax authorities.
VAT
Revenues, costs and assets are recorded net of VAT, with the exception of the case in which said tax
applied to the purchase of goods or services is non-‐deductible, in which case it is recognised as part of
the purchase cost of the asset or part of the cost item booked to the income statement. Trade
receivables and payables for which an invoice has already been issued are carried inclusive of tax.
The net amount of indirect taxes on sales and purchases that can be recovered or paid to the tax
authorities is included in the financial statements under other receivables or payables depending on
whether the balance is receivable or payable.
Derivative financial instruments and cash flow hedges
At the moment of initial recognition, then subsequently, derivative instruments are booked at fair value,
changes in fair value are recorded in the income statement, with the exception of cash flow hedges (as
per IAS 39), whose fair value changes are charged to shareholders’ equity.
In particular, the transaction is considered a hedge if documentation exists on the relationship between
the hedging instrument and the liability hedged that shows risk management objectives, the hedging
strategy and methods used to verify the effectiveness of the hedge. A transaction is considered a hedge
if the effectiveness is verified at the moment it starts and, going forward, confirmed during its entire life.
Within the scope of the International Accounting Standards (IFRS), these instruments are viewed as
derivative financial instruments.

29 CONSOLIDATED FINANCIAL STATEMENTS FOR THE YEAR ENDED 31 DECEMBER 2013
These derivative financial instruments are initially recorded at fair value at the date they are stipulated;
subsequently, said fair value is periodically re-‐measured. They are accounted as assets when the fair
value is positive and liabilities in the case of a negative fair value.
Any profits or losses resulting from changes in the fair value of derivatives that do not qualify for hedge
accounting are booked directly to the income statement in the year.
Service concession arrangements
The Group is the holder of concession agreements in which certain companies manage activities in the
public interest, provided that the grantor (i) controls/regulates, by determining the price, which public
services must be offered by the concessionary companies through the infrastructures that the
concessionary company obtains under management or constructs and (ii) maintains, through ownership
or by other means, the authorisation granted and any other interest in the infrastructures upon expiry
of the concession agreement.
The concessionary company shall not carry infrastructure under tangible assets as it does not hold
“control”, as set forth in IFRIC 12. The asset to be recognised is the right to use the infrastructure for
providing the service, to be classified as a financial asset in the presence of an unconditional right to
receive future compensation regardless of actual use of the infrastructure, charging users based on use
of the service. Provision is also made for a “mixed” accounting model if the concessionary company is
the holder of both a financial asset and an intangible right, where it is necessary to separate the
component of remuneration as provided for under the agreement relating to the financial asset,
determining the amount of the intangible asset as a secondary activity (with respect to the value of the
construction services provided).
The concessionary company also recognises revenues for the services it provides, in compliance with IAS
11 and IAS 18 and, therefore, the consideration envisaged in the agreement must be allocated with
reference to the fair value of the associated services provided (construction, improvements and
management respectively). Pursuant to IAS 23, financial charges attributable to the agreement must be
recognised as costs in the year in which they are incurred, unless the concession holder has recognised
an intangible asset, for which said costs are capitalised during the phase of drafting of the agreement.
Otherwise, if the concession holder has recorded a financial asset, IAS 39 requires financial income
calculated on the basis of the effective interest method to be recognised in the income statement.
Earnings per share
Basic earnings per share are calculated by dividing net profit in the year pertaining to the Parent
Company’s ordinary shareholders by the weighted average number of ordinary shares in issue during
the year.
Diluted earnings per share are calculated by dividing net profit pertaining to the Parent Company’s
ordinary shareholders by the weighted average number of ordinary shares in issue during the year.
The Parent Company presents voluntary disclosures on earnings per share, with reference solely to
consolidated data.
Operating segments
An operating segment is a clearly identifiable component of an entity which provides a collection of
related products and services, subject to different risks and awards from those of other Group business
sectors. For operational purposes, the Group is structured into business areas that coincide with the
“strategic business units” in which the Group operates, as defined in paragraph 1.1.

30 CONSOLIDATED FINANCIAL STATEMENTS FOR THE YEAR ENDED 31 DECEMBER 2013
No operating segments were combined for the purpose of determining the operating segments subject
to disclosure.
The Group’s Management look at the results of the individual Strategic Business Units separately, for the
purpose of making decisions regarding the allocation of resources and performance monitoring. The
segment performance is assessed on the basis of the EBIT. The Group’s financial management (including
loan costs and revenues) and income taxes are managed at Group level and are not allocated to
operating segments.
Methods of calculation of the costs allocated to the segments
The Group includes direct and indirect production costs relating to the business sector in the costs
attributed to the segments.
Starting from the consolidated financial statements for the year ended 31 December 2007, it was
deemed appropriate to allocate to the segments also commercial costs and other general overheads on
the basis of the appropriate conventional allocation drivers. By contrast, income and charges generated
by financial management and current and deferred taxes remain unallocated to the segments, while
income from equity investments valued using the equity method is attributed to the segments.
Methods of calculation of the assets and liabilities allocated to the segments
The assets and liabilities were attributed to the various segments in accordance with the method used
for income statement items.

31 CONSOLIDATED FINANCIAL STATEMENTS FOR THE YEAR ENDED 31 DECEMBER 2013
3. BUSINESS COMBINATIONS
Acquisition of the “Auchan” business unit
On 30 May 2013 the Group acquired from Auchan S.p.A. a business unit providing maintenance services
for the Italian Auchan retail network. This business unit was transferred with effect from 1 June 2013
and consists of materials used for the business activities, the employees’ employment contracts and
valid contracts related to its business.
This transaction was carried out against a consideration of € 70 thousand, fully paid up after completion.
There was also provision for future adjustments related to the interim period of management of the
business unit.
Accounting effects of the acquisition
The acquisition had the nature of a business combination and the Group therefore applied IFRS 3 in
accounting for it.
The value of the assets and liabilities acquired on the acquisition date, the difference between purchase
value and carrying amount and the net cash flow for the acquisition are presented in the table below:
Recognized value Book value
ASSETS
Current financial assets 422 422
TOTAL ASSETS 422 422
LIABILITIES
Employee termination indemnity 146 146
Payables to employees 206 206
TOTAL LIABILITIES 352 352
Fair value of net assets 70 70
Goodwill arising from the combination 0
TOTAL VALUE OF BUSINESS COMBINATION Consideration paid to the transferor 70
TOTAL VALUE OF BUSINESS COMBINATION 70
Net cash flow used in the transaction
Consideration paid to the transferor (70)
NET CASH FLOW USED IN THE TRANSACTION (70)
The fair value of the assets and liabilities acquired through the business combination was determined as
€ 70 thousand and the total consideration for the combination is € 70 thousand. The net liquidity used in
the combination is € 70 thousand.
Acquisition of Mowbray S.r.l.
On 5 July 2013 the subsidiary Energyproject S.r.l. acquired from Verde Vivo S.a.r.l. (a company
incorporated under Luxembourg law) the total quota in Mowbray S.r.l., a company incorporated under
Italian law and with registered office in Milan, which is active in the construction and operation of
photovoltaic projects and plants. Currently this company is the sole owner of the photovoltaic plant
named “Modena Fiere Pensiline”, which is operated by the same and which has been built by

32 CONSOLIDATED FINANCIAL STATEMENTS FOR THE YEAR ENDED 31 DECEMBER 2013
Energyproject in its capacity as an EPC contractor. The transfer of the quotas took place at an overall
price of € 705 thousand.
Accounting effects of the acquisition
The acquisition had the nature of a business combination and the Group therefore applied IFRS 3 in
accounting for it.
The transaction was carried out against an overall consideration of € 705 thousand, € 605 thousand of
which fully paid up after completion and € 100 thousand paid out in escrow.
The value of the assets and liabilities acquired on the acquisition date, the difference between purchase
value and carrying amount and the net cash flow generated with the acquisition are presented in the
table below:
Recognized value Book value
ASSETS
Non-‐current financial assets 27 27
Inventories 3,306 3,306
Trade receivables and advances to suppliers 230 230
Current tax receivables 12 12
Other current assets 90 90
Cash and cash equivalents 741 741
TOTAL ASSETS 4,406 4,406
LIABILITIES
Trade payables and advances from customers 2,565 2,565
Other financial liabilities 222 222
TOTAL LIABILITIES 2,787 2,787
Fair value of net assets 1,619 1,619
"Badwill" (914)
TOTAL VALUE OF BUSINESS COMBINATION:
Consideration paid to the transferor 705
TOTAL VALUE OF BUSINESS COMBINATION 705
Net cash flow used in the transaction
Cash and cash equivalents of the acquired entity 741
Consideration paid to the transferor (705)
NET CASH FLOW USED IN THE TRANSACTION 36
The fair value of the assets and liabilities acquired through the business combination was set at € 1,619
thousand, while the total consideration for the combination was € 705 thousand. The negative
difference between the acquisition cost and the carrying amount of net assets arising from the business
combination, equal to € 914 thousand, was recognized as income in the consolidated income statement.
The net cash flow generated by the combination was equal to € 36 thousand.
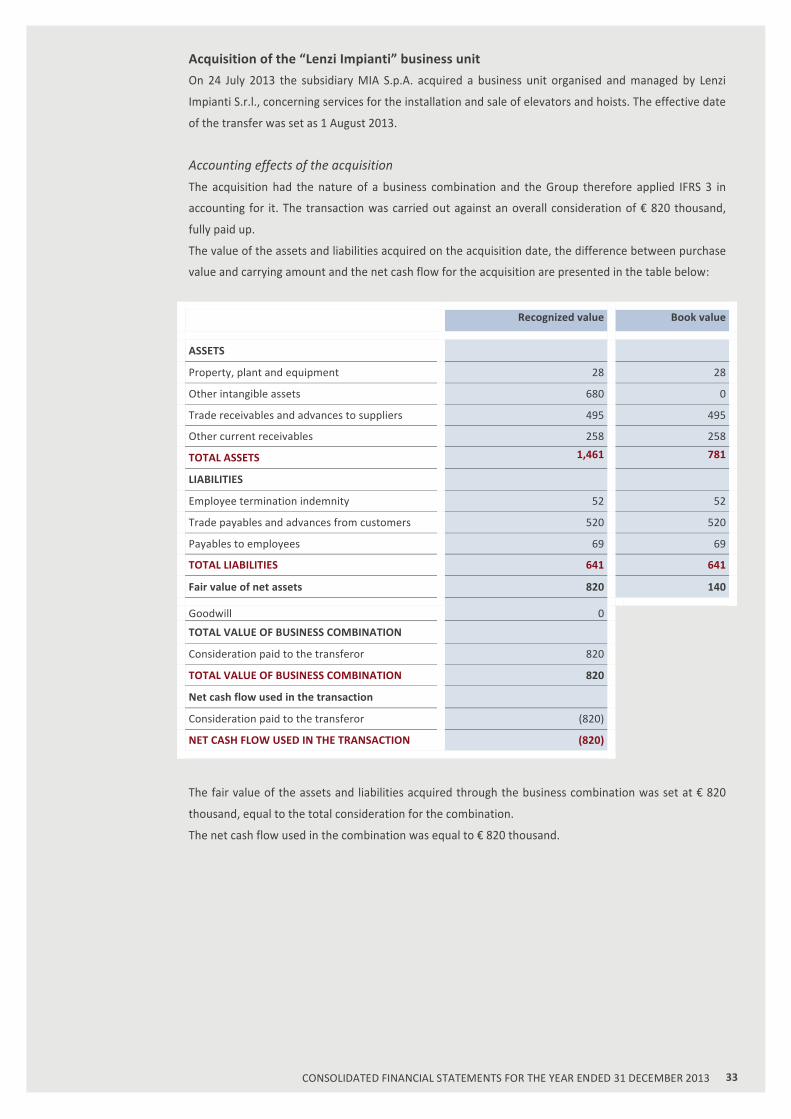
33 CONSOLIDATED FINANCIAL STATEMENTS FOR THE YEAR ENDED 31 DECEMBER 2013
Acquisition of the “Lenzi Impianti” business unit
On 24 July 2013 the subsidiary MIA S.p.A. acquired a business unit organised and managed by Lenzi
Impianti S.r.l., concerning services for the installation and sale of elevators and hoists. The effective date
of the transfer was set as 1 August 2013.
Accounting effects of the acquisition
The acquisition had the nature of a business combination and the Group therefore applied IFRS 3 in
accounting for it. The transaction was carried out against an overall consideration of € 820 thousand,
fully paid up.
The value of the assets and liabilities acquired on the acquisition date, the difference between purchase
value and carrying amount and the net cash flow for the acquisition are presented in the table below:
Recognized value Book value
ASSETS
Property, plant and equipment 28 28
Other intangible assets 680 0
Trade receivables and advances to suppliers 495 495
Other current receivables 258 258
TOTAL ASSETS 1,461 781
LIABILITIES
Employee termination indemnity 52 52
Trade payables and advances from customers 520 520
Payables to employees 69 69
TOTAL LIABILITIES 641 641
Fair value of net assets 820 140
Goodwill 0
TOTAL VALUE OF BUSINESS COMBINATION
Consideration paid to the transferor 820
TOTAL VALUE OF BUSINESS COMBINATION 820
Net cash flow used in the transaction
Consideration paid to the transferor (820)
NET CASH FLOW USED IN THE TRANSACTION (820)
The fair value of the assets and liabilities acquired through the business combination was set at € 820
thousand, equal to the total consideration for the combination.
The net cash flow used in the combination was equal to € 820 thousand.

34 CONSOLIDATED FINANCIAL STATEMENTS FOR THE YEAR ENDED 31 DECEMBER 2013
4. PROPERTY, PLANT AND EQUIPMENT
The table below shows the changes in property, plant and equipment (owned and under a financial
lease) in the year ended 31 December 2013.
Properties Plant and equipment
Properties under lease
Plant and equipment
under lease
Total
At 1 January 2013, net of accumulated depreciation and impairment 5,249 75,027 243 5,753 86,272
Additions due to business combinations 0 28 0 0 28 Additions from acquisitions 781 22,450 0 2,028 25,259 Impairment losses 0 (1,048) 0 (138) (1,186) Disposals (15) (658) 0 0 (673) Amortization (286) (24,868) (21) (832) (26,007) Others (486) 3,885 0 (3,435) (36) At 31 December 2013 5,243 74,816 222 3,376 83,657 At 1 January 2013 Cost 7,409 277,833 375 9,969 295,586 Accumulated amortization and impairment losses (2,160) (202,806) (132) (4,216) (209,314)
NET BOOK VALUE 5,249 75,027 243 5,753 86,272 At 31 December 2013 Cost 7,296 299,938 375 6,215 313,824 Accumulated amortization and impairment losses (2,053) (225,122) (153) (2,839) (230,167)
NET BOOK VALUE 5,243 74,816 222 3,376 83,657
The additions from acquisitions for the year relate for € 22,949 thousand to investments made by
companies operating in the Laundering & Sterilization segment, mainly due to the purchase of linen (€
13,015 thousand) and to the purchases of plant, machinery and specific equipment (€ 6,275 thousand).
Furthermore, during the year the construction and restructuring activities continued, for a total amount
of € 781 thousand, at the laundering and sterilization site in Lucca, connected to the linen rental and
industrial laundering services provided in the territory and acquired in the previous financial year. Finally,
€ 1,810 thousand was specifically invested in surgical instrumentation sterilization activities. The
residual amount mainly refers to the purchase of machinery and equipment used in the Facility
Management services.
The year saw the recognition of impairment losses of € 1,186 thousand, mainly linked to the process
started to close the industrial laundering plant, which entailed a write-‐down of part of the systems and
equipment owned by the Group and under leases, to adjust their book value at the market value or to
write-‐off the same against the expected failure to reuse the same in future production activities.
Other changes are mainly made of reclassifications from one class of assets to another, first of all after
the purchase of leased goods and equipment. For greater clarity, items previously reported as “plant
under lease”-‐ cogeneration plants used in project financing -‐ were reclassified among the Group’s own
plant and machinery. Furthermore, after the completion of enlargement works at the Lucca industrial
site, used for sterilization and laundering, some of the new additions previously reported as properties
were put in a more correct depreciation class. Finally, there were also other minor changes arising from
the deconsolidation of consortia controlled during 2013.

35 CONSOLIDATED FINANCIAL STATEMENTS FOR THE YEAR ENDED 31 DECEMBER 2013
The table below shows the movements in tangible fixed assets (owned and under a financial lease) in
the year ended 31 December 2012.
Properties Plant and equipment
Properties under lease
Plant and equipment
under lease
Total
At 1 January 2012, net of accumulated depreciation and impairment 1,494 66,962 254 6,658 75,368
Additions due to business combinations 0 140 0 0 140
Additions from acquisitions 4,022 31,790 0 0 35,812
Impairment losses 0 0 0 0 0
Disposals 0 (1,020) 0 0 (1,020)
Amortization (267) (22,792) (11) (874) (23,944)
Others 0 (53) 0 (31) (84)
At 31 December 2012 5,249 75,027 243 5,753 86,272
At 1 January 2012
Cost 3,387 248,688 375 11,208 263,658 Accumulated amortization and impairment losses (1,893) (181,726) (121) (4,550) (188,290)
NET BOOK VALUE 1,494 66,962 254 6,658 75,368
At 31 December 2012
Cost 7,409 277,833 375 9,969 295,586 Accumulated amortization and impairment losses (2,160) (202,806) (132) (4,216) (209,314)
NET BOOK VALUE 5,249 75,027 243 5,753 86,272
5. OTHER INTANGIBLE ASSETS
The table below shows the changes in intangible assets in the year ended 31 December 2013.
Other intangible
assets
Goodwill Total
Re-‐stated as at 1 January 2013, net of accumulated amortization and impairment
26,919 418,724 445,643
Additions due to business combinations 680 0 680 Additions from acquisitions 10,987 0 10,987 Disposals (66) (490) (556) Depreciation (8,767) 0 (8,767) Impairment losses (685) 0 (685) Other (4) (2,093) (2,097) At 31 December 2013 29,064 416,141 445,205 At 1 January 2013 Cost 73,069 421,117 494,186 Accumulated depreciation and impairment losses (46,150) (2,393) (48,543) NET BOOK VALUE 26,919 418,724 445,643 At 31 December 2013 Cost 85,585 418,534 504,119 Accumulated depreciation and impairment losses (56,521) (2,393) (58,914)
NET BOOK VALUE 29,064 416,141 445,205

36 CONSOLIDATED FINANCIAL STATEMENTS FOR THE YEAR ENDED 31 DECEMBER 2013
Goodwill is tested annually for impairment; for more details please refer to note 6.
No additions were reported in the year as a result of business combinations, while the disposal in the
related item relates to the sale of a business unit, previously managed by MIA Servizi Torino S.r.l. to
Kone S.p.A.. There were also other movements recorded during the year following the recognition of
liabilities measured at fair value for earn-‐outs, recorded as part of the business combinations made in
previous years, for € 2,093 thousand.
Other intangible assets, amounting to € 29,064 thousand at 31 December 2013, mainly consist of
investments in software carried out as part of the projects aimed at upgrading and enhancing the
corporate information systems. The additions from acquisitions made in the year (€ 10,987 thousand)
were attributable almost entirely to the investments in software used in the corporate IT systems within
the Facility Management SBU (€ 9,574 thousand).
The amortisation charges of intangible fixed assets amounted to € 8,767 thousand in 2013, compared to
€ 8,724 thousand in the previous year. Amortization of backlog came to € 2,530 thousand, of which €
482 thousand relating to MIA S.p.A..
Finally, the year saw the recognition of impairment losses of € 685 thousand, mainly linked to the write-‐
off of the residual net value of specific software used in the facility management activities performed on
the network of Telecom Italia according to contract requests submitted prior to the renewal of the
contract signed with the same in the course of the financial year.
The table below shows the movements in intangible fixed assets in the year ended 31 December 2012.
Other intangible
assets Goodwill Total
Re-‐stated as at 1 January 2012, net of accumulated amortization and impairment 26,622 411,995 438,617
Additions due to business combinations 430 7,887 8,317
Additions from acquisitions 8,537 0 8,537
Depreciation (8,724) 0 (8,724)
Impairment losses (27) (16) (43)
Other 81 (1,142) (1,061)
At 31 December 2012 26,919 418,724 445,643
At 1 January 2012
Cost 62,702 414,372 477,074
Accumulated depreciation and impairment losses (36,080) (2,377) (38,457)
NET BOOK VALUE 26,622 411,995 438,617
At 31 December 2012
Cost 73,069 421,117 494,186
Accumulated depreciation and impairment losses (46,150) (2,393) (48,543)
NET BOOK VALUE 26,919 418,724 445,643

37 CONSOLIDATED FINANCIAL STATEMENTS FOR THE YEAR ENDED 31 DECEMBER 2013
6. IMPAIRMENT TEST OF GOODWILL
The corporate restructuring process that involved the Group in the course of the previous financial years
led to a redefinition of the CGUs, coinciding with the SBUs, regardless of legal entities. The Group’s
Management believe that the SBU structure should be reflected, consistently with the provisions of the
accounting standards, also at the level of the CGUs used for impairment tests. The SBUs identified and
their composition, in corporate terms, are defined as follows.
ASA – Facility Management
The SBU is identified with:
› Manutencoop Facility Management S.p.A.
› Manutencoop Private Sector Solutions S.p.A.
› SMAIL S.p.A. and the groups controlled by Gruppo Sicura S.r.l. and by MIA S.p.A., operating in the
facility management segment as suppliers of more specialist services
› Telepost S.p.A. which provides internal mailing services for the Telecom Italia Group
› other minor investee companies operating in the same segment.
ASA – Laundering & Sterilization
The SBU is identified with:
› Servizi Ospedalieri S.p.A., operating in the linen rental and industrial laundering segment for
hospitals and the sterilization of linen and surgical instruments
› A.M.G. S.r.l., held under a joint venture (50%) with Servizi Ospedalieri S.p.A.
› other minor investee companies operating in the same segment.
ASA – Other
The SBU is identified with:
› Energyproject S.r.l., which manufactures and sells photovoltaic plants; this business has been
progressively wound down starting from 2011
› MACO S.p.A., to which the business unit relating to Group ‘‘building’’ activities was conferred in
2009; this company has also been the object of assessments by the Management as to the exit from
the market of this business, since Management does not consider it to be strategic any longer
› Other minor investee companies operating in the same segment.
The table below sets forth the carrying amounts of the goodwill recognized in the consolidated Financial
Statements at 31 December 2013, relating to the different CGUs, compared with the figures for the year
ended 31 December 2012.
31 December 2013 31 December 2012
Goodwill allocated to Facility Management CGU 403,331 405,914
Goodwill allocated to Laundering/Sterilization CGU 12,810 12,810
TOTAL GOODWILL 416,141 418,724

38 CONSOLIDATED FINANCIAL STATEMENTS FOR THE YEAR ENDED 31 DECEMBER 2013
Facility Management CGU goodwill
The goodwill allocated to the Facility Management CGU, which amounted to € 403,331 thousand as at
31 December 2013, was recorded as a result of various business combinations from 2004 to date, the
most important of which are listed below:
› Operation ‘Palladio’, which took place on 29 December 2003, involved the Group acquiring control
of the business unit relating to facility management technical services previously managed by the
parent company Manutencoop Società Cooperativa.
› Acquisition of MCB S.p.A., a company through which the Group established the first facility
management unit for “network” customers (banks, insurance companies, etc.). In 2010, MCB S.p.A.
was merged by incorporation into MP Facility S.p.A. (now Manutencoop Private Sector Solutions
S.p.A.).
› Acquisition of Teckal S.p.A., which was merged by incorporation into Manutencoop Facility
Management S.p.A. in 2010, through which the Group strengthened the production structure of
traditional facility management, in particular in the heat management service.
› Acquisition of Altair IFM S.p.A. (the most significant transaction to date), which enabled the Group
to gear the customer portfolio towards large private customers. In 2010 the larger companies in the
Altair sub-‐group were merged by incorporation into Manutencoop Facility Management S.p.A..
› Acquisition of Gruppo Sicura S.r.l., which paved the way for an expansion in the range of specialist
facility management services in the fire prevention and accident prevention market.
› Acquisitions made by MIA S.p.A., the launch pad for a network of companies operating throughout
Italy which covers elevating system (goods lifts and lifts) installation and maintenance services.
In 2013 the value of goodwill pertaining to the Facility Management CGU decreased by € 2,583
thousand, as described in note 5.
Laundering & Sterilisation CGU goodwill
The goodwill allocated to the Laundering & Sterilization CGU emerged as a result of the acquisition of
Omasa S.p.A. in 2007, a company operating in the market for the sterilization of surgical instruments
and linen, as well as after the acquisition of an interest in the joint-‐venture in AMG S.r.l., but following
further minor acquisitions, all made by Servizi Ospedalieri S.p.A., a company operating in the linen rental
and industrial laundering and sterilisation market. Omasa S.p.A was then merged by incorporation into
Servizi Ospedalieri S.p.A. on 1 July 2009.
Total goodwill attributable to the Laundering & Sterilization CGU, unchanged with respect to the
previous year, amounted to € 12,810 thousand as at 31 December 2013.
Impairment Test
Pursuant to IAS 36, goodwill is not amortised, but is tested for any possible impairment on an annual
basis, or more frequently, should specific events or circumstances arise which provide evidence of an
impairment loss. The impairment test was carried out through the comparison between the net book
value and the recoverable value of the individual CGUs/SBUs to which goodwill had been allocated, as
determined on the basis of the discounting-‐back of expected future cash flows relating to the period
2014-‐2016 extrapolated from the Business Plan of the Manutencoop Group.
The business plan used for the analyses described in these notes was approved by the Management
Board of Manutencoop Facility Management S.p.A. on 18 December 2013.

39 CONSOLIDATED FINANCIAL STATEMENTS FOR THE YEAR ENDED 31 DECEMBER 2013
The estimated value in use of the Facility Management SBU and of the Laundering & Sterilization SBU
was based on the following assumptions:
› The expected future cash flows for the period 2014-‐2016 were extrapolated from the Business Plan.
The main assumptions on which Management based cash flow projections for the purpose of
impairment test of goodwill are:
• Determination of the value of the forecast gross margins according to the projection of
the backlog of existing service contracts, augmented by the assumption of new portfolio
acquisitions.
• Changes in net working capital estimated on the basis of the target days of stock rotation,
the payment of amounts due and collection of receivables.
› A terminal value used to estimate future results beyond the time horizon expressly considered. The
terminal value was determined by applying a NOPAT based on 2014 EBIT, net of a nominal tax rate.
As regards long-‐term growth rates, an assumption of 1% was considered for the Facility
Management SBU and of 0.5% for the Laundering & Sterilization SBU.
› The expected future cash flows were discounted back at a discount rate (WACC) of 7.92% for the
Facility Management SBU (2012: 7.46%) and at a discount rate (WACC) of 7.66% (2012: 6.19%) for
the Laundering & Sterilization SBU. The WACC was determined by using the Capital Asset Pricing
Model (“CAPM”), by which the risk-‐free rate was calculated with reference to the curve of the rates
of return of Italian long-‐term government bonds, while the non-‐diversifiable systematic risk ratio
(βeta) and the debt/equity ratio were extrapolated from the analysis of a group of comparable
companies operating in the European facility management and laundering sector. In addition, in
order to reflect the uncertainty of the current economy and the future market conditions, the cost
of the equity component of the WACC rate was increased with a risk premium of 100 basis points in
each period of time.
For all CGUs/SBUs analysed, the analysis confirmed that the recoverable value of the same exceeds the
associated carrying amount, therefore not requiring any write-‐downs. On a prudential basis, a “Worst
Case” was outlined with reference to the WACC and to the growth rates applied. However, in simulating
nil growth rates (equal to 0%), also in combination with a WACC exceeding those applied by a
percentage point (and, then, equal to 8.92% for Facility Management and to 8.66% for Laundering &
Sterilization, respectively), there would be no need to make write-‐downs in both CGUs/SBUs, as the
recoverable value would exceed the related book value.
7. INVESTMENTS IN JOINT VENTURES
As at 31 December 2013, the Group holds 6 equity investments in joint-‐ventures.
These relate mostly to consortium companies and companies not quoted on regulated capital markets
and established for the purpose of regulating relations under temporary associations of companies set
up for the operational management of certain facility management and industrial laundering service
contracts.
The total values for assets and liabilities, revenues and results pertaining to the Group’s share are shown
below for the year ended 31 December 2013, as included in the consolidated financial statements of
said Companies, compared with the same figures for the year ended 31 December 2012:

40 CONSOLIDATED FINANCIAL STATEMENTS FOR THE YEAR ENDED 31 DECEMBER 2013
31 December 2013 31 December 2012
Non-‐current assets 2,759 2,420 Current assets 8,771 8,657 TOTAL ASSETS 11,530 11,077 Non-‐current liabilities 990 1,051 Current liabilities 9,389 8,926 TOTAL LIABILITIES 10,379 9,977
(in thousands of Euro) 31 December 2013 31 December 2012
Revenues 6,999 6,621 Operating costs (6,854) (6,412) EBIT 145 209 Result of financial management (53) (59) Pre-‐tax profit (loss) 92 150 Current, prepaid and deferred taxes (31) (82) PROFIT (LOSS) FOR THE PERIOD 61 68
8. INVESTMENTS IN ASSOCIATES ACCOUNTED UNDER THE EQUITY METHOD
The Group holds some investments in associates, which for the purpose of consolidation are accounted
under the equity method. A complete list of these investments is provided in Annex I attached to the
Consolidated Financial Statements
At 31 December 2013 the net-‐book value of the investments valued at Equity amounted to € 29,660
thousand, compared to a figure of € 27,881 thousand in the previous year.
Net Assets
31 December 2013 Net Assets
31 December 2012
Investments valued at Equity 29,660 27,881 Provision for risks on investments (60) (153)
INVESTMENTS VALUED AT EQUITY 29,600 27,728
Details of changes during the year are shown in Annex II attached to the Consolidated Financial
Statements.
In 2013 investments accounted for under the equity method overall recorded a positive result equal to €
2,592 thousand, for the share attributable to the Group, as a result of the recording of income from
equity investments of € 2,677 thousand and write-‐downs of € 85 thousand. Furthermore, positive
effects have been recognized directly in the shareholders’ equity of associates to an overall amount of €
727 thousand.
The year saw the incorporation of EOS Hijyen Tesis Hizmetleri Saglik Insaat Servis Muhendislik A.S., with
a subscribed capital of € 50 thousand (50%) and the incorporation of UFS – United Facility Solutions SA
(33.3%) with a subscribed capital of € 103 thousand.

41 CONSOLIDATED FINANCIAL STATEMENTS FOR THE YEAR ENDED 31 DECEMBER 2013
9. OTHER ELEMENTS OF NON-‐CURRENT ASSETS
The table below sets forth the breakdown of other non-‐current assets at 31 December 2013 and at 31
December 2012:
31 December 2013 31 December 2012
Other investments 3,038 3,041
Non-‐current financial assets 10,668 11,455
Other non-‐current assets 1,653 1,746
OTHER NON-‐CURRENT ASSETS 15,359 16,242
The financial assets accounted for as Other investments relate to investments in companies in which the
Group has no significant or controlling interests and that have been acquired for strategic/production
purposes. There are also investments in National Cooperative Consortia, as well as investments in
production sites, or in other minor activities such as industrial laundering services, performed by minor
companies that may also act as sub-‐contractors.
The other investments are measured at purchase or establishment cost, since there is no active market
in the securities concerned, which for the most part cannot be freely transferred to third parties due to
limitations and restrictions preventing their free circulation.
Non-‐current financial assets, amounting to € 10,668 thousand at 31 December 2013 (€ 11,455 thousand
at 31 December 2012), are composed of:
› € 8,589 thousand of non-‐current financial receivables due from associates or affiliates (€ 9,402
thousand at 31 December 2012). The face value of these receivables is € 9,053 thousand, while the
discounting fund amounts to € 464 thousand. Some of these are non-‐interest bearing since they
were drawn down proportionally from each consortium partner and are thus discounted on the
basis of their expected residual maturity, applying Eurirs as the reference interest rate, plus a
spread. The decrease recognised in the year was mainly linked to the partial repayment of some
loans owned by Servizi Ospedalieri S.p.A..
› € 1,915 thousand of non-‐current financial receivables from third parties (€ 1,890 thousand at 31
December 2012);
› € 164 thousand of securities held to maturity (€ 163 thousand at 31 December 2012).
Other non-‐current assets, amounting to € 1,653 thousand at 31 December 2013 (€ 1,746 thousand at 31
December 2012) mainly consist of security deposits related to long-‐term income-‐generating
manufacturing contracts (€ 940 thousand) thousand) and long-‐term prepaid expenses relating to certain
job orders (€ 471 thousand).
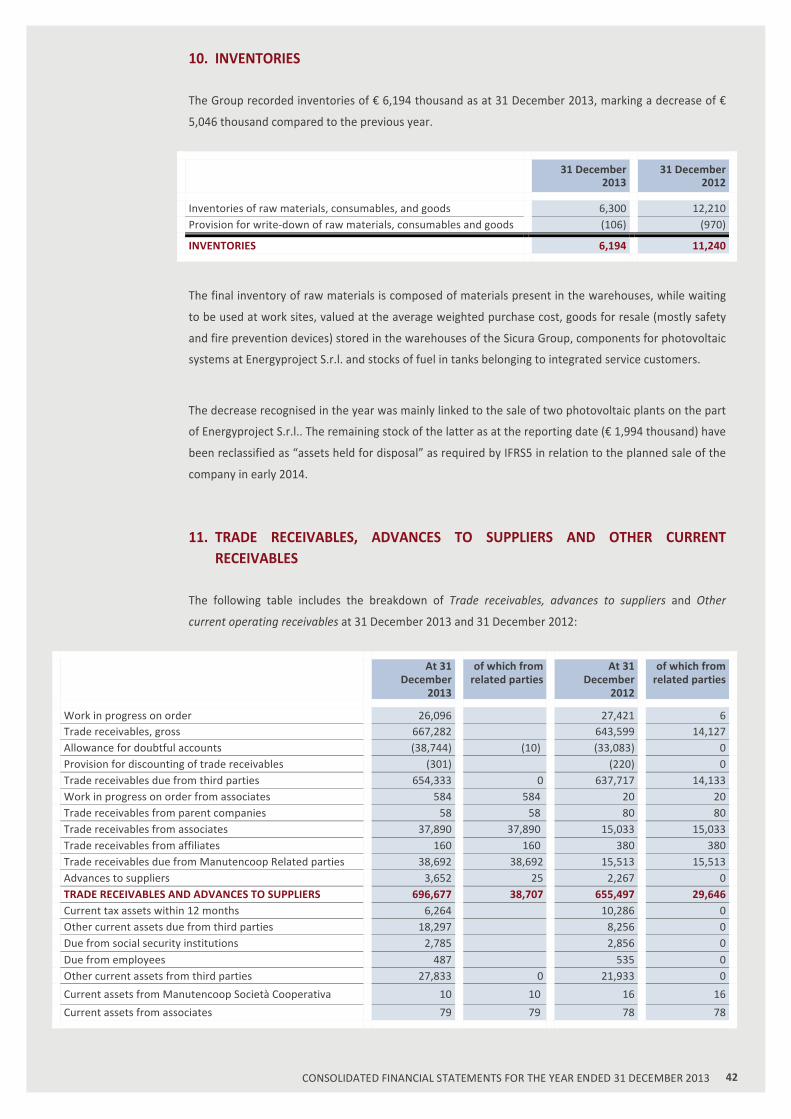
42 CONSOLIDATED FINANCIAL STATEMENTS FOR THE YEAR ENDED 31 DECEMBER 2013
10. INVENTORIES
The Group recorded inventories of € 6,194 thousand as at 31 December 2013, marking a decrease of €
5,046 thousand compared to the previous year.
31 December
2013 31 December
2012
Inventories of raw materials, consumables, and goods 6,300 12,210 Provision for write-‐down of raw materials, consumables and goods (106) (970)
INVENTORIES 6,194 11,240
The final inventory of raw materials is composed of materials present in the warehouses, while waiting
to be used at work sites, valued at the average weighted purchase cost, goods for resale (mostly safety
and fire prevention devices) stored in the warehouses of the Sicura Group, components for photovoltaic
systems at Energyproject S.r.l. and stocks of fuel in tanks belonging to integrated service customers.
The decrease recognised in the year was mainly linked to the sale of two photovoltaic plants on the part
of Energyproject S.r.l.. The remaining stock of the latter as at the reporting date (€ 1,994 thousand) have
been reclassified as “assets held for disposal” as required by IFRS5 in relation to the planned sale of the
company in early 2014.
11. TRADE RECEIVABLES, ADVANCES TO SUPPLIERS AND OTHER CURRENT RECEIVABLES
The following table includes the breakdown of Trade receivables, advances to suppliers and Other
current operating receivables at 31 December 2013 and 31 December 2012:
At 31 December
2013
of which from related parties
At 31 December
2012
of which from related parties
Work in progress on order 26,096 27,421 6 Trade receivables, gross 667,282 643,599 14,127 Allowance for doubtful accounts (38,744) (10) (33,083) 0 Provision for discounting of trade receivables (301) (220) 0 Trade receivables due from third parties 654,333 0 637,717 14,133 Work in progress on order from associates 584 584 20 20 Trade receivables from parent companies 58 58 80 80 Trade receivables from associates 37,890 37,890 15,033 15,033 Trade receivables from affiliates 160 160 380 380 Trade receivables due from Manutencoop Related parties 38,692 38,692 15,513 15,513 Advances to suppliers 3,652 25 2,267 0 TRADE RECEIVABLES AND ADVANCES TO SUPPLIERS 696,677 38,707 655,497 29,646 Current tax assets within 12 months 6,264 10,286 0 Other current assets due from third parties 18,297 8,256 0 Due from social security institutions 2,785 2,856 0 Due from employees 487 535 0 Other current assets from third parties 27,833 0 21,933 0
Current assets from Manutencoop Società Cooperativa 10 10 16 16
Current assets from associates 79 79 78 78

43 CONSOLIDATED FINANCIAL STATEMENTS FOR THE YEAR ENDED 31 DECEMBER 2013
At 31 December
2013
of which from related parties
At 31 December
2012
of which from related parties
Other current assets from Manutencoop Related parties 89 89 94 94
Accrued income 2 2 0 Prepaid expenses 1,726 1,661 0 Accrued income and prepaid expenses 1,728 0 1,663 0
OTHER CURRENT ASSETS 29,650 89 23,690 94
The balance of trade receivables and advances to suppliers, which also includes inventories of contract
work in progress, amounted to € 696,677 thousand as at 31 December 2013, showing an increase of €
41,180 thousand compared to the amount of € 655,497 thousand recorded as at 31 December 2012.
The change is mainly due to the increase in gross trade receivables, which amounted to € 667,157
thousand at 31 December 2013 (31 December 2012: € 643,599 thousand), against the related
adjustment provisions that showed a balance of € 38,744 thousand at 31 December 2013 (31 December
2012: € 33,083 thousand).
No further assignments of trade receivables without recourse took place during the second half of 2013
after the gradual abandonment of revolving programmes for the assignment to Crédit Agricole
Corporate & Investment Bank and to Banca IMI. The financial year saw the assignment of receivables for
a total nominal value of € 175.7 million (€ 459.1 million in 2012). Furthermore, a non-‐recurring
assignment was carried out with Credemfactor S.p.A –Credito Emiliano Banking Group in relation to the
receivables due from a public entity for € 1.1 million. Given the characteristics of the transactions
described above, the receivables were derecognized and costs for credit discount for an overall amount
of € 602 thousand and for interest discount for € 2,306 thousand were accounted for.
At 31 December 2013, the total receivables transferred through factoring by the Group to factoring
agencies and still not collected amounted to € 16.4 million (€ 146.3 million at 31 December 2012,
including € 52.7 million related to non-‐recurring assignments of receivables due from the client
Telecom).
On the basis of the historical performance of the debtors involved in the transfer, the incidence of the
credit risk is extremely low, while the risk of delayed payment is higher given that said receivables are
predominantly due from Public Authorities.
As part of the non-‐recourse factoring transactions the Group issued sureties for a total nominal value of
€ 2,104 thousand. In light of the characteristics of the transactions and the protections to which the
assumption of enforcement of the sureties is subject, the fair value of the underlying financial
guarantees is estimated at € 35 thousand (31 December 2012: € 237 thousand), that the Group
recorded under Loans and other current financial liabilities. The fair value difference compared to 31
December 2012 was recorded as a contra entry to a financial income.
Trade receivables due from Group companies include, in particular, receivables due from Progetto ISOM
S.p.A. for € 13,457 thousand, Progetto Nuovo S. Anna for € 5,448 thousand, Newco Duc Bologna S.p.A.
for € 3,237 thousand and from Se.Sa.Mo. S.p.A. for € 3,145 thousand.

44 CONSOLIDATED FINANCIAL STATEMENTS FOR THE YEAR ENDED 31 DECEMBER 2013
Since many of the Group’s customers are Public Authorities, who are notorious for long payment delays,
it was necessary to discount trade receivables. Changes in the provision for discounting of trade
receivables in 2013 are shown below:
At 31 December
2012 Increases Utilizations
Other changes
At 31 December
2013
Provision for discounting of trade receivables 221 165 0 (85) 301
The total decrease in the provision for discounting receivables is primarily due to the significant fall in
rates, in addition to a trend showing improvements in collection time.
A specific allowance for doubtful accounts was recorded in connection with non-‐performing receivables,
which are difficult to fully recover, amounting to € 38,744 thousand at 31 December 2013 (at 31
December 2012: € 33,083 thousand). Below are the reported the changes in the period::
At 31 December
2012 Increases Utilizations Releases Business
combinations Other
changes
At 31 December
2013
Allowance for doubtful accounts 33,083 6,847 (2,908) (515) 0 2,237 38,744
The other changes relate to amounts previously classified as provisions for future charges that for the
purpose of clarification have been reclassified and directly deducted from the asset items to which they
referred. Other movements include rises in the consolidated provision for default interest write-‐downs.
An analysis of trade receivables as at 31 December 2013 and as at the end of the previous year is
provided below, broken down by maturity.
Overdue trade receivables
Total Trade receivables
reaching maturity
< 30 days 30 -‐ 60 days
60 -‐ 90 days
90 -‐ 120 days
after 120 days
31 December 2013 628,413 391,589 63,196 35,535 18,830 20,503 98,760 31 December 2012 610,517 381,487 29,422 22,248 15,145 15,473 146,743
The balances shown are net of the bad debt provision but include the effect of discounting.
Other current assets, equal to €29,650 thousand (€ 23,690 thousand at 31 December 2012), increased
by an overall amount of € 5,960 thousand in the period.
This item includes the receivables arising from the periodic VAT settlements of some Group companies
(€ 6,240 thousand compared to € 7,423 thousand at 31 December 2012). Other current assets due from
third parties also include € 4,019 thousand of receivables from a customer on account of VAT requested
in the application of the principle of recourse laid down under article 93, paragraph 1, of decree law no.
1 of 24 January 2012, as converted by law 27 of 24 March 2012, as a result of the objections raised by

45 CONSOLIDATED FINANCIAL STATEMENTS FOR THE YEAR ENDED 31 DECEMBER 2013
the Tax Authorities as to the erroneous application of special VAT tax rates in the course of a tax
assessment that was completed at the parent company MFM S.p.A. in May with the issue of two
Reports of Findings (Processi Verbali di Constatazione, PVC).
The same item had also been recognizing, since 2012, receivables of € 2,595 thousand from the Tax
Authorities on account of refund following the petition submitted for the deduction of IRAP tax from the
IRES tax base by companies not adhering to the National Tax Consolidation agreement with
Manutencoop Società Cooperativa.
Finally, the item also recognizes € 2,176 thousand of credit balances of current accounts held at
Unicredit, managed in the name and on behalf of INPDAP (Social Security Institute for employees in
public administration), as envisaged in a property management contract stipulated with the
aforementioned authority. Some restrictions have been placed on said accounts as a result of the
dispute that has arisen with INPDAP. Therefore, for the purposes of an accurate presentation, it was
deemed appropriate to classify said item under Other current receivables.
12. CASH AND CASH EQUIVALENTS, RECEIVABLES AND OTHER CURRENT FINANCIAL ASSETS
An analysis of the balance as at 31 December 2013 and 31 December 2012 is shown below:
At 31
December 2013 At 31 December
2012
Bank and postal deposits 173,855 39,557 Cash in hand 72 115 Current financial consortia 11,366 12,315
CASH AND CASH EQUIVALENTS 185,293 51,987 Current financial receivables due from third parties 12,049 10,067 Current financial receivables from Group companies 1,099 1,133
Current financial receivables 13,148 11,200 Other receivables for dividends 60 2
RECEIVABLES AND OTHER CURRENT FINANCIAL ASSETS 13,208 11,202
Cash and cash equivalents recorded a significant increase, passing from € 51,987 thousand at 31
December 2012 to € 185,293 thousand at 31 December 2013, above all in relation to the contribution of
proceeds from the bond issue carried out in 2013. At 31 December 2013 the item included the balance
of the time deposit held with UNIPOL Banca for € 40,000 thousand, expiring on 28 February 2014.
Bank deposits accrue interest at the respective short-‐term interest rates.
Amounts deposited at Consorzio Cooperativo Finanziario Per Lo Sviluppo (C.C.F.S.) and Consorzio
Cooperative Costruzioni (C.C.C.) also have the nature of available current accounts on demand and
accrue interest.
At 31 December 2013 Current financial assets amounted to € 13,208 thousand (at 31 December 2012: €
11,202 thousand).
This item is mainly composed of:

46 CONSOLIDATED FINANCIAL STATEMENTS FOR THE YEAR ENDED 31 DECEMBER 2013
› the pledged current accounts related to the collection service of the receivables transferred
without recourse to Intesa San Paolo (€ 9,512 thousand);
› escrow amounts paid as part of business combinations for € 660 thousand;
› receivables of € 958 thousand for assignments of contracts and transfers of business units to third
parties, € 470 thousand of which related to the transactions carried out by the sub-‐group MIA in the
year;
› an overall amount of € 1,436 thousand of receivables from short-‐term loans and financial accounts
held with non-‐consolidated companies belonging to the Group.
13. NON-‐CURRENT ASSETS HELD FOR DISPOSAL AND LIABILITIES DIRECTLY ASSOCIATED WITH ASSETS HELD FOR DISPOSAL
In the course of the financial year the Management carried out an operation to streamline the business
involving the construction, installation and operation of the photovoltaic plants under the control of the
subsidiary Energyproject S.r.l., in view of the sale of the same to third parties. On 5 July 2013
Energyproject S.r.l. acquired the total quota in Mowbray S.r.l., a company which is active in the
construction and operation of photovoltaic projects and plants. Currently this company is the sole
owner of the photovoltaic plant named “Modena Fiere Pensiline”, which is operated by the same and
which has been built and developed by Energyproject in its capacity as an EPC contractor. On 3 February
2014 an agreement was reached for the transfer of the total quotas of the quota capital of
Energyproject S.r.l. (and of the subsidiary Mowbray S.r.l.) to UMA S.r.l. at a price of € 660 thousand, in
addition to the repayment of the shareholders’ loan of € 4,715 thousand outstanding at 31 December
2013. The balance sheet assets of the two companies were then classified, in the Consolidated Financial
Statements at 31 December 2013, as “Disposal Group”, pursuant to IFRS5. Likewise, the related balance
sheet liabilities were recognised as “Liabilities directly associated with non-‐current assets held for
disposal”.
Finally, in 2012 MIA S.p.A. acquired ABM S.r.l., which was subsequently merged by incorporation into
Unilift S.r.l.. The investment agreement stipulated by the parties provides for selling a residential
property to the sellers or third parties. The property is located in Noventa Vicentina (VI) and it has been
mortgaged. On 20 January 2014 Unilift S.r.l. completed the sale of the property to the former
quotaholders of ABM S.r.l. at the agreed price, subject to the prior redemption of the mortgage
encumbering the property for € 51 thousand.
Non-‐current assets held for disposal
At 31 December 2013 non-‐current assets held for disposal amounted to € 7,868 thousand.
31 December
2013 31 December
2012
Energyproject S.r.l. balance sheet assets 7,391 0 Mowbray S.r.l. balance sheet assets 347 0 Residential property owned by Unilift S.r.l 130 130
NON-‐CURRENT ASSETS CLASSIFIED AS HELD FOR SALE 7,868 130

47 CONSOLIDATED FINANCIAL STATEMENTS FOR THE YEAR ENDED 31 DECEMBER 2013
The table below shows an analytical breakdown of the item:
31 December 2013 31 December 2012
Energyproject S.r.l.
Mowbray S.r.l.
Unilift S.r.l.
Total Unilift S.r.l.
Total
Property, plant and equipment 130 130 130 130
Deferred tax assets 524 524 Current tax receivables 1,319 1,319 Inventories 3,388 3,388 Other non-‐current assets 31 27 57 Trade receivables and advances to suppliers 704 6 710 Current financial assets 100 100 Other current assets 270 194 464 Cash and cash equivalents 1,055 120 1,175
TOTAL ASSETS CLASSIFIED AS HELD FOR SALE
7,391 347 130 7,868 130 130
Liabilities directly associated with non-‐current assets held for disposal
At 31 December 2013 Liabilities directly associated with assets held for disposal amounted to € 2,420
thousand.
31 December
2013 31 December
2012
Energyproject S.r.l. balance sheet liabilities 1,863 0 Mowbray S.r.l. balance sheet liabilities 77 0 Provisions for risks and charges in consolidated accounts 425 0 Non-‐current loans (mortgages) of Unilift S.r.l. 56 64
LIABILITIES DIRECTLY ASSOCIATED WITH NON-‐CURRENT ASSETS CLASSIFIED AS HELD FOR SALE
2,420 64
The table below shows an analytical breakdown of the comparative item:
31 December 2013 31 December 2012
Energyproject S.r.l.
Mowbray S.r.l.
Unilift S.r.l.
Total Unilift S.r.l.
Total
Employee termination indemnity 2 2 0 Provisions for risks and charges, current in consolidated accounts 425 425 0
Provisions for risks and charges, current 731 731 0
Trade payables and advances from customers 149 8 157 0
Current tax payables 69 69 0
Other current liabilities 879 879 0 Long-‐term debt
56 56 64 64 Bank borrowings, including current portion of long-‐term debt, and other financial liabilities
100 100 0
TOTAL LIABILITIES DIRECTLY ASSOCIATED WITH NON-‐CURRENT ASSETS CLASSIFIED AS HELD FOR SALE
2,287 77 56 2,420 64 64

48 CONSOLIDATED FINANCIAL STATEMENTS FOR THE YEAR ENDED 31 DECEMBER 2013
In the cases listed, a comparison is provided of the carrying amount of assets held for disposal or the
asset disposal group recorded in the financial statements with the market value or sale price set by
contract, net of transaction costs. The measurement of the group of assets transferred with the
investments in Energyproject S.r.l. and Mowbray S.r.l. (net of liabilities directly associated with them)
gave rise to a negative difference with respect to the price set for the sale (including the repayment of
the intergroup loan), which entailed the recognition of a write-‐down under the result for assets being
disposed equal to € 425 thousands.
It should be pointed out that a comparison had been made in the previous years between the book
value of assets held for disposal recognised in the accounts in relation to the subsidiary Unilift S.r.l. and
the market value (as a set transfer price was not available), net of transaction costs, without this giving
rise to the need to make write-‐downs.
Income from discontinued operations
The details of income from discontinued operations are shown below:
31 December 2013
31 December 2012
Capital losses on assets sold 0 6 Accruals to future provisions for risks and charges in consolidated accounts 425 0
PROFIT (LOSS) FROM DISCONTINUED OPERATIONS 425 6
In 2013 profit (loss) from discontinued operations showed an overall loss of € 425 thousand, following a
provision of € 425 thousand, representing the difference between the net balance sheet value relating
to the companies in the photovoltaic segment that were transferred in 2014 and the agreed transfer
price.
Profit (loss) from discontinued operations in 2012 related to the capital loss for the sale of a leased
property, which was also acquired with the former ABM S.r.l. and intended for sale to third parties as
required by the investment agreement executed with the seller s.
Cash flows generated/absorbed by discontinued operations
In 2013 discontinued operations generated cash outflows of € 8 thousand, in relation to the payment of
the instalment falling due for the loan of Unilift S.r.l..
In 2012 cash inflows were recognised for € 111 thousand, against the payment of the instalment of the
same loan, in addition to the consideration received with the transfer of the leased property referred to
above.
31 December 2013
31 December 2012
Payment of Unilift S.r.l. loan instalment (8) (8) Payment received 0 119
NET CASH FLOW (8) 111

49 CONSOLIDATED FINANCIAL STATEMENTS FOR THE YEAR ENDED 31 DECEMBER 2013
14. SHARE CAPITAL AND RESERVES
31 December 2013 31 December 2012
Share Capital -‐ Ordinary shares 109,150 109,150
Ordinary shares have a nominal value of Euro 1 each.
Ordinary shares issued and fully paid up at 31 December 2013 amounted to 109,149,600. The Parent
Company does not hold own shares.
Reserves and Retained Earnings
The table below shows changes in shareholders’ equity reserves:
Share premium reserve
Legal reserve
SE reserves companies
valued at SE
Cash flow hedge
reserve
SORIE reserve
Other reserves
Total reserves
e
1 JANUARY 2012 145,018 15,811 (995) (1,035) (2,977) (16,769) 139,053 Allocation of profits of previous years 346 1,326 6,555 8,227
Economic effects on shareholders’ equity (821) 150 (2,388) (3,059)
31 DECEMBER 2012 145,018 16,157 (490) (885) (5,365) (10,214) 144,221 Allocation of profits of previous years 1,312 19,729 21,041
Economic effects on shareholders’ equity 727 885 923 2,535
31 DECEMBER 2013 145,018 17,469 237 0 (4,442) 9,515 167,797
The item Other reserves includes the following items, among the others:
› The reserve originating from the recognition of transactions under common control, which includes
the differences between the purchase cost and the net carrying amount of the assets acquired
under business combinations between entities under joint control, for a negative amount of €
45,400 thousand as at 31 December 2013.
› The Parent Company’s extraordinary reserve (€ 55,861 thousand).
The table below shows changes in Retained earnings:
Accumulated profits (losses) of the Parent Company
Consolidation reserve
Total retained earnings
1 JANUARY 2012 3,809 16,376 20,185 Allocation of profits of previous years 2,897 2,897 Acquisition/ Transfer of minority shares of subsidiaries 458 458
31 DECEMBER 2012 3,809 19,731 23,540 Allocation of profits of previous years 11,533 11,533 Acquisition/ Transfer of minority shares of subsidiaries (1,467) (1,467) 31 December 2013 3,809 29,797 33,606

50 CONSOLIDATED FINANCIAL STATEMENTS FOR THE YEAR ENDED 31 DECEMBER 2013
15. EMPLOYEE TERMINATION INDEMNITY (TFR)
Movements in liabilities relating to Employee Termination Indemnity (TFR) in 2013 are shown below,
compared with movements in the previous year.
Financial year ended
At 31 December 2013
At 31 December 2012
At 1 January 31,321 31,356 Increases for personnel acquired in business combinations 198 239 Current service cost 698 560 Interest costs on benefit obligation 1,058 1,110 Curtailment 32 0 Settlements 0 11 Benefits paid (4,247) (5,249) Net actuarial (gains)/ losses recognized in the period (1,273) 3,294 Other (2) 0 AT 31 DECEMBER 27,785 31,321
The increases for business combinations refer to acquisitions made by the sub-‐group MIA S.p.A. during
the year (€ 52 thousand) and to the acquisition of the Auchan business unit (€ 146 thousand). In this
regard, reference should be made to note no. 3.
The year saw the recognition of actuarial gains on the Employee Severance Indemnity (ESI) of
consolidated companies for € 1,273 thousand (actuarial losses for €3,294 thousand as at 31 December
2012), connected to the changes in the financial assumptions for € 1,074 thousand.
Details of the net cost of the benefit relating to ESI are shown below:
Year ended
At 31 December 2013
At 31 December 2012
Curtailment 32 0 Current service cost 698 560 Interest costs on benefits obligation 1,058 1,110 Net cost of the benefits recognized in the statement of income 1,788 1,670 Net actuarial (gains)/ losses recognized (1,273) 3,294
TOTAL 515 4,964
The main financial and demographic assumptions used in the actuarial valuation of the obligation
relating to ESI are illustrated below:
At 31 December 2013
At 31 December 2012
Discount rate 3.30% 2.90% Inflation rate 2.00% 2.00% Estimated turnover From 1.5% to 11.50% From 1.5% to 11.50%

51 CONSOLIDATED FINANCIAL STATEMENTS FOR THE YEAR ENDED 31 DECEMBER 2013
The discount rates used to assess the ESI obligation are defined on the basis of curves of rates of return
of high-‐quality fixed-‐interest securities, the amounts and maturity dates of which correspond to the
amounts and maturity dates of the payments of expected future benefits. In 2013 the discount rate was
equal to 3.30% (2012: 2.90%).
The estimated turnover rate is presented in a range as the actuary appointed by Group Companies for
the actuarial estimate of the liability used different turnover rates for the individual companies.
The effects on the ESI obligation from the increasing or decreasing measurement of the financial rates in
relation to reasonably possible changes in interests rates and in the assumptions of average duration of
the working population, while maintaining all the other variables unchanged, are illustrated below:
Discount rate
Actuarial assumptions
Employee termination indemnity
Financial year ended 31 December 2013 + 0.25 bps + 0.08 pps 27,148 -‐ 0.25 bps -‐ 0.08 pps 28,448 Financial year ended 31 December 2012 + 0.25 bps + 0.13 pps 29,021 -‐ 0.25 bps -‐ 0.13 pps 30,365
Below are reported the data relating to the average number of the Group’s employees and of the
workers provided to the Group by Manutencoop Società Cooperativa:
2013 2012
Executives 63 64 Office workers 1,658 1,652 Manual workers 13,290 12,876
AVERAGE STAFF 15,011 14,592
In 2013, the average number of leased personnel employed, including those shown in the table, stood at
597 (2012: 604).
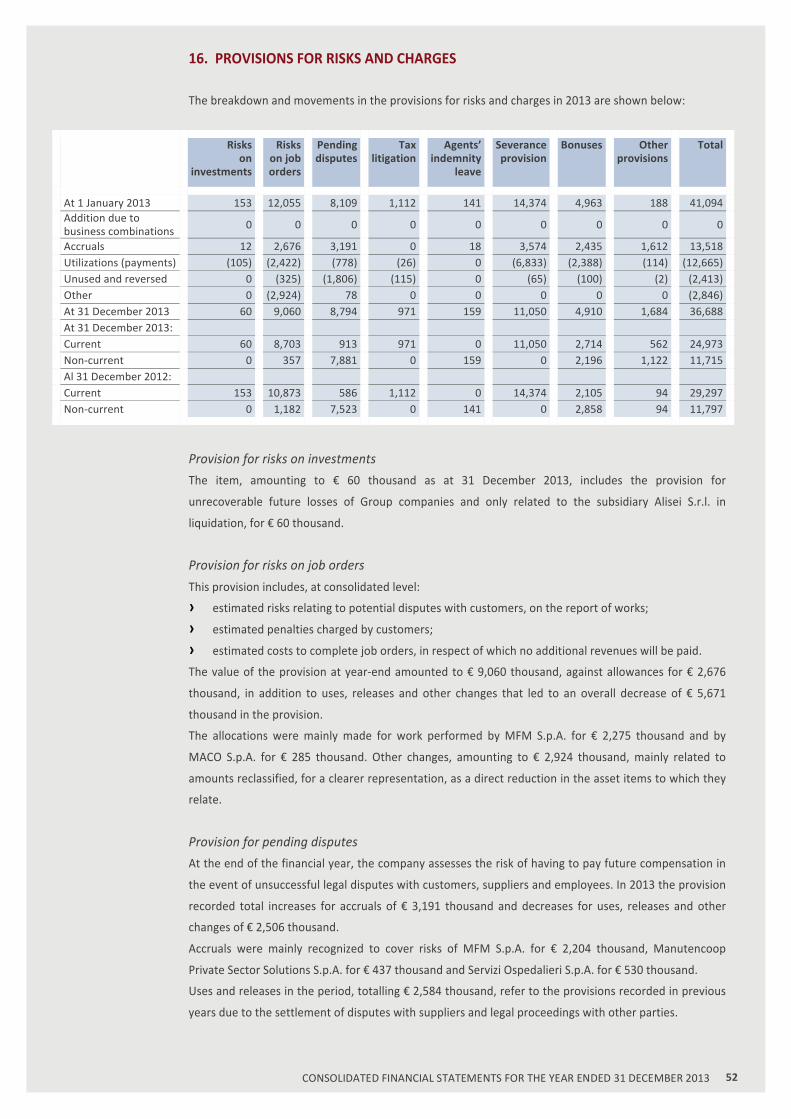
52 CONSOLIDATED FINANCIAL STATEMENTS FOR THE YEAR ENDED 31 DECEMBER 2013
16. PROVISIONS FOR RISKS AND CHARGES
The breakdown and movements in the provisions for risks and charges in 2013 are shown below:
Risks on
investments
Risks on job orders
Pending disputes
Tax litigation
Agents’ indemnity
leave
Severance provision
Bonuses Other provisions
Total
At 1 January 2013 153 12,055 8,109 1,112 141 14,374 4,963 188 41,094 Addition due to business combinations 0 0 0 0 0 0 0 0 0
Accruals 12 2,676 3,191 0 18 3,574 2,435 1,612 13,518 Utilizations (payments) (105) (2,422) (778) (26) 0 (6,833) (2,388) (114) (12,665) Unused and reversed 0 (325) (1,806) (115) 0 (65) (100) (2) (2,413) Other 0 (2,924) 78 0 0 0 0 0 (2,846) At 31 December 2013 60 9,060 8,794 971 159 11,050 4,910 1,684 36,688 At 31 December 2013: Current 60 8,703 913 971 0 11,050 2,714 562 24,973 Non-‐current 0 357 7,881 0 159 0 2,196 1,122 11,715 Al 31 December 2012: Current 153 10,873 586 1,112 0 14,374 2,105 94 29,297 Non-‐current 0 1,182 7,523 0 141 0 2,858 94 11,797
Provision for risks on investments
The item, amounting to € 60 thousand as at 31 December 2013, includes the provision for
unrecoverable future losses of Group companies and only related to the subsidiary Alisei S.r.l. in
liquidation, for € 60 thousand.
Provision for risks on job orders
This provision includes, at consolidated level:
› estimated risks relating to potential disputes with customers, on the report of works;
› estimated penalties charged by customers;
› estimated costs to complete job orders, in respect of which no additional revenues will be paid.
The value of the provision at year-‐end amounted to € 9,060 thousand, against allowances for € 2,676
thousand, in addition to uses, releases and other changes that led to an overall decrease of € 5,671
thousand in the provision.
The allocations were mainly made for work performed by MFM S.p.A. for € 2,275 thousand and by
MACO S.p.A. for € 285 thousand. Other changes, amounting to € 2,924 thousand, mainly related to
amounts reclassified, for a clearer representation, as a direct reduction in the asset items to which they
relate.
Provision for pending disputes
At the end of the financial year, the company assesses the risk of having to pay future compensation in
the event of unsuccessful legal disputes with customers, suppliers and employees. In 2013 the provision
recorded total increases for accruals of € 3,191 thousand and decreases for uses, releases and other
changes of € 2,506 thousand.
Accruals were mainly recognized to cover risks of MFM S.p.A. for € 2,204 thousand, Manutencoop
Private Sector Solutions S.p.A. for € 437 thousand and Servizi Ospedalieri S.p.A. for € 530 thousand.
Uses and releases in the period, totalling € 2,584 thousand, refer to the provisions recorded in previous
years due to the settlement of disputes with suppliers and legal proceedings with other parties.

53 CONSOLIDATED FINANCIAL STATEMENTS FOR THE YEAR ENDED 31 DECEMBER 2013
Tax litigation
In 2013, uses totalled € 26 thousand, while releases amounted to € 115 thousand, as a result of the
completion of certain tax assessments.
Severance provision
This provision relates to the amounts due for severance and employee redundancy costs, as part of the
restructuring plans implemented by some Group companies over the last few years.
At 31 December 2012 the Group had recognized provisions totalling € 14,374 thousand, € 5,638
thousand of which in Telepost S.p.A., € 6,750 thousand in Manutencoop Private Sector Solutions S.p.A.,
€ 1,254 thousand in MACO S.p.A. and € 732 thousand in EnergyProject S.r.l.. In 2013 there were uses of
€ 6,833 thousand, € 356 thousand of which in MACO S.p.A., € 2,354 thousand in Telepost S.p.A., € 733
thousand in EnergyProject S.r.l. and € 3,390 thousand in Manutencoop Private Sector Solutions S.p.A..
At 31 December 2013 the Group started an additional plan at the subsidiary Servizi Ospedalieri S.p.A.
and, therefore, provisions of € 2,679 thousand were set aside; furthermore, the provision for
Manutencoop Private Sector Solutions S.p.A. was increased by € 745 thousand as a result of the
additions to the restructuring plan already in place.
Provision for bonuses
This provision includes accrual for future payments to the Group’s management, in relation to the
medium and long-‐term bonus system adopted by the Group.
Changes that occurred in 2013 comprised new accruals for € 2,435 thousand and uses and releases for a
total of € 2,488 thousand.
Other provisions for risks and charges
In 2013 the provision, amounting to € 1,684 thousand as at 31 December 2013, recorded accruals of €
1,612 thousand, mainly due to provisions set aside by S.AN.CO. Soc. Cons.ar.l. for € 992 thousand and by
MFM S.p.A. for € 447 thousand, as well as uses and releases of € 116 thousand.
17. DERIVATIVES
The Group entered into 3 different interest rate swaps to cover any risk arising from fluctuations in the
variable interest rate of the loan agreement entered into with BNL/BNP in the course of 2008 in support
of the business combinations carried out.
Following the above-‐mentioned issue of Senior Secured Notes and the early repayment of the said loan,
the abovementioned IRS contracts were terminated and then subject to unwind, on the basis of the
mark-‐to-‐market value recorded as at 1 August 2013. The overall unwinding value, equal to € 721
thousand, was credited to respective participating banks at the value date of 5 August 2013 and
recognized as a financial charge for the period.
At 31 December 2013 there were no derivative contracts.
18. BORROWINGS, LOANS AND OTHER CURRENT FINANCIAL LIABILITIES
The items Non-‐current loans and Loans and other current financial liabilities include both the non-‐
current and current portion of loans from credit institutions and consortium members, respectively.
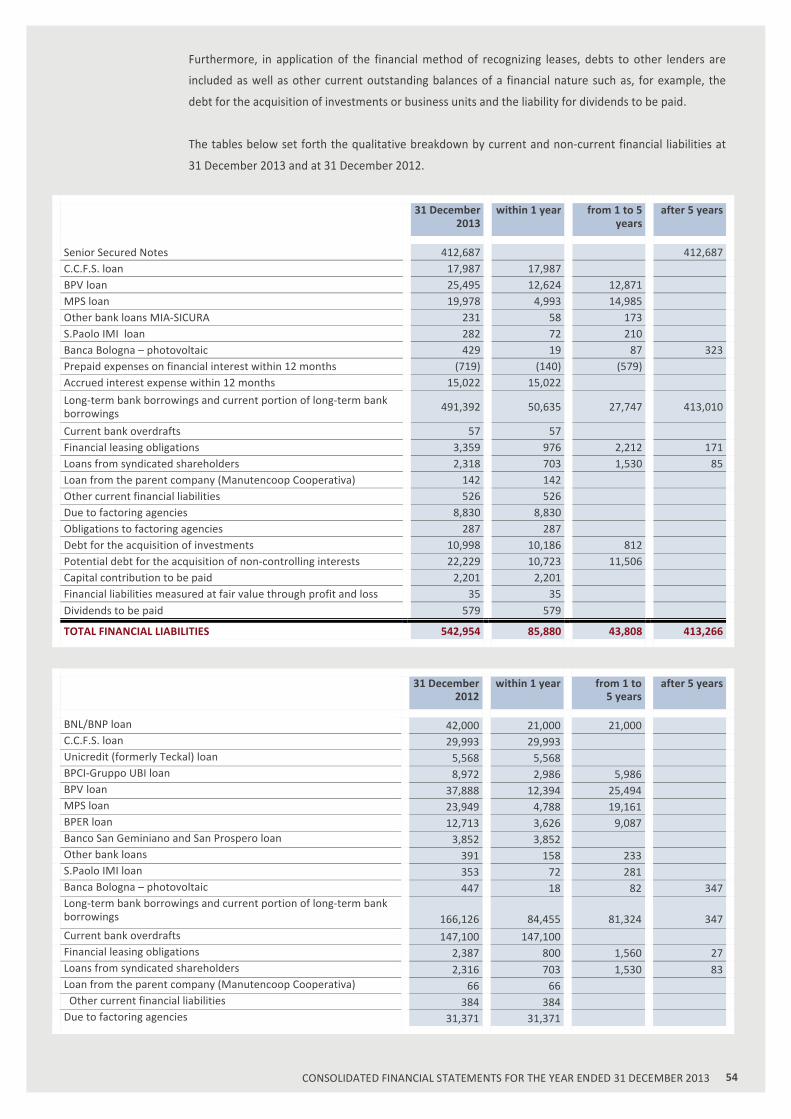
54 CONSOLIDATED FINANCIAL STATEMENTS FOR THE YEAR ENDED 31 DECEMBER 2013
Furthermore, in application of the financial method of recognizing leases, debts to other lenders are
included as well as other current outstanding balances of a financial nature such as, for example, the
debt for the acquisition of investments or business units and the liability for dividends to be paid.
The tables below set forth the qualitative breakdown by current and non-‐current financial liabilities at
31 December 2013 and at 31 December 2012.
31 December 2013
within 1 year from 1 to 5 years
after 5 years
Senior Secured Notes 412,687 412,687 C.C.F.S. loan 17,987 17,987 BPV loan 25,495 12,624 12,871 MPS loan 19,978 4,993 14,985 Other bank loans MIA-‐SICURA 231 58 173 S.Paolo IMI loan 282 72 210 Banca Bologna – photovoltaic 429 19 87 323 Prepaid expenses on financial interest within 12 months (719) (140) (579) Accrued interest expense within 12 months 15,022 15,022 Long-‐term bank borrowings and current portion of long-‐term bank borrowings 491,392 50,635 27,747 413,010
Current bank overdrafts 57 57 Financial leasing obligations 3,359 976 2,212 171 Loans from syndicated shareholders 2,318 703 1,530 85 Loan from the parent company (Manutencoop Cooperativa) 142 142 Other current financial liabilities 526 526 Due to factoring agencies 8,830 8,830 Obligations to factoring agencies 287 287 Debt for the acquisition of investments 10,998 10,186 812 Potential debt for the acquisition of non-‐controlling interests 22,229 10,723 11,506 Capital contribution to be paid 2,201 2,201 Financial liabilities measured at fair value through profit and loss 35 35 Dividends to be paid 579 579
TOTAL FINANCIAL LIABILITIES 542,954 85,880 43,808 413,266
31 December 2012
within 1 year from 1 to 5 years
after 5 years
BNL/BNP loan 42,000 21,000 21,000 C.C.F.S. loan 29,993 29,993 Unicredit (formerly Teckal) loan 5,568 5,568 BPCI-‐Gruppo UBI loan 8,972 2,986 5,986 BPV loan 37,888 12,394 25,494 MPS loan 23,949 4,788 19,161 BPER loan 12,713 3,626 9,087 Banco San Geminiano and San Prospero loan 3,852 3,852 Other bank loans 391 158 233 S.Paolo IMI loan 353 72 281 Banca Bologna – photovoltaic 447 18 82 347 Long-‐term bank borrowings and current portion of long-‐term bank borrowings
166,126
84,455
81,324
347
Current bank overdrafts 147,100 147,100 Financial leasing obligations 2,387 800 1,560 27 Loans from syndicated shareholders 2,316 703 1,530 83 Loan from the parent company (Manutencoop Cooperativa) 66 66 Other current financial liabilities 384 384 Due to factoring agencies 31,371 31,371

55 CONSOLIDATED FINANCIAL STATEMENTS FOR THE YEAR ENDED 31 DECEMBER 2013
31 December 2012
within 1 year from 1 to 5 years
after 5 years
Debt for the acquisition of investments 2,442 500 1,942 Potential debt for the acquisition of non-‐controlling interests 32,728 328 32,400 Capital contribution to be paid 2,197 2,197 Financial liabilities measured at fair value through profit and loss 237 237 Prepaid expenses on financial interest within 12 months (104) (104) Accrued interest expense within 12 months 103 103 Dividends to be paid 194 194
TOTAL FINANCIAL LIABILITIES 387,547 268,334 118,756 457
Senior Secured Notes (MFM S.p.A.)
On 2 August 2013 the Parent Company MFM S.p.A. issued secured High Yield bonds (Senior Secured
Notes) due 1 August 2020, restricted to institutional investors. The proceeds of the transaction were
used to repay most of the existing bank loans and replace the revolving programmes for the assignment
of trade receivables without recourse. The bonds, which are listed on the Euro MTF Market of the
Luxembourg Stock Exchange and on the Extra MOT Pro Segment of the Italian Stock Exchange, was
issued for a nominal value of € 425 million, with an issue price below par by 98.713%, with a fixed
annual 8.5% coupon on a six-‐monthly settlement basis.
To protect the investment of the Bondholders of the so-‐called notes, the rules governing the bond issue
provide for a system of guarantees and restrictions (covenants). In fact, some limitations are envisaged
on the financial operations of the Issuer and of its subsidiaries, while leaving the Group the freedom of
movement insofar as the operations undertaken contribute, at least potentially, added value and cash
flows to the Group. These restrictions consist of limitations on the possibility of incurrence of
indebtedness and of making distributions of dividends, investments and some types of payments that
fall outside the scope of the so-‐called Restricted Group payments. Furthermore, there are provisions in
relation to the allocation of sums obtained from the transfer of fixed assets, extraordinary operations
and transactions with related parties and the issue of collaterals to third parties on corporate assets. The
restrictions in question lie not so much in the absolute prohibition on carrying out the abovementioned
operations, but rather in checking for compliance with certain financial ratios (incurrence base financial
covenants), the presence of certain conditions or a quantitative limit on the performance of the above
operations. Finally, periodic disclosure obligations are provided for in relation to the Group’s financial
position, results of operation and cash flows.
The limits and provisions envisaged in the rules governing the bond issue are in line with the market
practice for similar operations. The failure by the Issuer to comply with one or more covenants, in
addition to significant events that express a state of insolvency, constitute events of default. For the
most of them, there is the possibility of remediation within a certain period of time. The event of default
relating to the state of insolvency or the absence of remediation of any other events of default are a
reason for acceleration, i.e. the forfeiture of the right to the time limit and the early redemption of the
bonds. As at the reporting date of these financial statements, no events of default had occurred and the
financial covenants, in relation to which no periodic check is required, had been complied with.
Revolving Credit Facility (MFM S.p.A.)
In the framework of the bond issue process, on 31 July 2013 the Parent Company also signed a 3-‐year
Revolving Credit Facility (RCF) agreement that assures a revolving credit line, which can be activated on
request, for a nominal amount of € 30.0 million with a pool of banks made up of UniCredit S.p.A., J.P.

56 CONSOLIDATED FINANCIAL STATEMENTS FOR THE YEAR ENDED 31 DECEMBER 2013
Morgan Chase Bank S.A. Milan Branch, Cassa di Risparmio in Bologna S.p.A. and Mediobanca – Banca di
Credito Finanziario S.p.A.. This line was granted to meet possible temporary cash requirements and thus
gave the Group additional financial flexibility.
The RCF agreement provides for the compliance with a financial covenant that is preliminary to the
possibility of using the line granted. This financial covenant is in line with market practice for similar
financing operations and is observed on a quarterly basis according to the data relating to the last 12
months, as resulting from the financial position, results of operations and cash flows approved in the
quarter prior to the date of request for use. As at the reporting date of these financial statements, the
financial covenants had been complied with and, as from the execution of the agreement, no use of the
line has been requested from the lending banks.
BNL/BNP loan (MFM S.p.A.)
To meet the financial requirements arising from the acquisition of Pirelli IFM S.p.A (afterwards Altair IFM
S.p.A. and now merged into MFM S.p.A.), in December 2008 MFM S.p.A. executed a pool loan
agreement with Banca Nazionale del Lavoro as Agent, repayable in six-‐monthly instalments up to 23
December 2014. After the issue of the Senior Secured Notes on 2 August 2013, this loan was prepaid.
CCFS loan (MFM S.p.A.)
During the 2013 financial year, the Parent Company entered into a loan agreement with CCFS for a debt
on account of capital of € 18,000 thousand, initially falling due in January 2016. The credit line was
repaid in early 2014. The loan has a variable interest rate plus a spread and replaced the credit facility
granted to the Company by the same bank, and that had a residual debt of € 30,000 thousand as at 31
December 2012, falling due in July 2013.
Unicredit (MFM S.p.A., formerly Teckal) loan
At the time of the acquisition of the merged company Teckal S.p.A. in 2007, the Group paid off a
preceding loan of € 18,437 thousand from Unicredit to the acquired company and the previously
existing vendor loan of € 11,438 thousand, taking out a nominal loan of € 25,000 thousand from
Unicredit. After the issue of the Senior Secured Notes on 2 August 2013, this loan was extinguished.
BPCI -‐UBI Group (MFM S.p.A.) loan
On 30 November 2010 the Group executed a loan agreement of € 15 million with Banca Popolare del
Commercio e Industria of the UBI Banca Group. This loan carried variable interest at 1-‐month Euribor
plus a spread, expiring on 30 November 2015 and was to be repaid at six-‐monthly intervals. After the
issue of the Senior Secured Notes on 2 August 2013, this loan was prepaid.
Banca Popolare Emilia Romagna loan (MFM S.p.A.)
The loan of € 12,750 thousand taken out from Banco Popolare Emilia Romagna, expiring on 23 June
2016, envisaged a six-‐monthly repayment plan on variable rates of interest. After the issue of the Senior
Secured Notes on 2 August 2013 this loan was prepaid.
Banco San Geminiano and San Prospero loan (Servizi Ospedalieri S.p.A.)
The unsecured loan from Banco San Geminiano e San Prospero was disbursed to Servizi Ospedalieri
S.p.A. on 13 March 2008, and was repayable in 8 six-‐monthly instalments in arrears. This loan was paid
off on the maturity date (30 June 2013) (the balance at 31 December 2012 was € 3,852 thousand).

57 CONSOLIDATED FINANCIAL STATEMENTS FOR THE YEAR ENDED 31 DECEMBER 2013
Banca Popolare di Vicenza (MFM S.p.A.) loan
The loan of € 50 million was stipulated with Banca Popolare di Vicenza and expires on 31 December
2015, with repayments in half-‐yearly instalments. The loan has variable interest rates equal to the one
month Euribor plus a spread. As at 31 December 2013, the residual debt was € 25,495 thousand.
MPS (MFM S.p.A.) loan
The loan with Banca Monte Paschi comprises a long-‐term credit line at a variable rate plus a spread
amounting to € 25 million, used partially, and expiring on 22 December 2017. The loan agreement also
makes provision for the verification of financial parameters to be calculated on an annual basis on the
consolidated financial statements. As at 31 December 2013 the financial parameters were respected.
As at 31 December 2013 the residual debt was € 19,978 thousand.
Accrued expenses on interest payable
At 31 December 2013 the Group recognised accrued expenses on interest payable of € 15,022 thousand,
of which € 14,952 thousand relating to the amount accrued on the coupon of the Senior Secured Notes
due 2 February 2014.
Current bank overdrafts and hot money
Current bank overdrafts are not backed by any guarantee. On 2 August a part of the proceeds from the
issue of the Senior Secured Notes was used to close existing short-‐term credit lines for Parent Company
MFM and its major subsidiaries.
Obligations deriving from financial leasing
The lease contracts stipulated are not secured and refer to the companies MFM S.p.A., Servizi
Ospedalieri S.p.A. and sub-‐group Sicura S.r.l.. Some contracts refer to motor vehicles and plant and
machinery used by Servizi Ospedalieri S.p.A. in the laundering and sterilization production processes.
Loan from the Parent Company (Manutencoop Cooperativa)
This item refers to a financial account on which transactions with the controlling company Manutencoop
Società Cooperativa are settled. As at 31 December 2013, the balance was € 142 thousand.
The balance accrues interest at the 3-‐month Euribor rate, plus a spread and is repayable on demand.
The agreement related to this financial account is renewable by tacit agreement.
Syndicated loans
This item refers to financing provided by syndicated shareholders, third parties to consortium
companies included within the scope of consolidation as they are controlled or held under a joint
venture (50%). In certain cases, these loans are interest-‐bearing and repayable on request. In other
cases, they have a contractually defined maturity and, in others still, they do not have a contractually
defined maturity but will essentially be repayable at the end of the long-‐term service contract, on the
basis of which the consortium company was established.
Collections on behalf of Credit Agricole Corporate & Investment Bank and Banca IMI
The debt balance relates to receivables transferred under non-‐recourse factoring transactions on a
revolving basis carried out by the Group, collected on behalf of the assignee in the last few days of 2013
and still not paid as at 31 December 2013. As at 31 December 2012, the balance was € 8,830 thousand
(€ 31,371 thousand as at 31 December 2012).

58 CONSOLIDATED FINANCIAL STATEMENTS FOR THE YEAR ENDED 31 DECEMBER 2013
Capital contribution to be paid
The Group recognized obligations for capital contribution to be paid to unconsolidated companies for €
2,201 thousand, € 2,192 thousand of which relates to the incorporation of Synchron Nuovo San Gerardo
S.p.A..
Debt for the acquisition of investments/business units
This line, amounting to € 10,998 thousand at 31 December 2013 (€ 2,442 thousand at 31 December
2012) relates to the amounts still not paid to the transferor within business combinations.
On 24 July 2013 an investment agreement was signed to supplement the provisions of the previous
agreement in 2010 between MIA S.p.A. and the minority shareholders of Lenzi S.p.A., which led, in 2012,
to the recognition of a liability for the Put option granted to the latter on 40% of the investment in the
company. The new agreement has set the transfer price of the shares at € 8,596 thousand, bearing
interest at 7.9% rate up to the date of payment. On 15 November, it was also agreed to make a partial
payment of € 962 thousand, and to finally settle any interest accrued on the debt amounting to € 210
thousand as from the date of execution of the agreement dated July 2013. The value of the liability has
therefore been adjusted, which was previously recognised under long-‐term contingent liabilities, and it
has been reclassified as a short-‐term liability for a balance of € 7,634 thousand still to be paid as at 31
December 2013.
Furthermore, MIA S.p.A. holds commitments to deposit amounts in escrow for a total of € 2,106
thousand, against the already deposited € 660 thousand with the contractually identified parties,
recognized under Other current financial assets.
Finally, payables of € 1,197 thousand have been recognised as consideration still to be paid by Gruppo
Sicura S.r.l. to the holders of minority interests in the subsidiaries that were acquired in the year.
Potential debt for the acquisition of non-‐controlling interests/business units
Any potential debt for the acquisition of investments, recognized to an amount of € 22,229 thousand,
related to:
› the current value of the earn-‐out to be paid to the minorities of Gruppo Sicura S.r.l., that has been
estimated at € 10,610 thousand. The liability is expected to be paid in the course of the 2014
financial year: therefore, it was reclassified as a short-‐term liability. Furthermore, a present value of
€ 7,124 thousand was also recognized for the Put option held by the minorities of the same
company in relation to 20% of the share capital that is still owned by them;
› the current value of the Put option granted to the minorities of Cofam S.r.l. (acquired by MIA S.p.A.
at the beginning of 2009), relating to the 40% stake in share capital that they still own, estimated at
€ 3,459 thousand;
› the current value of the earn-‐out to be paid in relation to the acquisition of ABM S.r.l. by MIA S.p.A.
(merged by incorporation into Unilift S.r.l. during 2012) estimated at € 55 thousand;
› the current value of the Put option granted to the minorities of Unilift S.r.l. (merged by
incorporation into ABM S.r.l. in 2012) estimated at € 924 thousand;
› the current value of the earn-‐out to be paid to the previous quotaholders of SIE S.r.l., acquired in
2012 by MIA S.p.A. and subsequently merged by incorporation into it, estimated at € 37 thousand;
› the current value of the earn-‐out to be paid to the previous owners of MIND S.r.l., acquired in 2012
by MIA S.p.A. and subsequently merged by incorporation into it, estimated at € 21 thousand.
In connection with the fair value measurement of the items described above, the Group recognized net
financial charges against their fair value for € 584 thousand.

59 CONSOLIDATED FINANCIAL STATEMENTS FOR THE YEAR ENDED 31 DECEMBER 2013
19. TRADE PAYABLES, ADVANCES FROM CUSTOMERS AND OTHER CURRENT PAYABLES
The table below sets forth the breakdown of the item as at 31 December 2013 and 31 December 2012:
At 31 December
2013
of which to related parties
At 31 December
2012
of which to related parties
Trade payables 416,705 0 408,549 696 Trade payables to third parties 416,705 0 408,549 696 Trade payables to Manutencoop Cooperativa 11,613 11,613 5,470 5,470 Trade payables to associates within 12 months 21,230 21,230 21,167 21,167 Trade payables to related parties 32,843 32,843 26,637 26,637 Advances from customers and payables for work to be performed 6,872 2 6,365 0 Trade payables and advances from customers 456,420 32,845 441,551 27,333 Payables to directors and statutory auditors 921 0 495 0 Tax payables 65,354 0 66,420 0 Payables to social security within 12 months 10,028 0 9,326 0 Collections on behalf of ATI (“Associazione temporanea di Imprese”) 16,557 0 17,802 0 Payables to employees within 12 months 45,446 0 44,662 0 Other payables within 12 months 5,142 0 4,297 0 Property collection on behalf of customers 2,176 0 2,176 0 Other current operating payables to third parties 145,624 0 145,178 0 Other current payables to Manutencoop Cooperativa 7 7 0 0 Other payables to subsidiaries of the Group 171 171 171 171 Other current operating payables to the related parties 178 178 171 171 Accrued expenses 18 0 106 0 Deferred income 2,715 0 2,906 0 Accrued expenses and deferred income 2,733 0 3,012 0
OTHER CURRENT LIABILITIES 148,535 178 148,361 171
Trade payables do not accrue interest and are settled for, on average, 90/120 days from the invoice date.
The other are non-‐interest bearing payables and are settled, on average, after 30 days, excluding
payables due to employees for accrued 13th and 14th monthly pay and holidays paid at 6 months on
average, and the amounts due to the Tax Authorities for deferred VAT payments settled at the moment
of collection of the related trade receivables.
Trade payables and advances from customers as at 31 December 2013 amounted to € 456,420, against a
balance of € 441,551 at 31 December 2012.
Intercompany trade payables, amounting to € 32,843 thousand as at 31 December 2013, are mainly
composed of payables due to Bologna Multiservizi Soc. Cons. a r.l. for € 5,206 thousand, to Se.Sa.Tre.
Soc. Cons. a r.l. for € 4,166 thousand, to Roma Multiservizi S.p.A. for € 3,628 thousand and to Servizi
Napoli 5 Soc. Cons. a r.l. for € 1,728 thousand.
Other current operating payables showed a balance of € 148,535 as at 31 December 2013 and are
mainly made up of the following items:
› payables to employees of € 45,446 thousand, including the current monthly salaries to be paid in
the months after the closing of the financial year, as well as payables for additional monthly salaries
to be paid (a portion of the 14th salary, to be paid in the month of July). Furthermore, the
corresponding payables to social security institutions were recognized for € 10,028 thousand;

60 CONSOLIDATED FINANCIAL STATEMENTS FOR THE YEAR ENDED 31 DECEMBER 2013
› payables due to tax authorities for € 65,354 thousand, mainly related to the balance of the VAT
payables due from subsidiaries of the Group (€ 53,211 thousand at 31 December 2012);
› collections on behalf of Temporary Associations of Companies for € 16,557 thousand, which relate
to the amounts collected by the Group, on behalf of third parties, mainly relating to job orders
under Consip agreements.
20. OPERATING SEGMENTS
The services provided by the MFM Group can be divided into three primary areas of business, which
coincide with the Strategic Business Units (SBU) where business is channelled. The latter is not affected
by significant seasonality factors.
The SBUs identified coincide with the CGUs where the Group’s activities are conducted. See note 1.1 for
details.
Information on the operating segments for the year ended 31 December 2013
Facility Management
Laundering &
Sterilization
Other Activities
Eliminations Total
Segment revenues 932,654 140,248 13,057 (5,362) 1,080,597 Segment costs (874,466) (132,278) (15,140) 5,362 (1,016,522) Operating income (loss) by segment 58,188 7,970 (2,082) 0 64,075 Share of net profit of associates 2,504 89 2,592 Net financial charges (28,940) Profit before taxes 37,727 Income taxes (23,211) Profit from discontinued operations (425) (425) NET PROFIT FOR THE PERIOD ENDED 31 DECEMBER 2013
14,091
Facility Management
Laundering &
Sterilization
Other Activities
Eliminations Total
Assets allocated to the segment 688,634 152,109 8,446 (3,947) 845,242 Goodwill 403,331 12,810 416,141 Investments valued at Equity 28,892 2,954 852 32,697 Assets classified as held for sale 130 7,738 7,868 Other assets not allocated and related taxes 251,500
SEGMENT ASSETS 1,120,988 167,872 17,036 (3,947) 1,553,449 Liabilities allocated to the segment 586,950 76,998 9,429 (3,947) 669,430 Liabilities classified as held for sale 56 2,363 2,420
Other liabilities not allocated and related taxes 555,344
SEGMENT LIABILITIES 587,006 76,998 11,792 (3,947)
1,227,195

61 CONSOLIDATED FINANCIAL STATEMENTS FOR THE YEAR ENDED 31 DECEMBER 2013
Facility Management
Laundering &
Sterilization
Other Activities
Total
Other segment information as at 31 December 2013
Investments in segment assets 12,161 23,472 613 36,246 Amortisation/depreciation and write-‐downs of segment assets 19,043 24,022 139 43,205
Information on the operating segments for the year ended 31 December 2012
Facility Management
Laundering &
Sterilization
Other Activities
Eliminations Total
Segment Revenues 925,330 134,352 14,622 (1,675) 1,072,629 Segment costs (868,766) (122,547) (23,356) 1,675 (1,012,994) Operating income (loss) by segment 56,564 11,805 (8,734) 0 59,635 Share of net profit of associates 3,119 132 3,251 Net financial charges (19,755) Profit before taxes 43,131 Income taxes (9,823) Profit from discontinued operations (6) NET PROFIT FOR THE PERIOD ENDED 31 DECEMBER 2012
33,302
Facility Management
Laundering &
Sterilization
Other Activities
Eliminations Total
Assets allocated to the segment 626,598 149,815 19,966 (4,771) 791,608 Goodwill 405,914 12,810 418,724 Investments valued at Equity 27,282 2,815 825 30,922 Assets classified as held for sale 130 Other assets not allocated and related taxes 136,697
SEGMENT ASSETS 1,059,794 165,440 20,791 (4,771) 1,378,081 Liabilities allocated to the segment 557,508 80,065 15,728 (4,721) 648,580 Liabilities classified as held for sale 64
Other liabilities not allocated and related taxes 417,451
SEGMENT LIABILITIES 557,508 80,065 15,728 (4,721)
1,066,096
Facility Management
Laundering &
Sterilization
Other Activities
Total
Other segment information as at 31 December 2012
Investments in segment assets 10,858 33,334 243 44,435 Amortisation/depreciation and write-‐downs of segment assets 12,362 19,560 85 32,007

62 CONSOLIDATED FINANCIAL STATEMENTS FOR THE YEAR ENDED 31 DECEMBER 2013
Geographical areas
The Group conducts its core business in Italy. As at 31 December 2013 the activities conducted abroad
were entirely marginal for the Group and generated revenues amounting to € 529 thousand (€ 375
thousand as at 31 December 2012).
The information by geographical area required by IFRS 8 is shown below for the years ended 31
December 2013 and 2012.
Italy Abroad Eliminations Total
Information by Geographical Area as at 31 December 2013
Revenues 1,080,068 529 1,080,597 Non-‐current operating assets 530,515 530,515
Italia Abroad Eliminations Total
Information by Geographical Area as at 31 December 2012
Revenues 1,072,254 375 1,072,629 Non-‐current operating assets 533,660 533,660
It should be pointed out that a share of 9% of consolidated revenues was generated by a key customer
in the Private market (11% in 2012).
21. REVENUES FROM SALES AND SERVICES
The breakdown of the item is shown below for the years ended 31 December 2013 and 31 December
2012:
Financial year ended
31 December
2013 31 December
2012
Revenues from product sales 18,437 15,985 Service revenues 916,577 904,702 Revenues from construction activities and plant installation 116,179 122,986 Other sales revenues 26,739 26,655
REVENUES FROM SALES AND SERVICE 1,077,932 1,070,328
As at 31 December 2013, the item Revenues from sales and service amounted to €1,077,932 thousand (€
1,070,328 thousand as at 31 December 2012).
The scope of consolidation did not report any significant changes in terms of acquisitions of companies
in the financial year. Therefore, the increase recorded in the item was only attributable to the
endogenous growth of the Group, also in consideration of the reduction in the business volumes linked
to the “Other” activities segment (mainly building and operation of photovoltaic plants), for which the
Group is continuing the plan of disposal that had already been started by the Management in previous
years.

63 CONSOLIDATED FINANCIAL STATEMENTS FOR THE YEAR ENDED 31 DECEMBER 2013
22. OTHER REVENUES
The breakdown of the item is shown below for the years ended 31 December 2013 and 2012:
Financial year ended
31 December 2013 31 December 2012
Contributions 1,155 729 Asset capital gains 583 352 Recovery of costs -‐ seconded personnel 100 85 Recovery of other costs 0 48 Payment of damages 374 449 Revenues for leases and rentals 21 20 Other revenues 432 618
OTHER REVENUES 2,665 2,301
As at 31 December 2013, the balance of Other revenues was € 2,665 thousand, compared to € 2,301
thousand in 2012. Capital gains were predominantly realised by Servizi Ospedalieri through the sale of
linen and machinery no longer usable in linen rental and industrial laundering activities.
The item also includes additional revenues deriving from the energy management of some photovoltaic
plants. Finally, an amount of € 1,155 thousand was recognised as operating grants, mainly relating to
employee training projects, as well as an amount of € 121 thousand of grants relating to the security of
some industrial laundering plants which were damaged as a result of the earthquake that occurred in
Emilia Romagna in 2012.
23. COSTS OF RAW MATERIALS AND CONSUMABLES
The breakdown of the item is shown below for the years ended 31 December 2013 and 31 December
2012:
Financial year ended
31 December 2013 31 December 2012
Change in inventories of fuel and raw materials 3,972 1,237 Fuel consumption 86,021 76,980 Consumption of raw materials 57,451 58,907 Purchase of semi-‐finished/finished products 7,175 6,529 Purchase of auxiliary materials and consumables 14,388 14,428 Packaging 1,933 1,955 Other purchases 2,771 3,132
CONSUMPTION OF RAW MATERIALS AND CONSUMABLES 173,711 163,168
As at 31 December 2013 the item amounted to € 173,711 thousand compared to € 163,168 thousand as
at 31 December 2012. The rise in consumption (€ 10,543 thousand) is mainly due to increasing fuel costs
for integrated service contracts. The item was affected by the general rise in market prices compared to
the previous year, as well as by the higher weight on the mix of the total services rendered in relation o
the orders of integrated services and heat management.

64 CONSOLIDATED FINANCIAL STATEMENTS FOR THE YEAR ENDED 31 DECEMBER 2013
24. COSTS FOR SERVICES AND USE OF THIRD PARTY ASSETS
The breakdown of the item is shown below for the years ended 31 December 2013 and 31 December
2012:
Financial year ended
31 December
2013 31 December
2012
Third-‐party services 258,978 276,831 Consortia services 10,816 11,800 Equipment maintenance and repair 8,066 10,090 Professional services 40,573 37,629 Statutory Auditors’ fees 857 816 Transport 9,327 9,310 Advertising and promotion 973 1,309 Bonuses and commissions 2,140 1,926 Insurance and sureties 4,825 6,723 Bank services 431 456 Utilities 12,521 18,387 Travel expenses and reimbursement of expenses 3,729 3,962 Employee services 8,926 8,003 Other services 5,656 7,640 Costs for services 367,818 394,882 Rent expense 21,512 22,782 Rentals and other 4,899 2,317 Costs for leased assets 26,411 25,099
COSTS FOR SERVICES AND USE OF THIRD PARTY ASSETS 394,229 419,981
For the year ended 31 December 2013, Costs for services and use of third party assets totalled € 394,229
thousand, marking a decrease of € 25,752 thousand compared to the previous year, mainly due to lower
costs for third party services (€ 17,853 thousand). Already in the previous years the Group started up a
process to increase insourcing of certain activities, which resulting in a change in the mix of production
factors in favour of the cost of labour, as described in note 25 below. At the same time, the group set
targets for limiting general costs and overhead, also by reducing recourse to professional services.
Furthermore, note lower costs for utilities (€ 5,866 thousand), as a result of the conclusion of some
contracts of integrated services and the transfer of the related utilities contracts to new entities.
Finally, Costs for services connected with the bond issue carried out in the year recorded an overall
amount of € 3,350 thousand.

65 CONSOLIDATED FINANCIAL STATEMENTS FOR THE YEAR ENDED 31 DECEMBER 2013
25. PERSONNEL COSTS
The breakdown of the item is shown below for the years ended 31 December 2013 and 31 December
2012:
Financial year ended
31 December
2013 31 December
2012
Wages and salaries 244,738 230,128 Social security charges 78,480 73,347 Secondment costs 38,758 37,259 ESI paid to INPS (National Social Security Institute), and to funds 14,486 13,874 Directors’ fees 3,239 3,207 Other personnel costs 2,683 1,466 Current benefits 382,384 359,281 Employee termination indemnity provision 1,787 1,961 Other subsequent benefits 0 35 Subsequent benefits 1,787 1,996 Employment termination 3,586 4,008 Employment termination benefits 3,586 4,008
PERSONNEL COST 387,757 365,285
As at 31 December 2013, Personnel Costs (equal to € 387,757 thousand) rose by € 22,472 thousand
compared to the same period in the previous year (€ 365,285 thousand). This change is related to the
net effect of various factors, such as:
› progressive recovery of efficiency following the company reorganisation policies started up in the
previous years;
› a rise in the average number of workers, partly due to the insourcing process described in note 24,
and partly due to the use of personnel in the changed contracts in the Hygiene segment;
› additional reorganisation efforts for certain companies in the Group, which also in 2013 entailed
costs for mobility, extraordinary lay-‐off schemes and voluntary redundancy incentives.
The comprehensive change in Group personnel costs is necessarily correlated to the cost of services, as
the mix of production costs linked to “internal” work (i.e. work performed by employees of group
companies) and “external" work (i.e. work performed by third-‐party providers) can change significantly
according to organisational changes aimed at increasing overall productivity.
The ratio between Sales and service revenues and the amount of such costs (total costs for personnel,
third-‐party services, consortia services and professional services) remained at an almost constant level
compared to the previous year (1.54 for 2013 against 1.55 for 2012). The slight decline in the ratio was
affected by the impact of significant costs for consultancy and professional services incurred in 2013 as a
result of the bond issue.

66 CONSOLIDATED FINANCIAL STATEMENTS FOR THE YEAR ENDED 31 DECEMBER 2013
26. OTHER OPERATING COSTS
The breakdown of the item is shown below for the years ended 31 December 2013 and 31 December
2012:
Financial year ended
31 December
2013 31 December
2012
Capital losses on disposals 107 66 Losses on receivables 126 260 Other taxes 2,079 2,005 Fines and penalties 2,038 2,279 Credit discount on assignments of receivables 602 1,594 Other operating costs 3,401 4,109
OTHER OPERATING COSTS 8,353 10,313
Other operating costs recognized € 897 thousand of penalties requested by the Tax Authority. On 4
March 2013 the Emilia Romagna Regional Head Office of the Italian Revenue Agency (“Agenzia delle
Entrate”) started a full tax audit on the Parent Company, MFM S.p.A., in connection with the tax year
2010. The tax audit was completed on 30 May 2013 with the service of two PVCs (Processi Verbali di
Constatazione, Reports on findings), in which the only remark was the non-‐compliance with VAT
reduced rate, which had been wrongly applied in the invoices related to a specific contract. The
management then filed formal notices of acceptance of the PVCs with the competent tax offices, which
were followed by the related “atti di definizione” (deeds of settlement) of the Italian Revenue Agency,
which required the payment of € 4,019 thousand on account of VAT, a penalty of € 837 thousand and €
376 thousand on account of interest. MFM S.p.A. has already taken steps to ask the client, to which the
reduced rate has been invoiced in place of the standard rate, to refund the portion of tax involved (€
4,019 thousand), applying the so called principle of recourse (rivalsa) laid down under article 93,
paragraph 1, of Decree Law no. 1 of 24 January 2012, as converted by Law no. 27 of 24 March 2012. The
tax debt for the financial years following that of the audit was also paid off, entailing additional costs of
€ 60 thousand of penalties and € 36 thousand on account of interest.
A reduction was recorded in credit discount costs connected to the assignments of trade receivables
without recourse, as a result of the exit from the plans for revolving assignments in place with Credit
Agricole Corporate & Investment Bank e Banca IMI.
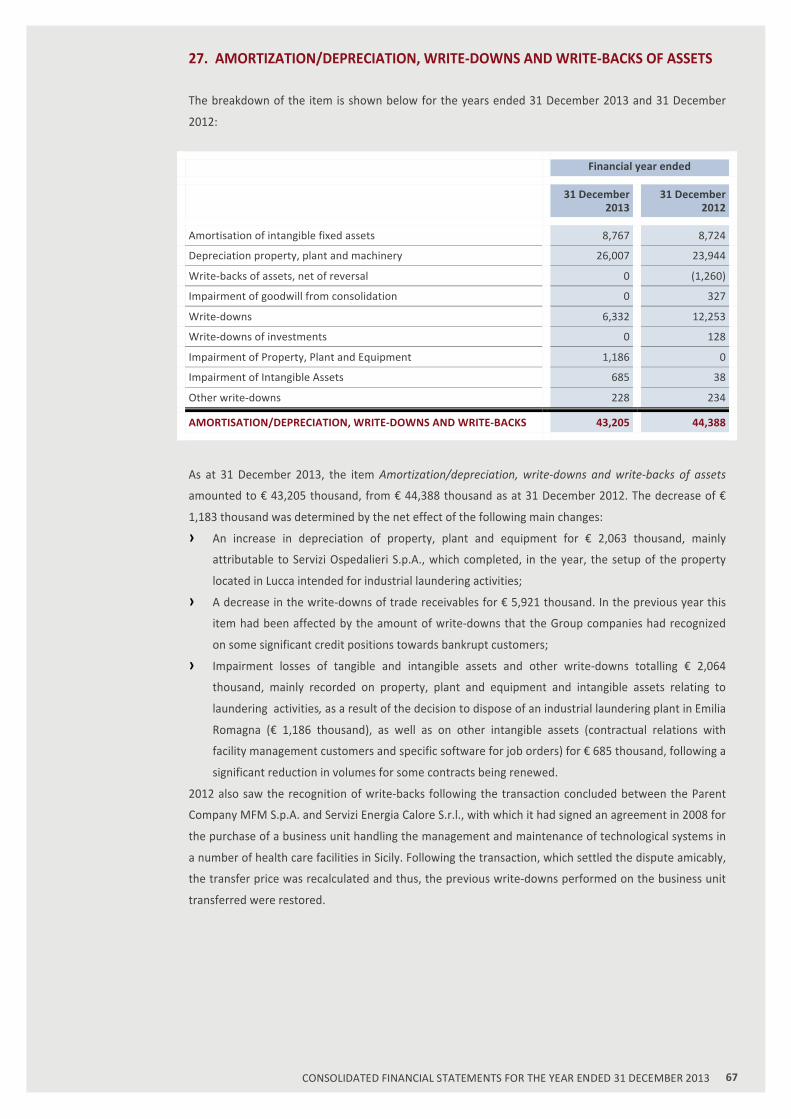
67 CONSOLIDATED FINANCIAL STATEMENTS FOR THE YEAR ENDED 31 DECEMBER 2013
27. AMORTIZATION/DEPRECIATION, WRITE-‐DOWNS AND WRITE-‐BACKS OF ASSETS
The breakdown of the item is shown below for the years ended 31 December 2013 and 31 December
2012:
Financial year ended
31 December
2013 31 December
2012
Amortisation of intangible fixed assets 8,767 8,724
Depreciation property, plant and machinery 26,007 23,944
Write-‐backs of assets, net of reversal 0 (1,260)
Impairment of goodwill from consolidation 0 327
Write-‐downs 6,332 12,253
Write-‐downs of investments 0 128
Impairment of Property, Plant and Equipment 1,186 0
Impairment of Intangible Assets 685 38
Other write-‐downs 228 234
AMORTISATION/DEPRECIATION, WRITE-‐DOWNS AND WRITE-‐BACKS 43,205 44,388
As at 31 December 2013, the item Amortization/depreciation, write-‐downs and write-‐backs of assets
amounted to € 43,205 thousand, from € 44,388 thousand as at 31 December 2012. The decrease of €
1,183 thousand was determined by the net effect of the following main changes:
› An increase in depreciation of property, plant and equipment for € 2,063 thousand, mainly
attributable to Servizi Ospedalieri S.p.A., which completed, in the year, the setup of the property
located in Lucca intended for industrial laundering activities;
› A decrease in the write-‐downs of trade receivables for € 5,921 thousand. In the previous year this
item had been affected by the amount of write-‐downs that the Group companies had recognized
on some significant credit positions towards bankrupt customers;
› Impairment losses of tangible and intangible assets and other write-‐downs totalling € 2,064
thousand, mainly recorded on property, plant and equipment and intangible assets relating to
laundering activities, as a result of the decision to dispose of an industrial laundering plant in Emilia
Romagna (€ 1,186 thousand), as well as on other intangible assets (contractual relations with
facility management customers and specific software for job orders) for € 685 thousand, following a
significant reduction in volumes for some contracts being renewed.
2012 also saw the recognition of write-‐backs following the transaction concluded between the Parent
Company MFM S.p.A. and Servizi Energia Calore S.r.l., with which it had signed an agreement in 2008 for
the purchase of a business unit handling the management and maintenance of technological systems in
a number of health care facilities in Sicily. Following the transaction, which settled the dispute amicably,
the transfer price was recalculated and thus, the previous write-‐downs performed on the business unit
transferred were restored.
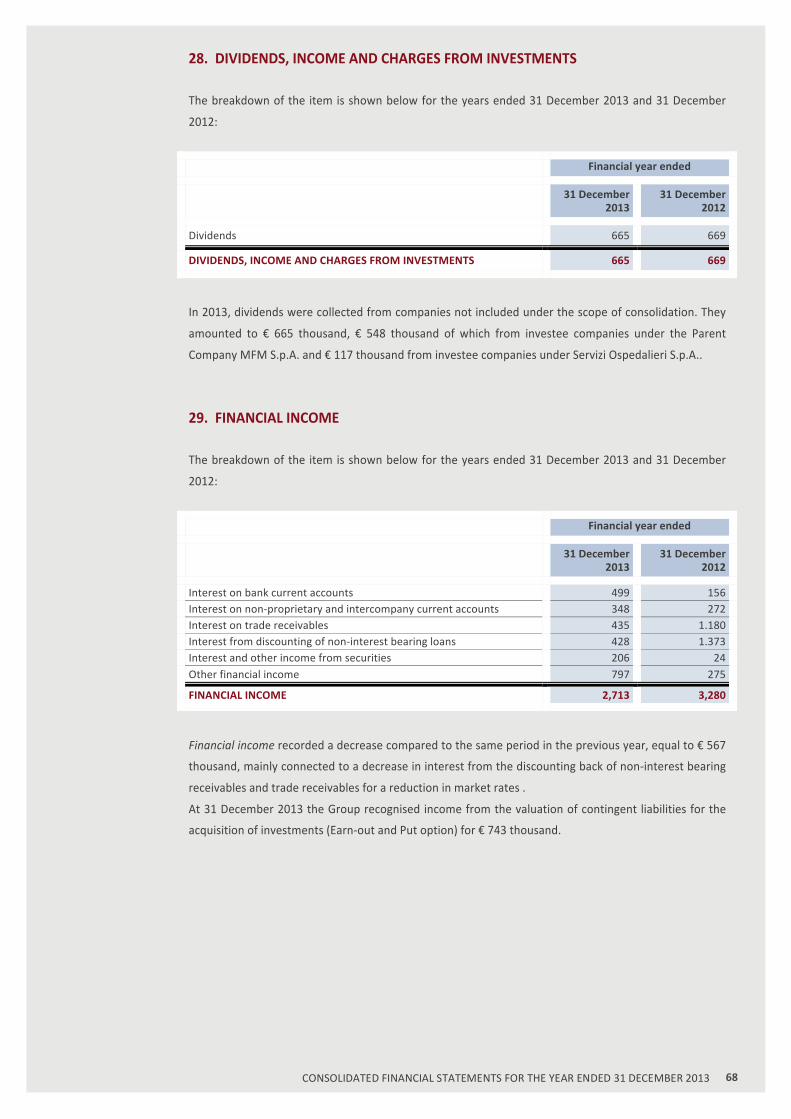
68 CONSOLIDATED FINANCIAL STATEMENTS FOR THE YEAR ENDED 31 DECEMBER 2013
28. DIVIDENDS, INCOME AND CHARGES FROM INVESTMENTS
The breakdown of the item is shown below for the years ended 31 December 2013 and 31 December
2012:
Financial year ended
31 December
2013 31 December
2012
Dividends 665 669
DIVIDENDS, INCOME AND CHARGES FROM INVESTMENTS 665 669
In 2013, dividends were collected from companies not included under the scope of consolidation. They
amounted to € 665 thousand, € 548 thousand of which from investee companies under the Parent
Company MFM S.p.A. and € 117 thousand from investee companies under Servizi Ospedalieri S.p.A..
29. FINANCIAL INCOME
The breakdown of the item is shown below for the years ended 31 December 2013 and 31 December
2012:
Financial year ended
31 December
2013 31 December
2012
Interest on bank current accounts 499 156 Interest on non-‐proprietary and intercompany current accounts 348 272 Interest on trade receivables 435 1.180 Interest from discounting of non-‐interest bearing loans 428 1.373 Interest and other income from securities 206 24 Other financial income 797 275
FINANCIAL INCOME 2,713 3,280
Financial income recorded a decrease compared to the same period in the previous year, equal to € 567
thousand, mainly connected to a decrease in interest from the discounting back of non-‐interest bearing
receivables and trade receivables for a reduction in market rates .
At 31 December 2013 the Group recognised income from the valuation of contingent liabilities for the
acquisition of investments (Earn-‐out and Put option) for € 743 thousand.

69 CONSOLIDATED FINANCIAL STATEMENTS FOR THE YEAR ENDED 31 DECEMBER 2013
30. FINANCIAL CHARGES
The breakdown of the item is shown below for the years ended 31 December 2013 and 31 December
2012:
Financial year ended
31 December
2013 31 December
2012
Charges on bank loans and current account overdrafts 381 674 Financial charges on other loans 22,777 12,827 Financial charges for financial leasing 83 64 Financial charges on Group financial accounts 208 105 Interest discount on assignment of receivables 2,306 7,650 Interest on trade payables 69 66 Expenses from derivatives 721 73 Other financial charges 5,773 2,241
FINANCIAL CHARGES 32,318 23,700
In 2013 Financial charges recorded an increase of € 8,618 thousand compared to the previous financial
year. The main change relates to the recognition of charges relating to the bond issue, as described
under note 18, which entailed the recognition of the relevant charges accrued on the coupon due 2
February 2014. Charges for interest discount connected with the transactions involving the non-‐recourse
factoring of trade receivables decreased by € 5,344 compared to the previous year, following the above-‐
mentioned exit from the revolving assignment plans. In 2013, factoring transactions were made for a
total of € 175.7 million, against € 511.8 million in 2012.
At 31 December 2013 the Group recognised charges correlated to contingent liabilities for the
acquisition of investments (Earn-‐out and Put option) for € 1,327 thousand (€ 1,231 thousand as at 31
December 2012).
31. CURRENT, PREPAID AND DEFERRED TAXES
The breakdown of the item is shown below for the years ended 31 December 2013 and 31 December
2012:
Financial year ended
31 December
2013 31 December
2012
Current IRES tax 17,344 16,119 Current IRAP tax 13,356 12,257 (Income) charges from tax consolidation (3,565) (2,317) Adjustment to current taxes of previous years (2,332) (15,337) Current taxes 24,803 10,722 Prepaid/deferred IRES tax (1,325) (1,050) Prepaid/deferred IRAP tax (248) (114) Prepaid/deferred taxes relating to previous years (19) 265 Prepaid/(deferred) taxes (1,592) (899)
CURRENT, PREPAID AND DEFERRED TAXES 23,211 9,823

70 CONSOLIDATED FINANCIAL STATEMENTS FOR THE YEAR ENDED 31 DECEMBER 2013
The Group recorded taxes totalling € 23,211 thousand in 2013, marking an increase of € 13,388
thousand in the net balance compared to 31 December 2012.
More specifically, the main changes are as follows:
› an increase of € 1,225 thousand for IRES taxes;
› an increase of € 1,099 thousand for IRAP taxes;
› an increase of € 1,248 thousand in income from tax consolidation;
› positive adjustments on current taxes relating to previous years for € 2,332 thousand (€ 15,337
thousand in negative adjustments as at 31 December 2012). It should be noted that an income was
recognised in 2012 for lower IRES tax for previous years as a result of the claim submitted for IRAP
deductions from taxable IRES;
› recognition of a net income amounting to € 1,592 thousand, relating to the total balance of prepaid
and deferred taxes. Net income totalled € 899 thousand in the previous year.
The reconciliation between current income taxes recorded and theoretical tax resulting from application
of the IRES tax rate in force for the years ended 31 December 2013 and 31 December 2012 to pre-‐tax
profit is as follows:
Reconciliation between theoretical and actual IRES tax rate
31 December 2013 31 December 2012
% %
Pre-‐tax profit 37,726 43,131
Ordinary rate applicable 27.50% 27.50%
Effect of increases (decreases):
-‐ Temporary differences 7,111 5.18% 6,327 4.03%
-‐ Permanent differences 5,27 3.84% 729 0.46%
IRES taxable income 50,187 50,187
ACTUAL RATE / TAX 13,779 36.52% 13,802 32.00%
The value shown as effective current IRES (€ 13,779 thousand) is represented by the current IRES shown
in the previous table, amounting to € 17,344 thousand, net of income from tax consolidation of € 3,565
thousand.
The reconciliation between the effective and theoretical IRAP rate is shown below:
Reconciliation between theoretical and actual IRAP tax rate
31 December 2013 31 December 2012
% %
Pre-‐tax profit 37,726 43,131
Ordinary rate applicable 1.17%
2.98% 2.98%
3.44% 3.44%
3.90% 3.90%
4.60% 4.60%
4.73% 4.73%
4.82% 4.82%
4.97% 4.97%

71 CONSOLIDATED FINANCIAL STATEMENTS FOR THE YEAR ENDED 31 DECEMBER 2013
Reconciliation between theoretical and actual IRAP tax rate
31 December 2013 31 December 2012
% %
5.57% 5.57%
Effect of increases (decreases):
-‐ Labour cost 380,532 365,285
-‐ Balance from financial management 13,991 19,751
-‐ Other differences between taxable base and pre-‐tax result
(112,642) (135,689)
IRAP taxable income 319,607 292,478
-‐ of which at 1.17% 2,695
-‐ of which at 2.98% 3,323 5,081
-‐ of which at 3.44% 5,552 4,576
-‐ of which at 3.90% 197,408 181,971
-‐ of which at 4.60% 7,47 12,19
-‐ of which at 4.73% 6,03 6,546
-‐ of which at 4.82% 79,586 67,648
-‐ of which at 4.97% 16,423 14,35
-‐ of which at 5.57% 119 116
ACTUAL RATE / TAX 13,356 35.40% 12,257 28.42%
In 2013, as in 2012, group companies did not pay income taxes in areas other than Italy.
Deferred and prepaid taxes
As at 31 December 2013, the Group recorded deferred tax assets of € 24,129 thousand, net of deferred
tax liabilities of € 12,156 thousand, as shown below:
Equity Tax Effect Economic Tax Effect
31
December 2013
31 December
2012
31 December
2013
31 December
2012
Prepaid taxes:
Multi-‐year costs 384 353 (31) 207
Financial lease 0 5 0 17
Maintenance exceeding deductible limit 139 9 (130) 6
Presumed losses on receivables 6,966 7,248 (370) (2,338)
Provisions for risks and charges 9,814 9,882 169 1,092
Write-‐downs on asset items 1,811 587 (695) (279)
Discounting-‐back of receivables 3 3 0 26 Fees of Directors, Statutory Auditors and Independent Auditors 517 615 87 (108)
Amortization 1,069 1,597 (215) 398
Adjustments to job order margin 0 0 67 73
Interest expense 457 154 (405) 84
Employee benefits and length of service bonuses 15 138 (26) 106
Substitute tax 1,385 1,385 0 0
Employee incentives 976 1,010 55 0
Tax losses relating to previous years 3 9 11 13 Up-‐front fees on contracts for the transfer of receivables 16 90 8 (47)

72 CONSOLIDATED FINANCIAL STATEMENTS FOR THE YEAR ENDED 31 DECEMBER 2013
Equity Tax Effect Economic Tax Effect
31
December 2013
31 December
2012
31 December
2013
31 December
2012
Cash flow hedge valuation 0 336 0 466
Cash cost deduction 37 65 29 125
Other temporary differences 518 65 (38) 30
Other consolidation adjustments 20 0 (10) 0
Total prepaid taxes 24,129 23,550 (1,492) (127)
Deferred taxes:
Tax amortisation (394) (218) (299) 74
IFRS work in progress valuation (41) (52) (15) (20)
Lease for tax purposes (49) (87) (3) (167)
Employee benefit discounting (632) (381) 21 (650)
Goodwill amortisation (8,159) (7,340) 817 794
Purchase Price Allocation (PPA) (2,258) (2,398) (643) (1,051)
Capital gains -‐ deferred taxation (9) (9) 0 0
Undistributed profit 0 (1) 0 1
Other temporary differences (533) (1,366) 17 123
Cash cost deduction (6) (154) 6 125
Other consolidation adjustments (75) 0 (0) 0
Total deferred taxes (12,156) (12,006) (99) (771)
NET PREPAID/(DEFERRED) TAXES 11,974 11,544 (1,592) (898)
Temporary differences excluded from calculation of the prepaid/(deferred)taxes:
31 December 2013 31 December 2012
-‐ Tax losses that can be carried forward 54 143
TOTAL TEMPORARY DIFFERENCES EXCLUDED 54 143
32. EARNINGS PER SHARE
Basic earnings per share are calculated by dividing consolidated net profit in the year pertaining to the
Parent Company’s ordinary shareholders by the weighted average number of ordinary shares in
circulation during the year. Diluted earnings per share are, in the case of the MFM Group, equal to basic
earnings per share, since no convertible bonds or share options were issued by the Parent Company.
Income and information on the shares used for the purpose of calculating consolidated basic earnings
per share are shown below:
Year ended 31 December
31 December
2013 31 December
2012
Net profit attributable to shareholders (in thousands of Euro) 13,747 32,574
Number of ordinary shares (excluding own shares) for the purpose of basic earnings per share 109,149,600 109,149,600
BASIC EARNINGS PER SHARE (IN EURO) 0.126 0.298

73 CONSOLIDATED FINANCIAL STATEMENTS FOR THE YEAR ENDED 31 DECEMBER 2013
Financial year ended
31 December
2013 31 December
2012
Net earnings deriving from continuing operations (in thousands of Euro) 14,516 33,308
Net profit /(loss) deriving from continuing operations pertaining to minority interests (in thousands of Euro) (344) (728)
Net profit deriving from continuing operations pertaining to the Group (in thousands of Euro) 14,172 32,580
Number of ordinary shares for the purpose of basic earnings per share 109,149,600 109,149,600
BASIC EARNINGS PER SHARE OF CONTINUING OPERATIONS (IN EURO) 0.130 0.298
No other transactions were performed regarding ordinary shares or potential ordinary shares between
the balance sheet date and the date the financial statements were drafted.
Dividends
The Parent company did not distribute dividends in 2012 or 2013.
33. COMMITMENTS AND CONTINGENT LIABILITIES
Financial leasing
The Group signed financial leases primarily for plant and machinery used in the production processes of
the Laundering/Sterilisation SBU and for motor vehicles. The table below details the amount of future
rental fees deriving from financial leases and the current value of these fees:
31 December 2013 31 December 2012
Rental fees
Current value of
rental fees
Rental fees
Current value of
rental fees
Within one year 1,135 976 862 800
From one year to five years 2,363 2,213 1,644 1,560
After five years 179 171 29 27
TOTAL LEASE FEES 3,677 3,359 2,535 2,388
Financial Charges (318) (147) Current value of lease fees 3,359 3,359 2,388 2,388
Guarantees given
As at 31 December 2013, the Group granted sureties to third parties for:
› guarantees in favour of associates amounting to € 11,263 thousand (2012: € 12,631 thousand);
› other sureties granted to third parties: i) to ensure the correct fulfilment of contract obligations in
place with customers amounting to € 252,236 thousand (2012: € 206,132 thousand) ii) to replace
security deposits required to activate utilities or for lease contracts, as well as for VAT refunds from
Inland Revenue Agency, for a total amount of € 2,340 thousand (2012: € 1,077 thousand);
› guarantees in favour of Factoring Agencies amounting to € 2,104 thousand (2012: € 9,576
thousand), to ensure correct fulfilment of factoring contracts.

74 CONSOLIDATED FINANCIAL STATEMENTS FOR THE YEAR ENDED 31 DECEMBER 2013
The sureties are issued on non-‐recourse factoring transactions to cover financial risk. For this reason the
risk was carried at fair value and recorded as a financial liability for € 35 thousand.
Guarantees given within the bond issue
The Parent Company MFM S.p.A. and the subsidiaries Servizi Ospedalieri S.p.A. and Manutencoop
Private Sector Solutions S.p.A. have issued, in favour of the banks participating in the RCF agreement
and in favour of the bondholders, described under note 18, the following collaterals:
› first-‐recorded pledge on the shares held by MFM S.p.A. in Manutencoop Private Sector Solutions
S.p.A. and in Servizi Ospedalieri S.p.A., equal to 100% of the capital of the same;
› assignment as security of receivables from private customers claimed by MFM S.p.A. and
Manutencoop Private Sector Solutions S.p.A.. At 31 December 2013 the receivables assigned as
security amounted to € 96,236 thousand;
› execution of a deed of pledge on the current accounts held with Unicredit S.p.A., which were
credited with the amounts collected from private customers assigned as security. The balance of
these current accounts at 31 December 2013 was equal to € 3,769 thousand;
› the release by Servizi Ospedalieri S.p.A. and Manutencoop Private Sector Solutions S.p.A. of a
personal security for an overall maximum amount of € 48,411 thousand and € 16,907 thousand,
respectively, at 31 December 2013.
Furthermore, within the scope of the RCF agreement only, the Parent Company granted the pool of
banks a special lien over all the Group-‐owned personal property up to a maximum amount of € 60
million. At 31 December 2013 the personal property subject to special lien amounted to € 29,658
thousand.
The guarantees listed above may be enforced by the counterparties only in the case that one of the
events of default envisaged in the abovementioned contracts occurs; up to the occurrence of the same,
the assets covered by the guarantee are fully available to the Group. At 31 December 2013 no events of
default had occurred.
Contingent liabilities
There were no contingent liabilities recognised at the balance sheet date, with the exception of those
already recognised in the Consolidated financial statements and described in the explanatory notes.

75 CONSOLIDATED FINANCIAL STATEMENTS FOR THE YEAR ENDED 31 DECEMBER 2013
34. TRANSACTIONS WITH RELATED PARTIES
Related party transactions were performed under normal market conditions, i.e. in line with conditions
that would be applied between aware and independent parties. Market prices are applied to both
commercial and financial transactions.
Non-‐interest bearing loans are only disbursed in the case of pro-‐quota financing granted by syndicated
shareholders to consortium companies. These loans were, however, discounted in the financial
statements of the Parent Company MFM S.p.A.. The Parent Company not only provides technical-‐
production services relating to the core business, but also administrative and IT services for certain
Group companies. The Parent Company also has some administrative, financial and lease service
contracts in place with its parent company Manutencoop Società Cooperativa.
No guarantees were given or received in relation to receivables and payables with related parties. In the
financial year the Group did not make any significant accrual to the bad debt provision for amounts due
from related parties.
The main contracts in place with other MFM Group companies, controlled by Manutencoop Società
Cooperativa, with the latter and its subsidiaries, are shown below.
› MFM signed a contract with associate Roma Multiservizi S.p.A. on the basis of which it is committed
to providing an Information System service. The contract, expiring on 31 December 2014, makes
provision for an annual consideration of € 1,000 thousand.
› Manutencoop Cooperativa sub-‐leased to MFM S.p.A. the part of the property located in Zola
Predosa, via Poli no. 4 (BO), for office use. The duration of the lease has a 5-‐year term and is tacitly
renewable, except in the event of termination by one of the parties. Annual rent is expected to be €
1,715 thousand, to be paid in 12 monthly instalments.
› The affiliate company Manutencoop Immobiliare S.p.A. leased to Sicura S.r.l. Group the property
located in Vicenza (VI), at via Zamenhof 363, for use as offices/warehouse. The duration of the lease
has a 6-‐year term and is tacitly renewable, except in the event of termination by one of the parties.
Annual rent is expected to be € 390 thousand, to be paid in 12 monthly instalments.
› The affiliate company Manutencoop Immobiliare S.p.A. leased to MFM S.p.A. the part of the
property located in Mestre (VE), via Porto di Cavergnago no. 6, for office use. The duration of the
lease has a 6-‐year term and is tacitly renewable, except in the event of termination by one of the
parties. Annual rent is expected to be € 348 thousand, to be paid in 12 monthly instalments.
› On 6 July 2007, MFM S.p.A. signed a framework agreement with its parent company, Manutencoop
Cooperativa, in order to regulate the essential contents of subsequent personnel leases from
Manutencoop Cooperativa to MFM S.p.A, pursuant to Title III, Chapter I of Legislative Decree
276/2003. The contract has a five-‐year term, and is tacitly renewed, unless terminated by one of
the parties. As a result of said agreement, which has the legal nature of a legislative contract that
does not provide rights to third parties, MFM and the parent company Manutencoop Cooperativa
set out the conditions that regulate any future contracts for the leasing of shareholding personnel
of Manutencoop Cooperativa, and the operating rules for establishing and resolving said contracts.
› Manutencoop Cooperativa is committed, on the basis of contracts stipulated with the individual
companies of the MFM Group, to preparing pay packets.
› MFM S.p.A. signed agreements with Manutencoop Cooperativa and its subsidiaries, for the
provision of tax consultancy services.
The breakdown of the balances relating to the transactions carried out by the Parent Company with
related parties is provided in Annex III attached to the Consolidated Financial Statements.

76 CONSOLIDATED FINANCIAL STATEMENTS FOR THE YEAR ENDED 31 DECEMBER 2013
Management and coordination activities
The Parent Company MFM S.p.A. is subject to the management and coordination activities of
Manutencoop Società Cooperativa and, pursuant to art. 2497-‐bis, paragraph 4 of the Italian Civil Code,
the key figures of the latest set of approved financial statements are provided below:
31 December 2013
31 December 2012
STATEMENT OF FINANCIAL POSITION ASSETS A) Subscribed capital, unpaid 244 203 B) Fixed assets 302,775 295,018 C) Working capital 40,828 31,438 D) Accruals and Deferrals 2,480 2,704 TOTAL ASSETS 346,327 329,363 LIABILITIES AND SHAREHOLDERS EQUITY A) Shareholders’ equity: Share capital 14,136 14,044 Reserves 253,139 253,163 Profit/(Loss) for the year (591) (24) B) Provision for risks and charges 3,967 3,166 C) Employee Severance Indemnity 2,685 2,840 D) Payables 72,158 55,421 E) Accruals and Deferrals 833 753 TOTAL LIABILITIES AND SHAREHOLDERS EQUITY 346,327 329,363 MEMORANDUM ACCOUNT 242,560 78,824 INCOME STATEMENT A) Value of production 40,652 39,342 B) Cost of production (40,450) (38,419) C) Financial income and charges (135) (1,135) D) Financial asset value adjustments (838) (26) E) Extraordinary income and charges 84 106 Income taxes for the year 96 108 Profit/(Loss) for the year (591) (24)
Remuneration of members of the Management Board, executives with strategic responsibilities
and members of the Supervisory Board
Fees paid to members of administration and control bodies are shown below, as well as those paid to
executives with strategic responsibilities in the Parent Company, including for roles held in other Group
companies:
31 December 2013
31 December 2012
Board of Directors/Management Board Short-‐term benefits 1,831 2,260 Subsequent benefits 0 0 Total Board of Directors/Management Board 1,831 2,260 Executives with strategic responsibilities Short-‐term benefits 3,105 3,134 Subsequent benefits 104 104 Total other strategic executives 3,209 3,238 Board of Statutory Auditors / Supervisory Board Short-‐term benefits 507 450 Total Board of Statutory Auditors / Supervisory Board 507 450
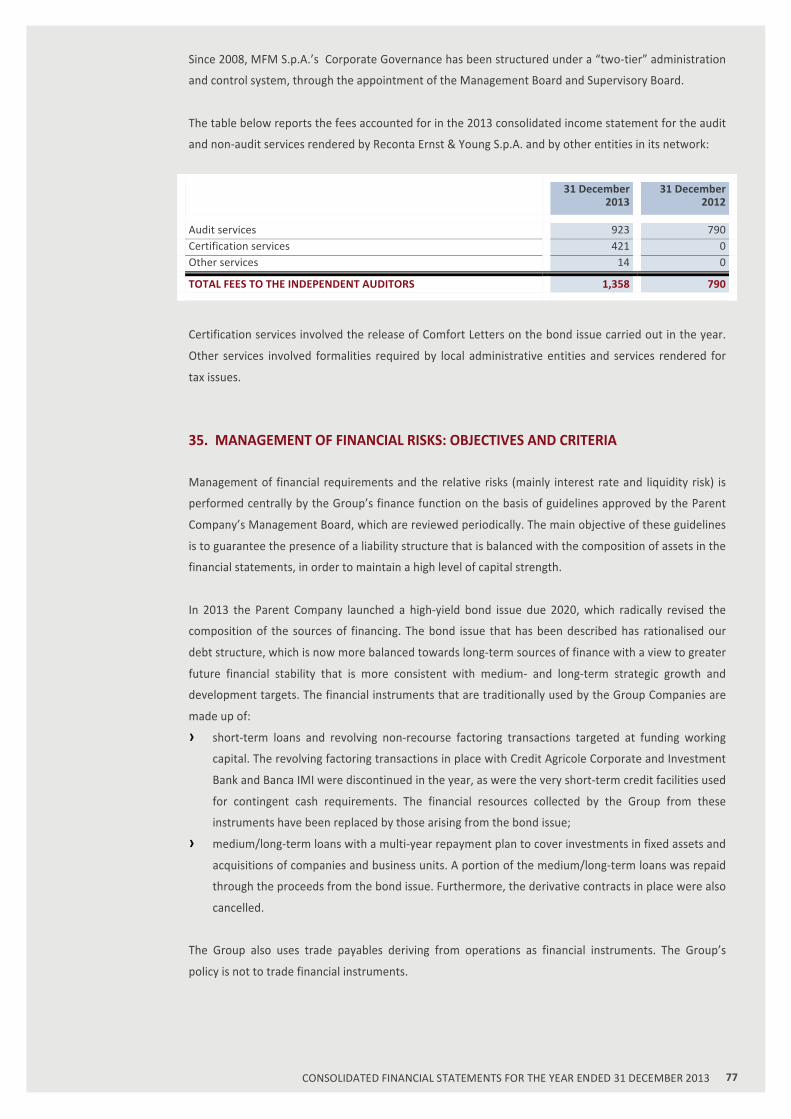
77 CONSOLIDATED FINANCIAL STATEMENTS FOR THE YEAR ENDED 31 DECEMBER 2013
Since 2008, MFM S.p.A.’s Corporate Governance has been structured under a “two-‐tier” administration
and control system, through the appointment of the Management Board and Supervisory Board.
The table below reports the fees accounted for in the 2013 consolidated income statement for the audit
and non-‐audit services rendered by Reconta Ernst & Young S.p.A. and by other entities in its network:
31 December 2013
31 December 2012
Audit services 923 790 Certification services 421 0 Other services 14 0
TOTAL FEES TO THE INDEPENDENT AUDITORS 1,358 790
Certification services involved the release of Comfort Letters on the bond issue carried out in the year.
Other services involved formalities required by local administrative entities and services rendered for
tax issues.
35. MANAGEMENT OF FINANCIAL RISKS: OBJECTIVES AND CRITERIA
Management of financial requirements and the relative risks (mainly interest rate and liquidity risk) is
performed centrally by the Group’s finance function on the basis of guidelines approved by the Parent
Company’s Management Board, which are reviewed periodically. The main objective of these guidelines
is to guarantee the presence of a liability structure that is balanced with the composition of assets in the
financial statements, in order to maintain a high level of capital strength.
In 2013 the Parent Company launched a high-‐yield bond issue due 2020, which radically revised the
composition of the sources of financing. The bond issue that has been described has rationalised our
debt structure, which is now more balanced towards long-‐term sources of finance with a view to greater
future financial stability that is more consistent with medium-‐ and long-‐term strategic growth and
development targets. The financial instruments that are traditionally used by the Group Companies are
made up of:
› short-‐term loans and revolving non-‐recourse factoring transactions targeted at funding working
capital. The revolving factoring transactions in place with Credit Agricole Corporate and Investment
Bank and Banca IMI were discontinued in the year, as were the very short-‐term credit facilities used
for contingent cash requirements. The financial resources collected by the Group from these
instruments have been replaced by those arising from the bond issue;
› medium/long-‐term loans with a multi-‐year repayment plan to cover investments in fixed assets and
acquisitions of companies and business units. A portion of the medium/long-‐term loans was repaid
through the proceeds from the bond issue. Furthermore, the derivative contracts in place were also
cancelled.
The Group also uses trade payables deriving from operations as financial instruments. The Group’s
policy is not to trade financial instruments.
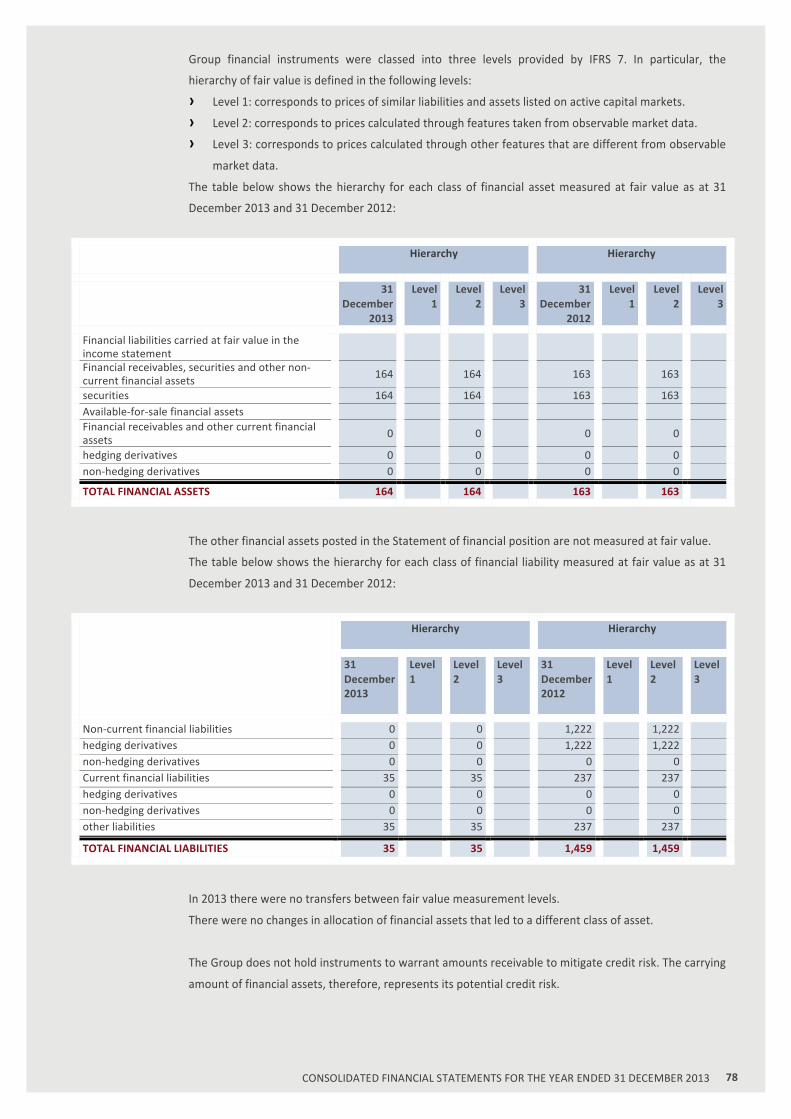
78 CONSOLIDATED FINANCIAL STATEMENTS FOR THE YEAR ENDED 31 DECEMBER 2013
Group financial instruments were classed into three levels provided by IFRS 7. In particular, the
hierarchy of fair value is defined in the following levels:
› Level 1: corresponds to prices of similar liabilities and assets listed on active capital markets.
› Level 2: corresponds to prices calculated through features taken from observable market data.
› Level 3: corresponds to prices calculated through other features that are different from observable
market data.
The table below shows the hierarchy for each class of financial asset measured at fair value as at 31
December 2013 and 31 December 2012:
Hierarchy Hierarchy
31 December
2013
Level 1
Level 2
Level 3
31 December
2012
Level 1
Level 2
Level 3
Financial liabilities carried at fair value in the income statement
Financial receivables, securities and other non-‐current financial assets 164 164 163 163
securities 164 164 163 163 Available-‐for-‐sale financial assets Financial receivables and other current financial assets 0 0 0 0
hedging derivatives 0 0 0 0 non-‐hedging derivatives 0 0 0 0
TOTAL FINANCIAL ASSETS 164 164 163 163
The other financial assets posted in the Statement of financial position are not measured at fair value.
The table below shows the hierarchy for each class of financial liability measured at fair value as at 31
December 2013 and 31 December 2012:
Hierarchy Hierarchy
31 December 2013
Level 1
Level 2
Level 3
31 December 2012
Level 1
Level 2
Level 3
Non-‐current financial liabilities 0 0 1,222 1,222 hedging derivatives 0 0 1,222 1,222 non-‐hedging derivatives 0 0 0 0 Current financial liabilities 35 35 237 237 hedging derivatives 0 0 0 0 non-‐hedging derivatives 0 0 0 0 other liabilities 35 35 237 237
TOTAL FINANCIAL LIABILITIES 35 35 1,459 1,459
In 2013 there were no transfers between fair value measurement levels.
There were no changes in allocation of financial assets that led to a different class of asset.
The Group does not hold instruments to warrant amounts receivable to mitigate credit risk. The carrying
amount of financial assets, therefore, represents its potential credit risk.

79 CONSOLIDATED FINANCIAL STATEMENTS FOR THE YEAR ENDED 31 DECEMBER 2013
Classes of financial assets and liabilities
The following table shows the classification of financial assets and liabilities recorded in the consolidated
Financial Statements of the MFM Group, as required by IFRS 7, and the associated economic effects for
the year closed as at 31 December 2013:
31 December 2013
Available-‐for-‐sale financial assets
Loans and receivables
Non-‐current financial assets Other investments 3,038 3,038 Non-‐current financial assets 10,668 10,668 Other non-‐current assets 1,653 1,653 Total non-‐current financial assets 15,359 3,038 12,321 Current financial assets Trade receivables and advances to suppliers 696,677 696,677 Current tax receivables 16,548 16,548 Other current assets 29,650 29,650 Current financial assets 13,208 13,208 Cash and cash equivalents 185,293 Total current financial assets 941,376 0 756,083 TOTAL CURRENT FINANCIAL ASSETS 956,735 3,038 768,404 Financial income (charges) 3,378 665 2,713
31 December 2013
Financial Liabilities at Fair
Value in the income
statement
Financial Liabilities
measured at amortised cost
Non-‐current financial liabilities Non-‐current loans 457,074 457,074 Financial liabilities for non-‐current derivatives 0 0 Other non-‐current liabilities 8 8 Total non-‐current financial liabilities 457,082 0 457,082 Current financial liabilities Trade payables and advances from customers 456,420 456,420 Current tax payables 227 227 Other current liabilities 148,535 148,535 Bank borrowings, including current portion of long-‐term debt, and other financial liabilities 85,880 35 85,845
Total current financial liabilities 691,062 35 691,027 TOTAL FINANCIAL LIABILITIES 1,148,144 35 1,148,109 Financial income (charges) (30,012) 202 (30,214)
The same information for the year ended 31 December 2012 is shown below:
31 December
2012 Available-‐for-‐sale
financial assets Loans and receivables
Non-‐current financial assets Other investments 3,041 3,041 Non-‐current financial assets 11,455 11,455 Other non-‐current assets 1,746 1,746 Total non-‐current financial assets 16,242 3,041 13,201

80 CONSOLIDATED FINANCIAL STATEMENTS FOR THE YEAR ENDED 31 DECEMBER 2013
31 December
2012 Available-‐for-‐sale
financial assets Loans and receivables
Current financial assets Trade receivables and advances to suppliers 655,497 655,497 Current tax receivables 24,712 24,712 Other current assets 23,690 23,690 Current financial assets 11,202 11,202 Cash and cash equivalents 51,987 Total current financial assets 767,088 0 715,101 TOTAL CURRENT FINANCIAL ASSETS 783,330 3,041 728,302 Financial income (charges) 3,949 669 3,280
31 December
2012
Financial Liabilities at Fair
Value in the income
statement
Financial Liabilities
measured at amortised cost
Non-‐current financial liabilities Non-‐current loans 119,213 119,213 Financial liabilities for non-‐current derivatives 1,222 1,222 Other non-‐current liabilities 7 7 Total non-‐current financial liabilities 120,442 0 120,442 Current financial liabilities Trade payables and advances from customers 441,551 441,551 Current tax payables 2,922 2,922 Other current liabilities 148,362 148,362 Bank borrowings, including current portion of long-‐term debt, and other financial liabilities 268,334 237 268,097
Total current financial liabilities 861,169 237 860,932 TOTAL FINANCIAL LIABILITIES 981,611 237 981,374 Financial income (charges) (16,050) (73) (15,977)
Liquidity risk
The Group’s objective is to maintain a balance between funding and flexibility through the use of
current account overdrafts, short-‐term bank loans (hot money and advances), financial leasing and
medium/long-‐term loans.
The Group is characterised by a labour-‐intensive model which does not involve significant requirements
of capital for investments. However, the Group’s customers are mainly composed of public authorities,
known for long payment times in respect of the services provided. This aspect means the Group has to
also finance working capital through bank indebtedness.
Following the bond issue and the consequent repayment of the short-‐ and very short-‐term bank loans,
the liquidity risk was further mitigated through the execution of a Revolving Credit Facility (RCF) of € 30
million that can be activated on demand. To date the RCF line has never been used.
Price risk
Risks of this nature which the Group are exposed to could involve changes in the price:
› of oil products relating to heat management activities
› of cotton, the raw material in the linen used for laundering activities
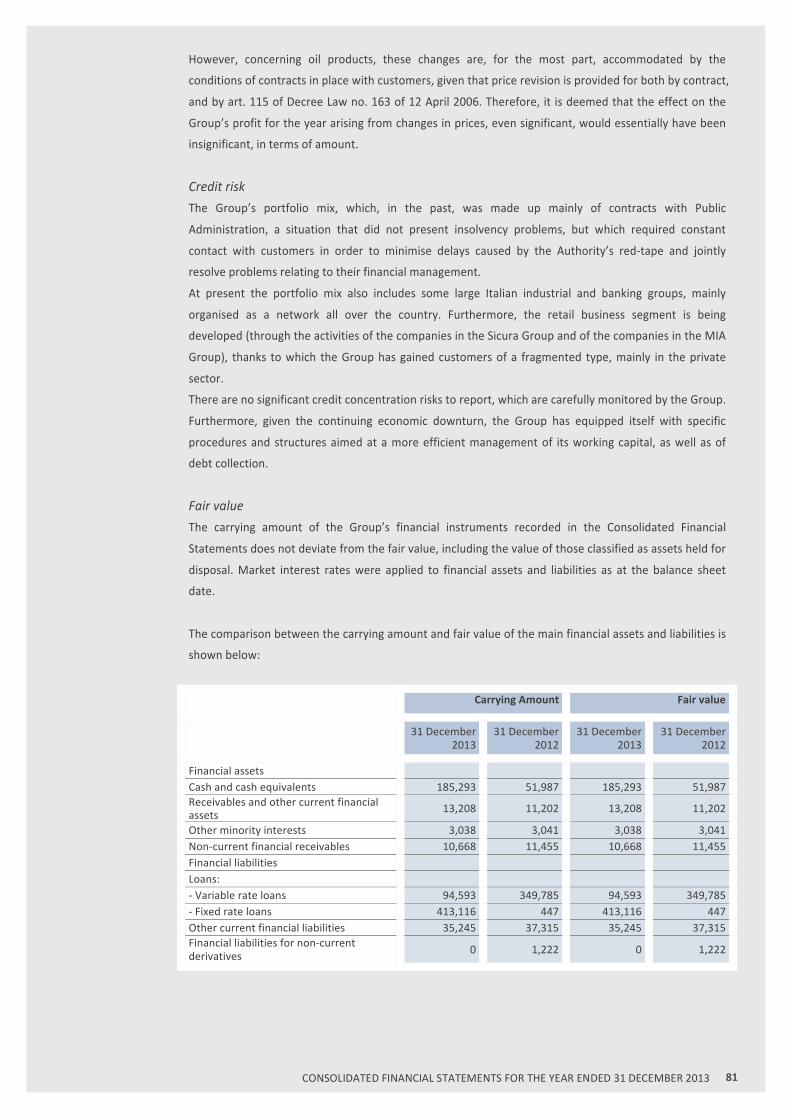
81 CONSOLIDATED FINANCIAL STATEMENTS FOR THE YEAR ENDED 31 DECEMBER 2013
However, concerning oil products, these changes are, for the most part, accommodated by the
conditions of contracts in place with customers, given that price revision is provided for both by contract,
and by art. 115 of Decree Law no. 163 of 12 April 2006. Therefore, it is deemed that the effect on the
Group’s profit for the year arising from changes in prices, even significant, would essentially have been
insignificant, in terms of amount.
Credit risk
The Group’s portfolio mix, which, in the past, was made up mainly of contracts with Public
Administration, a situation that did not present insolvency problems, but which required constant
contact with customers in order to minimise delays caused by the Authority’s red-‐tape and jointly
resolve problems relating to their financial management.
At present the portfolio mix also includes some large Italian industrial and banking groups, mainly
organised as a network all over the country. Furthermore, the retail business segment is being
developed (through the activities of the companies in the Sicura Group and of the companies in the MIA
Group), thanks to which the Group has gained customers of a fragmented type, mainly in the private
sector.
There are no significant credit concentration risks to report, which are carefully monitored by the Group.
Furthermore, given the continuing economic downturn, the Group has equipped itself with specific
procedures and structures aimed at a more efficient management of its working capital, as well as of
debt collection.
Fair value
The carrying amount of the Group’s financial instruments recorded in the Consolidated Financial
Statements does not deviate from the fair value, including the value of those classified as assets held for
disposal. Market interest rates were applied to financial assets and liabilities as at the balance sheet
date.
The comparison between the carrying amount and fair value of the main financial assets and liabilities is
shown below:
Carrying Amount Fair value
31 December
2013 31 December
2012 31 December
2013 31 December
2012
Financial assets Cash and cash equivalents 185,293 51,987 185,293 51,987 Receivables and other current financial assets 13,208 11,202 13,208 11,202
Other minority interests 3,038 3,041 3,038 3,041 Non-‐current financial receivables 10,668 11,455 10,668 11,455 Financial liabilities Loans: -‐ Variable rate loans 94,593 349,785 94,593 349,785 -‐ Fixed rate loans 413,116 447 413,116 447 Other current financial liabilities 35,245 37,315 35,245 37,315 Financial liabilities for non-‐current derivatives 0 1,222 0 1,222

82 CONSOLIDATED FINANCIAL STATEMENTS FOR THE YEAR ENDED 31 DECEMBER 2013
Interest rate risk
Traditionally the Group has used variable-‐rate loans, with the possession of quite a marginal share of
fixed rate loans. In 2009, in order to hedge interest rate risk, the Parent Company MFM S.p.A. entered
into Interest rate Swap contracts correlated to long-‐term loans used for important business
combinations.
With the bond issue launched in 2013, the Management restored the Group’s financial structure,
definitely strengthening a mix between short-‐ and medium/long-‐term debt in favour of the latter. The
bond issue was launched at a discount of 98.713%, with a fixed-‐rate coupon of 8.5% to be settled on a
six-‐monthly basis and due in 2020. The proceeds from the bond issue have been used to repay a
significant portion of the loans that were previously in place, in addition to the derivative contracts. As a
result of this operation, the Group now applies a fixed rate to the financial cost of its debt.
The other financial instruments of the Group exposed to interest rate risk are those listed in note 18 (to
which reference is made) such as Loans (other than the Senior Secured Notes), as well as financial
statement items recorded under Cash and cash equivalents, and Receivables and other current financial
assets (note 12) and Non-‐current financial assets (note 9).
Interest rate sensitivity analysis
The following table shows the sensitivity of pre-‐tax profit in the year, as a result of reasonably possible
changes in interest rates, maintaining all other variables constant.
Increase/decrease Effect on profit before taxes
Financial year ended 31 December 2013 +150 bps (3,816) -‐30 bps 763 Financial year ended 31 December 2012 +150 bps (8,825) -‐30 bps 1,869
The new structure of the consolidated debt, as we have seen, is affected, to a very marginal extent, by
the changes in market rates, as the Group has set the cost for its recourse to credit market at the rate of
return it ensures on the bond coupons.
The table below shows the sensitivity of the pre-‐tax profit in the year, should the bond issue dated 2
August have ensured proceeds since the beginning of the 2013 financial year:
Consolidated financial statements at 30 December
2013
Consolidated financial statements
with bond issue at 1 January 2013
Net financial charges
Profit before taxes
Net financial charges
Profit before taxes
Financial year ended 31 December 2013 29,605 37,727 42,131 25,201

83 CONSOLIDATED FINANCIAL STATEMENTS FOR THE YEAR ENDED 31 DECEMBER 2013
Exchange rate risk
The Group operates predominantly in the national market, where it is not exposed to exchange rate risk.
Capital management
The key objective of the Group’s capital management is to guarantee that a solid credit rating is
maintained as well as adequate capital ratios to support operations and to maximise value for
shareholders.
The Group manages the capital structure and amends it on the basis of changes in economic conditions.
In order to maintain or adjust the capital structure, the Group can adjust the dividends paid to
shareholders, repay principal or issue new shares.
The Group checks its debt ratio, by assessing the ratio of net debt to the total of own equity and net
debt: interest-‐bearing loans, trade payables, other payables and provisions for employee severance
indemnity net of cash and cash equivalents.
31 December
2013 31 December
2012
Employee termination indemnity 27,785 31,321 Interest-‐bearing loans 507,709 350,232 Trade payables and advances from customers 456,420 441,551 Other current payables 148,535 148,362 Other current financial liabilities 35,245 37,315 Cash and cash equivalents (185,293) (51,987) Other current financial assets (13,208) (11,202) Total Net Debt 977,193 945,592 Group shareholders’ equity 324,300 309,485 Undistributed net profit (13,747) (32,574) Total capital 310,553 276,911 EQUITY AND NET DEBT 1,287,746 1,222,503 Indebtedness ratio 76% 77%
No significant change was recorded in the debt ratio compared to 31 December 2012.
36. SUBSEQUENT EVENTS
3 February 2014 saw the completion of the transfer of the total stake held by MFM S.p.A. in the
subsidiary Energyproject S.r.l., which in turn held the total quota capital of Mowbray S.r.l., to UMA S.r.l.
at an agreed price of € 660 thousand. This transfer is the final step in the process of the disposal of
photovoltaic plant management activities that started in previous periods after the Group Management
decided to leave this market for good.
The Chairman of the Management Board
Claudio Levorato

84 CONSOLIDATED FINANCIAL STATEMENTS FOR THE YEAR ENDED 31 DECEMBER 2013
ANNEXES I GROUP COMPANIES
PARENT COMPANY
Name Registered Office City
Manutencoop Facility Management S.p.A. Via Poli n. 4 Zola Predosa (BO)
SUBSIDIARIES CONSOLIDATED ON A LINE-‐BY-‐LINE BASIS
Name Registered Office City %
Held Type
Antincendi Piave S.r.l. Via Zamenhof 363 Vicenza 100% Subsidiary MIA Servizi Torino S.r.l. Via Pianezza 123 Torino (TO) 100% Subsidiary CO.GE.F. Soc. Cons. a r.l Via Poli 4 Zola Predosa (BO) 80% Subsidiary COFAM S.r.l. Via A. Pica 160 Modena 60.00% Subsidiary Consorzio Igiene Ospedaliera Soc. Cons. a r.l Via Poli 4 Zola Predosa (BO) 66.66% Subsidiary Consorzio Servizi Toscana Soc. Cons. a r.l Via Poli 4 Zola Predosa (BO) 60% Subsidiary EnergyProject S.p.A. Via Poli 4 Zola Predosa (BO) 100% Subsidiary EP Servizi S.r.l. Via A. Pica 170 Modena 70% Subsidiary Evimed S.r.l. Via Zamenhof 363 Vicenza 90% Subsidiary Firing S.r.l. Via Luigi Meraviglia 31 Lainate (MI) 65% Subsidiary Global Oltremare Soc.Cons. r.l. Via Poli 4 Zola Predosa (BO) 60% Subsidiary Gruppo Sicura S.r.l. Via Zamenhof 363 Vicenza 80% Subsidiary ISOM Lavori Soc. Cons.rl Via Poli 4 Zola Predosa (BO) 62.71% Subsidiary ISOM Gestione Soc. Cons.rl Via Poli 4 Zola Predosa (BO) 52.97% Subsidiary KANARIND Soc. Cons.rl Via Poli 4 Zola Predosa (BO) 62.43% Subsidiary Lenzi S.p.A. Via Kravogl 6 Bolzano 60% Subsidiary Leonardo S.r.l. Via Zamenhof 363 Vicenza 100% Subsidiary Logistica Sud Est Soc. Cons. a r.l. Via Poli 4 Zola Predosa (BO) 60% Subsidiary Mako Engineering S.r.l. Via Ferruccio Parri 7 Treviglio (BG) 100% Subsidiary Manutencoop Costruzioni S.p.a. Via Poli 4 Zola Predosa (BO) 100% Subsidiary Manutenzione Installazione Ascensori S.p.A. Via A. Pica 170 Modena 100% Subsidiary Manutencoop Private Sector Solutions S.p.A. Via Poli 4 Zola Predosa (BO) 100% Subsidiary MCF servizi Integrati Soc. cons. a r.l. Via Poli 4 Zola Predosa (BO) 60% Subsidiary MIA Elevatori S.r.l. Via A. Pica n. 170 Modena (MO) 100% Subsidiary Mowbray S.r.l. Milano (MI) Via Filippo Turati n. 29 100% Subsidiary Nettuno Ascensori S.r.l. Via Marzabotto 11 Quarto inferiore (BO) 75% Subsidiary Palmanova Servizi Energetici Soc. Cons. a r.l Via Poli 4 Zola Predosa (BO) 60% Subsidiary PIB Service S.r.l. Via Poli 4 Zola Predosa (BO) 100% Subsidiary Protec S.r.l. Via Zamenhof 363 Vicenza 100% Subsidiary S.AN.CO S.c.a.r.l. Viale Piero e Alberto Pirelli 21 Milano 51.50% Subsidiary S.AN.GE S.c.a.r.l. Viale Piero e Alberto Pirelli 21 Milano 89% Subsidiary Securveneta S.r.l. Via Zamenhof 363 Vicenza 100% Subsidiary Sedda S.r.l. Via Zamenhof 363 Vicenza 100% Subsidiary Servizi Brindisi Soc. Cons. a r.l Via Poli 4 Zola Predosa (BO) 52% Subsidiary Servizi l'Aquila Soc. Cons. a r.l. Via Poli 4 Zola Predosa (BO) 60% Subsidiary Servizi Ospedalieri S.p.A. Via Calvino 33 Ferrara 100% Subsidiary Servizi Sanitari Sicilia Soc.Cons.a r.l. Via Calvino 33 Ferrara 70% Subsidiary Servizi Taranto Soc.Cons. a.r.l. Via Poli 4 Zola Predosa (BO) 60.08% Subsidiary Sicura S.r.l. Via Zamenhof 363 Vicenza 100% Subsidiary Sicurama S.r.l. Via G. di Vittorio 9 Casalecchio di Reno (BO) 100% Subsidiary Società Manutenzione Illuminazione S.p.A. (SMAIL) Via Poli 4 Zola Predosa (BO) 100% Subsidiary Telepost S.p.A. Via Poli 4 Zola Predosa (BO) 100% Subsidiary Unilift S.r.l. Piazzale Giustiniani 11/A Mestre (VE) 78.54% Subsidiary
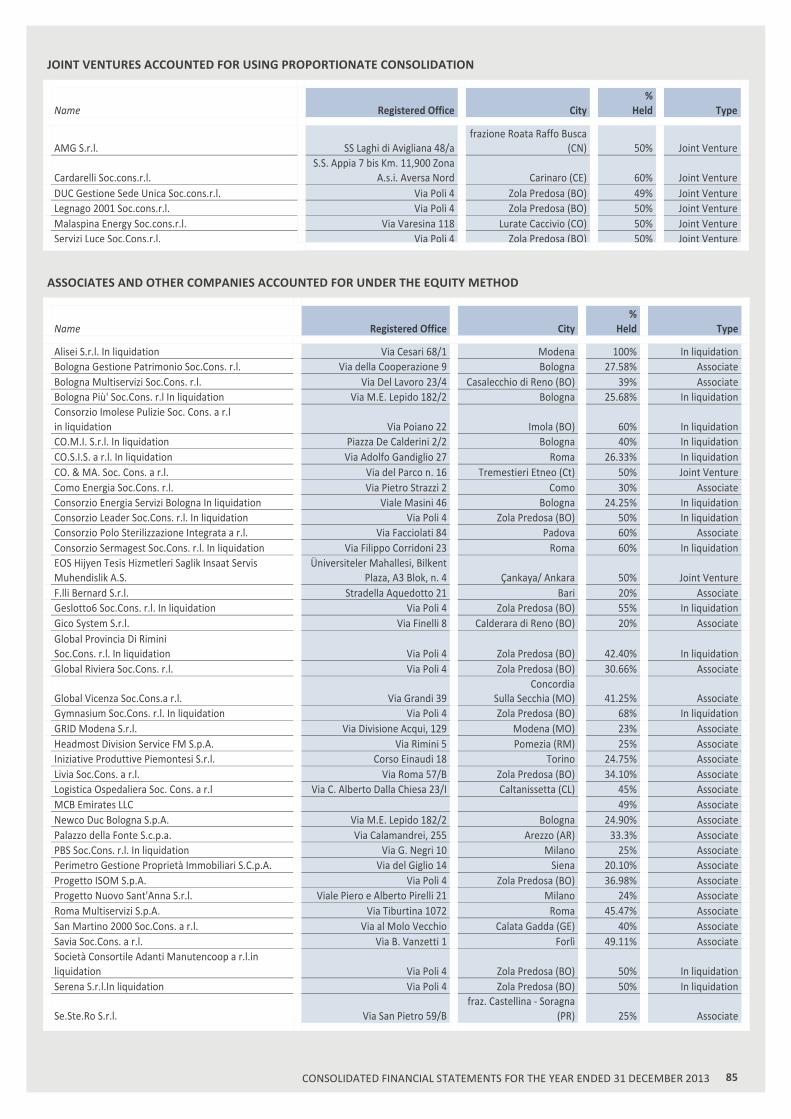
85 CONSOLIDATED FINANCIAL STATEMENTS FOR THE YEAR ENDED 31 DECEMBER 2013
JOINT VENTURES ACCOUNTED FOR USING PROPORTIONATE CONSOLIDATION
Name Registered Office City %
Held Type
AMG S.r.l. SS Laghi di Avigliana 48/a frazione Roata Raffo Busca
(CN) 50% Joint Venture
Cardarelli Soc.cons.r.l. S.S. Appia 7 bis Km. 11,900 Zona
A.s.i. Aversa Nord Carinaro (CE) 60% Joint Venture DUC Gestione Sede Unica Soc.cons.r.l. Via Poli 4 Zola Predosa (BO) 49% Joint Venture Legnago 2001 Soc.cons.r.l. Via Poli 4 Zola Predosa (BO) 50% Joint Venture Malaspina Energy Soc.cons.r.l. Via Varesina 118 Lurate Caccivio (CO) 50% Joint Venture Servizi Luce Soc.Cons.r.l. Via Poli 4 Zola Predosa (BO) 50% Joint Venture
ASSOCIATES AND OTHER COMPANIES ACCOUNTED FOR UNDER THE EQUITY METHOD
Name Registered Office City %
Held Type
Alisei S.r.l. In liquidation Via Cesari 68/1 Modena 100% In liquidation Bologna Gestione Patrimonio Soc.Cons. r.l. Via della Cooperazione 9 Bologna 27.58% Associate Bologna Multiservizi Soc.Cons. r.l. Via Del Lavoro 23/4 Casalecchio di Reno (BO) 39% Associate Bologna Più' Soc.Cons. r.l In liquidation Via M.E. Lepido 182/2 Bologna 25.68% In liquidation Consorzio Imolese Pulizie Soc. Cons. a r.l in liquidation Via Poiano 22 Imola (BO) 60% In liquidation CO.M.I. S.r.l. In liquidation Piazza De Calderini 2/2 Bologna 40% In liquidation CO.S.I.S. a r.l. In liquidation Via Adolfo Gandiglio 27 Roma 26.33% In liquidation CO. & MA. Soc. Cons. a r.l. Via del Parco n. 16 Tremestieri Etneo (Ct) 50% Joint Venture Como Energia Soc.Cons. r.l. Via Pietro Strazzi 2 Como 30% Associate Consorzio Energia Servizi Bologna In liquidation Viale Masini 46 Bologna 24.25% In liquidation Consorzio Leader Soc.Cons. r.l. In liquidation Via Poli 4 Zola Predosa (BO) 50% In liquidation Consorzio Polo Sterilizzazione Integrata a r.l. Via Facciolati 84 Padova 60% Associate Consorzio Sermagest Soc.Cons. r.l. In liquidation Via Filippo Corridoni 23 Roma 60% In liquidation EOS Hijyen Tesis Hizmetleri Saglik Insaat Servis Muhendislik A.S.
Üniversiteler Mahallesi, Bilkent Plaza, A3 Blok, n. 4 Çankaya/ Ankara 50% Joint Venture
F.lli Bernard S.r.l. Stradella Aquedotto 21 Bari 20% Associate Geslotto6 Soc.Cons. r.l. In liquidation Via Poli 4 Zola Predosa (BO) 55% In liquidation Gico System S.r.l. Via Finelli 8 Calderara di Reno (BO) 20% Associate Global Provincia Di Rimini Soc.Cons. r.l. In liquidation Via Poli 4 Zola Predosa (BO) 42.40% In liquidation Global Riviera Soc.Cons. r.l. Via Poli 4 Zola Predosa (BO) 30.66% Associate
Global Vicenza Soc.Cons.a r.l. Via Grandi 39 Concordia
Sulla Secchia (MO) 41.25% Associate Gymnasium Soc.Cons. r.l. In liquidation Via Poli 4 Zola Predosa (BO) 68% In liquidation GRID Modena S.r.l. Via Divisione Acqui, 129 Modena (MO) 23% Associate Headmost Division Service FM S.p.A. Via Rimini 5 Pomezia (RM) 25% Associate Iniziative Produttive Piemontesi S.r.l. Corso Einaudi 18 Torino 24.75% Associate Livia Soc.Cons. a r.l. Via Roma 57/B Zola Predosa (BO) 34.10% Associate Logistica Ospedaliera Soc. Cons. a r.l Via C. Alberto Dalla Chiesa 23/I Caltanissetta (CL) 45% Associate MCB Emirates LLC
49% Associate
Newco Duc Bologna S.p.A. Via M.E. Lepido 182/2 Bologna 24.90% Associate Palazzo della Fonte S.c.p.a. Via Calamandrei, 255 Arezzo (AR) 33.3% Associate PBS Soc.Cons. r.l. In liquidation Via G. Negri 10 Milano 25% Associate Perimetro Gestione Proprietà Immobiliari S.C.p.A. Via del Giglio 14 Siena 20.10% Associate Progetto ISOM S.p.A. Via Poli 4 Zola Predosa (BO) 36.98% Associate Progetto Nuovo Sant'Anna S.r.l. Viale Piero e Alberto Pirelli 21 Milano 24% Associate Roma Multiservizi S.p.A. Via Tiburtina 1072 Roma 45.47% Associate San Martino 2000 Soc.Cons. a r.l. Via al Molo Vecchio Calata Gadda (GE) 40% Associate Savia Soc.Cons. a r.l. Via B. Vanzetti 1 Forlì 49.11% Associate Società Consortile Adanti Manutencoop a r.l.in liquidation Via Poli 4 Zola Predosa (BO) 50% In liquidation Serena S.r.l.In liquidation Via Poli 4 Zola Predosa (BO) 50% In liquidation
Se.Ste.Ro S.r.l. Via San Pietro 59/B fraz. Castellina -‐ Soragna
(PR) 25% Associate
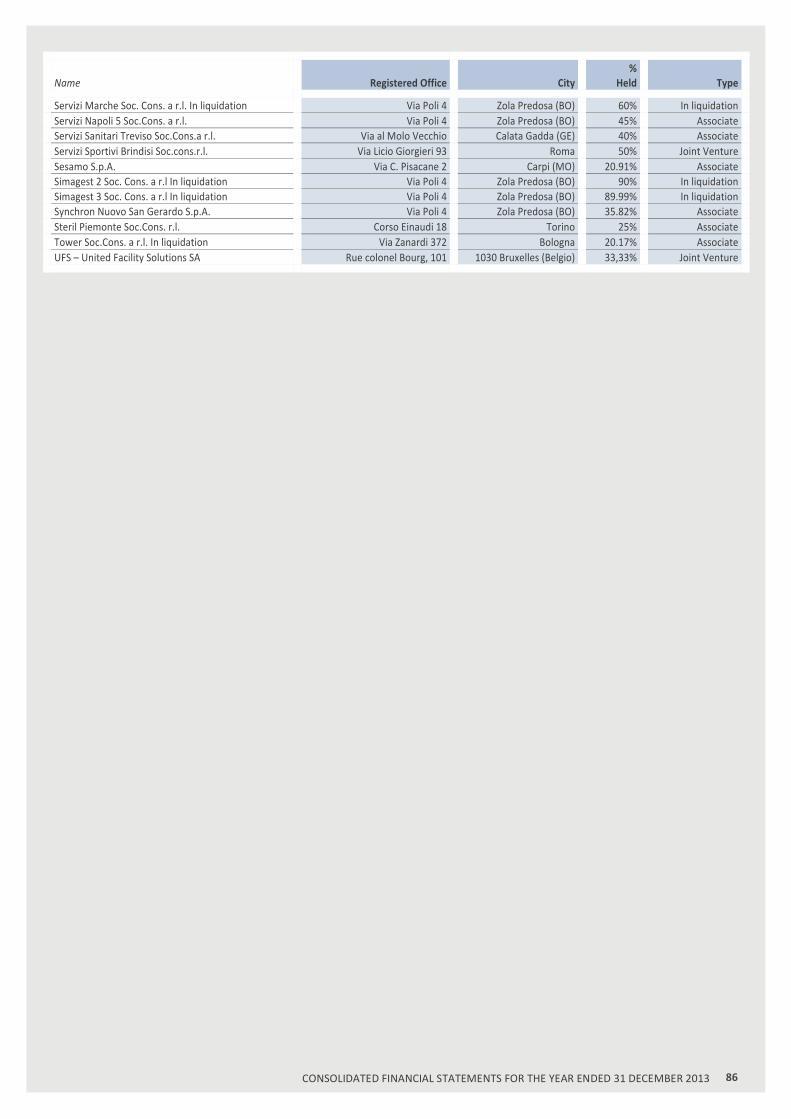
86 CONSOLIDATED FINANCIAL STATEMENTS FOR THE YEAR ENDED 31 DECEMBER 2013
Name Registered Office City %
Held Type
Servizi Marche Soc. Cons. a r.l. In liquidation Via Poli 4 Zola Predosa (BO) 60% In liquidation Servizi Napoli 5 Soc.Cons. a r.l. Via Poli 4 Zola Predosa (BO) 45% Associate Servizi Sanitari Treviso Soc.Cons.a r.l. Via al Molo Vecchio Calata Gadda (GE) 40% Associate Servizi Sportivi Brindisi Soc.cons.r.l. Via Licio Giorgieri 93 Roma 50% Joint Venture Sesamo S.p.A. Via C. Pisacane 2 Carpi (MO) 20.91% Associate Simagest 2 Soc. Cons. a r.l In liquidation Via Poli 4 Zola Predosa (BO) 90% In liquidation Simagest 3 Soc. Cons. a r.l In liquidation Via Poli 4 Zola Predosa (BO) 89.99% In liquidation Synchron Nuovo San Gerardo S.p.A. Via Poli 4 Zola Predosa (BO) 35.82% Associate Steril Piemonte Soc.Cons. r.l. Corso Einaudi 18 Torino 25% Associate Tower Soc.Cons. a r.l. In liquidation Via Zanardi 372 Bologna 20.17% Associate UFS – United Facility Solutions SA Rue colonel Bourg, 101 1030 Bruxelles (Belgio) 33,33% Joint Venture

87 CONSOLIDATED FINANCIAL STATEMENTS FOR THE YEAR ENDED 31 DECEMBER 2013
ANNEX II VALUATION OF INVESTMENTS USING THE EQUITY METHOD
% Net Book Value
Dec 31, 2012
Changes of the period Net Book Value
Dec 31, 2013
Book Value
Investment
Provision Additions/ Disposals
Dividends Share of net profit/Write-‐
downs
Investiment
Provision
Investiment
Reserves
Alisei s.rl. In liquidation
100% (47) (13) (60) 0 (60)
Bologna Gestione Patrimonio
27.58% 6 6 6
Bologna Multiservizi Soc.Cons. a R.L.
39% 4 4 4
Bologna Più Soc.Cons. a R.L.
25.68% 5 5 5
Co.S.I.S. Soc.Cons. a r.l.
26.33% 9 9 9
Co. & Ma. Soc.Cons. a r.l.
50% 0 5 5 5
Como Energia Soc.Cons. a R.L.
30% 11 11 11
Consorzio Imolese Pulizie Soc. Cons. a r.l In liquidation
60% 0 6 6 6
Consorzio Leader Soc.Cons. a r.l. In liquidation
50% 5 5 5
Consorzio Polo sterilizzazione Integrata
60% 23 23 23
Consorzio Sermagest In liquidation
60% 0 0 0
Costruzione Manutenzione Immobili
40% 84 84 84
EOS Hijyen Tesis Hizmetleri Saglik Insaat Servis Muhendislik A.S.
50% 0 50 50 50
F.lli Bernard S.r.l.
20% 694 58 752 752
Geslotto 6 soc. cons. a r.l.
55% 50 50 50
GICO Systems S.r.l.
20% 39 (10) 17 46 46
Global Provincia di Rimini Soc.Cons. a r.l.
42.40% 4 4 4

88 CONSOLIDATED FINANCIAL STATEMENTS FOR THE YEAR ENDED 31 DECEMBER 2013
% Net Book Value
Dec 31, 2012
Changes of the period Net Book Value
Dec 31, 2013
Book Value
Investment
Provision Additions/ Disposals
Dividends Share of net profit/Write-‐
downs
Investiment
Provision
Investiment
Reserves
Global Riviera Soc.Cons. a R.L.
30.66% 9 9 9
Global Vicenza 41.25% 4 4 4 Gymnasium soc. cons. a r.l. in liq.
68% 7 7 7
GRID Modena S.r.l.
23% (106) 23 1 106 24 24
Headmost Division Service FM S.p.A.
25% 0 0 0
IPP s.r.l. 25% 484 (17) 467 467
LIVIA SOC CONS R.L.
34.10% 3 3 3
Logistica Ospedaliera Soc. Cons. a r.l
45% 5 5 5
Newco DUC Bologna S.p.A.
24.90% (155) 96 453 393 393
P.B.S. Soc.Cons. a r.l. In liquidation
25% 25 25 25
Palazzo della Fonte S.c.p.a.
33.30% 8.000 8.000 8.000
Perimetro Gestione Proprietà Immobiliari Soc.Cons.a.r.l.
20.10% 1.111 1.111 1.111
Progetto ISOM S.p.A.
36.98% 2.457 (58) 2.399 2.399
Progetto Nuovo Sant’Anna S.r.l.
24% 1.141 273 215 1.630 1.630
ROMA Multiservizi S.p.A.
45.47% 8.856 (1.727) 1.471 59 8.658 8.658
San Martino 2000 Soc.Cons. a r.l.
40% 4 4 4
Savia soc.cons.a.r.l.
49.11% 5 5 5
Società Consortile Adanti Manutencoop a r.l. In liquidation
50% 0 10 10 10
SE.SA.MO. S.p.A.
20.91% 814 140 953 953
Se.Ste.Ro S.r.l. 25% 117 48 165 165 Serena S.r.l. 50% 9 0 9 9 Servizi Marche soc.Cons. a r.l. In liquidation
60% 6 6 6
Servizi Napoli 5 Soc. Cons. a r.l.
45% 5 5 5

89 CONSOLIDATED FINANCIAL STATEMENTS FOR THE YEAR ENDED 31 DECEMBER 2013
% Net Book Value
Dec 31, 2012
Changes of the period Net Book Value
Dec 31, 2013
Book Value
Investment
Provision Additions/ Disposals
Dividends Share of net profit/Write-‐
downs
Investiment
Provision
Investiment
Reserves
Servizi Sanitari Treviso (SE.SA.TRE)
40% 8 8 8
Servizi Sportivi Brindisi
50% 5 5 5
Simagest 2 Soc.Cons.a r.l.
90% 45 45 45
Simagest 3 Soc.Cons.a r.l.
89.99% 45 45 45
Synchron Nuovo San Gerardo S.p.A.
35.82% 2.919 575 3.494 3.494
Steril Piemonte Soc. Cons. a r.l.
25% 1.000 1.000 1.000
Tower Soc.Cons. a r.l.
20.17% 20 20 20
UFS – United Facility Solutions SA
33.33% 0 103 (9) 94 94
NET BOOK VALUE 27.728 197 (1.737) 2.592 93 727 29.600 29.660 (60)

90 CONSOLIDATED FINANCIAL STATEMENTS FOR THE YEAR ENDED 31 DECEMBER 2013
ANNEX III RELATED PARTY TRANSACTIONS
PARENT COMPANY
Revenues
Costs Financial income
Financial expenses
Trade receivables
Financial assets and
other
Trade payables
Financial liabilities and other
Manutencoop Cooperativa
31-‐dec-‐12 136 37.919 0 105 101 16.902 5.443 151 31-‐dec-‐13 600 40.015 0 209 554 14.068 11.613 577
ASSOCIATES
Revenues
Costs Financial income
Financial expenses
Trade receivables
Financial assets and
other
Trade payables
Financial liabilities and other
Roma Multiservizi S.p.A.
31-‐dec-‐12 1.497 5.872 0 0 443 6 6.625 0 31-‐dec-‐13 1.489 4.812 0 0 450 0 3.628 0
Gico Systems S.r.l. 31-‐dec-‐12 8 367 0 0 3 32 171 0 31-‐dec-‐13 7 587 0 0 7 0 359 0
Se.Sa.Mo. S.p.A. 31-‐dec-‐12 5.085 0 33 0 4.056 622 6 0 31-‐dec-‐13 5.073 0 33 0 3.145 606 6 0
S.I.MA.GEST2 Soc. Cons. r.l. In liquidation
31-‐dec-‐12 0 4 0 0 208 106 4 0
31-‐dec-‐13 0 0 0 0 208 75 4 0
Global Provincia di RN Soc.Cons.a r.l.
31-‐dec-‐12 217 993 0 0 251 170 18 0 31-‐dec-‐13 0 0 0 0 251 170 18 0
Bologna Più Soc.Cons.a r.l.
31-‐dec-‐12 0 5 0 0 0 39 11 0 31-‐dec-‐13 0 3 0 0 (2) 39 13 0
Global Riviera Soc.Cons.a r.l.
31-‐dec-‐12 817 2.887 0 0 573 0 0 0 31-‐dec-‐13 8 14 0 0 8 0 (177) 0
Como Energia Soc.Cons.a r.l.
31-‐dec-‐12 0 1.018 0 0 0 0 426 0 31-‐dec-‐13 0 1.044 0 0 0 0 655 0
Newcoduc S.p.A. 31-‐dec-‐12 132 71 0 0 2.448 0 17 69 31-‐dec-‐13 104 14 0 0 3.237 0 25 0
Cons.Energia Servizi Bologna Soc.Cons. a r.l.
31-‐dec-‐12 0 0 0 0 0 0 0 0
31-‐dec-‐13 55 0 0 0 55 0 0 0
P.B.S. Soc.Cons. a r.l. In liquidation
31-‐dec-‐12 0 0 0 0 6 0 0 0 31-‐dec-‐13 0 0 0 0 0 0 3 0
Tower Soc.Cons. a r.l.
31-‐dec-‐12 0 (24) 0 0 54 35 0 5 31-‐dec-‐13 0 1 0 0 17 17 (18) 0
Bologna Multiservizi Soc.Cons. a r.l.
31-‐dec-‐12 1.686 3.971 0 0 1.967 0 4.821 0 31-‐dec-‐13 1.386 4.233 0 0 2.082 0 5.206 0
Global Vicenza Soc.Cons. a r.l.
31-‐dec-‐12 263 1.550 0 0 426 0 484 0 31-‐dec-‐13 210 1.461 0 0 16 0 595 0
Bologna Gestione Patrimonio Soc.Cons. a r.l.
31-‐dec-‐12 201 109 0 0 324 0 75 0
31-‐dec-‐13 75 87 0 0 198 0 60 0
Progetto Sant'Anna 31-‐dec-‐12 110 115 145 0 5.295 5.282 157 13.149 31-‐dec-‐13 149 122 119 0 5.448 5.402 156 15.327
S.I.MA.GEST3 Soc. Cons. r.l In liquidation
31-‐dec-‐12 0 3 0 0 2 0 3 0
31-‐dec-‐13 0 0 0 0 2 0 3 0
Steril Piemonte Soc. cons. a.r.l
31-‐dec-‐12 7 826 13 0 7 1.163 306 0 31-‐dec-‐13 9 830 8 0 24 775 242 0
HEADMOST 31-‐dec-‐12 0 0 0 0 454 0 0 0 31-‐dec-‐13 0 0 0 0 454 0 0 0

91 CONSOLIDATED FINANCIAL STATEMENTS FOR THE YEAR ENDED 31 DECEMBER 2013
Revenues
Costs Financial income
Financial expenses
Trade receivables
Financial assets and
other
Trade payables
Financial liabilities and other
IPP 31-‐dec-‐12 263 355 1 0 295 100 296 0 31-‐dec-‐13 385 380 1 0 154 99 128 0
Alisei s.r.l. In liquidation
31-‐dec-‐12 1 0 0 0 3 0 0 0 31-‐dec-‐13 (1) 0 0 0 3 0 0 0
San Martino 2000 Soc.Cons. r.l.
31-‐dec-‐12 1.766 3.418 0 0 1.079 0 755 0 31-‐dec-‐13 1.694 3.418 0 0 640 0 631 0
Livia Soc. cons. a r.l. 31-‐dec-‐12 156 969 0 0 658 0 1.236 0 31-‐dec-‐13 210 1.033 0 0 172 0 868 0
Gymnasium Soc. cons. a r.l
31-‐dec-‐12 0 0 0 0 1 7 33 5 31-‐dec-‐13 0 0 0 0 1 7 33 5
Geslotto 6 Soc. cons. a r.l
31-‐dec-‐12 0 5 0 0 6 20 39 0 31-‐dec-‐13 0 4 0 0 6 20 43 0
Fr.lli Bernard s.r.l. 31-‐dec-‐12 36 332 0 0 69 0 161 0 31-‐dec-‐13 12 341 0 0 25 0 135 0
SESATRE 31-‐dec-‐12 10 4.313 67 67 0 3.331 3.349 0 31-‐dec-‐13 14 4.355 40 40 (12) 2.616 4.166 0
Savia Soc. Cons. a r.l 31-‐dec-‐12 687 1.407 0 0 336 0 951 0 31-‐dec-‐13 652 1.892 0 0 455 0 1454 0
Consorzio Sermagest Soc.Cons.a r.l In liquidation
31-‐dec-‐12 0 0 0 0 6 0 0 0
31-‐dec-‐13 0 0 0 0 6 0 0 0
Se.Ste.Ro S.r.l. 31-‐dec-‐12 9 494 0 0 11 50 432 0 31-‐dec-‐13 10 559 0 0 22 0 618 0
Napoli 5 Soc.Cons. a r.l.
31-‐dec-‐12 1.451 1.296 0 0 2.774 0 1.304 0 31-‐dec-‐13 1.377 1.283 0 0 2.535 0 1.728 0
Serena S.r.l. -‐ In liquidation
31-‐dec-‐12 0 0 0 0 52 3 1 0 31-‐dec-‐13 0 0 0 0 49 3 0 0
Servizi Marche Soc. Cons. r.l. In liquidation
31-‐dec-‐12 0 0 0 0 12 0 5 0
31-‐dec-‐13 0 1 0 0 12 0 4 0
Consorzio Leader Soc. Cons. a r.l. In liquidation
31-‐dec-‐12 0 0 0 0 13 0 6 0
31-‐dec-‐13 0 0 0 0 13 0 6 0
Progetto ISOM S.p.A. 31-‐dec-‐12 497 101 0 0 6.873 0 101 0 31-‐dec-‐13 214 17 8 0 13.457 192 92 0
Grid Modena S.r.l. 31-‐dec-‐12 187 0 0 0 199 0 0 0 31-‐dec-‐13 74 0 0 0 118 0 0 0
Logistica Ospedaliera Soc. Cons. a r.l.
31-‐dec-‐12 0 131 0 0 0 0 75 0 31-‐dec-‐13 0 404 0 0 0 0 94 0
Consorzio Imolese Pulizie soc.Cons. In liquidation
31-‐dec-‐12 0 0 0 0 0 0 0 0
31-‐dec-‐13 0 0 0 0 138 36 48 0
Palazzo della Fonte S.c.p.a.
31-‐dec-‐12 0 0 0 0 0 0 0 0
31-‐dec-‐13 3.374 0 0 0 848 0 0 0
CO.&MA. Soc. Cons. a r.l
31-‐dec-‐12 0 0 0 0 0 0 0 0
31-‐dec-‐13 0 0 0 0 0 0 0 4
Società Consortile Adanti Manutencoop In liquidation
31-‐dec-‐12 0 0 0 0 0 0 0 0
31-‐dec-‐13 0 0 0 0 36 0 12 0
Servizi Sportivi Brindisi Soc. Cons. a r.l.
31-‐dec-‐12 140 238 0 0 0 0 0 0
31-‐dec-‐13 0 0 0 0 0 0 0 0
Synchron Nuovo San Gerardo S.p.A.
31-‐dec-‐12 0 0 0 0 1 0 0 0 31-‐dec-‐13 3.699 128 0 0 3.291 0 128 0
Perimetro Gestione Proprietà Immobiliari Soc. Cons. p.A.
31-‐dec-‐12 424 0 0 0 95 0 0 0
31-‐dec-‐13 469 0 0 0 236 0 0 0

92 CONSOLIDATED FINANCIAL STATEMENTS FOR THE YEAR ENDED 31 DECEMBER 2013
SUBSIDIARIES OF MANUTENCOOP COOPERATIVA
Revenues
Costs Financial income
Financial expenses
Trade receivables
Financial assets and
other
Trade payables
Financial liabilities and other
Manutencoop Immobiliare S.p.A.
31-‐dec-‐12 120 2.099 0 0 61 0 2 0 31-‐dec-‐13 19 2.600 0 0 3 0 235 0
Nugareto Società Agricola Vinicola S.r.l.
31-‐dec-‐12 194 0 0 0 195 0 0 0
31-‐dec-‐13 90 4 0 0 88 0 4 0
Manutencoop Servizi Ambientali S.p.A.
31-‐dec-‐12 45 0 0 0 36 0 0 0 31-‐dec-‐13 20 0 0 0 6 0 0 0
Sies S.r.l. 31-‐dec-‐12 30 0 0 0 93 0 0 0 31-‐dec-‐13 34 0 0 0 138 0 0 0
Segesta servizi per l'Ambiente S.r.l.
31-‐dec-‐12 0 0 0 0 0 0 0 0 31-‐dec-‐13 11 0 0 0 12 0 0 0
Cerpac S.r.l. 31-‐dec-‐12 0 0 0 0 1 0 0 0 31-‐dec-‐13 0 0 0 0 1 0 0 0
ASSOCIATES OF MANUTENCOOP COOPERATIVA OR OTHER RELATED PARTIES
Revenues
Costs Financial income
Financial expenses
Trade receivables
Financial assets and
other
Trade payables
Financial liabilities and other
Consorzio Cooperativo Karabak Soc.a r.l.
31-‐dec-‐12 61 0 0 0 15 0 2 0
31-‐dec-‐13 64 0 0 0 16 0 2 0
Consorzio Karabak Tre Società Cooperativa
31-‐dec-‐12 1 0 0 0 1 0 0 0
31-‐dec-‐13 1 0 0 0 1 0 0 0
Consorzio Karabak Quattro Società Cooperativa
31-‐dec-‐12 0 0 0 0 0 0 0 0
31-‐dec-‐13 0 0 0 0 0 0 0 0
Consorzio Karabak Due Società Cooperativa
31-‐dec-‐12 3 0 0 0 1 0 0 0
31-‐dec-‐13 3 0 0 0 0 0 0 0
Sacoa S.r.l. 31-‐dec-‐12 85 0 0 0 142 0 18 0 31-‐dec-‐13 90 17 0 0 83 0 25 0
Revenues
Costs Financial income
Financial expenses
Trade receivables
Financial assets and
other
Trade payables
Financial liabilities and other
TOTAL 31-‐dec-‐12 16.325 70.844 259 172 29.646 27.868 27.333 13.379 31-‐dec-‐13 21.680 69.659 209 249 38.707 24.125 32.845 15.913