consolidated financial statements for the year ended 30 ... · the cfs shows the results of the...
TRANSCRIPT

Commonwealth of Australia
CONSOLIDATED FINANCIAL STATEMENTS FOR THE YEAR ENDED 30 JUNE 2014
CIRCULATED BY
SENATOR THE HONOURABLE MATHIAS CORMANN MINISTER FOR FINANCE OF THE COMMONWEALTH OF AUSTRALIA NOVEMBER 2014

© Commonwealth of Australia 2014
ISBN 978-1-925220-20-9
This publication is available for your use under a Creative Commons Attribution 3.0 Australia licence, with the exception of the Commonwealth Coat of Arms, the Department of Finance logo, photographs, images, signatures and where otherwise stated. The full licence terms are available from http://creativecommons.org/ licenses/by/3.0/au/legalcode.
Use of Department of Finance material under a Creative Commons Attribution 3.0 Australia licence requires you to attribute the work (but not in any way that suggests that Finance endorses you or your use of the work).
Department of Finance material used ‘as supplied’.
Provided you have not modified or transformed Department of Finance material in any way including, for example, by changing the Department of Finance text; calculating percentage changes; graphing or charting data; or deriving new statistics from published Finance statistics — then Department of Finance prefers the following attribution:
Source: The Australian Government Department of Finance.
Derivative material If you have modified or transformed Department of Finance material, or derived new material from those of the Department of Finance in any way, then Department of Finance prefers the following attribution:
Based on The Australian Government Department of Finance data.
Use of the Coat of Arms The terms under which the Coat of Arms can be used are set out on the It’s an Honour website (see www.itsanhonour.gov.au).
Internet The Consolidated Financial Statements are available on the Department of Finance website at: www.finance.gov.au.
Printed by Canprint Communications Pty Ltd.

iii
CONTENTS
PREFACE ......................................................................................................... 1
COMMENTARY ON THE FINANCIAL STATEMENTS ................................................. 5 Introduction .................................................................................................................... 7 Discussion and analysis ................................................................................................ 9
CONSOLIDATED FINANCIAL STATEMENTS, INCLUDING THE AUSTRALIAN GOVERNMENT (WHOLE OF GOVERNMENT) AND GENERAL GOVERNMENT SECTOR FINANCIAL REPORTS......................................................................... 35 Independent audit report ............................................................................................. 37 Statement of compliance ............................................................................................. 40 Australian Government operating statement .............................................................. 41 Australian Government balance sheet ........................................................................ 42 Australian Government cash flow statement .............................................................. 43 Australian Government statement of changes in equity ............................................. 44
SECTOR STATEMENTS .................................................................................... 47 Australian Government operating statement by sector –
including General Government Sector Financial Report ........................... 48 Australian Government balance sheet by sector –
including General Government Sector Financial Report ........................... 50 Australian Government cash flow statement by sector –
including General Government Sector Financial Report ........................... 53 Australian Government statement of changes in equity –
General Government Sector ..................................................................... 56
NOTES TO THE FINANCIAL STATEMENTS .......................................................... 58


1
PREFACE I am pleased to present the Consolidated Financial Statements (CFS) for the Australian Government for the financial year ended 30 June 2014. The CFS presents the whole of government and general government sector (GGS) financial reports. It consolidates the audited accounts of 205 entities across the public sector.
The CFS has been prepared in accordance with the regulations of the Financial Management and Accountability Act 1997 (FMA Act) and applicable Australian Accounting Standards (AAS), including the requirements of AASB 1049 Whole of Government and General Government Sector Financial Reporting (AASB 1049). The CFS shows the results of the Australian Government’s operations and cash flows for the year ended 30 June 2014 and the Australian Government’s financial position as at 30 June 2014.
The Preface and the Commentary on the Financial Statements should be read in light of the information and explanations provided in the Statement of Compliance and the CFS.
FISCAL BALANCE
The Australian Government fiscal balance for the year ended 30 June 2014 was a deficit of $42.2 billion. For the year ended 30 June 2013, the Australian Government reported a fiscal balance deficit of $28.0 billion.
Consolidated fiscal balance1
-70
-50
-30
-10
10
30
-70
-50
-30
-10
10
30
2007-08 2008-09 2009-10 2010-11 2011-12 2012-13 2013-14
$billion$billion
1 The reporting of consolidated fiscal balance commenced in 2008-09 when the consolidated financial statements were prepared in accordance with the whole of government requirements of AASB 1049 for the first time. The 2007-08 results were restated consistent with this standard in the 2008-09 CFS.

Preface
2
Australian Government taxation revenue increased by $14.7 billion (4.4 per cent) in 2013-14, reflecting an increase in taxes from individuals, goods and services tax, company and excise-like customs duty. Non-taxation revenue increased by $1.1 billion (3.0 per cent).
Australian Government expenses increased by $25.5 billion (6.5 per cent) in 2013-14. This was mainly driven by an $18.1 billion increase overall in current and capital transfers, a $4.2 billion increase in operating expenses, a $1.7 billion increase in interest expenses and a $1.5 billion increase in superannuation interest expenses.
The increase in current and capital transfers was due to a growth of $8.0 billion in personal benefits; $9.0 billion in current and capital grants; and $1.1 billion in subsidy expenses.
Within operating expenses, supply of goods and services grew by $4.8 billion, wages and salaries grew by $0.7 billion, partially offset by a decrease in superannuation expense of $1.8 billion, and smaller movements in other line items.
In addition, the Australian Government’s net acquisition of non-financial assets increased by $4.5 billion.
BALANCE SHEET
The Australian Government’s net worth was negative $264.3 billion at 30 June 2014. As at 30 June 2013, the Australian Government’s net worth was negative $210.5 billion.
Australian Government net worth position
-300
-250
-200
-150
-100
-50
0
50
100
-300
-250
-200
-150
-100
-50
0
50
100
2007-08 2008-09 2009-10 2010-11 2011-12 2012-13 2013-14
$billion$billion
The Australian Government’s financial assets increased by $49.5 billion (16.3 per cent) in 2013-14. Total non-financial assets increased by $9.5 billion (7.4 per cent).
The Australian Government’s liabilities increased by $112.8 billion (17.6 per cent) to $754.1 billion. The increase is primarily as a result of an increase in interest bearing
Preface
3
liabilities of $82.2 billion (26.1 per cent) which includes a $62.5 billion increase in the value of Commonwealth Government Securities and an increase in interest bearing deposits of $18.4 billion. Provisions and payables increased by $30.6 billion (9.4 per cent) mainly due to an increase in the superannuation liability of $28.3 billion.
CASH FLOW
The Australian Government recorded a cash deficit of $40.1 billion in 2013-14 from operating activities and investing activities in non-financial assets. The closing cash position was $4.5 billion.
CONTINGENT LIABILITIES, CONTINGENT ASSETS AND RISKS
Contingent liabilities and contingent assets for the Australian Government are not disclosed in the balance sheet but are set out in detail in Note 36. Analysis of interest rate, foreign currency, default and other risks that could potentially impact on the Australian Government’s financial position is included in Note 37.
I would like to thank the many Australian Government employees whose efforts have contributed to the completion of the 2013-14 CFS.
Senator the Hon Mathias Cormann Minister for Finance


COMMENTARY ON THE FINANCIAL STATEMENTS


7
INTRODUCTION
The 2013-14 Consolidated Financial Statements (CFS) for the Australian Government are required by section 55 of the Financial Management and Accountability Act 1997 (FMA Act).1 The CFS presents the whole of government and general government sector (GGS) financial reports and are prepared in accordance with the Australian Accounting Standard AASB 1049 — Whole of Government and General Government Sector Financial Reporting (AASB 1049).
The financial report includes consolidated results for all Australian Government controlled entities as well as disaggregated information on the various sectors of government (general government, public non-financial corporations and public financial corporations). The institutional structure of the public sector is explained in Note 1. Note 45 provides the list of Australian Government controlled reporting entities, including their sectoral classification.
At a glance
Table 1: Financial results for the year ended 30 June (2009-10 to 2013-14) 2009-10
$b2010-11
$b2011-12
$b2012-13
$b2013-14
$bRevenue 298.9 322.3 350.4 370.4 386.2
Expenses 350.7 368.0 389.8 393.9 419.4
Net capital investment 7.6 6.7 6.9 4.5 9.0
Fiscal balance (59.4) (52.4) (46.3) (28.0) (42.2)Total assets 377.2 377.0 390.6 430.9 489.8
Total liabilities 431.2 480.2 647.4 641.4 754.1
Net worth (53.9) (103.1) (256.9) (210.5) (264.3)Operating activities (44.3) (33.7) (29.6) (10.3) (27.5)
Investing activities in non-financial assets (12.5) (11.5) (12.5) (9.2) (12.6)
Cash surplus/(deficit) (56.8) (45.2) (42.1) (19.5) (40.1)
1 The Financial Management and Accountability Act 1997 was replaced by the Public Governance, Performance and Accountability Act 2013 (PGPA Act) on 1 July 2014. The PGPA Act will be applied to the 2014-15 Consolidated Financial Statements onwards.

Commentary on the financial statements
8
The Australian Government financial results for 2013-14 were as follows:
• The fiscal balance result for the year to 30 June 2014 was a deficit of $42.2 billion.2 For the year ended 30 June 2013, the Australian Government reported a fiscal balance deficit of $28.0 billion.
• Total revenues for 2013-14 were $386.2 billion, an increase of $15.7 billion (4.2 per cent) compared to 2012-13.
• Total expenses for 2013-14 were $419.4 billion, an increase of $25.5 billion (6.5 per cent) compared to 2012-13.
• Net acquisition of non-financial assets for 2013-14 were $9.0 billion, an increase of $4.5 billion (99.2 per cent) compared to 2012-13.
• The Australian Government’s closing net worth position was negative $264.3 billion at 30 June 2014, a decrease of $53.8 billion since 30 June 2013.
• Total assets increased by $58.9 billion (13.7 per cent) since 30 June 2013 to $489.8 billion at 30 June 2014.
• Total liabilities increased by $112.8 billion (17.6 per cent) since 30 June 2013 to $754.1 billion at 30 June 2014.
• The cash deficit was $40.1 billion, an increase of $20.6 billion compared to 2012-13.
2 Unless explicitly stated, the financial results reported in this commentary comprise consolidated amounts for the Australian Government as a whole, inclusive of the general government sector, public non-financial corporations sector and public financial corporations sector. The balances and movements detailed in the commentary have been rounded to the nearest tenth of a billion. Discrepancies between totals and sums of components are due to rounding.

Commentary on the financial statements
9
DISCUSSION AND ANALYSIS
Operating statement
Table 2: Operating statement 2013-14 2012-13 Change Change
$b $b $b %Revenue 386.2 370.4 15.8 4.3Expenses 419.4 393.9 25.5 6.5Net operating balance (33.2) (23.5) (9.7) 41.3Less Net acquisitions of non-financial assets 9.0 4.5 4.5 100.0Australian Government fiscal balance (42.2) (28.0) (14.2) 50.7 The fiscal balance for the year to 30 June 2014 was a deficit of $42.2 billion. For the year ended 30 June 2013, the Australian Government reported a fiscal balance deficit of $28.0 billion.
The decline in the fiscal balance between 2012-13 and 2013-14 reflects an increase in total expenses by $25.5 billion and an increase in the net acquisition of non-financial assets of $4.5 billion, partially offset by an increase in total revenues of $15.8 billion.
The increase in expenses was largely due to the rise in the purchase of goods and services, the increase in grants and the growth in direct personal benefits.
The increase in revenues was primarily due to an increase in taxation revenue flowing from the modest growth in employment and wages and personal non-wage income; and a small increase in the sale of goods and services.
The increase in the acquisition of non-financial assets is due to procurement activity in the Department of Defence (Defence) and National Broadband Network Co Ltd (NBN Co) construction projects.
Chart 1 provides a comparison of the Australian Government’s consolidated fiscal balance since 2007-08.

Commentary on the financial statements
10
Chart 1: Consolidated fiscal balance3
-70
-50
-30
-10
10
30
-70
-50
-30
-10
10
30
2007-08 2008-09 2009-10 2010-11 2011-12 2012-13 2013-14
$billion$billion
Chart 2 provides a trend of the Australian Government’s consolidated revenues and expenses since 2007-08.
Chart 2: Revenue and expenses
250
300
350
400
450
250
300
350
400
450
2007-08 2008-09 2009-10 2010-11 2011-12 2012-13 2013-14
$billion$billion
Expenses Revenue
3 The reporting of consolidated fiscal balance commenced in 2008-09 when the consolidated financial statements were prepared in accordance with the whole of government requirements of AASB 1049 for the first time. The 2007-08 results were restated consistent with this standard in the 2008-09 CFS.
Commentary on the financial statements
11
Australian Government revenue
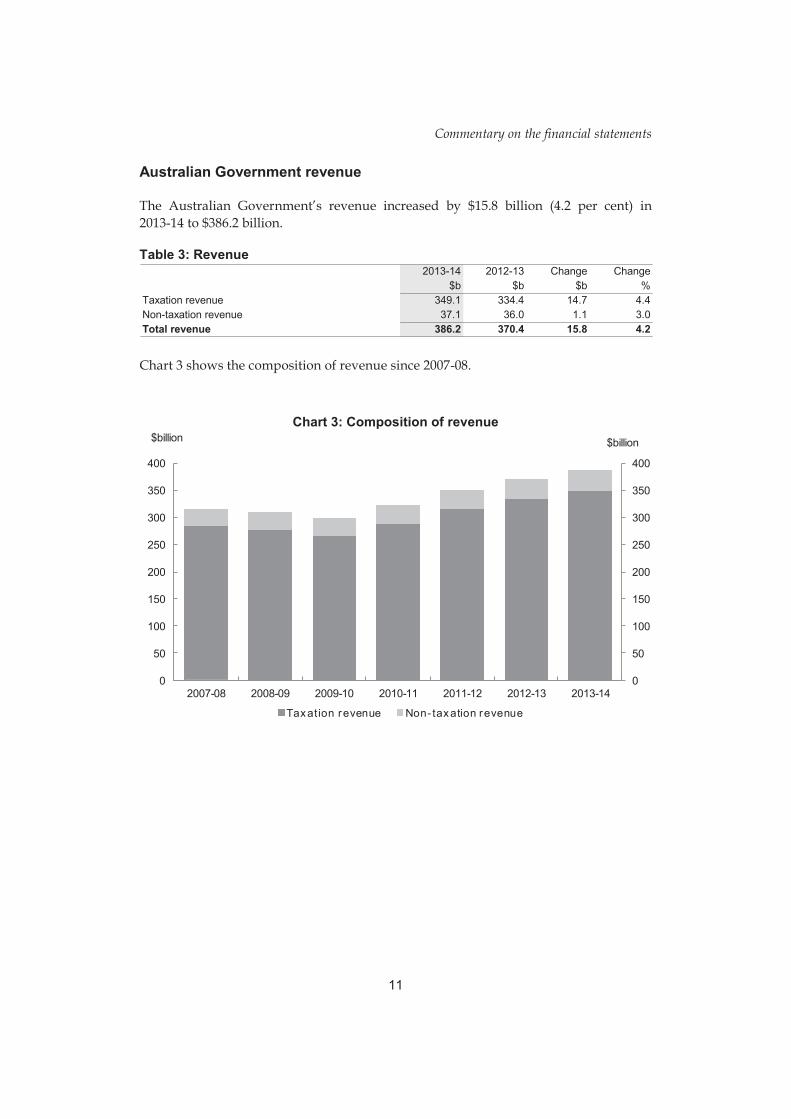
The Australian Government’s revenue increased by $15.8 billion (4.2 per cent) in 2013-14 to $386.2 billion.
Table 3: Revenue 2013-14 2012-13 Change Change
$b $b $b %Taxation revenue 349.1 334.4 14.7 4.4Non-taxation revenue 37.1 36.0 1.1 3.0Total revenue 386.2 370.4 15.8 4.2 Chart 3 shows the composition of revenue since 2007-08.
Chart 3: Composition of revenue
0
50
100
150
200
250
300
350
400
0
50
100
150
200
250
300
350
400
2007-08 2008-09 2009-10 2010-11 2011-12 2012-13 2013-14
$billion$billion
Taxation revenue Non- taxation revenue

Commentary on the financial statements
12
Taxation revenue
The Australian Government total taxation revenue for the year ended on 30 June 2014 was $349.1 billion. The composition of taxation revenue is shown in Chart 4 below.
Chart 4: Composition of taxation revenue
Individuals and other withholding taxation
48%
Company tax20%
Sales taxes16%
Custom duty 3%
Excise duty7%
Other*6%
*Other includes Resource Rent Tax ($1.8b), Fringe Benefits Tax ($4.3b), Carbon Pricing Mechanism ($4.7b), Superannuation funds ($6.2b) and Other — indirect taxation ($3.8b) categories
Table 4: Australian Government — taxation revenue 2013-14 2012-13 Change Change
$b $b $b %Income taxation
Individuals and other withholding taxation 167.9 159.8 8.1 5.1Company tax 68.6 67.8 0.8 1.2Fringe benefits tax 4.3 4.0 0.3 7.5Superannuation funds 6.2 7.5 (1.4) (18.7)Resource rent taxes 1.8 1.9 (0.1) (5.3)
Total income taxation 248.8 241.0 7.7 3.2Sales taxes 56.8 51.3 5.5 10.7Excise duty 25.7 25.7 0.0 0.0Custom duty 9.3 8.2 1.1 13.4Carbon pricing mechanism 4.7 5.0 (0.3) (6.0)Other - indirect taxation 3.8 3.2 0.6 18.8Total taxation revenue 349.1 334.4 14.7 4.4

Commentary on the financial statements
13
Taxation revenue increased by $14.7 billion (4.4 per cent) to $349.1 billion. The key movements in taxation revenue from 2012-13 to 2013-14 were:
• increase of $8.1 billion (5.1 per cent) from individuals and other withholding taxation. The growth in individuals and other withholding taxation is broadly consistent with the growth in personal non-wage income. In 2012-13 this grew by 4.9 per cent;
• increase of $5.5 billion in sales tax with the main contributor being a $5.3 billion (10.7 per cent) increase in goods and services tax (GST). This is in line with the growth in consumption subject to GST;
• increase of $0.8 billion (1.2 per cent) from company tax. Weaker corporate profitability, as well as resolving outstanding dispute matters, has impacted on the growth in company tax;
• increase of $1.1 billion (13.4 per cent) in customs duty mainly in relation to excise-like goods. This results from a higher volume of goods imported due to increased consumer demand, as well as the introduction of 12.5 per cent excise on tobacco from 1 December 2013; and
• decrease of $1.4 billion (18.7 per cent) from superannuation due to lower than expected taxable contributions and earnings as well as the resolution of some outstanding disputed matters.

Commentary on the financial statements
14
Non-taxation revenue
The Australian Government’s total non-taxation revenue for the year ended on 30 June 2014 was $37.1 billion. The composition of non-taxation revenue is shown in Chart 5 below.
Chart 5: Composition of non-taxation revenue
Sales of goods and serv ices
63%Interest income12%
Div idend income7%
Other 18%
Table 5: Non-taxation revenue 2013-14 2012-13 Change Change
$b $b $b %Sales of goods and services 23.2 22.1 1.1 5.0Interest income 4.5 4.7 (0.2) (4.3)Dividend income 2.5 2.2 0.3 13.6Other 6.9 7.0 (0.1) (1.4)Total non-taxation revenue 37.1 36.0 1.1 3.0 Total non-taxation revenue increased by $1.1 billion (3.0 per cent) to $37.1 billion. The key movements in non-taxation revenue from 2012-13 to 2013-14 were as follows:
• increase of $1.1 billion in sales of goods and services revenue mainly associated with:
– an increase of $1.3 billion in sales revenue from public corporations, including $0.5 billion in Australia Postal Corporation (Australia Post) revenue driven by growth in its parcel business, and an increase of $0.7 billion increase in Medibank Private Limited (Medibank) health insurance revenue;
– an increase of $0.4 billion in visa application fee revenue due to the consumer price index increase on the visa application charges from 1 July 2013; and

Commentary on the financial statements
15
– an increase of $0.1 billion in housing inventory sales in Defence Housing Australia; and partially offset by;
– a decrease of $0.6 billion in revenue from unclaimed monies under the Banking Act 1959, Life Insurance Act 1995 and Corporations Act 2001, resulting from the 2012-13 changes reducing the period of time that banks and other deposit taking and life insurance institutions hold unclaimed moneys from seven to three years, as well as changes to the administrative arrangements for unclaimed monies under the Corporations Act 2001; and
– a decrease of $0.3 billion for the wind down of deposit and wholesale funding fees administered by the Department of the Treasury.
• increase of $0.3 billion in dividend income primarily from collective investment vehicles, particularly private equity funds and infrastructure funds in the Future Fund investment portfolio;
• decrease of $0.1 billion in other revenue primarily driven by the decrease in revenue from unclaimed superannuation accounts mainly as a result of the 2012-13 changes to the operation of lost superannuation account provisions; and
• a decrease of $0.2 billion in interest revenue, including: a $0.1 billion reduction in realised gains on the Australian Government Nation Building Funds; a reduction of $0.1 billion interest from the Future Fund Management Agency (Future Fund) portfolio, and a $0.2 billion decrease in interest from residential mortgage backed securities investments held by the Australian Office of Financial Management (AOFM). These decreases were partially offset by a $0.3 billion increase primarily in Australian dollar securities held by the Reserve Bank of Australia (RBA).

Commentary on the financial statements
16
Australian Government expenses
Chart 6 below shows the composition and the trend for expenses since 2007-08.
Chart 6: Expenses
0
50
100
150
200
250
300
350
400
450
0
50
100
150
200
250
300
350
400
450
2007-08 2008-09 2009-10 2010-11 2011-12 2012-13 2013-14
$billion
Current and capital transfers Gross operating Interest
$billion
The Australian Government’s total expenses for the year ended on 30 June 2014 were $419.4 billion. The composition of expenses is shown in Chart 7 below.
Chart 7: Breakdown of expenses — year ended 30 June
Gross operating31%
Interest 6%
Grants 30%
Personal benef its30%
Subsidies3%
Commentary on the financial statements
17
Table 6: Expenses 2013-14 2012-13 Change Change
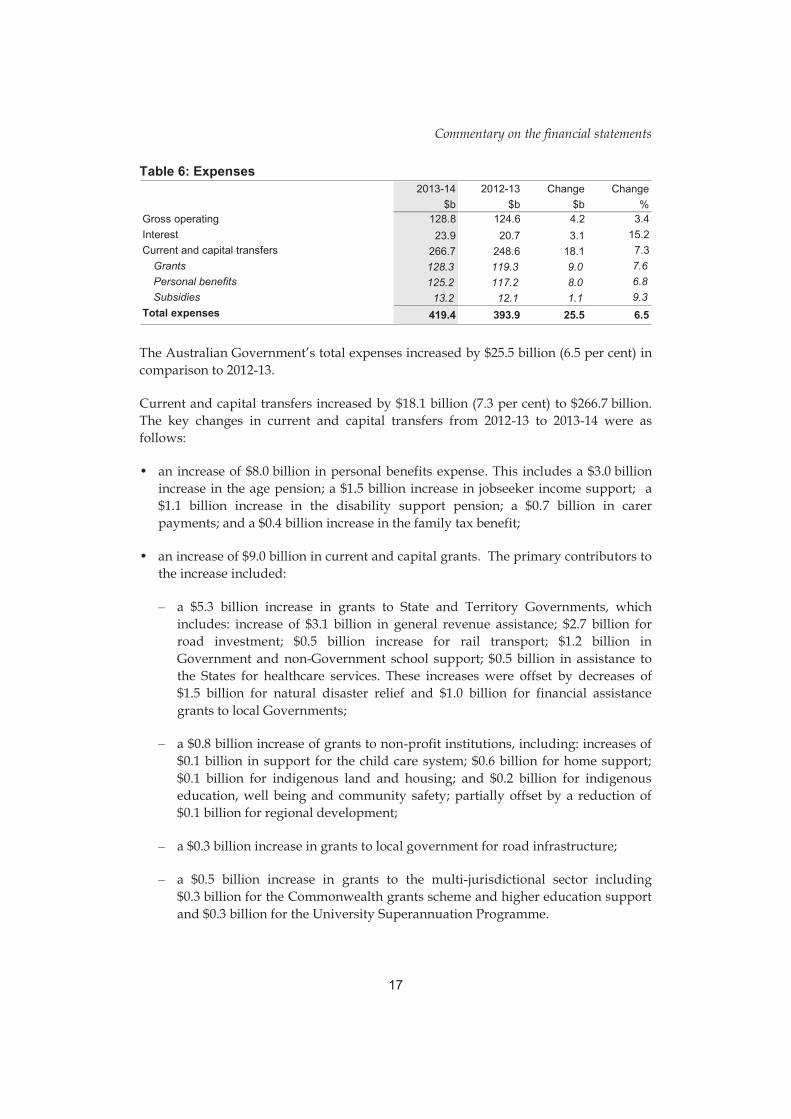
$b $b $b %Gross operating 128.8 124.6 4.2 3.4Interest 23.9 20.7 3.1 15.2Current and capital transfers 266.7 248.6 18.1 7.3
Grants 128.3 119.3 9.0 7.6Personal benefits 125.2 117.2 8.0 6.8Subsidies 13.2 12.1 1.1 9.3
Total expenses 419.4 393.9 25.5 6.5 The Australian Government’s total expenses increased by $25.5 billion (6.5 per cent) in comparison to 2012-13.
Current and capital transfers increased by $18.1 billion (7.3 per cent) to $266.7 billion. The key changes in current and capital transfers from 2012-13 to 2013-14 were as follows:
• an increase of $8.0 billion in personal benefits expense. This includes a $3.0 billion increase in the age pension; a $1.5 billion increase in jobseeker income support; a $1.1 billion increase in the disability support pension; a $0.7 billion in carer payments; and a $0.4 billion increase in the family tax benefit;
• an increase of $9.0 billion in current and capital grants. The primary contributors to the increase included:
– a $5.3 billion increase in grants to State and Territory Governments, which includes: increase of $3.1 billion in general revenue assistance; $2.7 billion for road investment; $0.5 billion increase for rail transport; $1.2 billion in Government and non-Government school support; $0.5 billion in assistance to the States for healthcare services. These increases were offset by decreases of $1.5 billion for natural disaster relief and $1.0 billion for financial assistance grants to local Governments;
– a $0.8 billion increase of grants to non-profit institutions, including: increases of $0.1 billion in support for the child care system; $0.6 billion for home support; $0.1 billion for indigenous land and housing; and $0.2 billion for indigenous education, well being and community safety; partially offset by a reduction of $0.1 billion for regional development;
– a $0.3 billion increase in grants to local government for road infrastructure;
– a $0.5 billion increase in grants to the multi-jurisdictional sector including $0.3 billion for the Commonwealth grants scheme and higher education support and $0.3 billion for the University Superannuation Programme.

Commentary on the financial statements
18
– a $1.7 billion increase in mutually agreed write-downs, primarily penalty and interest charge remissions by the Australian Taxation Office (ATO); and
– a $0.4 billion increase in other grants across a number of agencies.
• the $1.1 billion increase in subsidy expenses includes: $0.4 billion for the stronger uptake of the research and development tax incentive; $0.3 billion for the fuel tax credits scheme and $0.4 billion for free permits associated with the carbon price scheme.
Gross operating expenses increased by $4.2 billion (3.4 per cent) to $128.8 billion. The key changes in gross operating expenses from 2012-13 to 2013-14 were as follows:
• the supply of goods and services expense increased by $4.8 billion, including: a $1.0 billion increase in Defence sustainment and other costs; a $0.4 billion increase in costs associated with facility management fees for detention centres; a $0.4 billion increase in claims and medical services processed by Medibank Private; an increase of $0.6 billion for Medicare services; a $0.5 billion increase for pharmaceuticals and pharmaceutical services; a $0.3 billion increase in the cost of Australia Post services; and a $0.3 billion increase for the NBN. These increases were partially offset by savings across a number of entities;
• wages and salaries increased by $0.7 billion, primarily due to an increase in separation costs across a number of agencies;
• depreciation and amortisation expenses grew by $0.3 billion consistent with the increase in non-financial assets; and
• the current service cost of the Australian Government’s unfunded superannuation provisions decreased by $1.8 billion. The current service cost recognises the increase in the superannuation liability that results from employee service in the reporting period. As the calculation of the amount is based on a present value, it is sensitive to changes in the discount rate used for the calculation.4 The longer the length of service, the greater the impact of discount rate changes. Therefore, the decrease in current service cost was largely in the Public Sector Superannuation Scheme (closed in 2005) and the Military Superannuation and Benefits Scheme.
Superannuation interest expenses increased by $1.5 billion (22.1 per cent) during 2013-14 to $8.2 billion. This was largely attributable to a higher discount rate at the beginning of 2013-14 compared to 2012-13.
4 Under AASB 119, the expenses recognised in the Operating Statement, including the current service cost and the nominal interest on superannuation, are determined with reference to the yield on government bonds (discount rate) at the start of the reporting period (4.3 per cent in 2013-14; 3.1 per cent in 2012-13), with the change in interest rates reflected as an actuarial revaluation in ‘Other Economic Flows’.

Commentary on the financial statements
19
Interest expenses increased by $1.7 billion (11.9 per cent) during 2013-14 to $15.6 billion reflecting the interest associated with the issuance of Treasury Bonds recognised and an increase in exchange settlement balances held with the RBA.
Chart 8 below provides a presentation of total expenses based on how the Australian Government allocated resources across the range of policy areas. The chart highlights the relative cost of each function for 2013-14 compared with the previous year.
Chart 8: Total expenses by function
0 20 40 60 80 100 120 140
Social security and welfare
Other purposes
Health
Education
General public services
Defence
Transport and communication
Other economic affairs
Fuel and energy
Housing and community amenities
Public order and safety
Recreation and culture
Agriculture, forestry and fishing
Mining, manufacturing and construction
$billion2013-14 2012-13

Commentary on the financial statements
20
Australian Government other economic flows
Table 7: Other economic flows 2013-14 2012-13 Change Change
$b $b $b %Net write-downs of assets (7.4) (7.4) 0.0 (0.2)Revaluation of equity investments 0.3 (0.6) 0.9 (146.3)Net foreign exchange gains/(losses) (0.2) 1.7 (1.9) (114.6)Actuarial revaluation of superannuation (13.0) 50.4 (63.4) (125.8)Revaluations of non-financial assets 1.2 0.6 0.6 92.7Other (2.1) 25.0 (27.1) (108.2)Total other economic flows (21.2) 69.8 (90.9) (130.3) The Australian Government reported a net loss of $21.2 billion in other economic flows in 2013-14, a $90.9 billion change from 2012-13. The $63.4 billion change in the actuarial revaluation of superannuation primarily relates to discount rate changes. Under the accounting standards, the superannuation liability is calculated using a discount rate based on current long-term government bond rates. Movement in the discount rate can cause significant movements in the valuation of the liability. In 2013-14, the discount rate decreased from 4.3 per cent to 4.1 per cent (increasing the liability and reducing net worth) while in 2012-13, the discount rate increased from 3.1 per cent to 4.3 per cent (reducing the liability and improving net worth). The actuarial assumptions applied in the calculation of the Australian Government’s liability are detailed in Note 38.
The major contributor to the ‘Other’ $27.1 billion reduction in net worth is the relative change in the market valuation of debt of $15.2 billion, reflecting movements in interest rates, and a $7.8 billion change in indexation arrangements for military superannuation.
Australian Government net acquisition of non-financial assets
Table 8: Net acquisition of non-financial assets 2013-14 2012-13 Change Change
$b $b $b %Purchases of non-financial assets 15.1 11.9 3.2 26.9less Sale of non-financial assets 0.4 1.8 (1.4) (77.8)less Depreciation 7.4 7.2 0.2 2.8plus Change in inventories and other movements 0.7 1.0 (0.3) (30.0)plus Other movements in non-financial assets 1.0 0.6 0.4 66.7Total net acquisition of non-financial assets 9.0 4.5 4.5 100.0 The Australian Government’s net acquisition of non-financial assets showed an increase of $4.5 billion to $9.0 billion in 2013-14. This change was reflected in the increase of purchases of non-financial assets, mainly for Defence related acquisitions and the construction of the NBN. The decrease in sales of non-financial assets is reflective of lower than prior year activity for the auction of spectrum licences.

Commentary on the financial statements
21
Balance sheet
The Australian Government’s net worth decreased by $53.8 billion in 2013-14 to produce a closing negative net worth of $264.3 billion.
Table 9: Balance sheet 2013-14 2012-13 Change Change
$b $b $b %Financial assets 352.5 303.1 49.4 16.3Non-financial assets 137.3 127.8 9.5 7.4Total assets 489.8 430.9 58.9 13.7Interest bearing liabilities 397.6 315.4 82.2 26.1Provisions and payables 356.5 326.0 30.5 9.4Total liabilities 754.1 641.4 112.7 17.6Net worth (264.3) (210.5) (53.8) 25.6 The decline in net worth was reflected in the $82.2 billion increase in interest bearing liabilities; an increase of $30.5 billion in provisions and payables, primarily relating to superannuation; partially offset by an increase in financial assets.
Chart 9 shows the movement and composition of the Australian Government’s financial position over the last 7 years.
Chart 9: Australian Government balance sheet
-700
-600
-500
-400
-300
-200
-100
0
100
200
300
400
500
-700
-600
-500
-400
-300
-200
-100
0
100
200
300
400
500
2007-08 2008-09 2009-10 2010-11 2011-12 2012-13 2013-14
$billion
Financial assets Non-financial assets Provisions and payables
Interest bearing liabilities Net worth
$billion

Commentary on the financial statements
22
Australian Government assets
The Australian Government’s total assets as at 30 June 2014 were $489.8 billion. The composition of assets is shown in Chart 10 below.
Chart 10: Composition of assets Cash and deposits
1%
Adv ances paid7%
Other receiv ables and accrued rev enue
9%
Inv estments, loans and placements
47%Equity inv estments8%
Non-f inancial assets28%
Included in the above categories are the following items:
Cash and Deposits - Cash at bank and
cash on hand - Short-term deposits
(generally less than 3 months)
- Fund deposits at call
Advances Paid are loans made for policy purposes rather than for liquidity management, including: - Student loans (including HELP); - Loans to State and Territory
Governments; and - Subscriptions to international
aid organisations.
Investments, Loans and Placements - Term deposits; - Investment debt securities (including
Future Fund and Government Funds);
- International Monetary Fund quota; and
- Residential mortgage-backed securities.
Other receivables - Statutory receivables
and recoverables; - Trade debtors
Equity investments constitute a financial claim on other entities and include: - Investments in public
corporations (valued at DCF or net assets);
- Future fund equity holdings; and - Investments in international
financial institutions.
Non-financial assets - Land, buildings, plant, infrastructure
and equipment; - Investment property; - Heritage and cultural assets; - Biological assets and assets held for
sale are non-financial produced assets;
- Specialist military equipment; - Intangibles (including software and
other produced intangibles); - Inventories; and - Prepayments.

Commentary on the financial statements
23
Table 10: Australian Government’s assets 2013-14 2012-13 Change Change
$b $b $b %Financial assets
Cash and deposits 4.5 4.1 0.5 11.1Advances paid 34.8 30.1 4.8 15.8Other receivables and accrued revenue 42.9 42.7 0.2 0.5Investments, loans and placements 229.8 191.3 38.5 20.1Equity investments 40.5 34.9 5.6 16.0
Non-financial assets 137.3 127.8 9.5 7.4Total assets 489.8 430.9 58.9 13.7 The Australian Government’s total assets increased by $58.9 billion (13.7 per cent) since 30 June 2013.
This included a $49.5 billion (16.3 per cent) increase in financial assets to $352.5 billion at 30 June 2014, and a $9.5 billion (7.4 per cent) increase in non-financial assets to $137.3 billion at 30 June 2014. This continues the trend of recent years where a greater proportion of the Australian Government’s assets held are financial assets.
The key movements in financial assets between 30 June 2013 and 30 June 2014 included the following:
• an increase of $38.5 billion in investments, loans and placements. This included a $38.9 billion increase in Australian dollar securities and foreign exchange holdings of the RBA and an increase of $3.3 billion in non-equity investments by the Future Fund. These increases were partially offset by a $2.4 billion decrease in deposit investments by the AOFM;
• an increase of $5.6 billion in equity investments. The increase mainly relates to an increased allocation in listed equities and listed managed investment schemes held by the Future Fund; and
• an increase of $4.8 billion in advances paid. This increase was mainly due to a $3.6 billion increase in the value of student loans under the HELP scheme and the residual amount is due to an increase in loans receivable across a number of agencies.
The key movements in non-financial assets between 30 June 2013 and 30 June 2014 included the following:
• land at valuation increased by $0.4 billion;
• a movement of $1.6 billion for buildings mainly due to the finance lease arrangements for the rollout of the Single Living Environment and Accommodation Precinct (LEAP) project in Defence;

Commentary on the financial statements
24
• an increase of $4.8 billion in infrastructure, plant and equipment including an increase of $1.0 billion for specialist military equipment; and $4.0 billion in network assets for the rollout of the NBN;
• an increase in $0.3 billion for heritage and cultural assets mainly due to revaluation increments in collections across a number of cultural institutions;
• an increase of $0.5 billion in intangible assets mainly due to water entitlement acquisitions by the Department of the Environment; and
• an increase of $0.3 billion for inventory primarily due to an increase in explosive ordnance held by Defence.
Australian Government liabilities
The Australia Government’s total liabilities were $754.1 billion as at 30 June 2014. The composition of liabilities is shown in Chart 11 below.
Chart 11: Composition of liabilities
Interest bearing liabilities
53%
Payables3%
Provisions 44%

Commentary on the financial statements
25
Included in the above categories are the following items:
Interest bearing liabilities - Public debt (Treasury bonds,
Treasury Notes and Treasury Indexed Bonds);
- Bills of exchange and promissory notes issued to international multilateral organisations;
- IMF Special Drawing Right Allocation reflecting Australia’s cumulative liability to the IMF; and
- Finance leases and other loans.
Provisions - Australian Government’s
unfunded superannuation liability;
- Annual leave, long service leave liabilities, accrued salaries and wages, separations and redundancies, workers compensation provisions;
- Social security, health and education benefit provisions;
- Grant provisions for university superannuation, Natural Disaster Relief and Recovery Arrangements and subsidy provisions administered through the tax system;
- Provisions for asbestos, decontamination, etc; and
- Unearned income, unclaimed monies, outstanding claims and taxation refunds.
Payables - Trade creditors, capital
creditors and unsettled investment purchases;
- Amounts payable to grant or subsidy recipients at period-end;
- Personal benefit payables at period-end;
- Unearned income and prepayments received; and
- Unclaimed monies and outstanding claims.
Table 11: Australian Government’s liabilities 2013-14 2012-13 Change Change
$b $b $b %Interest bearing liabilities 397.6 315.4 82.2 26.1Payables 25.0 24.9 0.2 0.6Provisions 331.5 301.1 30.4 10.1Total liabilities 754.1 641.4 112.7 17.6 The Australian Government’s liabilities have increased by $112.7 billion (17.6 per cent) since 30 June 2013.
This included a $82.2 billion (26.1 per cent) increase in interest bearing liabilities to $397.6 billion at 30 June 2014 and a $30.6 billion (10.8 per cent) increase in provisions and payables to $356.6 billion at 30 June 2014.
The decrease in the bond rate was the main contributor to the overall increase in provisions. A number of Australian Government provisions are long-term in nature and, as such, are subject to variations if the discount rate used in calculating the present value of these liabilities changes. The bond rate change was the key determinant of the $28.3 billion increase in the Australian Government’s unfunded superannuation liabilities.
The increase of $82.2 billion in interest bearing liabilities includes:
• an increase of $62.5 billion in the issuance volume of Commonwealth Government Securities (CGS) held by the AOFM;

Commentary on the financial statements
26
• an increase of $18.4 billion in deposits held, including the Reserve Bank of Australia exchange settlement balances;
• an increase of $2.6 billion in other borrowings which mainly relate to finance leases and right of use licences entered into by NBN Co for its infrastructure assets and premises;
• an increase of $0.6 billion in loans, primarily bills of exchange & promissory notes issued to the International Monetary Fund by Treasury, partially offset by:
• a decrease of $2.0 billion in other interest bearing liabilities as a result of the improved performance of derivative contracts by the Future Fund to manage its investment portfolio.
The increase in provisions and payables of $30.6 billion included:
• an increase of $28.3 billion in the superannuation liability resulting from actuarial revaluations, in particular a 0.2 percentage point decrease in the Government bond rate used to discount expected future superannuation payments as well as an increase in the indexation arrangements for some military pensions;
• an increase of $3.8 billion in Australian currency (notes) on issue;
• an increase of $1.4 billion in other employee liabilities resulting from actuarial adjustments of $0.7 billion for claims under the Military Rehabilitation and Compensation Act 2004 and an allowance of $0.3 billion for separation and redundancy provisions across a number of agencies; and
• an increase of $0.9 billion in subsidies payable primarily due to claims on hand for various subsidies administered by the ATO.
The above increases in provisions and payables were partially offset by a decrease of $1.4 billion in supplier payables and a decrease in other provisions of $3.0 billion mainly relating to a decrease in grants provisions.

Commentary on the financial statements
27
Statement of cash flows
Table 12: Cash flow 2013-14 2012-13 Change Change
$b $b $b %Cash receipts
Operating activities 375.9 362.9 13.0 3.6Investing activities in non-financial assets 0.7 1.8 (1.1) (61.1)Financing activities 89.4 38.3 51.1 133.4
Total cash receipts 466.0 403.0 63.0 15.6Cash payments
Operating activities 403.4 373.2 30.2 8.1Investing activities in non-financial assets 13.3 11.0 2.3 20.9Investing activities in financial assets 39.9 13.7 26.2 191.4Financing activities 9.0 5.1 3.9 76.5
Total cash payments 465.6 403.0 62.6 15.5Net movement in cash 0.4 0.0 0.4 -Cash at beginning of the year 4.1 4.0 0.1 2.5Cash at end of year 4.5 4.0 0.5 12.5Key fiscal aggregateOperating activities (27.5) (10.3) (17.2) 167.0Investing activities in non-financial assets (12.6) (9.2) (3.4) 37.0Cash surplus/(deficit) (40.1) (19.5) (20.6) 105.6 The Australian Government’s cash balance was $4.5 billion at 30 June 2014. In 2013-14 the Australian Government recorded a cash deficit of $40.1 billion for 2013-14, an increase of $20.6 billion compared to a cash deficit of $19.5 billion for 2012-13.5
5 The cash deficit reported above differs to the deficit reported in the 2013-14 Final Budget Outcome (2013-14 FBO) as the above result is for the ‘whole of government’, including public corporations whereas the FBO focuses on the outcome for the GGS. In addition, the 2013-14 FBO excludes Future Fund earnings and includes the net acquisition of assets acquired under finance leases and similar arrangements.

Commentary on the financial statements
28
Australian Government cash receipts and payments
The following charts provide a detailed break-down of Australian Government receipts and payments for 2013-14, showing the relative composition of each dollar received and each dollar paid.
Chart 12: Composition of each dollar of cash received in 2013-14
Taxes,73c
Interest & div idends,
1c
Borrowings & inv estments,
19c
Sales of goods & serv ices,
5cOther,
2c
Taxes: $338.4 billion (2012-13: $326.3 billion) (73 cents of every dollar received in 2013-14, 82 cents in 2012-13)
Borrowing and investment:
$90.2 billion (2012-13: $40.1 billion) (19 cents of every dollar received in 2013-14, 8 cents in 2012-13)
Sales of goods and services:
$24.2 billion (2012-13: $23.1 billion) (5 cents of every dollar received in 2013-14, 6 cents in 2012-13)
Interest and dividends: $6.3 billion (2012-13: $6.7 billion) (1 cent of every dollar received in 2013-14, 2 cents in 2012-13)
Other: $7.1 billion (2012-13: $6.8 billion) (2 cents of every dollar received in 2013-14, 2 cents in 2012-13)
Taxation receipts remain the predominant source of Australian Government receipts with 73 cents of every dollar that the Australian Government receives resulting from tax collections in 2013-14.

Commentary on the financial statements
29
Chart 13: Composition of each dollar of cash paid in 2013-14
Grants & subsidies, 30c
Interest paid, 3c
Personal benefits, 27c
Purchases of non-financial assets, 3c
Payments for goods & services, 18c
Payment for employees & other, 8c
Financing & investing activities, 12c
Grants and subsidies: Personal benefits:
$140.1 billion (2012-13: $127.6 billion) (30 cents of every dollar paid in 2013-14, 32 cents in 2012-13) $126.4 billion (2012-13: $116.6 billion) (27 cents of every dollar paid in 2013-14, 29 cents in 2012-13)
Payments for goods and services:
$85.4 billion (2012-13: $81.7 billion) (18 cents of every dollar paid in 2013-14, 20 cents in 2012-13)
Payments for employees and other:
$37.2 billion (2012-13: $35.5 billion) (8 cents of every dollar paid in 2013-14, 9 cents in 2012-13)
Purchases of non-financial assets:
$13.3 billion (2012-13: $11.0 billion) (3 cents of every dollar paid in 2013-14, 3 cents in 2012-13)
Interest paid:
$14.6 billion (2012-13: $11.8 billion) (3 cents of every dollar paid in 2013-14, 3 cents in 2012-13)
Financing and investing activities:
$48.6 billion (2012-13: $18.8 billion) (11 cents of every dollar paid in 2013-14, 4 cents in 2012-13)
Grants and subsidies, personal benefits and payments for the supply of goods and services are the main items of expenditure for the government, comprising 75 per cent of all payments.

Commentary on the financial statements
30
Chart 14 provides a trend of the Australian Government’s cash receipts and cash payments since 2007-08.
Chart 14: Receipts and payments
250
300
350
400
450
250
300
350
400
450
2007-08 2008-09 2009-10 2010-11 2011-12 2012-13 2013-14
$billion$billion
Payments Receipts
Future commitments
Table 13: Australian Government — future commitments 2013-14 2012-13 Change Change
$b $b $b %
Capital commitments 28.5 24.8 3.7 14.9
Other commitmentsOperating leases 20.6 19.3 1.3 6.7Project commitments 1.2 1.8 (0.6) (33.3)Research and development 2.5 1.4 1.1 78.6Goods and services contracts 8.6 15.8 (7.2) (45.6)Grant commitments 96.9 131.9 (35.0) (26.5)Other commitments 35.4 36.7 (1.3) (3.5)
Total other commitments 165.2 206.9 (41.7) (20.2)
Total commitments 193.7 231.7 (38.0) (16.4)less Commitments receivable 4.8 2.0 2.8 136.1Net commitments 188.9 229.6 (40.8) (17.8) The Australian Government is committed to future capital expenditure of $28.5 billion as at 30 June 2014, an increase of $3.7 billion since 2012-13. The change is primarily in relation to various collective investment vehicles by the Future Fund, specialist military equipment by Defence and infrastructure, plant and equipment by various agencies.
Other commitments decreased by $41.7 billion, primarily as a result of the change in grant commitments by $35.0 billion. The change is largely a result of the timing of
Commentary on the financial statements
31
multi-year funding commitments. Funding information for payments to States and Territories can be found in the 2013-14 Budget Papers.
Contingent liabilities
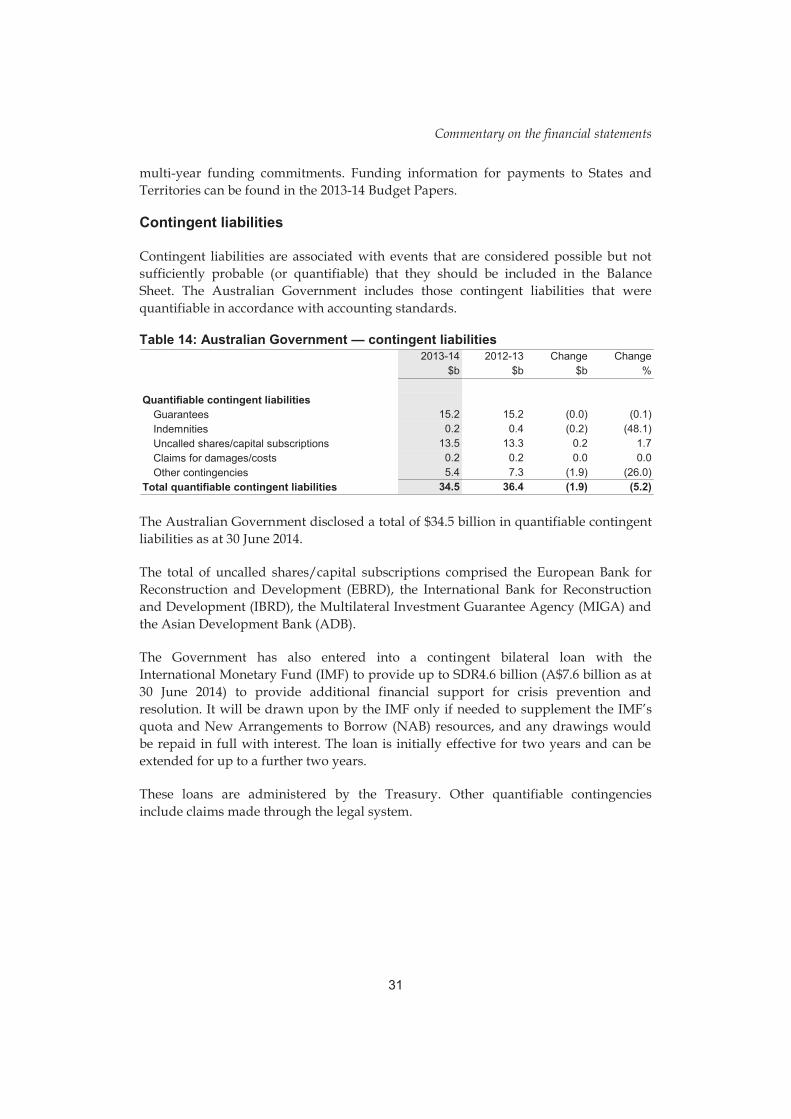
Contingent liabilities are associated with events that are considered possible but not sufficiently probable (or quantifiable) that they should be included in the Balance Sheet. The Australian Government includes those contingent liabilities that were quantifiable in accordance with accounting standards.
Table 14: Australian Government — contingent liabilities 2013-14 2012-13 Change Change
$b $b $b %
Quantifiable contingent liabilitiesGuarantees 15.2 15.2 (0.0) (0.1)Indemnities 0.2 0.4 (0.2) (48.1)Uncalled shares/capital subscriptions 13.5 13.3 0.2 1.7Claims for damages/costs 0.2 0.2 0.0 0.0Other contingencies 5.4 7.3 (1.9) (26.0)
Total quantifiable contingent liabilities 34.5 36.4 (1.9) (5.2) The Australian Government disclosed a total of $34.5 billion in quantifiable contingent liabilities as at 30 June 2014.
The total of uncalled shares/capital subscriptions comprised the European Bank for Reconstruction and Development (EBRD), the International Bank for Reconstruction and Development (IBRD), the Multilateral Investment Guarantee Agency (MIGA) and the Asian Development Bank (ADB).
The Government has also entered into a contingent bilateral loan with the International Monetary Fund (IMF) to provide up to SDR4.6 billion (A$7.6 billion as at 30 June 2014) to provide additional financial support for crisis prevention and resolution. It will be drawn upon by the IMF only if needed to supplement the IMF’s quota and New Arrangements to Borrow (NAB) resources, and any drawings would be repaid in full with interest. The loan is initially effective for two years and can be extended for up to a further two years.
These loans are administered by the Treasury. Other quantifiable contingencies include claims made through the legal system.

Commentary on the financial statements
32
APPENDIX A HISTORICAL INFORMATION
The following table presents the key financial results for the Australian Government from the 2007-08 financial year.6
2007-08 2008-09 2009-10 2010-11 2011-12 2012-13 2013-14
$b $b $b $b $b $b $bOPERATING STATEMENT
Revenue from transactionsTaxation revenue 286.0 278.3 268.0 288.8 316.5 334.4 349.1Non-taxation revenue 29.1 31.5 30.9 33.5 33.9 36.0 37.1Total revenue 315.1 309.8 298.9 322.3 350.4 370.4 386.1
Expenses from transactionsGross operating expenses 88.3 95.9 103.6 110.9 119.4 124.6 128.8Current and capital transfers 189.3 225.7 232.5 238.4 249.3 248.6 266.7Superannuation interest expense 6.0 6.7 6.7 7.0 7.4 6.7 8.2Interest expenses 5.9 6.4 7.9 11.7 13.8 14.0 15.6Total expenses 289.5 334.8 350.7 368.0 389.8 393.9 419.4
Net operating balance 25.6 (25.0) (51.8) (45.7) (39.4) (23.4) (33.3)
Net acquisition of non-financial assets 3.3 5.0 7.6 6.7 6.9 4.5 9.0
Fiscal balance 22.3 (30.0) (59.4) (52.4) (46.3) (28.0) (42.2)
BALANCE SHEETAssetsFinancial assets 244.1 266.9 268.3 261.7 268.2 303.1 352.5Non-financial assets 95.2 100.3 109.0 115.3 122.4 127.8 137.3Total assets 339.2 367.2 377.2 377.0 390.6 430.9 489.8
LiabilitiesInterest bearing liabilities 86.2 124.2 183.8 222.0 287.7 315.4 397.6Provisions and payables 185.4 227.5 247.4 258.2 359.8 325.9 356.5Total liabilities 271.5 351.7 431.2 480.2 647.4 641.4 754.1
Net worth 67.7 15.5 (53.9) (103.1) (256.9) (210.5) (264.3)
CASHFLOW STATEMENTOperating activities 32.6 (12.7) (44.3) (33.7) (29.6) (10.3) (27.5)Investing activities in non-financial assets (8.0) (10.2) (12.5) (11.5) (12.5) (9.2) (12.6)
Investing activities in financial assets (43.8) (26.7) 6.4 (0.9) (6.9) (13.7) (39.9)
Financing activities 18.9 49.4 51.9 46.0 47.5 33.2 80.5Net movement in cash (0.3) (0.2) 1.6 (0.1) (1.4) 0.0 0.5
6 Key financial results have been presented from 2007-08 following the introduction of the AASB 1049. The 2007-08 outcome was restated consistent with this standard in the 2008-09 CFS.
Commentary on the Financial Statements
33
APPENDIX B LINKS TO OTHER PUBLICATIONS PUBLISHED BY THE AUSTRALIAN GOVERNMENT ABOUT ITS PROJECTED AND ACTUAL FINANCIAL POSITION FOR THE 2013-14 FINANCIAL YEAR
The Australian Government publishes a range of information about its projected and actual financial position. Links to some of these documents are set out below. The information in the following documents has been prepared for different purposes and therefore does not form part of the Consolidated Financial Statements. Further, the documents listed below are not subject to audit.
2013-14 Final Budget Outcome
The Final Budget Outcome 2013-14 (FBO) has been prepared in a manner consistent with the Charter of Budget Honesty Act 1998 (the Charter). The Charter requires that, inter alia, the Government provide a final budget outcome report no later than three months after the end of the financial year. Consistent with these requirements, the FBO encompasses Australian Government general government sector fiscal outcomes for the 2013-14 financial year and is based on external reporting standards.
The FBO is available on the Australian Government website at: http://budget.gov.au/2013-14/content/fbo/html/index.htm.
Australian Government Monthly Financial Statements
The Australian Government Monthly Financial Statements have been prepared on a basis consistent with the Budget as required under section 54 of the Financial Management and Accountability Act 1997. The statements are prepared in accordance with the Australian Accounting Standards Board 1049 — Whole of Government and General Government Sector Financial Reporting (AASB 1049).
The Australian Monthly Financial Statements are available on the Department of Finance website and the Minister for Finance website at: Commonwealth Monthly Financial Statements | Department of Finance and http://www.financeminister.gov.au/media/2014/index.html.
Budget Strategy and Outlook and Mid-Year Economic and Fiscal Outlook
The Budget Strategy and Outlook — Budget Paper — 2013-14, the Mid-Year Economic and Fiscal Outlook 2014-15 and the Budget Strategy and Outlook — Budget Paper — 2014-15 have been prepared in accordance with the Charter of Budget Honesty Act 1998.
The aforementioned Budget Papers are available on the Australian Government website at http://www.budget.gov.au/.

Commentary on the financial statements
34
Tax Expenditures Statement 2013
The Tax Expenditures Statement (TES) provides details of concessions, benefits, incentives and charges provided through the tax system (tax expenditures) to taxpayers by the Australian Government. The publication of information is on The Treasury website at: http://www.treasury.gov.au/Treasury%20Home/Publications AndMedia/Publications/2014/TES%202013.

CONSOLIDATED FINANCIAL STATEMENTS, INCLUDING THE AUSTRALIAN GOVERNMENT (WHOLE OF
GOVERNMENT) AND GENERAL GOVERNMENT SECTOR FINANCIAL REPORTS


Consolidated financial statements
37
INDEPENDENT AUDITOR’S REPORT

Consolidated financial statements
38
Consolidated financial statements
39

Consolidated financial statements
40
STATEMENT OF COMPLIANCE

Consolidated financial statements
41
Australian Government operating statement for the year ended 30 June 2014
2014 2013Note $m $m
Revenue from transactionsTaxation revenue 2 349,069 334,430Sales of goods and services 3 23,256 22,127Interest income 4 4,466 4,658Dividend income 4 2,475 2,175Other 5 6,883 7,057Total revenue 386,149 370,447Expenses from transactionsGross operating expensesWages and salaries 6 22,868 22,207Superannuation 6 6,923 8,760Depreciation and amortisation 7 7,422 7,162Supply of goods and services 8 84,535 79,693Other operating expenses 6 7,094 6,794Total gross operating expenses 128,842 124,616Superannuation interest expense 6 8,214 6,729Interest expense 9 15,646 13,982Current transfers
Current grants 10 115,910 110,590Subsidy expenses 13,197 12,076Personal benefits 125,184 117,221
Total current transfers 254,291 239,887Capital transfers
Mutually agreed write-downs 10 2,477 794Other capital grants 10 9,932 7,888
Total capital transfers 12,409 8,682Total expenses 11 419,402 393,896Net operating balance (33,253) (23,449)Other economic flows - included in Operating Result
Net write-downs of assets (including bad and doubtful debts) 12 (7,378) (7,390)Assets recognised for the first time 313 388Net gain/(loss) from the sale of assets 13 6,325 1,076Net foreign exchange gains/(losses) 14 (245) 1,678Net swap interest received 15 (480) 45Other gains/(losses) 16 (8,183) 23,885Amortisation of non-produced assets (133) (95)Share of net result from associates and joint
ventures accounted for using the equity method 65 37Operating result (42,969) (3,825)Other economic flows - Other non-owner movements in equityItems that will not be reclassified to operating result
Revaluation of non-financial assets 33 1,235 641Actuarial revaluations of superannuation (13,014) 50,424Other economic revaluations 41 (303)
Items that may be reclassified subsequently to operating resultRevaluation of equity investments 33 282 (609)
Comprehensive result - Total change in net worth (54,425) 46,328Net operating balance (33,253) (23,449)less Net acquisition of non-financial assetsPurchases of non-financial assets 15,144 11,858less Sales of non-financial assets 444 1,839less Depreciation 7,422 7,162plus Change in inventories 721 1,005plus Other movements in non-financial assets 989 649Total net acquisition of non-financial assets 8,988 4,511Fiscal balance (Net lending/borrowing) (42,241) (27,960) The above statement should be read in conjunction with the accompanying notes.

Consolidated financial statements
42
Australian Government balance sheet as at 30 June 2014
2014 2013Note $m $m
AssetsFinancial assets
Cash and deposits 34B 4,514 4,062Advances paid 18 34,834 30,075Other receivables and accrued revenue 18 42,933 42,734Investments, loans and placements 19 229,776 191,300Equity investments 20 40,477 34,905
Total financial assets 352,534 303,076Non-financial assets
Land 21 9,846 9,440Buildings 21 27,381 25,742Plant, equipment and infrastructure 21 66,183 61,375Intangibles 22 8,321 7,822Investment property 21 375 368Inventories 23 8,371 8,038Biological assets 24 36 33Heritage and cultural assets 21 10,825 10,547Assets held for sale 24 143 213Other non-financial assets 24 5,781 4,224
Total non-financial assets 137,262 127,802Total assets 25 489,796 430,878LiabilitiesInterest bearing liabilities
Deposits held 26 24,588 6,124Government securities 27 346,616 284,160Loans 28 8,464 7,831Other borrowings 29 4,990 2,361Other interest bearing liabilities 30 12,934 14,948
Total interest bearing liabilities 397,592 315,424Provisions and payables
Superannuation liability 31 221,948 193,694Other employee liabilities 31 18,720 17,350Suppliers payable 32 6,146 7,586Personal benefits payable 32 5,607 5,699Subsidies payable 32 4,482 3,580Grants payable 32 3,355 3,355Australian currency on issue 32 60,778 56,943Other payables 32 5,432 4,648Other provisions 32 30,050 33,082
Total provisions and payables 356,518 325,937Total liabilities 754,110 641,361Net worthAccumulated results (319,964) (259,278)Reserves 55,650 48,795Minority interests - -Net worth (264,314) (210,483)Current liabilities 108,980 81,153Non-current liabilities 645,130 560,208Total liabilities by maturity 754,110 641,361Current assets 297,008 246,320Non-current assets 192,788 184,558Total assets by maturity 489,796 430,878 The above statement should be read in conjunction with the accompanying notes.
Consolidated financial statements
43
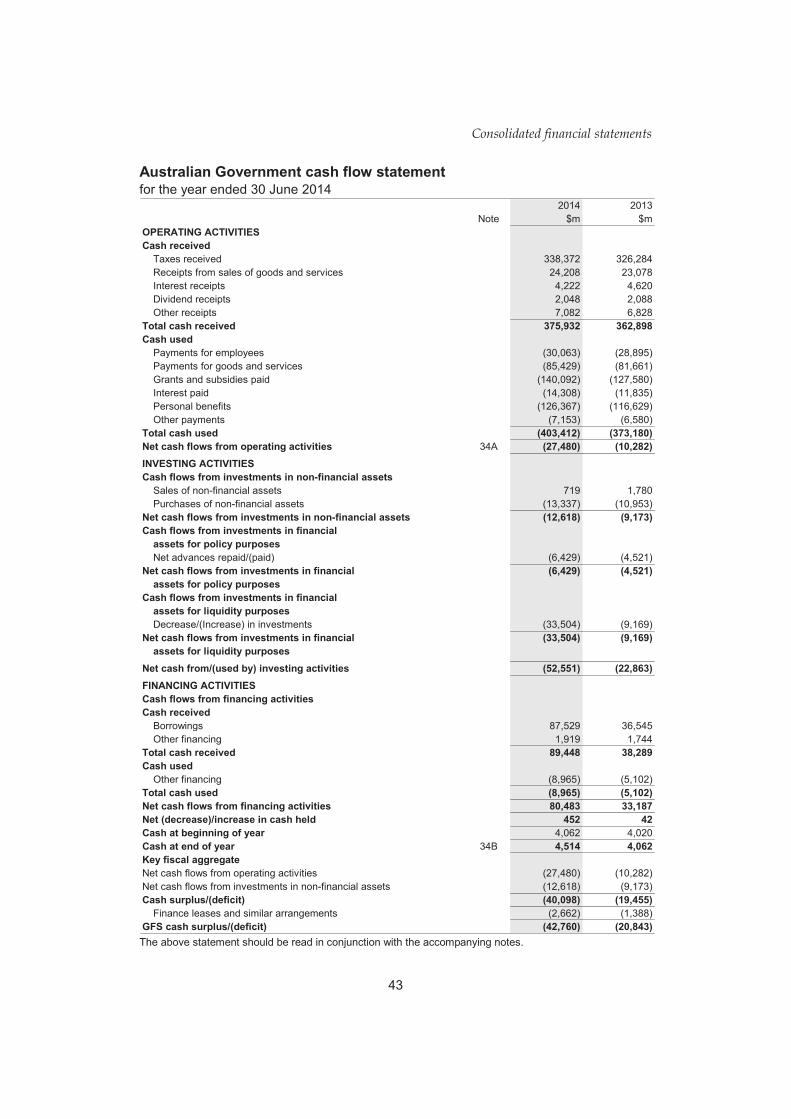
Australian Government cash flow statement for the year ended 30 June 2014
2014 2013Note $m $m
OPERATING ACTIVITIESCash received
Taxes received 338,372 326,284Receipts from sales of goods and services 24,208 23,078Interest receipts 4,222 4,620Dividend receipts 2,048 2,088Other receipts 7,082 6,828
Total cash received 375,932 362,898Cash used
Payments for employees (30,063) (28,895)Payments for goods and services (85,429) (81,661)Grants and subsidies paid (140,092) (127,580)Interest paid (14,308) (11,835)Personal benefits (126,367) (116,629)Other payments (7,153) (6,580)
Total cash used (403,412) (373,180)Net cash flows from operating activities 34A (27,480) (10,282)INVESTING ACTIVITIESCash flows from investments in non-financial assets
Sales of non-financial assets 719 1,780Purchases of non-financial assets (13,337) (10,953)
Net cash flows from investments in non-financial assets (12,618) (9,173)Cash flows from investments in financial
assets for policy purposesNet advances repaid/(paid) (6,429) (4,521)
Net cash flows from investments in financial (6,429) (4,521)assets for policy purposes
Cash flows from investments in financial assets for liquidity purposesDecrease/(Increase) in investments (33,504) (9,169)
Net cash flows from investments in financial (33,504) (9,169)assets for liquidity purposes
Net cash from/(used by) investing activities (52,551) (22,863)FINANCING ACTIVITIESCash flows from financing activitiesCash received
Borrowings 87,529 36,545Other financing 1,919 1,744
Total cash received 89,448 38,289Cash used
Other financing (8,965) (5,102)Total cash used (8,965) (5,102)Net cash flows from financing activities 80,483 33,187Net (decrease)/increase in cash held 452 42Cash at beginning of year 4,062 4,020Cash at end of year 34B 4,514 4,062Key fiscal aggregateNet cash flows from operating activities (27,480) (10,282)Net cash flows from investments in non-financial assets (12,618) (9,173)Cash surplus/(deficit) (40,098) (19,455)
Finance leases and similar arrangements (2,662) (1,388)GFS cash surplus/(deficit) (42,760) (20,843) The above statement should be read in conjunction with the accompanying notes.

44
Consolidated financial statements Au
stra
lian
Gov
ernm
ent s
tate
men
t of c
hang
es in
equ
ity
as a
t 30
June
201
4 A
ustra
lian
Gov
ernm
ent
Fore
ign
Ass
et
curre
ncy
Acc
umul
ated
reva
luat
ion
trans
latio
nIn
vest
men
tsS
tatu
tory
Oth
er
Tota
lIte
m re
sults
rese
rve
rese
rve
rese
rve
fund
sre
serv
esre
serv
esTo
tal
$m$m
$m$m
$m$m
$m$m
Ope
ning
bal
ance
as
at 1
Jul
y 20
13(2
59,2
78)
33,8
28(1
55)
13,9
71(3
,248
)4,
399
48,7
95(2
10,4
83)
Non
-mat
eria
l cha
nges
in a
ccou
ntin
g po
licy
and
erro
rs50
616
(1)
29-
4488
594
Adj
uste
d op
enin
g ba
lanc
e as
at 1
Jul
y 20
13(2
58,7
72)
33,8
44(1
56)
14,0
00(3
,248
)4,
443
48,8
83(2
09,8
89)
Com
preh
ensi
ve re
sult
- Tot
al c
hang
e in
net
wor
th(5
3,83
5)1,
461
(166
)(1
,993
)3
105
(590
)(5
4,42
5)Tr
ansf
ers
to/(f
rom
)/bet
wee
n re
serv
es(7
,357
)37
-(9
82)
8,79
9(4
97)
7,35
7-
Equi
ty a
s at
30
June
201
4(3
19,9
64)
35,3
42(3
22)
11,0
255,
554
4,05
155
,650
(264
,314
)le
ss: M
inor
ity in
tere
sts
--
--
--
--
Attr
ibut
able
to th
e Au
stra
lian
Gov
ernm
ent
(319
,964
)35
,342
(322
)11
,025
5,55
44,
051
55,6
50(2
64,3
14)
Res
erve
s
Th
e ab
ove
stat
emen
t sho
uld
be re
ad in
con
junc
tion
with
the
acco
mpa
nyin
g no
tes.

45
Consolidated financial statements Au
stra
lian
Gov
ernm
ent s
tate
men
t of c
hang
es in
equ
ity (c
ontin
ued)
as
at 3
0 Ju
ne 2
013
Aus
tralia
n G
over
nmen
tR
eser
ves
Fore
ign
Ass
etcu
rrenc
y A
ccum
ulat
ed re
valu
atio
ntra
nsla
tion
Inve
stm
ents
Sta
tuto
ryO
ther
Tota
lIte
m re
sults
rese
rve
rese
rve
rese
rve
fund
sre
serv
es re
serv
es T
otal
$m
$m$m
$m$m
$m$m
$m
Ope
ning
bal
ance
as
at 1
Jul
y 20
12(3
01,7
85)
33,9
85(1
58)
13,9
77(3
,693
)81
444
,925
(256
,860
)C
hang
es in
acc
ount
ing
polic
y an
d er
rors
159
(119
)-
2-
7(1
10)
49A
djus
ted
open
ing
bala
nce
as a
t 1 J
uly
2012
(301
,626
)33
,866
(158
)13
,979
(3,6
93)
821
44,8
15(2
56,8
11)
Com
preh
ensi
ve re
sult
- Tot
al c
hang
e in
net
wor
th46
,648
(40)
3(8
)(1
43)
(132
)(3
20)
46,3
28Tr
ansf
ers
to/(f
rom
)/bet
wee
n re
serv
es(4
,300
)2
--
588
3,71
04,
300
-N
et w
orth
as
at 3
0 Ju
ne 2
013
(259
,278
)33
,828
(155
)13
,971
(3,2
48)
4,39
948
,795
(210
,483
)le
ss:
Min
ority
inte
rest
s-
--
--
--
-At
trib
utab
le to
the
Aust
ralia
n G
over
nmen
t(2
59,2
78)
33,8
28(1
55)
13,9
71(3
,248
)4,
399
48,7
95(2
10,4
83)
The
abov
e st
atem
ent s
houl
d be
read
in c
onju
nctio
n w
ith th
e ac
com
pany
ing
note
s.


SECTOR STATEMENTS

48
Sector Segments A
ustr
alia
n G
over
nmen
t ope
ratin
g st
atem
ent b
y se
ctor
— in
clud
ing
Gen
eral
Gov
ernm
ent S
ecto
r Fin
anci
al R
epor
t fo
r the
yea
r end
ed 3
0 Ju
ne 2
014
Not
e20
1420
1320
1420
1320
1420
1320
1420
1320
1420
13$m
$m$m
$m$m
$m$m
$m$m
$mR
even
ue fr
om tr
ansa
ctio
nsTa
xatio
n re
venu
e2
349,
208
334,
542
--
--
(139
)(1
12)
349,
069
334,
430
Sal
es o
f goo
ds a
nd s
ervi
ces
38,
575
8,88
69,
389
8,69
36,
713
6,14
0(1
,421
)(1
,592
)23
,256
22,1
27In
tere
st in
com
e4
3,33
93,
644
6685
1,98
11,
842
(920
)(9
13)
4,46
64,
658
Div
iden
d in
com
e4
4,10
53,
079
--
6470
(1,6
94)
(974
)2,
475
2,17
5O
ther
56,
843
7,00
981
156
8,99
919
0(9
,040
)(2
98)
6,88
37,
057
Tota
l rev
enue
372,
070
357,
160
9,53
68,
934
17,7
578,
242
(13,
214)
(3,8
89)
386,
149
370,
447
Expe
nses
from
tran
sact
ions
Gro
ss o
pera
ting
expe
nses
Wag
es a
nd s
alar
ies
618
,823
18,4
863,
548
3,23
249
849
0(1
)(1
)22
,868
22,2
07S
uper
annu
atio
n6
6,37
28,
403
474
260
9110
9(1
4)(1
2)6,
923
8,76
0D
epre
ciat
ion
and
amor
tisat
ion
76,
340
6,39
799
868
883
761
17,
422
7,16
2S
uppl
y of
goo
ds a
nd s
ervi
ces
875
,134
71,5
944,
835
4,25
75,
988
5,43
8(1
,422
)(1
,596
)84
,535
79,6
93O
ther
ope
ratin
g ex
pens
es6
6,01
75,
874
681
538
399
384
(3)
(2)
7,09
46,
794
Tota
l gro
ss o
pera
ting
expe
nses
112,
686
110,
754
10,5
368,
975
7,05
96,
497
(1,4
39)
(1,6
10)
128,
842
124,
616
Sup
eran
nuat
ion
inte
rest
exp
ense
68,
214
6,72
9-
--
--
-8,
214
6,72
9In
tere
st e
xpen
ses
915
,050
13,9
4736
316
61,
154
782
(921
)(9
13)
15,6
4613
,982
Cur
rent
tran
sfer
sC
urre
nt g
rant
s10
115,
960
110,
699
--
--
(50)
(109
)11
5,91
011
0,59
0S
ubsi
dy e
xpen
ses
13,3
6812
,247
--
--
(171
)(1
71)
13,1
9712
,076
Per
sona
l ben
efits
125,
184
117,
221
--
--
--
125,
184
117,
221
Tax
expe
nses
--
35(1
7)88
82(1
23)
(65)
--
Tota
l cur
rent
tran
sfer
s25
4,51
224
0,16
735
(17)
8882
(344
)(3
45)
254,
291
239,
887
Cap
ital t
rans
fers
Mut
ually
agr
eed
writ
e-do
wns
102,
627
794
--
--
(150
)-
2,47
779
4O
ther
cap
ital g
rant
s10
18,7
327,
888
--
--
(8,8
00)
-9,
932
7,88
8To
tal c
apita
l tra
nsfe
rs21
,359
8,68
2-
--
-(8
,950
)-
12,4
098,
682
Tota
l exp
ense
s11
411,
821
380,
279
10,9
349,
124
8,30
17,
361
(11,
654)
(2,8
68)
419,
402
393,
896
Net
ope
ratin
g ba
lanc
e(3
9,75
1)(2
3,11
9)(1
,398
)(1
90)
9,45
688
1(1
,560
)(1
,021
)(3
3,25
3)(2
3,44
9)
netti
ng(a
)G
ener
al
Gov
ernm
ent
corp
orat
ions
corp
orat
ions
Pub
lic n
on-fi
nanc
ial
Pub
lic fi
nanc
ial
Gov
ernm
ent
Aus
tralia
nE
limin
atio
ns a
nd
(a
) Th
e el
imin
atio
ns a
nd n
ettin
g co
lum
n in
clud
es a
djus
tmen
ts re
sulti
ng fr
om th
e el
imin
atio
n of
inte
r-se
ctor
tran
sact
ions
and
the
netti
ng o
f gai
ns a
nd lo
sses
from
ass
et
sale
s an
d fo
reig
n cu
rrenc
y tra
nsac
tions
.

Sector statements
49
Aus
tral
ian
Gov
ernm
ent o
pera
ting
stat
emen
t by
sect
or —
incl
udin
g G
ener
al G
over
nmen
t Sec
tor F
inan
cial
Rep
ort (
cont
inue
d)
for t
he y
ear e
nded
30
June
201
4
Not
e20
1420
1320
1420
1320
1420
1320
1420
1320
1420
13$m
$m$m
$m$m
$m$m
$m$m
$mO
ther
eco
nom
ic fl
ows
- inc
lude
din
ope
ratin
g re
sult
Net
writ
e-do
wns
of a
sset
s (i
nclu
ding
bad
and
dou
btfu
l deb
ts)
12(7
,221
)(6
,800
)(6
6)(5
91)
(104
)(1
4)13
15(7
,378
)(7
,390
)A
sset
s re
cogn
ised
for t
he fi
rst t
ime
310
388
--
21
1(1
)31
338
8N
et g
ain/
(loss
) fro
m th
e sa
le o
f ass
ets
136,
093
1,33
919
746
34(3
09)
1-
6,32
51,
076
Net
fore
ign
exch
ange
gai
ns14
(402
)(2
,284
)8
1114
93,
951
--
(245
)1,
678
Net
sw
ap in
tere
st re
ceiv
ed15
(524
)16
114
3325
--
(480
)45
Oth
er g
ains
/(los
ses)
16(8
,322
)23
,689
1414
124
182
1-
(8,1
83)
23,8
85A
mor
tisat
ion
of n
on-p
rodu
ced
asse
ts(6
4)(3
1)(6
0)(5
4)(1
0)(1
1)1
1(1
33)
(95)
Sha
re o
f net
resu
lt fro
m a
ssoc
iate
s an
d jo
int v
entu
res
acco
unte
d fo
r usi
ng th
e eq
uity
met
hod
6437
--
--
1-
6537
Ope
ratin
g re
sult
(49,
817)
(6,7
65)
(1,2
94)
(760
)9,
684
4,70
6(1
,542
)(1
,006
)(4
2,96
9)(3
,825
)
Oth
er e
cono
mic
flow
s - O
ther
non-
owne
r m
ovem
ents
in e
quity
Item
s th
at w
ill n
ot b
e re
clas
sifie
d to
ope
ratin
g re
sult
Rev
alua
tion
of n
on-fi
nanc
ial a
sset
s33
1,15
855
963
6714
15-
-1,
235
641
Act
uaria
l rev
alua
tions
of s
uper
annu
atio
n(1
3,23
3)50
,122
220
301
(1)
1-
-(1
3,01
4)50
,424
Oth
er e
cono
mic
reva
luat
ions
(58)
(48)
(94)
(108
)15
7(3
00)
3615
341
(303
)Ite
ms
that
may
be
recl
assi
fied
subs
eque
ntly
to
oper
atin
g re
sult
Rev
alua
tion
of e
quity
337,
679
1,43
7-
-26
2(6
82)
(7,6
59)
(1,3
64)
282
(609
)C
ompr
ehen
sive
res
ult -
Tot
al c
hang
ein
net
wor
th b
efor
e tr
ansa
ctio
ns w
ithow
ners
in th
eir
capa
city
as
owne
rs(5
4,27
1)45
,305
(1,1
05)
(500
)10
,116
3,74
0(9
,165
)(2
,217
)(5
4,42
5)46
,328
Net
ope
ratin
g ba
lanc
e(3
9,75
1)(2
3,11
9)(1
,398
)(1
90)
9,45
688
1(1
,560
)(1
,021
)(3
3,25
3)(2
3,44
9)le
ss N
et a
cqui
sitio
n of
non
-fin
anci
al a
sset
sP
urch
ases
of n
on-fi
nanc
ial a
sset
s9,
613
8,04
64,
726
3,78
780
525
--
15,1
4411
,858
less
Sal
es o
f non
-fina
ncia
l ass
ets
241
1,72
919
710
95
11
-44
41,
839
less
Dep
reci
atio
n6,
341
6,39
899
868
884
76(1
)-
7,42
27,
162
plus
Cha
nge
in in
vent
orie
s70
41,
007
1411
2(1
2)1
(1)
721
1,00
5pl
us O
ther
mov
emen
ts in
non
-fina
ncia
l ass
ets
115
6287
558
5(1
)3
-(1
)98
964
9
Tota
l net
acq
uisi
tion
of n
on-f
inan
cial
ass
ets
3,85
098
84,
420
3,58
671
7(6
1)1
(2)
8,98
84,
511
Fisc
al b
alan
ce (N
et le
ndin
g/bo
rrow
ing)
(43,
601)
(24,
107)
(5,8
18)
(3,7
76)
8,73
994
2(1
,561
)(1
,019
)(4
2,24
1)(2
7,96
0)
gove
rnm
ent
corp
orat
ions
corp
orat
ions
Gen
eral
P
ublic
non
-fina
ncia
l P
ublic
fina
ncia
lne
tting
(a)
Gov
ernm
ent
Elim
inat
ions
and
A
ustra
lian
(a)
The
elim
inat
ions
and
net
ting
colu
mn
incl
udes
adj
ustm
ents
resu
lting
from
the
elim
inat
ion
of in
ter-
sect
or tr
ansa
ctio
ns a
nd th
e ne
tting
of g
ains
and
loss
es fr
om a
sset
sa
les
and
fore
ign
curre
ncy
trans
actio
ns.

50
Sector Segments A
ustr
alia
n G
over
nmen
t bal
ance
she
et b
y se
ctor
— in
clud
ing
Gen
eral
Gov
ernm
ent S
ecto
r Fin
anci
al R
epor
t as
at 3
0 Ju
ne 2
014
Not
e20
1420
1320
1420
1320
1420
1320
1420
1320
1420
13$m
$m$m
$m$m
$m$m
$m$m
$mAs
sets
Fina
ncia
l ass
ets
Cas
h an
d de
posi
ts34
B3,
844
2,11
31,
380
891
1,03
01,
095
(1,7
40)
(37)
4,51
44,
062
Adva
nces
pai
d18
34,0
4029
,373
814
1,85
11,
759
(1,0
65)
(1,0
71)
34,8
3430
,075
Oth
er re
ceiv
able
s an
d ac
crue
dre
venu
e18
42,6
2941
,626
1,17
21,
334
573
557
(1,4
41)
(783
)42
,933
42,7
34In
vest
men
ts, l
oans
and
pla
cem
ents
1911
7,61
111
1,09
741
51,
001
143,
954
101,
037
(32,
204)
(21,
835)
229,
776
191,
300
Equi
ty in
vest
men
ts20
75,5
7659
,033
911
638
740
(35,
746)
(24,
879)
40,4
7734
,905
Tota
l fin
anci
al a
sset
s27
3,70
024
3,24
22,
984
3,25
114
8,04
610
5,18
8(7
2,19
6)(4
8,60
5)35
2,53
430
3,07
6N
on-fi
nanc
ial a
sset
sLa
nd
219,
331
8,91
736
637
314
914
9-
19,
846
9,44
0Bu
ildin
gs21
24,7
2323
,500
2,37
41,
972
284
270
--
27,3
8125
,742
Plan
t, eq
uipm
ent a
nd in
frast
ruct
ure
2154
,294
52,8
9811
,613
8,26
827
520
91
-66
,183
61,3
75In
tang
ible
s22
6,13
75,
636
1,92
11,
826
263
360
--
8,32
17,
822
Inve
stm
ent p
rope
rty21
183
195
192
173
--
--
375
368
Inve
ntor
ies
238,
253
7,92
610
610
111
91
28,
371
8,03
8Bi
olog
ical
ass
ets
2436
33-
--
--
-36
33H
erita
ge a
nd c
ultu
ral a
sset
s21
10,8
2510
,547
--
--
--
10,8
2510
,547
Asse
ts h
eld
for s
ale
2495
110
4810
3-
--
-14
321
3Ta
x as
sets
--
913
904
1213
(925
)(9
17)
--
Oth
er n
on-fi
nanc
ial a
sset
s24
3,39
52,
755
2,41
01,
521
9168
(115
)(1
20)
5,78
14,
224
Tota
l non
-fina
ncia
l ass
ets
117,
272
112,
517
19,9
4315
,241
1,08
51,
078
(1,0
38)
(1,0
34)
137,
262
127,
802
Tota
l ass
ets
390,
972
355,
759
22,9
2718
,492
149,
131
106,
266
(73,
234)
(49,
639)
489,
796
430,
878
Gen
eral
G
over
nmen
tAu
stra
lian
Gov
ernm
ent
netti
ng(a
)co
rpor
atio
nsPu
blic
fina
ncia
lEl
imin
atio
ns a
nd
Publ
ic n
on-fi
nanc
ial
corp
orat
ions
(a
) Th
e el
imin
atio
ns a
nd n
ettin
g co
lum
n in
clud
es a
djus
tmen
ts re
sulti
ng fr
om th
e el
imin
atio
n of
inte
r-se
ctor
tran
sact
ions
and
the
netti
ng o
f gai
ns a
nd lo
sses
from
ass
et
sale
s an
d fo
reig
n cu
rrenc
y tra
nsac
tions
.

Sector statements
51
Aus
tral
ian
Gov
ernm
ent b
alan
ce s
heet
by
sect
or —
incl
udin
g G
ener
al G
over
nmen
t Sec
tor F
inan
cial
Rep
ort (
cont
inue
d)
as a
t 30
June
201
4
Not
e20
1420
1320
1420
1320
1420
1320
1420
1320
1420
13$m
$m$m
$m$m
$m$m
$m$m
$mLi
abili
ties
Inte
rest
bea
ring
liabi
litie
sD
epos
its h
eld
2621
118
2-
-53
,574
26,1
83(2
9,19
7)(2
0,24
1)24
,588
6,12
4G
over
nmen
t sec
uriti
es27
351,
282
285,
748
--
--
(4,6
66)
(1,5
88)
346,
616
284,
160
Loan
s28
4,70
84,
074
2,51
02,
509
2,28
52,
268
(1,0
39)
(1,0
20)
8,46
47,
831
Oth
er b
orro
win
g29
1,52
91,
024
3,46
11,
338
--
-(1
)4,
990
2,36
1O
ther
inte
rest
bea
ring
liabi
litie
s30
5,67
49,
616
143
7,24
75,
329
(1)
-12
,934
14,9
48To
tal i
nter
est b
earin
g lia
bilit
ies
363,
404
300,
644
5,98
53,
850
63,1
0633
,780
(34,
903)
(22,
850)
397,
592
315,
424
Prov
isio
ns a
nd p
ayab
les
Supe
rann
uatio
n lia
bilit
y31
221,
747
193,
313
459
197
321
-1
221,
948
193,
694
Oth
er e
mpl
oyee
liab
ilitie
s 31
15,9
3014
,796
1,34
91,
239
1,44
11,
311
-4
18,7
2017
,350
Supp
liers
pay
able
324,
882
6,44
71,
036
1,00
540
736
2(1
79)
(228
)6,
146
7,58
6Pe
rson
al b
enef
its p
ayab
le32
5,60
75,
699
--
--
--
5,60
75,
699
Subs
idie
s pa
yabl
e32
4,48
23,
580
--
--
--
4,48
23,
580
Gra
nts
paya
ble
323,
355
3,35
5-
--
--
-3,
355
3,35
5Au
stra
lian
curre
ncy
on is
sue
32-
--
-60
,778
56,9
43-
-60
,778
56,9
43Ta
x lia
bilit
ies
--
560
555
281
(588
)(5
56)
--
Oth
er p
ayab
les
323,
476
3,10
41,
307
999
2,04
61,
250
(1,3
97)
(705
)5,
432
4,64
8O
ther
pro
visi
ons
3229
,181
32,2
2239
341
447
744
6(1
)-
30,0
5033
,082
Tota
l pro
visi
ons
and
paya
bles
288,
660
262,
516
4,64
94,
271
65,3
7460
,634
(2,1
65)
(1,4
84)
356,
518
325,
937
Tota
l lia
bilit
ies
652,
064
563,
160
10,6
348,
121
128,
480
94,4
14(3
7,06
8)(2
4,33
4)75
4,11
064
1,36
1
Gen
eral
G
over
nmen
tG
over
nmen
tAu
stra
lian
corp
orat
ions
corp
orat
ions
netti
ng(a
)Pu
blic
non
-fina
ncia
l Pu
blic
fina
ncia
lEl
imin
atio
ns a
nd
(a
) Th
e el
imin
atio
ns a
nd n
ettin
g co
lum
n in
clud
es a
djus
tmen
ts re
sulti
ng fr
om th
e el
imin
atio
n of
inte
r-se
ctor
tran
sact
ions
and
the
netti
ng o
f gai
ns a
nd lo
sses
from
ass
et
sale
s an
d fo
reig
n cu
rrenc
y tra
nsac
tions
.

52
Sector Segments A
ustr
alia
n G
over
nmen
t bal
ance
she
et b
y se
ctor
— in
clud
ing
Gen
eral
Gov
ernm
ent S
ecto
r Fin
anci
al R
epor
t (co
ntin
ued)
as
at 3
0 Ju
ne 2
014
Not
e20
1420
1320
1420
1320
1420
1320
1420
1320
1420
13$m
$m$m
$m$m
$m$m
$m$m
$mN
et w
orth
Acc
umul
ated
resu
lts(3
16,1
39)
(249
,354
)(1
,530
)(6
9)1,
370
1,16
3(3
,665
)(1
1,01
8)(3
19,9
64)
(259
,278
)R
eser
ves
55,0
4741
,953
1,85
21,
702
19,1
5010
,558
(20,
399)
(5,4
18)
55,6
5048
,795
Con
tribu
ted
equi
ty-
-11
,971
8,73
813
113
1(1
2,10
2)(8
,869
)-
-M
inor
ity in
tere
sts
--
--
--
--
--
Net
wor
th(2
61,0
92)
(207
,401
)12
,293
10,3
7120
,651
11,8
52(3
6,16
6)(2
5,30
5)(2
64,3
14)
(210
,483
)C
urre
nt li
abili
ties
76,9
0966
,691
3,68
73,
495
64,5
9234
,177
(36,
208)
(23,
209)
108,
980
81,1
54N
on-c
urre
nt li
abili
ties
575,
155
496,
469
6,94
74,
626
63,8
8860
,237
(860
)(1
,123
)64
5,13
056
0,20
9To
tal l
iabi
litie
s by
mat
urity
652,
064
563,
160
10,6
348,
121
128,
480
94,4
14(3
7,06
8)(2
4,33
2)75
4,11
064
1,36
3C
urre
nt a
sset
s19
3,86
117
2,33
33,
059
3,43
813
5,86
493
,350
(35,
776)
(22,
801)
297,
008
246,
320
Non
-cur
rent
ass
ets
197,
111
183,
426
19,8
6815
,054
13,2
6712
,916
(37,
458)
(26,
838)
192,
788
184,
558
Tota
l ass
ets
by m
atur
ity39
0,97
235
5,75
922
,927
18,4
9214
9,13
110
6,26
6(7
3,23
4)(4
9,63
9)48
9,79
643
0,87
8
Aus
tralia
nco
rpor
atio
nsco
rpor
atio
nsne
tting
(a)
Gov
ernm
ent
Pub
lic n
on-fi
nanc
ial
Pub
lic fi
nanc
ial
Elim
inat
ions
and
G
over
nmen
tG
ener
al
(a
) Th
e el
imin
atio
ns a
nd n
ettin
g co
lum
n in
clud
es a
djus
tmen
ts re
sulti
ng fr
om th
e el
imin
atio
n of
inte
r-se
ctor
tran
sact
ions
and
the
netti
ng o
f gai
ns a
nd lo
sses
from
ass
et
sale
s an
d fo
reig
n cu
rrenc
y tra
nsac
tions
.

Sector statements
53
Aus
tral
ian
Gov
ernm
ent c
ash
flow
sta
tem
ent b
y se
ctor
— in
clud
ing
Gen
eral
Gov
ernm
ent S
ecto
r Fin
anci
al R
epor
t
for t
he y
ear e
nded
30
June
201
4
2014
2013
2014
2013
2014
2013
2014
2013
2014
2013
$m$m
$m$m
$m$m
$m$m
$m$m
OPE
RA
TIN
G A
CTI
VITI
ESC
ash
rece
ived
Taxe
s re
ceiv
ed33
8,36
832
6,42
6-
--
14
(143
)33
8,37
232
6,28
4R
ecei
pts
from
sal
es o
fgo
ods
and
serv
ices
8,57
99,
071
10,4
219,
556
6,67
55,
893
(1,4
67)
(1,4
42)
24,2
0823
,078
Inte
rest
rece
ipts
3,12
83,
561
7286
1,89
41,
898
(872
)(9
25)
4,22
24,
620
Div
iden
d re
ceip
ts2,
978
3,42
03
-43
49(9
76)
(1,3
81)
2,04
82,
088
GS
T re
ceip
ts-
-27
756
1818
(295
)(7
4)-
-O
ther
rece
ipts
6,81
16,
845
1288
9,00
519
6(8
,746
)(3
01)
7,08
26,
828
Tota
l cas
h re
ceiv
ed35
9,86
434
9,32
310
,785
9,78
617
,635
8,05
5(1
2,35
2)(4
,266
)37
5,93
236
2,89
8C
ash
used
Taxe
s pa
id-
-(8
4)(7
0)(6
1)(5
1)14
512
1-
-P
aym
ents
for e
mpl
oyee
s(2
5,88
9)(2
5,00
0)(3
,759
)(3
,465
)(4
30)
(440
)15
10(3
0,06
3)(2
8,89
5)P
aym
ents
for g
oods
and
ser
vice
s(7
5,84
5)(7
2,07
5)(5
,599
)(5
,392
)(5
,575
)(5
,641
)1,
590
1,44
7(8
5,42
9)(8
1,66
1)G
rant
s an
d su
bsid
ies
paid
(148
,990
)(1
27,7
54)
--
(123
)(1
06)
9,02
128
0(1
40,0
92)
(127
,580
)In
tere
st p
aid
(13,
972)
(11,
846)
(65)
(72)
(1,1
37)
(838
)86
692
1(1
4,30
8)(1
1,83
5)P
erso
nal b
enef
its(1
26,3
67)
(116
,629
)-
--
--
-(1
26,3
67)
(116
,629
)G
ST
paid
--
(396
)(1
04)
--
396
104
--
Oth
er p
aym
ents
(5,7
69)
(5,9
02)
(604
)(4
49)
(266
)(2
29)
(514
)-
(7,1
53)
(6,5
80)
Tota
l cas
h us
ed(3
96,8
32)
(359
,206
)(1
0,50
7)(9
,552
)(7
,592
)(7
,305
)11
,519
2,88
3(4
03,4
12)
(373
,180
)N
et c
ash
from
/(use
d by
)op
erat
ing
activ
ities
(36,
968)
(9,8
83)
278
234
10,0
4375
0(8
33)
(1,3
83)
(27,
480)
(10,
282)
Pub
lic n
on-fi
nanc
ial
corp
orat
ions
Pub
lic fi
nanc
ial
corp
orat
ions
Gen
eral
Gov
ernm
ent
Elim
inat
ions
and
A
ustra
lian
netti
ng(a
)G
over
nmen
t
(a
) Th
e el
imin
atio
ns a
nd n
ettin
g co
lum
n in
clud
es a
djus
tmen
ts re
sulti
ng fr
om th
e el
imin
atio
n of
inte
r-se
ctor
tran
sact
ions
and
the
netti
ng o
f gai
ns a
nd lo
sses
from
ass
et
sale
s an
d fo
reig
n cu
rrenc
y tra
nsac
tions
.

54
Sector Segments A
ustr
alia
n G
over
nmen
t cas
h flo
w s
tate
men
t by
sect
or —
incl
udin
g G
ener
al G
over
nmen
t Sec
tor F
inan
cial
Rep
ort (c
ontin
ued)
fo
r the
yea
r end
ed 3
0 Ju
ne 2
014
2014
2013
2014
2013
2014
2013
2014
2013
2014
2013
$m$m
$m$m
$m$m
$m$m
$m$m
INVE
STIN
G A
CTI
VITI
ESC
ash
flow
s fr
om in
vest
men
tsin
non
-fina
ncia
l ass
ets
Sal
es o
f non
-fina
ncia
l ass
ets
457
1,72
925
750
51
--
719
1,78
0P
urch
ases
of n
on-fi
nanc
ial a
sset
s(9
,012
)(7
,644
)(3
,523
)(3
,284
)(8
03)
(26)
11
(13,
337)
(10,
953)
Net
cas
h flo
ws
from
inve
stm
ents
in n
on-fi
nanc
ial a
sset
s(8
,555
)(5
,915
)(3
,266
)(3
,234
)(7
98)
(25)
11
(12,
618)
(9,1
73)
Cas
h flo
ws
from
inve
stm
ents
in
fina
ncia
l ass
ets
for
polic
y pu
rpos
esN
et a
dvan
ces
repa
id/(p
aid)
(6,3
71)
(4,8
02)
--
--
(58)
281
(6,4
29)
(4,5
21)
Net
cas
h flo
ws
from
inve
stm
ents
in fi
nanc
ial a
sset
s fo
rpo
licy
purp
oses
(6,3
71)
(4,8
02)
--
--
(58)
281
(6,4
29)
(4,5
21)
Cas
h flo
ws
from
inve
stm
ents
in fi
nanc
ial a
sset
s fo
rliq
uidi
ty p
urpo
ses
Dec
reas
e/(In
crea
se) i
n in
vest
men
ts(7
,718
)(6
,197
)65
6(3
41)
(40,
033)
(10,
757)
13,5
918,
126
(33,
504)
(9,1
69)
Net
cas
h flo
ws
from
inve
stm
ents
in
fina
ncia
l ass
ets
for
liqui
dity
pur
pose
s(7
,718
)(6
,197
)65
6(3
41)
(40,
033)
(10,
757)
13,5
918,
126
(33,
504)
(9,1
69)
Net
cas
h fr
om/(u
sed
by)
inve
stin
g ac
tiviti
es(2
2,64
4)(1
6,91
4)(2
,610
)(3
,575
)(4
0,83
1)(1
0,78
2)13
,534
8,40
8(5
2,55
1)(2
2,86
3)
Aus
tralia
nG
over
nmen
tE
limin
atio
ns a
nd
netti
ng(a
)G
over
nmen
tco
rpor
atio
nsP
ublic
fina
ncia
lco
rpor
atio
nsP
ublic
non
-fina
ncia
lG
ener
al
(a
) Th
e el
imin
atio
ns a
nd n
ettin
g co
lum
n in
clud
es a
djus
tmen
ts re
sulti
ng fr
om th
e el
imin
atio
n of
inte
r-se
ctor
tran
sact
ions
and
the
netti
ng o
f gai
ns a
nd lo
sses
from
ass
et
sale
s an
d fo
reig
n cu
rrenc
y tra
nsac
tions
.
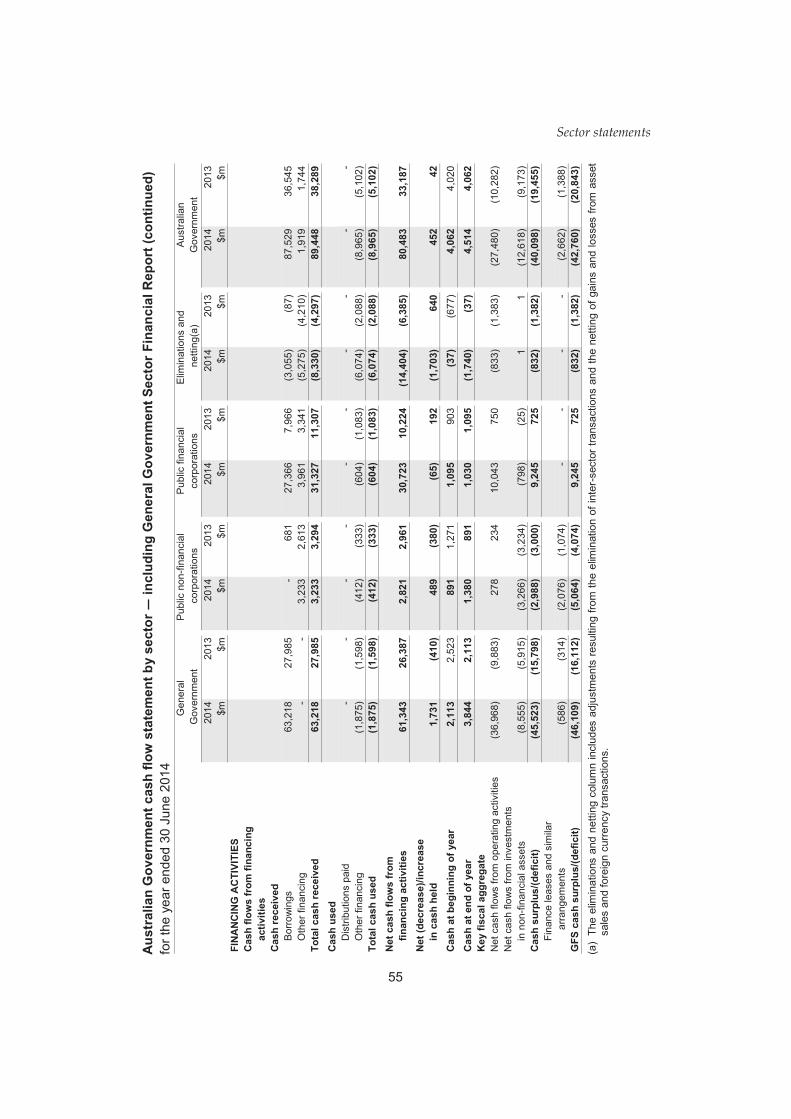
Sector statements
55
Aus
tral
ian
Gov
ernm
ent c
ash
flow
sta
tem
ent b
y se
ctor
— in
clud
ing
Gen
eral
Gov
ernm
ent S
ecto
r Fin
anci
al R
epor
t (co
ntin
ued)
fo
r the
yea
r end
ed 3
0 Ju
ne 2
014
2014
2013
2014
2013
2014
2013
2014
2013
2014
2013
$m$m
$m$m
$m$m
$m$m
$m$m
FIN
AN
CIN
G A
CTI
VITI
ESC
ash
flow
s fr
om fi
nanc
ing
activ
ities
Cas
h re
ceiv
edB
orro
win
gs63
,218
27,9
85-
681
27,3
667,
966
(3,0
55)
(87)
87,5
2936
,545
Oth
er fi
nanc
ing
--
3,23
32,
613
3,96
13,
341
(5,2
75)
(4,2
10)
1,91
91,
744
Tota
l cas
h re
ceiv
ed63
,218
27,9
853,
233
3,29
431
,327
11,3
07(8
,330
)(4
,297
)89
,448
38,2
89C
ash
used
Dis
tribu
tions
pai
d-
--
--
--
--
-O
ther
fina
ncin
g(1
,875
)(1
,598
)(4
12)
(333
)(6
04)
(1,0
83)
(6,0
74)
(2,0
88)
(8,9
65)
(5,1
02)
Tota
l cas
h us
ed(1
,875
)(1
,598
)(4
12)
(333
)(6
04)
(1,0
83)
(6,0
74)
(2,0
88)
(8,9
65)
(5,1
02)
Net
cas
h flo
ws
from
finan
cing
act
iviti
es61
,343
26,3
872,
821
2,96
130
,723
10,2
24(1
4,40
4)(6
,385
)80
,483
33,1
87N
et (d
ecre
ase)
/incr
ease
in c
ash
held
1,73
1(4
10)
489
(380
)(6
5)19
2(1
,703
)64
045
242
Cas
h at
beg
inni
ng o
f yea
r2,
113
2,52
389
11,
271
1,09
590
3(3
7)(6
77)
4,06
24,
020
Cas
h at
end
of y
ear
3,84
42,
113
1,38
089
11,
030
1,09
5(1
,740
)(3
7)4,
514
4,06
2K
ey fi
scal
agg
rega
teN
et c
ash
flow
s fro
m o
pera
ting
activ
ities
(3
6,96
8)(9
,883
)27
823
410
,043
750
(833
)(1
,383
)(2
7,48
0)(1
0,28
2)N
et c
ash
flow
s fro
m in
vest
men
tsin
non
-fina
ncia
l ass
ets
(8,5
55)
(5,9
15)
(3,2
66)
(3,2
34)
(798
)(2
5)1
1(1
2,61
8)(9
,173
)C
ash
surp
lus/
(def
icit)
(45,
523)
(15,
798)
(2,9
88)
(3,0
00)
9,24
572
5(8
32)
(1,3
82)
(40,
098)
(19,
455)
Fina
nce
leas
es a
nd s
imila
rar
rang
emen
ts(5
86)
(314
)(2
,076
)(1
,074
)-
--
-(2
,662
)(1
,388
)G
FS c
ash
surp
lus/
(def
icit)
(46,
109)
(16,
112)
(5,0
64)
(4,0
74)
9,24
572
5(8
32)
(1,3
82)
(42,
760)
(20,
843)
Gov
ernm
ent
corp
orat
ions
corp
orat
ions
netti
ng(a
)G
ener
alP
ublic
non
-fina
ncia
l P
ublic
fina
ncia
lE
limin
atio
ns a
nd
Gov
ernm
ent
Aus
tralia
n
(a
) Th
e el
imin
atio
ns a
nd n
ettin
g co
lum
n in
clud
es a
djus
tmen
ts re
sulti
ng fr
om th
e el
imin
atio
n of
inte
r-se
ctor
tran
sact
ions
and
the
netti
ng o
f gai
ns a
nd lo
sses
from
ass
et
sale
s an
d fo
reig
n cu
rrenc
y tra
nsac
tions
.

56
Sector Segments A
ustr
alia
n G
over
nmen
t sta
tem
ent o
f cha
nges
in e
quity
— G
ener
al G
over
nmen
t Sec
tor
for t
he y
ear e
nded
30
June
201
4 G
ener
al G
over
nmen
tFo
reig
nA
sset
cur
renc
yA
ccum
ulat
ed re
valu
atio
n tr
ansl
atio
nIn
vest
men
tsS
tatu
tory
Oth
erTo
tal
Con
tribu
ted
Item
resu
lts re
serv
e re
serv
e re
serv
e fu
nds
rese
rves
rese
rves
equ
ity T
otal
$m
$m$m
$m$m
$m$m
$m$m
Ope
ning
bal
ance
as
at 1
Jul
y 20
13(2
49,3
54)
29,2
56(2
18)
12,8
45-
7041
,953
-(2
07,4
01)
Non
-mat
eria
l cha
nges
in
acc
ount
ing
polic
y an
d er
rors
482
15(2
)35
-47
95-
577
Adj
uste
d op
enin
g ba
lanc
e as
at 1
Jul
y 20
13(2
48,8
72)
29,2
71(2
20)
12,8
80-
117
42,0
48-
(206
,824
)C
ompr
ehen
sive
resu
lt - T
otal
cha
nge
in
-ne
t wor
th(6
8,18
2)1,
118
(109
)12
,948
-(4
4)13
,913
-(5
4,26
9)Tr
ansf
ers
to/(f
rom
) res
erve
s91
553
-(9
83)
-16
(914
)-
1Eq
uity
as
at 3
0 Ju
ne 2
014
(316
,139
)30
,442
(329
)24
,845
-89
55,0
47-
(261
,092
)le
ss M
inor
ity in
tere
sts
--
--
--
--
-At
trib
utab
le to
the
Aust
ralia
n G
over
nmen
t(3
16,1
39)
30,4
42(3
29)
24,8
45-
8955
,047
-(2
61,0
92)
Res
erve
s
Th
e ab
ove
stat
emen
t sho
uld
be re
ad in
con
junc
tion
with
the
acco
mpa
nyin
g no
tes.

Sector statements
57
Aus
tral
ian
Gov
ernm
ent s
tate
men
t of c
hang
es in
equ
ity —
Gen
eral
Gov
ernm
ent S
ecto
r (co
ntin
ued)
fo
r the
yea
r end
ed 3
0 Ju
ne 2
013
Gen
eral
Gov
ernm
ent
Res
erve
sFo
reig
nA
sset
cur
renc
yA
ccum
ulat
edre
valu
atio
n tr
ansl
atio
nIn
vest
men
tsS
tatu
tory
Oth
erTo
tal
Con
tribu
ted
Item
resu
lts re
serv
e re
serv
e re
serv
e fu
nds
rese
rves
rese
rves
equ
ity T
otal
$m
$m$m
$m$m
$m$m
$m$m
Ope
ning
bal
ance
as
at 1
Jul
y 20
12(2
92,9
38)
28,8
07(1
78)
11,4
86-
6840
,183
-(2
52,7
55)
Cha
nges
in a
ccou
ntin
g po
licy
and
erro
rs15
8(1
19)
-2
-7
(110
)-
48A
djus
ted
open
ing
bala
nce
as a
t 1 J
uly
2012
(292
,780
)28
,688
(178
)11
,488
-75
40,0
73-
(252
,707
)C
ompr
ehen
sive
resu
lt - T
otal
cha
nge
in
-ne
t wor
th43
,417
560
(40)
1,35
7-
111,
888
-45
,305
Tran
sfer
s to
/(fro
m) r
eser
ves
98
--
-(1
6)(8
)-
1N
et w
orth
as
at 3
0 Ju
ne 2
013
(249
,354
)29
,256
(218
)12
,845
-70
41,9
53-
(207
,401
)le
ss M
inor
ity in
tere
sts
--
--
--
--
-At
trib
utab
le to
the
Aust
ralia
n G
over
nmen
t(2
49,3
54)
29,2
56(2
18)
12,8
45-
7041
,953
-(2
07,4
01)
The
abov
e st
atem
ent s
houl
d be
read
in c
onju
nctio
n w
ith th
e ac
com
pany
ing
note
s.

NOTES TO THE FINANCIAL STATEMENTS


60
INDEX TO NOTES
NOTE 1: STATEMENT OF SIGNIFICANT ACCOUNTING POLICIES ....................... 62 NOTE 2: TAXATION REVENUE .................................................................... 100 NOTE 3: SALES OF GOODS AND SERVICES ................................................. 101 NOTE 4: INTEREST AND DIVIDEND INCOME ................................................. 101 NOTE 5: OTHER SOURCES OF NON-TAXATION REVENUE ............................. 101 NOTE 6: EMPLOYEE AND SUPERANNUATION EXPENSES .............................. 102 NOTE 7: DEPRECIATION AND AMORTISATION EXPENSES ............................. 102 NOTE 8: SUPPLY OF GOODS AND SERVICES ............................................... 102 NOTE 9: INTEREST EXPENSE ..................................................................... 103 NOTE 10: GRANTS EXPENSE ....................................................................... 103 NOTE 11: EXPENSES BY FUNCTION ............................................................. 104 NOTE 12: NET WRITE-DOWN OF ASSETS
(INCLUDING BAD AND DOUBTFUL DEBTS) ...................................... 104 NOTE 13: NET GAIN/(LOSS) FROM THE SALE OF ASSETS ............................... 105 NOTE 14: NET FOREIGN EXCHANGE GAINS/(LOSSES) ................................... 106 NOTE 15: NET SWAP INTEREST RECEIVED ................................................... 106 NOTE 16: OTHER GAINS/(LOSSES) .............................................................. 106 NOTE 17: FAIR VALUE MEASUREMENT ......................................................... 106 NOTE 18: ADVANCES PAID AND RECEIVABLES ............................................. 123 NOTE 19: INVESTMENTS, LOANS AND PLACEMENTS ..................................... 125 NOTE 20: EQUITY INVESTMENTS ................................................................. 126 NOTE 21: LAND AND BUILDINGS, PLANT, EQUIPMENT AND
INFRASTRUCTURE, HERITAGE AND CULTURAL ASSETS AND INVESTMENT PROPERTIES ............................................................ 126
NOTE 22: INTANGIBLES .............................................................................. 135 NOTE 23: INVENTORIES .............................................................................. 137 NOTE 24: OTHER NON-FINANCIAL ASSETS ................................................... 137 NOTE 25: ASSETS BY FUNCTION ................................................................. 138 NOTE 26: DEPOSIT LIABILITIES ................................................................... 138 NOTE 27: GOVERNMENT SECURITIES .......................................................... 139 NOTE 28: LOANS ....................................................................................... 139

Notes to the financial statements
61
NOTE 29: OTHER BORROWINGS .................................................................. 139 NOTE 30: OTHER INTEREST BEARING LIABILITIES ......................................... 140 NOTE 31: EMPLOYEE BENEFITS .................................................................. 140 NOTE 32: OTHER PROVISIONS AND PAYABLES ............................................. 141 NOTE 33: NET REVALUATION INCREASES/(DECREASES) ............................... 142 NOTE 34: RECONCILIATION OF CASH ........................................................... 143 NOTE 35: COMMITMENTS ........................................................................... 145 NOTE 36: CONTINGENCIES ......................................................................... 148 NOTE 37: FINANCIAL INSTRUMENTS ............................................................ 170 NOTE 38: DEFINED BENEFIT SUPERANNUATION PLANS ................................. 193 NOTE 39: EVENTS OCCURRING AFTER BALANCE DATE ................................. 212 NOTE 40: CONSOLIDATED REVENUE FUND ................................................... 214 NOTE 41: ASSETS HELD IN TRUST ............................................................... 214 NOTE 42: RECONCILIATIONS TO ABS GFS MEASURES ................................ 216 NOTE 43: AUDIT EXPENSES ........................................................................ 221 NOTE 44: EXPLANATION OF MAJOR VARIANCES BETWEEN THE GENERAL
GOVERNMENT SECTOR BUDGET AND THE ACTUAL OUTCOMES........ 221 NOTE 45: LIST OF AUSTRALIAN GOVERNMENT REPORTING ENTITIES ............. 232 NOTE 46: GLOSSARY ................................................................................. 241

Notes to the financial statements
62
Note 1: Statement of significant accounting policies
1.1 Purpose
The purpose of this note is to disclose the significant accounting policies applied in the financial report of the Australian Government (whole of government) and the general government sector (GGS). Except as otherwise noted, the accounting policies detailed in this note are applicable at both the whole of government level and for the GGS.
1.2 Statement of compliance
The Australian Government Consolidated Financial Statements (CFS) are required by section 55 of the Financial Management and Accountability Act 1997 (FMA Act), and the regulations of that Act. As of 1 July 2014, the Public Governance, Performance and Accountability Act 2013 (PGPA Act) has replaced the FMA Act and the Commonwealth Authorities and Companies Act 1997 (CAC Act). Section 48 of the PGPA Act continues to require the annual preparation of the CFS. The implementation of the PGPA Act is not expected to have a material change in the content or reporting of the CFS.
The CFS is a general purpose financial report that has been prepared for the whole of government and the GGS in accordance with Australian Accounting Standards (AASs), including AASB 1049 Whole of Government and General Government Sector Financial Reporting (AASB 1049).
AASB 1049 stipulates that the GGS financial statements are not to be made available prior to the whole of government financial statements being made available. The GGS financial statements have therefore been included in the CFS and can be found in the Sector statements and the Notes to the financial statements.
Under the Charter of Budget Honesty Act 1998, the Australian Government is also required to publicly release and table a Final Budget Outcome (FBO) report. The 2013-14 Final Budget Outcome (FBO) for the Australian Government showed GGS budget aggregates for 2013-14 together with an analysis of the outcome against the revised budget prepared as part of the 2014-15 Budget update. The FBO was released by the Treasurer on 25 September 2014. The FBO is unaudited but is derived from materially audit-cleared financial statements. Under the Charter of Budget Honesty Act 1998, the FBO must be based on external reporting standards; including AASs and the concepts and classifications set out in Government Finance Statistics (GFS), with any departures from those standards to be documented. These departures are detailed in Part 2, Note 2 of the 2013-14 FBO.
1.3 Basis of accounting
The financial report for the whole of government and the GGS has been prepared in accordance with the reporting requirements of AASB 1049, which requires compliance with applicable AASs. The purpose of this financial report is to provide users with
Notes to the financial statements
63
information about the stewardship by the Australian Government and accountability for the resources entrusted to it; information about the financial position, performance and cash flows of the Australian Government; and information that facilitates assessment of the macro-economic impact of the Australian Government.
AASB 1049 requires preparation of a whole of government financial report and a GGS financial report. The standard requires compliance with other applicable accounting standards, except as specified, and mandates disclosure of certain key fiscal aggregates.
There are three main general purpose statements that must be prepared in accordance with AASB 1049. These are:
• an operating statement, including other economic flows, which shows net operating balance and net lending/borrowing (fiscal balance);
• a balance sheet, which shows net worth; and
• a cash flow statement, which shows the calculation of the cash surplus/(deficit) and includes GFS cash surplus/(deficit).
In addition to these general purpose statements, notes to the financial statements are required. These notes include a summary of accounting policies, disaggregated information and other disclosures required by the accounting standards.
The principles and rules in the Australian Bureau of Statistics (ABS) Australian System of Government Finance Statistics: Concepts, Sources and Methods 2005 — ABS Catalogue No. 5514.0 (ABS GFS manual) have been applied in the production of this financial report, except in instances in which the application would conflict with AASs.
The 2013-14 financial report for the whole of government and the GGS has been prepared on the basis of the ABS GFS manual effective as at 1 July 2012 with one exception as provided for in AASB 1049:
• On 13 July 2010, the treatment of defence weapons platforms (DWPs) was amended in the ABS GFS manual. The ABS treatment of DWPs changed to treat DWPs as capital formation (assets). Previously DWPs were fully expensed in the period they were acquired. Under the ABS GFS manual, all assets are recognised at market value. In the financial report for the whole of government and the GGS, DWPs are classified as specialist military equipment and are recorded at cost. In accordance with AASB 1049, paragraph 13C, the Australian Government has elected not to apply this amendment in the Consolidated Financial Statements for reporting periods ending before 30 June 2015. The impact of the change in the ABS GFS manual is currently being investigated.

Notes to the financial statements
64
Since the ABS GFS manual version as at 1 July 2012, there has been one amendment to the ABS GFS Manual:
• 20 November 2012 — This update to the amendments relates to the introduction and treatment of the various Commonwealth schemes that have been established by the Australian Government to reduce greenhouse gas (GHG) emissions, and it aligns the ABS GFS Manual with the ABS approach to emissions reduction schemes. As detailed below, the treatment of emission reduction schemes in the Consolidated Financial Statements, in particular the carbon pricing mechanism, is currently prepared in accordance with a preliminary interpretation based on the AASB issued staff paper.
Where the key fiscal aggregates presented on the face of the financial statements are materially different to that measured in accordance with the applied ABS GFS manual, a reconciliation between the two measures has been provided (refer Note 42).
The financial report has been prepared on an accrual basis and is presented in Australian dollars. No accounting assumptions or estimates have been identified that have a significant risk of causing a material adjustment to carrying amounts of assets and liabilities within the next accounting period.
AASB 1049 also requires functional information to be disclosed by expenses and assets according to the Government Purpose Classification (GPC). The GPC is based on the ABS classifications used as part of the GFS reporting framework. The disclosures are as follows:
• expenses, excluding losses and revaluations, that are reliably attributable to each function (refer Note 11); and
• the carrying amount of assets recognised in the balance sheet that are reliably attributable to each function (refer Note 25).
With the exception of advances paid to the International Development Association (IDA) and the Asian Development Fund (ADF) and free carbon units issued under the carbon pricing mechanism, the key fiscal aggregates reported in the CFS GGS financial statements materially align to the GGS financial statements included in the FBO. As detailed in Part 2, Note 2 of the 2013-14 FBO, AASB 1049 requires the advances paid to the IDA and ADF to be recognised at fair value. Under the ABS GFS manual, these advances are recorded at nominal value. The ABS GFS treatment is adopted in the FBO while the AAS treatment is adopted in the CFS.
The price of carbon units was set under the Clean Energy Act 2011. A preliminary interpretation based on the AASB issued staff paper recognises transactions under the carbon pricing mechanism in the financial statements where they are expected to result in a receipt or payment of cash by the government at the amount of the expected cash settlement. The issuance and surrender of free carbon units and Australian Carbon
Notes to the financial statements
65
Credit Units (ACCUs) used in the settlement of emissions liabilities do not qualify for recognition by the government as assets, liabilities, revenues or expenses. The Consolidated Financial Statements apply the AAS treatment. The carbon pricing mechanism legislation was repealed by Parliament on 17 July 2014, effective at 1 July 2014.
The 2013-14 FBO adopts the ABS GFS treatment as used in the 2013-14 Budget. Under ABS GFS, the issuance of free carbon units that are expected to be used to settle an emitter’s obligation are treated as an expense on issue and revenue when emissions occur. This had the effect of increasing both the revenue and expense with no impact on the net operating balance or fiscal balance.
1.4 New Australian Accounting Standards
Adoption of New Australian Accounting Standard Requirements
During 2013-14, the Australian Government adopted all applicable Australian Accounting Standards that became effective during 2013-14.
• AASB 13 Fair Value Measurement streamlines the guidance for measuring assets and liabilities at fair value considering a market participant perspective. This requires assessment of an asset’s fair value based on highest and best use. Moreover, the Fair Value Hierarchy is extended to all assets and liabilities under the amendment to this standard. See Note 17 for Fair Value disclosures for the Australian Government.
• AASB 119 Employee Benefits has been updated with accounting and disclosure requirements for employee benefits. Under the revised standard, actuarial gains and losses on defined benefit superannuation obligations are now fully recognised on the balance sheet, and included in other comprehensive income, in the reporting period in which they occur. Current service and net interest costs are now recognised in net profit. Net interest is now calculated by applying the discount rate to the net defined benefit liability; previously the return on the assets of a superannuation scheme was incorporated in this calculation. There is also clarification on the matter of short term employee benefits, which now requires annual leave liabilities not settled within a 12 month period to be classified as a long term benefit and measured on a discounted basis.
These amendments result in an increase in superannuation liability of $292 million ($614 million at 1 July 2012) and a cumulative reduction in reserves of $142 million being retrospectively recognised at 30 June 2013, with corresponding adjustments to the comparative figures for the reported total comprehensive income. The impact of these amendments on 2012-13 is included as part of the adjustments shown in Note 1.5.
No accounting standard has been adopted earlier than the application date as stated in the standard.
Notes to the financial statements
66
Future Australian Accounting Standards Requirements
The AASB has issued a number of new standards, amendments to standards and interpretations that are effective for future reporting periods:
• The IASB has been progressively replacing the current standard for the measurement and recognition of financial instruments (IAS 39 Financial Instruments: Recognition and Measurement (in Australia AASB 139)) with a new standard IFRS 9 Financial Instruments (in Australia AASB 9). AASB 9 currently contains the requirements for the recognition and measurement of financial assets and liabilities and their derecognition and general hedge accounting. The requirements for amortised cost and impairment, and macro hedge accounting are expected to be incorporated into the standard at a later stage. The amendments will likely have an impact on the recognition and measurement of financial instruments. The final outcome will be considered once the project is complete. The new standard is effective from 1 July 2017;
• AASB 10 Consolidated Financial Statements, AASB 11 Joint Arrangements, AASB 12 Disclosure of Interests in Other Entities and AASB 128 Investments in Associates and Joint Ventures (operative for 2014-15);
• Under AASB 10, the criteria to assess ‘control’ has changed. Under the new Standard, three criteria are required to assess whether control exists, being: the entity’s power over an investee; the entity’s exposure, or rights to variable returns from an investee; and the ability to affect those returns through power over an investee. AASB 11 replaces those requirements in AASB 131 Interests in Joint Ventures and requires entities that have an interest in arrangements that are jointly controlled to assess whether the arrangement is a joint operation or joint venture. Joint operations will be accounted for in accordance with AASB 11 while joint ventures will be accounted for in accordance with AASB 128 Investments in Associates and Joint Ventures. AASB 12 requires disclosure of information that enables users of financial statements to evaluate the nature of, and risks associated with, interests in other entities and the effects of those interests on the financial statements. The revised AASB 128 sets out the requirements for the application of the equity method when accounting for investments in associates and joint ventures. Other than disclosure, the above changes are not expected to materially impact the Consolidated Financial Statements;
• AASB 1031 Materiality is planned to be withdrawn by the Australian Accounting Standards Board in 2014-15. As a result of the change, guidance on quantitative assessment of materiality will likely be removed. Judgement calls will be required on a case-by-case basis as the quantitative rule will no longer be available;
• AASB 1049 Whole of Government and General Sector Financial Reporting will require Defence Weapons Platforms (DWPs) to be measured at fair value from 2014-15, if fair value can be reliably measured. The cost basis of measurement is currently

Notes to the financial statements
67
used for the valuation of DWPs. The question of reliable measurement of DWPs is yet to be settled, consequently the impact of this accounting standard change on the Consolidated Financial Statements cannot be quantified;
• AASB 1055 Budgetary Reporting requires reporting of budgetary information and explanation of significant variance between actual and budgeted amounts by not-for-profit entities within the General Government Sector. This Standard relocates the budgetary requirements currently in AASB 1049 Whole of Government and General Government Sector Financial Reporting into AASB 1055 to make it the complete reference on this topic. The new Standard applies to reporting periods beginning on or after 1 July 2014. AASB 1055 does not apply to the Consolidated Financial Statements but will see similar disclosures reported in entity financial statements to that already reported in Note 44.
Other than the above, current pronouncements related to future reporting periods are not expected to materially impact on future reporting periods or will not apply to the operations of the Australian Government.
1.5 Prior year adjustments and changes in accounting policy
For the 2012-13 financial year, income tax in relation to individuals and other withholding tax was overstated by amounts relating to compulsory repayments for the Higher Education Loan Programme (HELP). Adjustments were also made to multiple heads of revenue for 2012-13 due to an overstatement of revenue and expense in relation to penalty and interest imposition and remissions. This second adjustment has a nil effect on the Net Operating Balance in the Consolidated Statement of Comprehensive Income.
During 2013-14, revenues and receivables relating to child support penalties have been derecognised as they do not meet the recognition criteria for revenue and receivables as required by the relevant accounting standards. Accordingly, the 2012-13 comparatives relating to child support penalties have also been adjusted.
In the 2013-14 financial year, the accounting policy for recognising personal benefits recoveries revenue was changed to ensure consistent treatment at the whole of government level. These recoveries relate to where a recipient has been overpaid a particular benefit payment and the overpayment is recovered from a subsequent personal benefit payment.
In the 2013-14 financial year, the accounting policy for recognition of administered paid parental leave (PPL) liabilities was changed to ensure consistent application of AASB 137 Provisions, Contingent Liabilities and Contingent Assets and is in harmony with the accounting treatment under the Government Finance Statistics. The change was for recognition of PPL liabilities on a ‘due and payable’ basis. Previously, the PPL liability was recognised where a constructive obligation had been established based on the

Notes to the financial statements
68
birth of a child with an estimate of this liability being made. The 2012-13 liability for PPL has been adjusted for the new recognition method.
As a result of these prior period errors and accounting policy changes and other adjustments, including changes due to revisions to AASB 119, the combined impact on the Consolidated Financial Statements for 2012-13 was as follows:
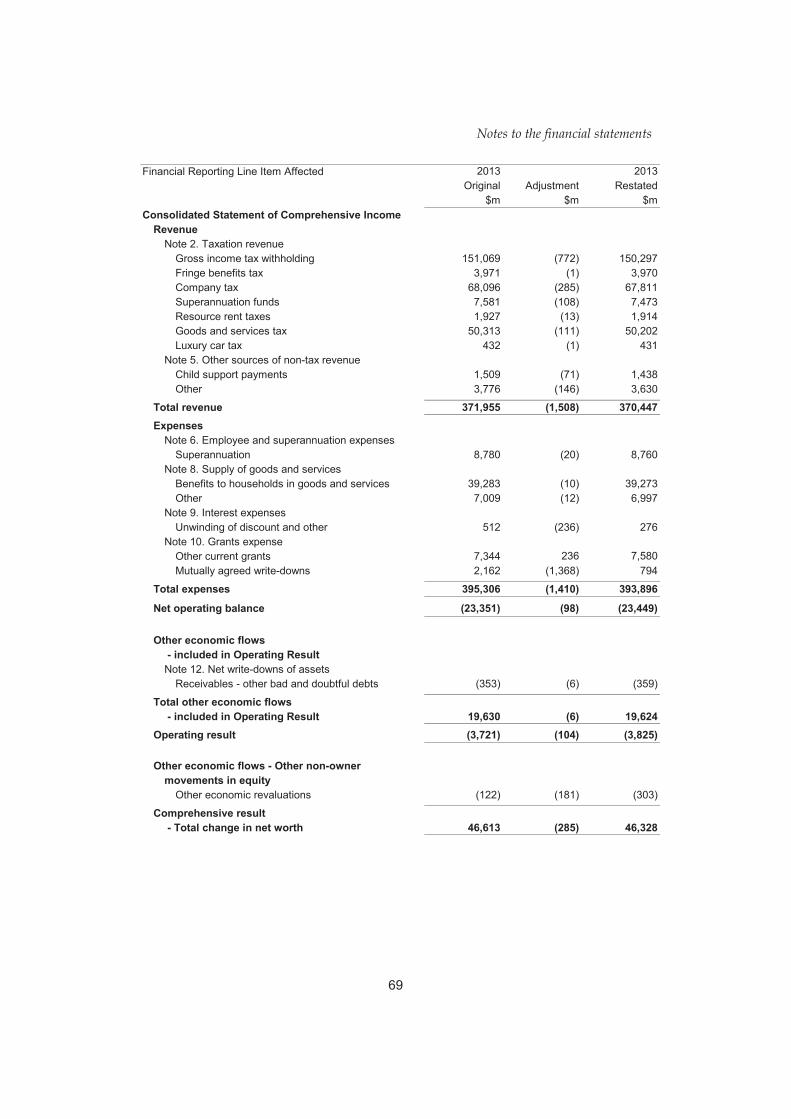
Notes to the financial statements
69
Financial Reporting Line Item Affected 2013 2013Original Adjustment Restated
$m $m $mConsolidated Statement of Comprehensive Income
RevenueNote 2. Taxation revenue
Gross income tax withholding 151,069 (772) 150,297Fringe benefits tax 3,971 (1) 3,970Company tax 68,096 (285) 67,811Superannuation funds 7,581 (108) 7,473Resource rent taxes 1,927 (13) 1,914Goods and services tax 50,313 (111) 50,202Luxury car tax 432 (1) 431
Note 5. Other sources of non-tax revenueChild support payments 1,509 (71) 1,438Other 3,776 (146) 3,630
Total revenue 371,955 (1,508) 370,447Expenses
Note 6. Employee and superannuation expensesSuperannuation 8,780 (20) 8,760
Note 8. Supply of goods and servicesBenefits to households in goods and services 39,283 (10) 39,273Other 7,009 (12) 6,997
Note 9. Interest expensesUnwinding of discount and other 512 (236) 276
Note 10. Grants expenseOther current grants 7,344 236 7,580Mutually agreed write-downs 2,162 (1,368) 794
Total expenses 395,306 (1,410) 393,896
Net operating balance (23,351) (98) (23,449)
Other economic flows - included in Operating ResultNote 12. Net write-downs of assets
Receivables - other bad and doubtful debts (353) (6) (359)
Total other economic flows - included in Operating Result 19,630 (6) 19,624
Operating result (3,721) (104) (3,825)
Other economic flows - Other non-ownerincluded in Operating Resultmovements in equity
Other economic revaluations (122) (181) (303)
Comprehensive result - Total change in net worth 46,613 (285) 46,328

Notes to the financial statements
70
Financial Reporting Line Item Affected 2013 2013Original Adjustment Restated
$m $m $mConsolidated Balance Sheet
AssetsNote 34B. Cash and deposits
Financial assets - cash 4,024 38 4,062Note 18. Other receivables and accrued revenue
Other receivables 8,421 (759) 7,662Provision for doubtful debts - other receivables (2,538) 750 (1,788)
Total assets 430,848 30 430,878
LiabilitiesNote 31. Employee benefits
Superannuation liability 193,402 292 193,694Note 32. Provisions and payables
Trade creditors 4,949 37 4,986Other payables 989 5 994Personal benefits payable 5,815 (116) 5,699Subsidies payable 3,557 23 3,580Other grants payable 664 (23) 641Provision for outstanding benefits and claims 12,777 (247) 12,530
Total liabilities 641,389 (28) 641,361Net worth (210,541) 58 (210,483)
Note 36. ContingenciesQuantifiable contingent liabilities
Guarantees 443 14,786 15,229Uncalled shares/capital subscriptions 11,380 1,871 13,251
Total quantifiable contingent liabilities 19,765 16,657 36,422Net quantifiable contingencies 19,433 16,657 36,090
The above prior year errors and accounting policy changes had the impact of decreasing liabilities as at 1 July 2012 (the start of the comparative period) by $352 million, assets by $7 million and increasing net worth by $345 million.
1.6 The reporting entity and basis of consolidation
For the purposes of this financial report, the Australian Government means the Executive (consisting principally of Ministers and their departments), the legislature (that is, the Parliament) and the judiciary (that is, the courts). Where the ‘Australian Government’ is referred to throughout this report it is intended to also mean the ‘Commonwealth of Australia’.
For the purposes of this financial report, the Australian Government reporting entity (referred to as the reporting entity) includes Australian Government Departments of State, Parliamentary Departments, prescribed agencies, Commonwealth authorities and Commonwealth companies in which the Australian Government holds a controlling interest. In the process of reporting the Australian Government as a single

Notes to the financial statements
71
economic entity, all material transactions and balances between government-controlled entities are eliminated. Where circumstances arise and their effect is considered material, dissimilar accounting policies are amended to ensure consistent policies are adopted in this consolidated financial report.
Where control of an entity is obtained during a financial year, results are included in the consolidated operating statement and consolidated cash flow statement from the date on which control commenced. Where control of an entity ceases during a financial year, results are included for that part of the year for which control existed.
For the purposes of this financial report, the control of another entity by the Australian Government complies with the requirements under AASB 127 Consolidated and Separate Financial Statements.
The existence of control in the context of this consolidated financial report does not in any way indicate that there is necessarily control over the manner in which statutory/professional functions are performed by an entity.
A detailed list of entities controlled by the Australian Government is provided in Note 45.
The Australian National University has not been consolidated in this financial report, but the value of total net assets has been recognised as an investment. Similarly, the total value of net assets of other entities, in which the Australian Government holds a share of the assets, but which it does not significantly influence, have also been recognised as an investment. Details of those entities are included in Note 45.
1.7 Sectors
The CFS includes the balances of GGS assets and liabilities held at the end of the financial year, and the GGS income and expenses during the year. The GGS operating statement, balance sheet and statement of cash flows are included in the Sector statements with supporting notes.
The consolidated operating statement, balance sheet, statement of cash flows, schedule of commitments (Note 35) and schedule of contingencies (Note 36) have also been disaggregated to include the Australian Government public non-financial corporations (PNFC) sector and the public financial corporations (PFC) sector.
In accordance with AASB 1049, the sector classification of Australian Government entities follows that defined by ABS for the purposes of GFS; this, in turn, is based on international standards issued by the International Monetary Fund (IMF).

Notes to the financial statements
72
Figure 1: Institutional structure of the public sector
General government sector: The general government sector (GGS) provides public services that are mainly non-market in nature, and for the collective consumption of the community, or involve the transfer or redistribution of income. These services are largely financed through taxes and other compulsory levies, although user charging and external funding have increased in recent years.
Public non-financial corporations sector: The primary function of the public non-financial corporations (PNFC) sector is to provide goods and services that are mainly commercial, non-regulatory, and non-financial in nature, financed predominantly through sales to the consumers of these goods and services.
Public financial corporations sector: The public financial corporations (PFC) sector comprises entities that have one or more of the following characteristics as their principal activity. They:
• perform central banking functions;
• accept demand, time or savings deposits; or
• have the authority to incur liabilities and acquire financial assets in the market on their own account.
1.8 Foreign currency translation
Transactions are translated to Australian dollars at the rate of exchange applicable at the date of the transaction. Balances and investments are translated at the exchange rates applicable at balance date. Foreign exchange holdings contracted for sale beyond 30 June (including those under swap contracts) have been valued at market exchange rates.
Total public sector
Total non-financial public sector
Public non-financial corporations sector
(Provide goods and services to consumers on a commercial basis, are funded largely by the sale of these goods and services, and are generally legally distinguishable from the governments that own them)
Public financial corporations sector
(Includes Reserve Bank of Australia and other borrowing authorities)
General government sector
(Government departments and agencies that provide non-market public services and are funded mainly through taxes)
Notes to the financial statements
73
1.9 Significant accounting judgements and estimates
In preparing this financial report, Australian Government entities are required to make judgements and estimates that impact:
• income and expenses for the year;
• the reported amounts of assets and liabilities; and
• the disclosure of off-balance sheet arrangements, including contingent assets and contingent liabilities.
Judgements and estimates are subject to periodic review, including through the receipt of actuarial advice. Judgements and estimates are based on historical experience, various other assumptions believed to be reasonable under the circumstances and, where appropriate, practices adopted by other entities.
In the process of applying the accounting policies described in this note, judgements and estimates made by Australian Government entities that have the most significant impact on the amounts recorded in the financial report include:
Revenues:
• A number of taxation revenue items are reported according to the economic transaction method (ETM), which relies on the estimation of the probable flows of taxes from transactions which have occurred in the economy, but have not yet been reported to the Australian Government.
Financial instruments:
• Australian Government entities evaluate the collectability of accounts receivable on an ongoing basis based on historical bad debts, customer/recipient credit-worthiness, current economic trends and changes in payment activity. An allowance is provided for known and estimated bad debts.
• In some instances, the fair value of derivatives, financial assets and liabilities must be estimated for recognition, measurement or disclosure purposes. Valuation techniques include, where applicable, reference to prices quoted in active markets, discounted cash flow analysis, fair value of recent arm’s length transactions involving the same instruments or other instruments that are substantially the same, and option pricing models (refer Note 17).
Statutory receivables:
• Provisions for doubtful debts (provision for impairment) and credit amendments are raised on outstanding tax debts and other statutory debts and rely on estimation methodologies and techniques to calculate the amount of the provision.

Notes to the financial statements
74
Land, buildings, plant, equipment and infrastructure:
• Where available, the fair value of property, plant and equipment is determined by reference to market-based evidence, for example, the market value of similar properties. If there is no market-based evidence of fair value because of the specialised nature of the item of property, plant or equipment and the item is rarely sold, fair value is estimated using an income (net present value/discounted cash flows) or a depreciated replacement cost approach (refer Note 17).
• Expected useful lives are estimated in the calculation of accumulated depreciation and amortisation and the associated expenses.
• Estimates are made in determining value-in-use for impairment purposes.
• When a legal or constructive obligation exists, an estimate of the cost of restoration or removal is provided for in the measurement of property, plant and equipment. Estimates are based upon a review of lease contracts, legal requirements, historical information and expected future costs. Any changes to these estimates are adjusted on a progressive basis as required.
Inventories:
• Australian Government entities periodically review inventory quantities on hand and evaluate significant items to determine whether they are excess or obsolete. The estimated value of excess and obsolete inventory is recorded as a reduction to inventory and an expense for the period in which it is identified.
Employee benefits:
• Various actuarial assumptions are utilised in the determination of the provisions for the Australian Government sponsored defined benefit superannuation schemes, including weighted average projected increases in salaries, discount rates, expected return on plan assets, future defined benefit fund increases and benefit taking rates. These assumptions are disclosed in Note 38.
• Various actuarial assumptions are also utilised in the determination of Australian Government long service leave provisions, including weighted average projected increases in salaries, weighted average discount rates and benefit taking probabilities.
Other provisions:
• In calculating the estimated cost of future payments for each provision, actuarial advice is generally obtained. The actuarial assessments use a range of estimation techniques, including based on historical experience. Where a range of potential outcomes is possible, the provision is generally valued using a central estimate

Notes to the financial statements
75
(excluding workers compensation) plus an appropriate risk margin. The expected future payments are discounted to present value using a risk-free rate.
• The calculation of all provisions is subject to the volatility of economic assumptions used, in particular, the discount rate and the effects of inflation as well as the impact of variations in payment patterns. Given the uniqueness of a number of the Australian Government provisions and the use of actuarial assumptions, there can be an element of uncertainty in the estimate.
• Significant provisions are listed in Note 1.17. Certain provisions include estimates of claims incurred but not yet reported.
Contingent liabilities and contingent assets:
• In determining whether to include or exclude a matter as a contingency the likelihood of meeting the eligibility requirements and the amount of future payments is determined to be uncertain.
• Where the outflow/inflow of resources is probable the entity will quantify the obligation.
1.10 Presentation of financial statements
Consolidated operating statement
The operating statement presents details of transactions in revenues, expenses, the net acquisition of non-financial assets and other economic flows for an accounting period.
Income and expenses in the operating statement are classified according to whether or not they arise from ‘transactions’ or ‘other economic flows’. This classification is consistent with that required under AASB 1049.
‘Transactions’ and ‘other economic flows’ are defined by the ABS GFS Manual.
‘Transactions’ are those economic flows that are considered to arise as a result of decisions, usually interactions between two entities by mutual agreement, and also flows within an entity, such as depreciation where the owner is simultaneously acting as the owner of the depreciating asset and as the consumer of the service provided by the asset. Taxation is regarded as mutually agreed interactions between the Australian Government and taxpayers. Transactions can be in kind (for example, assets provided/given free of charge or for nominal consideration) or where the final consideration is cash.
‘Other economic flows’ are changes arising from market re-measurements and other volume changes. They include gains and losses from disposals, revaluations and impairments of non-current physical and intangible assets; actuarial gains and losses arising from defined benefit superannuation plans; fair value changes of financial

Notes to the financial statements
76
instruments and agricultural assets; and depletion of natural assets (non-produced) from their use or removal.
The operating result is equivalent to profit or loss derived in accordance with AASs.
Key fiscal aggregates contained in the statement (and defined in Note 46) include:
• net result from transactions — net operating balance;
• total change in net worth; and
• fiscal balance — net lending/(borrowing).
Consolidated balance sheet
The balance sheet shows assets, liabilities and net worth. In the balance sheet:
• assets are aggregated into financial and non-financial;
• liabilities are aggregated into interest bearing liabilities and provisions and payables;
• assets and liabilities are classified according to GFS terminology, but retain measurement and disclosure rules under accounting standards; and
• assets and liabilities are also classified (in aggregate) as current versus non-current.
Consolidated cash flow statement
The cash flow statement identifies how cash is generated and applied in a single accounting period. The cash flow statement reflects a cash basis of recording (rather than an accrual basis). This, in effect, means that transactions are captured when cash is received or when cash payments are made.
The key fiscal aggregate is the cash surplus/(deficit). The cash surplus/(deficit) measure is equal to the net cash flows from operating activities, less net cash flows from investments in non-financial assets.
The GFS cash surplus/(deficit) measure includes assets acquired under finance leases so that all asset purchases are treated consistently. As these are not cash flows they are included as a non-cash adjustment.

Notes to the financial statements
77
1.11 Revenue from transactions
Appropriation revenue
Section 83 of the Constitution provides that no money shall be drawn down from the Treasury of the Australian Government except under appropriations made by law.
Australian Government entities receive appropriation funding through the following:
• annual appropriations and all other appropriations under an Appropriation Act;
• appropriations under section 31 of the Financial Management and Accountability Act 1997 (FMA Act);
• appropriations under sections 20, 21, 28, 30A and 39 of the FMA Act;
• transfer of appropriations under section 32 of the FMA Act;
• other amounts as determined under an Appropriation Act by the Finance Minister (or delegate) or an Agency Minister or Presiding Officer;
• other special appropriations — limited in amount, formula and/or time and/or determined by a Minister; and
• other unlimited special appropriations.
As appropriation revenue is internal to government, it has been eliminated upon consolidation in this financial report.
Taxation revenue
Taxation revenues are recognised when the Australian Government gains control of and can reliably measure or estimate the future economic benefits that flow from taxes and other statutory charges.
Where reliable, taxation revenue is recognised in the reporting period in which the taxpayer earns the income that is subsequently subject to taxation — this is known as the economic transactions method (ETM). Currently, petroleum resource rent tax (included in resource rent taxes), excise duty, customs duty, sales tax (including goods and services tax), fringe benefits tax, the carbon pricing mechanism and other taxes are recognised on an ETM basis.
Where there is an inability to reliably measure taxation revenue on an ETM basis, taxation revenue is recognised at the earlier of when an assessment of a tax liability is made or when cash payment is received by the relevant taxation authority — this is known as the taxation liability method (TLM).

Notes to the financial statements
78
The TLM is permitted under AAS and is applied in the CFS when there is an inability to measure taxation revenues reliably at the time the underlying transaction or event occurs. This recognition policy means that taxation revenue is generally measured at a later time than would be the case if it were measured under the ETM. Currently, individuals, company and superannuation tax revenue and the minerals resource rent tax (included in resource rent taxes) are recognised on a TLM basis.
The revenue recognition policy adopted by the Australian Government for each major type of taxation revenue is as follows:
Taxation revenue Type of taxation revenue
Revenue recognition basis
Basis of revenue recognition
Income tax — individuals
TLM
The total revenue related to income tax from individuals reported in the operating statement comprises income tax withholding (ITW), other individuals, Medicare levy and income tax refunds. ITW represents amounts withheld from payments of remuneration for the year. Other individuals includes income tax instalments and final tax returns received during the year. Other individuals and income tax refunds do not incorporate an estimate of the tax to be paid or refunded on the final assessment for the year.
Income tax — companies
TLM Company tax comprises amounts of tax payable by companies that relate to instalments and final payments received/raised for current and former periods. It does not include estimates of revenue related to the reporting year that will be recognised in annual income tax returns lodged after the reporting date.
Income tax — superannuation funds
TLM Superannuation contributions tax is levied on superannuation funds based on contributions made by employers. Superannuation fund tax comprises amounts of tax payable by superannuation funds that relate to instalments and payments for current and former reporting years. It does not include estimates of revenue related to the reporting year that will be recognised in annual income tax returns lodged after the reporting date.
Income tax—superannuation surcharge
TLM This tax was abolished from 1 July 2005. However, assessments and amendments continue to be issued for 2004–05 and previous financial years. Different arrangements exist for unfunded defined benefit funds (UDBs). Superannuation surcharge revenue relating to UDBs is recognised at the time it can be assessed, even though it may not be collected for some years, until which time an annual interest charge accrues.
Minerals resource rent tax (Resources rent tax)
TLM Minerals resource rent tax is a project based tax on the extraction of iron ore and coal. The taxation recognised is based on instalment and final payments received in this reporting period. It does not include estimates of revenue related to the current financial year that will be recognised in annual returns and instalments due after the end of the year.
Petroleum resource rent tax (Resources rent tax)
ETM Petroleum resource rent tax is recognised based on the actual and estimated taxable profits in respect of offshore petroleum projects other than some of the North-West Shelf production and associated exploration areas, which are subject to excise (included in excise on petroleum and other fuel products) and royalties.
Goods and services tax (GST)
ETM The GST is a broad-based tax of 10 per cent on most goods and services supplied/sold during the reporting period. The GST revenue is recognised based on the actual liabilities raised during the year and an estimate of those outstanding that relate to transactions occurring in the reporting period.

Notes to the financial statements
79
Taxation revenue (continued) Excise duty ETM Excise duty is recognised based on the actual and estimated duty
payable. Excise duty becomes payable when certain goods are distributed for home consumption during the reporting period.
Customs duty ETM Customs duty is recognised when imported goods are distributed for home consumption.
Sales tax and other indirect tax
ETM Sales tax and other indirect tax includes the luxury car tax and wine equalisation tax. Luxury car tax is recognised at the time the sale of a luxury vehicle occurs within the reporting period. Wine equalisation tax is recognised when an assessable dealing occurs within the reporting period that gives rise to the liability to pay tax.
Carbon pricing mechanism
ETM Carbon price revenue is recognised when liable entities’ emissions occur, where it is probable that future economic benefits will occur and can be reliably measured. Unit shortfall charges and other penalties are recognised at the time they are imposed.
Fringe benefits tax (FBT)
ETM FBT is recognised on fringe benefits provided to employees during the reporting period and includes an estimate of outstanding instalments and balancing payments for the annual FBT return.
If all taxation revenue had been measured according to the ETM, including those revenue types currently considered unreliable, the estimated impact on the 2013-14 financial results would be as follows:
Operating statement for the period to 30 June 2014 — Adoption of ETM 2014
Income 2014 2014statement Full ETM Difference
$m $m $mIncome
Taxation revenueIncome tax
Individuals and other withholding taxes 167,915 167,629 (286)Fringe benefits tax 4,285 4,285 -Superannuation 6,147 5,984 (163)Companies 68,625 61,341 (7,284)Resources rent tax (a) 1,785 1,785 -
Total income tax 248,757 241,024 (7,733)Total taxation revenue 349,069 341,336 (7,733)
(a) This figure does not include an ETM estimate for the minerals resource rent tax which is not yet available.
Balance sheet as at 30 June 2014 — Adoption of ETM 2014 2014 2014
Balance Full ETM Difference$m $m $m
Assets 489,796 560,055 70,259Liabilities 754,110 814,104 59,994
Net worth (264,314) (254,049) 10,265

Notes to the financial statements
80
The estimated impact of full ETM on the 2012-13 comparative financial results would be as follows:
Operating statement for the period to 30 June 2013 — Adoption of ETM 2013
Income 2013 2013statement Full ETM Difference
$m $m $mIncome
Taxation revenueIncome tax
Individuals and other withholding taxes 159,779 158,885 (894)Fringe benefits tax 3,970 3,970 -Superannuation 7,473 6,433 (1,040)Companies 67,811 67,889 78Resources rent tax 1,914 1,914 -
Total income tax 240,947 239,091 (1,856)Total taxation revenue 334,430 332,574 (1,856)
Balance sheet as at 30 June 2013 — Adoption of ETM
2013 2013 2013Balance Full ETM Difference
$m $m $m
Assets 430,878 503,015 72,137Liabilities 641,361 695,494 54,133
Net worth (210,483) (192,479) 18,004 In preparing the ETM financial results, company and superannuation revenue comprise actual amounts and estimates of income tax payable by companies and superannuation funds that relate to instalments and final payments relevant to companies or superannuation funds with balance dates falling in the reporting period. For companies and superannuation funds that do not have a reporting period ending 30 June, reporting end date has been interpreted as though it was 30 June.
The reliability of the ETM is assessed annually by relevant government agencies to determine if its adoption is appropriate across all items of taxation revenue reported in the Australian Government’s budget-related forecast and outcomes documentation.
Penalties and general interest charges (GIC) arising under taxation legislation are recognised as revenue at the time the penalty and GIC are imposed under the law on the taxpayer and included within relevant applicable revenue categories. Where events have occurred that prevented the application of GIC or penalties to taxpayer accounts, and the amounts can be reliably estimated, an estimate is included in the financial statements. Subsequent remissions and write-offs of such penalties and GIC are treated as an expense or other economic flow of the period.
Provisions are raised for any doubtful taxation debts and any probable credit amendments, and are based on a review of outstanding accounts as at year end. This

Notes to the financial statements
81
includes examination of individual large debts and also disputed amounts with reference to historic collection patterns.
The Australian Government is responsible for the administration of the Commonwealth Places (Mirror Taxes) Act 1988, which facilitates the payment of compensation to the States in respect of State taxes which may be constitutionally invalid, levied on Commonwealth places. Under the Act, the Australian Government is liable to pay to a State an amount equal to amounts notionally receivable by the Australian Government (including amounts received by a State on behalf of the Australian Government) under an applied law of the State. The amounts collected and retained by the States pursuant to the Act are disclosed in Note 2.
Taxation expense
Amounts paid through the tax system that are available to beneficiaries regardless of whether they are required to pay tax are recognised as an expense. By way of example, this would include payments made through the tax system in relation to the Private Health Insurance Benefit.
Tax expenditures refer to tax concessions that are designed to provide a benefit to a specified activity or class of taxpayer and the arrangement is integral to the tax system. Tax expenditures can be delivered in a variety of ways: by a tax exemption, tax rebate, tax deduction, reduced tax rate or by deferring a tax liability. Tax expenditures constitute revenue foregone rather than an outgoing of the Australian Government.
The cost of tax expenditure schemes cannot generally be reliably measured until the underlying tax revenue item, to which the tax expenditure is applied, becomes due and payable. Therefore, tax expenditures are not separately identified in this financial report. The Australian Government Treasury issues an annual Tax Expenditures Statement (unaudited), which provides a list of tax expenditures provided by the Australian Government to individuals and businesses.
Sales of goods and services
Revenue from the sale of goods is recognised when:
• the risks and rewards of ownership have been transferred to the buyer;
• the seller retains neither managerial involvement nor effective control over the goods;
• the revenue and transaction costs incurred can be reliably measured; and
• it is probable that the economic benefits associated with the transaction will flow to the entity.

Notes to the financial statements
82
Revenue from the rendering of services is recognised by reference to the stage of completion of contracts at the reporting date. The revenue is recognised when:
• the amount of revenue, stage of completion and transaction costs incurred can be reliably measured; and
• the probable economic benefits of the transaction will flow to the entity.
Interest and dividend income
Interest revenue is recognised using the effective interest method as set out in AASB 139 Financial Instruments: Recognition and Measurement. Dividend revenue is recognised when the right to receive a dividend has been established.
1.12 Expenses from transactions
Employee expenses and superannuation expenses
Employee expenses include wages and salaries, annual leave, sick leave, long service leave and other post employment benefits.
Superannuation includes all superannuation expenses and associated interest costs.
AASB 124 Related Party Disclosures requires the disclosure of remuneration of key management personnel. This standard is not currently applicable to general purpose financial reports of not-for-profit public sector entities. The Australian Government has elected to disclose ministerial remuneration of Cabinet Ministers. The disclosure is provided in Note 6.
Ministerial remuneration is limited to Cabinet Ministers because they are considered the key management personnel of the Australian Government. Cabinet Ministers are responsible for planning, directing and controlling the activities of the Australian Government, directly or indirectly. The disclosure includes all Cabinet Ministers who have served during the financial year. For Cabinet Ministers who serve only part of the financial year, their ministerial remuneration will be pro rata based on their length of service as a Cabinet Minister during the financial year.
Ministerial remuneration comprises total salary (including the additional ministerial component); superannuation contributions; and motor vehicle costs including related fringe benefits tax.
Additional ministerial benefits that are not considered to be for personal benefit are excluded from the disclosure. This covers electorate allowance, staff, transport, printing and communication as well as costs incurred by portfolio departments on behalf of Ministers. Costs associated with the Lodge and Kirribilli House are not included, as these are national assets and incur costs regardless of who uses them. The Life Gold Pass entitlement and accumulation of the entitlement available for former

Notes to the financial statements
83
Prime Ministers has also been excluded. The overall value of these entitlements is included in employee provisions.
The Remuneration Tribunal provides information on the remuneration of Senators and Members of Parliament, including Ministers. This information is available on the Remuneration Tribunal website.
Depreciation and amortisation
Depreciation of non-financial physical assets (excluding inventories) is generally provided on a straight-line basis at rates based on the expected useful lives of those assets. Depreciation rate details are provided in Note 1.15.
Amortisation is provided on intangibles, leasehold improvements and on assets that are subject to finance leases and is calculated on a straight-line basis, generally over the useful life of the intangibles or the term of the relevant leases. Amortisation rate details are provided in Note 1.15.
Leases
A distinction is made between finance leases and operating leases. Finance leases effectively transfer from the lessor to the lessee substantially all the risks and rewards incidental to ownership of leased assets. An operating lease is a lease that is not a finance lease. In operating leases, the lessor effectively retains substantially all such risks and rewards of ownership.
Operating lease payments are expensed on a straight line basis, which is representative of the pattern of benefits derived from the leased assets.
Where an asset is acquired by means of a finance lease, the asset is capitalised at either the fair value of the leased asset or, if lower, the present value of minimum lease payments at the inception of the lease contract and a liability recognised at the same time and for the same amount in other borrowings. Lease payments are allocated between the principal component and the interest expense. The discount rate used is the interest rate implicit in the lease. Leased assets are amortised over the period of the lease.
Interest expense
Interest on outstanding borrowings and other finance costs directly related to borrowings are expensed as incurred. Interest expense includes interest on debt, discounts on loans and concessional instruments, unwinding of discount of provisions and amortisation of finance charges for finance leases.

Notes to the financial statements
84
Current and capital transfers
Current and capital transfers include transactions such as grants, subsidies and other transfer payments made to local government, non-government schools, community groups, personal benefit payments made in cash to individuals and mutually agreed write-downs. Current transfers are amounts payable for current purposes for which no economic benefits are receivable in return. The distinction between current and capital transfers is based on the nature of the activities or assets for which the transfers are made. If the activities or assets relate to the acquisition of assets, other than inventories, that will be used in production for one year or more, the transfers are treated as capital transfers. Otherwise they are treated as current transfers (ABS GFS manual).
Where a transaction or event gives rise to a legal, social, political or economic consequences such that the Australian Government has little discretion to avoid the sacrifice of future economic benefits, a liability and expense is recognised.
In other circumstances, grants are recognised to the extent that the services required to be performed by the grantee have been performed or the grant eligibility criteria have been satisfied. Education grants to and through the States, Territories and other education providers such as universities are recognised on a due and payable basis, that is, when control of a grant passes to the grantee with grant conditions having been met. A commitment is recorded when the Australian Government has a binding agreement to make the grants but services have not been performed or criteria satisfied. Where grant monies are paid in advance of performance or eligibility, a prepayment is recognised.
Capital transfers also include mutually agreed write downs. These transactions occur when both parties agree to the write-off of an amount due to the Australian Government, rather than the Australian Government unilaterally deciding to write-down or write-off a debt. Mutually agreed write-downs include, for example, the remission of a penalty raised for overdue taxes receivable. Mutually agreed write downs are recorded as an expense in the calculation of fiscal balance.
Grants under Australian Government/State funding arrangements
The majority of grants to or through State and Territory Governments are paid under the Federal Financial Relations Act 2009. There are four main types of grant payments under the Act, as follows:
• National Specific Purpose Payments (National SPPs) — a financial contribution to support a State or Territory to deliver services in a particular sector;
• National Partnership Payments (NPPs) — a financial contribution to a State or Territory in respect of a National Partnership agreement to support the delivery of specific projects, to facilitate reforms or to reward those jurisdictions that deliver on national reforms or achieve service delivery improvements;

Notes to the financial statements
85
• GST revenue payments — a financial contribution to a State or Territory that is available for use by the States and Territories for any purpose; and
• General revenue assistance (GRA) other than GST revenue payments — a financial contribution to a State or Territory that is available for use by the States and Territories for any purpose.
Personal benefits
Personal benefits are recorded when the government provides monetary transfers directly to households. Payments are determined in accordance with provisions under social security law and other legislation.
Indirect benefits are recorded where the government provides goods and services directly to households as social transfers in kind, which includes medical and pharmaceutical benefits. Under AASB 1049, indirect benefits are classified as payments for the supply of goods and services within gross operating expenses.
1.13 Other economic flows
Other economic flows are classified according to those flows that are included in the operating result or other comprehensive income (net worth) as follows:
• Other economic flows — included in operating result:
– allowances for doubtful debts and bad debts unilaterally written off;
– assets recognised for the first time;
– realised or unrealised gains and losses from disposals;
– fair value changes of financial instruments designated as ‘held at fair value through profit or loss’;
– foreign exchange gains or losses;
– amortisation of non-produced assets; and
– net swap interest received.
• Other economic flows — other comprehensive income:
• revaluations of non-current physical assets, intangible assets and agricultural assets;
• actuarial gains and losses from superannuation defined benefit plans; and
• fair value changes of financial instruments designated as ‘available for sale’.

Notes to the financial statements
86
1.14 Financial assets
Recognition and measurement of financial assets
The classification of financial assets depends on the purpose for which they were acquired. The Australian Government classifies its financial assets into the following categories in accordance with AASB 139:
• financial assets at fair value through profit or loss — this category has two sub-categories: financial assets held for trading, and those designated at fair value through profit or loss. Derivatives are categorised as held for trading unless they are designated as hedges;
• loans and receivables — non-derivative financial assets with fixed or determinable payments that are not quoted in an active market;
• held-to-maturity investments — non-derivative financial assets with fixed or determinable payments and fixed maturities where there is a positive intention and ability to hold to maturity; and
• available-for-sale — comprising principally marketable equity securities, are non-derivatives that are either designated in this category or not classified in any of the other categories.
Available-for-sale financial assets and financial assets at fair value through profit or loss are subsequently carried at fair value. Loans and receivables and held-to-maturity investments are subsequently carried at amortised cost using the effective interest method less impairment. The effective interest method is a method of calculating the amortised cost of a financial asset and of allocating the interest expense over the relevant period. The effective interest rate is the rate that exactly discounts estimated future cash receipts through the expected life of the financial asset, or where appropriate, a shorter period to derive the amortised cost of the financial asset.
For ‘financial assets at fair value through profit or loss’, gains and losses arising from changes in the fair value are included as other economic flows in the operating statement in the period in which they arise.
Financial assets reported by the Australian Government include the individually significant financial assets listed below.
Cash and deposits
For the purpose of the statement of cash flows, cash includes: cash at bank and on hand, short term deposits at call and investments in short term money market instruments that are used in the cash management function on a day-to-day basis, net of outstanding bank overdrafts. Cash and cash equivalents includes notes and coins held and any deposits in bank accounts with an original maturity of three months or

Notes to the financial statements
87
less that are readily convertible to known amounts of cash and subject to insignificant risk of changes in value. Deposits at call but which are held for longer-term investment purposes are classified as investments. Cash is recognised at its nominal amount. Interest is credited to revenue as it accrues.
Advances
Loans are recognised initially at fair value plus transaction costs and subsequently measured at amortised cost using the effective interest rate method, less any impairment loss, unless these loans have been designated as ‘held at fair value through profit or loss’. The effective interest rate discounts estimated future cash receipts through the expected life of the loan to the net carrying amount of the loan but does not consider future credit losses. Interest is recognised on loans evenly in proportion to the amount outstanding over the period to repayment. Loans designated as ‘held at fair value through profit or loss’ include certain concessional loans.
The Higher Education Loan Programme (HELP) is designated as ‘held at fair value through profit or loss’. Under AASB 139 Financial Instruments: Recognition and Measurement, ‘fair value’ is the amount for which a financial asset could be exchanged between knowledgeable, willing parties in an arm’s length transaction. The estimate of the fair value of the HELP receivable is actuarially determined. In arriving at the fair value, the nominal or face value is adjusted for two main measures: an estimate of the face value of the debt which is not expected to be repaid; and the present value of projected future cash flows. The present value of future cash flows is calculated using a yield curve based on the reported yields of Commonwealth securities.
Multi-lateral aid agreements include agreements between the Australian Government and the International Development Association (IDA), Asian Development Fund (ADF), International Fund for Agriculture Development (IFAD), Global Environment Fund (GEF), Heavily Indebted Poor Countries (HIPC) and Montreal Protocol Multilateral Fund (MPMF). These agreements are accounted for as ‘available for sale’ investments based upon professional advice as to the estimated present value of the recoverable cash flows foregone.
Other receivables and accrued revenue
Trade debtors, bills of exchange, promissory notes and other receivables are initially recorded at the fair value of the amounts to be received and are subsequently measured at amortised cost using the effective interest rate method, less any impairment loss. Collectability of debts is reviewed at balance date. An allowance is made when collection of the debt is judged to be less, rather than more, likely.
Accrued taxation revenue is recognised for taxation revenue items recognised in accordance with the Economic Transactions Method (ETM). Accrued taxation revenue is recognised when a reliable estimate can be determined for revenue accrued in relation to relevant balance dates falling within the reporting period, where an assessment will be raised in the following reporting period.

Notes to the financial statements
88
Other accrued revenue is recognised when a service has been provided but has not been invoiced. Accrued revenue is recognised at the nominal amounts due.
Investments, loans and placements
Gold holdings (including gold on loan to other institutions) are valued at market value at balance date. The Australian Government measures gold at the bid price.
Investments in domestic and foreign government securities, except those contracted for sale under repurchase agreements, are classified by the Reserve Bank of Australia as ‘at fair value through profit or loss’ under AASB 139. Investments in Australian domestic government securities are eliminated from this financial report on consolidation. Securities purchased and contracted for sale under repurchase agreements are classified under AASB 139 as ‘loans and receivables’ and valued at amortised cost. The difference between the purchase and sale price is accrued over the term of the agreement and recognised as interest revenue.
Depending on the type of instrument, deposits are recognised at either nominal or market value. Interest is credited to revenue as it accrues. Deposits have varying terms and rates of interest.
The International Monetary Fund (IMF) quota represents Australia’s membership subscription to the IMF. The investment is denominated in special drawing rights (SDR) and is valued at the Australian dollar equivalent. SDR is an international type of monetary reserve made up of a basket of national currencies created by the IMF.
Investments in international financial institutions represent Australia’s membership in the Asian Development Bank, the International Bank for Reconstruction and Development, the International Finance Corporation, Multilateral Investment Guarantee and the European Bank for Reconstruction and Development. These investments are recognised at historical cost translated into Australian dollars using the relevant foreign currency rates at balance date.
Equity investments
At the whole of government level, equity investments primarily consist of the Future Fund’s holdings of listed equities and listed managed investment schemes. These investments are designated as financial assets through profit or loss on acquisition.
At the GGS level, equity investments also include the Australian Government’s ownership interest in public corporations in the PNFC and PFC sectors. The investments are eliminated at whole of government. Where the public corporation is a government business enterprise whose principal function is to engage in commercial activities in the private sector, the investment is measured at fair value, where fair value is reliably measurable. Investments in other public corporations are measured at the Australian Government’s proportional interest in the net assets of the public corporation as at the end of the reporting period.

Notes to the financial statements
89
Derecognition of financial assets and liabilities
Financial assets are derecognised when the contractual rights to the cash flows from the financial asset expire or the asset is transferred to another entity. In the case of a transfer to another entity, it is necessary that the risks and rewards of ownership are also transferred. Financial liabilities are derecognised when the obligation under the contract is discharged, cancelled or expired.
Impairment of financial assets
Financial assets are assessed for impairment at each balance date.
• Financial assets held at amortised cost: If there is objective evidence that an impairment loss has been incurred for loans and receivables or held to maturity investments held at amortised cost, then the amount of the loss is measured as the difference between the asset’s carrying amount and the present value of estimated future cash flows discounted at the asset’s original effective interest rate. The carrying amount is reduced by way of an allowance account. The loss is recognised in the operating statement.
• Financial assets held at cost: If there is objective evidence that an impairment loss has been incurred on an unquoted equity instrument held at cost (because fair value cannot be reliably measured) or a linked derivative asset, then the amount of the impairment loss is the difference between the carrying amount of the asset and the present value of the estimated future cash flows discounted at the current market rate for similar assets.
• Available for sale financial assets: If there is objective evidence that an impairment loss on an available for sale financial asset has been incurred, then the amount of the difference between its cost, less principal repayments and amortisation, and its fair value, less any impairment loss previously recognised in the operating statement, is transferred from equity (net worth) to the operating statement.
1.15 Non-financial assets
Inventory
Inventories held for sale are valued at the lower of cost and net realisable value. Inventories held for distribution are measured at cost, adjusted when applicable for any loss of service potential.
Land, buildings, plant, equipment and infrastructure
Property, plant and equipment are stated at historical cost or valuation, except as otherwise indicated. The majority of Australian Government entities have valued these assets at fair value. Specialist military equipment is measured on a cost basis.

Notes to the financial statements
90
Details pertaining to valuations can be found in the audited financial statements of individual Australian Government controlled entities, which are tabled in Parliament. During 2013-14, material revaluations occurred within the following Australian Government controlled entities:
• Australian Broadcasting Corporation;
• Australian Federal Police;
• Australian National Maritime Museum;
• Australian Postal Corporation;
• Australian Rail Track Corporation Limited;
• Bureau of Meteorology;
• Commonwealth Scientific and Industrial Research Organisation;
• Defence Housing Australia;
• Department of Defence;
• Department of Finance;
• Department of Foreign Affairs and Trade;
• Department of Human Services;
• Department of Infrastructure and Regional Development;
• Department of the Environment;
• Indigenous Business Australia;
• National Gallery of Australia; and
• National Library of Australia.
The measurement basis used for each class of depreciable assets are as follows:
Land Fair value: Market selling price
Buildings Fair value: Market selling price or depreciated replacement cost
Specialist military equipment Cost
Other plant, equipment and infrastructure Fair value: Market selling price or depreciated replacement cost
Heritage and cultural assets Fair value: Market selling price or depreciated replacement cost
Investment properties Fair value: Market selling price

Notes to the financial statements
91
Assets were assessed for impairment at 30 June 2014. Where indications of impairment exist, the asset’s recoverable amount is estimated and an impairment adjustment made if the asset’s recoverable amount is less than its carrying amount. The recoverable amount of an asset is the higher of its fair value less cost to sell and its value in use. Value in use is the present value of future cash flows expected to be derived from the asset. Where the future economic benefit of an asset is not primarily dependent on the asset’s ability to generate future cash flows, and the asset would be replaced if the Australian Government was deprived of the asset, its value in use is taken to be its depreciated replacement cost.
The cost of restoration or removal is provided for in the measurement of property, plant and equipment when a legal or constructive obligation exists. These costs include obligations relating to the dismantling, removal, remediation, restoration and other expenditure associated with the Australian Government’s fixed assets or site fit outs. Restoration provisions are initially recorded when a reliable estimate of the costs to be incurred can be determined and are discounted to present value. Estimates are based upon a review of lease contracts, legal requirements, historical information and expected future costs. Any changes to these estimates are adjusted on a progressive basis as required.
Where restoration costs are incurred due to the acquisition, construction or development of a non-current asset, a provision is raised and recorded at that time as part of the cost of the asset where the cost is reliably measurable.
Land, being an asset with an unlimited useful life, is not depreciated. The majority of buildings, plant, equipment and infrastructure are depreciated on a straight-line basis over the useful life of the asset or over the lesser of the lease term and useful life for selected leasehold improvements.
Depreciation and amortisation rates applying to each class of depreciable assets are based on the following useful lives:
2013-14 2012-13 Buildings(a) 1-200 years 1-200 years Specialist military equipment 1-54 years 1-54 years Other plant, equipment and infrastructure 1-112 years 1-112 years Heritage and cultural assets 1-5,000 years 5-5,000 years (a) This depreciation range includes certain leasehold improvements, which have depreciation rates of up to
50 per cent. Intangibles
Intangible assets are assets that have value, but do not have physical substance. In order to be recognised, an intangible asset must be either separable or arise from contractual or other legal rights. The Australian Government’s intangibles comprise internally developed software for internal use, water entitlements and intangible assets acquired by public corporations (PNFCs and PFCs). When public corporations acquire

Notes to the financial statements
92
investments in controlled, jointly controlled or associated entities, and pay an amount greater than the fair value of the net identifiable assets of the entity, this excess is recognised as goodwill.
Intangibles are carried at cost. Software is amortised on a straight-line basis over its anticipated useful life. Water entitlements are classified as indefinite life intangibles and are therefore subject to annual impairment testing. Goodwill and other indefinite life intangibles are not amortised but tested for impairment on an annual basis. Other intangible assets are amortised from the date they are available for use.
Amortisation rates applying to each class of intangible are based on the following useful lives:
2013-14 2012-13 Computer software 1-24 years 1-24 years Other intangibles(a) 1-100 years (b) 1-100 years (b) (a) Excludes goodwill and indefinite life intangibles. (b) The useful life of the Hansard digitised data is currently 100 years. 1.16 Financial liabilities
Recognition and measurement of financial liabilities
The classification of financial liabilities depends on the purpose for which the liabilities were entered into. The Australian Government classifies its financial liabilities in the following categories:
• financial liabilities at fair value through profit or loss; and
• other liabilities.
Financial liabilities reported by the Australian Government include the individually significant financial instruments listed below.
Deposits held
Deposits include deposits at call and term deposits. Deposits are classified as financial liabilities under AASB 139. Deposit balances are shown at their amortised cost, which is equivalent to their face value. Interest is accrued over the term of deposits and is paid periodically or at maturity.
Government securities
Government securities primarily comprise Treasury Bonds, Treasury Indexed Bonds and Treasury Notes. These liabilities are measured at fair value. Where a security is issued at a premium or discount, the premium or discount is recognised at that time and included in the book value of the liability.

Notes to the financial statements
93
Loans
Loans are initially recognised at fair value plus any transaction costs that are directly attributable to the issue, and are subsequently measured at either amortised cost or at fair value through profit and loss. Any difference between the final amounts paid to discharge the loan and the initial loan proceeds (including transaction costs) is recognised in the operating statement over the borrowing period using the effective interest method.
Other interest bearing liabilities
The International Monetary Fund (IMF) special drawing right (SDR) allocation liability reflects the current value in Australian dollars of the Australian Government’s liability to repay to the IMF Australia’s cumulative allocations of SDRs. Interest is payable to the IMF in relation to the amount by which Australia’s SDR holdings are below Australia’s net cumulative allocations. It is valued at the Australian dollar equivalent of its liability in SDRs. Interest expense is recognised as it accrues.
In the course of financial market operations, the Reserve Bank of Australia (RBA) engages in repurchase agreements involving foreign and Australian dollar marketable securities. Securities sold but contracted for purchase under repurchase agreements are reported within the relevant investment category and are valued at market prices. The counterparty obligation to repurchase is reported as an interest bearing liability and is measured at amortised cost. The difference between the sale and purchase price is recognised as interest expense over the term of the agreement.
1.17 Provisions and payables
A provision is a liability of uncertain timing or amount. Non-employee provisions are recognised at the best estimate of the expenditure required to settle the present obligation at the reporting date. If the effect is material, provisions are determined by discounting the expected future cash flows (adjusted for expected future risks) required to settle the obligation at a rate that reflects current market assessments of the time value of money and the risks specific to the liability. The unwinding of the discount is treated as a borrowing cost.
Where some or all of the economic benefits required to settle a provision are expected to be recovered from a third party, the recovery receivable is recognised as an asset when it is virtually certain that the recovery will be received and is measured on a basis consistent with the measurement of the related provision.
Trade and other payables, including accruals, are recorded when Australian Government entities are required to make future payments as a result of a purchase of assets or services. Payables are initially recognised at fair value and are subsequently measured at amortised cost.

Notes to the financial statements
94
Superannuation
Australian Government sponsored superannuation schemes are detailed in Note 38.
The superannuation liability represents the present value of the Australian Government’s unfunded liability to employees for past services as estimated by the actuaries of the respective superannuation plans. Additional information on superannuation is included in Notes 19, 31 and 38.
Other employee benefits
Liabilities for ‘short-term employee benefits’ (as defined in AASB 119 Employee Benefits) and termination benefits due within 12 months of balance date are measured at their nominal amounts. The nominal amount is calculated with regard to the rates expected to be paid on settlement of the liability.
The liability for leave and other entitlements includes provision for annual leave and long service leave. No provision has been made for sick leave because all sick leave is non-vesting and the average sick leave taken by employees is less than the annual entitlement for sick leave.
Liabilities for services rendered by employees are recognised at the reporting date to the extent that they have not been settled.
All other employee benefit liabilities are measured at the present value of the estimated future cash outflows to be made in respect of services provided by employees up to the reporting date.
The liability for long service leave is calculated using expected future increases in wages and salary rates including related on-costs and is discounted using applicable government bond rates. In determining the present value of the liability, attrition rates, pay increases through promotion and inflation are taken into account. The liability for long service leave has been determined by reference to the work of actuaries.
Workers compensation — outstanding claims
This consolidated financial report includes as a provision an estimate of outstanding workers compensation claims. The provision represents an estimate of the present value of future payments in respect of claims for events occurring before 30 June 2014 with a 75 per cent probability of sufficiency. The expected future payments are discounted to present value using a risk free rate. The expected future payments include claims reported but not yet paid, claims incurred but not yet reported (IBNR) and anticipated claims handling costs.
Australian currency on issue
Australian currency issued represents a liability of the RBA in favour of the holder. Currency issued for circulation, including demonetised currency, is measured at face

Notes to the financial statements
95
value. When the RBA issues currency notes to the commercial banks, it receives in exchange funds equal to the full face value of the notes issued.
Other provisions
Other individually significant provisions reported by the Australian Government include:
• provision for outstanding medical benefits (Department of Health, Medibank Private);
• provision for military compensation provisions (Department of Veterans’ Affairs);
• payments made to States and Territories under the Natural Disaster Relief and Recovery Arrangements (Department of the Treasury);
• family tax benefit (Department of Social Services);
• pension bonus scheme (Department of Social Services);
• paid parental leave scheme (Department of Social Services);
• provision for Medical Indemnity (Department of Health);
• provision for restoration (primarily Department of Defence, Department of the Environment and the Australian Nuclear Science and Technology Organisation);
• provision for unfunded superannuation for Australian universities (Department of Education);
• provision for the reimbursement of employers for the long service leave entitlements of employees in the black coal industry (Coal Mining Industry [Long Service Leave Funding] Corporation); and
• provision for common law claims for asbestos related diseases (Comcare).
For details of these provisions, refer to the financial statements for the respective Australian Government reporting entities.
The financial report has not included a provision for outstanding claims under the Terrorism Insurance Act 2003 because a declared terrorism incident has not been announced since the Act was enacted.
1.18 Reserves
Asset revaluation reserve
The asset revaluation reserve includes the net revaluation increments and decrements arising from the revaluation of property, plant and equipment in accordance with AASB 116 Property, Plant and Equipment.

Notes to the financial statements
96
Foreign currency reserve
The foreign currency translation reserve records the foreign currency differences arising from the translation of self-sustaining foreign operations, primarily foreign subsidiaries of Australia Postal Corporation.
Investments reserve
The investments reserve records the Australian Government’s interest in portfolio authorities and companies.
Statutory funds reserve
The statutory funds reserve comprises amounts set aside out of operating surpluses under a specific Act or Statute.
Other reserves
Other reserves include amounts set aside out of operating surpluses for purposes other than those detailed above, including general reserves.
1.19 Commitments
Commitments are obligations or undertakings to make future payments to other entities that exist at the end of the reporting period but which have not been recognised as liabilities in the balance sheet.
Additional information on commitments is included in Note 35.
1.20 Contingent liabilities and contingent assets
Contingent liabilities and assets are not recognised in the balance sheet but are disclosed in the relevant notes. They are classified as contingent due to:
• uncertainty as to the existence of a liability or asset,
• an existing liability or asset in respect of which settlement is not probable, or
• an existing liability or asset where the amount cannot be reliably measured.
Remote contingencies are reported as part of this disclosure where the contingency is considerered significant to the Australian Government, albeit remote.
A liability or asset may be recognised when its existence is confirmed by a future event, settlement becomes probable (virtually certain for assets) or reliable measurement becomes possible.

Notes to the financial statements
97
In this consolidated financial report, contingent assets are possible assets that arise from past events, the existence of which will be confirmed only by the occurrence or non-occurrence of one or more uncertain future events not wholly within the control of the Australian Government.
Additional information on contingencies is included in Note 36.
1.21 Insurance
Australian Government entities operating in the general government sector are members of the Australian Government’s self managed fund for insurable risks, Comcover. This excludes workers compensation where the risk continues to be managed by Comcare. Australian Government entities operating outside the general government sector adopt their own insurance strategies, which includes both self-insurance and commercial insurance coverage.
1.22 Rounding
All amounts in this consolidated financial report have been rounded to the nearest million dollars, unless otherwise noted.
1.23 Comparative figures
Unless otherwise stated, comparative figures are consistent with those presented in the 2012-13 Consolidated Financial Statements.
1.24 Balance dates
Most entities controlled by the Australian Government have 30 June balance dates. Where entities have balance dates other than 30 June they are incorporated into this financial report as at their latest balance date. This approach has not materially affected the income and expenses to 30 June 2014 or the assets and liabilities reported as at 30 June 2014.
1.25 Materiality
AASB 1031 Materiality states that an item or an aggregate of items is required to be recognised, measured or disclosed in a financial report where its omission, misstatement or non-disclosure could affect either resource allocation decisions by users of the report or the discharge of accountability by management or the governing body of an entity. It also provides guidance as to quantitative thresholds for determining the materiality of a particular item or aggregate of items. These financial statements are compiled having regard to AASB 1031. This includes consistent application between the CFS and the FBO.

Notes to the financial statements
98
1.26 Audit of Australian Government controlled entities
This financial report is consolidated from the 2013-14 financial statements of Australian Government entities that were all audit signed, with the exception of the following entities, as at the time of publication:
• Northern Land Council;
• Tiwi Land Council;
• Outback Stores Pty Ltd; and
• Health Workforce Australia.
1.27 Compliance with the Constitution
Section 83 of the Constitution provides that no amount may be paid out of the Consolidated Revenue Fund except under an appropriation made by law. After reviewing the circumstances of certain Section 83 breaches in 2010-11, the Australian Government considered that there was a risk of non-compliance with Section 83 of the Constitution in circumstances where payments are made that do not accord with conditions included in the relevant legislation. This could primarily occur with payments made from special appropriations and special accounts.
During 2011-12, government agencies developed individual plans to review exposure to risks of not complying with statutory conditions on payments from appropriations to their agency. As a result of that investigation, legislation was amended by the Financial Framework Legislation Amendment Act (No 2) 2012 (FFLA Act No 2). The amendment ensured that payments made under certain Acts with a special appropriation would not be subject to Section 83 breaches in the future.
During 2012-13 and 2013-14, agencies continued to monitor their level of compliance with Section 83 of the Constitution across all legislation for which they have legislative responsibility. During 2012-13 additional legal advice was received that indicated there could be breaches of Section 83 under certain circumstances with payments for long service leave, goods and services tax and payments under determinations of the Remuneration Tribunal. Australian Government agencies have reviewed, or are in the process of reviewing their processes and controls over payments for these items to minimise the possibility for future breaches as a result of these payments. In general, agencies have determined that there is a low risk of the certain circumstances mentioned in the legal advice applying to their agency, although some breaches have been reported.
The following table shows the number and value of actual and potential breaches identified in 2013-14, and amounts recovered to date, for those agencies that have reported actual or potential non-compliance with Section 83 of the Constitution:

Notes to the financial statements
99
Commonwealth controlled entity Actual breaches Potential breaches RecoveredValue Value /Waived
No. $'000 No. $'000 $'000Attorney-General's Department - - 132 252 -Australian Customs and Border Protection
Service 355 1,819 - - 714Australian Financial Security Authority 1 3 - - -Australian Taxation Office 2 - - - -Department of Defence - - 503 625 638Department of Education, Employment and
Workplace Relations - - 89,375 28,683 2,198Department of Education - - 1 125 -Department of Finance 33 69 - - 69Department of Health 13 317 n/a (a) 18,463 9,670Department of Human Services 4 28 - - 7Department of Industry 1 162 25,776 30,410 9,090Department of Social Services 1 784 1,316,037 895,805 459,316Department of the Prime Minister
and Cabinet 2 117 - - 116Department of the Treasury 9 5 - - 5Department of Veterans' Affairs - - n/a (a) 50,177 n/a (a)Total 421 3,304 1,431,824 1,024,540 481,824 (a) The number of potential breaches has not been quantified. It is important to note that it is not possible in all instances to fully remove the potential for Section 83 breaches under existing legislation. In many cases the Australian Government relies on information provided by payment recipients to calculate and pay appropriate entitlements, and this information is not always timely or accurate.
The Australian Government continues to have regard to developments in case law, including the High Court’s most recent decision on Commonwealth expenditure in Williams v Commonwealth [2014] HCA 23, as they contribute to the larger body of law relevant to the development of Commonwealth programmes. In accordance with its general practice, the Government will continue to monitor and assess risk and decide on any appropriate actions to respond to risks of expenditure not being consistent with constitutional or other legal requirements.
During the 2013-14 financial year, The High Court in Williams v Commonwealth [2014] HCA 23 held that payments made under the National Schools Chaplaincy and Student Welfare Programme were invalid on the grounds that they were not supported by a Commonwealth constitutional head of power. Consequently, the payments so made became debts owed to the Commonwealth. However, the Minister for Finance, the Hon Mathias Cormann, after considering all relevant matters, waived those debts under s34(1)(a) of the Financial Management and Accountability Act 1997 on 19 June 2014. The amount waived was $156.1 million (this is a separate amount to the Section 83 breaches reported above).

Notes to the financial statements
100
Note 2: Taxation revenue
2014 2013 2014 2013$m $m $m $m
Income taxationIndividuals and other withholding taxes
Gross income tax withholding 157,761 150,297 157,761 150,297Gross other individuals 37,561 36,283 37,561 36,283less Refunds (27,407) (26,801) (27,407) (26,801)
Total individuals and other withholding taxation 167,915 159,779 167,915 159,779Fringe benefits tax 4,285 3,970 4,285 3,970Company tax 68,764 67,923 68,625 67,811Superannuation funds 6,147 7,473 6,147 7,473Resource rent taxes 1,785 1,914 1,785 1,914Total income taxation revenue 248,896 241,059 248,757 240,947Indirect taxationSales taxes
Goods and services tax 55,517 50,202 55,517 50,202Wine equalisation tax 826 716 826 716Luxury car tax 476 431 476 431
Total sales taxes 56,819 51,349 56,819 51,349Excise duty
Petrol 5,925 6,079 5,925 6,079Diesel 8,603 8,640 8,603 8,640Beer 1,948 1,958 1,948 1,958Other excisable products 9,171 9,032 9,171 9,032
Of which: Other excisable beverages(a) 879 914 879 914Total excise duty revenue 25,647 25,709 25,647 25,709Customs duty
Textiles, clothing and footwear 789 676 789 676Passenger motor vehicles 921 892 921 892Excise-like goods 6,258 5,458 6,258 5,458Other imports 1,633 1,500 1,633 1,500less Refunds and drawbacks (319) (354) (319) (354)
Total customs duty revenue 9,282 8,172 9,282 8,172
Carbon pricing mechanism 4,744 5,047 4,744 5,047Other indirect taxation
Agricultural levies 491 476 491 476Other taxes 3,329 2,730 3,329 2,730
Total other indirect taxation revenue 3,820 3,206 3,820 3,206Mirror taxes 498 484 498 484
less Transfers to States in relation tomirror tax revenue (498) (484) (498) (484)
Mirror tax revenue - - - -
Total indirect taxation revenue 100,312 93,483 100,312 93,483Total taxation revenue 349,208 334,542 349,069 334,430
General Government Australian Government
(a) Other excisable beverages are those not exceeding 10 per cent by volume of alcohol.

Notes to the financial statements
101
Note 3: Sales of goods and services
2014 2013 2014 2013$m $m $m $m
Sales of goods 1,453 1,283 8,247 7,367Rendering of services 3,645 3,878 11,489 11,000Operating lease rental 68 46 111 81Other fees from regulatory services 3,409 3,679 3,409 3,679Total sales of goods and services revenue 8,575 8,886 23,256 22,127
Cost of goods sold 552 490 893 840
General Government Australian Government
Note 4: Interest and dividend income
2014 2013 2014 2013$m $m $m $m
Interest from other governmentsState and Territory debt 9 10 9 10Housing agreements 121 139 121 139General purpose advances - - 187 254
Total interest from other governments 130 149 317 403
Interest from other sourcesAdvances 44 42 45 43Deposits 39 131 114 249Bills receivable 5 - 30 51Bank deposits 257 181 337 274Indexation of HELP receivable and
other student loans 408 377 408 377Securities 1,472 1,887 2,711 2,703Other 984 877 504 558
Total interest from other sources 3,209 3,495 4,149 4,255
Total interest 3,339 3,644 4,466 4,658Dividends
Dividends from other public sector entities 1,695 972 - -Other dividends 2,410 2,107 2,475 2,175
Total dividends 4,105 3,079 2,475 2,175Total interest and dividend income 7,444 6,723 6,941 6,833
General Government Australian Government
Note 5: Other sources of non-taxation revenue
2014 2013 2014 2013$m $m $m $m
Industry contributions 75 56 75 56Royalties 1,823 1,798 1,823 1,799Seigniorage 112 134 112 134Child support payments 1,507 1,438 1,507 1,438Other 3,326 3,583 3,366 3,630Total other sources of non-taxation
revenue 6,843 7,009 6,883 7,057
General Government Australian Government

Notes to the financial statements
102
Note 6: Employee and superannuation expenses
2014 2013 2014 2013$m $m $m $m
Wages and salaries expenses 18,823 18,486 22,868 22,207Other operating expenses
Leave and other entitlements 2,614 2,624 3,380 3,333Separations and redundancies 580 261 720 293Workers compensation premiums and claims 740 1,012 784 1,062Other 2,083 1,977 2,210 2,106
Total other operating expenses 6,017 5,874 7,094 6,794Superannuation expenses
Superannuation 6,372 8,403 6,923 8,760Superannuation interest 8,214 6,729 8,214 6,729
Total superannuation expenses 14,586 15,132 15,137 15,489Total employee and superannuation expense 39,426 39,492 45,099 44,490
General Government Australian Government
Employee expenses include salary and allowances received or receivable by 39 Cabinet Ministers (including 20 ministers who served under the former Government which ceased on 18 September 2013) totalling $8.8 million during 2013-14 (25 Cabinet Ministers during 2012-13: $9.7 million).
Note 7: Depreciation and amortisation expenses
2014 2013 2014 2013$m $m $m $m
DepreciationSpecialist military equipment 2,539 2,688 2,539 2,688Buildings 1,422 1,351 1,531 1,443Other infrastructure, plant and equipment 1,394 1,430 1,993 1,869Heritage and cultural assets 51 50 51 50
Total depreciation 5,406 5,519 6,114 6,050Total amortisation 998 909 1,441 1,207
Add back Amortisation of non-produced assets (64) (31) (133) (95)Total depreciation and amortisation expense 6,340 6,397 7,422 7,162
General Government Australian Government
Note 8: Supply of goods and services
2014 2013 2014 2013$m $m $m $m
Supply of goods and services 24,230 22,292 28,108 25,343Operating lease rental expenses 2,549 2,626 2,895 2,866Health care payments 5,220 5,214 5,220 5,214Benefits to households in goods and services 40,943 39,273 40,943 39,273Other 2,192 2,189 7,369 6,997Total payment for supply of goods
and services 75,134 71,594 84,535 79,693
General Government Australian Government

Notes to the financial statements
103
Note 9: Interest expense
2014 2013 2014 2013$m $m $m $m
Interest on debtGovernment securities 13,390 12,225 13,148 11,896Loans 10 10 143 131Taxation overpayments 230 503 230 503Exchange settlement funds - - 342 32Deposits - - 29 44Other 32 30 138 99
Total interest on debt 13,662 12,768 14,030 12,705Discount on concessional instruments 1,060 870 1,060 870Unwinding of discount and other 227 241 234 276Finance charges for finance leases 101 68 322 131
Other financing costs 1,388 1,179 1,616 1,277Total interest expense 15,050 13,947 15,646 13,982
General Government Australian Government
Note 10: Grants expense
2014 2013 2014 2013$m $m $m $m
Current grants expenseState and Territory governments 88,454 84,869 88,454 84,869Local governments 15 16 15 16Private sector 1,919 1,799 1,919 1,799Overseas 4,173 4,085 4,173 4,085Non-profit organisations 3,966 3,132 3,966 3,132Multi-jurisdictional sector 9,634 9,108 9,634 9,108Other 7,799 7,689 7,749 7,580
Total current grants expense 115,960 110,699 115,910 110,590Capital grants expense
Mutually agreed write-downs 2,627 794 2,477 794Other capital grants
State and Territory governments 8,765 7,032 8,765 7,032Local governments 714 406 714 406Private sector 34 48 34 48Multi-jurisdictional sector 97 92 97 92Other 9,122 311 322 311
Total other capital grants expense 18,732 7,888 9,932 7,888Total capital grants expense 21,359 8,682 12,409 8,682Total grants expense 137,319 119,381 128,319 119,272
General Government Australian Government

Notes to the financial statements
104
Note 11: Expenses by function(a)
2014 2013 2014 2013$m $m $m $m
General public services 34,091 25,223 35,667 26,339Defence 22,146 21,146 23,064 22,057Public order and safety 4,369 3,923 4,477 4,031Education 29,669 28,468 29,669 28,468Health 63,791 61,303 70,252 67,264Social security and welfare 140,561 131,803 140,561 131,803Housing and community amenities 6,044 5,278 6,045 5,281Recreation and culture 3,749 3,553 3,749 3,553Fuel and energy 6,749 5,955 6,749 5,955Agriculture, forestry and fishing 2,384 2,407 2,384 2,407Mining, manufacturing and construction 3,451 2,920 3,548 3,016Transport and communication 8,408 5,022 17,935 12,788Other economic affairs 10,838 10,631 10,444 10,263Other purposes 75,571 72,647 64,858 70,671Total expenses 411,821 380,279 419,402 393,896
General Government Australian Government
(a) Refer Note 46 for description of each function. Note 12: Net write-down of assets (including bad and doubtful debts)
2014 2013 2014 2013$m $m $m $m
FINANCIAL ASSETSReceivables - bad and doubtful debts
Goods and services 99 89 102 90Taxes due 5,474 5,097 5,474 5,097Other 719 359 719 359
Total receivables - bad and doubtful debts 6,292 5,545 6,295 5,546Net write-down/(reversal) and impairment arising
from the revaluation of investments and otherfinancial assets (159) 12 (170) 8
Total financial write-down and impairment 6,133 5,557 6,125 5,554NON-FINANCIAL ASSETS
Inventories 379 417 388 427Land - 1 - 16Buildings 58 68 63 107Specialist military equipment 466 309 467 309Other infrastructure, plant and equipment 144 51 179 557Heritage and cultural assets 6 - 6 -Other non-financial assets 2 5 2 6Intangibles 2 376 117 398Investment properties 31 16 31 16
Net write-down, impairment and fairvalue losses arising from the revaluation of non-financial assets 1,088 1,243 1,253 1,836
Total net write-down and impairmentof assets and fair value losses 7,221 6,800 7,378 7,390
General Government Australian Government

Notes to the financial statements
105
Note 13: Net gain/(loss) from the sale of assets
2014 2013 2014 2013$m $m $m $m
FINANCIAL ASSETSNet gains/(losses) from sale of investments 6,111 (129) 6,145 (436)Net gains/(losses) from sale of receivables - - - -
Total net gains/(losses) from sale offinancial assets 6,111 (129) 6,145 (436)
NON-FINANCIAL ASSETSProceeds from sale of land and buildings 135 147 358 159less selling costs of sale of land and buildings (8) (10) (44) (11) less written down value of land and buildings sold (141) (142) (171) (132)
Net gains/(losses) from sale of land and buildings (14) (5) 143 16
Proceeds from sale of investment properties 15 5 17 73less selling costs of investment properties - (1) - (1)less written down value of investment properties (16) (5) (16) (45)
Net gains/(losses) from sale of investment properties (1) (1) 1 27
Proceeds from sale of infrastructure, plantand equipment 77 35 104 41
less selling costs of infrastructure, plantand equipment (11) (4) (11) (4)
less written down value of infrastructure, plant and equipment sold (84) (54) (108) (65)
Net gains/(losses) from sale of infrastructure, plant and equipment (18) (23) (15) (28)
Proceeds from sale of intangibles 5 1,484 5 1,485less selling costs of intangibles - - - -less written down value of intangibles (7) (2) (7) (4)
Net gains/(losses) from sale of intangibles (2) 1,482 (2) 1,481less written down value of heritage and cultural assets (2) - (2) -
Net gains/(losses) from sale hertiage and cultural assets (2) - (2) -
Proceeds from sale of biological assets 9 13 9 13less selling costs of biological assets - - - -less written down value of biological assets (9) (13) (9) (13)
Net gains/(losses) from sale of biological assets - - - -
Total net gains/(losses) from sale of non-financial assets (37) 1,453 125 1,496
Net gains/(losses) from sale of assets 6,074 1,324 6,270 1,060Add back selling costs included in expenses from
transactions 19 15 55 16Net gains/(losses) from sale of assets in other
economic flows 6,093 1,339 6,325 1,076
General Government Australian Government

Notes to the financial statements
106
Note 14: Net foreign exchange gains/(losses)
2014 2013 2014 2013$m $m $m $m
Net foreign exchange gains/(losses)Non-speculative (402) (2,284) (245) 1,678
Net foreign exchange gains/(losses) (402) (2,284) (245) 1,678
General Government Australian Government
Note 15: Net swap interest received
2014 2013 2014 2013$m $m $m $m
Net swap interestNet swap interest revenue 612 387 698 472Net swap interest expense (1,136) (371) (1,178) (427)
Net swap interest received (524) 16 (480) 45
General Government Australian Government
Note 16: Other gains/(losses)
2014 2013 2014 2013$m $m $m $m
Fair value gains- financial instruments 1,005 25,113 1,130 25,298
Fair value gains - biological assets 11 4 11 4Fair value gains - investment properties 8 4 22 15Net actuarial gains/(losses) (1,584) (1,546) (1,584) (1,546)Revaluation of superannuation liability (7,797) - (7,797) -Other 35 114 35 114Total other gains/(losses) (8,322) 23,689 (8,183) 23,885
General Government Australian Government
Note 17: Fair value measurement (a) Fair value measurement
The following tables provide an analysis of assets and liabilities that are measured at fair value. The different levels of the fair value hierarchy are defined below.
Level 1: Quoted prices (unadjusted) in active markets for identical assets or liabilities that the entity can access at measurement date.
Level 2: Inputs other than quoted prices included within Level 1 that are observable for the asset or liability, either directly or indirectly.
Level 3: Unobservable inputs for the asset or liability.

Notes to the financial statements
107
Australian GovernmentLevel 1: Level 2: Level 3:Market Market Non Market TotalValues Inputs Inputs
2014 2014 2014 2014$m $m $m $m
Financial assets:Receivables - 1,949 27,583 29,532Investments, loans and placements
Deposits 146 6,628 - 6,774Government securities 55,448 2,741 - 58,189Debentures 200 659 - 859International Monetary Fund quota - - 5,306 5,306Collective investment vehicles - 273 32,020 32,293Other interest bearing securities 43 27,453 4,054 31,550Other 3,790 3,131 2,855 9,776
Equity investmentsInvestments - Shares 38,346 120 1,467 39,933Investment in public corporations - - - -Equity accounted investments - - 210 210
Total financial assets 97,973 42,954 73,495 214,422
Non-financial assets:Land - 8,842 1,004 9,846Buildings - 4,465 22,916 27,381Plant, equipment and infrastructure - 1,867 23,073 24,940Investment property - 375 - 375Biological assets - 36 - 36Heritage and cultural assets - 8,161 2,664 10,825Assets held for sale 11 132 - 143
Total non-financial assets 11 23,878 49,657 73,546
Total fair value measurements of assets in the statement of financial position 97,984 66,832 123,152 287,968
Financial liabilities:Fair value through profit and loss
Government securities 314,024 32,578 - 346,602Loans - 1,951 224 2,175Other debt 21 630 12 663Payables 13 87 1,683 1,783
Total financial liabilities 314,058 35,246 1,919 351,223
Total fair value measurements of liabilities in the statement of financial position 314,058 35,246 1,919 351,223

Notes to the financial statements
108
General GovernmentLevel 1: Level 2: Level 3:Market Market Non Market TotalValues Inputs Inputs
2014 2014 2014 2014$m $m $m $m
Financial assets:Receivables - 1,243 26,727 27,970Investments, loans and placements
Deposits 146 33,493 - 33,639Government securities - - - -Debentures - - - -International Monetary Fund quota - - 5,306 5,306Collective investment vehicles - 273 32,020 32,293Other interest bearing securities 43 27,453 4,054 31,550Other 3,694 1,797 2,377 7,868
Equity investmentsInvestments - Shares 38,159 18 1,119 39,296Investment in public corporations - - 35,746 35,746Equity accounted investments - - 210 210
Total financial assets 42,042 64,277 107,559 213,878
Non-financial assets:Land - 8,539 792 9,331Buildings - 3,046 21,677 24,723Plant, equipment and infrastructure - 1,133 11,918 13,051Investment property - 183 - 183Biological assets - 36 - 36Heritage and cultural assets - 8,161 2,664 10,825Assets held for sale 9 86 - 95
Total non-financial assets 9 21,184 37,051 58,244
Total fair value measurements of assets in the statement of financial position 42,051 85,461 144,610 272,122
Financial liabilities:Fair value through profit and loss
Government securities 318,691 32,578 - 351,269Loans - - - -Other debt 20 448 8 476Payables 13 82 1,659 1,754
Total financial liabilities 318,724 33,108 1,667 353,499
Total fair value measurements of liabilities in the statement of financial position 318,724 33,108 1,667 353,499
Notes to the financial statements
109
Level 3 financial assets
Australian Government Level 3 financial assets at 30 June 2014 included:
unlisted managed investment schemes and collective investment vehicles held by the Future Fund which are re-measured based on the estimated fair value of the net assets of each scheme or vehicle at the reporting date. In determining fair value, reference is made to the underlying unit price provided by the Manager (where available), associated Manager valuation reports and the most recent audited financial statements of the scheme. Collective investment vehicles held by the Future Fund were valued at $32,293 million at 30 June 2014 (2013: $29,498 million);
amounts receivable under the Higher Education Loan Programme (HELP) which are actuarially determined (refer Note 1). The HELP receivable was valued at $25,147 million at 30 June 2014 (2013: $21,593 million); and
subscription based membership rights (controlled) held by the Australian Government in accordance with the articles of association for the International Development Association (IDA) and the Asian Development Fund (ADF) which are measured at fair value based on professional valuation advice as to the estimated present value of the recoverable cash flows foregone. The subscription was valued at $1,545 million at 30 June 2014 (2013: $1,493 million).
In addition, certain entities apply models in the valuation of derivative instruments.
At the general government sector level, Level 3 financial assets also included equity investments in public corporations. Where the public corporation is a government business enterprise whose principal function is to engage in commercial activities in the private sector, the investment has been measured at fair value, where fair value is reliably measurable. Investments in other public corporations have been measured at the Australian Government’s proportional interest in the net assets of the public corporation at 30 June. These investments are eliminated at the whole of government level.
Fair value measurements – highest and best use differs from current use for non-financial assets
The highest and best use for non-financial assets is the same as their current use.
(b) Level 1 and level 2 transfers for recurring fair value measurement
There have been no material transfers between Level 1 and Level 2 fair value hierarchy categories during the reporting period.

Notes to the financial statements
110
(c)
Val
uatio
n te
chni
que
and
inpu
ts fo
r lev
el 2
and
leve
l 3 fa
ir v
alue
mea
sure
men
ts
The
follo
win
g ta
ble
sum
mar
ises
the
valu
atio
n te
chni
ques
use
d in
det
erm
inin
g fa
ir v
alue
acr
oss
all a
genc
ies.
Leve
l 2 a
nd 3
fair
valu
e m
easu
rem
ents
- va
luat
ion
tech
niqu
e an
d th
e in
puts
use
d fo
r ass
ets
and
liabi
litie
s
Cat
egor
y (L
evel
2or
Leve
l 3)
Gen
eral
G
over
nmen
t$m
Aust
ralia
n G
over
nmen
t$m
Valu
atio
n te
chni
que(
s)(a
)In
puts
use
d(b)
Ran
ge (w
eigh
ted
aver
age)
(c)
Fina
ncia
l ass
ets
Rec
eiva
bles
21,
243
1,94
9D
isco
unte
d ca
sh fl
owPr
inci
pal d
ueN
/AD
isco
unt r
ate
N/A
326
,727
27,5
83D
isco
unte
d ca
sh fl
owPr
inci
pal d
ueN
/AR
epay
men
t pat
tern
sR
efer
foot
note
(d)
Deb
t not
exp
ecte
d to
be re
paid
22.1
%(d
)Fu
ture
CPI
gro
wth
2.5%
(d)
Dis
coun
t rat
e9.
5% -
12.5
%(e
)In
vest
men
ts, l
oans
and
pla
cem
ents
Dep
osits
233
,493
6,62
8M
arke
t App
roac
hM
arke
t tra
nsac
tions
N/A
Gov
ernm
ent s
ecur
ities
2-
2,74
1M
arke
t App
roac
hM
arke
t tra
nsac
tions
N/A
Deb
entu
res
2-
659
Mar
ket A
ppro
ach
Mar
ket t
rans
actio
nsN
/AIn
tern
atio
nal M
onet
ary
Fund
quo
ta3
5,30
65,
306
Cos
t app
roac
hC
ost
N/A
Col
lect
ive
inve
stm
ent v
ehic
les
227
327
3M
arke
t App
roac
hM
arke
t tra
nsac
tions
N/A
332
,020
32,0
20M
arke
t App
roac
hN
et a
sset
s of
ent
ities
Ref
er fo
otno
te(f)
Oth
er in
tere
st b
earin
g se
curit
ies
227
,453
27,4
53M
arke
t App
roac
hM
arke
t tra
nsac
tions
N/A
34,
054
4,05
4M
arke
t App
roac
hN
et a
sset
s of
ent
ities
Ref
er fo
otno
te(f)
Oth
er2
1,79
73,
131
Mar
ket A
ppro
ach
Mar
ket t
rans
actio
nsN
/A3
2,21
72,
532
Net
ass
ets
of e
ntiti
esN
et a
sset
s of
ent
ities
N/A
160
323
Mar
ket A
ppro
ach
Adju
sted
mar
ket t
rans
actio
nR
efer
foot
note
(b)
Fair
valu
e

Notes to the financial statements
111
Cat
egor
y (L
evel
2or
Leve
l 3)
Gen
eral
G
over
nmen
t$m
Aust
ralia
n G
over
nmen
t$m
Valu
atio
n te
chni
que(
s)(a
)In
puts
use
d(b)
Ran
ge (w
eigh
ted
aver
age)
(c)
Equi
ty in
vest
men
tsIn
vest
men
ts -
Shar
es2
1812
0M
arke
t app
roac
hM
arke
t tra
nsac
tions
N/A
31,
119
1,46
7M
arke
t app
roac
hAd
just
ed m
arke
t tra
nsac
tion
Ref
er fo
otno
te(b
)In
vest
men
t in
publ
ic c
orpo
ratio
ns3
31,3
13-
Net
ass
ets
of e
ntiti
esN
et a
sset
s of
ent
ities
N/A
(Gen
eral
Gov
ernm
ent o
nly)
34,
433
-D
isco
unte
d ca
sh fl
owC
ash
flow
gro
wth
2.5%
- 5%
(g)
Wei
ghte
d av
erag
eco
st o
f cap
ital
10%
- 10
.75%
(g)
Equi
ty a
ccou
nted
inve
stm
ents
321
021
0N
et a
sset
s of
ent
ities
Net
ass
ets
of e
ntiti
esN
/AN
on-fi
nanc
ial a
sset
sLa
nd2
8,33
88,
641
Mar
ket a
ppro
ach
Mar
ket t
rans
actio
nsN
/A20
120
1In
com
e Ap
proa
chM
arke
t tra
nsac
tions
N/A
379
21,
004
Mar
ket a
ppro
ach
Adju
sted
mar
ket t
rans
actio
nR
efer
foot
note
(b)
Build
ings
22,
241
3,66
0M
arke
t app
roac
hM
arke
t tra
nsac
tions
N/A
241
841
8In
com
e ap
proa
chM
arke
t tra
nsac
tions
N/A
Rep
lace
men
t cos
t of
238
738
7C
ost a
ppro
ach
new
ass
ets
N/A
Mar
ket t
rans
actio
nsN
/AD
epre
ciat
ed re
plac
emen
tR
epla
cem
ent c
ost o
f3
21,2
4322
,482
cost
new
ass
ets
N/A
Con
sum
ed e
cono
mic
ben
efit
0.5%
- 10
0%
(3.4
3%)(h
)3
327
327
Mar
ket a
ppro
ach
Adju
sted
mar
ket t
rans
actio
nR
efer
foot
note
(b)
310
710
7In
com
e ap
proa
chC
apita
lisat
ion
rate
7.05
% -
10%
(8
.64%
)(i)
Per s
quar
e m
etre
cos
tN
/A
Fair
valu
e

Notes to the financial statements
112
Cat
egor
y (L
evel
2or
Leve
l 3)
Gen
eral
G
over
nmen
t$m
Aust
ralia
n G
over
nmen
t$m
Valu
atio
n te
chni
que(
s)(a
)In
puts
use
d(b)
Ran
ge (w
eigh
ted
aver
age)
(c)
Plan
t, eq
uipm
ent a
nd in
frast
ruct
ure
266
21,
396
Mar
ket a
ppro
ach
Per s
quar
e m
etre
cos
tN
/AR
epla
cem
ent c
ost o
fne
w a
sset
sN
/AM
arke
t tra
nsac
tions
N/A
247
147
1C
ost a
ppro
ach
Con
sum
ed e
cono
mic
ben
efit
N/A
Rep
lace
men
t cos
t of
new
ass
ets
N/A
Dep
reci
ated
repl
acem
ent
Rep
lace
men
t cos
t of
311
,918
23,0
73co
stne
w a
sset
sN
/AC
onsu
med
eco
nom
ic b
enef
it0.
91%
- 10
0%
(7.0
2%)(j
)In
vest
men
t pro
perty
218
337
5M
arke
t app
roac
hM
arke
t tra
nsac
tions
N/A
Cap
italis
atio
n ra
teN
/AFu
ture
ear
ning
sN
/ABi
olog
ical
ass
ets
236
36M
arke
t app
roac
hM
arke
t tra
nsac
tions
N/A
Her
itage
and
cul
tura
l ass
ets
27,
159
7,15
9M
arke
t app
roac
hM
arke
t tra
nsac
tions
N/A
Rep
lace
men
t cos
t of
21,
002
1,00
2C
ost a
ppro
ach
new
ass
ets
N/A
Dep
reci
ated
repl
acem
ent
Rep
lace
men
t cos
t of
31,
466
1,46
6co
stne
w a
sset
sN
/AC
onsu
med
eco
nom
ic b
enef
it0.
12%
- 33
.3%
(1
.08%
)(k)
31,
198
1,19
8M
arke
t app
roac
hAd
just
ed m
arke
t tra
nsac
tion
Ref
er fo
otno
te(b
)As
sets
hel
d fo
r sal
e2
8613
2M
arke
t app
roac
hM
arke
t tra
nsac
tions
N/A
Fair
valu
e

Notes to the financial statements
113
Cat
egor
y (L
evel
2or
Leve
l 3)
Gen
eral
G
over
nmen
t$m
Aust
ralia
n G
over
nmen
t$m
Valu
atio
n te
chni
que(
s)(a
)In
puts
use
d(b)
Ran
ge (w
eigh
ted
aver
age)
(c)
Fina
ncia
l lia
bilit
ies
Fair
valu
e th
roug
h pr
ofit
and
loss
Gov
ernm
ent s
ecur
ities
232
,578
32,5
78M
arke
t app
roac
hM
arke
t tra
nsac
tions
N/A
Loan
s2
-1,
951
Mar
ket a
ppro
ach
Mar
ket t
rans
actio
nsN
/A3
-22
4M
arke
t app
roac
hAd
just
ed m
arke
t tra
nsac
tion
Ref
er fo
otno
te(b
)O
ther
deb
t2
448
630
Mar
ket a
ppro
ach
Mar
ket t
rans
actio
nsN
/A3
812
Mar
ket a
ppro
ach
Adju
sted
mar
ket t
rans
actio
nR
efer
foot
note
(b)
Paya
bles
282
87D
isco
unte
d ca
sh fl
owD
isco
unt r
ate
N/A
31,
659
1,68
3D
isco
unte
d ca
sh fl
owD
isco
unt r
ate
9.5%
- 12
.5%
(l)Bo
nd ra
te 1
0 ye
arN
/A
Fair
valu
e
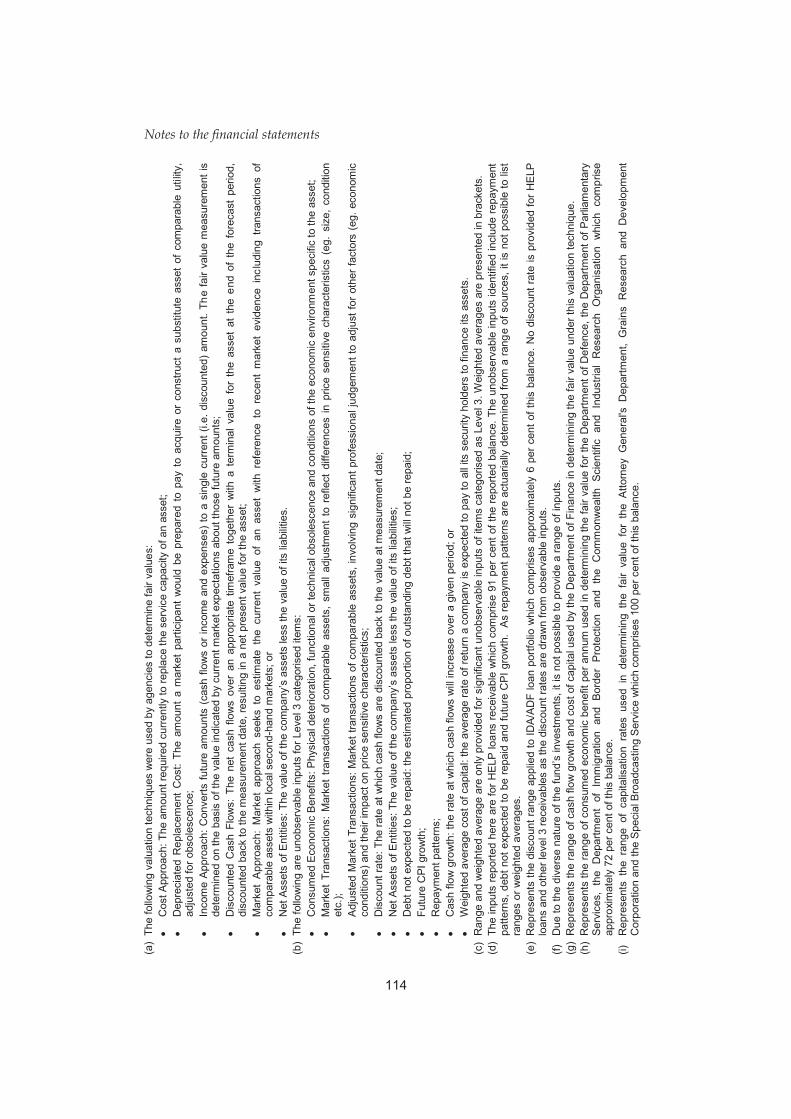
Notes to the financial statements
114
(a)
The
follo
win
g va
luat
ion
tech
niqu
es w
ere
used
by
agen
cies
to d
eter
min
e fa
ir va
lues
:
Cos
t App
roac
h: T
he a
mou
nt re
quire
d cu
rrent
ly to
repl
ace
the
serv
ice
capa
city
of a
n as
set;
D
epre
ciat
ed R
epla
cem
ent
Cos
t: Th
e am
ount
a m
arke
t pa
rtici
pant
wou
ld b
e pr
epar
ed t
o pa
y to
acq
uire
or
cons
truct
a s
ubst
itute
ass
et o
f co
mpa
rabl
e ut
ility
, ad
just
ed fo
r obs
oles
cenc
e;
In
com
e A
ppro
ach:
Con
verts
futu
re a
mou
nts
(cas
h flo
ws
or in
com
e an
d ex
pens
es)
to a
sin
gle
curre
nt (
i.e. d
isco
unte
d) a
mou
nt. T
he fa
ir va
lue
mea
sure
men
t is
dete
rmin
ed o
n th
e ba
sis
of th
e va
lue
indi
cate
d by
cur
rent
mar
ket e
xpec
tatio
ns a
bout
thos
e fu
ture
am
ount
s;
D
isco
unte
d C
ash
Flow
s: T
he n
et c
ash
flow
s ov
er a
n ap
prop
riate
tim
efra
me
toge
ther
with
a t
erm
inal
val
ue f
or t
he a
sset
at
the
end
of t
he f
orec
ast
perio
d,
disc
ount
ed b
ack
to th
e m
easu
rem
ent d
ate,
resu
lting
in a
net
pre
sent
val
ue fo
r the
ass
et;
M
arke
t A
ppro
ach:
Mar
ket
appr
oach
see
ks t
o es
timat
e th
e cu
rrent
val
ue o
f an
ass
et w
ith r
efer
ence
to
rece
nt m
arke
t ev
iden
ce i
nclu
ding
tra
nsac
tions
of
com
para
ble
asse
ts w
ithin
loca
l sec
ond-
hand
mar
kets
; or
N
et A
sset
s of
Ent
ities
: The
val
ue o
f the
com
pany
’s a
sset
s le
ss th
e va
lue
of it
s lia
bilit
ies.
(b
) Th
e fo
llow
ing
are
unob
serv
able
inpu
ts fo
r Lev
el 3
cat
egor
ised
item
s:
C
onsu
med
Eco
nom
ic B
enef
its: P
hysi
cal d
eter
iora
tion,
func
tiona
l or t
echn
ical
obs
oles
cenc
e an
d co
nditi
ons
of th
e ec
onom
ic e
nviro
nmen
t spe
cific
to th
e as
set;
M
arke
t Tr
ansa
ctio
ns:
Mar
ket
trans
actio
ns o
f co
mpa
rabl
e as
sets
, sm
all a
djus
tmen
t to
ref
lect
diff
eren
ces
in p
rice
sens
itive
cha
ract
eris
tics
(eg.
siz
e, c
ondi
tion
etc.
);
Adj
uste
d M
arke
t Tra
nsac
tions
: Mar
ket t
rans
actio
ns o
f com
para
ble
asse
ts, i
nvol
ving
sig
nific
ant p
rofe
ssio
nal j
udge
men
t to
adju
st fo
r oth
er fa
ctor
s (e
g. e
cono
mic
co
nditi
ons)
and
thei
r im
pact
on
pric
e se
nsiti
ve c
hara
cter
istic
s;
D
isco
unt r
ate:
The
rate
at w
hich
cas
h flo
ws
are
disc
ount
ed b
ack
to th
e va
lue
at m
easu
rem
ent d
ate;
Net
Ass
ets
of E
ntiti
es: T
he v
alue
of t
he c
ompa
ny’s
ass
ets
less
the
valu
e of
its
liabi
litie
s;
D
ebt n
ot e
xpec
ted
to b
e re
paid
: the
est
imat
ed p
ropo
rtion
of o
utst
andi
ng d
ebt t
hat w
ill n
ot b
e re
paid
;
Futu
re C
PI g
row
th;
R
epay
men
t pat
tern
s;
C
ash
flow
gro
wth
: the
rate
at w
hich
cas
h flo
ws
will
incr
ease
ove
r a g
iven
per
iod;
or
W
eigh
ted
aver
age
cost
of c
apita
l: th
e av
erag
e ra
te o
f ret
urn
a co
mpa
ny is
exp
ecte
d to
pay
to a
ll its
sec
urity
hol
ders
to fi
nanc
e its
ass
ets.
(c
) R
ange
and
wei
ghte
d av
erag
e ar
e on
ly p
rovi
ded
for s
igni
fican
t uno
bser
vabl
e in
puts
of i
tem
s ca
tego
rised
as
Leve
l 3. W
eigh
ted
aver
ages
are
pre
sent
ed in
bra
cket
s.
(d)
The
inpu
ts re
porte
d he
re a
re fo
r HE
LP lo
ans
rece
ivab
le w
hich
com
pris
e 91
per
cen
t of t
he re
porte
d ba
lanc
e. T
he u
nobs
erva
ble
inpu
ts id
entif
ied
incl
ude
repa
ymen
t pa
ttern
s, d
ebt n
ot e
xpec
ted
to b
e re
paid
and
futu
re C
PI g
row
th.
As
repa
ymen
t pat
tern
s ar
e ac
tuar
ially
det
erm
ined
from
a ra
nge
of s
ourc
es, i
t is
not p
ossi
ble
to li
st
rang
es o
r wei
ghte
d av
erag
es.
(e)
Rep
rese
nts
the
disc
ount
rang
e ap
plie
d to
IDA/
AD
F lo
an p
ortfo
lio w
hich
com
pris
es a
ppro
xim
atel
y 6
per c
ent o
f thi
s ba
lanc
e. N
o di
scou
nt ra
te is
pro
vide
d fo
r HE
LP
loan
s an
d ot
her l
evel
3 re
ceiv
able
s as
the
disc
ount
rate
s ar
e dr
awn
from
obs
erva
ble
inpu
ts.
(f)
Due
to th
e di
vers
e na
ture
of t
he fu
nd’s
inve
stm
ents
, it i
s no
t pos
sibl
e to
pro
vide
a ra
nge
of in
puts
. (g
) R
epre
sent
s th
e ra
nge
of c
ash
flow
gro
wth
and
cos
t of c
apita
l use
d by
the
Dep
artm
ent o
f Fin
ance
in d
eter
min
ing
the
fair
valu
e un
der t
his
valu
atio
n te
chni
que.
(h
) R
epre
sent
s th
e ra
nge
of c
onsu
med
eco
nom
ic b
enef
it pe
r ann
um u
sed
in d
eter
min
ing
the
fair
valu
e fo
r the
Dep
artm
ent o
f Def
ence
, the
Dep
artm
ent o
f Par
liam
enta
ry
Ser
vice
s, t
he D
epar
tmen
t of
Im
mig
ratio
n an
d B
orde
r P
rote
ctio
n an
d th
e C
omm
onw
ealth
Sci
entif
ic a
nd I
ndus
trial
Res
earc
h O
rgan
isat
ion
whi
ch c
ompr
ise
appr
oxim
atel
y 72
per
cen
t of t
his
bala
nce.
(i)
R
epre
sent
s th
e ra
nge
of c
apita
lisat
ion
rate
s us
ed i
n de
term
inin
g th
e fa
ir va
lue
for
the
Atto
rney
Gen
eral
's D
epar
tmen
t, G
rain
s R
esea
rch
and
Dev
elop
men
t C
orpo
ratio
n an
d th
e S
peci
al B
road
cast
ing
Ser
vice
whi
ch c
ompr
ises
100
per
cen
t of t
his
bala
nce.

Notes to the financial statements
115
(j)
Rep
rese
nts
the
rang
e of
con
sum
ed e
cono
mic
ben
efit
per a
nnum
use
d in
det
erm
inin
g th
e fa
ir va
lue
for t
he D
epar
tmen
t of D
efen
ce,
NBN
Co,
Aus
tralia
n R
ail T
rack
C
orpo
ratio
n Lt
d an
d A
irser
vice
s Au
stra
lia w
hich
com
pris
e ap
prox
imat
ely
75 p
er c
ent o
f thi
s ba
lanc
e.
(k)
Rep
rese
nts
the
rang
e of
con
sum
ed e
cono
mic
ben
efit
per a
nnum
use
d in
det
erm
inin
g th
e fa
ir va
lue
for t
he A
ustra
lian
War
Mem
oria
l, th
e N
atio
nal L
ibra
ry o
f Aus
tralia
, th
e D
epar
tmen
t of
Inf
rast
ruct
ure
and
Reg
iona
l Dev
elop
men
t an
d th
e A
ustra
lian
Nat
iona
l Mar
itim
e M
useu
m w
hich
com
pris
es a
ppro
xim
atel
y 72
per
cen
t of
thi
s ba
lanc
e.
(l)
Rep
rese
nts
the
disc
ount
rang
e ap
plie
d to
IDA/
AD
F lo
an p
ortfo
lio w
hich
com
pris
es a
ppro
xim
atel
y 99
per
cen
t of t
his
bala
nce.

Notes to the financial statements
116
Recurring and non-recurring Level 3 fair value measurements - valuation processes Financial assets
The fair value of the Higher Education Loan Programme (HELP) receivable that makes up 91 per cent of the Level 3 receivables balance is calculated each year by actuarial assessment. The two main measures impacting on the calculation of the HELP asset are the face value of the debt not expected to be repaid and the fair value of the remaining receivable, calculated as the present value of projected future cash flows.
The fair value of the IDA and ADF receivables that comprise six per cent of the level 3 receivables balance has been determined on a basis consistent with previous years, using professional valuation advice.
Investments in public corporations that have been valued using a discounted net cash flow technique are assumed to be a cash generating unit. Cash flow projections for a forecast period and terminal year are based on management corporate plans and have been discounted using a Weighted Average Cost of Capital. Weighted Average Cost of Capital is calculated based on a number of inputs derived from either professional judgement or observable historical market data of comparable entities.
Investments categorised as level 3 are valued using the net assets as the inputs have been based on either the latest available audited accounts of those entities or internal management accounts because this is the most relevant available information at the end of the period. Collective investments vehicles, which comprise a significant proportion of the investments valued with this technique, are pooled investments with a variety of underlying assets. The diverse nature of these investments results in them being classified as level 3. The valuation techniques used by the investment managers are consistent with the overall accounting policy.
Level 3 investments that have been valued using market approach are based on the share value of the relevant institution.
Non-financial assets
Government agencies engage professional valuers to undertake comprehensive valuations of these classes of non-financial assets as specified in their respective accounting policy notes. Valuations are conducted with sufficient frequency to ensure that the carrying amounts of assets do not differ materially from the assets’ fair values as at the reporting date. The regularity of independent valuations depends upon the volatility of movements in market values for the relevant assets. Professional valuers were engaged as required to provide assurance that the models developed comply with requirements of AASB 13.
Non-financial assets valued using the market approach utilise market transactions of similar assets to determine fair value. Due to the sensitive nature of the assets within

Notes to the financial statements
117
this class, precise location or details have not been disclosed. Fair value measurements have been developed based on analysed prices in the assets’ general locality. The values are based on sales evidence and applied using professional judgement.
Non-financial assets that do not transact with enough frequency and transparency to develop objective opinions of value from observable market evidence have been valued utilising the Depreciated Replacement Cost (DRC) approach. Under the DRC approach, the estimated cost to replace the asset has been calculated and then adjusted to take into account obsolescence (accumulated depreciation). The obsolescence has been determined based on professional judgement regarding physical, economic and external obsolescence factors relevant to the asset under consideration.
Financial liabilities
Financial liabilities categorised as Level 3 have had their fair value determined using market interest rates and valuation techniques that incorporate discounted cash flows. They have been classified Level 3 because they have either complex interest rate formulas that include foreign exchange rates, a variety of discount rates, use the Nikkei index or they have knockout or callable features.
Recurring Level 3 fair value measurements - sensitivity of inputs Receivables – Repayment patterns, debt expected to not be repaid, future CPI growth and discount rate
Significant unobservable inputs used in the fair value measurement of receivables are the repayment pattern, debt expected to not be repaid, future CPI growth and the discount rate. A significant increase (or decrease) in these inputs or adjustments would result in significantly lower (or higher) fair value measurements.
Investments in public corporations – cash flow growth and weighted average cost of capital
Significant unobservable inputs used in the fair value measurement of investments in public corporations are the cash flow growth and the weighted average cost of capital. A significant increase (or decrease) in these inputs or adjustments would result in significantly lower (or higher) fair value measurements.
Buildings, plant, equipment and infrastructure, and heritage and cultural assets – consumed economic benefit
A significant unobservable input used in the fair value measurement of these classes of assets is consumed economic benefit. A significant increase (or decrease) in the input or adjustments would result in significantly lower (or higher) fair value measurements.

Notes to the financial statements
118
Buildings – capitalisation rate
A significant unobservable input used in the fair value measurement of this class of assets is the capitalisation rate. A significant increase (or decrease) in the input or adjustments would result in significantly lower (or higher) fair value measurements.
Payables – discount rate
A significant unobservable input used in the fair value measurement of payables is the discount rate. A significant increase (or decrease) in the input or adjustments would result in significantly lower (or higher) fair value measurements.
Recurring Level 3 fair value measurements - sensitivity analysis for financial assets and liabilities Changing significant unobservable inputs to the level 3 hierarchy valuations of financial assets and liabilities held at fair value to reasonably possible alternate assumptions would not significantly change amounts recognised in net cost of service or other comprehensive income.
Further details around the sensitivity in regards to the market risks associated with financial assets and liabilities can be found in Note 37 Financial Instruments.

Notes to the financial statements
119
(d)
Rec
onci
liatio
n fo
r rec
urri
ng le
vel 3
fair
val
ue m
easu
rem
ents
The
follo
win
g ta
bles
pro
vide
reco
ncili
atio
ns fo
r the
mov
emen
t in
bala
nces
for a
sset
s an
d lia
bilit
ies
clas
sifie
d as
leve
l 3.
Aust
ralia
n G
over
nmen
t
Rec
eiva
bles
Inte
rnat
iona
l M
onet
ary
Fund
quo
ta
Col
lect
ive
inve
stm
ent
vehi
cles
Oth
er in
tere
st
bear
ing
secu
ritie
sO
ther
Inve
stm
ents
-Sh
ares
Inve
stm
ent i
n pu
blic
co
rpor
atio
ns
Equi
ty
acco
unte
d in
vest
men
tsTo
tal
2014
2014
2014
2014
2014
2014
2014
2014
2014
$m$m
$m$m
$m$m
$m$m
$mFi
nanc
ial a
sset
s at
fair
valu
eO
peni
ng b
alan
ce24
,767
5,24
728
,954
3,99
473
71,
553
-19
265
,444
Purc
hase
s / P
aym
ents
6,51
1-
8,03
41,
847
181
187
-23
16,7
83Sa
les
/ Rep
aym
ents
(2,0
05)
-(7
,718
)(1
,651
)(1
74)
(217
)-
(5)
(11,
770)
Gai
ns a
nd lo
sses
reco
gnis
ed in
pro
fit o
r los
s(9
22)
59-
-19
21-
-(8
23)
Gai
ns a
nd lo
sses
reco
gnis
ed in
equ
ity(1
64)
-2,
750
152,
092
9-
-4,
702
Tran
sfer
s in
/ (o
ut) o
f lev
el 3
(604
)-
-(1
51)
-(8
6)-
-(8
41)
Clos
ing
bala
nce
27,5
835,
306
32,0
204,
054
2,85
51,
467
-21
073
,495
Recu
rrin
g Le
vel 3
fair
valu
e m
easu
rem
ents
- re
conc
iliat
ion
for a
sset
s
Fina
ncia
l Ass
ets
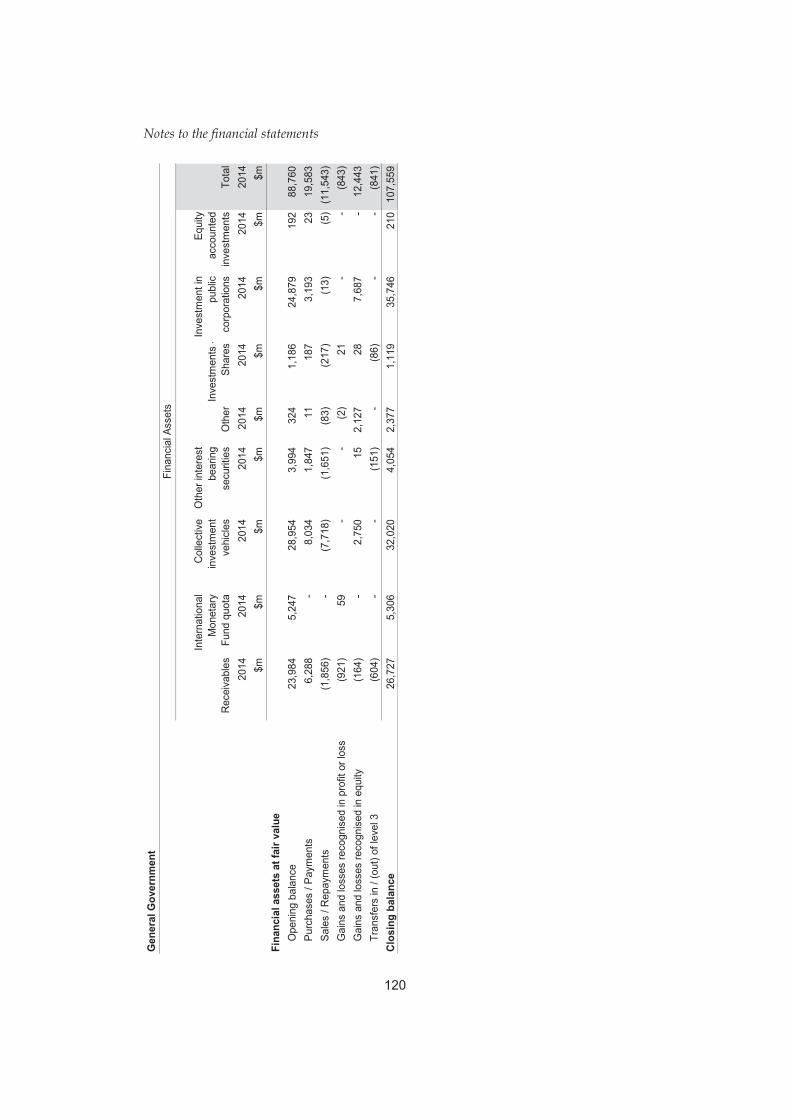
Notes to the financial statements
120
Gen
eral
Gov
ernm
ent
Rec
eiva
bles
Inte
rnat
iona
l M
onet
ary
Fund
quo
ta
Col
lect
ive
inve
stm
ent
vehi
cles
Oth
er in
tere
st
bear
ing
secu
ritie
sO
ther
Inve
stm
ents
-Sh
ares
Inve
stm
ent i
n pu
blic
co
rpor
atio
ns
Equi
ty
acco
unte
d in
vest
men
tsTo
tal
2014
2014
2014
2014
2014
2014
2014
2014
2014
$m$m
$m$m
$m$m
$m$m
$mFi
nanc
ial a
sset
s at
fair
valu
eO
peni
ng b
alan
ce23
,984
5,24
728
,954
3,99
432
41,
186
24,8
7919
288
,760
Purc
hase
s / P
aym
ents
6,28
8-
8,03
41,
847
1118
73,
193
2319
,583
Sale
s / R
epay
men
ts(1
,856
)-
(7,7
18)
(1,6
51)
(83)
(217
)(1
3)(5
)(1
1,54
3)G
ains
and
loss
es re
cogn
ised
in p
rofit
or l
oss
(921
)59
--
(2)
21-
-(8
43)
Gai
ns a
nd lo
sses
reco
gnis
ed in
equ
ity(1
64)
-2,
750
152,
127
287,
687
-12
,443
Tran
sfer
s in
/ (o
ut) o
f lev
el 3
(604
)-
-(1
51)
-(8
6)-
-(8
41)
Clos
ing
bala
nce
26,7
275,
306
32,0
204,
054
2,37
71,
119
35,7
4621
010
7,55
9
Fina
ncia
l Ass
ets

Notes to the financial statements
121
Australian Government
Land Buildings
Plant, equipment and
infrastructureHeritage and
cultural assets Total2014 2014 2014 2014 2014
$m $m $m $m $mFinancial assets at fair value
Opening balance 1,014 21,357 19,938 2,476 44,785Purchases / Payments 1 2,720 4,266 28 7,015Sales / Repayments (1) (23) (54) - (78)Gains and losses recognised in profit or loss (2) (1,400) (1,658) (21) (3,081)Gains and losses recognised in equity (12) 237 305 179 709Transfers in / (out) of level 3 4 25 276 2 307
Closing balance 1,004 22,916 23,073 2,664 49,657
Non-Financial Assets
General Government
Land Buildings
Plant, equipment and
infrastructureHeritage and
cultural assets Total2014 2014 2014 2014 2014
$m $m $m $m $mFinancial assets at fair value
Opening balance 806 20,230 10,960 2,476 34,472Purchases / Payments 1 2,576 1,424 28 4,029Sales / Repayments (1) (16) (48) - (65)Gains and losses recognised in profit or loss (1) (1,330) (1,080) (21) (2,432)Gains and losses recognised in equity (12) 209 326 179 702Transfers in / (out) of level 3 (1) 8 336 2 345
Closing balance 792 21,677 11,918 2,664 37,051
Non-Financial Assets

Notes to the financial statements
122
Australian Government
Loans Other debt Payables Total2014 2014 2014 2014
$m $m $m $mFinancial liabilities at fair value
Opening balance 380 7 32 419Purchases / Payments - - 749 749Sales / Repayments (146) 8 (344) (482)Gains and losses recognised in profit or loss (2) (3) (144) (149)Gains and losses recognised in equity (8) - - (8)Transfers in / (out) of level 3 - - 1,390 1,390
Closing balance 224 12 1,683 1,919
Financial liabilities
General Government
Loans Other debt Payables Total2014 2014 2014 2014
$m $m $m $mFinancial liabilities at fair value
Opening balance - - - -Purchases / Payments - - 749 749Sales / Repayments - 8 (344) (336)Gains and losses recognised in profit or loss - - (136) (136)Gains and losses recognised in equity - - - -Transfers in / (out) of level 3 - - 1,390 1,390
Closing balance - 8 1,659 1,667
Financial liabilities

Notes to the financial statements
123
Note 18: Advances paid and receivables
2014 2013 2014 2013$m $m $m $m
Advances paidLoans to State and Territory governments 2,502 2,486 2,502 2,486Higher Education Loan Programme 25,147 21,593 25,147 21,593Student Financial Supplement Scheme 604 677 604 677Other 6,015 4,641 6,810 5,349less Provision for doubtful debts (228) (24) (229) (30)
Total advances paid 34,040 29,373 34,834 30,075Other receivables
Goods and services receivable 817 781 1,827 1,807Recoveries of benefit payments 3,635 3,261 3,635 3,261Taxes receivable 37,972 35,533 37,967 35,521Other financial assets 55 189 300 493Other 6,890 8,005 5,823 7,662less Provision for doubtful debts - Goods
and services and other (1,958) (1,772) (1,978) (1,788)less Provision for doubtful debts - Personal
benefits receivable (675) (667) (675) (667)less Provision for doubtful debts - Taxes
receivable (14,685) (12,269) (14,685) (12,269)less Provision for credit amendments (2,538) (2,773) (2,538) (2,773)
Total other receivables 29,513 30,288 29,676 31,247Accrued revenue
Accrued taxation revenue 12,775 10,942 12,775 10,942Other accrued revenue 341 396 482 545
Total accrued revenue 13,116 11,338 13,257 11,487Other receivables and accrued revenue 42,629 41,626 42,933 42,734Total advances paid and receivables 76,669 70,999 77,767 72,809
Advances paid and receivables maturity scheduleNot later than one year 36,722 36,821 36,965 38,066Later than one year and not later than two years 29,272 26,025 29,371 26,096Later than two years and not later than five years 1,464 1,144 2,007 1,620Later than five years 9,211 7,009 9,424 7,027
Total advances paid and receivables by maturity 76,669 70,999 77,767 72,809
General Government Australian Government

Notes to the financial statements
124
Reconciliation of the allowance for doubtful debts(a) Movements in relation to 2014 Australian Government Advances Goods and Other Total
and loans Services$m $m $m $m
Opening doubtful debts balance (30) (104) (1,682) (1,816)less Amounts written off (5) (52) (2) (59)less Amounts recovered and reversed - (11) (24) (35)plus Increase/decrease recognised in net surplus (5) (80) (118) (203)plus Other movement (199) (46) (37) (282)Total (229) (167) (1,811) (2,207) General Government Advances Goods and Other Total
and loans Services$m $m $m $m
Opening doubtful debts balance (24) (88) (1,682) (1,794)less Amounts written off (5) (50) (2) (57)less Amounts recovered and reversed - (9) (24) (33)plus Increase/decrease recognised in net surplus (4) (73) (118) (195)plus Other movement (205) (46) (36) (287)Total (228) (148) (1,810) (2,186) Movements in relation to 2013 Australian Government Advances Goods and Other Total
and loans Services$m $m $m $m
Opening doubtful debts balance (31) (187) (1,727) (1,945)less Amounts written off (2) (47) (28) (77)less Amounts recovered and reversed - (7) - (7)plus Increase/decrease recognised in net surplus 6 (26) 1 (19)plus Other movement (7) 55 16 64Total (30) (104) (1,682) (1,816) General Government Advances Goods and Other Total
and loans Services$m $m $m $m
Opening doubtful debts balance (25) (171) (1,727) (1,923)less Amounts written off (2) (44) (26) (72)less Amounts recovered and reversed - (6) - (6)plus Increase/decrease recognised in net surplus 6 (22) 1 (15)plus Other movement (7) 55 18 66Total (24) (88) (1,682) (1,794) (a) Excludes statutory receivables such as taxes receivable and personal benefits recoverable.

Notes to the financial statements
125
Note 19: Investments, loans and placements
2014 2013 2014 2013$m $m $m $m
Gold - - 3,584 3,299Deposits 30,866 23,342 6,512 5,829Government securities 233 233 125,620 86,968Residential mortgage-backed securities(a) 6,060 9,113 6,060 9,113Debentures - - 859 782International Monetary Fund quota 5,306 5,247 9,995 9,992Defined benefit superannuation plan assets - - 81 -Collective investment vehicles 32,293 29,498 32,293 29,498Other interest bearing securities 31,550 31,373 31,550 31,373Other 11,303 12,291 13,222 14,446Total investments, loans and placements 117,611 111,097 229,776 191,300
General Government Australian Government
(a) Investments in residential mortgage-backed securities are to support competition in the residential
mortgage market and to meet government policy objectives. Residential mortgage-backed securities held for investment purposes are classified elsewhere.

Notes to the financial statements
126
Note 20: Equity investments
2014 2013 2014 2013$m $m $m $m
Investments - Shares 39,296 33,661 39,933 34,401Investment in public corporations 35,745 24,879 - -Equity accounted investments 535 493 544 504Total equity investments 75,576 59,033 40,477 34,905
General Government Australian Government
Note 21: Land and buildings, plant, equipment and infrastructure, heritage and cultural assets and investment properties
2014 2013 2014 2013$m $m $m $m
LAND AND BUILDINGSLand
Land - at cost 89 90 333 338Land - at valuation(a) 9,242 8,827 9,513 9,102
Total land 9,331 8,917 9,846 9,440Buildings
Buildings - at cost 3,540 3,040 5,206 4,442Accumulated depreciation (26) (28) (737) (677)
3,514 3,012 4,469 3,765Buildings - at valuation(a) 24,311 23,562 26,352 25,379Accumulated depreciation (3,102) (3,074) (3,440) (3,402)
21,209 20,488 22,912 21,977Total buildings 24,723 23,500 27,381 25,742Total land and buildings 34,054 32,417 37,227 35,182PLANT, EQUIPMENT AND INFRASTRUCTURESpecialist military equipment
Specialist military equipment - at cost 77,387 75,820 77,387 75,820Accumulated depreciation (36,144) (35,532) (36,144) (35,532)
Total specialist military equipment 41,243 40,288 41,243 40,288Other plant, equipment and infrastructure
Other plant, equipment and infrastructure - at cost 1,569 1,425 11,016 7,827Accumulated depreciation (35) (79) (1,879) (1,613)
1,534 1,346 9,137 6,214Other plant, equipment and infrastructure - at
valuation(a) 14,696 14,338 19,104 18,091Accumulated depreciation (3,179) (3,074) (3,301) (3,218)
11,517 11,264 15,803 14,873Total other plant, equipment and infrastructure 13,051 12,610 24,940 21,087Total plant, equipment and infrastructure 54,294 52,898 66,183 61,375
General Government Australian Government
(a) Refer Note 1.15 for details regarding the valuation methodologies adopted. The reporting periods in
which these assets were revalued are detailed in Note 21, Table D.
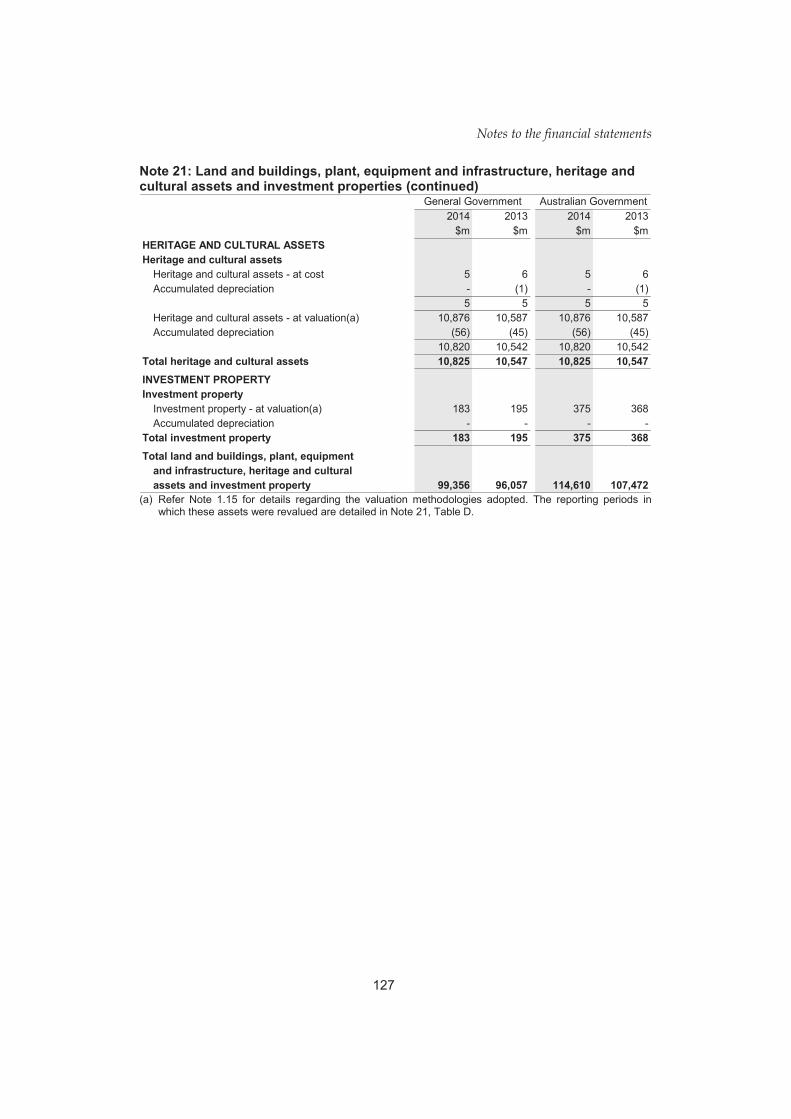
Notes to the financial statements
127
Note 21: Land and buildings, plant, equipment and infrastructure, heritage and cultural assets and investment properties (continued)
2014 2013 2014 2013$m $m $m $m
HERITAGE AND CULTURAL ASSETSHeritage and cultural assets
Heritage and cultural assets - at cost 5 6 5 6Accumulated depreciation - (1) - (1)
5 5 5 5Heritage and cultural assets - at valuation(a) 10,876 10,587 10,876 10,587Accumulated depreciation (56) (45) (56) (45)
10,820 10,542 10,820 10,542Total heritage and cultural assets 10,825 10,547 10,825 10,547INVESTMENT PROPERTYInvestment property
Investment property - at valuation(a) 183 195 375 368Accumulated depreciation - - - -
Total investment property 183 195 375 368Total land and buildings, plant, equipment
and infrastructure, heritage and cultural assets and investment property 99,356 96,057 114,610 107,472
General Government Australian Government
(a) Refer Note 1.15 for details regarding the valuation methodologies adopted. The reporting periods in
which these assets were revalued are detailed in Note 21, Table D.

Notes to the financial statements
128
Not
e 21
: Lan
d an
d bu
ildin
gs, p
lant
, equ
ipm
ent a
nd in
fras
truc
ture
, her
itage
and
cul
tura
l ass
ets
and
inve
stm
ent p
rope
rtie
s (c
ontin
ued)
A
: Rec
onci
liatio
n of
mov
emen
t in
land
and
bui
ldin
gs, p
lant
, equ
ipm
ent a
nd in
frast
ruct
ure,
her
itage
and
cul
tura
l ass
ets
and
inve
stm
ent
prop
ertie
s(a)
Aus
tralia
n G
over
nmen
tH
erita
geTo
tal l
and
Spe
cial
ist
Oth
er p
lant
,To
tal p
lant
,an
dan
d m
ilita
ryeq
uipm
ent a
ndeq
uipm
ent a
ndcu
ltura
lIn
vest
men
tLa
ndB
uild
ings
bui
ldin
gs e
quip
men
tin
frast
ruct
ure
infra
stru
ctur
eas
sets
prop
erty
Tota
lIte
m$m
$m$m
$m$m
$m$m
$m$m
As a
t 1 J
uly
2013
Gro
ss b
ook
valu
e9,
440
29,8
2139
,261
75,8
2025
,918
101,
738
10,5
9337
515
1,96
7A
ccum
ulat
ed d
epre
ciat
ion
-(4
,079
)(4
,079
)(3
5,53
2)(4
,831
)(4
0,36
3)(4
6)(7
)(4
4,49
5)N
et b
ook
valu
e9,
440
25,7
4235
,182
40,2
8821
,087
61,3
7510
,547
368
107,
472
Add
ition
s:P
urch
ase
of n
ew o
r sec
ondh
and
asse
ts28
2,62
02,
648
4,30
93,
656
7,96
577
210
,692
Acq
uisi
tion
by fi
nanc
e le
ase
251
351
5-
2,14
72,
147
--
2,66
2R
eval
uatio
ns: w
rite-
ups
480
232
712
-18
618
623
916
1,15
3R
ecla
ssifi
catio
n(4
4)(5
4)(9
8)(7
4)11
339
65
(48)
Dep
reci
atio
n/am
ortis
atio
n ex
pens
e-
(1,5
84)
(1,5
84)
(2,5
39)
(2,1
41)
(4,6
80)
(51)
-(6
,315
)R
ecov
erab
le a
mou
nt w
rite-
dow
ns(2
)(1
23)
(125
)(4
69)
(63)
(532
)(6
)-
(663
)R
ever
sal o
f writ
e-do
wns
--
-16
218
--
18O
ther
mov
emen
ts(2
3)46
23(2
63)
27(2
36)
15-
(198
)D
ispo
sals
(35)
(11)
(46)
(25)
(74)
(99)
(2)
(16)
(163
)As
at 3
0 Ju
ne 2
014
9,84
627
,381
37,2
2741
,243
24,9
4066
,183
10,8
2537
511
4,61
0G
ross
boo
k va
lue
9,84
631
,558
41,4
0477
,387
30,1
2010
7,50
710
,881
375
160,
167
Acc
umul
ated
dep
reci
atio
n-
(4,1
77)
(4,1
77)
(36,
144)
(5,1
80)
(41,
324)
(56)
-(4
5,55
7)N
et b
ook
valu
e9,
846
27,3
8137
,227
41,2
4324
,940
66,1
8310
,825
375
114,
610
(a
) Th
is ta
ble
is in
clus
ive
of a
mou
nts
deta
iled
in T
able
s B,
C a
nd D
bel
ow.

Notes to the financial statements
129
Not
e 21
: Lan
d an
d bu
ildin
gs, p
lant
, equ
ipm
ent a
nd in
fras
truc
ture
, her
itage
and
cul
tura
l ass
ets
and
inve
stm
ent p
rope
rtie
s (c
ontin
ued)
A
: Rec
onci
liatio
n of
mov
emen
t in
land
and
bui
ldin
gs, p
lant
, equ
ipm
ent a
nd in
frast
ruct
ure,
her
itage
and
cul
tura
l ass
ets
and
inve
stm
ent
prop
ertie
s(a) (c
ontin
ued)
A
ustra
lian
Gov
ernm
ent
Her
itage
Tota
l lan
dS
peci
alis
tO
ther
pla
nt,
Tota
l pla
nt,
and
and
mili
tary
equi
pmen
t and
equi
pmen
t and
cultu
ral
Inve
stm
ent
Land
Bui
ldin
gs b
uild
ings
equ
ipm
ent
infra
stru
ctur
e in
frast
ruct
ure
asse
tspr
oper
tyTo
tal
Item
$m$m
$m$m
$m$m
$m$m
$mAs
at 1
Jul
y 20
12G
ross
boo
k va
lue
9,15
529
,574
38,7
2974
,915
24,3
6299
,277
10,5
0137
714
8,88
4A
ccum
ulat
ed d
epre
ciat
ion
-(4
,129
)(4
,129
)(3
4,58
7)(5
,703
)(4
0,29
0)(6
8)-
(44,
487)
Net
boo
k va
lue
9,15
525
,445
34,6
0040
,328
18,6
5958
,987
10,4
3337
710
4,39
7A
dditi
ons:
Pur
chas
e of
new
or s
econ
dhan
das
sets
361,
887
1,92
33,
032
3,42
06,
452
7115
8,46
1A
cqui
sitio
n by
fina
nce
leas
e-
283
283
-1,
105
1,10
5-
-1,
388
Ent
ity a
cqui
sitio
ns48
7212
0-
113
113
--
233
Rev
alua
tions
: writ
e-up
s29
545
340
-22
622
672
1265
0R
ecla
ssifi
catio
n(6
9)(3
97)
(466
)(9
9)25
015
1-
5(3
10)
Dep
reci
atio
n/am
ortis
atio
n ex
pens
e-
(1,4
92)
(1,4
92)
(2,6
89)
(1,9
64)
(4,6
53)
(50)
-(6
,195
)R
ecov
erab
le a
mou
nt w
rite-
dow
ns(1
7)(1
51)
(168
)(3
15)
(537
)(8
52)
(4)
(3)
(1,0
27)
Rev
ersa
l of w
rite-
dow
ns-
--
7(2
)5
--
5O
ther
mov
emen
ts3
5053
25(1
23)
(98)
258
(12)
Dis
posa
ls(1
1)-
(11)
(1)
(60)
(61)
-(4
6)(1
18)
As a
t 30
June
201
39,
440
25,7
4235
,182
40,2
8821
,087
61,3
7510
,547
368
107,
472
Gro
ss b
ook
valu
e9,
440
29,8
2139
,261
75,8
2025
,918
101,
738
10,5
9337
515
1,96
7A
ccum
ulat
ed d
epre
ciat
ion
-(4
,079
)(4
,079
)(3
5,53
2)(4
,831
)(4
0,36
3)(4
6)(7
)(4
4,49
5)N
et b
ook
valu
e9,
440
25,7
4235
,182
40,2
8821
,087
61,3
7510
,547
368
107,
472
(a
) Th
is ta
ble
is in
clus
ive
of a
mou
nts
deta
iled
in T
able
s B,
C a
nd D
bel
ow.

Notes to the financial statements
130
Not
e 21
: Lan
d an
d bu
ildin
gs, p
lant
, equ
ipm
ent a
nd in
fras
truc
ture
, her
itage
and
cul
tura
l ass
ets
and
inve
stm
ent p
rope
rtie
s (c
ontin
ued)
A
: Rec
onci
liatio
n of
mov
emen
t in
land
and
bui
ldin
gs, p
lant
, equ
ipm
ent a
nd in
frast
ruct
ure,
her
itage
and
cul
tura
l ass
ets
and
inve
stm
ent
prop
ertie
s(a) (c
ontin
ued)
G
ener
al G
over
nmen
tH
erita
geTo
tal l
and
Spe
cial
ist
Oth
er p
lant
,To
tal p
lant
,an
dan
d m
ilita
ryeq
uipm
ent a
ndeq
uipm
ent a
ndcu
ltura
lIn
vest
men
tLa
ndB
uild
ings
bui
ldin
gs e
quip
men
tin
frast
ruct
ure
infra
stru
ctur
eas
sets
prop
erty
Tota
lIte
m$m
$m$m
$m$m
$m$m
$m$m
As a
t 1 J
uly
2013
Gro
ss b
ook
valu
e8,
917
26,6
0235
,519
75,8
2015
,763
91,5
8310
,593
195
137,
890
Acc
umul
ated
dep
reci
atio
n-
(3,1
02)
(3,1
02)
(35,
532)
(3,1
53)
(38,
685)
(46)
-(4
1,83
3)N
et b
ook
valu
e8,
917
23,5
0032
,417
40,2
8812
,610
52,8
9810
,547
195
96,0
57A
dditi
ons:
Pur
chas
e of
new
or s
econ
dhan
das
sets
212,
247
2,26
84,
309
1,54
55,
854
772
8,20
1Ac
quis
ition
by
finan
ce le
ase
251
351
5-
7171
--
586
Rev
alua
tions
: writ
e-up
s47
912
260
1-
214
214
239
21,
056
Rec
lass
ifica
tion
(34)
(72)
(106
)(7
4)12
955
6-
(45)
Dep
reci
atio
n/am
ortis
atio
n ex
pens
e-
(1,4
74)
(1,4
74)
(2,5
40)
(1,4
33)
(3,9
73)
(51)
-(5
,498
)R
ecov
erab
le a
mou
nt w
rite-
dow
ns-
(116
)(1
16)
(469
)(4
0)(5
09)
(6)
-(6
31)
Rev
ersa
l of w
rite-
dow
ns-
--
16-
16-
-16
Oth
er m
ovem
ents
(23)
4219
(262
)8
(254
)15
-(2
20)
Dis
posa
ls(3
1)(3
9)(7
0)(2
5)(5
3)(7
8)(2
)(1
6)(1
66)
As a
t 30
June
201
49,
331
24,7
2334
,054
41,2
4313
,051
54,2
9410
,825
183
99,3
56G
ross
boo
k va
lue
9,33
127
,851
37,1
8277
,387
16,2
6593
,652
10,8
8118
314
1,89
8A
ccum
ulat
ed d
epre
ciat
ion
-(3
,128
)(3
,128
)(3
6,14
4)(3
,214
)(3
9,35
8)(5
6)-
(42,
542)
Net
boo
k va
lue
9,33
124
,723
34,0
5441
,243
13,0
5154
,294
10,8
2518
399
,356
(a
) Th
is ta
ble
is in
clus
ive
of a
mou
nts
deta
iled
in T
able
s B,
C a
nd D
bel
ow.

Notes to the financial statements
131
Not
e 21
: Lan
d an
d bu
ildin
gs, p
lant
, equ
ipm
ent a
nd in
fras
truc
ture
, her
itage
and
cul
tura
l ass
ets
and
inve
stm
ent p
rope
rtie
s (c
ontin
ued)
A
: Rec
onci
liatio
n of
mov
emen
t in
land
and
bui
ldin
gs, p
lant
, equ
ipm
ent a
nd in
frast
ruct
ure,
her
itage
and
cul
tura
l ass
ets
and
inve
stm
ent
prop
ertie
s(a) (c
ontin
ued)
G
ener
al G
over
nmen
tH
erita
geTo
tal l
and
Spe
cial
ist
Oth
er p
lant
,To
tal p
lant
,an
dan
d m
ilita
ryeq
uipm
ent a
ndeq
uipm
ent a
ndcu
ltura
lIn
vest
men
tLa
ndB
uild
ings
bui
ldin
gs e
quip
men
tin
frast
ruct
ure
infra
stru
ctur
eas
sets
prop
erty
Tota
lIte
m$m
$m$m
$m$m
$m$m
$m$m
As a
t 1 J
uly
2012
Gro
ss b
ook
valu
e8,
649
26,5
5135
,200
74,9
1515
,529
90,4
4410
,501
181
136,
326
Acc
umul
ated
dep
reci
atio
n-
(3,2
19)
(3,2
19)
(34,
587)
(2,9
95)
(37,
582)
(68)
-(4
0,86
9)N
et b
ook
valu
e8,
649
23,3
3231
,981
40,3
2812
,534
52,8
6210
,433
181
95,4
57A
dditi
ons:
Pur
chas
e of
new
or s
econ
dhan
das
sets
361,
611
1,64
73,
032
1,41
14,
443
7115
6,17
6Ac
quis
ition
by
finan
ce le
ase
-28
328
3-
3131
--
314
Rev
alua
tions
: writ
e-up
s29
911
541
4-
7979
72-
565
Rec
lass
ifica
tion
(56)
(354
)(4
10)
(99)
263
164
--
(246
)D
epre
ciat
ion/
amor
tisat
ion
expe
nse
-(1
,407
)(1
,407
)(2
,689
)(1
,487
)(4
,176
)(5
0)-
(5,6
33)
Rec
over
able
am
ount
writ
e-do
wns
(1)
(113
)(1
14)
(315
)(4
0)(3
55)
(4)
(3)
(476
)R
ever
sal o
f writ
e-do
wns
--
-7
(2)
5-
-5
Oth
er m
ovem
ents
147
4825
(130
)(1
05)
258
(24)
Dis
posa
ls(1
1)(1
4)(2
5)(1
)(4
9)(5
0)-
(6)
(81)
As a
t 30
June
201
38,
917
23,5
0032
,417
40,2
8812
,610
52,8
9810
,547
195
96,0
57G
ross
boo
k va
lue
8,91
726
,602
35,5
1975
,820
15,7
6391
,583
10,5
9319
513
7,89
0A
ccum
ulat
ed d
epre
ciat
ion
-(3
,102
)(3
,102
)(3
5,53
2)(3
,153
)(3
8,68
5)(4
6)-
(41,
833)
Net
boo
k va
lue
8,91
723
,500
32,4
1740
,288
12,6
1052
,898
10,5
4719
596
,057
(a
) Th
is ta
ble
is in
clus
ive
of a
mou
nts
deta
iled
in T
able
s B,
C a
nd D
bel
ow.

Notes to the financial statements
132
Not
e 21
: Lan
d an
d bu
ildin
gs, p
lant
, equ
ipm
ent a
nd in
fras
truc
ture
, her
itage
and
cul
tura
l ass
ets
and
inve
stm
ent p
rope
rtie
s (c
ontin
ued)
B
: Ass
ets
held
und
er fi
nanc
e le
ase
Aus
tralia
n G
over
nmen
tH
erita
geTo
tal l
and
Spe
cial
ist
Oth
er p
lant
,To
tal p
lant
,an
dan
d m
ilita
ryeq
uipm
ent a
ndeq
uipm
ent a
ndcu
ltura
lIn
vest
men
tLa
ndB
uild
ings
bui
ldin
gs e
quip
men
tin
frast
ruct
ure
infra
stru
ctur
eas
sets
prop
erty
Tota
lIte
m$m
$m$m
$m$m
$m$m
$m$m
As a
t 30
June
201
4G
ross
val
ue88
1,51
51,
603
-24
924
9-
-1,
852
Acc
umul
ated
dep
reci
atio
n/am
ortis
atio
n-
(104
)(1
04)
-(1
2)(1
2)-
-(1
16)
Net
boo
k va
lue
881,
411
1,49
9-
237
237
--
1,73
6As
at 3
0 Ju
ne 2
013
Gro
ss v
alue
891,
116
1,20
5-
1,51
41,
514
--
2,71
9A
ccum
ulat
ed d
epre
ciat
ion/
amor
tisat
ion
-(8
7)(8
7)-
(52)
(52)
--
(139
)N
et b
ook
valu
e89
1,02
91,
118
-1,
462
1,46
2-
-2,
580
G
ener
al G
over
nmen
tH
erita
geTo
tal l
and
Spe
cial
ist
Oth
er p
lant
,To
tal p
lant
,an
dan
d m
ilita
ryeq
uipm
ent a
ndeq
uipm
ent a
ndcu
ltura
lIn
vest
men
tLa
ndB
uild
ings
bui
ldin
gs e
quip
men
tin
frast
ruct
ure
infra
stru
ctur
eas
sets
prop
erty
Tota
lIte
m$m
$m$m
$m$m
$m$m
$m$m
As a
t 30
June
201
4G
ross
val
ue88
1,51
51,
603
-23
023
0-
-1,
833
Acc
umul
ated
dep
reci
atio
n/am
ortis
atio
n-
(104
)(1
04)
-(1
2)(1
2)-
-(1
16)
Net
boo
k va
lue
881,
411
1,49
9-
218
218
--
1,71
7As
at 3
0 Ju
ne 2
013
Gro
ss v
alue
891,
089
1,17
8-
201
201
--
1,37
9A
ccum
ulat
ed d
epre
ciat
ion/
amor
tisat
ion
-(8
4)(8
4)-
(20)
(20)
--
(104
)N
et b
ook
valu
e89
1,00
51,
094
-18
118
1-
-1,
275

Notes to the financial statements
133
Not
e 21
: Lan
d an
d bu
ildin
gs, p
lant
, equ
ipm
ent a
nd in
fras
truc
ture
, her
itage
and
cul
tura
l ass
ets
and
inve
stm
ent p
rope
rtie
s (c
ontin
ued)
C
: Ass
ets
unde
r con
stru
ctio
n A
ustra
lian
Gov
ernm
ent
Her
itage
Tota
l lan
dS
peci
alis
tO
ther
pla
nt,
Tota
l pla
nt,
and
and
mili
tary
equi
pmen
t and
equi
pmen
t and
cultu
ral
Inve
stm
ent
Land
Bui
ldin
gs b
uild
ings
equ
ipm
ent
infra
stru
ctur
e in
frast
ruct
ure
asse
tspr
oper
tyTo
tal
Item
$m$m
$m$m
$m$m
$m$m
$mAs
at 3
0 Ju
ne 2
014
Gro
ss v
alue
-3,
135
3,13
511
,904
2,04
513
,949
6-
17,0
90A
ccum
ulat
ed d
epre
ciat
ion/
amor
tisat
ion
--
--
--
--
-N
et b
ook
valu
e-
3,13
53,
135
11,9
042,
045
13,9
496
-17
,090
As a
t 30
June
201
3G
ross
val
ue-
2,22
92,
229
10,7
583,
177
13,9
355
-16
,169
Acc
umul
ated
dep
reci
atio
n/am
ortis
atio
n-
--
--
--
--
Net
boo
k va
lue
-2,
229
2,22
910
,758
3,17
713
,935
5-
16,1
69
Gen
eral
Gov
ernm
ent
Her
itage
Tota
l lan
dS
peci
alis
tO
ther
pla
nt,
Tota
l pla
nt,
and
and
mili
tary
equi
pmen
t and
equi
pmen
t and
cultu
ral
Inve
stm
ent
Land
Bui
ldin
gs b
uild
ings
equ
ipm
ent
infra
stru
ctur
e in
frast
ruct
ure
asse
tspr
oper
tyTo
tal
Item
$m$m
$m$m
$m$m
$m$m
$mAs
at 3
0 Ju
ne 2
014
Gro
ss v
alue
-2,
346
2,34
611
,904
1,28
913
,193
6-
15,5
45A
ccum
ulat
ed d
epre
ciat
ion/
amor
tisat
ion
--
--
--
--
-N
et b
ook
valu
e-
2,34
62,
346
11,9
041,
289
13,1
936
-15
,545
As a
t 30
June
201
3G
ross
val
ue-
2,19
12,
191
10,7
581,
205
11,9
635
-14
,159
Acc
umul
ated
dep
reci
atio
n/am
ortis
atio
n-
--
--
--
--
Net
boo
k va
lue
-2,
191
2,19
110
,758
1,20
511
,963
5-
14,1
59
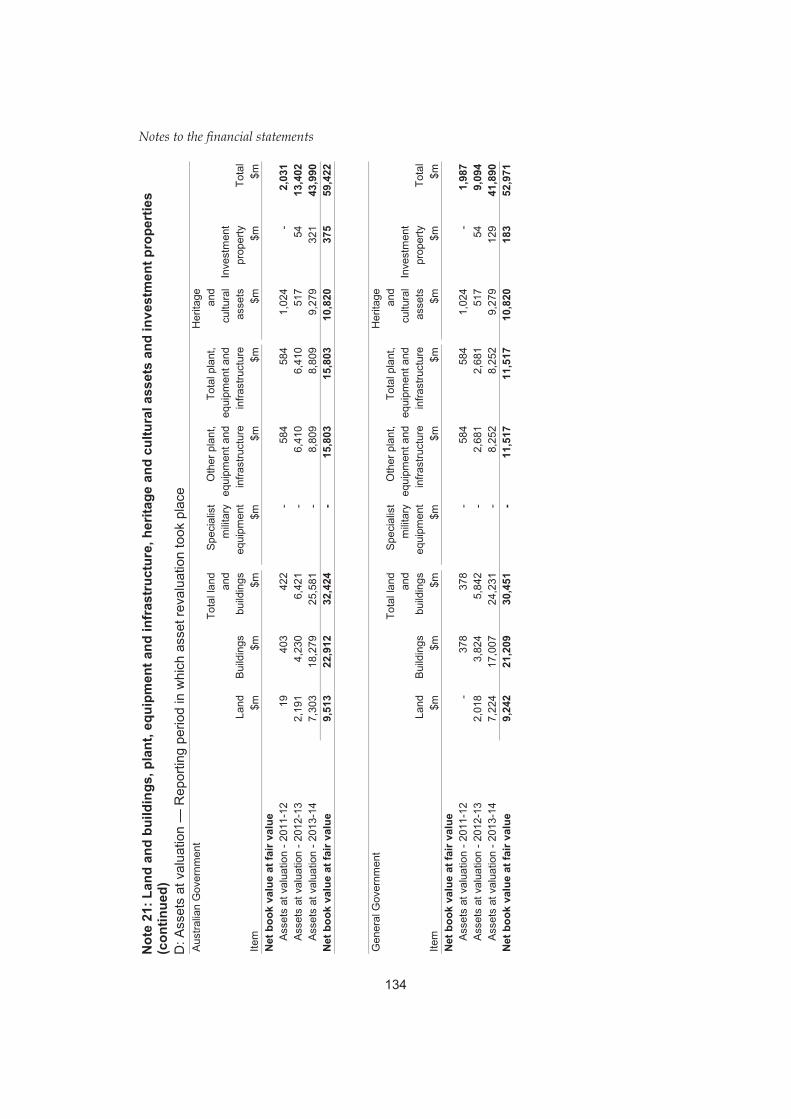
Notes to the financial statements
134
Not
e 21
: Lan
d an
d bu
ildin
gs, p
lant
, equ
ipm
ent a
nd in
fras
truc
ture
, her
itage
and
cul
tura
l ass
ets
and
inve
stm
ent p
rope
rtie
s (c
ontin
ued)
D
: Ass
ets
at v
alua
tion
— R
epor
ting
perio
d in
whi
ch a
sset
reva
luat
ion
took
pla
ce
Aus
tralia
n G
over
nmen
tH
erita
geTo
tal l
and
Spe
cial
ist
Oth
er p
lant
,To
tal p
lant
,an
dan
d m
ilita
ryeq
uipm
ent a
ndeq
uipm
ent a
ndcu
ltura
lIn
vest
men
tLa
ndB
uild
ings
bui
ldin
gs e
quip
men
tin
frast
ruct
ure
infra
stru
ctur
eas
sets
prop
erty
Tota
lIte
m$m
$m$m
$m$m
$m$m
$m$m
Net
boo
k va
lue
at fa
ir va
lue
Ass
ets
at v
alua
tion
- 201
1-12
1940
342
2-
584
584
1,02
4-
2,03
1A
sset
s at
val
uatio
n - 2
012-
132,
191
4,23
06,
421
-6,
410
6,41
051
754
13,4
02A
sset
s at
val
uatio
n - 2
013-
147,
303
18,2
7925
,581
-8,
809
8,80
99,
279
321
43,9
90N
et b
ook
valu
e at
fair
valu
e9,
513
22,9
1232
,424
-15
,803
15,8
0310
,820
375
59,4
22
Gen
eral
Gov
ernm
ent
Her
itage
Tota
l lan
dS
peci
alis
tO
ther
pla
nt,
Tota
l pla
nt,
and
and
mili
tary
equi
pmen
t and
equi
pmen
t and
cultu
ral
Inve
stm
ent
Land
Bui
ldin
gs b
uild
ings
equ
ipm
ent
infra
stru
ctur
e in
frast
ruct
ure
asse
tspr
oper
tyTo
tal
Item
$m$m
$m$m
$m$m
$m$m
$mN
et b
ook
valu
e at
fair
valu
eA
sset
s at
val
uatio
n - 2
011-
12-
378
378
-58
458
41,
024
-1,
987
Ass
ets
at v
alua
tion
- 201
2-13
2,01
83,
824
5,84
2-
2,68
12,
681
517
549,
094
Ass
ets
at v
alua
tion
- 201
3-14
7,22
417
,007
24,2
31-
8,25
28,
252
9,27
912
941
,890
Net
boo
k va
lue
at fa
ir va
lue
9,24
221
,209
30,4
51-
11,5
1711
,517
10,8
2018
352
,971

Notes to the financial statements
135
Note 22: Intangibles
2014 2013 2014 2013$m $m $m $m
Computer softwareComputer software - at cost 7,847 7,373 10,510 9,681Accumulated amortisation (4,218) (3,794) (5,670) (5,024)
Total computer software 3,629 3,579 4,840 4,657Other intangibles
Other intangibles - at cost 3,384 2,216 4,697 3,455Accumulated amortisation (876) (159) (1,216) (290)
Total other intangibles 2,508 2,057 3,481 3,165
Total intangibles 6,137 5,636 8,321 7,822
General Government Australian Government
A: Reconciliation of movement in intangibles Australian Government Computer Other
software intangibles TotalItem $m $m $mAs at 1 July 2013Gross book value 9,681 3,455 13,136Accumulated depreciation (5,024) (290) (5,314)Net book value 4,657 3,165 7,822Additions:
Purchase of new or secondhand assets 1,210 243 1,453Internally generated 127 1 128
Revaluations: write-ups/(write-downs) (5) (14) (19)Reclassification 48 (2) 46Amortisation expense (1,116) (124) (1,240)Recoverable amount write-downs (69) (140) (209)Reversal of write-downs - 84 84Other movements (4) 270 266Disposals (8) (2) (10)
As at 30 June 2014 4,840 3,481 8,321Gross book value 10,510 4,697 15,207Accumulated depreciation (5,670) (1,216) (6,886)
Net book value 4,840 3,481 8,321

Notes to the financial statements
136
Note 22: Intangibles (continued) A: Reconciliation of movement in intangibles (continued) Australian Government Computer Other
software intangibles TotalItem $m $m $mAs at 1 July 2012Gross book value 8,345 2,704 11,049Accumulated depreciation (4,106) (207) (4,313)Net book value 4,239 2,497 6,736Additions:
Purchase of new or secondhand assets 1,334 358 1,692Internally generated 6 1 7Entity acquisitions 38 680 718
Revaluations: write-ups/(write-downs) (1) - (1)Reclassification 73 (1) 72Amortisation expense (985) (77) (1,062)Recoverable amount write-downs (42) (355) (397)Other movements (1) 62 61Disposals (4) - (4)As at 30 June 2013 4,657 3,165 7,822Gross book value 9,681 3,455 13,136Accumulated depreciation (5,024) (290) (5,314)
Net book value 4,657 3,165 7,822
General Government Computer Othersoftware intangibles Total
Item $m $m $mAs at 1 July 2013Gross book value 7,373 2,216 9,589Accumulated depreciation (3,794) (159) (3,953)Net book value 3,579 2,057 5,636Additions:
Purchase of new or secondhand assets 762 213 975Internally generated 127 1 128
Revaluations: write-ups/(write-downs) (5) 1 (4)Reclassification 46 - 46Amortisation expense (850) (56) (906)Recoverable amount write-downs (51) (38) (89)Reversal of write-downs - 84 84Other movements 26 248 274Disposals (5) (2) (7)
As at 30 June 2014 3,629 2,508 6,137Gross book value 7,847 3,384 11,231Accumulated depreciation (4,218) (876) (5,094)
Net book value 3,629 2,508 6,137

Notes to the financial statements
137
Note 22: Intangibles (continued) A: Reconciliation of movement in intangibles (continued) General Government Computer Other
software intangibles TotalItem $m $m $mAs at 1 July 2012Gross book value 6,500 2,216 8,716Accumulated depreciation (3,079) (136) (3,215)Net book value 3,421 2,080 5,501Additions:
Purchase of new or secondhand assets 886 282 1,168Internally generated 6 1 7
Revaluations: write-ups/(write-downs) (1) - (1)Reclassification 73 (1) 72Amortisation expense (773) (22) (795)Recoverable amount write-downs (28) (344) (372)Other movements (2) 61 59Disposals (3) - (3)As at 30 June 2013 3,579 2,057 5,636Gross book value 7,373 2,216 9,589Accumulated depreciation (3,794) (159) (3,953)
Net book value 3,579 2,057 5,636
Note 23: Inventories
2014 2013 2014 2013$m $m $m $m
Inventories held for saleFinished goods(a) 669 689 734 750Raw materials and stores 63 69 77 82Work in progress 535 424 539 428
Total inventories held for sale 1,267 1,182 1,350 1,260Inventories not held for sale
Consumable stores and inventoriesheld for distribution 6,986 6,744 7,021 6,778
Total inventories not held for sale 6,986 6,744 7,021 6,778Total inventories 8,253 7,926 8,371 8,038
General Government Australian Government
(a) Finished goods includes $231 million valued at net realisable value (2013: $353 million), the remainder is
valued at cost.
Note 24: Other non-financial assets
2014 2013 2014 2013$m $m $m $m
Total biological assets 36 33 36 33Total assets held for sale 95 110 143 213Other non-financial assets:
Prepayments 2,985 2,463 3,058 2,519Other 410 292 2,723 1,705
Total other non-financial assets 3,526 2,898 5,960 4,470
General Government Australian Government

Notes to the financial statements
138
Note 25: Assets by function(a)
2014 2013 2014 2013$m $m $m $m
General public services 167,318 159,311 166,730 158,921Defence 75,996 73,095 76,314 73,413Public order and safety 2,548 1,969 2,595 2,006Education 22,761 25,316 22,761 25,291Health 5,444 5,120 3,596 3,240Social security and welfare 14,322 7,318 13,106 6,889Housing and community amenities 8,164 7,967 8,139 7,944Recreation and culture 13,467 11,697 13,416 11,664Fuel and energy 877 569 877 569Agriculture, forestry and fishing 451 354 451 353Mining, manufacturing and construction 70 70 1,856 1,878Transport and communication 11,762 11,073 19,877 16,658Other economic affairs 4,458 16,627 140,530 103,252Other purposes(b) 63,334 35,273 19,548 18,802Total assets 390,972 355,759 489,796 430,880
General Government Australian Government
(a) Refer to Note 46 for description of each function. (b) Cash and deposits that are not allocated to other functions are included in the ‘Other purposes’ function.
Note 26: Deposit liabilities
2014 2013 2014 2013$m $m $m $m
Exchange settlement funds - - 22,379 2,235Drawing accounts held with the Reserve Bank
of Australia - - 824 484State governments - - - 10Monies held in trust 206 176 206 176Foreign governments - - 872 2,815Other 5 6 307 404
Total deposit liabilities 211 182 24,588 6,124
General Government Australian Government

Notes to the financial statements
139
Note 27: Government securities
2014 2013 2014 2013$m $m $m $m
Treasury bonds 309,202 251,574 309,202 251,569Treasury notes 4,974 5,483 4,974 5,483Treasury indexed bonds 32,419 27,093 32,419 27,093Other 4,687 1,598 21 15
Total government securities 351,282 285,748 346,616 284,160
General Government Australian Government
Note 28: Loans
2014 2013 2014 2013$m $m $m $m
Bills of exchange and promissory notes 3,904 3,165 4,477 3,631Bonds (non-Treasury) - - 3,067 3,099Loans 804 909 920 1,101Total loans 4,708 4,074 8,464 7,831Loans maturity scheduleNot later than one year 104 114 594 1,061Later than one year and not later than two years 25 88 328 874Later than two years and not later than five years 430 248 1,729 1,578Later than five years 4,149 3,624 5,813 4,318
Total loans by maturity 4,708 4,074 8,464 7,831
General Government Australian Government
Note 29: Other borrowings
2014 2013 2014 2013$m $m $m $m
Finance lease liabilities as at the reporting dateare reconciled to the lease liability as follows:
Not later than one year 175 177 569 322Later than one year and not later than five years 651 517 1,836 975Later than five years 2,301 1,388 10,495 4,647
Minimum lease payments 3,127 2,082 12,900 5,944less future finance charges 1,598 1,058 7,910 3,583Total finance lease liabilities 1,529 1,024 4,990 2,361Finance lease liabilities maturity scheduleCurrent 80 95 199 133Non-current 1,449 929 4,791 2,228
Total finance lease liabilities by maturity 1,529 1,024 4,990 2,361
General Government Australian Government

Notes to the financial statements
140
Note 30: Other interest bearing liabilities
2014 2013 2014 2013$m $m $m $m
Swap principal payable 469 4,472 647 4,759Amounts outstanding under repurchase agreements - - 5,244 2,379Special reserve - International Monetary Fund special drawing rights 5,054 4,999 5,054 4,999Finance lease incentives 144 126 154 129Other 7 19 1,835 2,682
Total other interest bearing liabilities 5,674 9,616 12,934 14,948
General Government Australian Government
Note 31: Employee benefits
2014 2013 2014 2013$m $m $m $m
Total superannuation liability 221,747 193,313 221,948 193,694Other employee liabilities
Leave and other entitlements 7,331 7,396 9,800 9,656Accrued salaries and wages 772 655 854 740Workers compensation claims 3,175 3,087 3,314 3,217Separations and redundancies 284 100 383 179Military compensation 4,092 3,353 4,092 3,353Other 276 205 277 205
Total other employee liabilities 15,930 14,796 18,720 17,350Total employee and superannuation liabilities 237,677 208,109 240,668 211,044
General Government Australian Government
As at 30 June 2014, the number of full time equivalent employees was 304,491 (2013: 314,072). This comprises civilians and military personnel, including reserve forces.

Notes to the financial statements
141
Note 32: Other provisions and payables
2014 2013 2014 2013$m $m $m $m
PayablesSuppliers payable
Trade creditors 3,562 4,047 4,622 4,986Operating lease rental payable 264 209 264 209Other creditors 1,056 2,191 1,260 2,391
Total suppliers payable 4,882 6,447 6,146 7,586Total personal benefits payable 5,607 5,699 5,607 5,699Total subsidies payable 4,482 3,580 4,482 3,580Grants payable
State and Territory governments 679 807 679 807Private sector 384 505 384 505Overseas 1,660 1,390 1,660 1,390Local governments 2 12 2 12Other 630 641 630 641
Total grants payable 3,355 3,355 3,355 3,355Other payables
Unearned income 1,091 1,243 2,029 2,100Accrued expenses 961 883 1,947 1,554Other 1,424 978 1,456 994
Total other payables 3,476 3,104 5,432 4,648Total payables 21,802 22,185 25,022 24,868Australian currency on issue - - 60,778 56,943Other provisions
Grant provisions 10,846 12,855 10,846 12,855Provision for outstanding benefits
and claims 11,720 12,123 12,127 12,530Provision for tax refunds 2,919 3,391 2,919 3,391Provision for restoration,
decommissioning and makegood 2,017 1,914 2,122 2,016Other 1,679 1,939 2,036 2,290
Total other provisions 29,181 32,222 30,050 33,082Total provisions 29,181 32,222 90,828 90,025Total other provisions and payables 50,983 54,407 115,850 114,893
General Government Australian Government
A: Reconciliation of movement in provisions
2014 2013 2014 2013$m $m $m $m
Movement table:Balance of provisions at 1 July 32,222 29,707 90,025 84,022Provisions made during the year 18,456 14,320 26,815 24,644Provisions used during the year (13,365) (12,175) (17,925) (19,053)Provisions remeasured, reversed or
unwound during the year (8,132) 370 (8,087) 412Balance of provisions at 30 June 29,181 32,222 90,828 90,025
General Government Australian Government

Notes to the financial statements
142
Note 33: Net revaluation increases/(decreases)
2014 2013 2014 2013$m $m $m $m
Financial assets Equity investments 7,679 1,437 282 (609)Non-financial assets Land 496 248 498 246 Buildings 139 41 230 (38) Other infrastructure, plant and equipment 260 168 244 331 Heritage and cultural assets 239 66 239 66 Other non-financial assets - (5) - (5) Provision for restoration, decommissioning and makegood 24 37 24 37 Intangibles - 4 - 4Total non-financial assets 1,158 559 1,235 641Total revaluation increases/(decreases) 8,837 1,996 1,517 32
General Government Australian Government

Notes to the financial statements
143
Note 34: Reconciliation of cash A: Reconciliation of net operating balance to net cash flows from operating activities
2014 2013 2014 2013$m $m $m $m
Net operating balance (39,751) (23,119) (33,253) (23,449)less Revenues not providing cash
Other 554 440 554 440Total revenues not providing cash 554 440 554 440plus Expenses not requiring cash
Increase in employee entitlements 16,301 8,019 16,500 8,175 Depreciation/amortisation expense 6,341 6,429 7,422 7,258 Mutually agreed writedowns 2,627 2,162 2,477 2,162 Other non-cash expenses (6,867) 706 (6,862) 648
Total expenses not requiring cash 18,402 17,316 19,537 18,243plus Cash provided by working capital items
(Increase)/Decrease in receivables (9,695) (8,317) (8,306) (9,969) (Increase)/Decrease in inventories (474) (797) (491) (795) (Increase)/Decrease in other financial assets 99 921 154 1,259 (Increase)/Decrease in other non-financial
assets (319) 32 (363) (18) Increase/(Decrease) in benefits, subsidies
and grants payable (2,410) 4,786 (2,410) 4,786 Increase/(Decrease) in supplier payables (506) 145 (447) 311 Increase/(Decrease) in other provisions and payables (1,760) (410) (1,347) (210)
Total cash provided/(used) by workingcapital items (15,065) (3,640) (13,210) (4,636)
equals Net cash from/(used by) operatingactivities (36,968) (9,883) (27,480) (10,282)
General Government Australian Government
B: Reconciliation of cash at the end of the reporting period as shown in the cash flow statement to the related items in the balance sheet
2014 2013 2014 2013$m $m $m $m
Items in the balance sheetFinancial assets - cash 3,844 2,113 4,514 4,062Financial liabilities - overdrafts - - - -
Total items in the balance sheet 3,844 2,113 4,514 4,062Total as per cash flow statement 3,844 2,113 4,514 4,062
General Government Australian Government

Notes to the financial statements
144
Note 34: Reconciliation of cash (continued) C: Cash flows associated with entities acquired during the year
2014 2013 2014 2013 (a)$m $m $m $m
Consideration for acquisitionCash - - - (59)Other - - - 460
Total consideration - - - 401
Fair value of assets and liabilities of entities acquired were:
AssetsTotal cash - - - 59Financial assets - - - 174Total non-financial assets - - - 462
Total assets - - - 695
LiablitiesTotal debt - - - 585Total payables - - - 92Total provisions - - - 109
Total liabilities - - - 786
Net assets - - - (91)
Interest in entity prior to obtaining controlOutside equity interest relating to controlled entities
Australian Government share of net assets - - - (91)acquired
Goodwill / (discount) on acquisition and other - - - 479adjustments
Acquisition costs written-off - - - -Less: investment previously held - - - (194)
Fair value of Australian Government's share of net assets acquired and goodwill - - - 194
During the 2012-13 financial year: On the 13th November 2012 Australia Post Group's equity interest in AUX Investments increased from 50 to 100 percent and AUX became a subsidiary from that date.
General Government Australian Government
(a) The numbers have been amended to reflect additional information on the AUX Investments tax balances which
was not available at the time of preparing the 2012-13 Consolidated Financial Statements. The Australia Government share of net assets decreased by $15 million.

Notes to the financial statements
145
Note 35: Commitments as at 30 June 2014
2014 2013$m $m
BY TYPECapital commitments
Land and buildings 1,569 952Infrastructure, plant and equipment 3,019 3,333Specialist military equipment 10,252 8,915Investments 12,656 10,456Other capital commitments 988 1,148
Total capital commitments 28,484 24,804Other commitments
Operating leases(c) 20,617 19,331Project commitments 1,180 1,848Research and development 2,489 1,384Goods and services contracts 8,617 15,848Grant commitments(b) 96,933 131,855Other commitments 35,415 36,691
Total other commitments 165,251 206,957Total commitments 193,735 231,761less Commitments receivable 4,774 2,022Net commitments 188,961 229,739BY MATURITY(a)Capital
One year or less 18,679 15,110From one to five years 7,635 7,620Over five years 1,041 1,198
27,355 23,928Operating leases
One year or less 2,718 2,544From one to five years 7,986 7,329Over five years 7,959 9,200
18,663 19,073Other
One year or less 49,445 47,949From one to five years 83,874 98,789Over five years 9,624 40,000
142,943 186,738Net commitments by maturity 188,961 229,739 (a) The maturity schedule for capital commitments, operating lease commitments and other commitments
are presented net of commitments receivable. (b) The decrease in grant commitments is largely attributable to legislated education obligations where a
funding determination has not yet been signed. The legislation comprises the Australian Education Act 2013 and the Higher Education Support Act 2003. The commitments schedule does not include commitments for grants payable to the States and Territories under the Federal Financial Relations Act 2009 (for the current and comparative years). The budgeted information for payment of grants to States and Territories can be found in the Budget Paper No. 3.
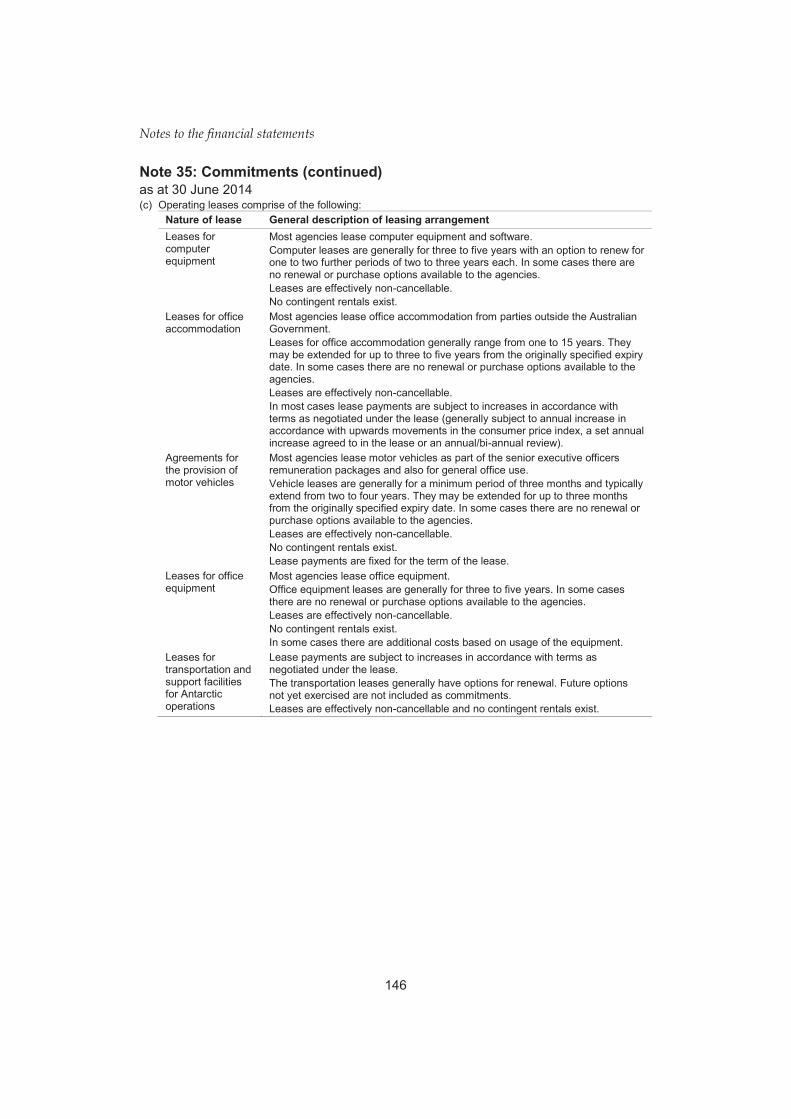
Notes to the financial statements
146
Note 35: Commitments (continued) as at 30 June 2014 (c) Operating leases comprise of the following:
Nature of lease General description of leasing arrangement Leases for computer equipment
Most agencies lease computer equipment and software. Computer leases are generally for three to five years with an option to renew for one to two further periods of two to three years each. In some cases there are no renewal or purchase options available to the agencies. Leases are effectively non-cancellable. No contingent rentals exist.
Leases for office accommodation
Most agencies lease office accommodation from parties outside the Australian Government. Leases for office accommodation generally range from one to 15 years. They may be extended for up to three to five years from the originally specified expiry date. In some cases there are no renewal or purchase options available to the agencies. Leases are effectively non-cancellable. In most cases lease payments are subject to increases in accordance with terms as negotiated under the lease (generally subject to annual increase in accordance with upwards movements in the consumer price index, a set annual increase agreed to in the lease or an annual/bi-annual review).
Agreements for the provision of motor vehicles
Most agencies lease motor vehicles as part of the senior executive officers remuneration packages and also for general office use. Vehicle leases are generally for a minimum period of three months and typically extend from two to four years. They may be extended for up to three months from the originally specified expiry date. In some cases there are no renewal or purchase options available to the agencies. Leases are effectively non-cancellable. No contingent rentals exist. Lease payments are fixed for the term of the lease.
Leases for office equipment
Most agencies lease office equipment. Office equipment leases are generally for three to five years. In some cases there are no renewal or purchase options available to the agencies. Leases are effectively non-cancellable. No contingent rentals exist. In some cases there are additional costs based on usage of the equipment.
Leases for transportation and support facilities for Antarctic operations
Lease payments are subject to increases in accordance with terms as negotiated under the lease. The transportation leases generally have options for renewal. Future options not yet exercised are not included as commitments. Leases are effectively non-cancellable and no contingent rentals exist.

Notes to the financial statements
147
Note 35: Commitments (continued) Commitments by sector(a) as at 30 June 2014
General Public non-financialgovernment corporations2014 2013 2014 2013 2014 2013
$m $m $m $m $m $mBY TYPECapital commitmentsLand and buildings 1,480 884 96 75 - -Infrastructure, plant and equipment 1,313 1,222 1,676 2,111 37 14Specialist military equipment 10,252 8,915 - - - -Investments 33,738 35,624 - 4 - -Other capital commitments 986 1,148 - - 2 -Total capital commitments 47,769 47,793 1,772 2,190 39 14Other commitmentsOperating leases 18,708 17,667 1,658 1,433 342 329Project commitments 1,180 1,916 - - - -Research and development 2,489 1,384 - - - -Goods and services contracts 6,355 13,355 2,453 2,725 1 2Grant commitments (b) 96,933 131,855 - - - -Other commitments 33,595 33,807 1,931 3,040 - -Total other commitments 159,260 199,984 6,042 7,198 343 331Total commitments 207,029 247,777 7,814 9,388 382 345less Commitments receivable 4,527 1,841 21,682 25,764 10 6
Net commitments 202,502 245,936 (13,868) (16,376) 372 339BY MATURITY(c)CapitalOne year or less 22,303 18,592 1,539 1,609 38 9From one to five years 23,282 26,036 233 579 2 5Over five years 1,041 2,268 - 2 - -
46,626 46,896 1,772 2,190 40 14
Operating leasesOne year or less 2,432 2,281 241 229 45 33From one to five years 7,131 6,575 700 643 155 112Over five years 7,115 8,495 707 527 137 178
16,678 17,351 1,648 1,399 337 323
OtherOne year or less 48,187 46,533 (3,902) (4,145) (2) 1From one to five years 81,242 95,025 (14,333) (17,128) (3) 1Over five years 9,769 40,131 947 1,308 - -
139,198 181,689 (17,288) (19,965) (5) 2
Net commitments by maturity 202,502 245,936 (13,868) (16,376) 372 339
Public financialcorporations
(a) Transactions between sectors are included in this statement but eliminated in the consolidated statements to
avoid double counting. Accordingly, the sum of the amounts for each line item may exceed or be less than the equivalent amount in the consolidated statements.
(b) The decrease in grant commitments is largely attributable to legislated education obligations where a funding determination has not yet been signed. The legislation comprises the Australian Education Act 2013 and the Higher Education Support Act 2003. The commitments schedule does not include commitments for grants payable to the States and Territories under the Federal Financial Relations Act 2009 (for the current and comparative years). The budgeted information for payment of grants to States and Territories can be found in the Budget Paper No. 3.
(c) The maturity schedule for capital commitments, operating lease commitments and other commitments are presented net of commitments receivable.

Notes to the financial statements
148
Note 36: Contingencies as at 30 June 2014
2014 2013$m $m
Quantifiable contingent liabilitiesGuarantees(a) 15,216 15,229Indemnities(b) 232 447Uncalled shares/capital subscriptions(c) 13,474 13,251Claims for damages/costs 181 232Other contingencies 5,442 7,263
Total quantifiable contingent liabilities 34,545 36,422less Quantifiable contingent assets 190 332Net quantifiable contingencies 34,355 36,090 (a) A guarantee is where one party promises to be responsible for the debt or performance obligations of
another party should that party default in some way. This includes 2013 restatement of Treasury’s contingencies relating to International Monetary Fund (IMF) New Arrangements to Borrow (NAB) ($7,085 million) and IMF bilateral loan ($7,700 million).
(b) An indemnity is a legally binding promise whereby a party undertakes to accept the risk of loss or damage another party may suffer.
(c) Uncalled shares/capital subscriptions include uncalled shares of $13,415 million (2013: $13,192 million) in the European Bank for Reconstruction and Development, the International Bank for Reconstruction and Development, the Multilateral Investment Guarantee Agency and the Asian Development Bank.
A. Reconciliation of movement in quantifiable contingent assets
2014 2013$m $m
Quantifiable contingent assetsOpening balance as at 1 July 332 247Increases 141 84Re-measurement (20) 61Assets crystallised (248) (58)Expired (15) (2)As at 30 June 190 332

149
Notes to the financial statements N
ote
36: C
ontin
genc
ies
(con
tinue
d)
B.
Rec
onci
liatio
n of
mov
emen
t in
quan
tifia
ble
cont
inge
nt li
abilit
ies
Unc
alle
d sh
ares
Cla
ims
for
Oth
er
or c
apita
l da
mag
es o
r qu
antif
iabl
eG
uara
ntee
sIn
dem
nitie
ssu
bscr
iptio
nsco
sts
cont
inge
ncie
sTo
tal
$m$m
$m$m
$m$m
Ope
ning
bal
ance
as
at 1
Jul
y 20
1315
,229
447
13,2
5123
27,
263
36,4
22In
crea
ses
351
-94
1,23
21,
362
Re-
mea
sure
men
t(1
5)(1
89)
223
7(1
,161
)(1
,135
)Li
abilit
ies
crys
tallis
ed-
--
(43)
(1)
(44)
Obl
igat
ions
exp
ired
(33)
(27)
-(1
09)
(1,8
91)
(2,0
60)
As a
t 30
June
201
415
,216
232
13,4
7418
15,
442
34,5
45
U
ncal
led
shar
esC
laim
s fo
rO
ther
or c
apita
lda
mag
es o
r qu
antif
iabl
eG
uara
ntee
sIn
dem
nitie
ssu
bscr
iptio
nsco
sts
cont
inge
ncie
sTo
tal
$m$m
$m$m
$m$m
Ope
ning
bal
ance
as
at 1
Jul
y 20
1236
836
510
,198
185
4,74
715
,863
Incr
ease
s14
,876
--
743,
822
18,7
72R
e-m
easu
rem
ent
610
13,
053
121,
467
4,63
9Li
abilit
ies
crys
tallis
ed-
--
(15)
-(1
5)O
blig
atio
ns e
xpire
d (2
1)(1
9)-
(24)
(2,7
73)
(2,8
37)
As a
t 30
June
201
315
,229
447
13,2
5123
27,
263
36,4
22

Notes to the financial statements
150
Note 36: Contingencies (continued) C. Contingent liabilities excluded on the basis of remoteness
2014 2013$m $m
Remote contingent liabilitiesFinancial Claims Scheme(a) 722,800 688,200Guarantee Scheme for large deposits and wholesale funding(b) 14,800 48,300Guarantee of State and Territory Borrowing(c) 15,700 25,400Accomodation Bond Guarantee Scheme(d) 14,200 13,000Guarantees in relation to NBN Co(e) 10,105 5,800Commonwealth Bank of Australia and
Commonwealth Bank of Australia - Officers Superannuation Fund (f) 5,092 4,931Space Activities Act 1998 (g) 3,000 3,100Other 5,055 5,208
Total remote contingent liabilities 790,752 793,939 The above schedule should be read in conjunction with the accompanying notes: (a) Financial Claims Scheme
The Australian Government has established a Financial Claims Scheme to provide depositors of authorised deposit-taking institutions and general insurance policyholders with timely access to their funds in the event of a financial institution failure.
The Australian Prudential Regulation Authority (APRA) is responsible for the administration of the Financial Claims Scheme. Under the Financial Claims Scheme any payments to eligible depositors or general insurance policyholders will be made out of APRA's Financial Claims Scheme Special Account.
The Early Access Facility for Depositors established under the Banking Act 1959 provides a mechanism for making payments to depositors under the Government's guarantee of deposits in authorised deposit-taking institutions. From 1 February 2012, deposits up to $250,000 at eligible authorised deposit-taking institutions would be eligible for coverage under the Financial Claims Scheme. This $250,000 cap has no expiry date.
As at 30 June 2014, deposits eligible for coverage under the Financial Claims Scheme were estimated to be approximately $722 billion.
The Policyholder Compensation Facility established under the Insurance Act 1973 provides a mechanism for making payments to eligible beneficiaries with a valid claim against a failed general insurer.
Amounts available to meet payments and administer both facilities, in the event of activation, are capped at $20.1 billion under the legislation.
Any payments made under the Financial Claims Scheme would be recovered through the liquidation of the failed institution. If there were a shortfall, a levy would be applied to industry to recover the difference between the amount expended and the amount recovered in the liquidation.

Notes to the financial statements
151
(b) Guarantee of large deposits and wholesale funding in authorised deposit taking institutions
The Australian Government announced the guarantee of eligible deposits and wholesale funding for authorised deposit-taking institutions from 12 October 2008 under the Guarantee Scheme for Large Deposits and Wholesale Funding.
On 7 February 2010, the Government announced the closure of the Guarantee Scheme from 31 March 2010. Since then, Australian authorised deposit-taking institutions have been prohibited from issuing any new guaranteed wholesale funding or accepting new guaranteed deposits above $1 million. Existing guaranteed wholesale funding is guaranteed to maturity. Depositors who covered their balances above $1 million under the Guarantee Scheme can have those funds covered to maturity for term deposits up to five years, or until October 2015 for at call deposits.
The expected liability for deposits under the Guarantee Scheme is remote and unquantifiable. Australia's financial system is considered among the strongest and best regulated in the world. Authorised deposit-taking institutions are subject to prudential regulation by APRA in accordance with international standards, which are designed to ensure that financial institutions have the capacity to meet their financial obligations. This framework requires institutions to be adequately capitalised and have appropriate risk management systems in place. Furthermore, Australia’s four major banks (which hold the majority of government wholesale funding) are among only ten large banking groups globally rated AA or higher.
Government expenditure would arise under the large deposit guarantee only in the unlikely event that an institution failed to meet its obligations with respect to a commitment that was subject to the guarantee and the guarantee was called upon. In such a case, the Government would likely be able to recover any such expenditure through a claim on the relevant institution. The impact on the Government's budget would depend on the extent of the institution's default and its ability to meet the Government's claim.
As at 30 June 2014, total liabilities covered by the Guarantee Scheme were estimated at $14.8 billion, including $2.3 billion of large deposits and $12.5 billion of wholesale funding.
(c) Guarantee of State and Territory Borrowing
The Australian Government announced on 25 March 2009 that a voluntary and temporary guarantee would be put in place over state and territory borrowing. The Guarantee of State and Territory Borrowing commenced on 24 July 2009.
The guarantee closed to new issuances of guaranteed liabilities on 31 December 2010. Securities covered by the guarantee will continue to be guaranteed until these securities either mature or are bought back and extinguished by the issuer.

Notes to the financial statements
152
The expected liability under the guarantee is remote and unquantifiable. Government expenditure would arise under the guarantee only in the unlikely event that a State or Territory failed to meet its obligations with respect to a commitment that was subject to the guarantee and the guarantee was called upon. In such a case, the Government would likely be able to recover any such expenditure through a claim on the relevant State or Territory at a future date. The impact on the Government's budget would depend upon the extent of the default and the State or Territory's ability to meet the Government's claim.
As at 30 June 2014, the face value of State and Territory borrowings covered by the guarantee was $15.7 billion.
(d) Accommodation Bond Guarantee Scheme
The Accommodation Bond Guarantee Scheme (the Guarantee Scheme) guarantees the repayment of aged care residents’ accommodation bond, entry contribution balances and, from 1 July 2014, refundable accommodation deposits and contributions if the approved provider becomes insolvent or bankrupt and defaults on its refund obligations. In return for the payment, the rights that the resident had to recover the amount from their approved provider are transferred to the Australian Government so it can pursue the approved provider for the funds. In cases where the funds are unable to be recovered, the Australian Government may levy all approved providers holding bonds to meet any shortfall.
From the latest available information, the maximum contingent liability, in the unlikely event that all providers defaulted, is $14.2 billion.
(e) Guarantees in relation to NBN Co
The Australian Government has provided guarantees in respect of NBN Co as follows:
(i) Telstra Financial Guarantee
The Australian Government has provided a guarantee to Telstra in respect of NBN Co’s financial obligations to Telstra under the Definitive Agreements. The Definitive Agreements are long-term contracts and, in the case of the infrastructure component, involve terms of at least 35 years. The liabilities under the Definitive Agreements arise progressively during the roll out of the network as infrastructure is accessed and subscribers to Telstra’s existing network are disconnected. As at 30 June 2014, NBN Co had generated liabilities covered by the Guarantee estimated at $3.4 billion. The Guarantee will terminate when NBN Co achieves specified credit ratings for a period of two continuous years and either:
• the company is fully capitalised; or
• the Communications Minister declares, under the National Broadband Network Companies Act 2011, that, in his or her opinion, the national broadband network should be treated as built and fully operational.

Notes to the financial statements
153
(ii) Optus Financial Guarantee
The Commonwealth has provided a guarantee to Optus of NBN Co’s financial obligations to Optus under the NBN Co-Optus Agreement. That agreement extends for the period of the national broadband network roll out in Optus Hybrid Fibre Coaxial areas. As at 30 June 2014, NBN Co had generated liabilities covered by the Optus Agreement estimated at $5.1 million. The Guarantee will terminate in 2021.
(iii) NBN Co Limited — Equity Agreement
The Australian Government has entered into an Equity Funding Agreement with NBN Co. The Agreement formalises the Commonwealth’s intention to provide equity to fund the roll out of the National Broadband Network, with such funding being conditional on the annual appropriation processes. In addition, it commits the Commonwealth, in the event of a termination of the national broadband network roll out, to provide sufficient funds to NBN Co to meet its direct costs arising from that termination. The NBN Co Equity Agreement terminates in 2021. As at 30 June 2014, NBN Co’s termination liabilities were estimated at $6.7 billion.
(f) Commonwealth Bank of Australia and Commonwealth Bank of Australia Officers’ Super Fund
Under the terms of the Commonwealth Bank Sale Act 1995, the Australian Government has guaranteed various liabilities of the Commonwealth Bank of Australia (CBA), and the Commonwealth Bank Officers’ Superannuation Corporation (CBOSC). The guarantee for the CBA relates to both on and off balance sheet liabilities. The guarantee of the CBOSC covers the due payments of any amount that is payable to or from Officers’ of the Superannuation Fund (the Fund), by CBOSC or by CBA, in respect of a person who was a member, retired member or beneficiary of the Fund immediately before 19 July 1996. The guarantee of the CBA and CBOSC reflected in the above table is the value at 30 June 2014.
(g) Space Activities Act 1998
The Australian Government is liable under the UN Convention on International Liability for Damage Caused by Space Objects for injury or damage to foreign nationals arising from space launches from Australia. The Space Activities Act 1998 requires the launch operator to insure against liability up to a prescribed amount, with the Australian Government bearing any liability above this amount. The Australian Government also accepts liability for damage suffered by Australian nationals, to a maximum value of $3 billion above the insured level.
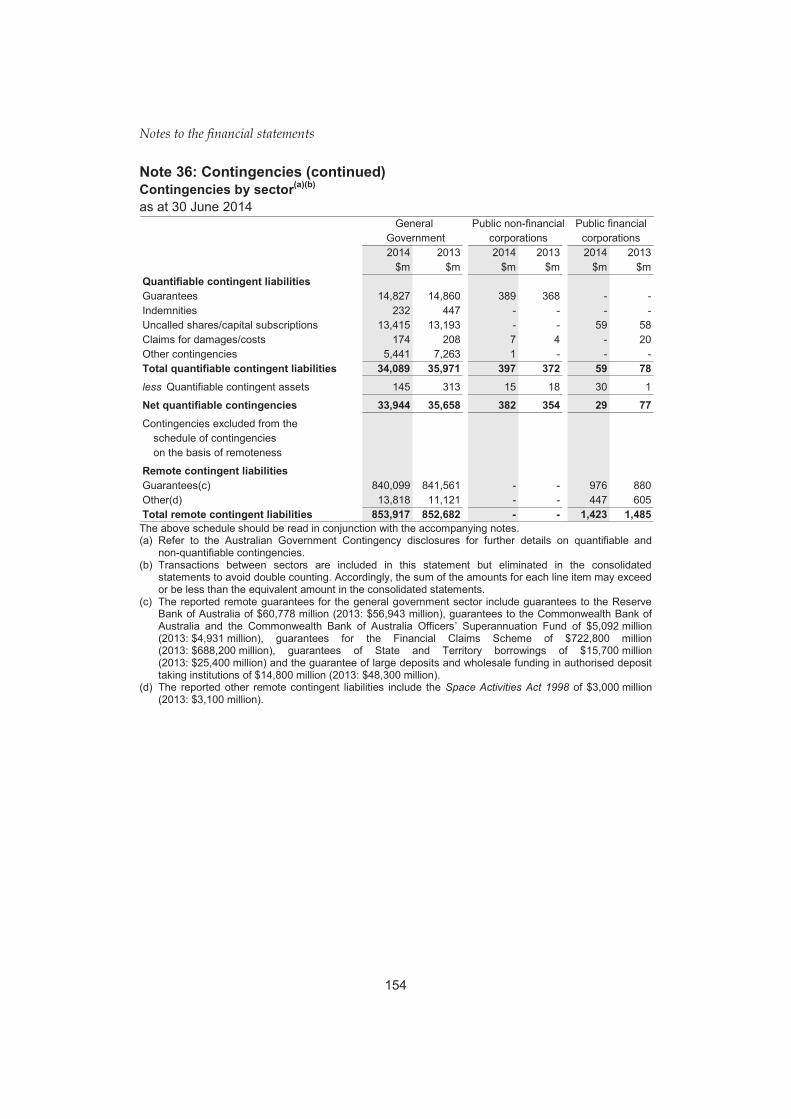
Notes to the financial statements
154
Note 36: Contingencies (continued) Contingencies by sector(a)(b) as at 30 June 2014
General Public non-financial Public financialGovernment corporations corporations2014 2013 2014 2013 2014 2013
$m $m $m $m $m $mQuantifiable contingent liabilitiesGuarantees 14,827 14,860 389 368 - -Indemnities 232 447 - - - -Uncalled shares/capital subscriptions 13,415 13,193 - - 59 58Claims for damages/costs 174 208 7 4 - 20Other contingencies 5,441 7,263 1 - - -Total quantifiable contingent liabilities 34,089 35,971 397 372 59 78less Quantifiable contingent assets 145 313 15 18 30 1
Net quantifiable contingencies 33,944 35,658 382 354 29 77Contingencies excluded from the
schedule of contingencieson the basis of remoteness
Remote contingent liabilitiesGuarantees(c) 840,099 841,561 - - 976 880Other(d) 13,818 11,121 - - 447 605Total remote contingent liabilities 853,917 852,682 - - 1,423 1,485 The above schedule should be read in conjunction with the accompanying notes. (a) Refer to the Australian Government Contingency disclosures for further details on quantifiable and
non-quantifiable contingencies. (b) Transactions between sectors are included in this statement but eliminated in the consolidated
statements to avoid double counting. Accordingly, the sum of the amounts for each line item may exceed or be less than the equivalent amount in the consolidated statements.
(c) The reported remote guarantees for the general government sector include guarantees to the Reserve Bank of Australia of $60,778 million (2013: $56,943 million), guarantees to the Commonwealth Bank of Australia and the Commonwealth Bank of Australia Officers’ Superannuation Fund of $5,092 million (2013: $4,931 million), guarantees for the Financial Claims Scheme of $722,800 million (2013: $688,200 million), guarantees of State and Territory borrowings of $15,700 million (2013: $25,400 million) and the guarantee of large deposits and wholesale funding in authorised deposit taking institutions of $14,800 million (2013: $48,300 million).
(d) The reported other remote contingent liabilities include the Space Activities Act 1998 of $3,000 million (2013: $3,100 million).

Notes to the financial statements
155
Non-quantifiable contingent liabilities Contingent liabilities and contingent assets represent possible costs or gains to the Australian Government arising from past events, which will be confirmed or otherwise by the outcome of future events that are not within the Government’s ability to control or where the cost or gain cannot be reliably measured.
Contingent liabilities include loan guarantees, non-loan guarantees, warranties, indemnities, uncalled capital and letters of comfort. These possible costs are in addition to those recognised as liabilities in the Consolidated Financial Statements.
Contingent assets include, for example, claims that the Australian Government is pursuing through legal processes, where the outcome is uncertain.
Unquantifiable contingencies identified and reported in the 2013-14 Consolidated Financial Statements for the first time include1:
• New South Wales Health Administration Council - indemnity;
• Tobacco plain packaging litigation; and
• Medicare Locals.
The following pages list unquantifiable contingencies by portfolio. For further information on these contingencies refer to the individual agency’s website.
Agriculture
Compensation claims arising from suspension of livestock exports to Indonesia
The Australian Government has received correspondence that indicates there are a number of potential claimants who are alleging losses due to the temporary suspension of exports of live animals to Indonesia that was put in place on 7 June 2011. Proceedings have commenced against the Commonwealth and at this date the amount of the claims remains unquantified.
Attorney General’s
Australian Victims of Terrorism Overseas Payment
The Social Security Amendment (Supporting Australian Victims of Terrorism Overseas) Act 2012 inserted Part 2.24AA into the Social Security Act 1991 (the Act) to create a scheme for providing financial assistance to Australians who are victims of an overseas terrorist act that has been declared by the Prime Minister. The scheme commenced on 23 January 2013. Under the scheme, Australians harmed (primary victims) and Australians who are close family members of a person who dies as a direct result of a
1 A number of the new contingent liabilities have previously been reported in the Statement of Risks included in the Australian Government budget documentation.

Notes to the financial statements
156
declared terrorist act (secondary victims) will be able to claim payments of up to $75,000. As acts of terrorism are unpredictable, the cost of the scheme is unquantifiable.
Native title agreements — access to geospatial data
The Australian Government has entered into agreements with State and Territory government bodies and/or their agents to access their geospatial land tenure data, which is essential to support the National Native Title Tribunal in achieving its outcomes. Under these agreements, the Australian Government provides indemnities against third-party claims arising from errors in the data.
Native title costs
The Australian Government can assist State and Territory governments in meeting certain Native Title costs pursuant to the Native Title Act 1993 (the NTA), including compensation costs. A National Partnership Agreement was executed in 2010 between the Australian Government and Victoria, under which the Australian Government provided a contribution towards the settlement of two native title claims. No other agreement has been entered into to date.
The Australian Government will also be liable for any compensation found to be payable under the NTA in respect of compensable acts for which the Commonwealth is responsible.
The Australian Government’s liability in both scenarios cannot be quantified owing to uncertainty about the number and effect of compensable acts and the value of Native Title affected by those acts.
Defence
Cockatoo Island Dockyard
On 13 October 2001, Cockatoo Island Dockyard (CODOCK) commenced proceedings against the Australian Government (Defence) in the NSW Supreme Court seeking full reimbursement from the Australian Government for personal injury claims costs incurred by CODOCK after 31 October 1995 in relation to asbestos exposure. Following decisions in the NSW Supreme Court on 17 December 2004 and 4 February 2005, and the NSW Court of Appeal on 23 November 2006, CODOCK was awarded a complete indemnity from the Australian Government for its uninsured exposure to asbestos damages claims, plus profit of 7.5 per cent.
Finance (refer also contingencies under ‘Various’)
Australian Government general insurance fund – Comcover
Comcover, the Australian Government’s general insurance fund, provides insurance and risk management services to the Australian Government general government sector. Comcover’s liability for outstanding claims, which includes the expected future cost of claims notified and claims incurred but not reported, is subject to inherent

Notes to the financial statements
157
uncertainty in the estimation process. The Australian Government’s potential liability cannot be quantified at this time.
Superannuation
On 20 April 2007, the High Court of Australia found against the Australian Government on a claim for negligent misstatement relating to superannuation benefits for a former employee of the Department of the Interior. There is potential for more claims to arise from other former temporary employees who upon their retirement can demonstrate negligent misstatement over their eligibility to join an Australian Government superannuation scheme.
Health
Australian Red Cross Society — indemnities and blood and blood products liability cover
The existing Deed of Agreement between the Commonwealth and the Australian Red Cross Society (ARCS) and the National Blood Authority (NBA) in relation to the operations of the Australian Red Cross Blood Service (ARCBS), includes certain indemnities and limited liability in favour of ARCS. These cover a defined set of potential business, product and employee risks and liabilities arising from the operation of the ARCBS. The indemnities and limitation of liability only operate in the event of the expiry and non-renewal, or the early termination of the Deed, and only within a certain scope. They are also subject to appropriate limitations and conditions including in relation to mitigation, contributory fault, and the process of handling relevant claims. Under certain conditions the Australian Government, States and Territories jointly provide indemnity for the ARCBS through a cost-sharing arrangement in relation to the National Managed Fund claims, both current and potential, regarding personal injury and loss or damages suffered by a recipient of certain blood and blood products where other available mitigation or cover is not available. Under a Memorandum of Understanding between governments and the ARCBS, the blood and blood products liability cover for the ARCBS remains in force until all parties agree to terminate the arrangements from an agreed date.
CSL Ltd
Under existing agreements, the Australian Government has indemnified CSL Ltd for certain existing and potential claims made for personal injury, loss or damage suffered through therapeutic and diagnostic use of certain products manufactured by CSL Ltd. The Australian Government has indemnified CSL Ltd for a specific range of events that occurred during the Plasma Fractionation Agreement from 1 January 1994 to 31 December 2004, where alternative cover was not arranged by CSL Ltd.
Medical Indemnity
The Department of Human Services delivers the Incurred But Not Reported Scheme (IBNRS) on behalf of the Australian Government. The IBNR scheme is designed to fund the IBNR liabilities of Medical Defence Organisation’s where they do not have

Notes to the financial statements
158
adequate reserves to cover their liabilities. Eligibility for claim payments under this scheme is dependent on whether the Medical Indemnity Insurer (MII) is deemed to be a participating Medical Defence Organisation under the Medical Indemnity Act 2002 and the Midwife Professional Indemnity (Commonwealth Contribution) Scheme Act 2010.
Medical Indemnity Exceptional Claims Scheme
In May 2003, the Australian Government announced that the Medical Indemnity Exceptional Claims Scheme was to assume liability for 100 per cent of any damages payable against a doctor that exceeds a specified level of cover provided by that doctor’s medical indemnity insurer (currently $20 million). These arrangements would apply to payouts either related to a single large claim or to multiple claims that in aggregate exceed the cover provided by the doctor’s medical indemnity insurer, and would apply to claims notified under contracts-based cover since 1 January 2003.
Vaccines
Under certain conditions, the Australian Government has provided an indemnity to the manufacturer of smallpox vaccine held by the Australian Government, covering possible adverse events that could result from the use of the vaccine in an emergency situation. Further, under certain conditions, certain indemnities have been provided to particular manufacturers of pandemic and pre-pandemic influenza vaccines for the supply or future supply of influenza vaccines (including H1N1 and H5N1). For the period ended 30 June 2014, no claims have been made. The contract under which the contingent liability is recognised has now expired. However, until replacement stock is sourced the contingent liability for use of the vaccine currently held remains with the Commonwealth.
The Australian Medical Association
There is an agreement between the Australian Medical Association Ltd (AMA), the Commonwealth, Australian Private Hospitals Association Ltd, Australian Health Insurance Association and Beyond Blue Ltd for participation in and support of the Private Mental Health Alliance. In respect of identified information collected, held or exchanged by the parties in connection with the National Model for the Collection and Analysis of a Minimum Data Set with Outcome Measures in Private, Hospital-based Psychiatric Services each party has agreed to indemnify each other in respect of any loss, liability, cost, claim or expense, misuse of confidential information or breach of the Privacy Act 1988. The AMA's liability to indemnify the other parties will be reduced proportionally to the extent that any unlawful or negligent act or omission of the other parties or their employees or agents contributed to the loss or damage.

Notes to the financial statements
159
New South Wales Health Administration Council – indemnity
The National Health Funding Body (NHFB) provided an indemnity to the New South Wales government through the New South Wales Health Administration Council (NSW HAC), in relation to a state funding pool account with the Reserve Bank of Australia. The indemnity includes liabilities or claims arising in relation to the NHFB in two respects:
(i) liabilities or claims arising from acts or omissions of NHFB staff as users of pool account information; and
(ii) liabilities or claims arising from unauthorised access to the banking services or system from NHFB premises.
NSW HAC has provided a reciprocal indemnity for the actions of staff of the NHFB to the Reserve Bank of Australia.
Tobacco Plain Packaging Litigation
The Government will continue to fund the defence of legal challenges to the tobacco plain packaging legislation in international forums. Further information about these cases has not been disclosed on the grounds that it may prejudice the outcomes of these cases or may relate to commercial information.
Medicare Locals
Due to the Government's commitment to cease all Commonwealth funding to Medicare Locals from 30 June 2015 the Commonwealth is terminating the Medicare Locals Deed for Funding and Programme Schedules under clause 22.1(i). The Commonwealth is therefore liable for any reasonable costs incurred by Medicare Locals which are directly attributable to the termination. Some funds are also expected to be recovered from a number of sites as a result of the termination, which would partially offset the liability. Neither costs nor potential recoveries can be estimated at present.
Immigration and Border Protection
Northern Maritime Patrol and Response - Triton
The Australian Government has entered into a contractual arrangement with Gardline Australia Pty Ltd until 31 December 2014 for the provision of a vessel to strengthen enforcement activities in Australia’s northern waters. The contract with Gardline Australia contains unquantifiable indemnities relating to the use, or other operations, of armaments and the presence of armaments on the vessel. It also contains unquantifiable indemnities relating to damage to any property or injury to any person caused by the apprehended or escorted persons or their vessel.

Notes to the financial statements
160
Southern Ocean Maritime Patrol and Response Programme
The Australian Government has entered into a contract to provide a Civil Charter Vessel to conduct patrols in the Southern Ocean and northern waters to undertake law enforcement activities in relation to illegal, unregulated and unreported fishing as well as counter people smuggling activities. This contract will remain in force until 31 December 2014. The Australian Government’s contract contains unquantifiable indemnities relating to the use or other operations of armaments and ammunition and the presence of armaments and ammunition on the vessel. It also contains unquantifiable indemnities relating to damage to any property or injury to any person caused by the apprehended or escorted persons or their vessels.
Immigration Detention Services — liability limits
The Australian Government has negotiated arrangements with a number of State and Territory governments for the provision of various services (including health, education, corrections and policing services) to immigration detention facilities and people in immigration detention. Some jurisdictions are seeking indemnification by the Australian Government for the provision of those services.
Infrastructure and Regional Development
Australian Maritime Safety Authority — incident costs
In the normal course of operations, the Australian Maritime Safety Authority is responsible for the provision of funds necessary to meet the clean-up costs arising from ship-sourced marine pollution and, in all circumstances, is responsible for making appropriate efforts to recover the costs of any such incidents.
Industry
Snowy Hydro Limited — water releases
The Australian, New South Wales and Victorian governments have indemnified Snowy Hydro Limited for liabilities arising from water releases in the Snowy River below Jindabyne Dam, where these releases are in accordance with the water licence and related regulatory arrangements agreed between the three governments. The indemnity applies to liabilities for which a claim is notified within 20 years from 28 June 2002.
Liquid Fuel Emergency Act 1984
The Australian Government has responsibility for the Liquid Fuel Emergency Act 1984 (the Act). In addition, the Australian Government and State and Territory governments have entered into an inter-governmental agreement in relation to a national liquid fuel emergency (IGA 2006). Under the IGA, the Australian Government agrees to consult IGA parties on a likely shortage and, if necessary after those consultations, to advise the Governor-General to declare a national emergency under the Act. The IGA also contains three areas where the Australian Government may incur expenses in the unlikely event of a national liquid fuel emergency. These relate to

Notes to the financial statements
161
the direct costs of managing a liquid fuel emergency and include the possibility of the Australian Government reimbursing the State and Territory governments for costs arising from their responses, and potential compensation for industry arising from Australian Government directions under the Act.
Indemnity for Maralinga clean-up
The Australian Government has given 14 unlimited indemnities in relation to the clean-up of the former British atomic test site at Maralinga.
Gorgon liquefied natural gas and carbon dioxide storage project
The Australian and Western Australian governments have agreed in principle to provide an indemnity to the Gorgon Joint Venture Partners (GJV) to indemnify the GJV against independent third-party claims (relating to stored carbon dioxide) under common law following closure of the carbon dioxide sequestration project, and subject to conditions equivalent to those set out in the Offshore Petroleum and Greenhouse Gas Storage Act 2006. It is proposed that the Western Australian Government will indemnify the GJV, and that the Australian Government will indemnify the Western Australian Government for 80 per cent of any amount determined to be payable under that indemnity. The formal agreement between the Australian and Western Australian governments in relation to the indemnity is expected to be signed in 2014-15.
Social Services
Business Services Wage Assessment Tool - Litigation
The Australian Government may potentially become liable for a significant range of costs following the full Federal Court ruling (21 December 2012) that the use of the Business Services Wage Assessment Tool (BSWAT) to assess the wages of two intellectually disabled employees constituted unlawful discrimination under the Disability Discrimination Act 1992. The Australian Government’s potential liability cannot be quantified at this time.
Treasury
Commitments under expanded IMF New Arrangements to Borrow (NAB)
Australia has made a line of credit available to the IMF under its NAB since 1998. During 2014 Australia met six calls under the NAB totalling A$209.5 million (SDR 126.4 million). In 2012-13 Australia provided A$185.4 million (SDR 126.0 million) under the NAB. Under the IMF’s current ‘Resource Mobilization Plan’, a maximum of Special Drawing Rights (SDR) 36.4 million (A$59.5 million as at 30 June 2014) could have been called by the IMF between the period 1 July 2014 to 30 September 2014. Subsequent to this period, the amount is subject to change. The precise amount that will be called by the IMF cannot be determined accurately. As at the completion of these statements, the IMF has not called on the NAB.
Notes to the financial statements
162
Grants to States and Territories
As the Treasury has responsibility for all payments to the States and Territories under the Federal Financial Relations Framework, remote and unquantifiable liabilities may exist in relation to some agreements between the relevant agency with policy responsibility and the States and Territories. Whilst the Treasury does not bear the risk of the contingent event, the resultant payment would be made and reported by the Treasury under the Federal Financial Relations Framework.
Loan to New South Wales for James Hardie Asbestos Injuries Compensation Fund
The Australian Government has agreed to lend up to $160 million to the State Government of New South Wales (NSW) to support the loan facility to top up the James Hardie Asbestos Injuries Compensation Fund. Draw down on the loan is subject to the James Hardie Asbestos Injuries Compensation Fund requiring funds to meet its liabilities and is contingent on NSW meeting a number of conditions under the loan agreement with the Australian Government. The timing and amounts that may be drawn down by NSW cannot be determined accurately. A further $25.3 million in funding was provided to the State Government of NSW in respect of the loan facility in 2013-14. (2012-13: $0).
Terrorism insurance — Australian Reinsurance Pool Corporation (ARPC)
The Terrorism Insurance Act 2003 established a scheme for replacement terrorism insurance covering damage to commercial property including associated business interruption and public liability. The Australian Reinsurance Pool Corporation (ARPC) uses reinsurance premiums paid by insurers to meet its administrative expenses and to build a fund and purchase reinsurance to help meet future claims. The Australian Government guarantees to pay any liabilities of the ARPC, but the Treasurer must declare a reduced payout rate to insured parties if the Australian Government’s liability would otherwise exceed $10 billion.
Various
Officers’ and directors’ indemnities
From time to time, the Australian Government has provided warranties, undertakings and indemnities (indemnities) to directors, committee members, advisors officers and/or staff of organisations for activities undertaken in good faith in assisting the Commonwealth in relation to asset sales, reviews and other arrangements. Indemnities have been issued in relation to:
• the directors of NBN Co as a result of the Commonwealth failing to meet its funding obligations to NBN Co. The liabilities covered by this indemnity would be the same as those covered by the NBN Co Equity Agreement, with the exception of any legal expenses incurred by individual Directors arising from this indemnity. Relevant Directors are also indemnified in relation to claims arising out of their involvement in the negotiation and entry by NBN Co into the Financial Heads of

Notes to the financial statements
163
Agreement, dated June 2010, with Telstra (through the Department of Communications);
• Export Finance and Insurance Corporation (EFIC) board members and senior management to protect against civil claims and legal expenses for unsuccessful criminal claims relating to the implementation of EFIC’s alliance/divestment of its short-term export credit insurance business;
• Maritime Industry Finance Company Ltd board members to protect them against civil claims relating to their employment and conduct as directors (through the Department of Infrastructure and Regional Development);
• certain specified members of the review into the Australian Human Pituitary Hormone Programme for the purposes of the review (Department of Health);
• certain specified members of the review into the Diagnostics Products Agreement for the purpose of the review (Department of Health);
• officers of the Australian Nuclear Science and Technology Organisation from liability that might be incurred from the conduct of activities authorised under the Australian Nuclear Science and Technology Organisation Act 1987 (Department of Industry);
In relation to the sale of Australian Government entities, the Australian Government has indemnified the boards and/or acquirers of certain entities against certain claims and costs arising from the sales of the entities.
Other guarantees, indemnities and undertakings
A range of guarantees, indemnities and undertakings have been provided by Australian Government entities in relation to various matters. Some of these guarantees, indemnities and undertakings are unlimited.
Claims and legal actions
At any time various Australian Government entities are subject to claims and legal actions that are pending court or other processes.
Property remediation — Defence and other sites
From time to time, the Australian Government may have ownership of properties that have a potential or possible environmental and associated concern. Where this is the case, further reviews may be undertaken to determine the extent, nature and estimated costs of remediation, if required.
The Australian Government has detected some contamination at the former site of the National Halon Bank in Braybrook, Victoria, which was leased to the Commonwealth. Investigations are continuing into the cause, source and timing of the contamination. Once these investigations have been completed, the extent of any potential soil and

Notes to the financial statements
164
groundwater remediation costs for the parties involved, including the Commonwealth, will be clearer.
Lease arrangements
Various Australian Government entities have entered into finance and/or operating leases for goods and services. On termination or expiry of the lease term these entities may have an obligation to acquire assets from the lessor or comply with make good provisions. In the majority of arrangements, a provision has been recognised on the balance sheet. In some arrangements, it has not been possible to estimate the amount of any eventual payment in relation to these obligations.
Non-quantifiable contingent assets Industry
Wireless local area network
The Commonwealth Scientific and Industrial Research Organisation (CSIRO) is currently involved in several legal proceedings related to a family of wireless local area network (WLAN) patents which it owns and has licensed broadly. The proceedings are additional to similar proceedings settled by CSIRO in 2009 and 2012. Two actions in the USA involve claims and counterclaims related to patent damages, infringement, patent validity, and related matters. The first of those cases to proceed to trial was heard in February 2014. A damages award of USD $16 million plus interest was made. However, the damages award is expected to be appealed by the defendant Cisco. A trial is set for July 2015 in the other of those two US cases. In August 2013 a further proceeding was filed in Germany seeking damages for patent infringement, and the defendant Nokia has filed a so-called “nullity” proceeding, claiming that CSIRO’s German patent is invalid. If successful in these actions, CSIRO expects to receive significant revenue which would exceed the associated legal cost. At this stage, the revenue and costs are considered unquantifiable.
Treasury
HIH Claims Support Scheme (HCSS)
As an insured creditor in the liquidation of the HIH Group, the Australian Government is entitled to payments arising from the HCSS’s position in the Proof of Debt of respective HIH companies. Treasury has received payments from the HIH Estate during 2013-14, however, the timing and amount of future payments are unknown and will depend on the outcome of the estimation process and the completion of the liquidation of the HIH Group.
International Monetary Fund (IMF)
Since 1986, the IMF has used its burden sharing mechanism to make up for the loss of income from unpaid interest charges on the loans of debtor members and to accumulate precautionary balances in a Special Contingent Account to protect the IMF against losses arising from the failure of a member to repay its overdue principal

Notes to the financial statements
165
obligations. The mechanism works by providing for additions to the rate of charge on IMF loans and deductions to the rate of remuneration for creditor members such as Australia. Resources collected from individual members under the burden sharing mechanism are refundable to them as arrears cases are resolved, or as may be decided by the IMF. Thus, resources collected for unpaid charges are refunded when these charges are eventually settled. Likewise, precautionary balances held in the Special Contingent Account would be distributed back to members in proportion to their cumulative contributions when there are no overdue charges or principal balances. The IMF could also decide to make an early distribution. As there is considerable and inherent uncertainty around the timing and amounts of burden sharing to be refunded to Australia this contingent asset cannot be reliably measured and as such is recorded as an unquantifiable contingent asset.
Various
Claims and legal action
At any time various Australian Government entities are pursuing claims and legal actions that are pending court or other processes.
Non-quantifiable contingent liabilities considered remote Agriculture
Compensation claims arising from equine influenza outbreak
The Australian Government may become liable for compensation should it be found negligent in relation to the outbreak of equine influenza in 2007. Proceedings have commenced in the Federal Court of Australia by Maurice Blackburn Lawyers with Attwood Marshall Lawyers who represent a closed class of 586 applicants claiming damages as a result of the 2007 equine influenza outbreak. No final quantum of damages sought can be calculated.
Emergency pest and disease response agreements
National emergency response arrangements for animal, plant and environmental pest and disease outbreaks are largely funded through cost sharing agreements between Australian governments and, where relevant, agricultural industry bodies. Under the terms of the agreements, the Australian Government is typically liable for 50 per cent of total government funding to respond to a disease or pest outbreak. Limited funding is provided in the forward estimates for the Australian Government’s contribution under emergency response agreements with States and Territories. This funding is unlikely to be sufficient to meet the unquantifiable costs of a major outbreak or large scale emergency response exercise. The Australian Government may be expected to contribute bilaterally in situations where an incursion is not covered by a cost sharing agreement or where the relevant industry body is not party to an agreement. The Australian Government may also provide financial assistance to an industry party by funding its initial share of the response. These contributions may subsequently be recovered from the industry over a 10-year period, usually by a levy.

Notes to the financial statements
166
Research and development
The Australian Government encourages expenditure on research and development to increase the competitiveness and sustainability of industries within Australia. Under several Acts, the Commonwealth provides contributions to a number of nominated entities responsible for undertaking research and development activities in respect of portfolio industries. These contributions are typically made on a matching basis.
At 30 June 2014, the Commonwealth had a maximum potential liability in respect of matching payments of approximately $401 million (30 June 2013: $347 million). However, the Commonwealth's actual future liability is contingent on a combination of several currently indeterminate independent factors which are beyond the control of both the department and the recipient entities, in particular the future annual levels of levy collections and determined gross values of production. The likelihood of meeting the eligibility requirements and the amount of future payments is uncertain. Hence, this liability is considered to be both contingent and remote.
Communications
Termination of the funding agreement with OPEL
Following the termination of its agreement with OPEL Network Pty Ltd (OPEL) under the Broadband Connect Programme, the Commonwealth made provision towards costs incurred by OPEL in producing its Implementation Plan. OPEL was wound up on 13 March 2009. Proceedings were commenced in the NSW Federal Court by the OPEL Liquidators and Optus on 5 September 2013 in respect of the termination of the funding agreement (including a claim relating to the costs for the preparation of the Implementation Plan).
Defence
Guarantees, indemnities and undertakings
The Australian Government, through the Department of Defence and the Defence Materiel Organisation, carries an extensive range of guarantees, indemnities and undertakings, normally of a short-term nature, relating to business, training activities and other arrangements involving contracts, agreements and other Defence activities. Indemnities issued cover potential losses or damages for which the Australian Government would not be liable without the indemnity.
Infrastructure and Regional Development
Tripartite Deeds relating to the sale of core regulated airports
The tripartite deeds between the Australian Government, the airport lessee company and financiers amend the airport (head) leases to provide for limited step-in-rights for financiers in circumstances where the Australian Government terminates the head lease to enable the financiers to correct the circumstances that triggered such a termination event. The tripartite deeds may require the Australian Government to pay financiers compensation as a result of its termination of the (head) lease. The

Notes to the financial statements
167
Australian Government’s contingent liabilities are considered to be unquantifiable and remote.
Treasury
Foreign currency denominated loans
The Australian Government has indemnified agents of foreign currency denominated loans issued by the Australian Government outside Australia against any loss, liability, costs, claims, charges, expenses, actions, or demands due to any misrepresentation by the Australian Government and any breach of warranties. The Australian Government is not aware of any event that has occurred that may trigger action under the indemnities.
Treasury bonds
In the extremely unlikely event of default by a borrower of Treasury bonds under the securities lending facility, the AOFM would be in a position to sell the securities pledged by the borrower to offset the increased liability to the government. As at 30 June 2014 there were no open transactions under the AOFM’s securities lending facility.
Various
Officers’ and directors’ indemnities
From time to time, the Australian Government has provided warranties, undertakings and indemnities (indemnities) to directors, committee members, advisors officers and/or staff of organisations for activities undertaken in good faith in assisting the Commonwealth in relation to asset sales, reviews and other arrangements. Indemnities (a number of which are considered remote but have been included for completeness) have been issued in relation to:
• Former Directors of the Australian Submarine Corporation Pty Ltd (ASC) with indemnities in relation to three matters: for any claim against them as a result of complying with the ASC’s obligations under the Process Agreement between the Electric Boat Corporation (EBC), the Australian Government and the ASC; for any claim against them as a result of complying with the ASC’s obligations under the Service Level Agreement between the ASC, the Department of Defence, EBC and Electric Boat Australia; and for any claims and legal costs arising from the Directors acting in accordance with the Board’s tasks and responsibilities, as defined under the indemnity.
• Directors, officers and employees of ADI Limited for claims and legal costs associated with assistance related to the sale of the Australian Government’s shares in the company. The Australian Government has provided an indemnity to ADI Limited for uninsured losses relating to specific heads of claims.

Notes to the financial statements
168
• The board members of the Moorebank Intermodal Company Limited (MIC) to protect them against civil claims relating to their employment and conduct as directors. The indemnities apply to the period of appointment as board members of the company. Until the indemnity agreements are varied or brought to an end, they will remain as contingent and unquantifiable liabilities.
• Deeds of Indemnity for members of the Future Fund Board of Guardians (Board members). The indemnities are intended to cover liabilities in excess of the insurance policies of the Future Fund Board and its subsidiary entities. The indemnity is financially limited, in broad terms, to the value of the funds under management by the Future Fund Board of Guardians.
• The Directors of the Commonwealth Superannuation Corporation. The Governance of Australian Government Superannuation Schemes Act 2011 (the Governance Act) provides for specific immunities for activities undertaken in good faith by Directors and delegates of the board of the Commonwealth Superannuation Corporation (CSC), provided these activities relate to the performance of their functions.
Claims and legal actions
At any time various Australian Government entities are subject to claims and legal actions which are pending court or other processes.
Guarantees, indemnities and undertakings
A range of guarantees, indemnities and undertakings have been provided by Australian Government entities in relation to various matters. Some of these guarantees, indemnities and undertakings are unlimited. A range of guarantees, indemnities and undertakings have been issued in relation to:
Transactional banking services
• The Australian Government has indemnified the Reserve Bank of Australia and contracted private sector banks against loss and damage arising from error or fraud by the entity, or transactions made by the bank with the authority of the entity.
Property remediation – Defence and other sites
• From time to time, the Australian Government may have ownership of properties that have a potential or possible environmental and associated concern. Where this is the case, further reviews may be undertaken to determine the extent, nature and estimated costs of remediation, if required.
• Defence has made financial provision for the possible costs involved in restoring, decontaminating and decommissioning Defence sites in Australia where a legal or constructive obligation has arisen. For those decontaminating and decommissioning Defence sites for which there is no legal or constructive obligation, the potential costs have not been assessed and are unquantifiable.

Notes to the financial statements
169
• On 4 September 2008, a 150 year lease for Googong Dam was signed between the Australian Government and the Australian Capital Territory (ACT) Government. The Australian Government is liable to pay just terms compensation if the terms of the lease are breached by introducing new legislation or changing the Canberra Water Supply (Googong Dam) Act 1974 in a way that impacts on the rights of the ACT. The lease includes a requirement for the Australian Government to undertake rectification of easements or any defects in title in relation to Googong Dam, and remediation of any contamination it may have caused to the site. It also gives an indemnity in relation to acts or omissions by the Australian Government.
Non-quantifiable contingent assets considered remote Various
Claims and legal action
At any time various Australian Government entities are pursuing claims and legal actions that are pending court or other processes.

Notes to the financial statements
170
Note 37: Financial instruments Details of the significant accounting policies, key definitions, and methods adopted, including criteria for recognition and the basis for measurement in respect of each class of financial asset and financial liability are disclosed in Note 1.
(a) Categories of financial instruments
2014 2013 2014 2013$m $m $m $m
Financial assetsLoans and receivables 32,286 18,686 109,816 70,444Financial assets at fair value through profit or loss 167,573 152,423 202,612 183,320Held to maturity 3,502 3,081 4,179 3,105Available for sale 46,305 34,950 11,810 12,099Carrying amount of financial assets 249,666 209,140 328,417 268,968
Financial liabilitiesFinancial liabilities at fair value through profit or loss 353,499 291,883 351,223 294,598Other financial liabilities 26,464 25,718 126,925 96,901
Carrying amount of financial liabilities 379,963 317,601 478,148 391,499
General AustralianGovernment Government
Financial assets at amortised cost that has been calculated using a valuation method
Certain financial assets categorised as ‘loans and receivables’ and measured at amortised cost were initially measured at fair value using a valuation method as a quoted price was not observable. These include:
• the general government sector’s investment in the IMF quota is classified as ‘available for sale’ but is measured at cost as fair value cannot be reliably measured due to its unique nature. The investment in the IMF quota was valued at $5,306 million at 30 June 2014 (2013: $5,247 million); and

Notes to the financial statements
171
• the Guarantee Scheme for Large Deposits and Wholesale Funding and the Guarantee of State and Territory Borrowing contractual fee receivable represents the requirement under AASB 139 Financial Instruments: Recognition and Measurement for the Australian Government to recognise up front, its entitlements under the financial guarantee contract to revenue received or receivable from authorised deposit taking institutions over the contracted guarantee period. Conversely, the Australian Government is required to recognise a corresponding initial liability for its contractual obligation to provide a guarantee service over the period covered by each guarantee contract (analogous to unearned income). The contractual fee receivable for the Guarantee Scheme for Large Deposits and Wholesale Funding and the Guarantee of State and Territory Borrowing was valued at $23 million (2013: $337 million) and $113 million (2013: $199 million) respectively. The corresponding service obligation liability is valued at the same amounts.
Concessional loans
The fair values of Australian Government and general government sector financial assets and liabilities approximate their carrying amounts as reported in the consolidated financial statements, with the exception of the subsequent measurement of concessional loans categorised as ‘loans and receivables’ under AASB 139 Financial Instruments: Recognition and Measurement.
On recognition, the fair values for those concessional loans categorised as ‘loans and receivables’ were determined using the methods described below:
• Advances and loans reported by the Department of Industry are obtained by reference to market prices that employ observable market transactions.
• Loans to State and Territory governments, including those reported by the Australian Office of Financial Management and the Department of Finance, are recognised at amortised cost. These transactions are not traded and, especially for those with the longest term to maturity, a direct market benchmark to underpin fair value measurement does not exist. Data on Treasury bonds are used in estimating fair value.
Subsequent to recognition, the above loans are carried at amortised cost which may differ to an updated fair value. Other concessional loans, including student loans provided under the Higher Education Loans Programme and home and business loans provided by Indigenous Business Australia (IBA), have been categorised as ‘held at fair value through the profit and loss’. As such, the carrying amount of these loans is updated each reporting period to reflect fair value.
The following table details the nominal value of material concessional loans as well as the unexpired discount.

Notes to the financial statements
172
Concessional loans
Nominal value Unexpired discount
Nominal value
Unexpired discount
$m $m $m $m
HECS / HELP Loans 35,311 (1,949) 30,135 (1,415)Other student loans 2,181 (11) 2,206 (54)State and Territory Governments - AOFM 2,374 (267) 2,463 (285)IBA Home and Business Loans 943 (286) 863 (268)Australia Indonesia Partnership for
Reconstruction and Development 462 (341) 422 (321)Industry 286 (159) 294 (160)ACT Housing 155 (55) 162 (59)Returned service personnel 74 (24) 77 (24)Aged care facilities 245 (22) 176 (45)Natural Disaster Relief and Recovery
Arrangements 138 (11) 34 (3)Pension Bonus Scheme 32 (2) 31 (2)Northern Territory and Norfolk Island 86 (8) 74 (9)Total 42,287 (3,137) 36,937 (2,645)
2014 2013
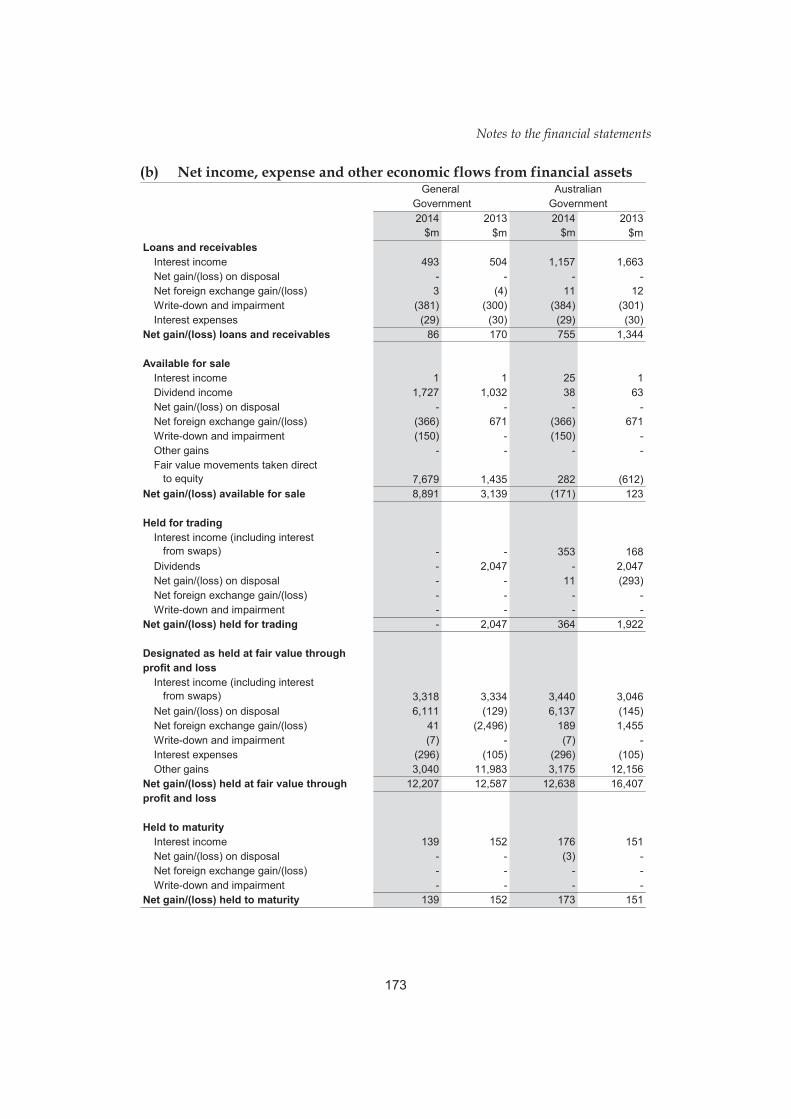
Notes to the financial statements
173
(b) Net income, expense and other economic flows from financial assets
2014 2013 2014 2013$m $m $m $m
Loans and receivablesInterest income 493 504 1,157 1,663Net gain/(loss) on disposal - - - -Net foreign exchange gain/(loss) 3 (4) 11 12Write-down and impairment (381) (300) (384) (301)Interest expenses (29) (30) (29) (30)
Net gain/(loss) loans and receivables 86 170 755 1,344
Available for saleInterest income 1 1 25 1Dividend income 1,727 1,032 38 63Net gain/(loss) on disposal - - - -Net foreign exchange gain/(loss) (366) 671 (366) 671Write-down and impairment (150) - (150) -Other gains - - - -Fair value movements taken direct to equity 7,679 1,435 282 (612)
Net gain/(loss) available for sale 8,891 3,139 (171) 123
Held for tradingInterest income (including interest from swaps) - - 353 168Dividends - 2,047 - 2,047Net gain/(loss) on disposal - - 11 (293)Net foreign exchange gain/(loss) - - - -Write-down and impairment - - - -
Net gain/(loss) held for trading - 2,047 364 1,922
Designated as held at fair value throughprofit and loss
Interest income (including interest from swaps) 3,318 3,334 3,440 3,046Net gain/(loss) on disposal 6,111 (129) 6,137 (145)Net foreign exchange gain/(loss) 41 (2,496) 189 1,455Write-down and impairment (7) - (7) -Interest expenses (296) (105) (296) (105)Other gains 3,040 11,983 3,175 12,156
Net gain/(loss) held at fair value through 12,207 12,587 12,638 16,407profit and loss
Held to maturityInterest income 139 152 176 151Net gain/(loss) on disposal - - (3) -Net foreign exchange gain/(loss) - - - -Write-down and impairment - - - -
Net gain/(loss) held to maturity 139 152 173 151
Government GovernmentGeneral Australian
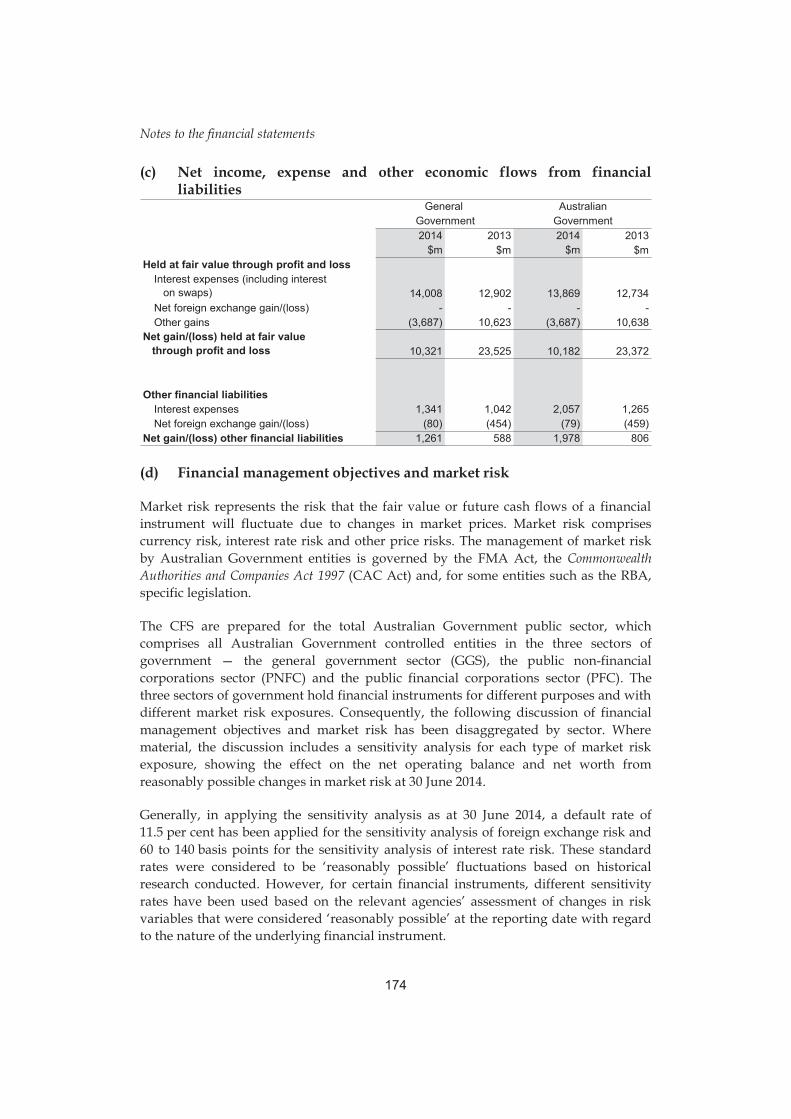
Notes to the financial statements
174
(c) Net income, expense and other economic flows from financial liabilities
2014 2013 2014 2013$m $m $m $m
Held at fair value through profit and lossInterest expenses (including interest on swaps) 14,008 12,902 13,869 12,734Net foreign exchange gain/(loss) - - - -Other gains (3,687) 10,623 (3,687) 10,638
Net gain/(loss) held at fair value through profit and loss 10,321 23,525 10,182 23,372
Other financial liabilitiesInterest expenses 1,341 1,042 2,057 1,265Net foreign exchange gain/(loss) (80) (454) (79) (459)
Net gain/(loss) other financial liabilities 1,261 588 1,978 806
General AustralianGovernment Government
(d) Financial management objectives and market risk
Market risk represents the risk that the fair value or future cash flows of a financial instrument will fluctuate due to changes in market prices. Market risk comprises currency risk, interest rate risk and other price risks. The management of market risk by Australian Government entities is governed by the FMA Act, the Commonwealth Authorities and Companies Act 1997 (CAC Act) and, for some entities such as the RBA, specific legislation.
The CFS are prepared for the total Australian Government public sector, which comprises all Australian Government controlled entities in the three sectors of government — the general government sector (GGS), the public non-financial corporations sector (PNFC) and the public financial corporations sector (PFC). The three sectors of government hold financial instruments for different purposes and with different market risk exposures. Consequently, the following discussion of financial management objectives and market risk has been disaggregated by sector. Where material, the discussion includes a sensitivity analysis for each type of market risk exposure, showing the effect on the net operating balance and net worth from reasonably possible changes in market risk at 30 June 2014.
Generally, in applying the sensitivity analysis as at 30 June 2014, a default rate of 11.5 per cent has been applied for the sensitivity analysis of foreign exchange risk and 60 to 140 basis points for the sensitivity analysis of interest rate risk. These standard rates were considered to be ‘reasonably possible’ fluctuations based on historical research conducted. However, for certain financial instruments, different sensitivity rates have been used based on the relevant agencies’ assessment of changes in risk variables that were considered ‘reasonably possible’ at the reporting date with regard to the nature of the underlying financial instrument.

Notes to the financial statements
175
General government sector As detailed in Note 1, the GGS provides public services that are mainly non-market in nature, and for the collective consumption of the community, or involve the transfer or redistribution of income. GGS entities hold financial instruments as part of their operations or for public policy purposes.
Management of interest rate risk in the general government sector General risk management
Agencies subject to the FMA Act are required to draw down administered and departmental monies on an ‘as-needed’ basis. As a general principle, FMA Act agencies cannot invest public monies except as delegated under section 39 of the FMA Act or authorised by legislation. Companies and authorities subject to the CAC Act are also restricted in how they can invest monies that are surplus to operational requirements. As a general principle, surplus money may only be placed on deposit with a bank or invested directly in securities issued or guaranteed by the Australian Government, a State or a Territory, unless an exemption is approved by the Finance Minister. Financial assets held by the majority of GGS entities are non-interest bearing, including trade receivables, or have fixed interest and do not fluctuate due to changes in the market interest rate.
The Treasurer has delegated investment powers to the Australian Office of Financial Management (AOFM). The AOFM’s functions give it primary responsibility for ensuring that the Australian Government has sufficient cash to meet its needs. As at 30 June 2014, AOFM had deposited $27.1 billion in term deposits with the RBA on behalf of the Australian Government (2013: $20.1 billion). As these investments are internal to the Australian Government reporting entity, they are not reported in the Consolidated Financial Statements, except at the General Government level.
Investment funds
The Australian Government is meeting its commitment to Australia’s future by drawing on previous and future surpluses to invest in several funds. As at 30 June 2014, the following significant funds were in operation:
• Future Fund;
• Building Australia Fund (BAF);
• Education Investment Fund (EIF); and
• Health and Hospitals Fund (HHF).
The Future Fund was established by the Future Fund Act 2006 to finance the Australian Government’s unfunded public sector superannuation liability. The Future Fund Board of Guardians is responsible for the investment decisions of the Fund under an

Notes to the financial statements
176
Investment Mandate issued by the Australian Government. The Investment Mandate requires the Board to maximise returns above a benchmark rate whilst taking acceptable but not excessive risk. The benchmark rate has been set at CPI + 4.5 per cent to 5.5 per cent per annum over the long term. Section 39 of the FMA Act does not apply to investments of the fund.
As at 30 June 2014, the Future Fund’s exposure to interest rates consisted of $11,037 million in floating interest rate securities (2013: $11,367 million) and $17,387 million in fixed interest rate securities (2013: $16,301 million).
The following table demonstrates the impact on the net operating balance and net worth of a 60 basis points (2013: 120 basis points) change in Future Fund interest rate bond yields with all other variables held constant.
Interest rate risk
Change in risk
variable
Operating balance
Net worth Operating balance
Net worth
2014 2014 2013 2013$m $m $m $m
Asset portfolios (including derivatives) +60bp (308) (308) n/a n/a-60bp 328 328 n/a n/a
+120bp n/a n/a (443) (443)-120bp n/a n/a 493 493
Effect on Effect on
Exchange traded interest rate futures are used by the Future Fund’s investment managers to manage the exposure to interest rates and to ensure it remains within approved limits. At 30 June 2014, the notional value of open futures contracts and swaps totalled $8,982 million (2013: $1,796 million).
The Building Australia Fund (BAF), Education Investment Fund (EIF) and Health and Hospitals Fund (HHF) were established by the Nation-building Funds Act 2008 on 1 January 2009 and their investments are also managed by the Future Fund Board of Guardians.
The Funds were established to provide financing sources to meet the Australian Government’s commitment to Australia’s future by investment in critical areas of infrastructure. The objective of each Fund is as follows:
• BAF — to make payments in relation to the creation or development of transport, communications, eligible national broadband network matters, energy and water infrastructure;
• EIF — to make payments in relation to the creation or development of higher education infrastructure, vocational education and training infrastructure, eligible education and research infrastructure; and
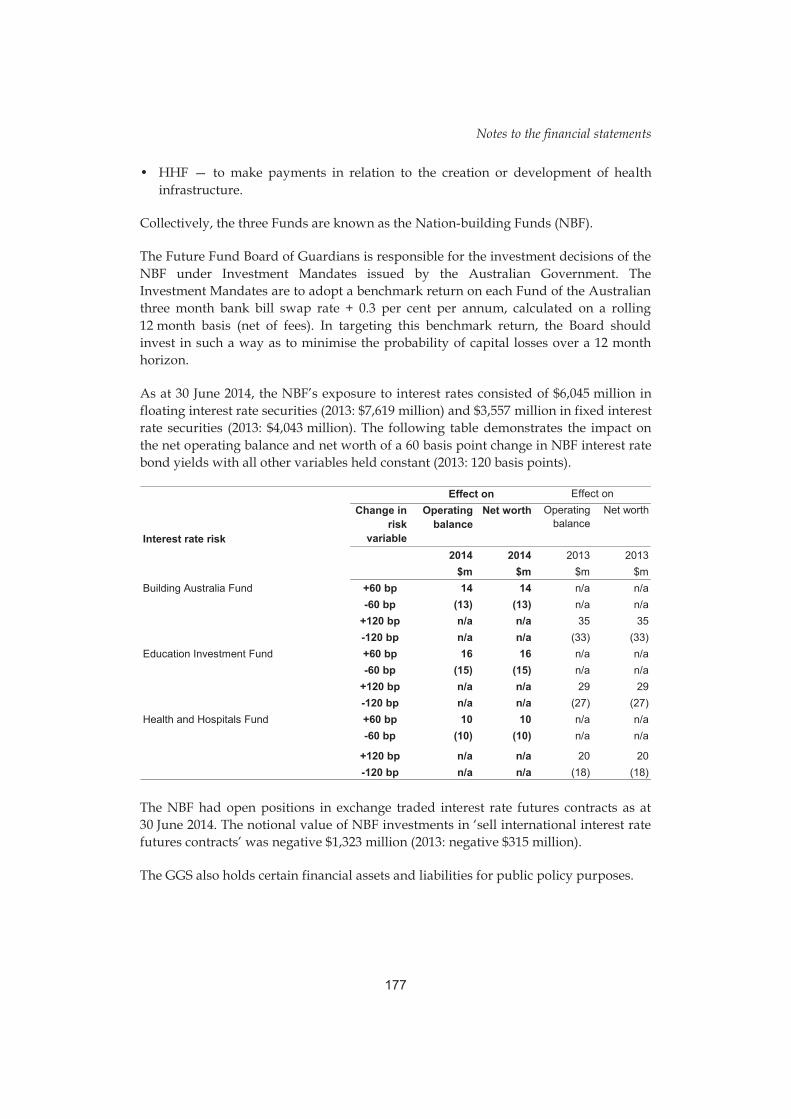
Notes to the financial statements
177
• HHF — to make payments in relation to the creation or development of health infrastructure.
Collectively, the three Funds are known as the Nation-building Funds (NBF).
The Future Fund Board of Guardians is responsible for the investment decisions of the NBF under Investment Mandates issued by the Australian Government. The Investment Mandates are to adopt a benchmark return on each Fund of the Australian three month bank bill swap rate + 0.3 per cent per annum, calculated on a rolling 12 month basis (net of fees). In targeting this benchmark return, the Board should invest in such a way as to minimise the probability of capital losses over a 12 month horizon.
As at 30 June 2014, the NBF’s exposure to interest rates consisted of $6,045 million in floating interest rate securities (2013: $7,619 million) and $3,557 million in fixed interest rate securities (2013: $4,043 million). The following table demonstrates the impact on the net operating balance and net worth of a 60 basis point change in NBF interest rate bond yields with all other variables held constant (2013: 120 basis points).
Interest rate risk
Change in risk
variable
Operating balance
Net worth Operating balance
Net worth
2014 2014 2013 2013$m $m $m $m
Building Australia Fund +60 bp 14 14 n/a n/a-60 bp (13) (13) n/a n/a
+120 bp n/a n/a 35 35-120 bp n/a n/a (33) (33)
Education Investment Fund +60 bp 16 16 n/a n/a-60 bp (15) (15) n/a n/a
+120 bp n/a n/a 29 29-120 bp n/a n/a (27) (27)
Health and Hospitals Fund +60 bp 10 10 n/a n/a-60 bp (10) (10) n/a n/a
+120 bp n/a n/a 20 20-120 bp n/a n/a (18) (18)
Effect on Effect on
The NBF had open positions in exchange traded interest rate futures contracts as at 30 June 2014. The notional value of NBF investments in ‘sell international interest rate futures contracts’ was negative $1,323 million (2013: negative $315 million).
The GGS also holds certain financial assets and liabilities for public policy purposes.

Notes to the financial statements
178
Debt management The majority of GGS entities are prohibited from borrowing. The AOFM is responsible for the borrowing activities of the GGS and for overall debt management.
For many years, debt issuance by the Australian Government was undertaken solely with the objective of maintaining the Treasury bond and Treasury bond futures markets, as successive budget surpluses removed the need to borrow to fund the Budget. The forecast Budget outlook changed in the Updated Economic and Fiscal Outlook published on 3 February 2009 and the objective of issuance changed to funding the Budget.
As a means of diversifying its funding sources, in September 2009, the Australian Government resumed issuance of Treasury indexed bonds.
The main types of market risk the Australian Government’s debt portfolio is exposed to is domestic interest rate risk and domestic inflation risk. Moreover, by generally issuing/buying and holding to maturity, the market risk most relevant to the debt portfolio is the risk of fluctuations to future interest cash flows and principal amounts arising from changes in interest rates and inflation. In market value terms, as at 30 June 2014, the AOFM had issued $351,275 million in Commonwealth Government securities (2013: $285,741 million).
The following table provides a sensitivity analysis of interest rate risk in relation to the debt portfolio. Inflation risk is covered under the management of other price risk in another part of this note.
At 1 July 2013, if domestic interest rates had experienced an immediate 100 basis point parallel upward (downward) movement across the yield curve, and if that change were to persist for the 12 months to 30 June 2014, with all other variables held constant, the effect on the net operating balance and net worth position would be as follows:
Interest rate risk
Change in risk
variable
Operating balance
Net worth Operating balance
Net worth
2014 2014 2013 2013$m $m $m $m
Treasury bonds +100 bp (230) (230) (185) (185)-100 bp 269 269 214 214
Treasury notes +100 bp (40) (40) (49) (49)-100 bp 40 40 49 49
Effect on Effect on
Until 30 June 2008, the AOFM used interest rate swaps to reduce the accrual cost of its borrowing by exchanging fixed rate exposure for floating rate exposure. It stopped doing this because interest rate structures had reduced the potential savings. The

Notes to the financial statements
179
portfolio of interest rate swaps has now been wound down. The cost and risk of the debt portfolio is now managed through debt issuance and investment activities.
Residential mortgage-backed securities In September 2008, the Australian Government announced that it would invest up to $4 billion in residential mortgage-backed securities (RMBS) to support competition in the Australian residential mortgage market. In October 2008, this initiative was extended to $8 billion, of which a maximum of $4 billion may be in RMBS issued by authorised deposit taking institutions. In November 2009, the Australian Government extended the programme by up to an additional $8 billion subject to market conditions. An additional objective of the extended programme was to provide support for lending to small business through participating lenders agreeing to direct some of the proceeds received for lending to small business. In December 2010, the Australian Government announced an extension to the programme by up to an additional $4 billion (bringing the programme to $20 billion). On behalf of the Australian Government, the AOFM acquired a total of $15,462 million of AAA (or equivalent) rated RMBS up to 30 June 2014. The amount held as at 30 June was $6,016 million (in principal terms).
Interest earned on RMBS comprises a floating interest rate (set against the one-month Bank Bill Swap (BBSW) reference rate) plus a fixed margin set at the time each investment is acquired. The following table demonstrates the impact on the net operating balance and net worth of a 100 basis point change to the one-month BBSW rate with all other variables held constant.
Interest rate risk
Change in risk
variable
Operating balance
Net worth Operating balance
Net worth
2014 2014 2013 2013$m $m $m $m
Residential mortgage backed +100 bp 51 51 79 79securities -100 bp (51) (51) (79) (79)
Effect on Effect on
Concessional loans held for policy purposes The Australian Government has entered into a number of concessional loan arrangements for policy purposes. These include student loans provided under the Higher Education Loan Programme (2014: $25,147 million, 2013: $21,593 million) and loans to State and Territory Governments under previous Commonwealth-State financing arrangements (2014: $2,106 million, 2013: $2,177 million).
Consistent with the requirements of AASB 139 Financial Instruments: Recognition and Measurement, these loans are initially valued at fair value applying market interest rates.

Notes to the financial statements
180
Student loans have been designated as ‘held at fair value through the profit and loss’. Changes in market interest rates will impact on the fair value of these loans but will have no impact on the future cash flows or principal amounts at maturity. Loans to State and Territory Governments are of a fixed interest credit foncier nature. Other concessional loans have been designated as ‘loans and receivables’ and have no exposure to interest rate risk.
Investments, multi-lateral grants and contributions payable The Department of Foreign Affairs and Trade administers material financial assets on behalf of the Australian Government. The Australian Government is the holder of these financial instruments, with the issuers being partner foreign governments and multi-lateral aid organisations including the Asian Development Fund (ADF) and the International Development Association (IDA). Financial instruments are recognised on a trade date basis. The fair value of the non-monetary ‘available for sale’ debt instrument at 30 June 2014 was $1,545 million (2013: $1,494 million).
Grants are made to a number of international, United Nations (UN) and Australian Government organisations. The fair value of multi-lateral grants payable at 30 June 2014 was $590 million (2013: $492 million) and multilateral contributions payable was $1,069 million at 30 June 2014 (2013: $898 million).
The following table demonstrates the impact of a 60 basis points (2013: 140 basis points) interest rate change in the calculation of the above instruments on the net operating balance and net worth. The interest rate risk reflects the impact on assets and liabilities of movements, either alone or in combination, of the following interest rate variables: i) United States dollar (USD) 30-year Government bond rate; ii) the currency risk, liquidity risk and sovereign risk premiums (obtained via independent professional advice) as they apply to the borrowing countries party to the IDA and ADF; and, iii) the ten-year Australian government bond rate.
Interest rate risk
Change in risk
variable
Operating balance
Net worth Operating balance
Net worth
2014 2014 2013 2013$m $m $m $m
International Development Association +60 bp 101 101 n/a n/aand Asia Development Fund -60 bp (104) (104) n/a n/a
+140 bp n/a n/a 64 64-140 bp n/a n/a (84) (84)
Effect on Effect on

Notes to the financial statements
181
Management of currency risk in the general government sector Entities in the GGS are responsible for the management of their foreign exchange risks. However, it is Australian Government policy that GGS entities do not act to reduce the foreign exchange risk that they would otherwise face in the course of their business arrangements. This means that GGS entities are not permitted to undertake any form of hedging. Rather than allowing GGS entities to enter into individual hedging arrangements, the Australian Government has taken a decision to self-insure foreign exchange exposures and not accept the additional costs associated with hedging. This is based on the view that, as a large organisation, the Australian Government has a broad spread of assets and liabilities and a range of revenues and expenses, both geographically and across classes, which assists in the management of movements in exchange rates.
The Future Fund undertakes certain transactions denominated in foreign currencies, hence it is exposed to the effects of exchange rate fluctuations. Exchange rate exposures are managed utilising forward foreign exchange contracts. The Fund’s exposure in Australian equivalents to foreign currency risk at 30 June 2014 totalled $67,945 million (2013: $62,992 million). After adjusting for forward exchange contracts, the Fund’s net exposure at 30 June 2014 amounted to $44,841 million (2013: $22,912 million). The Fund’s exposures are in multiple currencies, primarily USD, Euro, Yen and the UK Pound.
The following table demonstrates the impact on the net operating balance and net worth, of a 11.5 per cent movement (2013: 15.7 per cent movement) in the value of the Australian dollar (AUD) relative to the basket of actual net exposures.
Currency risk
Change in risk
variable
Operating balance
Net worth Operating balance
Net worth
2014 2014 2013 2013$m $m $m $m
Investments +11.5% 5,460 5,460 n/a n/a-11.5% (5,411) (5,411) n/a n/a+15.7% n/a n/a 4,572 4,572-15.7% n/a n/a (4,245) (4,245)
Effect on Effect on
The Australian Government is also exposed to currency risk from debt denominated in foreign currency. The Australian Government’s policy is to reduce its foreign currency denominated debt to zero. Only a small residual amount of such debt remains in the debt portfolio administered by the AOFM and the AOFM seeks to repurchase this debt when available on acceptable terms. The exposure to foreign exchange risk on general government debt is not material.
The Australian Government holds several financial instruments as part of its membership of the International Monetary Fund (IMF) and its investment in

Notes to the financial statements
182
international financial institutions and multilateral aid organisations. These financial instruments include the:
• IMF (financial assets), comprising the current value in AUD of Australia’s subscription to the IMF (2014: $5,306 million, 2013: $5,247 million);
• investment in international financial institutions, including the European Bank for Reconstruction and Development, the International Bank for Reconstruction and Development, the International Finance Corporation, the Asian Development Bank and the Multilateral Investment Guarantee Agency (2014: $857 million, 2013: $758 million);
• subscription based membership rights (not control) held by the Australian Government in accordance with the articles of association for the International Development Association and the Asian Development Fund, which are recognised at fair value (2014: $1,545 million, 2013: $1,493 million);
• promissory notes (financial liability) issued to the IMF and international financial institutions (2014: $3,904 million, 2013: $3,167 million). The promissory notes are non-interest bearing and relate to the undrawn paid-in capital subscriptions; and
• the special drawing rights (SDR) allocation liability which reflects the current value in AUD of the Treasury’s liability to repay to the IMF Australia’s cumulative allocations of SDRs (2014: $5,054 million, 2013: $4,998 million).
The Australian Government is exposed to foreign currency denominated in USD, EUR and SDR on the above financial instruments. The following table demonstrates the impact on the net operating balance and net worth of a 12 per cent (2013: 15.7 per cent) movement in the relative value of the AUD relative for financial instruments associated with the IMF and international financial institutions and a 11.5 per cent (2013: 15 per cent) movement for financial instruments associated with multi-lateral aid organisations.
Currency risk
Change in risk
variable
Operating balance
Net worth Operating balance
Net worth
2014 2014 2013 2013$m $m $m $m
Loans + 11.5% (0) (0) n/a n/a- 11.5% 0 0 n/a n/a+ 15.0% n/a n/a (195) (195)- 15.0% n/a n/a 264 264
International Monetary Fund + 12.0% (547) (547) n/a n/a- 12.0% 689 689 n/a n/a+ 15.7% n/a n/a (712) (712)- 15.7% n/a n/a 977 977
Effect on Effect on

Notes to the financial statements
183
Management of other price risk in the general government sector The Australian Government is exposed to equity price risks arising from equity investments, primarily through Future Fund investments. The equity price risk is the risk that the value of the equity portfolio will decrease as a result of changes in the levels of equity indices and the price of individual stocks. The Future Fund holds all of its equities at fair value through profit or loss.
As at 30 June 2014, the Future Fund’s exposure to equity price risk consisted of $11,190 million in domestic listed equities and listed managed investment schemes (2013: $10,670 million) and $27,225 million in international listed equities and listed management schemes (2013: $22,213 million).
The following table demonstrates the impact on the net operating balance and net worth of a +/- 20 per cent change in domestic equities and a +/- 15 per cent change in international equities held by the Future Fund.
Other price risk
Change in risk
variable
Operating balance
Net worth Operating balance
Net worth
2014 2014 2013 2013$m $m $m $m
AssetsAustralian equities + 20% 3,045 3,045 3,190 3,190
- 20% (2,986) (2,986) (3,157) (3,157)International equities + 15% 8,327 8,327 6,758 6,758
- 15% (7,916) (7,916) (6,437) (6,437)
Effect on Effect on
The Future Fund’s exposure to other price risks was assessed as being not material.
The Fund had open positions in exchange traded equity futures contracts and equity option contracts as at 30 June 2014. The exchange traded equity futures, swaps and options are used to manage market exposures to equity price risk to ensure that asset allocations remain within the Fund’s approved limits. The notional value of the open contracts and their fair market value are set out below.

Notes to the financial statements
184
Notional Fair Notional Fairvalue market value market
value value2014 2014 2013 2013
$m $m $m $m
Buy domestic equity futures contracts 100 - 160 -Sell domestic equity futures contracts (497) - (456) (1)Buy international equity futures 7,115 37 5,998 (41)Equity index swap agreements - -Equity index swap agreements - - 1 -Exchange traded international volatility
index call options 1 - - -Over the counter domestic equity
index put options (8) - (49) 3Over the counter domestic equity
index call options 214 16 137 14Over the counter international equity
index put options (420) 26 (479) 29Over the counter international equity
index call options 2,815 350 1,246 165Exchange traded warrants 95 159 138 190
9,415 588 6,696 359
Equity price risk
Total The Australian Government is exposed to cash flow risk on Treasury capital indexed bonds on issue. These instruments expose the Australian Government to cash flow risk on interest payments and the value of principal payable on maturity arising from indexation against the (all groups) Australian consumer price index (CPI). When the CPI increases, debt servicing costs and the principal payable on maturity will also rise (subject to a six-month lag).
At 1 July 2013, if the CPI were to experience an immediate 1 per cent increase/(decrease) and that change were to persist for 12 months to 30 June 2014 with all other variables held constant, the effect on the net operating balance and net worth position for the year ended 30 June 2014 would be as follows:
CPI sensitivity analysis
Change in risk
variable
Operating balance
Net worth Operating balance
Net worth
2014 2014 2013 2013$m $m $m $m
Treasury Capital Indexed Bonds +1% (309) (309) (280) (280)- 1% 315 315 274 274
Effect onEffect on
Public financial corporations As detailed in Note 1, the public financial corporations (PFC) sector comprises the Reserve Bank of Australia (RBA) and other entities that accept demand, time or savings deposits; or have the authority to incur liabilities and acquire financial assets in the market on their own account.

Notes to the financial statements
185
The RBA is Australia’s central bank. Its role is set out in the Reserve Bank Act 1959. The RBA’s main responsibility is monetary policy. In addition to conducting monetary policy, the RBA also holds Australia’s foreign currency reserves, operates Australia’s main high-value payments system, provides banking services to the Australian Government and designs, produces and issues Australia’s banknotes. In undertaking these functions, the RBA has significant exposures to interest rate and currency risk. The Export Finance and Insurance Corporation (EFIC) is also involved in lending and borrowing activities with exposures to interest rate and currency risk.
The principal financial instruments held by other entities in the PFC sector comprise cash and short-term money market instruments (including bank bills, negotiable certificates of deposit and commercial paper), debentures and floating rate notes, global property trusts, domestic equity trusts, global equity trusts and domestic listed shares. The market risk associated with reasonably possible movements in interest rates, currency rates and other prices on financial instruments held by these entities is not material to the Consolidated Financial Statements. Consequently, the following market risk disclosures are limited to the market operations of the RBA and EFIC.
Management of interest rate risk in the public financial corporations sector The RBA’s balance sheet is exposed to considerable interest rate risk because most of its assets are financial assets, such as domestic and foreign securities, which have a fixed income stream. The price of such securities increases when market interest rates decline, while the price of a security will fall if market rates rise. Interest rate risk increases with the maturity of a security because the associated income stream is fixed for a longer period.
The following table demonstrates the effect on profit and net worth of a movement of +/- 100 basis points in interest rates on the RBA’s financial asset holdings, given the level, composition and modified duration of the RBA’s foreign currency and AUD securities as at 30 June 2014.
Interest rate risk
Change in risk
variable
Operating balance
Net worth Operating balance
Net worth
2014 2014 2013 2013$m $m $m $m
Foreign currency securities +100 bp 365 365 339 339-100 bp (365) (365) (339) (339)
Australian dollar securities +100 bp 131 131 140 140-100 bp (131) (131) (140) (140)
Effect onEffect on
As EFIC is also involved in lending and borrowing activities, interest rate risks arise. EFIC uses interest rate swaps, forward rate agreements, cross-currency swaps and futures as the primary methods of reducing exposure to interest rate movements. As at

Notes to the financial statements
186
30 June 2014, EFIC’s net exposure to interest rates consisted of $25 million in floating interest rate securities (2013: $25 million) and $193 million in fixed interest rate securities (2013: $183 million). As at 30 June 2014, a +/- 60 basis point movement in interest rates was assessed as not having a material impact on the reported balance of the corporation’s portfolio.
Management of currency risk in the public financial corporations sector Foreign exchange risk arises from the RBA’s foreign currency assets, which are held to support the RBA’s operations in the foreign exchange market. The overall level of foreign currency exposure is determined by policy considerations and cannot otherwise be managed to reduce foreign exchange risk. The RBA’s net foreign currency exposure as at 30 June 2014 was $42 billion (2013: $42 billion). Within the overall exposure and to a limited extent, foreign currency risk can be reduced by holding assets across a diversified portfolio of currencies. The RBA holds foreign reserves in four currencies — the US dollar (52 per cent of net foreign currency holdings), the Euro (35 per cent), the Canadian dollar (5 per cent), the Yen (5 per cent) and Chinese renminbi (3 per cent) — because the markets for these currencies are typically liquid and suitable for investing foreign exchange reserves. The RBA also operates in foreign exchange markets on behalf of its clients, including to assist the Australian Government in meeting foreign currency obligations.
The RBA also undertakes foreign currency swaps to assist its daily domestic market operations. These instruments carry no foreign exchange risk since the exchange rates at which both legs of the transaction are settled are agreed at the time the swap is undertaken.
The following table demonstrates the sensitivity of the RBA’s profit and net worth to a movement of +/-10 per cent in the value of the AUD exchange rate as at 30 June.
Currency riskChange in
risk i bl
Operating balance
Net worth Operating balance
Net worth
2014 2014 2013 2013$m $m $m $m
Australian dollar exchange rate + 10% (3,849) (3,849) (3,764) (3,764)- 10% 4,704 4,704 4,601 4,601
Effect on Effect on
EFIC extends facilities in various currencies, principally in US dollars and Euros. Where the borrowing currency is different from the currency of the assets being funded, cross-currency swaps, or the foreign exchange markets are used to offset the exposure (before provisions). EFIC’s exposure in AUD to foreign currency risk at 30 June 2014 totalled $2,756 million on financial assets and $2,778 million on financial liabilities giving a net exposure of negative $22 million (2013: negative $34 million).

Notes to the financial statements
187
Management of other price risk in the public financial corporations sector The PFC sector does not have material exposures (from a whole of government perspective) to equity or other price risks.
Public non-financial corporations As detailed in Note 1, the public non-financial corporations (PNFC) sector comprises entities that provide goods and services that are mainly market, non-regulatory, and non-financial in nature, financed mainly through sales to consumers of these goods and services.
These entities primarily hold financial instruments as a direct result of operations, including trade receivables and payables, or to finance operations. Certain entities in the PNFC sector also enter into derivative transactions, including interest rate swaps, forward currency contracts and commodity swap contracts. The purpose is to manage the interest rate, currency and commodity risks arising from the entity’s operations and sources of finance.
The market risk associated with reasonably possible movements in interest rates, currency rates and other prices on financial instruments held by PNFC sector entities is not material to the Consolidated Financial Statements.
(e) Credit risk
Credit risk in relation to financial assets, is the risk that a third party will not meet its obligations in accordance with agreed terms. Generally, the Australian Government’s maximum exposure to credit risk in relation to each class of recognised financial asset is the carrying amount of those assets as indicated in the consolidated balance sheet. The following table shows the credit quality of financial receivables reported in the Consolidated Financial Statements that are not past due or individually determined as impaired.
Australian Government 2014 2013 2014 2013Not Past Due Not Past Due Past Due Past Due
nor Impared nor Impaired or Impared or Impaired$m $m $m $m
Advances and loans 34,752 29,305 82 769Goods and services receivable 1,301 1,156 359 547Other receivables 3,593 4,219 720 2,462Total 39,646 34,680 1,161 3,778
General Government 2014 2013 2014 2013
Not Past Due Not Past Due Past Due Past Duenor Impared nor Impaired or Impared or Impaired
$m $m $m $mAdvances and loans 33,958 28,603 82 769Goods and services receivable 476 386 193 308Other receivables 4,416 4,258 720 2,462Total 38,850 33,247 995 3,539

Notes to the financial statements
188
The following table shows the ageing of financial receivables that are past due but not impaired for 2014:
Australian Government 0 to 30 30 to 60 60 to 90 over 90 Totaldays days days days
$m $m $m $m $m
Advances and loans 25 22 23 12 82Goods and services receivable 214 47 20 78 359Other receivables(a) 37 34 27 622 720Total 276 103 70 712 1,161 General Government 0 to 30 30 to 60 60 to 90 over 90 Total
days days days days$m $m $m $m $m
Advances and loans 25 22 23 12 82Goods and services receivable 121 22 15 35 193Other receivables(a) 37 34 27 622 720Total 182 78 65 669 995 (a) Excludes statutory receivables such as taxes receivable and personal benefits recoverable. The following table shows the ageing of financial receivables that were past due but not impaired for 2013:
Australian Government 0 to 30 30 to 60 60 to 90 over 90 Totaldays days days days
$m $m $m $m $m
Advances and loans 37 17 29 686 769Goods and services receivable 278 65 35 169 546Other receivables(a) 1,841 29 12 580 2,463Total 2,156 111 76 1,435 3,778 General Government 0 to 30 30 to 60 60 to 90 over 90 Total
days days days days$m $m $m $m $m
Advances and loans 37 11 (10) 17 56Goods and services receivable 136 40 22 110 309Other receivables(a) 1,841 29 12 580 2,463Total 2,014 80 24 707 2,825 (a) Excludes statutory receivables such as taxes receivable and personal benefits recoverable. Australian Government entities have assessed the risk of default on payment and have allocated the following to an impairment allowance for doubtful debts:
• advances and loans receivable of $229 million at 30 June 2014 (2013: $30 million); and
• goods and services and other receivables (including certain statutory receivables other than tax) of $1,978 million at 30 June 2014 (2013: $2,538 million).

Notes to the financial statements
189
The majority of Australian Government entities do not have significant exposures to any concentrations of credit risk. Generally, Australian Government entities’ exposures are to a large number of customers or highly rated counterparties and their credit risks are very low. Australian Government entities with material concentrations of credit risk include:
• the Export Finance and Insurance Corporation’s (EFIC) principal exposure to credit risk arises from the financing and credit facilities extended to clients. These facilities are provided by EFIC on both a commercial basis and on the national interest account. Credit risk exposures on the Commercial Account amounted to $1,871 million at 30 June 2014 (2013: $1,716 million) while credit risk exposures on the national interest account amounted to $867 million (2013: $758 million);
• the AOFM’s financial investments include loans to state and territory Governments, deposits, discount securities and residential mortgage-backed securities (RMBS). The credit quality of the RMBS derives from the underlying quality of the mortgage assets and structural enhancements such as lenders mortgage insurance, liquidity facilities, and the issue of different classes of securities. At the time of acquisition, each RMBS issue must meet a range of eligibility criteria set by the AOFM;
• the Future Fund has a significant exposure to interest bearing securities issued by domestic banks (including domestic subsidiaries of foreign banks);
• for the RBA, credit risk arises from exposure to the issuers of securities that it holds; banks with which the RBA deposits funds and counterparties that are yet to settle transactions. The RBA’s credit exposure is low compared with that of most commercial financial institutions because it manages such risks within a highly risk-averse framework; and
• from time to time the Australian Government may have significant exposures to credit risk in relation to major asset sales.
The majority of Australian Government entities do not hold collateral to manage credit risk.
Cash invested by the RBA under repurchase agreements is secured by collateral to a value of between 101 and 127 per cent of the amount invested.
In relation to Indigenous Business Australia’s gross credit risk, collateral valued at $1,370 million is held against home and business loans (2013: $1,196 million).
Collateral held may include first ranking mortgage over assets financed by EFIC, standby documentary credits, third-party guarantees and recourse to companies and company directors. No collateral has currently been called and held at year end.
Notes to the financial statements
190
Loans and advances at fair value through profit or loss Student loans under the Higher Education Loan Programme and Student Financial Supplement Scheme have been designated as at fair value through profit or loss as the Australian Government manages these loans and advances on a fair value basis.
Commercial loans and National Interest Account loans managed by the Export Finance Insurance Corporation (EFIC) are designated at fair value through profit or loss. These include export finance loans and rescheduled insurance debts designated at fair value through profit or loss as the designation significantly reduces the accounting mismatch that would otherwise arise from measuring the asset on a different basis from derivatives that have been entered into to hedge the transactions. Business and home loans managed by Indigenous Business Australia (IBA) are designated at fair value through profit or loss as these loans are managed on a fair value basis with risk management focussed on monitoring, measuring and reporting the impact of interest rate changes.
The maximum exposure to credit risk arises from the potential default of a debtor. This amount is equal to the carrying amount of the receivables net of impairment losses.
(f) Liquidity risk
Liquidity risk is the risk that the Australian Government will not be able to meet its obligations as they fall due. The following tables disclose the undiscounted value of the contractual maturities of financial liabilities as at the end of the financial year, including estimated future interest payments.
The Australian Government has sufficient access to funds to meet its liabilities as they fall due. At 30 June 2014, the Australian Government reported $295,785 million in current assets compared to current liabilities of $98,789 million (as reported in the balance sheet). Moreover, the Australian Government is positioned to address liquidity risk through existing revenue sources, including the power to tax, and its capacity to roll over existing debt.

Notes to the financial statements
191
The following table illustrates the contractual maturities for financial liabilities:
Liquidity risk 2014(a)(b) Australian Government On 1 Year 1 to 5 More than Total
2014 Demand or Less Years 5 Years$m $m $m $m $m
Suppliers 978 4,734 151 28 5,891Subsidies payable - 121 - - 121Grants liability 21 2,005 - 5,054 7,080Other payables 347 2,323 713 32 3,415Overdrafts - - - - -Deposits 12,178 11,820 - - 23,998Government securities - 32,584 132,570 181,465 346,619Loans - 1,159 1,927 5,818 8,904Leases - 584 1,859 10,531 12,974Other interest bearing liabilities 5 7,927 1,724 2,089 11,745Provisions - - - - -Australian currency on issue - - - 60,778 60,778Total Financial Liabilities 13,529 63,257 138,944 265,795 481,525 General Government On 1 Year 1 to 5 More than Total
2014 Demand or Less Years 5 Years$m $m $m $m $m
Suppliers 55 3,912 124 2 4,093Subsidies payable - 121 - - 121Grants liability 21 2,052 - 5,054 7,127Other payables 327 1,165 71 32 1,595Overdrafts - - - - -Deposits 211 - - - 211Government securities - 32,584 137,236 181,465 351,285Loans - 7 157 3,779 3,943Leases - 190 665 2,337 3,192Other interest bearing liabilities 5 419 986 395 1,805Provisions - - - - -Australian currency on issue - - - - -Total Financial Liabilities 619 40,450 139,239 193,064 373,372 (a) The amounts disclosed in the tables above are the undiscounted values and may not align to the
amounts disclosed in the balance sheet. (b) The Future Fund has entered into forward exchange contracts to manage exposure to currency risk.
These contracts are settled on a gross basis with the maturities of inflows and outflows as follows:
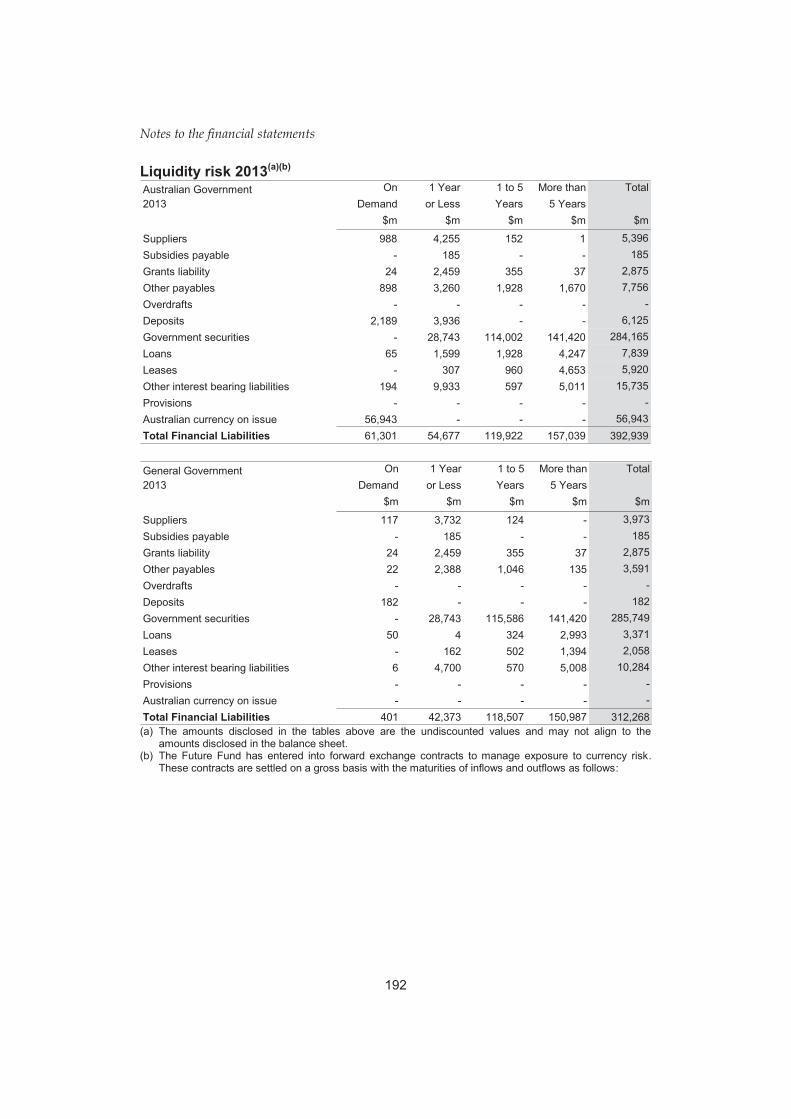
Notes to the financial statements
192
Liquidity risk 2013(a)(b) Australian Government On 1 Year 1 to 5 More than Total2013 Demand or Less Years 5 Years
$m $m $m $m $m
Suppliers 988 4,255 152 1 5,396Subsidies payable - 185 - - 185Grants liability 24 2,459 355 37 2,875Other payables 898 3,260 1,928 1,670 7,756Overdrafts - - - - -Deposits 2,189 3,936 - - 6,125Government securities - 28,743 114,002 141,420 284,165Loans 65 1,599 1,928 4,247 7,839Leases - 307 960 4,653 5,920Other interest bearing liabilities 194 9,933 597 5,011 15,735Provisions - - - - -Australian currency on issue 56,943 - - - 56,943Total Financial Liabilities 61,301 54,677 119,922 157,039 392,939 General Government On 1 Year 1 to 5 More than Total2013 Demand or Less Years 5 Years
$m $m $m $m $m
Suppliers 117 3,732 124 - 3,973Subsidies payable - 185 - - 185Grants liability 24 2,459 355 37 2,875Other payables 22 2,388 1,046 135 3,591Overdrafts - - - - -Deposits 182 - - - 182Government securities - 28,743 115,586 141,420 285,749Loans 50 4 324 2,993 3,371Leases - 162 502 1,394 2,058Other interest bearing liabilities 6 4,700 570 5,008 10,284Provisions - - - - -Australian currency on issue - - - - -Total Financial Liabilities 401 42,373 118,507 150,987 312,268 (a) The amounts disclosed in the tables above are the undiscounted values and may not align to the
amounts disclosed in the balance sheet. (b) The Future Fund has entered into forward exchange contracts to manage exposure to currency risk.
These contracts are settled on a gross basis with the maturities of inflows and outflows as follows:

Notes to the financial statements
193
Gross settled derivatives On 1 Year 1 to 5 More than TotalDemand or Less Years 5 Years
2014 2014 2014 2014 2014
(Inflow) - (17,868) (127) (41) (18,036)Outflow - 18,163 134 41 18,337Total - 295 6 0 302 Gross settled derivatives On 1 Year 1 to 5 More than Total
Demand or Less Years 5 Years2013 2013 2013 2013 2013
(Inflow) - (54,307) (6,087) (29) (60,423)Outflow - 58,115 6,626 30 64,770Total - 3,808 539 1 4,347
Note 38: Defined benefit superannuation plans Within the reporting entity, various Australian Government entities sponsor defined benefit superannuation plans. The following are the plans that are covered in this note:
• Commonwealth Superannuation Scheme (CSS);
• Public Sector Scheme (PSS);
• Parliamentary Contributory Superannuation Scheme (PCSS);
• Defence Force Retirement and Death Benefits Scheme (DFRDB);
• Military Superannuation Benefits Scheme (MSBS); and
• the following defined benefit superannuation schemes have been disclosed under the heading ‘Other’.
Scheme title Responsible entities AvSuper Airservices Australia Australia Post Superannuation Scheme (APSS) Australia Post Corporation State Authorities Superannuation Scheme (SASS), State Superannuation Scheme (SSS), State Authorities Non-contributory Superannuation Scheme (SASCS)
Australian Rail Track Corporation
Australian Submarine Corporation Superannuation Fund (ASCSF) Australian Submarine Corporation North American and London, Dublin and New Delhi pension schemes (other)
Department of Foreign Affairs and Trade
Reserve Bank of Australia Officers’ Superannuation Fund (OSF) and UK Pension Scheme (UKPS)
Reserve Bank of Australia
The Judges’ Pension Scheme (JPS), Governor-General Pension Scheme and Federal Circuit Court Judges Death and Disability Scheme (FCCJDDS) (these are included in other in the tables)
Department of Finance

Notes to the financial statements
194
This note includes information on the statutory and whole of government schemes listed above, including the Judges’ Pension Scheme (JPS), Governor General Pension Scheme and Federal Circuit Court Judges Death and Disability Scheme (FCCJDDS) listed under ‘Other’. Information on the other schemes sponsored by individual Australian Government entities can be found in the annual report of the responsible entities.
(a) Accounting policies
The Australian Government recognises actuarial gains or losses immediately in Other Comprehensive Income in the year in which they occur. Net interest on the net defined benefit liability is recognised in profit and loss; the return on plan assets excluding the amount included in interest income is recognised in Other Comprehensive Income as part of re-measurements. Sensitivity analysis is provided on significant changes in assumptions that are reasonably possible.
(b) Scheme information
Commonwealth Superannuation Scheme
Scheme information and regulatory framework
The Commonwealth Superannuation Scheme (CSS) is a scheme for Commonwealth civilian employees and was established under the Superannuation Act 1976. The CSS was open to new members from 1 July 1976 to 30 June 1990.
The CSS 1976 Scheme is a regulated public sector scheme and must comply with the Superannuation Industry (Supervision) Act 1993 which governs the superannuation industry and provides the framework within which superannuation plans operate.
Prior to 1976, the superannuation of Australian Government public servants was covered by the Superannuation Act 1922. There are no longer any members contributing under this Act. However, some pensioners remain entitled to benefits under this Act and the liabilities in respect of these members are included in the CSS liability.
The 1922 scheme is an exempt public sector superannuation scheme for the purposes of the Superannuation Industry (Supervision) Act 1993.
Benefits provided
The CSS 1976 Scheme is a partially unfunded defined benefit scheme that provides benefits on resignation, retirement, involuntary retirement, invalidity and death (to eligible spouses / children). Retirement benefits include an unfunded employer financed lifetime indexed pension based on the member’s age at retirement, years of contributory service and final superannuation salary. The member’s basic contributions, employer productivity contributions and interest can be taken as a lump sum or an additional non-indexed lifetime pension.

Notes to the financial statements
195
Members of the scheme who resign before age 55 can claim a preserved resignation benefit on or after reaching that age. This benefit is commonly known as the 54/11 benefit. In this case, the unfunded employer financed lifetime, indexed pension is calculated by applying age-based factors to the amount of two and a half times the member’s accumulated basic member contributions and interest.
Indexed pensions are indexed twice yearly (January and July) in line with changes in the Consumer Price Index.
The 1922 Scheme is an unfunded defined benefit scheme that still provides the payments of pensions, deferred benefit entitlements and any reversionary pensions to surviving eligible spouses and/or children on the death of a member.
Funding arrangements
Funded contributions generally comprise basic member contributions and employer productivity (up to 3 per cent) contributions. These are invested in the CSS Fund. Members can also choose to make no basic member contributions. In most cases, when a member’s benefit becomes payable, monies held in the CSS Fund in respect of the member are paid to Consolidated Revenue with the member then having their benefit paid to them from Consolidated Revenue.
Governance
The Scheme’s Trustee, Commonwealth Superannuation Corporation (CSC), was established under the Governance of Australian Government Superannuation Schemes Act 2011. CSC is responsible for:
• administration of the Scheme;
• management and investment of the Scheme assets;
• compliance with superannuation and taxation laws and other applicable laws; and
• compliance with relevant legislation including the Governance of Australian Government Schemes Act 2011 and the Commonwealth Authorities and Companies Act 1997.
ComSuper is the legislated provider of administration services for the Scheme under the ComSuper Act 2011. ComSuper is subject to any reasonable direction from CSC and is required to comply, where possible, with any policies, guidelines and standards regarding administration services set by CSC.
The prudential regulator, the Australian Prudential Regulation Authority (APRA), licenses and supervises the regulated CSS 1976 Scheme.

Notes to the financial statements
196
Public Sector Superannuation Scheme
Scheme information and regulatory framework
The Public Sector Superannuation Scheme (PSS) is a scheme for Commonwealth civilian employees and was established under the Superannuation Act 1990 and Trust Deed made under the Act. The PSS was open to new members from 1 July 1990 to 30 June 2005.
The PSS is a regulated public sector scheme and must comply with the Superannuation Industry (Supervision) Act 1993 and regulations under that Act which govern the superannuation industry and provides the framework within which superannuation plans operate.
Benefits provided
The PSS is a partially funded defined benefit scheme that provides benefits on resignation, retirement, involuntary retirement, invalidity and death (to eligible spouse/children).
On retirement a lump sum benefit is payable. This lump sum is calculated based on the member’s length of contributory membership, their rate of member contribution and Final Average Salary (average of a member’s superannuation salary on their last three birthdays). Generally this lump sum comprises a funded component (as described above) and an unfunded component.
Where a member resigns before age 55, generally the member’s lump sum benefit at that time is crystallised with the funded component of the benefit accumulating with interest and the unfunded component accumulating with changes in the CPI, until the benefit becomes payable.
Members can convert 50 per cent or more of their lump sum to a lifetime indexed pension based on the member’s age.
Indexed pensions are indexed twice yearly (January and July) in line with changes in the Consumer Price Index.
Funding arrangements
Funded contributions generally comprise basic member contributions and employer productivity (up to 3 per cent) contributions. These are invested in the PSS Fund and accumulate with interest. Members can choose to make no contributions. When a member’s benefit becomes payable, monies held in the PSS Fund in respect of the member are paid to Consolidated Revenue with the member then having their benefit paid to them from Consolidated Revenue.

Notes to the financial statements
197
Governance
The Governance arrangements are consistent with those applied for the CSS.
Parliamentary Contributory Superannuation Scheme
Scheme information and regulatory framework
The Parliamentary Contributory Superannuation Scheme (PCSS) is a scheme for Federal parliamentarians and was established under the Parliamentary Contributory Superannuation Act 1948 (the Act). The scheme was closed to new and returning members on 9 October 2004.
The PCSS scheme is an exempt superannuation scheme for the purposes of the Superannuation Industry (Supervision) Act 1993.
Benefits provided
The PCSS is an unfunded defined benefit scheme that is governed by the rules set out in the Act.
The main benefit provided by the PCSS is a lifetime pension, which is payable where a retiring member has sufficient parliamentary service to meet the pension qualification period set out in the Act. A PCSS member who qualifies for a pension can also elect to convert up to half of their benefit to a lump sum. Lump sum benefits are payable to PCSS members who do not have sufficient parliamentary service to qualify for a lifetime pension.
Benefits are funded by the Australian Government at the time they become payable. The amount of the benefit payable is determined under the Act and is dependent on the member’s length of parliamentary service and the additional offices they have held.
Pension benefits are expressed as a percentage of the superannuation salary applicable for the PCSS and are indexed by movements in that superannuation salary.
The Act also provides for the payment of reversionary pensions to surviving eligible spouses and/or children on the death of a member.
Funding arrangements
Members of the scheme are required to contribute towards the cost of their benefit during their term of parliamentary service. Contributions are a set percentage of the superannuation salary applicable for the purposes of the PCSS. In most cases, when a member’s benefit becomes payable, monies are paid to them from Consolidated Revenue.

Notes to the financial statements
198
Governance
The Act establishes the Parliamentary Retiring Allowances Trust, which exercises certain statutory discretions in the Act in relation to the PCSS. The Trust comprises five trustees, being two Senators, two members of the House of Representatives and the Finance Minister. The Assistant Secretary, Funds and Superannuation, Governance and Public Management within the Department of Finance, acts as adviser to the Trust.
The Finance Secretary also has certain powers under the Act in relation to Administration of the PCSS.
Defence Force Retirement and Death Benefits Scheme
Scheme information and regulatory framework
The Defence Force Retirement and Death Benefit Scheme (DFRDB) is a scheme that provides superannuation for Australian Defence Force (ADF) members who became contributors on or after 1 October 1972, and for members who were contributors to the former Defence Force Retirement Benefits Scheme (DFRB) on 30 September 1972 and were compulsorily transferred to the DFRDB Scheme.
The scheme is an exempt public sector superannuation scheme for the purposes of the Superannuation Industry (Supervision) Act 1993.
Benefits provided
The DFRDB is an unfunded defined benefit superannuation scheme where benefit entitlements do not depend on investment fund earnings, except for members who have an ancillary account in MSBS. It was open to new members until 1 October 1991.
The DFRDB Scheme differs from most other defined benefit superannuation schemes in that retirement age plays only an incidental part in calculating benefit entitlements. Length of service is the primary factor: total full-time contributory service, plus any periods of past service that may have been brought back. Members who retire from the ADF after 20 years of effective service (or after 15 years of service at retirement age for rank) are entitled to a pension based on a percentage of their annual pay on retirement. Members retired from the ADF on invalidity grounds may be entitled to an invalidity pension.
DFRDB Scheme members who have less than 20 years of service but have not reached their compulsory retiring age for rank are entitled to:
• a refund of their contributions, a Superannuation Guarantee amount and a productivity benefit (described below); and
• if applicable, a gratuity based on completed years of service.

Notes to the financial statements
199
Members are entitled to a productivity benefit under the Defence Force (Superannuation) (Productivity Benefit) Determination (issued under the Defence Act 1903). The amount of this productivity benefit varies according to the circumstances under which an individual member has left the ADF. It is paid at the same time as DFRDB Scheme benefits are paid.
Benefits may also be payable to any surviving eligible spouse and children on the death of a member or pensioner.
Funding arrangements
When a member’s benefit becomes payable, monies are paid to them from Consolidated Revenue.
Governance
Established by the Defence Force Retirement and Death Benefits Act 1973 (the DFRDB Act), the Scheme closed to new entrants with the commencement of the Military Superannuation and Benefits Scheme (MSBS) on 1 October 1991.
Military Superannuation and Benefits Scheme
Scheme information and regulatory framework
The Military Superannuation and Benefits Scheme (MSBS) is a scheme operated for the purpose of providing members of the Australian Defence Force (and their dependants or beneficiaries) with lump sum and pension benefits.
Established by the Military Superannuation and Benefits Act 1991, the MSBS scheme commenced on 1 October 1991 after the closure for new entrants in DFRDB.
Benefits provided
The MSBS is a partly funded scheme that provides benefits upon retirement, termination of service, death and disablement.
The benefits payable from the Scheme comprise a lump sum of accumulated member contributions and a defined benefit financed by the Australian Government.
The scheme is calculated on the basis of the member’s final average salary and length of service. The defined benefit may be taken as a lump sum or as a pension or as a combination of lump sum and pension. The defined benefit consists of a funded component (the accumulated value of the 3 per cent of salary contributions made to the Fund by the Australian Government) and an unfunded component (the balance of the defined benefit).

Notes to the financial statements
200
Funding arrangements
Funded contributions generally comprise basic member contributions, including amounts notionally carried over from the DFRDB, plus earnings on these amounts, and employer productivity (of 3 per cent) contributions. These are invested in the MSBS Fund. The cost of the unfunded employer component is met from Consolidated Revenue when benefits fall due.
Governance
The Governance arrangements are consistent with those applied for the CSS.
Governor-General Pension Scheme (G-GPS)
Scheme information and regulatory framework
The Governor-General pension scheme was established under the Governor-General Act 1974 (the Act).
The scheme is an exempt public sector superannuation scheme for the purposes of the Superannuation Industry (Supervision) Act 1993.
Benefits provided
The scheme is an unfunded defined benefit scheme that is governed by the rules set out in the Act. The scheme remains open to new members.
The scheme provides a lifetime retirement allowance of 60 per cent of the salary of the Chief Justice of the High Court of Australia. There is no minimum qualification period for the payment of a retiring allowance and the allowance is not dependent upon length of service.
The retirement allowance is funded by the Australian Government at the time it becomes payable and is indexed by movements in the salary of the Chief Justice of the High Court of Australia.
The Act also provides for the payment of a reversionary allowance to a surviving eligible spouse on the death of a Governor-General or former Governor-General.
Funding arrangements
Governors-General are not required to contribute towards the cost of their benefit during their term of appointment. Benefits are funded from Consolidated Revenue.
Governance
The Finance Secretary has certain powers under the Act in relation to administration of the scheme.

Notes to the financial statements
201
Judges’ Pensions Scheme (JPS)
Scheme information and regulatory framework
The Judges’ Pensions Scheme is a scheme for Federal Judges (excluding Federal Circuit Court Judges) and was established under the Judges’ Pensions Act 1968 (the Act). The scheme remains open to new members.
The scheme is an exempt superannuation scheme for the purposes of the Superannuation Industry (Supervision) Act 1993.
Benefits provided
The Judges’ Pensions Scheme is an unfunded defined benefit scheme that is governed by the rules set out in the Act. The scheme remains open to new members.
The main benefit provided by the Judges’ Pensions Scheme is a lifetime pension of 60 per cent of judicial salary, which is payable where a Judge has 10 or more years of service and is over age 60. The Act provides for a part pension (prorated based on length of service) where a Judge who has less than 10 years service, but not less than 6 years service, must retire due to reaching the maximum retiring age in the Constitution (age 70).
A lump sum benefit, based on minimum Superannuation Guarantee, is payable to a Judge who does not have sufficient judicial service to qualify for a lifetime pension.
Benefits under the Judges Pensions Scheme’ are funded by the Australian Government at the time they become payable. Pensions are indexed by movements in judicial salaries.
The Act also provides for the payment of reversionary pensions to surviving eligible spouses and/or children on the death of a Judge or former Judge.
Funding arrangements
Judges are not required to contribute towards the cost of their benefit during their term of appointment. Benefits are funded from Consolidated Revenue.
Governance
The Finance Minister exercises certain discretions under the Act. The Finance Secretary also has certain powers under the Act in relation to administration of the scheme. Day-to-day administration of the scheme is undertaken by Finance.
Notes to the financial statements
202
Federal Circuit Court Judges Death and Invalidity Scheme (FCCJDIS)
Scheme information and regulatory framework
The Federal Circuit Court of Australia Act 1999 (the Act) provides for employer funded superannuation contributions to a superannuation fund of the Judge’s choice, as well as access to a statutory death and disability scheme (FCCJDDS). It is an exempt public sector superannuation scheme for the purposes of the Superannuation Industry (Supervision) Act 1993.
Benefits provided
The death and disability scheme is unfunded and is governed by the rules set out in the Act. It is accessible to new Federal Circuit Court Judges.
The disability benefit provides a retired disabled Federal Circuit Court Judge with a pension of 60 per cent of the salary the Judge would have received if they had not retired, and is payable until the earlier of the Judge attaining age 70, or his/her death. In addition, the Judge continues to receive employer superannuation contributions in respect of this pension until they reach age 65.
Funding arrangements
Judges are not required to contribute towards the cost of these benefits. Benefits are funded from Consolidated Revenue in the event they become payable.
Governance
The Finance Minister exercises certain discretions under the Act in respect of the death and disability scheme.
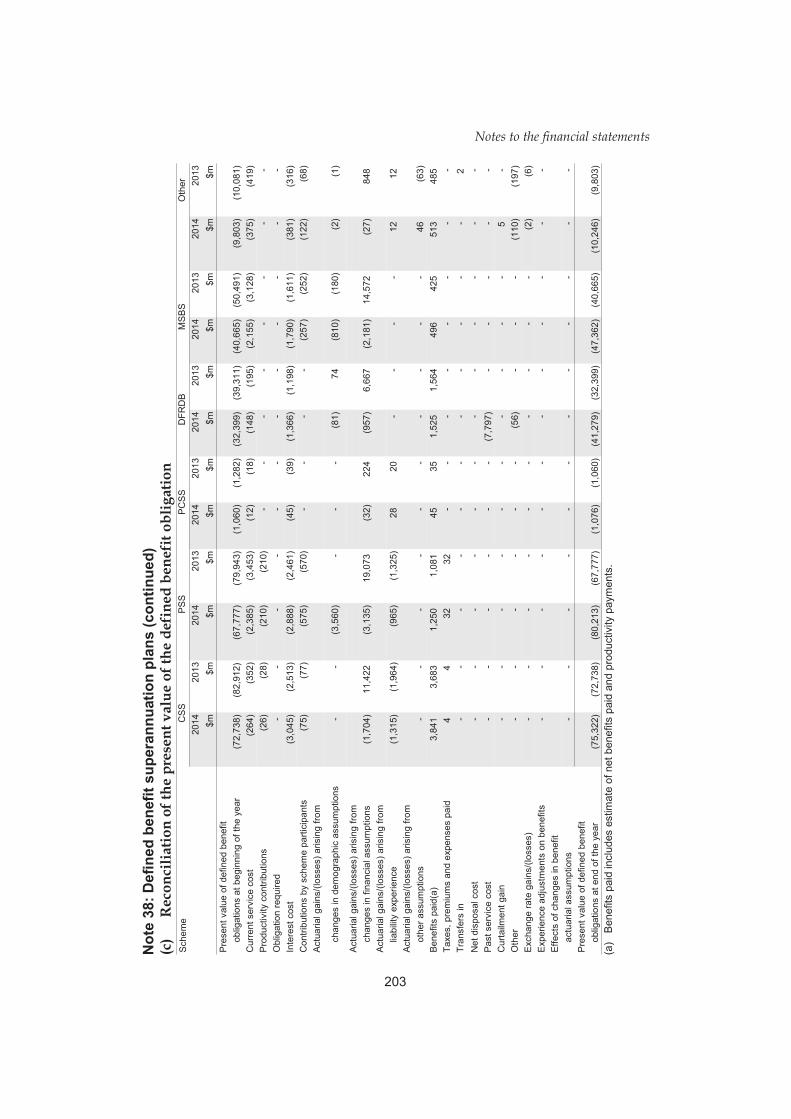
Notes to the financial statements
203
Not
e 38
: Def
ined
ben
efit
supe
rann
uatio
n pl
ans
(con
tinue
d)
(c)
Rec
onci
liatio
n of
the
pres
ent v
alue
of t
he d
efin
ed b
enef
it ob
ligat
ion
Sch
eme
CS
SP
SS
PC
SS
DFR
DB
MS
BS
Oth
er20
1420
1320
1420
1320
1420
1320
1420
1320
1420
1320
1420
13 $
m
$m
$
m
$m $
m
$m $
m
$m
$
m
$m $
m
$mP
rese
nt v
alue
of d
efin
ed b
enef
it ob
ligat
ions
at b
egin
ning
of t
he y
ear
(72,
738)
(
82,9
12)
(67,
777)
(7
9,94
3)
(1
,060
)
(1
,282
)
(3
2,39
9)
(39,
311)
(4
0,66
5)
(50,
491)
(9
,803
)
(10,
081)
Cur
rent
ser
vice
cos
t(2
64)
(352
)
(2
,385
)
(3,4
53)
(1
2)
(18)
(1
48)
(1
95)
(2
,155
)
(3
,128
)
(3
75)
(419
)
P
rodu
ctiv
ity c
ontri
butio
ns(2
6)
(2
8)
(2
10)
(210
)
-
-
-
-
-
-
-
-
O
blig
atio
n re
quire
d-
-
-
-
-
-
-
-
-
-
-
-
Inte
rest
cos
t(3
,045
)
(2,5
13)
(2
,888
)
(2,4
61)
(4
5)
(39)
(1
,366
)
(1
,198
)
(1
,790
)
(1
,611
)
(3
81)
(316
)
C
ontri
butio
ns b
y sc
hem
e pa
rtici
pant
s(7
5)
(7
7)
(5
75)
(570
)
-
-
-
-
(2
57)
(2
52)
(1
22)
(68)
Act
uaria
l gai
ns/(l
osse
s) a
risin
g fro
m
chan
ges
in d
emog
raph
ic a
ssum
ptio
ns-
-
(3,5
60)
-
-
-
(81)
74
(810
)
(180
)
(2)
(1
)
Act
uaria
l gai
ns/(l
osse
s) a
risin
g fro
mch
ange
s in
fina
ncia
l ass
umpt
ions
(1,7
04)
11
,422
(3,1
35)
19
,073
(3
2)
224
(9
57)
6,
667
(2,1
81)
14,5
72
(2
7)
84
8
A
ctua
rial g
ains
/(los
ses)
aris
ing
from
liabi
lity
expe
rienc
e(1
,315
)
(1,9
64)
(9
65)
(1,3
25)
28
20
-
-
-
-
12
12
A
ctua
rial g
ains
/(los
ses)
aris
ing
from
othe
r ass
umpt
ions
-
-
-
-
-
-
-
-
-
-
46
(6
3)
B
enef
its p
aid(
a)3,
841
3,
683
1,
250
1,08
1
45
35
1,52
5
1,
564
496
42
5
513
485
Taxe
s, p
rem
ium
s an
d ex
pens
es p
aid
4
4
32
32
-
-
-
-
-
-
-
-
Tran
sfer
s in
-
-
-
-
-
-
-
-
-
-
-
2
Net
dis
posa
l cos
t-
-
-
-
-
-
-
-
-
-
-
-
Pas
t ser
vice
cos
t-
-
-
-
-
-
(7,7
97)
-
-
-
-
-
Cur
tailm
ent g
ain
-
-
-
-
-
-
-
-
-
-
5
-
Oth
er-
-
-
-
-
-
(56)
-
-
-
(1
10)
(197
)
E
xcha
nge
rate
gai
ns/(l
osse
s)-
-
-
-
-
-
-
-
-
-
(2)
(6
)
Exp
erie
nce
adju
stm
ents
on
bene
fits
-
-
-
-
-
-
-
-
-
-
-
-
E
ffect
s of
cha
nges
in b
enef
it ac
tuar
ial a
ssum
ptio
ns-
-
-
-
-
-
-
-
-
-
-
-
Pre
sent
val
ue o
f def
ined
ben
efit
oblig
atio
ns a
t end
of t
he y
ear
(75,
322)
(72,
738)
(80,
213)
(6
7,77
7)
(1
,076
)
(1
,060
)
(4
1,27
9)
(32,
399)
(4
7,36
2)
(40,
665)
(1
0,24
6)
(9
,803
)
(a
) B
enef
its p
aid
incl
udes
est
imat
e of
net
ben
efits
pai
d an
d pr
oduc
tivity
pay
men
ts.

Notes to the financial statements
204
Not
e 38
: Def
ined
ben
efit
supe
rann
uatio
n pl
ans
(con
tinue
d)
(d)
Rec
onci
liatio
n of
the
fair
val
ue o
f sch
eme
asse
ts
Sch
eme
CS
SP
SS
PC
SS
DFR
DB
MS
BS
Oth
er20
1420
1320
1420
1320
1420
1320
1420
1320
1420
1320
1420
13 $
m
$m
$
m
$m $
m
$m $
m
$m
$
m
$m $
m
$mFa
ir va
lue
of s
chem
e as
sets
at
begi
nnin
g of
the
year
3,89
5
3,91
1
13,8
56
12,1
07
-
-
-
-
4,88
8
4,
012
8,27
1
7,67
6
Cha
nges
in fa
ir va
lue
of s
chem
e as
sets
:P
lan
asse
t acq
uire
d-
-
-
-
-
-
-
-
-
-
-
-
Inte
rest
inco
me
156
115
594
37
8
-
-
-
-
21
7
129
31
0
23
5
A
ctua
l ret
urn
on s
chem
e as
sets
less
inte
rest
inco
me
230
284
972
1,
207
-
-
-
-
35
3
423
45
3
48
4
A
ctua
rial g
ains
/(los
ses)
-
-
-
-
-
-
-
-
-
-
2
2
Net
app
ropr
iatio
n fro
m C
RF
3,22
9
3,16
8
426
49
7
45
36
1,
525
1,56
4
54
5
497
25
7
30
0
E
mpl
oyer
con
tribu
tions
prod
uctiv
ity c
ontri
butio
n26
28
21
0
210
-
-
-
-
257
25
2
-
-
Con
tribu
tions
by
sche
me
parti
cipa
nts
75
77
575
57
0
-
-
-
-
-
-
12
2
69
N
et c
hang
es in
fair
valu
e of
sch
eme
asse
ts-
-
-
-
-
-
-
-
-
-
-
-
Fore
ign
curr
ency
exc
hang
e ra
te c
hang
es-
-
-
- -
-
-
-
-
-
5
3
7,61
0
7,5
82
16,6
33
14,
969
45
36
1,52
5
1,
564
6,26
0
5,
313
9,41
9
8,7
69
Less
Ben
efits
pai
d(a)
3,84
1
3,68
3
1,25
0
1,
081
45
36
-
-
49
6
425
51
4
48
5
Ta
xes,
pre
miu
ms
and
expe
nses
pai
d4
4
32
32
-
-
1,
525
1,56
4
-
-
13
13
3,
845
3
,687
1,2
82
1,
113
4
5
36
1,52
5
1,
564
496
425
527
4
98
Fair
valu
e of
sch
eme
asse
tsat
end
of t
he y
ear
3,76
5
3,89
5
15,3
51
13,8
56
--
-
-
5,76
4
4,
888
8,89
2
8,27
1
(a
) B
enef
its p
aid
incl
udes
est
imat
e of
net
ben
efits
pai
d an
d pr
oduc
tivity
pay
men
ts.
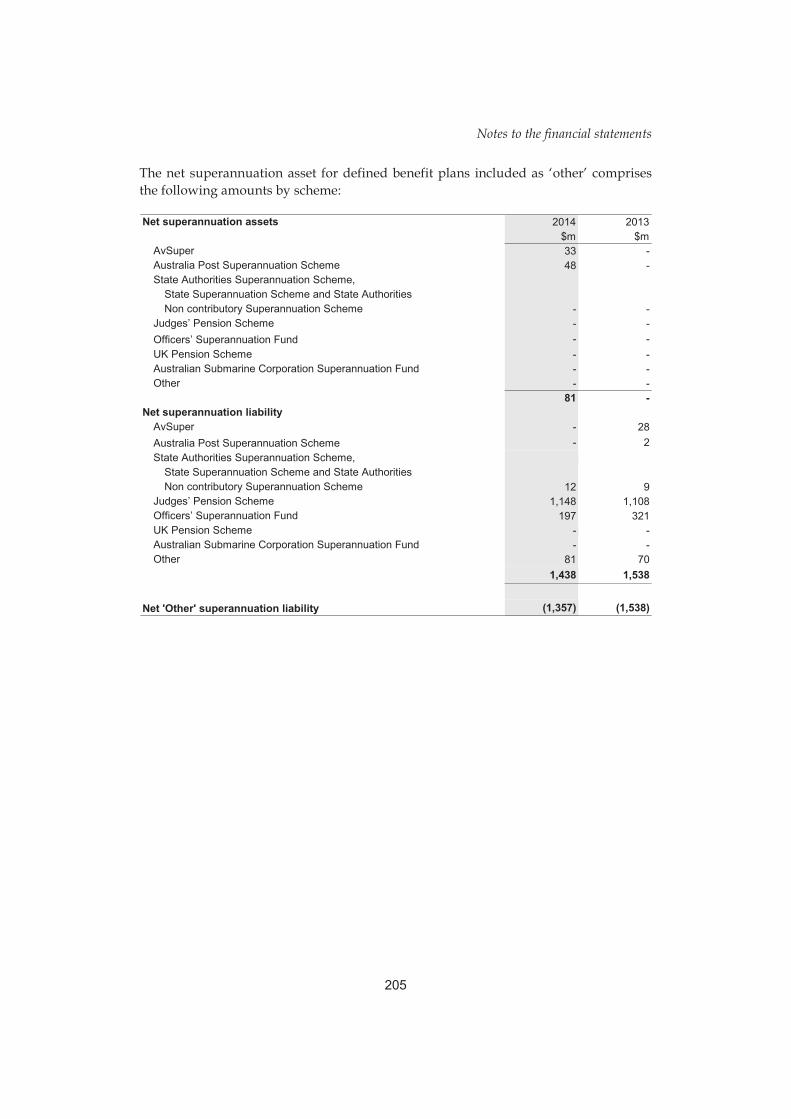
Notes to the financial statements
205
The net superannuation asset for defined benefit plans included as ‘other’ comprises the following amounts by scheme:
Net superannuation assets 2014 2013$m $m
AvSuper 33 - Australia Post Superannuation Scheme 48 - State Authorities Superannuation Scheme,
State Superannuation Scheme and State AuthoritiesNon contributory Superannuation Scheme - -
Judges’ Pension Scheme - - Officers’ Superannuation Fund - - UK Pension Scheme - - Australian Submarine Corporation Superannuation Fund - - Other - -
81 - Net superannuation liability
AvSuper - 28 Australia Post Superannuation Scheme - 2 State Authorities Superannuation Scheme,
State Superannuation Scheme and State AuthoritiesNon contributory Superannuation Scheme 12 9
Judges’ Pension Scheme 1,148 1,108 Officers’ Superannuation Fund 197 321 UK Pension Scheme - - Australian Submarine Corporation Superannuation Fund - - Other 81 70
1,438 1,538
Net 'Other' superannuation liability (1,357) (1,538)
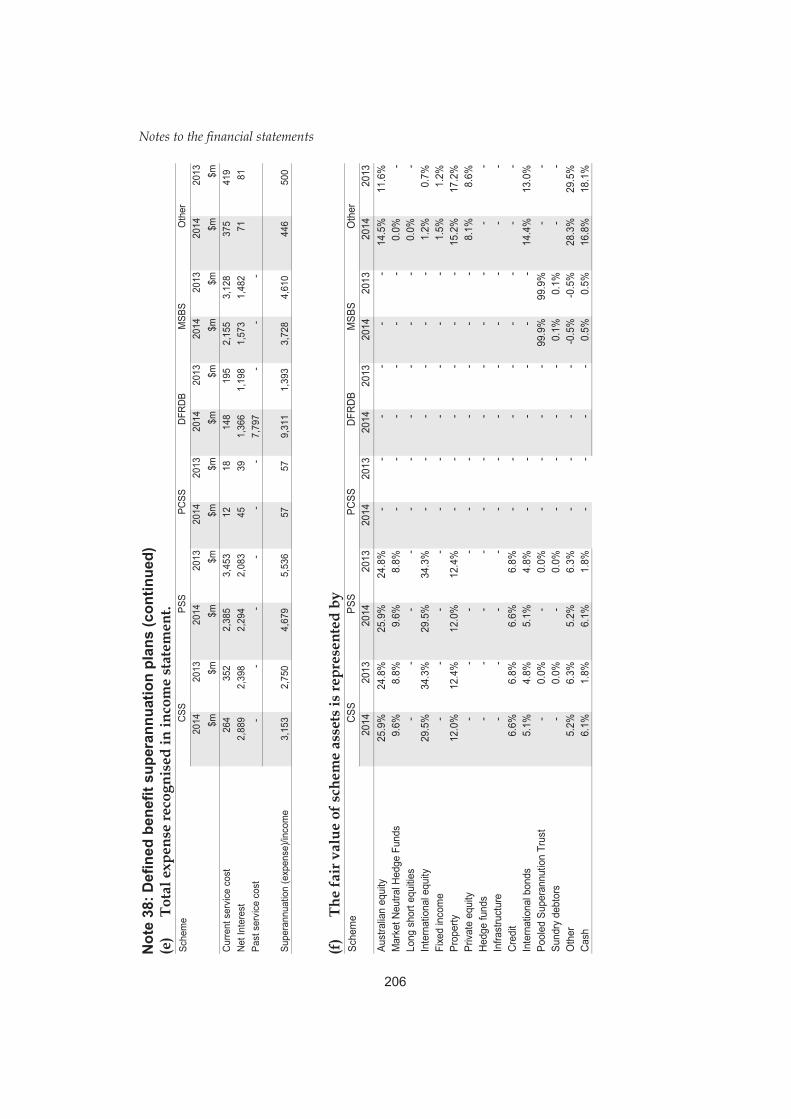
Notes to the financial statements
206
Not
e 38
: Def
ined
ben
efit
supe
rann
uatio
n pl
ans
(con
tinue
d)
(e)
Tota
l exp
ense
reco
gnis
ed in
inco
me
stat
emen
t. Sc
hem
eCS
SPS
SPC
SSDF
RDB
MSB
SO
ther
2014
2013
2014
2013
2014
2013
2014
2013
2014
2013
2014
2013
$m
$
m
$m
$
m
$m
$
m
$m
$
m
$m
$
m
$m
$
m
Curre
nt s
ervi
ce c
ost
264
3
52
2
,385
3,45
3
12
1
8
148
19
5
2,
155
3,12
8
37
5
419
Ne
t Int
eres
t
2,88
9
2
,398
2,2
94
2,
083
4
5
39
1,36
6
1,
198
1,57
3
1,
482
71
81
Past
ser
vice
cos
t
-
-
-
-
-
-
7,
797
-
-
-
Supe
rann
uatio
n (e
xpen
se)/i
ncom
e
3,15
3
2
,750
4,6
79
5,
536
5
7
57
9,31
1
1,
393
3,72
8
4,
610
446
5
00
(f)
The
fair
val
ue o
f sch
eme
asse
ts is
repr
esen
ted
by
Sche
me
CSS
PSS
PCSS
DFRD
BM
SBS
Oth
er20
1420
1320
1420
1320
1420
1320
1420
1320
1420
1320
1420
13Au
stra
lian
equi
ty25
.9%
24.8
%25
.9%
24.8
%-
- -
- -
- 14
.5%
11.6
%M
arke
t Neu
tral H
edge
Fun
ds9.
6%8.
8%9.
6%8.
8%-
- -
- -
- 0.
0%
- Lo
ng s
hort
equi
ties
-
-
-
- -
- -
- -
- 0.
0%
- In
tern
atio
nal e
quity
29.5
%34
.3%
29.5
%34
.3%
-
-
-
-
-
-
1.2%
0.7%
Fixe
d in
com
e-
- -
-
-
-
-
-
-
-
1.5%
1.2%
Prop
erty
12.0
%12
.4%
12.0
%12
.4%
-
-
-
-
-
-
15.2
%17
.2%
Priva
te e
quity
-
-
-
- -
- -
- -
- 8.
1%8.
6%He
dge
fund
s-
- -
-
-
-
-
-
-
-
-
-
Infra
stru
ctur
e-
- -
-
-
-
-
-
-
-
-
-
Cred
it6.
6%6.
8%6.
6%6.
8%-
- -
- -
- -
- In
tern
atio
nal b
onds
5.1%
4.8%
5.1%
4.8%
-
-
-
-
-
-
14.4
%13
.0%
Pool
ed S
uper
annu
tion
Trus
t-
0.
0%-
0.0%
--
--
99.9
%99
.9%
-
-
Sund
ry d
ebto
rs-
0.
0%-
0.0%
--
--
0.1%
0.1%
-
-
Oth
er5.
2%6.
3%5.
2%6.
3%-
- -
- -0
.5%
-0.5
%28
.3%
29.5
%Ca
sh6.
1%1.
8%6.
1%1.
8%-
- -
- 0.
5%0.
5%16
.8%
18.1
%

Notes to the financial statements
207
Not
e 38
: Def
ined
ben
efit
supe
rann
uatio
n pl
ans
(con
tinue
d)
(g)
Prin
cipa
l act
uari
al a
ssum
ptio
ns a
t the
bal
ance
she
et d
ate
Sche
me
CSS
PSS
PCSS
DFRD
BM
SBS
Oth
er20
1420
1320
1420
1320
1420
1320
1420
1320
1420
1320
1420
13Di
scou
nt ra
te (a
ctive
mem
bers
)4.
1%4.
3%4.
1%4.
3%4.
1%4.
3%4.
1%4.
3%4.
1%4.
3%3.
7%4.
2%Di
scou
nt ra
te (p
ensi
oner
s)4.
1%4.
3%4.
1%4.
3%4.
1%4.
3%-
-
-
-
-
-
Ex
pect
ed ra
te o
f ret
urn
on p
lan
asse
ts (a
ctive
mem
bers
)-
7.
0%-
7.0%
-
-
-
-
4.1%
4.3%
2.1%
2.0%
Expe
cted
sal
ary
incr
ease
rate
4.0%
4.0%
4.0%
4.0%
4.0%
4.0%
4.0%
4.0%
4.0%
4.0%
2.4%
0.9%
Expe
cted
pen
sion
incr
ease
rate
(a)
2.5%
2.5%
2.5%
2.5%
2.5%
4.0%
4.0%
2.5%
4.0%
2.5%
4.3%
3.7%
(a
) N
ot re
leva
nt fo
r all
sche
mes
. See
not
es b
elow
for m
ore
info
rmat
ion.

Notes to the financial statements
208
Note 38: Defined benefit superannuation plans (continued) (g) Principal actuarial assumptions at the balance sheet date (continued)
CSS, PSS and PCSS
Assumptions have been made regarding rates of retirement, death (for active, preserved and pension members), mortality improvements, invalidity, resignation, retrenchment, retention and take up rates of pensions in the scheme. Assumptions have also been made for the ages of spouses and rates of member contributions. These assumptions are consistent to those used within the Long Term Cost Report as at 30 June 2011, except for two assumptions within the PSS scheme, which have been updated to reflect recent experiences. The two new assumptions are:
• PSS members contribution rate increased by 0.6 per cent of salary to 6.6 per cent as at 30 June 2014, compared to 6 per cent of salary assumed within the 2011 LTCR; and
• Pension take-up rate has been updated from 70 per cent to 80 per cent.
Certain estimates and approximations were required to determine the year end assets and liabilities in the timeframe required.
The fair value of scheme assets at 30 June 2014 was estimated using the audited fair value of scheme assets at 30 June 2013 with cash flow items provided by the scheme manager, other than benefits paid. An estimate of the actual rate of investment return earned by the scheme during the year to 30 June 2014 was used in determining the fair value of scheme assets.
In relation to the defined benefit obligation, member data as at 30 June 2013 was projected forward allowing for decrements in accordance with the Long Term Cost Report 2011. The data was then adjusted for the difference between the actual benefit payments and those based on the assumed decrements. Salaries at 30 June 2014 were estimated using an assumption derived from the APS remuneration survey. Members’ account balances were increased to be consistent with the level of exit rates prevailing at 30 June 2014.
G-GPS, JPS and FCCJDDS
The demographic assumptions used as at 30 June 2014 liability are those used for the last actuarial review of the schemes as at 30 June 2011.
Benefits payable are paid from Consolidated Revenue on a pay as you go basis. Thus contributions made equal benefits paid.

Notes to the financial statements
209
DFRDB and MSBS
The Australian Government Actuary (AGA) estimates the unfunded provisions and expected future cash flows as at 30 June each year. The AGA completes a full review of the unfunded liabilities (Long Term Cost Report) every three years. This was last completed in 2011.
Other
The actuarial assumptions associated with these defined superannuation plans, such as rates of retirement, death, and the expected rate of return, were based on the recommendations of the scheme’s actuary.
(h) Employer contributions The following table shows the expected contributions for 2015 by scheme:
Scheme 2015$m
Commonwealth Superannuation Scheme 23 Public Sector Superannuation Scheme 208 Parliamentary Contributory Superannuation Scheme 41 Defence Force Retirement and Death Benefits Scheme 1,560 Military Superannuation Benefits Scheme 599 Other schemes 234
Where applicable, the surplus or deficit between accrued benefits and the net market value of plan assets as determined in accordance with AAS 25 Financial Reporting by Superannuation Plans is disclosed in the annual financial reports for each scheme.
The accrued benefits for the DFRDB, DFRB and PCSS have no assets to meet benefit payments. Instead, the plans are financed by the Australian Government at the time benefits become payable.
The following table provides a breakdown of the superannuation provision reported in Note 31 by scheme as at the reporting date.
Scheme2014 2013 2014 2013
$m $m $m $mCommonwealth Superannuation Scheme 71,556 68,843 71,556 68,843 Public Sector Superannuation Scheme 64,862 53,921 64,862 53,921 Parliamentary Contributory Superannuation Scheme 1,076 1,060 1,076 1,060 Defence Force Retirement and Death Benefits Scheme 41,279 32,399 41,279 32,399 Military Superannuation Benefits Scheme 41,598 35,777 41,598 35,777 Other schemes 1,203 1,153 1,351 1,532 Other superannuation liabilities 173 159 226 162
221,747 193,313 221,948 193,693
General Government Australian Government

Notes to the financial statements
210
The following table provides a breakdown of defined benefit plan assets by scheme (that is where the sponsored scheme has a surplus of assets over defined benefit obligations) as reported in Note 19.
Scheme2014 2013 2014 2013
$m $m $m $mCommonwealth Superannuation Scheme - - - - Public Sector Superannuation Scheme - - - - Parliamentary Contributory Superannuation Scheme - - - - Defence Force Retirement and Death Benefits Scheme - - - - Military Superannuation Benefits Scheme - - - - Other schemes - - 81 -
- - 81 -
General Government Australian Government
(i) Sensitivity Analysis for Significant actuarial assumptions
The defined benefit obligation as at 30 June 2014 under several scenarios is presented below. The defined benefit obligation has been recalculated by changing the assumptions as outlined below, whilst retaining all other assumptions.

Notes to the financial statements
211
Sensitivity Analysis
CSSSalary growth ratePension growth rateDiscount rate
PSSSalary growth ratePension growth rateDiscount rate
PCSSSalary growth rateDiscount rate
DFRDB and MSBSSalary growth rateDiscount rateRate of CPI increase
OtherPensioner mortality rate (a)Salary growth rate (b)Salary growth rate (c)Salary growth rate (d)Pension growth rate (e)Pension growth rate (f)Discount rate (g)Discount rate (h)Discount rate (i)Discount rate (j)Rate of CPI (k) 0.5% 7 (6)
0.6% (92) 105 0.5% (61) 66
1.0% (251) 296
1.0% 1 (1)
0.3% (53) 57
9,006 (7,734)
0.6%
0.5% 4,506 (4,685)
0.3% 40 (38)
0.5% 58 (54)
5.0% (0) 0 1.0% 350 (297)
0.5% 5,559 (4,550) 0.6% (8,925) 10,647
(92) 106
Impact on defined benefit obligationIncrease in Decrease in
$m $mChange in
assumption
1.0% 261 (237) 0.5% 4,119 (3,477) 0.6% (4,935) 5,574
1.0%0.6% (9,817) 10,998
1.0% 5,582 (4,827)
1.0% 176 (142)
0.3% 13 (13)
(a) Relates to the percentage change in pensioner mortality rate applied to SASS, SSS and SANCS. (b) Relates to the percentage change in salary growth rate applied to G-GPS, JPS, FCCJDDS and APSS. (c) Relates to the percentage change in salary growth rate applied to AvSuper, SASS, SSS, SANCS,
ASCSF and other. (d) Relates to the percentage change in salary growth rate applied to OSF. (e) Relates to the percentage change in pension growth rate applied to JPS. (f) Relates to the percentage change in pension growth rate applied to OSF. (g) Relates to the percentage change in discount rate applied to APSS, SASS, SSS and SANCS. (h) Relates to the percentage change in discount rate applied to JPS. (i) Relates to the percentage change in discount rate applied to AvSuper, ASCSF and other. (j) Relates to the percentage change in discount rate applied to OSF. (k) Relates to the percentage change in CPI applied to SASS, SSS, SANCS, ASCSF and other.

Notes to the financial statements
212
(j) Maturity profile of defined benefit obligation
The weighted average duration of the defined benefit obligation in years for each of the schemes is outlined below.
SchemeCommonwealth Superannuation Scheme 1976 12.1 yearsCommonwealth Superannuation Scheme 1922 7.3 yearsPublic Sector Superannuation Scheme 21 yearsParliamentary Contributory Superannuation Scheme 16 yearsDefence Force Retirement and Death Benefits Scheme 17.3 yearsDefence Forces Retirement Benefits Scheme 9.4 yearsMilitary Superannuation Benefits Scheme 33.8 yearsOther
AvSuper 11 yearsAustralia Post Superannuation Scheme 6.9 yearsState Authorities Superannuation Scheme 12.3 yearsState Superannuation Scheme 12.3 yearsState Authorities Non contributory Superannuation Scheme 12.3 yearsAustralian Submarine Corporation Superannuation Fund 8 yearsNorth American and London, Dublin and New Delhi pension schemes N/AReserve Bank of Australia Officers' Superannuation Fund 18 yearsUK Pension Scheme N/AJudges' Pension Scheme 14.3 yearsGovernor General Pension Scheme 10.1 yearsFederal Circuit Court Judges Death and Disability Scheme 3.3 years
Weighted average duration of the defined benefit obligation
in years
N/A - Weighted average information not available
Note 39: Events occurring after balance date In accordance with AASB 110 Events after the Reporting Period, reporting entities are required to disclose any event between the balance sheet date and the date the financial statements are authorised for issue that may affect the financial statements. The standard classifies these events as either ‘adjusting’ or ‘non-adjusting’. Adjusting events refer to conditions that existed before the balance sheet date, and if the conditions change the statements should be adjusted accordingly. Non-adjusting events are significant conditions that arise after the balance sheet date, but do not require the statements to be adjusted.
(a) Adjusting Events
There have been no significant events occurring after reporting date that require the Consolidated Financial Statements to be adjusted as at 30 June 2014.

Notes to the financial statements
213
(b) Non-Adjusting Events
On 26 March 2014 the Government announced a decision to proceed with the sale of Medibank Private Limited (Medibank Private) through an initial public offering.
At the 30 June 2014 Medibank Private was a company limited by shares and wholly-owned by the Commonwealth of Australia.
The Medibank Private Share Offer prospectus was released on 20 October 2014. Medibank Private will be listed on the Australian Stock Exchange on 25 November 2014.
The prospectus provides an indicative price range of between $1.55 to $2.00 per share. The sale proceeds are expected to raise between $4.3 billion to $5.5 billion.
There are no other significant non-adjusting events that have occurred after the reporting date.

Notes to the financial statements
214
Note 40: Consolidated revenue fund The cash balance reflected in the balance sheet for the General Government Sector (GGS) includes the reported cash balances controlled and administered by Australian Government entities subject to the FMA Act and the reported cash balances controlled and administered by entities, subject to the CAC Act, that implement public policy through the provision of primarily non-market services.
Revenues or moneys raised by the Executive Government automatically form part of the Consolidated Revenue Fund (CRF) by force of section 81 of the Constitution. The CRF will not equal the cash balance reported in the balance sheet. For practical purposes, total Australian Government GGS cash, less cash controlled and administered by CAC Act entities, plus special public monies, represents the CRF referred to in section 81 of the Constitution. On this basis, the balance of the CRF as at 30 June is shown below.
2014 2013$m $m
Total general government sector cash 3,844 2,113
less CAC Agency cash balances (2,217) (1,952)
plus Special public monies 173 311
Balance of consolidated revenue fund at 30 June 1,800 472
Note 41: Assets held in trust Assets held in trust are moneys that are not held on account of the Australian Government or for the use or benefit of the Australian Government. These funds are held by the Australian Government in a trustee capacity and are generally subject to trust law.
Assets held in trust are not recognised in the primary statements. Details pertaining to assets held in trust can be found in the audited financial reports of individual Australian Government controlled entities.
Assets held in trust that do not stand to the credit of a Special Account are held by the following Australian Government controlled entities (primarily entities subject to the CAC Act).

Notes to the financial statements
215
Commonwealth controlled entity Description of special publicmoney account 2014 2013
$m $mAustralian Government Solicitor Solicitor trust accounts 25 7
Australian Securities and Monies held under reg. 7.6.02AAInvestments Commission of the Corporations Regulations 10 11
Australian Securities and Monies held under section 1284(1) ofInvestments Commission the Corporations Act 2 2
Comcare Comcare Beneficiaries Trust Account (BTA) 1 1
Commonwealth Scientific and Elwood and Hannah ZimmermanIndustrial Research Organisation Trust Fund 5 5
Commonwealth Scientific and Schlinger TrustIndustrial Research Organisation 3 2
Indigenous Business Australia Aboriginal and Torres StraitIslander Commission Funds 4 4
Various entities Other trust moneys held for variouspurposes 2 2
Total assets held in trust 52 34
Balance
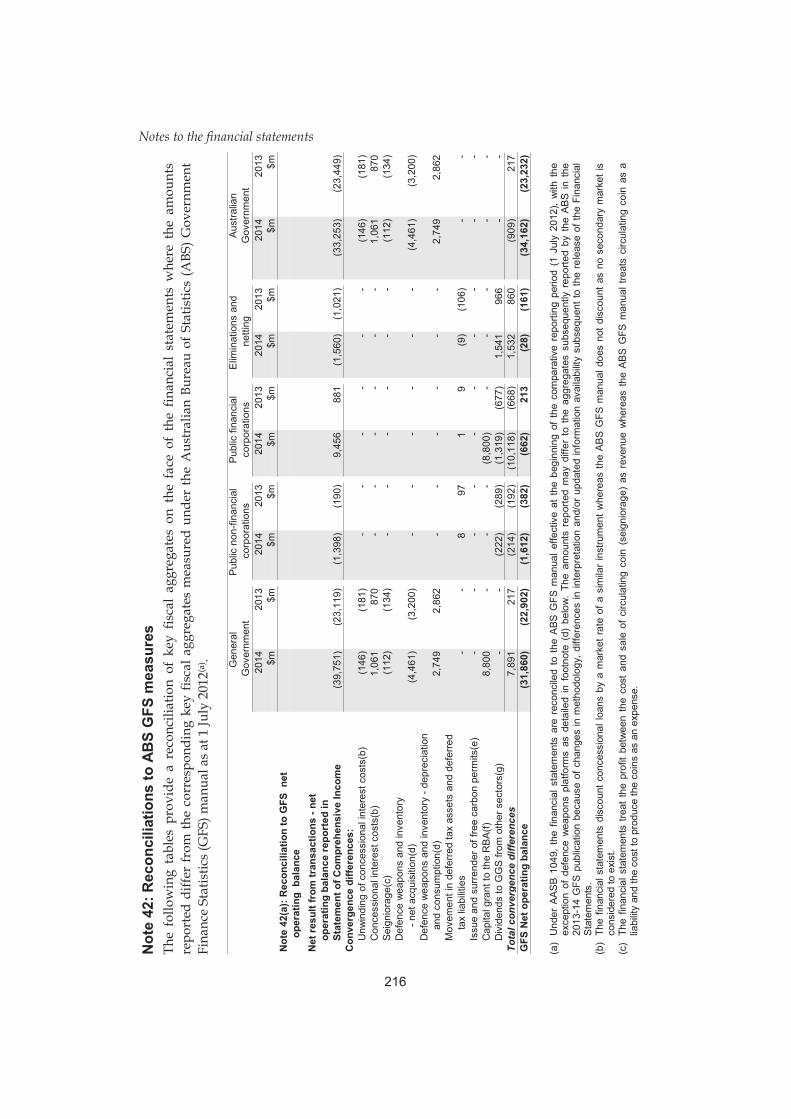
Notes to the financial statements
216
Not
e 42
: Rec
onci
liatio
ns to
AB
S G
FS m
easu
res
The
follo
win
g ta
bles
pro
vide
a r
econ
cilia
tion
of k
ey f
isca
l ag
greg
ates
on
the
face
of
the
finan
cial
sta
tem
ents
whe
re t
he a
mou
nts
repo
rted
diff
er fr
om th
e co
rres
pond
ing
key
fisca
l agg
rega
tes
mea
sure
d un
der
the
Aus
tral
ian
Bure
au o
f Sta
tistic
s (A
BS) G
over
nmen
t Fi
nanc
e St
atis
tics (
GFS
) man
ual a
s at
1 Ju
ly 2
012(
a).
2014
2013
2014
2013
2014
2013
2014
2013
2014
2013
$m$m
$m$m
$m$m
$m$m
$m$m
Not
e 42
(a):
Rec
onci
liatio
n to
GFS
net
ope
ratin
g b
alan
ceN
et re
sult
from
tran
sact
ions
- ne
top
erat
ing
bala
nce
repo
rted
in
Stat
emen
t of C
ompr
ehen
sive
Inco
me
(39,
751)
(23,
119)
(1,3
98)
(190
)9,
456
881
(1,5
60)
(1,0
21)
(33,
253)
(23,
449)
Con
verg
ence
diff
eren
ces:
Unw
indi
ng o
f con
cess
iona
l int
eres
t cos
ts(b
)(1
46)
(181
)-
--
--
-(1
46)
(181
)C
once
ssio
nal i
nter
est c
osts
(b)
1,06
187
0-
--
--
-1,
061
870
Sei
gnio
rage
(c)
(112
)(1
34)
--
--
--
(112
)(1
34)
Def
ence
wea
pons
and
inve
ntor
y -
net a
cqui
sitio
n(d)
(4,4
61)
(3,2
00)
--
--
--
(4,4
61)
(3,2
00)
Def
ence
wea
pons
and
inve
ntor
y - d
epre
ciat
ion
and
cons
umpt
ion(
d)2,
749
2,86
2-
--
--
-2,
749
2,86
2M
ovem
ent i
n de
ferr
ed ta
x as
sets
and
def
erre
dta
x lia
bilit
ies
--
897
19
(9)
(106
)-
-Is
sue
and
surr
ende
r of f
ree
carb
on p
erm
its(e
)-
--
--
--
--
-C
apita
l gra
nt to
the
RB
A(f)
8,80
0-
--
(8,8
00)
--
--
-D
ivid
ends
to G
GS
from
oth
er s
ecto
rs(g
)-
-(2
22)
(289
)(1
,319
)(6
77)
1,54
196
6-
-To
tal c
onve
rgen
ce d
iffer
ence
s7,
891
217
(214
)(1
92)
(10,
118)
(668
)1,
532
860
(909
)21
7G
FS N
et o
pera
ting
bala
nce
(31,
860)
(22,
902)
(1,6
12)
(382
)(6
62)
213
(28)
(161
)(3
4,16
2)(2
3,23
2)
Gen
eral
P
ublic
non
-fina
ncia
l P
ublic
fina
ncia
lE
limin
atio
ns a
nd
Aus
tralia
nG
over
nmen
tco
rpor
atio
nsco
rpor
atio
nsne
tting
Gov
ernm
ent
(a)
Und
er A
AS
B 1
049,
the
fin
anci
al s
tate
men
ts a
re r
econ
cile
d to
the
ABS
GFS
man
ual e
ffect
ive
at t
he b
egin
ning
of
the
com
para
tive
repo
rting
per
iod
(1 J
uly
2012
), w
ith t
he
exce
ptio
n of
def
ence
wea
pons
pla
tform
s as
det
aile
d in
foo
tnot
e (d
) be
low
. Th
e am
ount
s re
porte
d m
ay d
iffer
to
the
aggr
egat
es s
ubse
quen
tly r
epor
ted
by t
he A
BS
in t
he
2013
-14
GFS
pub
licat
ion
beca
use
of c
hang
es in
met
hodo
logy
, diff
eren
ces
in in
terp
reta
tion
and/
or u
pdat
ed in
form
atio
n av
aila
bilit
y su
bseq
uent
to th
e re
leas
e of
the
Fina
ncia
l S
tate
men
ts.
(b)
The
finan
cial
sta
tem
ents
dis
coun
t con
cess
iona
l loa
ns b
y a
mar
ket r
ate
of a
sim
ilar
inst
rum
ent w
here
as th
e A
BS
GFS
man
ual d
oes
not d
isco
unt a
s no
sec
onda
ry m
arke
t is
cons
ider
ed to
exi
st.
(c)
The
finan
cial
sta
tem
ents
trea
t th
e pr
ofit
betw
een
the
cost
and
sal
e of
circ
ulat
ing
coin
(se
igni
orag
e) a
s re
venu
e w
here
as t
he A
BS
GFS
man
ual t
reat
s ci
rcul
atin
g co
in a
s a
liabi
lity
and
the
cost
to p
rodu
ce th
e co
ins
as a
n ex
pens
e.

Notes to the financial statements
217
(d)
The
finan
cial
sta
tem
ents
trea
t acq
uisi
tions
of d
efen
ce w
eapo
ns p
latfo
rms
as c
apita
l exp
endi
ture
rec
ogni
sed
as a
n as
set w
ith d
epre
ciat
ion
reco
rded
in th
e op
erat
ing
stat
emen
t. Th
e pr
evio
us A
BS
GFS
man
ual t
reat
ed a
cqui
sitio
ns o
f de
fenc
e w
eapo
ns p
latfo
rms
and
expl
osiv
e or
dnan
ce a
s an
exp
ense
at
the
time
of a
cqui
sitio
n. T
his
has
now
bee
n am
ende
d in
the
ABS
GFS
man
ual t
o ad
opt a
con
sist
ent t
reat
men
t to
AAS.
Und
er A
ASB
104
9, th
e am
ende
d G
FS re
quire
men
t is
man
dato
ry fr
om 2
014-
15 (r
efer
Not
e 1.
3).
(e)
The
issu
ance
and
sur
rend
er o
f fre
e ca
rbon
uni
ts a
nd A
ustra
lian
Car
bon
Cre
dit U
nits
(AC
CU
s) u
sed
in th
e se
ttlem
ent o
f em
issi
ons
liabi
litie
s ar
e no
t rec
ogni
sed
in th
e fin
anci
al
stat
emen
ts w
here
as th
e A
BS G
FS m
anua
l tre
ats
the
issu
ance
and
sur
rend
er o
f the
se fr
ee u
nits
as
expe
nses
and
rev
enue
s re
spec
tivel
y. A
s th
is in
volv
es a
gro
ssin
g up
of
reve
nues
and
exp
ense
s, th
e im
pact
on
key
fisca
l agg
rega
tes
is im
mat
eria
l. (f)
Th
e 20
13-1
4 fin
anci
al s
tate
men
ts tr
eate
d a
capi
tal p
aym
ent t
o th
e R
BA
as a
cap
ital g
rant
exp
ense
for
the
Gen
eral
Gov
ernm
ent S
ecto
r an
d re
venu
e fo
r th
e P
ublic
Fin
anci
al
Cor
pora
tions
Sec
tor.
The
AB
S G
FS m
anua
l tre
ats
this
as
an e
quity
inje
ctio
n w
hich
wou
ld n
ot a
ppea
r on
the
oper
atin
g st
atem
ent.
(g)
The
finan
cial
sta
tem
ents
tre
at d
ivid
ends
to
the
Gen
eral
Gov
ernm
ent
Sect
or a
s a
dist
ribut
ion
to o
wne
rs w
here
as t
he A
BS G
FS m
anua
l tre
ats
divi
dend
s to
ow
ners
as
an
expe
nse.
N
ote
42: R
econ
cilia
tions
to A
BS
GFS
mea
sure
s (c
ontin
ued)
2014
2013
2014
2013
2014
2013
2014
2013
2014
2013
$m$m
$m$m
$m$m
$m$m
$m$m
Not
e 42
(b):
Rec
onci
liatio
n to
GFS
tota
l ch
ange
in n
et w
orth
Tota
l cha
nge
in n
et w
orth
bef
ore
tran
sact
ions
with
ow
ners
in th
eir
capa
city
as
owne
rs a
s re
port
ed in
St
atem
ent o
f Com
preh
ensi
ve In
com
e(5
4,26
9)45
,305
(1,1
05)
(500
)10
,116
3,74
0(9
,167
)(2
,217
)(5
4,42
5)46
,328
Con
verg
ence
diff
eren
ces:
Rel
atin
g to
net
ope
ratin
g ba
lanc
e7,
891
217
(214
)(1
92)
(10,
118)
(668
)1,
532
860
(909
)21
7R
elat
ing
to o
ther
eco
nom
ic fl
ows
(4,9
52)
(240
)(1
,692
)(1
,632
)1,
321
(2,3
95)
9,33
31,
039
4,01
0(3
,227
)R
elat
ing
to tr
ansa
ctio
ns w
ith o
wne
rs-
-3,
011
2,32
4(1
,319
)(6
77)
(1,6
92)
(1,6
47)
--
Tota
l con
verg
ence
diff
eren
ces
2,94
0(2
3)1,
105
500
(10,
116)
(3,7
40)
9,17
325
23,
102
(3,0
11)
GFS
Tot
al c
hang
e in
net
wor
th(5
1,32
9)45
,282
--
--
6(1
,965
)(5
1,32
3)43
,317
Gen
eral
Pu
blic
non
-fina
ncia
l Pu
blic
fina
ncia
lEl
imin
atio
ns a
nd
Aust
ralia
nG
over
nmen
tco
rpor
atio
nsco
rpor
atio
nsne
tting
Gov
ernm
ent

Notes to the financial statements
218
Not
e 42
: Rec
onci
liatio
ns to
AB
S G
FS m
easu
res
(con
tinue
d)
2014
2013
2014
2013
2014
2013
2014
2013
2014
2013
$m$m
$m$m
$m$m
$m$m
$m$m
Not
e 42
(c):
Rec
onci
liatio
n G
FS n
et le
ndin
g/(b
orro
win
g)N
et le
ndin
g/(b
orro
win
g) a
s re
port
ed in
St
atem
ent o
f Com
preh
ensi
ve In
com
e(4
3,60
1)(2
4,10
7)(5
,818
)(3
,776
)8,
739
942
(1,5
61)
(1,0
19)
(42,
241)
(27,
960)
Con
verg
ence
diff
eren
ces:
Rel
atin
g to
net
ope
ratin
g ba
lanc
e7,
891
217
(214
)(1
92)
(10,
118)
(668
)1,
532
860
(909
)21
7D
efen
ce w
eapo
ns a
nd in
vent
ory
- ne
t acq
uisi
tion(
a)4,
461
3,20
0-
--
--
-4,
461
3,20
0D
efen
ce w
eapo
ns a
nd in
vent
ory
- dep
reci
atio
nan
d co
nsum
ptio
n(a)
(2,7
49)
(2,8
62)
--
--
--
(2,7
49)
(2,8
62)
Auct
ion
sale
s of
spe
ctru
m(b
)-
1,96
5-
--
--
--
1,96
5To
tal c
onve
rgen
ce d
iffer
ence
s9,
603
2,52
0(2
14)
(192
)(1
0,11
8)(6
68)
1,53
286
080
32,
520
GFS
Net
lend
ing/
(bor
row
ing)
(33,
998)
(21,
587)
(6,0
32)
(3,9
68)
(1,3
79)
274
(29)
(159
)(4
1,43
8)(2
5,44
0)
Gen
eral
Pu
blic
non
-fina
ncia
l Pu
blic
fina
ncia
lEl
imin
atio
ns a
nd
Aust
ralia
nG
over
nmen
tco
rpor
atio
nsco
rpor
atio
nsne
tting
Gov
ernm
ent
(a)
The
finan
cial
sta
tem
ents
trea
t acq
uisi
tions
of d
efen
ce w
eapo
ns p
latfo
rms
as c
apita
l exp
endi
ture
reco
gnis
ed a
s an
ass
et w
ith d
epre
ciat
ion
of d
efen
ce w
eapo
ns p
latfo
rms
and
cons
umpt
ion
of e
xplo
sive
ord
nanc
e tre
ated
as
an e
xpen
se in
the
oper
atin
g st
atem
ent.
The
prev
ious
AB
S G
FS m
anua
l tre
ated
acq
uisi
tions
of d
efen
ce w
eapo
ns p
latfo
rms
and
expl
osiv
e or
dnan
ce a
s an
exp
ense
at t
he ti
me
of a
cqui
sitio
n. T
his
has
now
bee
n am
ende
d in
the
AB
S G
FS m
anua
l to
adop
t a c
onsi
sten
t tre
atm
ent t
o A
AS.
Und
er A
ASB
104
9,
the
amen
ded
GFS
requ
irem
ent i
s m
anda
tory
from
201
4-15
(ref
er N
ote
1.3)
. (b
) Th
e fin
anci
al s
tate
men
ts re
cogn
ise
the
disp
osal
of s
pect
rum
lice
nces
at t
he p
oint
of i
ssue
whe
reas
the
ABS
GFS
man
ual r
ecog
nise
s sp
ectru
m li
cenc
es a
t the
tim
e of
auc
tion
and
the
proc
eeds
from
thei
r sal
e at
the
poin
t of a
uctio
n, re
flect
ed o
n th
e ba
lanc
e sh
eet a
s a
rece
ivab
le.

Notes to the financial statements
219
Not
e 42
: Rec
onci
liatio
ns to
AB
S G
FS m
easu
res
(con
tinue
d)
2014
2013
2014
2013
2014
2013
2014
2013
2014
2013
$m$m
$m$m
$m$m
$m$m
$m$m
Not
e 42
(d):
Rec
onci
liatio
n to
G
FS n
et w
orth
Net
wor
th a
s re
port
ed in
Bal
ance
She
et(2
61,0
92)
(207
,401
)12
,293
10,3
7120
,651
11,8
52(3
6,16
6)(2
5,30
5)(2
64,3
14)
(210
,483
)C
onve
rgen
ce d
iffer
ence
s:P
rovi
sion
for d
oubt
ful d
ebts
(a)
25,7
6123
,258
1311
811
--
25,7
8223
,280
Con
cess
iona
lity
on lo
ans
and
inve
stm
ents
(b)
8,68
87,
764
--
--
--
8,68
87,
764
Inve
stm
ent i
n ot
her s
ecto
r ent
ities
(c)
(3,4
45)
(3,6
26)
--
--
3,44
53,
626
--
Def
erre
d ta
x as
sets
(d)
--
(909
)(9
03)
(12)
(13)
921
916
--
Def
ence
wea
pons
pla
tform
s an
d in
vent
ory(
e)(4
3,76
0)(4
2,63
1)-
--
--
-(4
3,76
0)(4
2,63
1)D
ivid
end
paya
ble
--
--
--
--
--
Spe
cial
dra
win
g rig
hts
(SD
R)(
f)-
--
--
--
--
-S
eign
iora
ge(g
)(3
,750
)(3
,638
)-
--
--
-(3
,750
)(3
,638
)D
efer
red
tax
liabi
lity(
d)-
-53
752
3-
-(5
37)
(523
)-
-A
uctio
n sa
les
of s
pect
rum
(h)
1,96
51,
965
--
--
--
1,96
51,
965
Sha
res
and
othe
r con
tribu
ted
capi
tal(i
)-
-(1
1,93
4)(1
0,00
2)(2
0,64
7)(1
1,85
0)32
,337
21,2
86(2
44)
(566
)M
inor
ity in
tere
sts
--
--
--
--
--
Tota
l con
verg
ence
diff
eren
ces
(14,
542)
(16,
909)
(12,
293)
(10,
371)
(20,
651)
(11,
852)
36,1
6625
,305
(11,
320)
(13,
827)
GFS
Net
wor
th(2
75,6
34)
(224
,310
)-
--
--
-(2
75,6
34)
(224
,310
)
Gen
eral
P
ublic
non
-fina
ncia
l P
ublic
fina
ncia
lE
limin
atio
ns a
nd
Aus
tralia
nG
over
nmen
tco
rpor
atio
nsco
rpor
atio
nsne
tting
Gov
ernm
ent
(a)
The
finan
cial
sta
tem
ents
trea
t pro
visi
ons
for d
oubt
ful d
ebts
as
an o
ffset
to th
e as
set i
n th
e ba
lanc
e sh
eet.
The
AB
S G
FS m
anua
l doe
s no
t con
side
r the
cre
atio
n of
a p
rovi
sion
to
be
an e
cono
mic
eve
nt a
nd th
eref
ore
excl
udes
it fr
om th
e ba
lanc
e sh
eet.
(b)
The
finan
cial
sta
tem
ents
dis
coun
t con
cess
iona
l loa
ns b
y a
mar
ket r
ate
of a
sim
ilar
inst
rum
ent w
here
as t
he A
BS
GFS
man
ual d
oes
not d
isco
unt a
s no
sec
onda
ry m
arke
t is
cons
ider
ed to
exi
st.
(c)
The
finan
cial
sta
tem
ents
app
ly A
ASB
13
to th
e va
luat
ion
of th
e G
ener
al G
over
nmen
t Sec
tor’s
inve
stm
ent i
n pu
blic
cor
pora
tions
whe
reas
the
ABS
GFS
man
ual v
alue
s pu
blic
co
rpor
atio
ns a
t the
ir ne
t ass
ets
unle
ss th
e sh
ares
in a
pub
lic c
orpo
ratio
n ar
e pu
blic
ly tr
aded
. A c
onve
rgen
ce d
iffer
ence
aris
es w
here
the
appl
icat
ion
of A
ASB
13 r
esul
ts in
a
valu
atio
n ot
her t
han
net a
sset
s.
(d)
Def
erre
d ta
x as
sets
and
def
erre
d ta
x lia
bilit
ies
are
repo
rted
in th
e fin
anci
al s
tate
men
ts w
here
as th
e A
BS G
FS m
anua
l doe
s no
t rec
ogni
se th
ese
item
s.
(e)
The
finan
cial
sta
tem
ents
trea
t acq
uisi
tions
of d
efen
ce w
eapo
ns p
latfo
rms
and
expl
osiv
e or
dnan
ce a
s ca
pita
l exp
endi
ture
rec
ogni
sed
as a
n as
set i
n th
e ba
lanc
e sh
eet.
The
prev
ious
AB
S G
FS m
anua
l tre
ated
acq
uisi
tions
of d
efen
ce w
eapo
ns p
latfo
rms
and
expl
osiv
e or
dnan
ce a
s an
exp
ense
at t
he ti
me
of a
cqui
sitio
n. T
his
has
now
bee
n am
ende
d in
the
ABS
GFS
man
ual t
o ad
opt a
con
sist
ent t
reat
men
t to
AAS
. U
nder
AA
SB
1049
, the
am
ende
d G
FS re
quire
men
t is
man
dato
ry fr
om 2
014-
15 (r
efer
Not
e 1.
3).
(f)
The
prev
ious
AB
S G
FS m
anua
l tre
ated
SD
R c
urre
ncy
issu
ed b
y th
e IM
F as
a c
ontin
gent
liab
ility.
The
AB
S G
FS m
anua
l ver
sion
as
at 1
Jul
y 20
12 n
ow tr
eats
SD
R c
urre
ncy
issu
ed b
y th
e IM
F as
a li
abilit
y w
hich
is c
onsi
sten
t with
AAS
. Th
e co
mpa
rativ
e re
conc
iliatio
n ha
s be
en re
stat
ed to
rem
ove
this
div
erge
nce.
(g
) Th
e fin
anci
al s
tate
men
ts tr
eat
the
prof
it be
twee
n th
e co
st a
nd s
ale
of c
ircul
atin
g co
in (
seig
nior
age)
as
reve
nue
whe
reas
the
AB
S G
FS m
anua
l tre
ats
circ
ulat
ing
coin
as
a lia
bilit
y an
d th
e co
st to
pro
duce
the
coin
s as
an
expe
nse.
(h
) Th
e fin
anci
al s
tate
men
ts re
cogn
ise
the
disp
osal
of s
pect
rum
lice
nces
at t
he p
oint
of i
ssue
whe
reas
the
ABS
GFS
man
ual r
ecog
nise
s sp
ectru
m li
cenc
es a
t the
tim
e of
auc
tion
and
the
proc
eeds
from
thei
r sal
e at
the
poin
t of a
uctio
n, re
flect
ed o
n th
e ba
lanc
e sh
eet a
s a
rece
ivab
le.
(i)
The
finan
cial
sta
tem
ents
tre
at s
hare
s an
d ot
her
cont
ribut
ed c
apita
l in
publ
ic c
orpo
ratio
ns a
s pa
rt of
net
wor
th w
here
as t
he A
BS G
FS m
anua
l ded
ucts
sha
res
and
othe
r co
ntrib
uted
cap
ital i
n th
e ca
lcul
atio
n of
net
wor
th (w
ith n
et w
orth
cal
cula
ted
as a
sset
s le
ss li
abilit
ies
less
sha
res
and
othe
r con
tribu
ted
equi
ty).

Notes to the financial statements
220
Note 42: Reconciliations to ABS GFS measures (continued) The ABS GFS manual measures inventory at market value (rather than the lower of cost and net realisable value). It also does not recognise the provision for decommissioning/restoration costs. The above reconciliation has not been adjusted for these items on the basis of materiality and information availability.
Reconciliation to GFS cash surplus/(deficit) is disclosed on the face of the cash flow statement.

Notes to the financial statements
221
Note 43: Audit expenses With the exception of a small number of entities, audit services within the reporting entity are provided by the Auditor–General. The cost of these services which include performance and financial statement audits, totalled $75.2 million (2013: $71.7 million). This amount includes $0.7 million for the audit of the Consolidated Financial Statements (2013: $0.7 million).
Of this, $44.5 million (2013: $42.2 million) relates to financial statement audit report expense and $30.0 million (2013: $28.8 million) to all other Australian National Audit Office output expenses.
Note 44: Explanation of major variances between the general government sector budget and the actual outcomes The following tables provide a comparison of the original budget as presented in Budget Paper No. 1 Budget Strategy and Outlook 2013-14, Statement 9 Australian Government Budget Financial Statements to the 2013-14 final outcome as presented in accordance with AASB 1049 for the general government sector (GGS).
The Australian Government does not present budgets at the whole of government level, and therefore, only the GGS is presented in this note. The Budget is not audited.

Notes to the financial statements
222
General government sector operating statement 2013-14
2014 Original Budget Revised Actual budget(a) variance budget(b)
$m $m $m $mRevenue from transactionsTaxation revenue 349,208 366,664 (17,456) 350,956Sales of goods and services 8,575 8,577 (2) 8,853Interest income 3,339 4,313 (974) 3,445Dividend income 4,105 2,426 1,679 4,288Other 6,843 5,768 1,075 6,724Total revenue 372,070 387,749 (15,679) 374,267Expenses from transactionsGross operating expensesWages and salaries 18,823 19,772 (949) 19,532Superannuation 6,372 4,039 2,333 6,235Depreciation and amortisation 6,340 5,813 527 6,474Supply of goods and services 75,134 75,918 (784) 74,552Other operating expenses 6,017 5,467 550 6,039Total gross operating expenses 112,686 111,009 1,677 112,833Superannuation interest expense 8,214 8,462 (248) 8,320Interest expenses 15,050 14,008 1,042 14,396Current transfers
Current grants 115,960 118,137 (2,177) 117,437Subsidy expenses 13,368 14,944 (1,576) 15,534Personal benefits 125,184 121,699 3,485 124,944
Total current transfers 254,512 254,780 (269) 257,915Capital transfers
Mutually agreed write-downs 2,627 2,137 490 3,094Other capital grants 18,732 7,905 10,827 18,736
Total capital transfers 21,359 10,042 11,317 21,830Total expenses 411,821 398,301 13,520 415,294Net operating balance (39,751) (10,552) (29,199) (41,027)
(a) Original budget for 2013-14 as presented in the 2013-14 Budget papers released in May 2013. (b) Revised budget for 2013-14 as presented in the 2014-15 Budget papers released in May 2014.

Notes to the financial statements
223
General government sector operating statement 2013-14 (continued) 2014 Original Budget Revised
Actual budget(a) variance budget(b)$m $m $m $m
Other economic flows included inoperating resultNet write-downs of assets (including bad and
doubtful debts) (7,221) (7,488) 267 (5,278)Assets recognised for the first time 310 559 (249) 330Net gain/(loss) from the sale of assets 6,093 - 6,093 -Net foreign exchange gains (402) 73 (475) (447)Net swap interest received (524) - (524) (663)Other gains/(losses) (8,386) 6,579 (14,965) 11,712Share of net result from associates and joint
ventures accounted for using the equity method 64 - 64 -Total Other economic flows included
in operating result (10,066) (278) (9,788) 5,655Operating Result (49,817) (10,830) (38,987) (35,372)
Other economic flows - Other non-ownermovements in equityRevaluation of equity 7,679 (2,223) 9,902 7,185Revaluation of non-financial assets 1,158 23 1,135 -Actuarial revaluations of superannuation (13,233) 140 (13,373) (6,720)Other economic revaluations (58) 543 (601) 704
Total other economic flows included in equity (4,454) (1,517) (2,937) 1,168Comprehensive result - Total change in
net worth (54,271) (12,347) (41,924) (34,204)Net operating balance (39,751) (10,552) (29,199) (41,027)less Net acquisition of non-financial assetsPurchases of non-financial assets 9,613 8,755 858 10,240less Sales of non-financial assets 241 346 (105) 273less Depreciation 6,341 5,813 528 6,474plus Change in inventories 704 270 434 430plus Other movements in non-financial assets 115 78 37 105Total net acquisition of non-financial assets 3,850 2,945 905 4,027Fiscal balance (net lending/borrowing) (43,601) (13,497) (30,104) (45,055) (a) Original budget for 2013-14 as presented in the 2013-14 Budget papers released in May 2013. (b) Revised budget for 2013-14 as presented in the 2014-15 Budget papers released in May 2014.
Fiscal balance
The fiscal balance for the year to 30 June 2014 was a deficit of $43.6 billion, representing a movement of $30.1 billion on the original 2013-14 estimated deficit of $13.5 billion.
Revenue
The total revenue for 2013-14 was $372.1 billion, $15.7 billion (4.0 per cent) lower than the original budget of $387.7 billion.
Notes to the financial statements
224
Total taxation revenue was lower by $17.5 billion (to $349.2 billion) compared to the original budget of $366.7 billion. The key drivers for the change included:
• a shortfall of $7.4 billion in individuals and other withholding taxes consistent with weaker than expected growth in wages and salaries;
• a shortfall of $5.2 billion in company tax reflecting weaker economic conditions affecting corporate profitability;
• a shortfall of $3.6 billion in carbon pricing mechanism revenue. Around $2.3 billion of this was the result of using different accounting treatments for the 2013-14 Budget forecast and the outcome. This affects both revenue and expenses and has no net impact on the fiscal balance. The remaining difference was consistent with lower than expected covered emissions. The carbon estimates are considered preliminary as certain emitters are not required to report in interim emissions reports, and emitters may base their interim report on the previous year’s emissions. Information on actual 2013-14 emissions will become available following the final emissions reporting in late 2014;
• a shortfall of $2.3 billion in superannuation funds consistent with lower than expected taxable contributions and earnings;
• a shortfall of $1.6 billion in resources rent taxes reflecting lower than budgeted revenue from both the petroleum resource rent tax and the minerals resource rent; partly offset by
– an excess of $2.4 billion in the goods and services tax reflecting stronger than expected collections.
The total non-taxation revenue from transactions for 2013-14 was $22.9 billion, an increase of $1.8 billion compared to the original budget of $21.1 billion. The increase was primarily driven by:
• an increase of $1.7 billion in dividend income mainly relating to dividend received from the RBA ($1.2 billion) and investments managed by the Future Fund ($0.7 billion), offset by small decreases across a number of agencies;
• an increase of $1.1 billion in other revenue. This increase in revenue was driven by an increase in unclaimed superannuation money received by the ATO ($0.3 billion), petroleum royalties ($0.4 billion) and resources received free of charge associated with the Water Reform Programme ($0.1 billion); offset by
– a decrease of $1.0 billion in interest income driven by the Future Fund, impacted by the strategic asset allocation.

Notes to the financial statements
225
Expenses
Total expenses grew by $13.5 billion (3.4 per cent) to $411.8 billion compared to the original budget of $398.3 billion.
The total gross operating expenses for 2013-14 amounted to $112.7 billion, an increase of $1.7 billion compared to the original budget of $111.0 billion. The change was mainly driven by:
• superannuation expense increased by $2.3 billion mainly due to the different interest rates used in calculating the budget and actuals figures for civilian superannuation schemes;
• other operating expenses increased by $0.6 billion due to increases in employee costs other than wages and salaries. This included a $0.5 billion increase in separations and redundancies across a number of agencies;
• depreciation and amortisation increased by $0.5 billion mainly due to an increase in Defence’s asset base; and
• the above increases were partially offset by a $0.9 billion reduction in wages and salaries across a number of agencies and a $0.8 billion decrease in supply of goods and services.
Interest expenses increased by $1.0 billion mainly relating to the interest on Government securities reflecting the increase in Goverment securities on issue.
Total current and capital transfers increased by $11.1 billion to $275.9 billion against an original budget of $264.8 billion. The key drivers for the increase included:
• an increase of $9.1 billion in current and capital grants mainly relating to a one-off $8.8 billion grant payment to the RBA to help manage future economic crises, an increase of $1.2 billion in General Revenue Assistance to the States, an increase of $1.5 billion on road transport, offset by a decrease of $0.8 billion in primary care practice incentives reclassified to personal benefit payments and a decrease in $0.6 billion in resources related initiatives and management; and
• personal benefits increased by $3.5 billion mainly relating to the childcare benefit and rebate, Private Health Insurance rebate reflecting greater than expected numbers of people with subsidised health cover, parents and baby payments and primary care practice incentives reclassified from grants to personal benefits payment; offset by
– subsidy expenses decreased by $1.5 billion mainly due to the research and development tax incentive programme administered by the ATO.

Notes to the financial statements
226
Net acquisition of non-financial assets
Net acquisition of non-financial assets was $0.9 billion higher than the original budget due to an increase in purchases of non-financial assets of $0.9 billion and increased inventories of $0.4 billion, offset by an increase in depreciation of $0.5 billion. The major increases relate to Defence for the purchase of specialist military equipment.
Detailed explanations of the changes to revenue, expenses and net acquisition of non-financial assets can be found in the Mid-Year Economic and Fiscal Outlook 2013-14 (Part 3: Fiscal Strategy and Outlook), Budget Paper No. 1 Budget Strategy and Outlook 2014-15 and the Final Budget Outcome 2013-14 (Part 1).
Other economic flows
Net losses from other economic flows included in operating result and equity increased from a budgeted net loss of $1.8 billion to an actual net loss of $14.5 billion. The primary reasons for the $12.7 billion reduction in net worth are the changes in:
• the market value of debt ($6.6 billion);
• the revaluation of superannuation liabilities ($20.9 billion), primarily as a result of the change in the discount rate which is tied to the government bond rate (the budget does not estimate changes in discount rates in the estimation of the superannuation liability);
• the revaluation of equity ($9.9 billion) in public corporations; and
• net gains from the sale of assets ($6.1 billion) primarily attributable to the Future Fund gain on the sale of investments.

Notes to the financial statements
227
General government sector balance sheet as at 30 June 2014 2014 Original Budget Revised
Actual budget(a) variance budget(b)$m $m $m $m
AssetsFinancial assets
Cash and deposits 3,844 2,679 1,165 3,004Advances paid 34,040 41,017 (6,977) 39,737Other receivables 42,629 44,500 (1,871) 46,051Investments, loans and placements 117,611 112,965 4,646 117,371Equity investments 75,576 60,565 15,011 73,630
Total financial assets 273,700 261,725 11,975 279,792
Non-financial assetsLand 9,331 8,719 612 8,929Buildings 24,723 24,454 269 24,335Plant, equipment and infrastructure 54,294 54,888 (594) 54,875Intangibles 6,137 5,712 425 5,810Investment property 183 182 1 196Inventories 8,253 7,206 1,047 7,942Biological assets 36 37 (1) 35Heritage and cultural assets 10,825 10,465 360 10,573Assets held for sale 95 83 12 136Other non-financial assets 3,395 3,130 265 397
Total non-financial assets 117,272 114,876 2,396 113,228Total assets 390,972 376,601 14,371 393,020LiabilitiesInterest bearing liabilities
Deposits held 211 192 19 182Government securities 351,282 321,252 30,030 346,648Loans and other interest bearing liabilities 10,382 11,851 (1,469) 9,608Other borrowing 1,529 1,470 59 1,524
Total interest bearing liabilities 363,404 334,765 28,639 357,963Provisions and payables
Superannuation liability 221,747 148,710 73,037 157,067Other employee liabilities 15,930 14,829 1,101 15,102Suppliers payable 4,882 4,259 623 4,632Personal benefits payable 5,607 6,641 (1,034) 12,384Subsidies payable 4,482 3,475 1,007 4,242Grants payable 3,355 4,236 (881) 14,170Other payables and provisions 32,657 33,145 (488) 13,879
Total provisions and payables 288,660 215,294 73,366 221,477Total liabilities 652,064 550,059 102,005 579,439Net worth (261,092) (173,458) (87,634) (186,419) (a) Original budget for 2013-14 as presented in the 2013-14 Budget papers released in May 2013. (b) Revised budget for 2013-14 as presented in the 2014-15 Budget papers released in May 2014.

Notes to the financial statements
228
Net worth
Net worth for the financial year ended 30 June 2014 was negative $261.1 billion. This represented a further $87.6 billion decrease on the original 2013-14 estimated net worth of negative $173.5 billion. The change in net worth reflected an increase of $14.4 billion in assets and an increase of $102.0 billion in liabilities.
Assets
Total assets increased by $14.4 billion (3.8 per cent) to $391.0 billion at 30 June 2014. This increase is mainly related to financial assets.
The key movements in financial assets from the original budget to the final outcome included the following:
• increase in cash of $1.2 billion is largely as a result of growth in term deposits managed by AOFM.
• increase in investments, loans and placements of $4.6 billion. This increase was primarily due to:
– a $6.6 billion increase in the value of deposits and securities held by the AOFM due to changes in cash management or liquidity requirements compared to the original forecast; and
– a $2.4 billion increase in investments managed by the Future Fund; offset by
– a $4.5 billion decrease in the value of the IMF Quota payments due to international delays in the implementation of the 2010 IMF reforms.
• increase in equity investments of $15.0 billion. This increase was primarily due to:
– a $5.5 billion increase in investments managed by the Future Fund; and
– a $9.8 billion increase in Administered Investments in Portfolio Entities held by the Department of Treasury’s investment in the RBA and the Clean Energy Finance Corporation which increased during 2013-14. Other contributors included an investment valuation adjustment for investments in the Finance portfolio as at 30 June 2014.
• decrease in advances paid of $7.0 billion. This was mainly due to the different measurement techniques used between the original budget and the consolidated financial statements for the value of the advances paid to the International Development Association (IDA) and Asian Development Fund (ADF). In the original budget, IDA/ADF was recorded at nominal value whilst for the purpose of actual reporting fair value was used (see note 1.3 and the 2013-14 Budget Paper (No. 1) Statement 9 for more detail). The decrease was also driven by lower

Notes to the financial statements
229
Higher Education Loan Programme (HELP) receivable of $1.1 billion reflecting actuarial movements; and
• decrease in other receivables of $1.9 billion predominantly due to the delay in the spectrum sale process.
The key movements in non-financial assets of $2.4 billion from the original budget to the final outcome included the following:
• a $1.4 billion increase in non-financial assets, including $0.6 billion for land; $0.4 billion for heritage and cultural assets; and $0.4 billion for intangibles; offset by a $0.6 billion decrease in plant, equipment and infrastructure; and
• a $1.0 billion increase in inventories relating to Defence. The main driver for this increase is the difference between explosive ordnance acquired and ordnance consumed for the year.
Liabilities
Total liabilities increased by $102.0 billion (18.6 per cent) to $652.1 billion at 30 June 2014.
This movement included an increase of $73.4 billion (34.1 per cent) in provisions and payables to a balance of $288.7 billion and an increase of $28.6 billion (8.6 per cent) in interest bearing liabilities to a balance of $363.4 billion.
The key movements in provisions and payables from the original budget to the final outcome included the following:
• increase of $73.0 billion in the Australian Government’s superannuation liabilities. An increase of $61.5 billion was due to the different discount rates used to value the liability. In the original budget, a discount rate applied by the actuaries in preparing the Long-term Cost Report was used to value the superannuation liability to allow comparability between years for budget estimates. Consistent with the Australian Accounting Standards, the long-term government bond rate as at 30 June was used to calculate the superannuation liability for the purpose of actuals reporting. Additional information about the measurement of the superannuation liability between the budget and the final outcome is provided in note 1 and the 2013-14 Budget Paper (No. 1) Statement 9. In addition, revised indexation arrangements for military superannuation pensions have increased the liability by $7.8 billion. A further $3.6 billion increase is due to the adoption of revised actuarial assumptions for the PSS scheme;
• increase of $1.1 billion in other employee liabilities. This includes a $0.4 billion increase associated with the actuarial revaluation of Military Compensation Claims under the Military Rehabilitation and Compensation Act 2004 and the Safety, Rehabilitation and Compensation Act 1988, a $0.5 billion increase in the provision for

Notes to the financial statements
230
workers compensation and insurance claims and $0.2 billion for separation and redundancy provisions across a number of agencies;
• increase of $1.0 billion in subsidies payable mainly due to the Fuel Tax Credits Scheme; and
• increase of $0.6 billion in suppliers payable mainly associated with the Future Fund due to an increase in unsettled trades; offset by
• decrease of $1.0 billion in personal benefits payable in part due to the reclassification of childcare assistance to provisions;
• decrease of $0.9 billion in grants payables mainly attributable to revised expenditure estimates since original budget for overseas aid; and
• decrease of $0.5 billion in other payables and provisions, driven by a $0.7 billion decrease in the provision for unfunded university superannuation, a $0.2 billion decrease in the provision for interest on the overpayment of taxes, a $0.3 billion in other taxation provisions and payables, $0.3 billion decrease in unearned income for the levy on wholesale funding and large deposits and decreases across a number of agencies. These decreases were partly offset by the reclassification of childcare assistance from personal benefits.
The key movements in interest bearing liabilities from the original budget to the final outcome included the following:
• increase in Commonwealth Government Securities of $30.0 billion by the AOFM. The issuance volume was higher than predicted at the 2013-14 Budget which was partly offset by lower premiums on issuance and a lower than forecast mark-to-market adjustment; offset by
• decrease in loans and other interest bearing liabilities of $1.5 billion mainly relating to:
– decrease of $2.5 billion in Treasury Promissory Notes due to changes in 2013-14 calls on quota resources following the release of drawings by the IMF, as well as changes in exchange rates; offset by
– increase of $0.5 billion in swap principal payable held by the Future Fund; and
– increase of $0.4 billion in Treasury Special Drawing Rights due to changes in exchange rates.

Notes to the financial statements
231
General government sector cash flow statement 2013-14 2014 Original Budget Revised
Actual budget(a) variance budget(b)$m $m $m $m
OPERATING ACTIVITIESCash received
Taxes received 338,368 354,854 (16,486) 341,643Receipts from sales of goods and services 8,579 8,639 (60) 8,764Interest receipts 3,128 4,074 (946) 3,210Dividend receipts 2,978 2,526 452 3,040Other receipts 6,811 5,496 1,315 6,376
Total cash received 359,864 375,589 (15,725) 363,032Cash used
Payments for employees (25,889) (26,909) 1,020 (26,587)Payments for goods and services (75,845) (76,293) 448 (74,438)Grants and subsidies paid (148,990) (139,740) (9,250) (152,953)Interest paid (13,972) (11,909) (2,063) (13,935)Personal benefits (126,367) (122,319) (4,048) (126,398)Other payments (5,769) (5,271) (498) (6,056)
Total cash used (396,832) (382,442) (14,390) (400,366)Net cash from/(used by) operating activities (36,968) (6,853) (30,115) (37,334)INVESTING ACTIVITIESCash flows from investments in
non-financial assetsSales of non-financial assets 457 405 52 464Purchases of non-financial assets (9,012) (8,288) (724) (9,827)
Net cash flows from investments innon-financial assets (8,555) (7,883) (672) (9,363)
Cash flows from investments in financial assets for policy purposesNet advances repaid/(paid) (6,371) (10,073) 3,702 (6,575)
Net cash flows from investments in financial assets for policy purposes (6,371) (10,073) 3,702 (6,575)
Cash flows from investments in financial assets for liquidity purposesDecrease/(Increase) in investments (7,718) (4,919) (2,799) (8,592)
Net cash flows from investments in financial assets for liquidity purposes (7,718) (4,919) (2,799) (8,592)
Net cash from/(used by) investing activities (22,644) (22,874) 230 (24,530)FINANCING ACTIVITIESCash flows from financing activitiesCash received
Borrowings 63,218 31,996 31,222 64,689Other financing - - - 17
Total cash received 63,218 31,996 31,222 64,706Cash used
Other financing (1,875) (2,059) 184 (1,914)Total cash used (1,875) (2,059) 184 (1,914)Net cash flows from financing activities 61,343 29,937 31,406 62,792Net (decrease)/increase in cash held 1,731 209 1,522 928 (a) Original budget for 2013-14 as presented in the 2013-14 Budget papers released in May 2013. (b) Revised budget for 2013-14 as presented in the 2014-15 Budget papers released in May 2014.

Notes to the financial statements
232
General government sector cash flow statement 2013-14 (continued) 2014 Original Budget Revised
Actual budget(a) variance budget(b)$m $m $m $m
Cash at beginning of year 2,113 (17) 2,130 2,075Cash at end of year 3,844 192 3,652 3,004Key fiscal aggregateNet cash flows from operating activities (36,968) (6,853) (30,115) (37,334)Net cash flows from investments in
non-financial assets (8,555) (7,883) (672) (9,363)Cash surplus/(deficit) (45,523) (14,736) (30,787) (46,698)
Finance leases and similar arrangements (586) (469) (117) (469)GFS cash surplus/(deficit) (46,109) (15,205) (30,904) (47,166) (a) Original budget for 2013-14 as presented in the 2013-14 Budget papers released in May 2013. (b) Revised budget for 2013-14 as presented in the 2014-15 Budget papers released in May 2014. In 2013-14 the Australian Government had a GFS cash deficit of $46.1 billion, compared to a budgeted GFS cash deficit of $15.2 billion. This represented a movement of $30.9 billion.
The change in the cash flows primarily reflected a decrease in tax receipts, increase in grants and subsidies paid, personal benefits payment and interest paid, offset by a decrease in payments for employees and higher other receipts.
Note 45: List of Australian Government reporting entities The following is a list of Australian Government reporting entities which have been consolidated for the purposes of the financial report. Unless otherwise noted, all such entities are wholly owned. The list is based on the Australian Government Administrative Arrangement Orders in place at 30 June 2014.
Agriculture Portfolio
General government
Australian Fisheries Management Authority Australian Pesticides and Veterinary Medicines Authority Cotton Research and Development Corporation Department of Agriculture Fisheries Research and Development Corporation Grains Research and Development Corporation Grape and Wine Research Development Corporation Rural Industries Research and Development Corporation Wine Australia Corporation

Notes to the financial statements
233
Attorney-General’s Portfolio
General government
Administrative Appeals Tribunal Attorney-General’s Department Australian Business Arts Foundation Ltd (Creative Partnerships Australia)
(company limited by guarantee) Australian Commission for Law Enforcement Integrity Australia Council Australian Crime Commission Australian Federal Police Australian Film, Television and Radio School Australian Financial Security Authority Australian Human Rights Commission Australian Institute of Criminology Australian Law Reform Commission Australian National Maritime Museum Australian Security Intelligence Organisation Australian Transaction Reports and Analysis Centre Bundanon Trust (company limited by guarantee) Crimtrac Agency Family Court and Federal Circuit Court Federal Court of Australia High Court of Australia National Archives of Australia National Film and Sound Archive Australia National Gallery of Australia National Library of Australia National Museum of Australia National Portrait Gallery of Australia Office of Parliamentary Counsel Office of the Australian Information Commissioner Office of the Director of Public Prosecutions Old Parliament House Screen Australia
Public non-financial corporations
Australian Government Solicitor
Communications Portfolio
General government
Australian Broadcasting Corporation Australian Communications and Media Authority Department of Communications Special Broadcasting Service Corporation Telecommunications Universal Service Management Agency
Notes to the financial statements
234
Public non-financial corporations
Australian Postal Corporation NBN Co Ltd
Defence Portfolio
General government
AAF Company (company limited by guarantee) Army and Air Force Canteen Service Australian Military Forces Relief Trust Fund Australian Strategic Policy Institute Ltd (company limited by guarantee) Australian War Memorial Department of Defence Department of Veterans’ Affairs Defence Housing Australia Defence Materiel Organisation Royal Australian Air Force Veterans’ Residences Trust Fund Royal Australian Air Force Welfare Recreation Company
(company limited by guarantee) Royal Australian Air Force Welfare Trust Fund Royal Australian Navy Central Canteens Board Royal Australian Navy Relief Trust Fund
Education Portfolio
General government
Australian Curriculum, Assessment and Reporting Authority Australian Institute for Teaching and School Leadership Ltd
(company limited by guarantee) Australian Research Council Department of Education Tertiary Education Quality and Standards Agency
Employment Portfolio
General government
Asbestos Safety and Eradication Agency Comcare Department of Employment Fair Work Commission Office of the Fair Work Building Industry Inspectorate
(Fair Work Building and Construction) Office of the Fair Work Ombudsman

Notes to the financial statements
235
Safe Work Australia Seafarers Safety, Rehabilitation and Compensation Authority (Seacare Authority) Workplace Gender Equality Agency
Public financial corporations
Coal Mining Industry (Long Service Leave Funding) Corporation
Environment Portfolio
General government
Bureau of Meteorology Clean Energy Regulator Climate Change Authority Department of the Environment Director of National Parks Great Barrier Reef Marine Park Authority Low Carbon Australia Ltd (company limited by guarantee) Murray-Darling Basin Authority National Water Commission Sydney Harbour Federation Trust
Finance Portfolio
General government
Australian Electoral Commission Commonwealth Superannuation Corporation ComSuper Department of Finance Future Fund Management Agency
Public financial corporations
Medibank Private Ltd
Public non-financial corporations
Albury-Wodonga Development Corporation ASC Pty Ltd Australian River Co Ltd

Notes to the financial statements
236
Foreign Affairs and Trade Portfolio
General government
Australian Centre for International Agricultural Research Australian Secret Intelligence Service Australian Trade Commission Department of Foreign Affairs and Trade Export Finance and Insurance Corporation (National Interest Account) Tourism Australia
Public financial corporations
Export Finance and Insurance Corporation
Health Portfolio
General government
Australian Commission on Safety and Quality in Health Care Australian Institute of Health and Welfare Australian Organ and Tissue Donation and Transplantation Authority
(Organ and Tissue Authority) Australian Radiation Protection and Nuclear Safety Agency Australian Sports Anti-Doping Authority Australian Sports Commission Australian Sports Foundation Ltd (company limited by guarantee) Cancer Australia Department of Health Food Standards Australia New Zealand General Practice Education and Training Ltd (company limited by guarantee) Health Workforce Australia Independent Hospital Pricing Authority National Blood Authority National Health Funding Body National Health and Medical Research Council National Health Performance Authority National Mental Health Commission Private Health Insurance Administration Council Private Health Insurance Ombudsman Professional Services Review Scheme
Immigration and Border Protection Portfolio
General government
Department of Immigration and Border Protection Australian Customs and Border Protection Service Migration Review Tribunal and Refugee Review Tribunal

Notes to the financial statements
237
Industry Portfolio
General government
Australian Institute of Marine Science Australian Nuclear Science and Technology Organisation Australian Renewable Energy Agency Australian Skills Quality Authority
(National Vocational Education and Training Regulator) Commonwealth Scientific and Industrial Research Organisation Department of Industry Geoscience Australia IIF Investments Pty Ltd IP Australia National Offshore Petroleum Safety and Environmental Management Authority
Public non-financial corporations
ANSTO Nuclear Medicine Pty Ltd
Infrastructure and Regional Development Portfolio
General government
Australian Maritime Safety Authority Australian Transport Safety Bureau Civil Aviation Safety Authority Department of Infrastructure and Regional Development National Capital Authority National Transport Commission
Public non-financial corporations
Airservices Australia Australian Rail Track Corporation Ltd Moorebank Intermodal Company Ltd
Parliamentary Departments
General government
Department of Parliamentary Services Department of the House of Representatives Department of the Senate Parliamentary Budget Office

Notes to the financial statements
238
Prime Minister and Cabinet Portfolio
General government
Aboriginal Hostels Ltd (company limited by guarantee) Anindilyakwa Land Council Australian Institute of Aboriginal and Torres Strait Islander Studies Australian National Audit Office Australian Public Service Commission Central Land Council Department of the Prime Minister and Cabinet Indigenous Business Australia Indigenous Land Corporation National Australia Day Council Ltd (company limited by guarantee) Northern Land Council Outback Stores Pty Ltd Tiwi Land Council Torres Strait Regional Authority Office of National Assessments Office of the Commonwealth Ombudsman Office of the Inspector-General of Intelligence and Security Office of the Official Secretary to the Governor-General Wreck Bay Aboriginal Community Council
Public non-financial corporations
Voyages Indigenous Tourism Australia Pty Ltd
Social Services Portfolio
General government
Australian Aged Care Quality Agency Australian Institute of Family Studies Department of Social Services National Disability Insurance Scheme Launch Transition Agency
(National Disability Insurance Agency)
Human Services Portfolio
General government
Department of Human Services
Public non-financial corporations
Australian Hearing Services (Australian Hearing)

Notes to the financial statements
239
Treasury Portfolio
General government
Australian Bureau of Statistics Australian Competition and Consumer Commission Australian Office of Financial Management Australian Prudential Regulation Authority Australian Securities and Investments Commission Australian Taxation Office Clean Energy Finance Corporation Commonwealth Grants Commission Corporations and Markets Advisory Committee Department of the Treasury Inspector-General of Taxation National Competition Council Office of the Auditing and Assurance Standards Board Office of the Australian Accounting Standards Board Productivity Commission Royal Australian Mint
Public financial corporations
Australian Reinsurance Pool Corporation Reserve Bank of Australia
Other investments
Australian National University Ceramic Fuel Cells Clarity Pharmaceuticals Pty Ltd Crace Developments Pty Ltd Law Courts Ltd Murray-Darling Freshwater Research Centre NEPC Service Corporation PSMA Australia Ltd Snowy Hydro Ltd Yarra Community Housing Ltd

Notes to the financial statements
240
Entity changes during 2013-14
Entities no longer consolidated
Aged Care Standards and Accreditation Agency Ltd replaced by the Australian Aged Care Quality Agency (1 January 2014) Australian Agency for International Development (AusAID) integrated into the Department of Foreign Affairs and Trade (1 November 2013) Australian National Preventive Health Agency (30 June 2014) Department of Education, Employment and Workplace Relations (30 September 2013) Department of Regional Australia, Local Government, Arts and Sport
(30 September 2013) Department of Resources, Energy and Tourism (30 September 2013) Family Court of Australia and Federal Circuit Court of Australia integrated into the
Family Court and Federal Circuit Court (1 July 2013) Sugar Research and Development Corporation (30 September 2013)
Entities newly controlled/established in 2013-14
Asbestos Safety and Eradication Agency (1 July 2013) Australian Aged Care Quality Agency (1 January 2014) Department of Education (1 October 2013) Department of Employment (1 October 2013) Family Court and Federal Circuit Court (1 July 2013) National Portrait Gallery of Australia (1 July 2013)
Entities with name changes
Australian Financial Security Authority (previously Insolvency and Trust Services Australia)
Department of Agriculture (previously Department of Agriculture, Fisheries and Forestry
Department of Communications (previously Department of Broadband, Communications and the Digital Economy)
Department of Environment (previously Department of Sustainability, Environment, Water, Population and Communities)
Department of Finance (previously Department of Finance and Deregulation) Department of Health (Department of Health and Ageing) Department of Immigration and Border Protection
(previously Department of Immigration and Citizenship) Department of Industry (previously Department of Industry, Innovation,
Climate Change, Science, Research and Tertiary Education) Department of Infrastructure and Regional Development
(previously Department of Infrastructure and Transport) Department of Social Services (previously Department of Families, Housing,
Community Services and Indigenous Affairs)

Notes to the financial statements
241
Note 46: Glossary
Key technical terms
Balance sheet
The balance sheet shows stocks of assets, liabilities and net worth. In accordance with the Accrual Uniform Presentation Framework, net debt, net financial worth and net financial liabilities are also reported in the balance sheet.
Comprehensive result (total change in net worth before transactions with owners as owners)
The net result of all items of income and expense recognised for the period. It is the aggregate of operating result and other movements in equity, other than transactions with owners as owners.
Fiscal balance
The fiscal balance (or net lending/borrowing) is the net operating balance less net capital investment. Thus, the fiscal balance includes the impact of net expenditure (effectively purchases less sales) on non-financial assets rather than consumption (depreciation) of non-financial assets.
The fiscal balance measures the Australian Government’s investment-saving balance. It measures in accrual terms the gap between government savings plus net capital transfers, and investment in non-financial assets. As such, it approximates the contribution of the Australian Government GGS to the balance on the current account in the balance of payments.
Mutually agreed bad debts
Financial assets written off where there was prior knowledge and consent by the counterparties.
Net actuarial gains
Includes actuarial gains and losses on defined benefit superannuation plans.
Net financial liabilities
Total liabilities less financial assets, other than equity in PNFCs and PFCs. This measure is broader than net debt as it includes significant liabilities, other than borrowings (for example accrued employee liabilities such as superannuation and long service leave entitlements). For the PNFC and PFC sectors, it is equal to negative net financial worth.
Net financial worth
Net financial worth is equal to financial assets minus liabilities. It is a broader measure than net debt in that it incorporates provisions made (such as superannuation, but

Notes to the financial statements
242
excluding depreciation and bad debts) as well as holdings of equity. Net financial worth includes all classes of financial assets and liabilities, only some of which are included in net debt.
Net lending/borrowing
The net operating balance minus the net acquisition/(disposal) of non-financial assets. It is also equal to transactions in the net acquisition/(disposal) of financial assets minus the net incurrence of liabilities. It indicates the extent to which financial resources are placed at the disposal of the rest of the economy or the utilisation of financial resources generated by the rest of the economy. It is an indicator of the financial impact on the rest of the economy.
Net other economic flows
The net change in the volume or value of assets and liabilities that does not result from transactions.
Net operating balance
This is calculated as income from transactions minus expenses from transactions.
Net result from transactions — net operating balance
The revenue from transactions minus expenses from transactions. It is a summary measure of the ongoing sustainability of operations. It excludes gains and losses resulting from changes in price levels and other changes in the volume of assets. It is the component of the change in net worth that is due to transactions and can be attributed directly to government policies.
Net worth
The net worth of the GGS, PNFC and PFC sectors are defined as assets less liabilities. This differs from the ABS GFS definition for the PNFC and PFC sectors where net worth is defined as assets less liabilities less shares and other contributed capital. Net worth is an economic measure of wealth, reflecting the Australian Government’s contribution to the wealth of Australia.
Operating result
A measure of financial performance of the operations for the period. It is the net result of items of revenue, gains and expenses (including losses) recognised for the period, excluding those that are classified as ‘other non-owner movements in equity’.
Operating statement
The operating statement presents details of transactions in revenues, expenses, the net acquisition of non-financial assets (net capital investment) and other economic flows for an accounting period.

Notes to the financial statements
243
Transactions
Interactions between two units by mutual agreement or an action within a unit that is analytically useful to treat as a transaction.
Unilaterally determined bad debts
Financial assets written off without an agreement with the debtor in cases such as bankruptcy of the debtor.
Expenses by function
General public services
Include legislative and executive affairs, financial and fiscal affairs, foreign affairs, foreign economic aid, general research, general economic and social planning and statistical services, and government superannuation benefits.
Defence
Includes military and civil defence affairs, foreign military aid and defence research.
Public order and safety
Includes administration of the federal legal system and the provision for legal services, including legal aids, to the community. Public order and safety expenses also include law enforcement and intelligence activities, and the protection of Australian Government property.
Education
Includes primary and secondary education, university and other higher education, technical and further education, preschool and special education, and transportation of students.
Health
Includes general hospitals, repatriation hospitals, mental health institutions, nursing homes, special hospitals, hospital benefits, medical clinics and practitioners, dental clinics and practitioners, maternal and infant health, ambulance services, medical benefits, school and other public health services, pharmaceuticals, medical aids and appliances, and health research.
Social security and welfare
Includes sickness benefits, benefits to ex-servicemen and their dependants, invalid and other permanent disablement benefits, old age benefits, widows, deserted wives, divorcees and orphans benefits, unemployment benefits, family and child benefits, sole parent benefits, family and child welfare, and aged and handicapped welfare.

Notes to the financial statements
244
Housing and community amenities
Includes housing and community development, water supply, household garbage and other sanitation, sewerage, urban stormwater drainage, protection of the environment, and street lighting.
Recreation and culture
Includes public halls and civic centres, swimming pools and beaches, national parks and wildlife, libraries, creative and performing arts, museums, art galleries, broadcasting, and film production.
Fuel and energy
Includes coal, petroleum, gas, nuclear affairs, and electricity.
Agriculture, forestry and fishing
Includes agricultural land management, agricultural water resources management, agricultural support schemes, agricultural research and extension services, forestry and fishing.
Mining, manufacturing and construction
Includes activities relating to prospecting, mining and mineral resources development, manufacturing activities and research into manufacturing methods, materials and industrial management and activities associated with the building and construction industry.
Transport and communications
Includes road construction, road maintenance, parking, water transport, rail transport, air transport, pipelines, multi-mode urban transit systems, and communications.
Other economic affairs
Includes storage, saleyards, markets, tourism and area promotion, and labour and employment affairs.
Other purposes
Includes public debt transactions, general purpose inter-government transactions, and natural disaster relief.

