consolidated financial statements for the third quarter of ... · financial highlights for the...
TRANSCRIPT

For Immediate Release:
Company Name: Mizuho Financial Group, Inc. ("MHFG") January 31, 2018Stock Code Number (Japan): 8411Stock Exchange Listings: Tokyo Stock Exchange (First Section), New York Stock Exchange
URL: https://www.mizuho-fg.com/index.htmlRepresentative: Yasuhiro Sato President & CEOFor Inquiry: Masahiro Kosugi General Manager of Accounting Phone: +81-3-6838-6101 Filing of Shihanki Hokokusho (scheduled): Trading Accounts: EstablishedCommencement of Dividend Payment (scheduled): -Supplementary Materials on Quarterly Results: AttachedIR Conference on Quarterly Results: Not Scheduled
Amounts less than one million yen are rounded down.
1. Financial Highlights for the Third Quarter of Fiscal 2017 (for the nine months endedDecember 31, 2017)
(1) Consolidated Results of Operations (Accumulated Period) (%: Changes from the corresponding period of the previous fiscal year)
Note: Comprehensive Income: 3Q F2017: million, %; 3Q F2016: million, %
(2) Consolidated Financial Conditions
Reference: Own Capital: As of December 31, 2017: million; As of March 31, 2017: million
Own Capital Ratio stated above is not calculated based on the public notice of Own Capital Ratio.
2. Cash Dividends for Shareholders of Common Stock
3. Consolidated Earnings Estimates for Fiscal 2017 (for the fiscal year ending March 31, 2018)
(%: Changes from the previous fiscal year)
\ million % \
Notes: 1. Revision of the latest announced earnings estimates for fiscal 2017: No2. The number of shares of common stock used in the above per share information is based on the weighted average of the average number of shares during 1Q, 2Q and 3Q
and the number of outstanding shares as of December 31, 2017 (which is used as a proxy for the average number of shares during 4Q of fiscal 2017).
Fiscal 2017 550,000 (8.8) 21.68
Profit Attributable to Ownersof Parent
Net Incomeper Share of Common Stock
Fiscal 2017 (estimate) 3.75 7.50
Note: Revision of the latest announced estimates for cash dividends for shareholders of common stock : No
Fiscal 2016 3.75 3.75 7.50Fiscal 2017 3.75 -
-\ \
Annual Cash Dividends per ShareFirst Quarter-end Second Quarter-end Third Quarter-end Fiscal Year-end Total
Fiscal 2016 200,508,610 9,273,361 4.2
Note: Own Capital Ratio is calculated as follows: (Total Net Assets - Stock Acquisition Rights - Non-controlling Interests) / Total Assets × 100¥9,111,763 ¥8,522,268
\ million \ million %
3Q F2017 208,443,982 9,869,448 4.3
3Q F2016 19.97 19.88
Total Assets Total Net Assets Own Capital Ratio
\ \
3Q F2017 18.75 18.74
Net Incomeper Share of Common Stock
Diluted Net Incomeper Share of Common Stock
3Q F2016 2,395,600¥387,090
0.4 575,783 (25.2)
%
3Q F2017 2,674,120 11.6 644,556 11.9 475,703 (5.7)\ million
Consolidated Financial Statements for the Third Quarter of Fiscal 2017(Nine months ended December 31, 2017)
<Under Japanese GAAP>
February 14, 2018
Ordinary Income Ordinary Profits Profit Attributable to Owners of Parent
11.5
\
504,655
\
(2.8)
\
-
-
\ million % \ million %
¥802,214 107.2

* Notes(1) Changes in Significant Subsidiaries during the Period (changes in specified subsidiaries accompanying changes in the scope of consolidation): No
(2) Adoption of Specified Accounting Methods for the Preparation of Quarterly Consolidated Financial Statements: No
No ② Changes in accounting policies other than ① above: No ③ Changes in accounting estimates:No ④ Restatements: No
(4) Issued Shares of Common Stock ① Period-end issued shares (including treasury stock): As of December 31, 2017 shares As of March 31, 2017 shares
② Period-end treasury stock: As of December 31, 2017 shares As of March 31, 2017 shares
③ Average outstanding shares (accumulated period): 3Q Fiscal 2017 shares 3Q Fiscal 2016 shares
This immediate release is outside the scope of quarterly review.
(3) Changes in Accounting Policies and Accounting Estimates / Restatements
25,389,644,945 25,386,307,945
25,019,893 19,992,754
25,366,621,222 25,259,486,767
① Changes in accounting policies due to revisions of accounting standards, etc.
This immediate release contains statements that constitute forward-looking statements within the meaning of the United States PrivateSecurities Litigation Reform Act of 1995, including estimates, forecasts, targets and plans. Such forward-looking statements do notrepresent any guarantee by management of future performance.In many cases, but not all, we use such words as “aim,” “anticipate,” “believe,” “endeavor,” “estimate,” “expect,” “intend,” “may,”“plan,” “probability,” “project,” “risk,” “seek,” “should,” “strive,” “target” and similar expressions in relation to us or ourmanagement to identify forward-looking statements. You can also identify forward-looking statements by discussions of strategy, plans orintentions. These statements reflect our current views with respect to future events and are subject to risks, uncertainties and assumptions.We may not be successful in implementing our business strategies, and management may fail to achieve its targets, for a wide range ofpossible reasons, including, without limitation: incurrence of significant credit-related costs; declines in the value of our securitiesportfolio; changes in interest rates; foreign currency fluctuations; decrease in the market liquidity of our assets; revised assumptions orother changes related to our pension plans; a decline in our deferred tax assets; the effect of financial transactions entered into forhedging and other similar purposes; failure to maintain required capital adequacy ratio levels; downgrades in our credit ratings; ourability to avoid reputational harm; our ability to implement our Medium-term Business Plan, realize the synergy effects of "OneMIZUHO," and implement other strategic initiatives and measures effectively; the effectiveness of our operational, legal and other riskmanagement policies; the effect of changes in general economic conditions in Japan and elsewhere; and changes to applicable laws andregulations.Further information regarding factors that could affect our financial condition and results of operations is included in “Item 3.D. KeyInformation—Risk Factors” and “Item 5. Operating and Financial Review and Prospects” in our most recent Form 20-F filed with theU.S. Securities and Exchange Commission (“SEC”) and our report on Form 6-K furnished to the SEC on December 28, 2017, both ofwhich are available in the Financial Information section of our web page at www.mizuho-fg.com/index.html and also at the SEC’s website at www.sec.gov.We do not intend to update our forward-looking statements. We are under no obligation, and disclaim any obligation, to update or alterour forward-looking statements, whether as a result of new information, future events or otherwise, except as may be required by the rulesof the Tokyo Stock Exchange.

○Contents of Attachment
1. Quarterly Consolidated Financial Statements and Others……………………………………...p.1-2
(1) Consolidated Balance Sheets……………………………………………………………….p.1-2
(2) Consolidated Statements of Income and Consolidated Statements of
Comprehensive Income…………………………………………………………………….p.1-4
(3) Note for Assumption of Going Concern.………………………………………...……..…..p.1-6
(4) Note for Significant Changes in the Amount of Shareholders’ Equity……………………. p.1-6
※SELECTED FINANCIAL INFORMATION For the Third Quarter of Fiscal 2017
【Note to XBRL】
Please note that the names of the English accounts contained in XBRL data, which are available
through EDINET and TDNet, may be different from those of the English accounts in our financial
statements.
Mizuho Financial Group, Inc.
1 - 1

1. Quarterly Consolidated Financial Statements and Others
Millions of yen
As of March 31, 2017 As of December 31, 2017
AssetsCash and Due from Banks \ 47,129,583 \ 47,913,637Call Loans and Bills Purchased 1,035,746 1,262,721Receivables under Resale Agreements 8,967,777 9,438,302Guarantee Deposits Paid under Securities Borrowing Transactions 3,350,051 2,868,193Other Debt Purchased 2,745,204 2,502,812Trading Assets 10,361,787 11,414,185Money Held in Trust 247,583 301,813Securities 32,353,158 35,065,618Loans and Bills Discounted 78,337,793 81,563,363Foreign Exchange Assets 1,828,782 2,230,740Derivatives other than for Trading Assets 2,170,750 1,533,121Other Assets 4,180,339 3,717,451Tangible Fixed Assets 1,136,329 1,111,618Intangible Fixed Assets 1,045,486 1,093,872Net Defined Benefit Asset 797,762 803,456Deferred Tax Assets 56,066 51,183Customers' Liabilities for Acceptances and Guarantees 5,273,581 5,886,107Reserves for Possible Losses on Loans (509,175) (314,217)Total Assets \ 200,508,610 \ 208,443,982
(1) Consolidated Balance Sheets
Mizuho Financial Group, Inc.
1 - 2
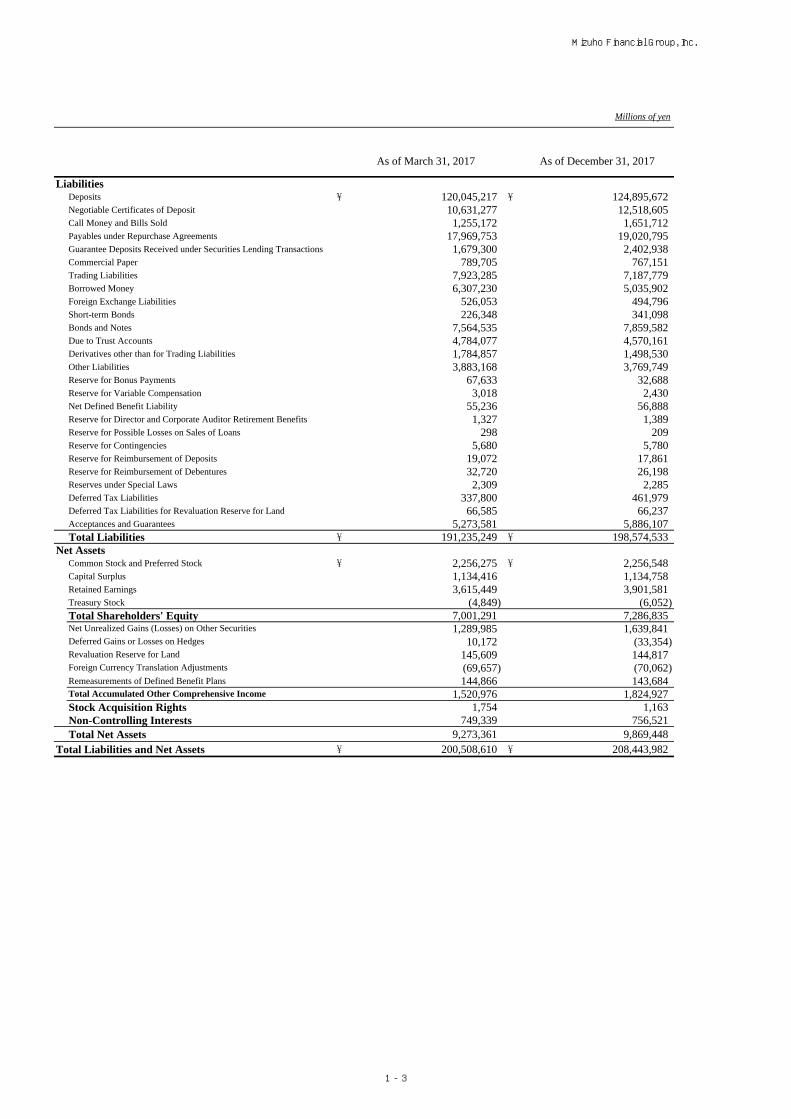
Millions of yen
As of March 31, 2017 As of December 31, 2017
LiabilitiesDeposits \ 120,045,217 \ 124,895,672Negotiable Certificates of Deposit 10,631,277 12,518,605Call Money and Bills Sold 1,255,172 1,651,712Payables under Repurchase Agreements 17,969,753 19,020,795Guarantee Deposits Received under Securities Lending Transactions 1,679,300 2,402,938Commercial Paper 789,705 767,151Trading Liabilities 7,923,285 7,187,779Borrowed Money 6,307,230 5,035,902Foreign Exchange Liabilities 526,053 494,796Short-term Bonds 226,348 341,098Bonds and Notes 7,564,535 7,859,582Due to Trust Accounts 4,784,077 4,570,161Derivatives other than for Trading Liabilities 1,784,857 1,498,530Other Liabilities 3,883,168 3,769,749Reserve for Bonus Payments 67,633 32,688Reserve for Variable Compensation 3,018 2,430Net Defined Benefit Liability 55,236 56,888Reserve for Director and Corporate Auditor Retirement Benefits 1,327 1,389Reserve for Possible Losses on Sales of Loans 298 209Reserve for Contingencies 5,680 5,780Reserve for Reimbursement of Deposits 19,072 17,861Reserve for Reimbursement of Debentures 32,720 26,198Reserves under Special Laws 2,309 2,285Deferred Tax Liabilities 337,800 461,979Deferred Tax Liabilities for Revaluation Reserve for Land 66,585 66,237Acceptances and Guarantees 5,273,581 5,886,107Total Liabilities \ 191,235,249 \ 198,574,533
Net AssetsCommon Stock and Preferred Stock \ 2,256,275 \ 2,256,548Capital Surplus 1,134,416 1,134,758Retained Earnings 3,615,449 3,901,581Treasury Stock (4,849) (6,052)Total Shareholders' Equity 7,001,291 7,286,835
1,289,985 1,639,84110,172 (33,354)
145,609 144,817(69,657) (70,062)
Remeasurements of Defined Benefit Plans 144,866 143,6841,520,976 1,824,927
Stock Acquisition Rights 1,754 1,163Non-Controlling Interests 749,339 756,521Total Net Assets 9,273,361 9,869,448
Total Liabilities and Net Assets \ 200,508,610 \ 208,443,982
Foreign Currency Translation Adjustments
Total Accumulated Other Comprehensive Income
Net Unrealized Gains (Losses) on Other Securities
Deferred Gains or Losses on Hedges
Revaluation Reserve for Land
Mizuho Financial Group, Inc.
1 - 3

Consolidated Statements of Comprehensive Income
【Consolidated Statements of Income】Millions of yen
For the nine months ended For the nine months ended December 31, 2016 December 31, 2017
Ordinary Income \ 2,395,600 \ 2,674,120 Interest Income 1,052,662 1,208,466
Interest on Loans and Bills Discounted 697,429 753,825 Interest and Dividends on Securities 187,902 200,553
Fiduciary Income 35,238 39,268 Fee and Commission Income 540,438 553,438 Trading Income 242,502 193,420 Other Operating Income 281,723 245,799 Other Ordinary Income 243,036 433,726
Ordinary Expenses 1,819,816 2,029,563 Interest Expenses 409,628 609,687
Interest on Deposits 156,732 234,038 Fee and Commission Expenses 117,695 122,402
1,852 - Other Operating Expenses 64,352 72,175 General and Administrative Expenses 1,079,276 1,109,994 Other Ordinary Expenses 147,010 115,304
Ordinary Profits 575,783 644,556
Extraordinary Gains 57,866 18,472
Extraordinary Losses 4,834 5,237
Income before Income Taxes 628,816 657,790 Income Taxes:
Current 139,651 156,341 Deferred (43,146) 1,968Total Income Taxes 96,504 158,309
Profit 532,311 499,481
Profit Attributable to Non-controlling Interests 27,655 23,777
Profit Attributable to Owners of Parent \ 504,655 \ 475,703
Trading Expenses
(2) Consolidated Statements of Income and
Mizuho Financial Group, Inc.
1 - 4

【Consolidated Statements of Comprehensive Income】Millions of yen
For the nine months ended For the nine months ended December 31, 2016 December 31, 2017
Profit \ 532,311 \ 499,481Other Comprehensive Income (145,220) 302,733
2,523 347,373
(131,523) (42,969)
(6) (2)
(23,131) 4,207
Remeasurements of Defined Benefit Plans 20,055 2,943
Share of Other Comprehensive Income of Associates Accounted
for Using Equity Method (13,138) (8,819)
Comprehensive Income 387,090 802,214 (Breakdown)
358,964 780,443
28,126 21,770Comprehensive Income Attributable to Non-controlling Interests
Net Unrealized Gains (Losses) on Other Securities
Deferred Gains or Losses on Hedges
Comprehensive Income Attributable to Owners of Parent
Revaluation Reserve for Land
Foreign Currency Translation Adjustments
Mizuho Financial Group, Inc.
1 - 5

(3) Note for Assumption of Going Concern
There is no applicable information.
(4) Note for Significant Changes in the Amount of Shareholders’ Equity
There is no applicable information.
Mizuho Financial Group, Inc.
1 - 6

SELECTED FINANCIAL INFORMATION
<Under Japanese GAAP>
For the Third Quarter of Fiscal 2017(Nine months ended December 31, 2017)
Mizuho Financial Group, Inc.

C O N T E N T S
FINANCIAL INFORMATION FOR THE THIRD QUARTER OF FISCAL 2017 See above Notes Page
1. Income Analysis CON NON 2- 1
2. Net Gains/Losses on Stocks CON NON 2- 3
3. Unrealized Gains/Losses on Securities CON NON 2- 4
4. Deferred Hedge Gains/Losses on Derivative Transactions Qualifying for NON 2- 6
Hedge Accounting
5. Status of Disclosed Claims under the Financial Reconstruction Act ("FRA") CON NON 2- 7
NON 2- 9
Attachments Page
2- 102- 11
Comparison of Non-Consolidated Balance Sheets (selected items) 2- 12Comparison of Non-Consolidated Statements of Income (selected items) 2- 13
2- 142- 15
This immediate release contains statements that constitute forward-looking statements within the meaning of the United States Private Securities LitigationReform Act of 1995, including estimates, forecasts, targets and plans. Such forward-looking statements do not represent any guarantee by management offuture performance.In many cases, but not all, we use such words as “aim,” “anticipate,” “believe,” “endeavor,” “estimate,” “expect,” “intend,” “may,” “plan,”“probability,” “project,” “risk,” “seek,” “should,” “strive,” “target” and similar expressions in relation to us or our management to identify forward-looking statements. You can also identify forward-looking statements by discussions of strategy, plans or intentions. These statements reflect our currentviews with respect to future events and are subject to risks, uncertainties and assumptions.We may not be successful in implementing our business strategies, and management may fail to achieve its targets, for a wide range of possible reasons,including, without limitation: incurrence of significant credit-related costs; declines in the value of our securities portfolio; changes in interest rates; foreigncurrency fluctuations; decrease in the market liquidity of our assets; revised assumptions or other changes related to our pension plans; a decline in ourdeferred tax assets; the effect of financial transactions entered into for hedging and other similar purposes; failure to maintain required capital adequacyratio levels; downgrades in our credit ratings; our ability to avoid reputational harm; our ability to implement our Medium-term Business Plan, realize thesynergy effects of "One MIZUHO," and implement other strategic initiatives and measures effectively; the effectiveness of our operational, legal and otherrisk management policies; the effect of changes in general economic conditions in Japan and elsewhere; and changes to applicable laws and regulations.Further information regarding factors that could affect our financial condition and results of operations is included in “Item 3.D. Key Information—RiskFactors” and “Item 5. Operating and Financial Review and Prospects” in our most recent Form 20-F filed with the U.S. Securities and ExchangeCommission (“SEC”) and our report on Form 6-K furnished to the SEC on December 28, 2017, both of which are available in the Financial Informationsection of our web page at www.mizuho-fg.com/index.html and also at the SEC’s web site at www.sec.gov.We do not intend to update our forward-looking statements. We are under no obligation, and disclaim any obligation, to update or alter our forward-lookingstatements, whether as a result of new information, future events or otherwise, except as may be required by the rules of the Tokyo Stock Exchange.
Comparison of Non-Consolidated Balance Sheets (selected items)Comparison of Non-Consolidated Statements of Income (selected items)
6. Status of Deposits and Loans
Mizuho Bank, Ltd. Comparison of Non-Consolidated Balance Sheets (selected items)Comparison of Non-Consolidated Statements of Income (selected items)
Mizuho Trust & Banking Co., Ltd.
Mizuho Securities Co., Ltd.
Notes:"CON": Consolidated figures for Mizuho Financial Group, Inc. ("MHFG")"NON": Non-consolidated figures for Mizuho Bank, Ltd. ("MHBK") and Mizuho Trust & Banking Co., Ltd. ("MHTB")

Mizuho Financial Group, Inc.
FINANCIAL INFORMATION FOR THE THIRD QUARTER OF FISCAL 2017
1. Income AnalysisConsolidated
(Billions of yen)
Third Quarter ofFiscal 2017
(Accumulated Period)Change
Third Quarter ofFiscal 2016
(Accumulated Period)
Consolidated Gross Profits 1 1,436.1 (122.9) 1,559.0
Net Interest Income 2 598.7 (44.2) 643.0
Fiduciary Income 3 39.2 4.0 35.2
Credit Costs for Trust Accounts 4 - - -
Net Fee and Commission Income 5 431.0 8.2 422.7
Net Trading Income 6 193.4 (47.2) 240.6
Net Other Operating Income 7 173.6 (43.7) 217.3
8 (1,109.9) (30.7) (1,079.2)
9 (14.4) 6.8 (21.2)
10 183.8 156.7 27.1
Net Gains (Losses) related to Stocks 11 190.1 52.3 137.8
12 14.9 (1.6) 16.5
Other 13 (56.1) 8.1 (64.3)
14 644.5 68.7 575.7
Net Extraordinary Gains (Losses) 15 13.2 (39.7) 53.0
Income before Income Taxes 16 657.7 28.9 628.8
Income Taxes 17 (158.3) (61.8) (96.5)
Profit 18 499.4 (32.8) 532.3
Profit Attributable to Non-controlling Interests 19 (23.7) 3.8 (27.6)
Profit Attributable to Owners of Parent 20 475.7 (28.9) 504.6
21 169.4 163.5 5.9
* Credit-related Costs [21] = Expenses related to Portfolio Problems (including Reversal of (Provision for) General Reserve for Losses on Loans) [9]
+ Gains on Reversal of Reserves for Possible Losses on Loans, and others [10] + Credit Costs for Trust Accounts [4]
(Reference)
22 347.9 (160.9) 508.8
* Consolidated Net Business Profits [22] = Consolidated Gross Profits [1] - General and Administrative Expenses (excluding Non-Recurring Losses)
+ Equity in Income from Investments in Affiliates and certain other consolidation adjustments
Number of consolidated subsidiaries 23 126 (22) 148
24 19 2 17Number of affiliates under the equity method
Ordinary Profits
Equity in Income from Investments in Affiliates
General and Administrative Expenses
Credit-related Costs(including Credit Costs for Trust Accounts)
Consolidated Net Business Profits
Expenses related to Portfolio Problems (including Reversal of (Provisionfor) General Reserve for Losses on Loans)
Gains on Reversal of Reserves for Possible Losses on Loans,and others
2-1

Mizuho Financial Group, Inc.
Non-Consolidated
Aggregate Figures for the 2 Banks(Billions of yen)
Third Quarter of Fiscal 2017 (Accumulated Period)
MHBK MHTBAggregate
FiguresChange
Gross Profits 1 901.4 78.2 979.6 (96.9) 1,076.5
Net Interest Income 2 505.6 20.7 526.4 (30.5) 556.9
Fiduciary Income 3 38.9 38.9 4.1 34.7
Trust Fees for Jointly Operated Designated Money Trust 4 1.7 1.7 0.1 1.5
Credit Costs for Trust Accounts 5 - - - -
Net Fee and Commission Income 6 260.0 17.2 277.2 (7.7) 285.0
Net Trading Income 7 34.7 0.7 35.5 (11.6) 47.1
Net Other Operating Income 8 100.9 0.5 101.4 (51.0) 152.5
9 (658.6) (61.6) (720.2) (14.8) (705.3)
10 242.7 16.6 259.3 (111.7) 371.1
11 - - - 7.2 (7.2)
Net Business Profits 12 242.7 16.6 259.3 (104.5) 363.9
Net Gains (Losses) related to Bonds 13 29.1 0.6 29.7 (72.1) 101.8
Net Non-Recurring Gains (Losses) 14 255.2 15.2 270.5 219.4 51.0
15 172.1 16.7 188.9 52.7 136.1
Expenses related to Portfolio Problems 16 (11.9) (0.0) (11.9) 4.5 (16.4)
17 174.6 2.9 177.5 151.8 25.6
Other 18 (79.5) (4.4) (84.0) 10.2 (94.3)
Ordinary Profits 19 498.0 31.8 529.9 114.8 415.0
Net Extraordinary Gains (Losses) 20 15.5 0.0 15.6 18.1 (2.5)
Income before Income Taxes 21 513.6 31.8 545.5 133.0 412.5
Income Taxes 22 (121.9) (7.1) (129.0) (26.5) (102.5)
Net Income 23 391.6 24.7 416.4 106.4 310.0
* Net Business Profits (before Reversal of (Provision for) General Reserve for Losses on Loans) for MHTB excludes the amounts of "Credit Costs for Trust Accounts" [5].
Credit-related Costs 24 162.7 2.9 165.6 163.6 2.0
* Credit-related Costs [24] = Expenses related to Portfolio Problems [16] + Reversal of (Provision for) General Reserve for Losses on Loans [11]
+ Gains on Reversal of Reserves for Possible Losses on Loans, and others [17] + Credit Costs for Trust Accounts [5]
(Reference) Breakdown of Credit-related Costs
25 - - - -
26 153.1 2.8 155.9 162.8 (6.8)
27 (2.5) (0.0) (2.5) (17.6) 15.1
28 14.7 0.0 14.7 19.6 (4.8)
29 0.0 0.0 0.0 (0.0) 0.0
30 (0.0) - (0.0) (0.4) 0.4
31 (2.5) - (2.5) (0.7) (1.8)
32 162.7 2.9 165.6 163.6 2.0
Third Quarter of
Fiscal 2016
(Accumulated
Period)
General and Administrative Expenses
(excluding Non-Recurring Losses)
Net Business Profits (before Reversal of (Provision for)
General Reserve for Losses on Loans) *
Net Gains (Losses) related to Stocks
Gains on Reversal of Reserves for Possible Losses on Loans,
and others
Reversal of (Provision for) General Reserve for Losses on Loans
Other (including Losses on Sales of Loans)
Credit Costs for Trust Accounts
Reversal of (Provision for) General Reserve for Losses on Loans
Losses on Write-offs of Loans
Reversal of (Provision for) Specific Reserve for Possible Losses on Loans
Total
Reversal of (Provision for) Reserve for Possible Losses on Loans to
Restructuring Countries
Reversal of (Provision for) Reserve for Contingencies
2-2
Mizuho Financial Group, Inc.
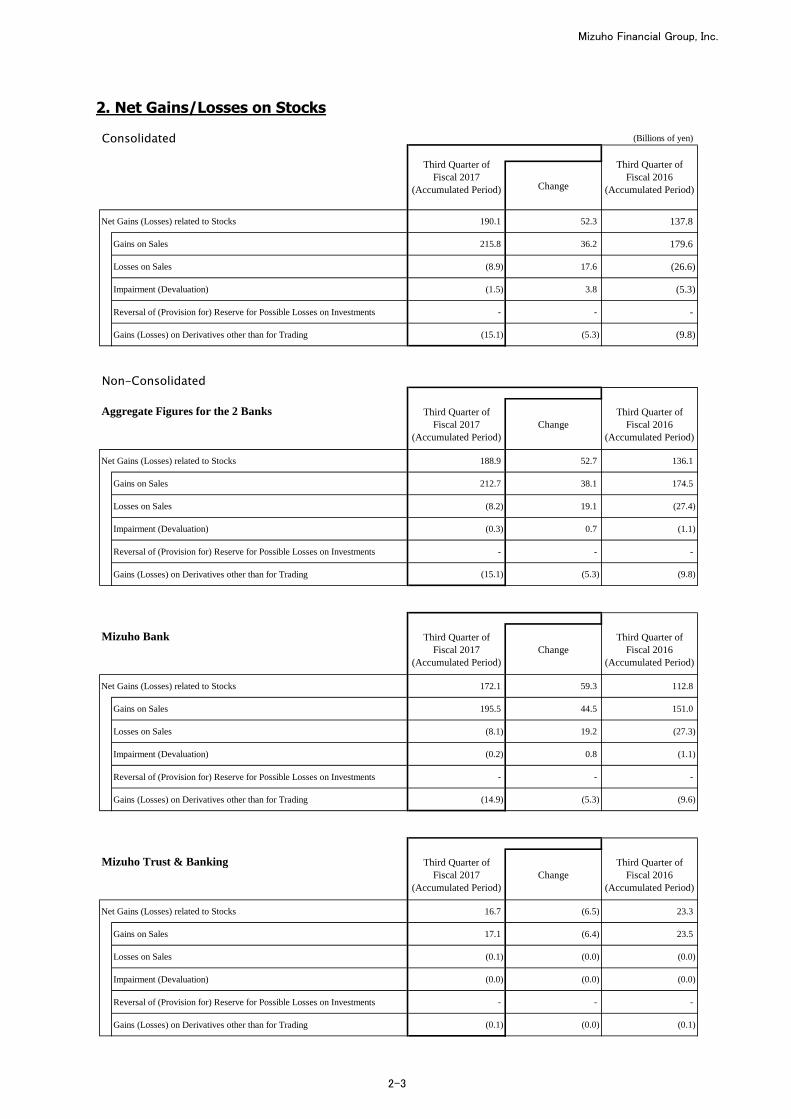
2. Net Gains/Losses on Stocks
Consolidated (Billions of yen)
Change
Net Gains (Losses) related to Stocks 190.1 52.3 137.8
Gains on Sales 215.8 36.2 179.6
Losses on Sales (8.9) 17.6 (26.6)
Impairment (Devaluation) (1.5) 3.8 (5.3)
Reversal of (Provision for) Reserve for Possible Losses on Investments - - -
Gains (Losses) on Derivatives other than for Trading (15.1) (5.3) (9.8)
Non-Consolidated
Third Quarter of
Fiscal 2017
(Accumulated Period)
Change
Third Quarter of
Fiscal 2016
(Accumulated Period)
Net Gains (Losses) related to Stocks 188.9 52.7 136.1
Gains on Sales 212.7 38.1 174.5
Losses on Sales (8.2) 19.1 (27.4)
Impairment (Devaluation) (0.3) 0.7 (1.1)
Reversal of (Provision for) Reserve for Possible Losses on Investments - - -
Gains (Losses) on Derivatives other than for Trading (15.1) (5.3) (9.8)
Third Quarter of
Fiscal 2017
(Accumulated Period)
Change
Third Quarter of
Fiscal 2016
(Accumulated Period)
Net Gains (Losses) related to Stocks 172.1 59.3 112.8
Gains on Sales 195.5 44.5 151.0
Losses on Sales (8.1) 19.2 (27.3)
Impairment (Devaluation) (0.2) 0.8 (1.1)
Reversal of (Provision for) Reserve for Possible Losses on Investments - - -
Gains (Losses) on Derivatives other than for Trading (14.9) (5.3) (9.6)
Third Quarter of
Fiscal 2017
(Accumulated Period)
Change
Third Quarter of
Fiscal 2016
(Accumulated Period)
Net Gains (Losses) related to Stocks 16.7 (6.5) 23.3
Gains on Sales 17.1 (6.4) 23.5
Losses on Sales (0.1) (0.0) (0.0)
Impairment (Devaluation) (0.0) (0.0) (0.0)
Reversal of (Provision for) Reserve for Possible Losses on Investments - - -
Gains (Losses) on Derivatives other than for Trading (0.1) (0.0) (0.1)
Mizuho Trust & Banking
Third Quarter of
Fiscal 2017
(Accumulated Period)
Third Quarter of
Fiscal 2016
(Accumulated Period)
Aggregate Figures for the 2 Banks
Mizuho Bank
2-3

Mizuho Financial Group, Inc.
3. Unrealized Gains/Losses on Securities ■ Securities for which it is deemed to be extremely difficult to determine the fair value are excluded.
Consolidated(1) Other Securities (Billions of yen)
Book Value Book Value Book Value
Gains Losses Gains Losses Gains Losses
32,273.6 2,329.4 2,586.3 256.8 28,480.7 1,819.2 2,103.7 284.5 28,931.6 1,988.3 2,235.9 247.5
3,953.8 2,338.4 2,363.9 25.4 3,542.0 1,854.4 1,898.2 43.8 3,640.9 2,011.5 2,044.6 33.1
15,677.8 0.7 32.4 31.6 13,245.1 21.1 55.8 34.6 12,611.9 (9.3) 30.7 40.0
Japanese Government Bonds 12,565.1 (7.1) 4.7 11.9 10,264.3 8.7 25.2 16.5 9,658.2 (15.9) 4.7 20.7
12,642.0 (9.8) 189.9 199.7 11,693.5 (56.4) 149.6 206.0 12,678.6 (13.8) 160.5 174.3
Foreign Bonds 9,411.4 (160.3) 8.1 168.4 8,955.4 (144.3) 13.0 157.3 9,610.3 (136.6) 8.9 145.6
(2) Bonds Held to Maturity(Billions of yen)
Book Value Book Value Book Value
Gains Losses Gains Losses Gains Losses
2,784.9 14.5 26.5 11.9 3,815.6 31.0 37.3 6.2 3,125.7 22.0 28.2 6.1
Non-ConsolidatedAggregate Figures for the 2 Banks (1) Other Securities
(Billions of yen)
Book Value Book Value Book Value
Gains Losses Gains Losses Gains Losses
30,139.6 1,968.2 2,209.2 240.9 26,246.1 1,533.7 1,802.9 269.2 26,755.9 1,681.1 1,914.8 233.7
3,602.8 2,098.0 2,120.2 22.1 3,230.9 1,658.1 1,701.5 43.4 3,314.5 1,796.9 1,830.6 33.7
15,003.2 1.2 31.8 30.6 12,477.7 21.7 54.7 33.0 11,895.2 (8.6) 30.0 38.6
Japanese Government Bonds 12,222.3 (6.6) 4.5 11.1 9,765.9 9.6 24.6 15.0 9,285.9 (15.1) 4.4 19.5
11,533.4 (131.0) 57.1 188.2 10,537.3 (146.1) 46.5 192.7 11,546.1 (107.1) 54.1 161.3
Foreign Bonds 8,898.4 (151.5) 7.1 158.6 8,363.6 (135.9) 11.5 147.5 9,015.1 (128.4) 7.2 135.7
1,057.7 150.3 164.3 13.9 1,207.8 118.4 133.5 15.1 1,123.5 122.6 137.9 15.2
257.1 153.4 156.1 2.6 231.2 124.2 127.1 2.8 234.8 130.1 132.8 2.6
385.4 (0.2) 0.5 0.8 567.3 (0.5) 1.0 1.5 433.7 (0.5) 0.6 1.1
Japanese Government Bonds 321.2 (0.5) 0.2 0.8 498.0 (0.9) 0.6 1.5 372.0 (0.8) 0.2 1.1
415.1 (2.7) 7.6 10.3 409.2 (5.3) 5.3 10.6 454.8 (6.8) 4.4 11.3
Foreign Bonds 228.6 (8.5) - 8.5 263.6 (8.3) 0.2 8.6 291.0 (8.6) - 8.6
31,197.3 2,118.6 2,373.5 254.9 27,453.9 1,652.1 1,936.4 284.3 27,879.4 1,803.8 2,052.8 248.9
3,860.0 2,251.5 2,276.3 24.8 3,462.1 1,782.4 1,828.7 46.2 3,549.3 1,927.0 1,963.5 36.4
15,388.7 0.9 32.4 31.4 13,045.1 21.1 55.7 34.6 12,329.0 (9.2) 30.6 39.8
Japanese Government Bonds 12,543.6 (7.1) 4.7 11.9 10,264.0 8.7 25.2 16.5 9,657.9 (15.9) 4.7 20.7
11,948.5 (133.8) 64.7 198.5 10,946.6 (151.4) 51.9 203.4 12,001.0 (114.0) 58.6 172.6
Foreign Bonds 9,127.0 (160.1) 7.1 167.2 8,627.3 (144.3) 11.8 156.1 9,306.2 (137.1) 7.2 144.4
As of September 30, 2017(Reference)
As of December 31, 2017
Unrealized Gains/LossesUnrealized Gains/Losses
As of September 30, 2017(Reference)
As of March 31, 2017
Unrealized Gains/Losses
As of March 31, 2017
Unrealized Gains/Losses
Other Securities
Japanese Stocks
Other Securities
Other
Other
Japanese Bonds
Other
As of December 31, 2017
Unrealized Gains/Losses Unrealized Gains/Losses
As of September 30, 2017(Reference)
As of March 31, 2017
Unrealized Gains/Losses
MHFG(Consolidated)
MHFG (Consolidated)
MHBK
As of December 31, 2017
Unrealized Gains/Losses
Other Securities
Japanese Stocks
Total
Other
Other Securities
Japanese Stocks
Japanese Bonds
Unrealized Gains/Losses
MHTB
Japanese Bonds
Japanese Bonds
Japanese Stocks
* In addition to "Securities" on the consolidated balance sheets, NCDs in "Cash and Due from Banks," certain items in "Other Debt Purchased" and certain items in "Other Assets" are also included.* Fair value of Japanese stocks with a quoted market price is determined based on the average quoted market price over the month preceding the consolidated balance sheet date.
Fair value of securities other than Japanese stocks is determined at the quoted market price if available, or other reasonable value at the consolidated balance sheet date.* Unrealized Gains/Losses include ¥68.7billion, ¥54.6billion, and ¥34.3billion, which were recognized in the statement of income for December 31, 2017, September 30, 2017, and March 31, 2017 respectively,
by applying the fair-value hedge method.
* In addition to "Securities" on the balance sheets, NCDs in "Cash and Due from Banks" and certain items in "Other Debt Purchased" are also included.* Fair value of Japanese stocks with a quoted market price is determined based on the average quoted market price over the month preceding the balance sheet date.
Fair value of securities other than Japanese stocks is determined at the quoted market price if available, or other reasonable value at the balance sheet date.* Unrealized Gains/Losses include ¥68.7billion, ¥54.6billion, and ¥34.3billion, which were recognized in the statement of income (aggregate figures for the 2 banks) for December 31, 2017, September 30, 2017, and March 31,
2017 respectively, by applying the fair-value hedge method.
2-4

Mizuho Financial Group, Inc.
(2) Bonds Held to Maturity (Billions of yen)
Book Value Book Value Book ValueGains Gains Losses Gains Losses
2,784.9 14.5 26.5 3,815.6 31.0 37.3 6.2 3,125.7 22.0 28.2 6.1
- - - - - - - - - - -
2,784.9 14.5 26.5 3,815.6 31.0 37.3 6.2 3,125.7 22.0 28.2 6.1
(3) Investments in Subsidiaries and Affiliates (Billions of yen)
Book Value Book Value Book ValueGains Gains Losses Gains Losses
108.6 194.8 196.1 108.6 168.1 168.9 0.7 108.6 147.8 149.4 1.5
- - - - - - - - - - -
108.6 194.8 196.1 108.6 168.1 168.9 0.7 108.6 147.8 149.4 1.5
(Reference)
Unrealized Gains/Losses on Other Securities (the base amount to be recorded directly to Net Assets after tax and other necessary adjustments)
Consolidated(Billions of yen)
As ofMarch 31,
2017
As ofSeptember30, 2017
(Reference)
Change
2,260.7 475.8 1,784.8 1,933.7
2,290.5 451.8 1,838.7 1,977.4
0.7 (20.3) 21.1 (9.3)
Japanese Government Bonds (7.1) (15.8) 8.7 (15.9)(30.6) 44.4 (75.0) (34.4)
Foreign Bonds (181.1) (18.1) (162.9) (157.2)
Non-ConsolidatedAggregate Figures for the 2 Banks
(Billions of yen)
As ofMarch 31,
2017
As ofSeptember30, 2017
(Reference)
Change
2,049.9 432.1 1,617.7 1,749.1
2,203.6 436.9 1,766.6 1,893.0
0.9 (20.1) 21.1 (9.2)
Japanese Government Bonds (7.1) (15.8) 8.7 (15.9)(154.6) 15.4 (170.0) (134.6)
Foreign Bonds (180.9) (17.9) (162.9) (157.7)
As of December 31,2017
Unrealized Gains/Losses
Losses
11.9
-
1.3
Losses
1.3
As of December 31, 2017
Unrealized Gains/Losses
MHTB
Total
MHBK
-
11.9
As of September 30, 2017(Reference)
Unrealized Gains/Losses
Unrealized Gains/Losses
As of December 31, 2017As of September 30, 2017
(Reference)
Unrealized Gains/Losses
As of March 31, 2017
Unrealized Gains/Losses
As of March 31, 2017
Unrealized Gains/Losses
UnrealizedGains/Losses
UnrealizedGains/Losses
UnrealizedGains/Losses
Japanese Bonds
Japanese Stocks
Japanese Bonds
As of December 31,2017
Unrealized Gains/Losses
UnrealizedGains/Losses
Other
MHBK
MHTB
Total
Other
Japanese Stocks
Other Securities
Other Securities
For certain Other Securities, Unrealized Gains/Losses were recognized in the statement of income by applying the fair-value hedge method. Unrealized Gains/Losses on Other Securities after excluding such Income/Loss (the "base amount") are recorded directly to Net Assets after tax and other necessary adjustments. The base amounts are as follows:
2-5

Mizuho Financial Group, Inc.
4. Deferred Hedge Gains/Losses on Derivative Transactions Qualifying
for Hedge Accounting
Non-ConsolidatedAggregate Figures for the 2 Banks
(Billions of yen)
Gains Losses Gains Losses Gains Losses
622.8 686.1 685.5 681.0 627.2 649.5
99.1 96.8 109.5 107.1 102.8 100.5
721.9 783.0 795.0 788.1 730.1 750.1
Note: Above figures reflect all derivative transactions qualifying for hedge accounting, and are before net of applicable income taxes.
As of December 31, 2017
(63.3)
As of September 30, 2017
(Reference)
Deferred Hedge Gains/Losses Deferred Hedge Gains/Losses
As of March 31, 2017
Deferred Hedge Gains/Losses
(22.2)
2.2
(19.9)
MHTB
Total
MHBK 4.4
2.2
(61.0)
2.3
6.8
2-6
Mizuho Financial Group, Inc.
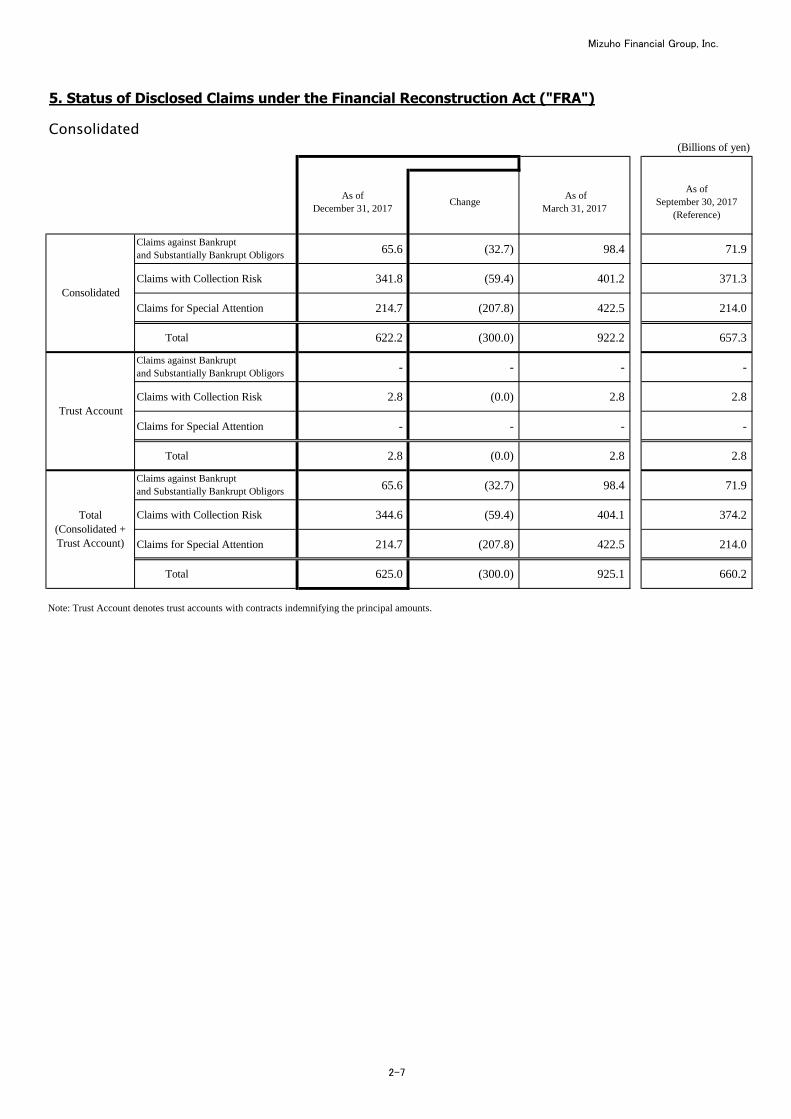
5. Status of Disclosed Claims under the Financial Reconstruction Act ("FRA")
Consolidated(Billions of yen)
65.6 (32.7) 98.4 71.9
Claims with Collection Risk 341.8 (59.4) 401.2 371.3
Claims for Special Attention 214.7 (207.8) 422.5 214.0
Total 622.2 (300.0) 922.2 657.3
- - - -
Claims with Collection Risk 2.8 (0.0) 2.8 2.8
Claims for Special Attention - - - -
Total 2.8 (0.0) 2.8 2.8
65.6 (32.7) 98.4 71.9
Claims with Collection Risk 344.6 (59.4) 404.1 374.2
Claims for Special Attention 214.7 (207.8) 422.5 214.0
Total 625.0 (300.0) 925.1 660.2
Note: Trust Account denotes trust accounts with contracts indemnifying the principal amounts.
Trust Account
Claims against Bankrupt
and Substantially Bankrupt Obligors
Total
(Consolidated +
Trust Account)
Claims against Bankrupt
and Substantially Bankrupt Obligors
As of
December 31, 2017 Change
As of
March 31, 2017
As of
September 30, 2017
(Reference)
Consolidated
Claims against Bankrupt
and Substantially Bankrupt Obligors
2-7

Mizuho Financial Group, Inc.
Non-ConsolidatedAggregate Figures for the 2 Banks
(Billions of yen, %)
Claims against Bankrupt and
Substantially Bankrupt Obligors54.2 (28.5) 82.7 57.2
Claims with Collection Risk 331.2 (58.7) 390.0 361.3
Claims for Special Attention 161.9 (205.2) 367.2 166.3
Sub-totalSub-total [1] 547.4 (292.5) 840.0 584.8
Sub-totalNPL ratio [1]/[2] 0.63% (0.36)% 1.00% 0.70%
TotalNormal Claims 85,338.7 2,622.3 82,716.4 82,131.1
Total [2] 85,886.2 2,329.7 83,556.4 82,715.9
Claims against Bankrupt and
Substantially Bankrupt Obligors53.3 (28.1) 81.5 56.2
Claims with Collection Risk 325.7 (58.2) 384.0 355.7
Claims for Special Attention 160.8 (199.8) 360.7 165.2
Sub-totalSub-total [3] 540.0 (286.2) 826.2 577.2
Sub-totalNPL ratio [3]/[4] 0.65% (0.37)% 1.03% 0.72%
TotalNormal Claims 81,910.0 2,545.0 79,364.9 78,780.3
Total [4] 82,450.1 2,258.8 80,191.2 79,357.6
Banking Account
Claims against Bankrupt and
Substantially Bankrupt Obligors0.8 (0.3) 1.2 0.9
Claims with Collection Risk 2.6 (0.5) 3.1 2.7
Claims for Special Attention 1.0 (5.4) 6.5 1.0
Sub-totalSub-total [5] 4.5 (6.3) 10.9 4.7
Sub-totalNPL ratio [5]/[6] 0.13% (0.19)% 0.32% 0.14%
TotalNormal Claims 3,419.9 78.0 3,341.8 3,341.7
Total [6] 3,424.5 71.7 3,352.7 3,346.4
Trust Account
Claims against Bankrupt and
Substantially Bankrupt Obligors- - - -
Claims with Collection Risk 2.8 (0.0) 2.8 2.8
Claims for Special Attention - - - -
Sub-totalSub-total [7] 2.8 (0.0) 2.8 2.8
Sub-totalNPL ratio [7]/[8] 24.64% 1.55% 23.09% 24.16%
TotalNormal Claims 8.7 (0.8) 9.5 9.0
Total [8] 11.6 (0.8) 12.4 11.8
Notes: 1. Trust Account denotes trust accounts with contracts indemnifying the principal amounts.
2. NPL: Non-Performing Loans
MHTB
As of
December 31, 2017 Change
As of
March 31, 2017
As of
September 30, 2017
(Reference)
Total(Banking Account
+ Trust Account)
MHBK
2-8

Mizuho Financial Group, Inc.
6. Status of Deposits and Loans
Non-Consolidated
(1)-1 Deposits (Billions of yen)
Aggregate Figures for the 2 Banks
Change
108,093.3 303.5 107,789.8 108,971.5
3,451.1 63.7 3,387.3 3,368.2
111,544.5 367.3 111,177.1 112,339.8
(1)-2 Domestic Deposits (Billions of yen)
Aggregate Figures for the 2 Banks
Change
89,489.2 118.3 89,370.8 89,490.5
Individual deposits 42,042.0 1,666.3 40,375.6 40,989.2
3,451.1 77.6 3,373.4 3,364.8
Individual deposits 977.0 (29.2) 1,006.3 986.0
92,940.3 196.0 92,744.3 92,855.4
Individual deposits 43,019.0 1,637.1 41,381.9 41,975.3
Note: Above figures do not include deposits booked at overseas offices and offshore deposits.
(2) Loans and Bills Discounted (Billions of yen)
Aggregate Figures for the 2 Banks
Change
72,373.4 1,110.5 71,262.8 70,003.3
3,398.0 71.7 3,326.2 3,306.4
75,771.4 1,182.3 74,589.1 73,309.7
Note: Loans to MHFG are included as follows:
As of December 31, 2017: \961.5 billion (from MHBK)
As of September 30, 2017: \496.3 billion (from MHBK)
As of March 31, 2017: \656.1 billion (from MHBK)
(3) Interest Margins (Domestic Operations) (%)
Mizuho Bank
Change
1 0.82 (0.05) 0.88
2 0.00 (0.00) 0.00
3 0.82 (0.05) 0.87
Notes: 1. Return on Loans and Bills Discounted excludes loans to financial institutions (including MHFG).
(Reference) After excluding Loans to the Japanese government and others
4 0.87 (0.07) 0.95
5 0.87 (0.07) 0.94
(%)
Mizuho Trust & Banking
Change
6 0.64 (0.03) 0.68
7 0.02 (0.01) 0.03
8 0.62 (0.02) 0.64
Notes: 1. Return on Loans and Bills Discounted excludes loans to financial institutions (including MHFG).
2. Deposits include NCDs.
(Reference) After excluding Loans to the Japanese government and others
9 0.68 (0.05) 0.74
10 0.66 (0.04) 0.70
(Reference) (%)
Aggregate Figures for the 2 Banks
Change
11 0.81 (0.05) 0.87
12 0.00 (0.00) 0.01
13 0.81 (0.05) 0.86
Notes: 1. Return on Loans and Bills Discounted excludes loans to financial institutions (including MHFG).
2. Deposits include NCDs.
(Reference) After excluding Loans to the Japanese government and others
14 0.86 (0.07) 0.93
15 0.85 (0.06) 0.92Loan and Deposit Rate Margin [14]-[12]
Third Quarter of
Fiscal 2017
(Accumulated Period)
Third Quarter of
Fiscal 2016
(Accumulated Period)
Return on Loans and Bills Discounted
Cost of Deposits
Loan and Deposit Rate Margin [11]-[12]
Return on Loans and Bills Discounted
Return on Loans and Bills Discounted
Cost of Deposits
Loan and Deposit Rate Margin [6]-[7]
Return on Loans and Bills Discounted
Loan and Deposit Rate Margin [9]-[7]
Return on Loans and Bills Discounted
Loan and Deposit Rate Margin [4]-[2]
Third Quarter of
Fiscal 2017
(Accumulated Period)
Third Quarter of
Fiscal 2016
(Accumulated Period)
Third Quarter of
Fiscal 2016
(Accumulated Period)
Return on Loans and Bills Discounted
Cost of Deposits
Loan and Deposit Rate Margin [1]-[2]
2. Deposits include NCDs.
MHBK
MHTB
Total
Third Quarter of
Fiscal 2017
(Accumulated Period)
MHTB
Total
As of
December 31, 2017
As of
March 31, 2017
As of
September 30, 2017
(Reference)
Total
As of
December 31, 2017
As of
March 31, 2017
As of
September 30, 2017
(Reference)
MHBK
As of
December 31, 2017
As of
March 31, 2017
As of
September 30, 2017
(Reference)
MHBK
MHTB
2-9

Mizuho Bank, Ltd.
(Attachments)COMPARISON OF NON-CONSOLIDATED BALANCE SHEETS (selected items)OF MIZUHO BANK
Millions of yen
Change(A) - (B)
AssetsCash and Due from Banks \ 38,344,925 \ 38,943,082 \ (598,157)Call Loans 283,450 433,198 (149,748)Receivables under Resale Agreements 442,361 596,194 (153,833)Other Debt Purchased 432,283 728,080 (295,796)Trading Assets 3,525,278 4,234,901 (709,622)Money Held in Trust 3,093 3,137 (44)Securities 34,070,409 31,264,703 2,805,705Loans and Bills Discounted 72,373,429 71,262,838 1,110,590Foreign Exchange Assets 2,251,681 1,769,212 482,468Derivatives other than for Trading 2,431,604 3,201,963 (770,358)Other Assets 2,510,466 2,268,678 241,788Tangible Fixed Assets 805,568 828,363 (22,794)Intangible Fixed Assets 800,409 754,547 45,861Prepaid Pension Cost 479,586 481,968 (2,382)Customers' Liabilities for Acceptances and Guarantees 6,321,315 5,757,150 564,165Reserves for Possible Losses on Loans (255,565) (437,689) 182,123Total Assets \ 164,820,298 \ 162,090,330 \ 2,729,968
LiabilitiesDeposits \ 108,093,392 \ 107,789,803 \ 303,589Negotiable Certificates of Deposit 11,992,608 10,091,832 1,900,775Call Money 949,388 775,450 173,938Payables under Repurchase Agreements 8,411,409 7,604,970 806,439Guarantee Deposits Received under Securities Lending Transactions 459,431 335,575 123,856Commercial Paper 767,151 765,146 2,004Trading Liabilities 2,723,676 3,362,426 (638,750)Borrowed Money 8,938,548 9,136,351 (197,802)Foreign Exchange Liabilities 775,835 729,532 46,302Bonds and Notes 2,956,237 3,726,331 (770,094)Derivatives other than for Trading 2,406,006 2,836,858 (430,851)Other Liabilities 1,963,142 1,616,928 346,214Reserve for Bonus Payments 6,903 20,902 (13,999)Reserve for Variable Compensation 971 1,269 (297)Reserve for Possible Losses on Sales of Loans 209 298 (89)Reserve for Contingencies 67 52 15Reserve for Reimbursement of Deposits 16,378 17,575 (1,196)Reserve for Reimbursement of Debentures 26,198 32,720 (6,522)Deferred Tax Liabilities 283,411 186,153 97,258Deferred Tax Liabilities for Revaluation Reserve for Land 66,237 66,585 (348)Acceptances and Guarantees 6,321,315 5,757,150 564,165Total Liabilities 157,158,523 154,853,914 2,304,608
Net AssetsCommon Stock and Preferred Stock 1,404,065 1,404,065 -Capital Surplus 2,286,328 2,286,328 - Capital Reserve 655,418 655,418 - Other Capital Surplus 1,630,910 1,630,910 -Retained Earnings 2,486,611 2,298,416 188,194 Appropriated Reserve 266,664 225,810 40,853 Other Retained Earnings 2,219,947 2,072,606 147,340 Retained Earnings Brought Forward 2,219,947 2,072,606 147,340Total Shareholders' Equity 6,177,005 5,988,810 188,194Net Unrealized Gains (Losses) on Other Securities, net of Taxes 1,384,485 1,099,468 285,017Net Deferred Hedge Gains (Losses), net of Taxes (44,533) 2,527 (47,060)Revaluation Reserve for Land, net of Taxes 144,817 145,609 (791)Total Valuation and Translation Adjustments 1,484,770 1,247,605 237,165Total Net Assets 7,661,775 7,236,415 425,359Total Liabilities and Net Assets \ 164,820,298 \ 162,090,330 \ 2,729,968
As ofDecember 31,
2017 (A)
As ofMarch 31, 2017 (B)
2-10
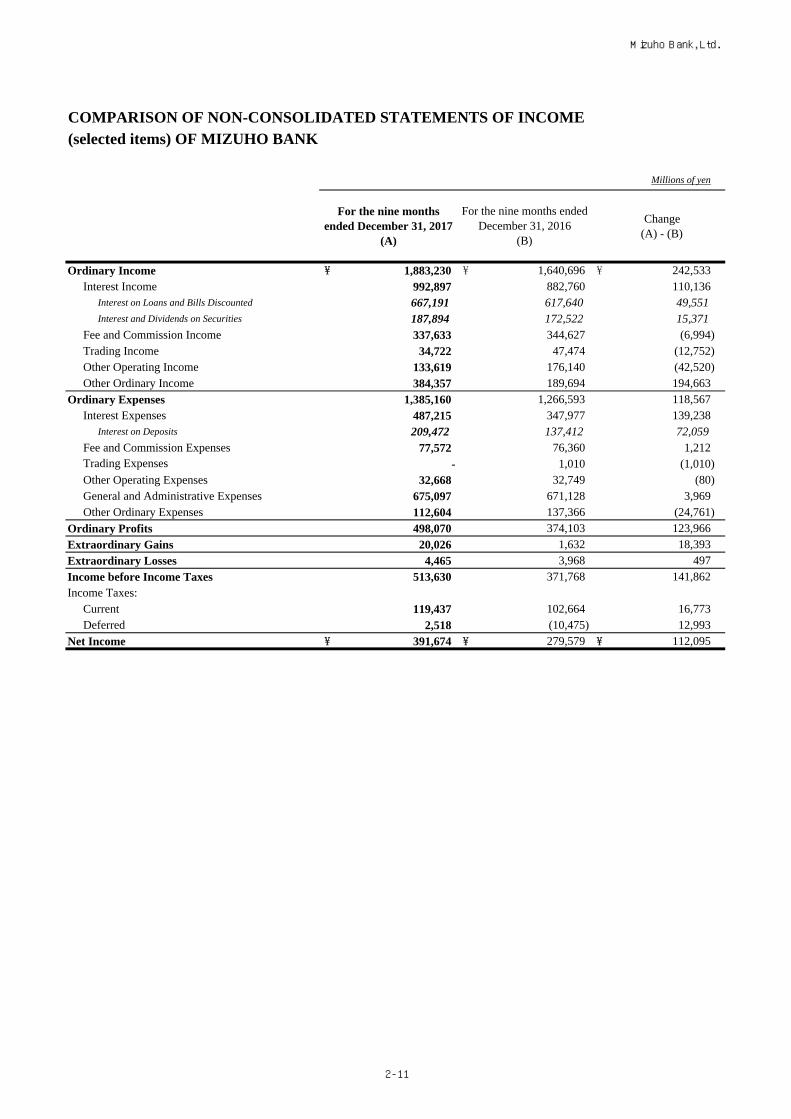
Mizuho Bank, Ltd.
COMPARISON OF NON-CONSOLIDATED STATEMENTS OF INCOME (selected items) OF MIZUHO BANK
Millions of yen
Change(A) - (B)
Ordinary Income \ 1,883,230 \ 1,640,696 \ 242,533Interest Income 992,897 882,760 110,136
Interest on Loans and Bills Discounted 667,191 617,640 49,551Interest and Dividends on Securities 187,894 172,522 15,371
Fee and Commission Income 337,633 344,627 (6,994)Trading Income 34,722 47,474 (12,752)Other Operating Income 133,619 176,140 (42,520)Other Ordinary Income 384,357 189,694 194,663
Ordinary Expenses 1,385,160 1,266,593 118,567Interest Expenses 487,215 347,977 139,238
Interest on Deposits 209,472 137,412 72,059Fee and Commission Expenses 77,572 76,360 1,212
- 1,010 (1,010)Other Operating Expenses 32,668 32,749 (80)General and Administrative Expenses 675,097 671,128 3,969Other Ordinary Expenses 112,604 137,366 (24,761)
Ordinary Profits 498,070 374,103 123,966
Extraordinary Gains 20,026 1,632 18,393
Extraordinary Losses 4,465 3,968 497
Income before Income Taxes 513,630 371,768 141,862Income Taxes:
Current 119,437 102,664 16,773Deferred 2,518 (10,475) 12,993
Net Income \ 391,674 \ 279,579 \ 112,095
Trading Expenses
For the nine monthsended December 31, 2017
(A)
For the nine months endedDecember 31, 2016
(B)
2-11

Mizuho Trust & Banking Co., Ltd.
COMPARISON OF NON-CONSOLIDATED BALANCE SHEETS (selected items)OF MIZUHO TRUST & BANKING
Millions of yen
As ofDecember 31,
2017 (A)
As ofMarch 31,2017(B)
Change(A) - (B)
AssetsCash and Due from Banks \ 1,723,175 \ 1,699,040 \ 24,135Call Loans 2,825 6,956 (4,131)Guarantee Deposits Paid under Securities Borrowing Transactions 216,093 113,046 103,046Other Debt Purchased 7,153 9,196 (2,043)Trading Assets 79,014 90,487 (11,473)Money Held in Trust 3,463 3,286 176Securities 1,104,212 1,253,105 (148,892)Loans and Bills Discounted 3,398,056 3,326,296 71,759Foreign Exchange Assets 2,401 2,596 (194)Other Assets 170,388 83,804 86,584Tangible Fixed Assets 23,296 23,617 (321)Intangible Fixed Assets 35,176 33,477 1,699Prepaid Pension Cost 49,368 49,230 137Customers' Liabilities for Acceptances and Guarantees 23,602 23,887 (284)Reserves for Possible Losses on Loans (1,848) (4,779) 2,930Total Assets \ 6,836,378 \ 6,713,251 \ 123,127
LiabilitiesDeposits \ 3,451,149 \ 3,387,390 \ 63,758Negotiable Certificates of Deposit 341,240 327,620 13,620Call Money 375,706 242,493 133,213Payables under Repurchase Agreements 67,806 67,320 486Guarantee Deposits Received under Securities Lending Transactions 227,151 310,303 (83,152)Trading Liabilities 72,035 83,683 (11,647)Borrowed Money 419,852 372,578 47,273Bonds and Notes 10,000 10,000 -Due to Trust Accounts 1,192,309 1,272,149 (79,840)Other Liabilities 41,027 36,173 4,854Reserve for Bonus Payments - 1,976 (1,976)Reserve for Variable Compensation 382 413 (30)Reserve for Reimbursement of Deposits 1,482 1,496 (14)Deferred Tax Liabilities 20,923 9,692 11,231Acceptances and Guarantees 23,602 23,887 (284)Total Liabilities 6,244,670 6,147,179 97,490
Net AssetsCommon Stock and Preferred Stock 247,369 247,369 -Capital Surplus 15,505 15,505 - Capital Reserve 15,505 15,505 -Retained Earnings 207,057 205,013 2,044 Appropriated Reserve 31,970 27,427 4,543 Other Retained Earnings 175,086 177,585 (2,498) Retained Earnings Brought Forward 175,086 177,585 (2,498)Total Shareholders' Equity 469,932 467,888 2,044Net Unrealized Gains (Losses) on Other Securities, net of Taxes 120,207 96,529 23,677Net Deferred Hedge Gains (Losses), net of Taxes 1,568 1,654 (85)Total Valuation and Translation Adjustments 121,776 98,183 23,592Total Net Assets 591,708 566,071 25,636Total Liabilities and Net Assets \ 6,836,378 \ 6,713,251 \ 123,127
2-12

Mizuho Trust & Banking Co., Ltd.
COMPARISON OF NON-CONSOLIDATED STATEMENTS OF INCOME (selected items) OF MIZUHO TRUST & BANKING
Millions of yen
##
For the nine months endedDecember 31, 2017
(A)
For the nine months endedDecember 31, 2016
(B)
Change(A) - (B)
Ordinary Income \ 137,068 \ 140,900 \ (3,831)Fiduciary Income 38,928 34,798 4,129Interest Income 30,760 29,643 1,116
Interest on Loans and Bills Discounted 19,121 19,488 (367)Interest and Dividends on Securities 10,132 8,839 1,292
Fee and Commission Income 40,589 36,509 4,079Trading Income 796 717 78Other Operating Income 4,077 14,117 (10,039)Other Ordinary Income 21,916 25,112 (3,196)
Ordinary Expenses 105,229 99,983 5,245Interest Expenses 9,983 7,462 2,520
Interest on Deposits 652 969 (317)Fee and Commission Expenses 23,386 19,724 3,662
0 0 (0)Other Operating Expenses 3,554 4,959 (1,404)General and Administrative Expenses 65,317 65,222 95Other Ordinary Expenses 2,986 2,615 371
Ordinary Profits 31,839 40,916 (9,077)Extraordinary Gains 182 - 182Extraordinary Losses 126 164 (38)Income before Income Taxes 31,895 40,751 (8,856)Income Taxes:
Current 5,047 8,965 (3,917)Deferred 2,087 1,346 741
Net Income \ 24,759 \ 30,439 \ (5,680)
Trading Expenses
2-13

Mizuho Securities Co., Ltd.
COMPARISON OF NON-CONSOLIDATED BALANCE SHEETS (selected items)OF MIZUHO SECURITIES
Millions of yen
Change(A) - (B)
AssetsCurrent AssetsCash and Bank Deposits \ 398,949 \ 249,691 \ 149,257Cash Segregated as Deposits for Customers and Others 289,448 230,214 59,233Trading Assets 6,066,572 5,019,291 1,047,280Receivables - Unsettled Trades - 169,960 (169,960)Operating Investment Securities 24,292 21,762 2,529Operating Loans Receivable - 2,790 (2,790)Receivables Related to Margin Transactions 69,478 96,255 (26,776)Collateralized Short-Term Financing Agreements-Receivable 3,421,041 3,821,571 (400,529)Advances Paid 338 191 147Securities: Fail to Deliver 13,167 28,695 (15,527)Short-Term Loans Receivable 38,674 22,459 16,215Deferred Tax Assets 13,909 15,302 (1,392)Other Current Assets 482,581 537,638 (55,056)Less: Allowance for Doubtful Accounts (7) (6) (1)Noncurrent AssetsProperty and Equipment 14,841 15,087 (246)Intangible Assets 54,520 50,195 4,325Investments and Other Assets 297,093 297,330 (237)Total Assets \ 11,184,903 \ 10,578,433 \ 606,470
LiabilitiesCurrent LiabilitiesTrading Liabilities \ 3,308,611 \ 3,771,283 \ (462,672)Payables - Unsettled Trades 400 - 400Payables Related to Margin Transactions 39,835 55,287 (15,452)Collateralized Short-Term Financing Agreements-Payable 4,558,078 3,727,318 830,759Deposits Received 284,344 234,622 49,722Guarantee Deposits Received 212,126 184,821 27,305Securities: Fail to Receive 3,205 12,844 (9,639)Short-Term Borrowings 755,644 716,603 39,041Commercial Paper 236,300 111,300 125,000Bonds and Notes Due within One Year 56,389 55,323 1,066Lease Obligations 380 375 4Income Taxes Payable 2,198 - 2,198Accrued Employees’ Bonuses 4,220 13,432 (9,212)Provision for Variable Compensation 715 855 (139)Provision for Bonus Point Redemption 540 596 (55)Other Current Liabilities 26,331 28,513 (2,182)Noncurrent LiabilitiesBonds and Notes 540,251 554,903 (14,651)Long-Term Borrowings 283,500 233,500 50,000Lease Obligations 234 494 (259)Provision for Retirement Benefits 19,485 19,536 (51)Other Noncurrent Liabilities 1,606 1,647 (40)Statutory ReservesReserve for Financial Instruments Transaction Liabilities 2,285 2,291 (5)Total Liabilities 10,336,687 9,725,551 611,135
Net AssetsCommon Stock 125,167 125,167 -Capital Surplus 381,649 381,649 - Additional Paid - in Capital 285,831 285,831 - Other Capital Surplus 95,817 95,817 -Retained Earnings 326,417 332,177 (5,760) Other Retained Earnings 326,417 332,177 (5,760) Retained Earnings Brought Forward 326,417 332,177 (5,760)Total Shareholders' Equity 833,233 838,993 (5,760)Net Unrealized Gains on (Operating) Investment Securities, net of Tax 30,475 22,719 7,756Net Deferred Gains or Losses on Hedges, net of Tax (15,492) (8,831) (6,661)Total Valuation and Translation Adjustments 14,983 13,887 1,095Total Net Assets 848,216 852,881 (4,664)Total Liabilities and Net Assets \ 11,184,903 \ 10,578,433 \ 606,470
As ofDecember 31,
2017 (A)
As ofMarch 31,2017 (B)
2-14
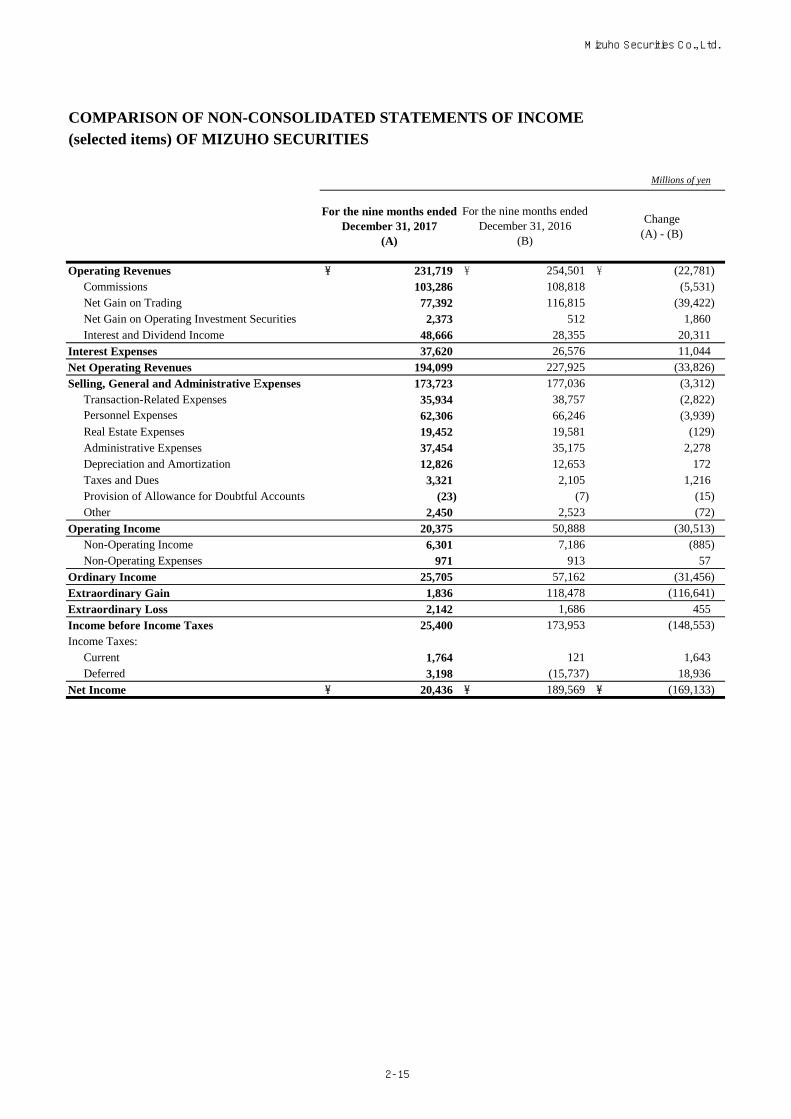
Mizuho Securities Co., Ltd.
COMPARISON OF NON-CONSOLIDATED STATEMENTS OF INCOME (selected items) OF MIZUHO SECURITIES
Millions of yen
Change(A) - (B)
Operating Revenues \ 231,719 \ 254,501 \ (22,781)Commissions 103,286 108,818 (5,531)Net Gain on Trading 77,392 116,815 (39,422)Net Gain on Operating Investment Securities 2,373 512 1,860Interest and Dividend Income 48,666 28,355 20,311
Interest Expenses 37,620 26,576 11,044
Net Operating Revenues 194,099 227,925 (33,826)
Selling, General and Administrative Expenses 173,723 177,036 (3,312)Transaction-Related Expenses 35,934 38,757 (2,822)
62,306 66,246 (3,939)Real Estate Expenses 19,452 19,581 (129)Administrative Expenses 37,454 35,175 2,278Depreciation and Amortization 12,826 12,653 172Taxes and Dues 3,321 2,105 1,216Provision of Allowance for Doubtful Accounts (23) (7) (15)Other 2,450 2,523 (72)
Operating Income 20,375 50,888 (30,513)Non-Operating Income 6,301 7,186 (885)Non-Operating Expenses 971 913 57
Ordinary Income 25,705 57,162 (31,456)
Extraordinary Gain 1,836 118,478 (116,641)
Extraordinary Loss 2,142 1,686 455
Income before Income Taxes 25,400 173,953 (148,553)Income Taxes:
Current 1,764 121 1,643Deferred 3,198 (15,737) 18,936
Net Income \ 20,436 \ 189,569 \ (169,133)
For the nine months endedDecember 31, 2017
(A)
For the nine months endedDecember 31, 2016
(B)
Personnel Expenses
2-15