consolidated financial statements for the first half of ...the consolidated financial result...
TRANSCRIPT

Consolidated Financial Statements
for the First Half of the Fiscal Year Ending December 31, 2020
<under IFRS> August 7, 2020
These financial statements, prepared in accordance with International Financial Reporting Standards (IFRS), have been translated for reference only from the original Japanese-language document “KESSAN TANSHIN.” The entire format is pursuant to the requirements or guidance of Tokyo Stock Exchange. As for the contents, if there are any differences or discrepancies between the original Japanese-language and the English translation, the original Japanese-language supersedes this English translation. Company name: Bridgestone Corporation Stock exchange listings: Tokyo, Nagoya, Fukuoka Code number: 5108 URL: https://www.bridgestone.com/ Representative: Shuichi Ishibashi, Member of the Board
CEO and Representative Executive Officer Contact: Tetsuo Kenmochi, Director Global Finance Strategy Division,
General Manager Treasury & IR Department Telephone: +81-3-6836-3100 Scheduled date of quarterly securities report submission: August 7, 2020 Scheduled date of dividend payment commencement: September 1, 2020 Supplementary information for the quarterly financial statements to be prepared: Yes Meeting to explain the quarterly financial statements to be held: Yes
(All amounts are rounded off the nearest million yen) 1. Consolidated Results for the First Half of Fiscal 2020 (January 1, 2020 - June 30, 2020) (1) Consolidated Operating Results (Percentage figures represent changes from the same period of previous year)
Revenue Adjusted
operating profit* Operating profit
Profit attributable
to owners of
parent
Comprehensive
income
Yen in millions
% Yen in millions
% Yen in millions
% Yen in millions
% Yen in millions
%
Six months ended June 30, 2020
1,355,470 (22.1) 48,266 (68.3) 19,762 (86.7) (22,044) - (112,269) -
Six months ended June 30, 2019
1,739,926 - 152,124 - 148,451 - 98,703 - 66,662 -
* The Group utilizes “adjusted operating profit” in place of the previously employed J-GAAP-based operating income. For details on reconciliations, please refer to page 12, “Reconciliation from adjusted operating profit to profit before tax” under “2. Condensed Quarterly Consolidated Financial Statements and Primary Notes (6) Notes to the Condensed Quarterly Consolidated Financial Statements.”
Basic earnings
per share
Diluted earnings
per share
Yen Yen
Six months ended June 30, 2020
(31.31) (31.31)
Six months ended June 30, 2019
134.03 133.81
(2) Consolidated Financial Position
Total assets Total equity
Total equity
attributable to
owners of parent
Ratio of equity
attributable to
owners of parent to
total assets
Yen in millions Yen in millions Yen in millions
%
As of June 30, 2020 4,146,955 2,229,450 2,183,395 52.7 As of December 31, 2019 4,277,016 2,402,477 2,349,378 54.9

2. Dividends Dividend per share
1st quarter
end 2nd quarter
end 3rd quarter
end Year -end Total
Yen Yen Yen Yen Yen
Fiscal 2019 - 80.00 - 80.00 160.00
Fiscal 2020 - 50.00
Fiscal 2020 (Projection)
- To be determined
To be determined
(Note) Changes from the latest forecasts released: Yes 3. Consolidated Financial Results Forecasts for Fiscal 2020 (January 1, 2020 - December 31, 2020) (Percentage figures represent changes from the same period of previous year)
Revenue Adjusted operating
profit
Profit attributable to
owners of parent
Basic earnings
per share
Yen in millions % Yen in millions % Yen in millions % Yen
Fiscal 2020 2,700,000 (23.0) 100,000 (70.2) To be determined
- To be determined
(Notes) 1. Changes from the latest forecasts released: Yes 2. The financial results forecasts stated above are formulated with the possibility of a “second wave” of
the spread of the novel coronavirus disease (COVID-19) in Japan and major countries overseas, and the assumption of the impact of a decrease in demand in the fourth quarter.
3. The consolidated financial result forecast for profit attributable to owners of parent has not been determined because it is difficult to reasonably calculate the result at this time due to the effect of the spread of COVID-19. When it does become possible to perform a reasonable calculation, the financial result forecast for profit attributable to owners of parent will be promptly announced.

* Notes
(1) Changes in principal subsidiaries during the six months ended June 30, 2020: No
(Changes in specified subsidiaries involving change in consolidation scope)
(2) Changes in accounting policies and changes in accounting estimates
1) Changes in accounting policies required by IFRS : No
2) Changes in accounting policies other than 1) : No
3) Changes in accounting estimates : No
(3) Number of issued shares (common stock)
1) Total number of issued shares at period end (including treasury stock):
June 30, 2020 713,698,221 shares
December 31, 2019 761,536,421 shares
2) Number of shares of treasury stock at period end
June 30, 2020 9,583,088 shares
December 31, 2019 57,481,254 shares
3) Average number of shares outstanding during the period (during the first half)
First Half ended June 30, 2020 704,093,432 shares
First Half ended June 30, 2019 736,400,589 shares
* Quarterly financial results reports are exempt from quarterly review conducted by certified public accountants or an audit corporation.
* Statement regarding appropriate use of forward-looking statements and other notes
Forecasts based on our projections and plans for the future in this document contain unpredictable
elements that may cause fluctuations. As such, they do not constitute guarantees by the Company of the
achievement of those forecasts. Accordingly, actual business results may differ substantially from the
Company’s current assessment.
Adoption of International Financial Reporting Standards (IFRS)
The Company has adopted International Financial Reporting Standards (IFRS) from the first quarter of
the fiscal year ending December 31, 2020. Presentation of figures in the consolidated financial statements
for the period of the previous year also conforms to IFRS.
For differences between IFRS and J-GAAP in the financial statements, please refer to page 16, “First-
time adoption of IFRS” under “2. Condensed Quarterly Consolidated Financial Statements and Primary
Notes (6) Notes to the Condensed Quarterly Consolidated Financial Statements.”

Bridgestone Corporation (5108) First half results of fiscal 2020
- 1 -
[ Index ] 1. Qualitative Information on Consolidated Financial Results for the Six Months P2
(1) Explanation regarding information on consolidated financial results forecasts and other
forward-looking statements P2
2. Condensed Quarterly Consolidated Financial Statements and Primary Notes P4
(1) Condensed Quarterly Consolidated Statement of Financial Position P4
(2) Condensed Quarterly Consolidated Statement of Profit or Loss P6
(3) Condensed Quarterly Consolidated Statement of Comprehensive Income P7
(4) Condensed Quarterly Consolidated Statement of Changes in Equity P8
(5) Condensed Quarterly Consolidated Statement of Cash Flows P10
(6) Notes to the Condensed Quarterly Consolidated Financial Statements P12
(Notes regarding going concern assumption) P12
(Reconciliation from adjusted operating profit to profit before tax) P12
(Impairment of non-financial assets) P13
(Selling, general and administrative expenses) P14
(Other income and other expenses) P14
(Finance income and finance costs) P15
(Subsequent events) P16
(First-time adoption of IFRS) P16

Bridgestone Corporation (5108) First half results of fiscal 2020
- 2 -
1. Qualitative Information on Consolidated Financial Results for the Six Months
(1) Explanation regarding information on consolidated financial results forecasts and other forward-looking
statements
[Revision of consolidated financial results forecasts for the fiscal year ending December 31, 2020]
1) Consolidated financial results forecasts (from January 1, 2020 to December 31, 2020)
Revenue Adjusted operating
profit Profit attributable to
owners of parent Basic earnings
per share
Yen in millions Yen in millions Yen in millions Yen
Previous forecasts (A)
To be determined To be determined To be determined To be determined
Revised forecasts (B)
2,700,000 100,000 To be determined To be determined
Differences (A-B) - - - -
Change (%) - - - -
(Reference) FY2019 results
3,507,243 335,702 240,111 332.31
2) Reason for disclosure
Until now, the consolidated financial results forecasts for fiscal 2020 have been undetermined, taking
into consideration the uncertainties regarding the spread of COVID-19 across in each region.
However, the Company has now calculated the financial results forecasts based on the information
that is currently available and discloses them as shown above.
As for profit attributable to owners of parent, the financial result forecast has not been determined
because it is difficult to reasonably calculate the result in light of the effect of COVID-19. When it does
become possible to perform a reasonable calculation, the financial result forecast for profit attributable
to owners of parent will be promptly announced.
3) Assumptions in the financial results forecasts
In the first two quarters of fiscal 2020, tire demand for both new vehicles and replacement significantly
declined due to the global stagnation of economic activity arising from the respective issuances of
states of emergency by the respective countries. Even though signs of recovery have been apparent
since June, the market environment continues to be unpredictable.
With regard to the last two quarters, the Company has formulated the financial results forecasts with
the assumption of the impact of a decrease in demand due to a second wave of COVID-19 infection
in the fourth quarter, despite the current expectation of a gradual recovery. The impact of a decrease
in demand due to a second wave is expected to be on a smaller scale when compared with the first
wave that occurred during the second quarter.

Bridgestone Corporation (5108) First half results of fiscal 2020
- 3 -
[Determination of dividends of surplus and revisions to the dividends forecast]
1) Dividends of surplus (cash dividends)
Determined amount
Latest dividends forecast
(announced on May 11, 2020)
FY2019 Interim dividend result
Record date June 30, 2020 June 30, 2020 June 30, 2019
Cash dividends per share 50 yen 80 yen 80 yen
Total dividends 35,206 million yen - 57,556 million yen
Effective date September 1, 2020 - September 2, 2019
Source of dividend Retained earnings - Retained earnings
2) Reason for the determination of dividends
The Company’s basic policies on profit distribution and dividends are as follows.
• Policy on profit distribution- the Company conducts shareholder returns while maintaining an appropriate
financial position and securing the internal reserves necessary for future growth investments.
• Policy on dividends- the Company comprehensively evaluates factors including business results,
financial condition for the relevant fiscal period, medium-term earnings forecasts, investment plans, and cash flows. Based on these considerations, the Company issues stable dividend payments targeting a consolidated payout ratio of 20%-40%.
During these current harsh business circumstances caused by the effect of the spread of COVID-19, the Company determined the dividend amount based on the above basic policies while keeping the following concepts.
• Growth investments: Exercise restraint to limit cash outflow during the current fiscal year while securing priority investments required for business strategies.
• Financial position: Carefully watch for the risk of a second wave of COVID-19 and continue to maintain a robust cash position.
• Shareholder returns: While giving consideration to growth investments and financial position, determine dividend amounts that are in line with the “stable shareholder returns” in the medium to long term.
3) Revisions to the forecasts of cash dividends
As it is not possible to provide financial results forecasts for fiscal 2020, the Company has left the forecast of the year-end dividend undetermined.
Cash dividends per share (yen)
2nd quarter end Year-end Total
Previous forecasts 80 yen 80 yen 160 yen
Revised forecasts 50 yen To be determined To be determined
FY2019 results 80 yen 80 yen 160 yen

Bridgestone Corporation (5108) First half results of fiscal 2020
- 4 -
2. Condensed Quarterly Consolidated Financial Statements and Primary Notes
(1) Condensed Quarterly Consolidated Statement of Financial Position
IFRS transition date (January 1, 2019)
As of December 31, 2019
As of June 30, 2020
Millions of yen Millions of yen Millions of yen
Assets
Current assets
Cash and cash equivalents 433,916 432,924 628,694
Trade and other receivables 781,916 755,344 605,717
Inventories 645,924 630,162 594,778
Other financial assets 25,867 14,311 10,103
Other current assets 78,435 80,643 74,970
Subtotal 1,966,059 1,913,385 1,914,262
Non-current assets held for sale 1,788 5,023 1,038
Total current assets 1,967,847 1,918,408 1,915,300
Non-current assets
Property, plant and equipment 1,515,042 1,555,170 1,471,491
Right-of-use assets 322,670 298,569 296,153
Goodwill 41,382 98,346 96,388
Intangible assets 49,710 113,664 113,208
Investments accounted for using equity method
48,014 47,071 23,015
Other financial assets 217,306 140,462 126,668
Deferred tax assets 57,379 60,711 62,319
Other non-current assets 33,327 44,616 42,414
Total non-current assets 2,284,830 2,358,608 2,231,655
Total assets 4,252,677 4,277,016 4,146,955

Bridgestone Corporation (5108) First half results of fiscal 2020
- 5 -
IFRS transition date (January 1, 2019)
As of December 31, 2019
As of June 30, 2020
Millions of yen Millions of yen Millions of yen
Liabilities and equity
Liabilities
Current liabilities
Trade and other payables 497,173 453,069 303,592
Bonds and borrowings 191,556 135,442 373,806
Lease liabilities 52,097 52,827 52,018
Income taxes payable 35,404 51,506 33,160
Other financial liabilities 24,996 27,628 26,743
Provisions 33,080 34,931 35,926
Other current liabilities 123,190 138,980 131,153
Subtotal 957,495 894,383 956,398
Liabilities directly associated with non-current assets held for sale
– 953 11
Total current liabilities 957,495 895,336 956,409
Non-current liabilities
Bonds and borrowings 209,977 405,514 410,429
Lease liabilities 271,179 250,685 249,273
Other financial liabilities 11,824 12,937 8,799
Net defined benefit liability 207,928 211,619 209,719
Provisions 24,212 23,348 20,380
Deferred tax liabilities 46,613 44,243 30,633
Other non-current liabilities 29,077 30,856 31,863
Total non-current liabilities 800,810 979,203 961,096
Total liabilities 1,758,306 1,874,539 1,917,505
Equity
Common stock 126,354 126,354 126,354
Capital surplus 121,998 121,998 122,030
Treasury stock (32,648) (232,330) (38,724)
Other components of equity 118,815 42,661 (36,904)
Retained earnings 2,105,280 2,290,696 2,010,638
Total equity attributable to owners of parent
2,439,799 2,349,378 2,183,395
Non-controlling interests 54,572 53,099 46,055
Total equity 2,494,371 2,402,477 2,229,450
Total liabilities and equity 4,252,677 4,277,016 4,146,955

Bridgestone Corporation (5108) First half results of fiscal 2020
- 6 -
(2) Condensed Quarterly Consolidated Statement of Profit or Loss
(Six months ended June 30, 2020)
Six months ended June 30, 2019
Six months ended June 30, 2020
Millions of yen Millions of yen
Revenue 1,739,926 1,355,470
Cost of sales 1,092,271 882,259
Gross profit 647,655 473,211
Selling, general and administrative expenses 502,725 434,701
Other income 10,336 2,886
Other expenses 6,814 21,634
Operating profit 148,451 19,762
Finance income 8,473 4,114
Finance costs 16,361 12,966
Impairment loss related to shares using equity
method – 18,442
Share of profit (loss) of investments accounted for
using equity method (2,948) (3,620)
Profit (loss) before tax 137,615 (11,152)
Income tax expense 35,088 9,842
Profit (loss) 102,527 (20,994)
Profit (loss) attributable to
Owners of parent 98,703 (22,044)
Non-controlling interests 3,824 1,050
Profit (loss) 102,527 (20,994)
Earnings (loss) per share
Basic earnings (loss) per share (yen) 134.03 (31.31)
Diluted earnings (loss) per share (yen) 133.81 (31.31)

Bridgestone Corporation (5108) First half results of fiscal 2020
- 7 -
(3) Condensed Quarterly Consolidated Statement of Comprehensive Income
(Six months ended June 30, 2020)
Six months ended June 30, 2019
Six months ended June 30, 2020
Millions of yen Millions of yen
Profit (loss) 102,527 (20,994)
Other comprehensive income
Items that will not be reclassified to profit or loss
Net change in fair value of financial assets measured through other comprehensive income
(356) (8,868)
Remeasurements of defined benefit plans (445) (8,509)
Share of other comprehensive income of investments accounted for using equity method
– (5)
Total of items that will not be reclassified to profit or loss (800) (17,382)
Items that may be reclassified to profit or loss
Exchange differences on translation of foreign operations
(34,495) (73,475)
Effective portion of change in fair value of cash flow hedges
407 452
Share of other comprehensive income of investments accounted for using equity method
(977) (872)
Total of items that may be reclassified to profit or loss (35,065) (73,894)
Other comprehensive income, net of tax (35,865) (91,276)
Comprehensive income 66,662 (112,269)
Comprehensive income attributable to
Owners of parent 62,144 (109,689)
Non-controlling interests 4,519 (2,580)
Comprehensive income 66,662 (112,269)

Bridgestone Corporation (5108) First half results of fiscal 2020
- 8 -
(4) Condensed Quarterly Consolidated Statement of Changes in Equity
Six months ended June 30, 2019
Equity attributable to owners of parent
Common stock
Capital surplus
Treasury stock
Other components of equity
Stock
acquisition rights
Exchange differences
on transition of foreign operations
Effective portion of change in
fair value of cash flow hedges
Net change in fair value of financial
assets measured through other
comprehen-sive income
Millions of
yen
Millions of yen
Millions of
yen
Millions of yen
Millions of
yen
Millions of yen
Millions of yen
Balance at January 1, 2019 126,354 121,998 (32,648) 3,452 – 1,742 113,620
Profit (loss) – – – – – – –
Other comprehensive income – – – – (35,785) 199 (356)
Total comprehensive income – – – – (35,785) 199 (356)
Purchase of treasury stock – – (137,510) – – – –
Disposal of treasury stock – – 241 (150) – – –
Dividends – – – – – – –
Transfer from other components of equity to retained earnings
– – – – – –
(12,618)
Other changes – – – – – – –
Total transactions with owners – – (137,269) (150) – – (12,618)
Balance at June 30, 2019 126,354 121,998 (169,918) 3,302 (35,785) 1,941 100,647
Equity attributable to owners of parent
Non-controlling interests
Total
Other components of equity
Retained earnings
Total
Remeasure- ments of defined benefit plans
Total
Millions of
yen
Millions of yen
Millions of
yen
Millions of yen
Millions of
yen
Millions of yen
Balance at January 1, 2019 – 118,815 2,105,280 2,439,799 54,572 2,494,371
Profit (loss) – – 98,703 98,703 3,824 102,527
Other comprehensive income (618) (36,560) – (36,560) 695 (35,865)
Total comprehensive income (618) (36,560) 98,703 62,144 4,519 66,662
Purchase of treasury stock – – – (137,510) – (137,510)
Disposal of treasury stock – (150) (91) (0) – (0)
Dividends – – (60,145) (60,145) (5,608) (65,753)
Transfer from other components of equity to retained earnings
618 (11,999) 11,999 – – –
Other changes – – – – (162) (162)
Total transactions with owners 618 (12,149) (48,236) (197,655) (5,769) (203,425)
Balance at June 30, 2019 – 70,106 2,155,748 2,304,287 53,322 2,357,609

Bridgestone Corporation (5108) First half results of fiscal 2020
- 9 -
Six months ended June 30, 2020
Equity attributable to owners of parent
Common stock
Capital surplus
Treasury stock
Other components of equity
Stock
acquisition rights
Exchange differences
on transition of foreign operations
Effective portion of change in
fair value of cash flow hedges
Net change in fair value of financial
assets measured through other
comprehen-sive income
Millions of
yen
Millions of yen
Millions of
yen
Millions of yen
Millions of
yen
Millions of yen
Millions of yen
Balance at January 1, 2020 126,354 121,998 (232,330) 3,275 (18,968) (325) 58,678
Profit (loss) – – – – – – –
Other comprehensive income – – – – (72,125) 657 (8,873)
Total comprehensive income – – – – (72,125) 657 (8,873)
Purchase of treasury stock – – (2) – – – –
Disposal of treasury stock – – 193,608 (119) – – –
Dividends – – – – – – –
Changes in ownership interests of owners in subsidiaries under control
– 32 – – – –
–
Transfer from other components of equity to retained earnings
– – – – – –
896
Other changes – – – – – – –
Total transactions with owners, etc. – 32 193,606 (119) – – 896
Balance at June 30, 2020 126,354 122,030 (38,724) 3,157 (91,094) 332 50,701
Equity attributable to owners of parent
Non-controlling interests
Total
Other components of equity
Retained earnings
Total
Remeasure- ments of defined benefit plans
Total
Millions of
yen
Millions of yen
Millions of
yen
Millions of yen
Millions of
yen
Millions of yen
Balance at January 1, 2020 – 42,661 2,290,696 2,349,378 53,099 2,402,477
Profit (loss) – – (22,044) (22,044) 1,050 (20,994)
Other comprehensive income (7,304) (87,646) – (87,646) (3,630) (91,276)
Total comprehensive income (7,304) (87,646) (22,044) (109,689) (2,580) (112,269)
Purchase of treasury stock – – – (2) – (2)
Disposal of treasury stock – (119) (193,489) 0 – 0
Dividends – – (56,325) (56,325) (5,447) (61,772)
Changes in ownership interests of owners in subsidiaries under control
– – – 32 1,039 1,071
Transfer from other components of equity to retained earnings
7,304 8,200 (8,200) – – –
Other changes – – – – (56) (56)
Total transactions with owners, etc. 7,304 8,081 (258,014) (56,294) (4,465) (60,758)
Balance at June 30, 2020 – (36,904) 2,010,638 2,183,395 46,055 2,229,450

Bridgestone Corporation (5108) First half results of fiscal 2020
- 10 -
(5) Condensed Quarterly Consolidated Statement of Cash Flows
Six months ended June 30, 2019
Six months ended June 30, 2020
Millions of yen Millions of yen
Cash flows from operating activities
Profit (loss) before tax 137,615 (11,152)
Depreciation and amortization 134,142 133,118
Impairment losses 349 11,890
Increase (decrease) in accounts payable - bonuses (6,537) (8,072)
Increase (decrease) in retirement benefit liability 2,472 (9,723)
Interest and dividend income (7,299) (3,999)
Interest expenses 8,220 7,452
Impairment loss related to shares using equity method
– 18,442
Share of loss (profit) of investments accounted for using equity method
2,948 3,620
Loss (gain) on sale of fixed assets (1,875) (496)
Business and plant restructuring expenses 2,746 4,726
Loss on retirement of fixed assets 1,612 977
Decrease (increase) in trade and other receivables 5,481 126,506
Decrease (increase) in inventories (21,446) 26,966
Increase (decrease) in trade and other payables (20,657) (103,574)
Increase (decrease) in accrued consumption taxes (2,153) 10,056
Other 19,653 (22,789)
Subtotal 255,271 183,949
Interest and dividends received 7,137 4,047
Interest paid (7,664) (7,789)
Income taxes paid (35,742) (35,031)
Net cash provided by (used in) operating activities 219,002 145,177
Cash flows from investing activities
Payments for purchase of property, plant and equipment
(127,952) (102,528)
Proceeds from sale of property, plant and equipment
5,757 5,657
Payments for purchase of intangible assets (5,145) (8,233)
Payments of long-term loans receivable (1,594) (4,138)
Purchase of investments in subsidiaries resulting in change in scope of consolidation
(109,206) (1,834)
Other 20,080 6,944
Net cash provided by (used in) investing activities (218,059) (104,131)

Bridgestone Corporation (5108) First half results of fiscal 2020
- 11 -
Six months ended June 30, 2019
Six months ended June 30, 2020
Millions of yen Millions of yen
Cash flows from financing activities
Proceeds from short-term debt 53,580 291,794
Repayments of short-term debt (13,654) (152,534)
Proceeds from long-term debt 1,711 114,502
Repayments of long-term debt (12,800) (210)
Proceeds from issuance of bonds 200,000 –
Repayments of lease liabilities (27,198) (27,987)
Purchase of treasury stock (137,510) (2)
Dividends paid (owners of parent) (60,132) (56,308)
Dividends paid (non-controlling interests) (5,716) (5,374)
Other (1,832) (143)
Net cash provided by (used in) financing activities (3,551) 163,737
Effect of exchange rate changes on cash and cash equivalents
(3,246) (9,014)
Net increase (decrease) in cash and cash equivalents
(5,854) 195,769
Cash and cash equivalents at beginning of period 433,916 432,924
Cash and cash equivalents at end of period 428,062 628,694

Bridgestone Corporation (5108) First half results of fiscal 2020
- 12 -
(6) Notes to the Condensed Quarterly Consolidated Financial Statements
(Notes regarding going concern assumption)
Not applicable
(Reconciliation from adjusted operating profit to profit before tax)
(Millions of yen)
Six months ended
June 30, 2019
Six months ended
June 30, 2020
Adjusted operating profit (Note 1) 152,124 48,266
Adjusted items (income) (Note 2) 141 31
Adjusted items (expenses) (Note 3) 3,814 28,535
Operating profit 148,451 19,762
Finance income 8,473 4,114
Finance costs 16,361 12,966
Impairment loss related to shares using equity method
- 18,442
Share of profit (loss) of investments accounted for using equity method
(2,948) (3,620)
Profit (loss) before tax 137,615 (11,152)
(Note 1) For adjusted operating profit, adjusted items (income and expenses) are excluded from operating profit.
(Note 2) The major breakdown of adjusted items (income) is as follows:
(Millions of yen)
Six months ended
June 30, 2019
Six months ended
June 30, 2020
Insurance claim income 34 4
Business and plant restructuring income 107 27
Adjusted items (income) 141 31
(Note 3) The major breakdown of adjusted items (expenses) is as follows:
(Millions of yen)
Six months ended
June 30, 2019
Six months ended
June 30, 2020
Impairment losses 349 (Note 4) 11,890
Cost of sales (loss on disaster) - (Note 5) 9,675
Other expenses (loss on disaster) 720 (Note 6) 2,244
Business and plant restructuring expenses (Note 7) 2,746 (Note 8) 4,726
Adjusted items (expenses) 3,814 28,535
(Note 4) The major breakdown of impairment losses is impairment on property, plant and equipment of ¥10,539 million
(of which ¥450 million was recorded for business and plant restructuring expenses). Details are presented
below in “Impairment of non-financial assets” under Notes to the Condensed Quarterly Consolidated Financial
Statements.
(Note 5) This was primarily the recording of fixed costs, etc. arising from the period when operations were temporarily
suspended at plants, etc. due to official requests and declarations by the national and local governments to
prevent the spread of COVID-19.
(Note 6) This was primarily the recording of expenses, etc. recorded as the direct result of the preparation for and
cancellation of events that were cancelled due to official requests and declarations by the national and local
governments to prevent the spread of COVID-19. Note that the major breakdown of “other expenses” is
presented below in “Other income and other expenses” under Notes to the Condensed Quarterly Consolidated
Financial Statements.
(Note 7) This was primarily the recording of expenses relating to the sale of an overseas raw materials plant.
(Note 8) This was primarily the recording of expenses relating to the transfer of the unit bath business.

Bridgestone Corporation (5108) First half results of fiscal 2020
- 13 -
(Impairment of non-financial assets)
(Impairment of property, plant and equipment)
Impairment loss on property, plant and equipment recognized in the six months ended June 30, 2020 of
¥10,539 million is mainly the result of the carrying amount of assets related to property, plant and
equipment in the “Europe, Russia, Middle East, India, and Africa” segment (assets for business use in
Russia) being reduced by ¥9,840 million to the recoverable amount because the intended revenue is no
longer expected as a result of changes in the business environment, such as the impacts of COVID-19.
The recoverable amount of these assets was measured by value in use, which was calculated by
discounting future cash flows at a discount rate of 10.3%. In addition, this impairment loss was recorded
in “other expenses” in the condensed quarterly consolidated statement of profit or loss.
(Impairment of investments accounted for using equity method)
Impairment loss on investments accounted for using equity method recognized in the six months ended
June 30, 2020 of ¥18,442 million is mainly the result of the carrying amount of assets related to
investments in TIREHUB, LLC, which is a jointly controlled entity in the “Americas” segment being
reduced by ¥17,286 million to the recoverable amount because the intended revenue is no longer
expected as a result of changes in the business environment, such as the impacts of COVID-19. The
recoverable amount of these assets was measured by value in use, which was calculated by
discounting future cash flows at a discount rate of 11.5%. In addition, this impairment loss was recorded
in “impairment loss related to shares using equity method” in the condensed quarterly consolidated
statement of profit or loss.

Bridgestone Corporation (5108) First half results of fiscal 2020
- 14 -
(Selling, general and administrative expenses)
The breakdown of “Selling, general and administrative expenses” is as follows:
(Millions of yen)
Six months ended
June 30, 2019
Six months ended
June 30, 2020
Sales fare 91,529 74,607
Advertising and sales promotion expenses 59,356 46,937
Employee benefit expenses 139,440 125,351
Depreciation and amortization 43,011 44,432
Research and development expenses (Note) 52,820 48,676
Other 116,570 94,699
Total 502,725 434,701
(Note) All research and development expenses recognized as expenses are included in “Selling, general and administrative expenses.”
(Other income and other expenses)
The breakdown of “Other income” and “Other expenses” is as follows:
(1) Other income
(Millions of yen)
Six months ended
June 30, 2019
Six months ended
June 30, 2020
Gain on sale of fixed assets 1,875 496
Loss on tax purpose reduction entry of fixed assets, grant and subsidies
443 442
Settlement package and compensation 5,581 152
Other 2,436 1,797
Total 10,336 2,886
(2) Other expenses
(Millions of yen)
Six months ended
June 30, 2019
Six months ended
June 30, 2020
Impairment losses (Note 1) 349 11,890
Business and plant restructuring expenses (Note 2)
2,746 4,726
Loss on disaster (Note 2) 720 2,244
Loss on retirement of fixed assets 1,612 977
Removal and demolition expenses 788 640
Other 601 1,157
Total 6,814 21,634
(Note 1) The major breakdown of “Impairment losses” is presented in “Impairment of non-financial assets.” (Note 2) The major breakdown of “Business and plant restructuring expenses” and “Loss on disaster” is presented in
“Reconciliation from adjusted operating profit to profit before tax” under Notes to the Condensed Quarterly Consolidated Financial Statements.

Bridgestone Corporation (5108) First half results of fiscal 2020
- 15 -
(Finance income and finance costs)
The breakdown of “Finance income” and “Finance costs” is as follows:
(1) Finance income
(Millions of yen)
Six months ended
June 30, 2019
Six months ended
June 30, 2020
Interest income (Note) 2,897 2,374
Dividend income (Note) 4,402 1,625
Gain on valuation of derivatives 1,174 –
Other – 115
Total 8,473 4,114
(2) Finance costs
(Millions of yen)
Six months ended
June 30, 2019
Six months ended
June 30, 2020
Interest expenses (Note) 8,220 7,452
Net interest of defined benefit plans 2,700 1,976
Loss on valuation of derivatives – 1,847
Foreign exchange loss 3,533 17
Other 1,908 1,675
Total 16,361 12,966
(Note) “Interest income” and “Interest expenses” are in relation to financial assets and financial liabilities measured at amortized cost. In addition, “Dividend income” is in relation to financial assets measured at fair value through other comprehensive income.

Bridgestone Corporation (5108) First half results of fiscal 2020
- 16 -
(Subsequent events)
Not applicable
(First-time adoption of IFRS)
The Group prepared its condensed quarterly consolidated financial statements in accordance with IFRS
from the first quarter of the fiscal year ending December 31, 2020. The most recent consolidated financial
statements prepared in accordance with Japanese GAAP are those for the fiscal year ended December
31, 2019, and the date of transition to IFRS (hereinafter the “transition date”) is January 1, 2019.
(1) Exemption in IFRS 1
IFRS 1 requires, as a general rule, a company adopting IFRS for the first time to apply the provisions
required under IFRS retrospectively. However, IFRS 1 “First-time Adoption of International Financial
Reporting Standards” (hereinafter “IFRS 1”) allows exemptions from retrospective application of some
IFRS requirements on first-time adoption of IFRS. The Group elected to apply the following
exemptions for the transition from Japanese GAAP to IFRS:
1) Business combinations
The Group elected not to apply IFRS 3 “Business Combinations” retrospectively to business
combinations that occurred before the transition date. Consequently, the amount of goodwill
arising from business combinations before the transition date is based on the carrying amount at
the transition date under Japanese GAAP.
Further, the Group performed an impairment test on goodwill at the transition date regardless of
whether there was any indication that the goodwill may be impaired.
2) Exchange differences on translation of foreign operations
The Group elected to deem all cumulative exchange differences on translation of foreign
operations as zero at the transition date.
3) Designation of financial assets recognized prior to the transition date
The Group assessed the classification of financial assets under IFRS 9 “Financial Instruments”
(hereinafter “IFRS 9”) on the basis of facts and circumstances existing at the transition date and
designated some equity financial assets as financial assets measured through other
comprehensive income.
4) Leases
The Group assessed whether a contract existing at the transition date contains a lease on the
basis of facts and circumstances existing at the transition date. The Group measured a lease
liability at the present value of the remaining lease payments, discounted using the lessee’s
incremental borrowing rate at the transition date. In addition, the Group measures, on a lease-by-
lease basis, a right-of-use asset at either: (i) its carrying amount as if IFRS 16 “Leases”
(hereinafter “IFRS 16”) had been applied since the commencement date of lease, but discounted
using the lessee’s incremental borrowing rate at the transition date; or (ii) an amount equal to the
lease liability. Further, the Group expensed the lease payments associated with leases for which
the lease term ends within 12 months of the transition date and leases for which the underlying
asset is of low value.
(2) Mandatory exception under IFRS 1
IFRS 1 prohibits retrospective application of IFRS with respect to “estimates,” “derecognition of
financial assets and financial liabilities,” “hedge accounting,” “non-controlling interests,” “classification
and measurement of financial instruments,” etc. Thus, the Group applied IFRS to these items from the
transition date and onwards.

Bridgestone Corporation (5108) First half results of fiscal 2020
- 17 -
(3) Reconciliations
The reconciliations required to be disclosed at the first-time adoption of IFRS are as follows.
In the reconciliations below, “Reclassification” includes items that do not affect retained earnings and
comprehensive income, while “Differences in recognition and measurement” include items that affect
retained earnings and comprehensive income.
Reconciliations of equity as of January 1, 2019 (transition date) (Millions of yen)
Line items under Japanese GAAP Japanese
GAAP Reclassification
Differences in recognition
and measurement
IFRSs Notes Line items under IFRSs
Assets Assets
Current assets Current assets
Cash and cash equivalents 440,378 (6,462) – 433,916 Cash and cash equivalents
Notes and accounts receivable 603,119 19,091 159,705 781,916 (1) (2) Trade and other receivables
Finished products 406,964 204,240 34,720 645,924 (1) (3) Inventories
Work in process 37,904 (37,904) – – (1)
Raw materials and supplies 171,720 (171,720) – – (1)
Marketable securities 153,853 15,528 (143,514) 25,867 (2) Other financial assets
Other current assets 123,188 (41,916) (2,838) 78,435 (1) Other current assets
Allowance for doubtful accounts (21,729) 21,729 – –
Total current assets 1,915,400 2,586 48,073 1,966,059 Subtotal
– 1,788 – 1,788 Non-current assets held for sale
Total current assets 1,915,400 4,374 48,073 1,967,847 Total current assets
Fixed assets Non-current assets
Property, plant and equipment 1,524,681 (86,526) 76,886 1,515,042 (1) (4) Property, plant and equipment
– 80,087 242,583 322,670 (1) (5) Right-of-use assets
Intangible assets
Goodwill 41,381 – – 41,382 Goodwill
Other intangible fixed assets 48,987 4,137 (3,414) 49,710 Intangible assets
– 47,839 175 48,014 (1) Investments accounted for using equity method
Investments and other assets
Investments in securities 219,970 (7,668) 5,004 217,306 (1) Other financial assets
Long-term loans receivable 11,465 (11,465) – –
Deferred tax assets 65,698 – (8,319) 57,379 (6) Deferred tax assets
Net defined benefit asset 371 (371) – –
Other assets 65,376 (28,859) (3,190) 33,327 Other non-current assets
Allowance for doubtful accounts (1,524) 1,524 – –
Total fixed assets 1,976,407 (1,302) 309,724 2,284,830 Total non-current assets
Total assets 3,891,808 3,072 357,797 4,252,677 Total assets

Bridgestone Corporation (5108) First half results of fiscal 2020
- 18 -
(Millions of yen)
Line items under Japanese GAAP Japanese
GAAP Reclassification
Differences in recognition
and measurement
IFRSs Notes Line items under IFRSs
Liabilities Liabilities
Current liabilities Current liabilities
Notes and accounts payable 233,970 264,236 (1,033) 497,173 (1) Trade and other payables
Short-term debt 100,627 90,955 (27) 191,556 (1) Bonds and borrowings
Commercial paper 20,955 (20,955) – – (1)
Current portion of bonds 70,000 (70,000) – – (1)
Lease obligations 11,495 – 40,601 52,097 (5) Lease liabilities
Income taxes payable 15,073 11,314 9,016 35,404 Income taxes payable
– 24,996 – 24,996 Other financial liabilities
Provision for sales returns 3,531 32,910 (3,362) 33,080 Provisions
Provision for reorganization of R&D and manufacturing base 4,333 (4,333) – –
Accounts payable 186,677 (186,677) – – (1)
Accrued expenses 190,754 (190,754) – – (1)
Other current liabilities 61,215 54,455 7,519 123,190 (1) Other current liabilities
Total current liabilities 898,633 6,147 52,715 957,495 Subtotal
– – – –
Liabilities directly associated with non-current assets held for sale
Total current liabilities 898,633 6,147 52,715 957,495 Total current liabilities
Long-term liabilities Non-current liabilities
Bonds 150,000 (150,000) – – (1)
Long-term debt 38,041 150,000 21,936 209,977 (1) (2) Bonds and borrowings
Lease obligations 68,975 – 202,203 271,179 (5) Lease liabilities
– 11,824 – 11,824 Other financial liabilities
Net defined benefit liability 196,005 7,862 4,061 207,928 Net defined benefit liability
Provision for product warranties 2,999 (2,999) – –
Provision for environmental remediation 1,511 (1,511) – –
Provision for reorganization of R&D and manufacturing base – 23,072 1,141 24,212 Provisions
Deferred tax liabilities 27,723 – 18,890 46,613 (6) Deferred tax liabilities
Other long-term liabilities 73,524 (41,321) (3,126) 29,077 Other non-current liabilities
Total long-term liabilities 558,781 (3,075) 245,104 800,810 Total non-current liabilities
Total liabilities 1,457,414 3,072 297,819 1,758,306 Total liabilities

Bridgestone Corporation (5108) First half results of fiscal 2020
- 19 -
(Millions of yen)
Line items under Japanese GAAP Japanese
GAAP Reclassification
Differences in recognition
and measurement
IFRSs Notes Line items under IFRSs
Equity Equity
Common stock 126,354 – – 126,354 Common stock
Capital surplus 121,997 – – 121,998 Capital surplus
Treasury stock (32,648) – – (32,648) Treasury stock
Net unrealized gain (loss) on available-for-sale securities 108,888 (305,364) 315,291 118,815 (7) Other components of equity
Deferred gain (loss) on derivative instruments 1,730 (1,730) – –
Foreign currency translation adjustments (174,850) 174,850 – –
Remeasurements of defined benefit plans (135,696) 135,696 – –
Stock acquisition rights 3,452 (3,452) – –
Retained earnings 2,360,967 – (255,687) 2,105,280 (7) (8) Retained earnings
2,439,799 Total equity attributable to owners of parent
Non-controlling interests 54,198 – 374 54,572 Non-controlling interests
Total equity 2,434,393 – 59,978 2,494,371 Total equity
Total liabilities and equity 3,891,808 3,072 357,797 4,252,677 Total liabilities and equity

Bridgestone Corporation (5108) First half results of fiscal 2020
- 20 -
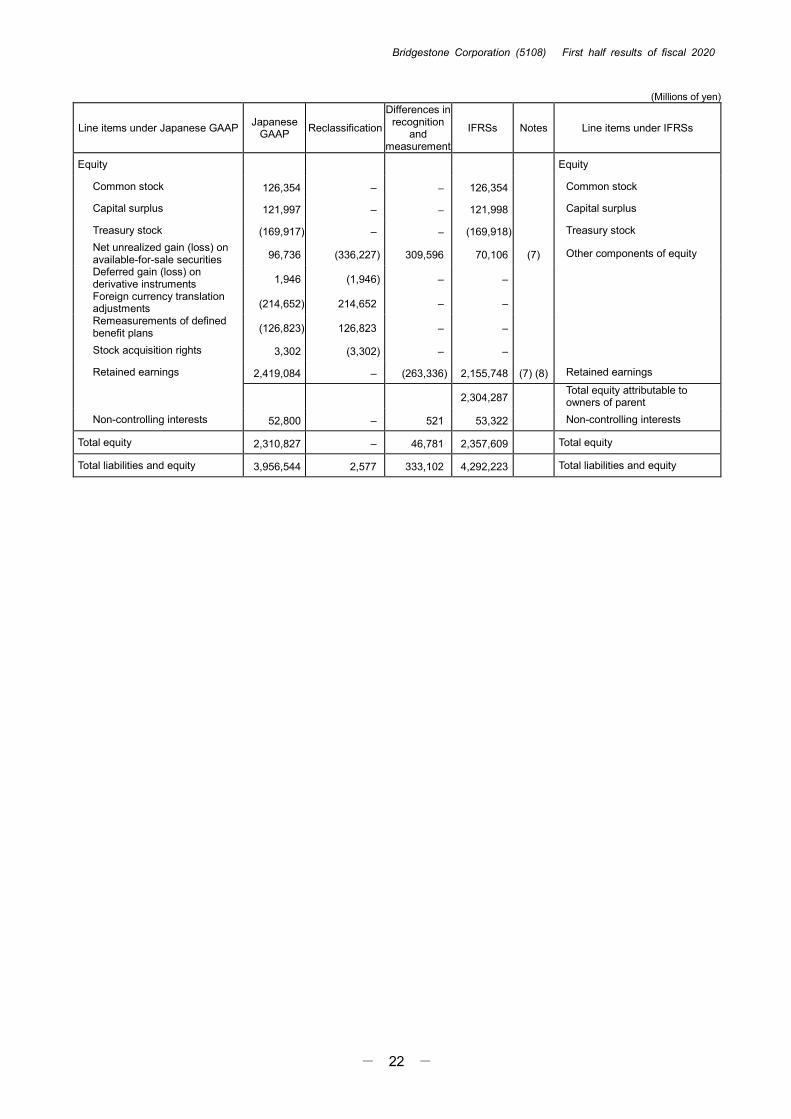
Reconciliations of equity as of the end of the second quarter of the previous fiscal year (June 30,
2019) (Millions of yen)
Line items under Japanese GAAP Japanese
GAAP Reclassification
Differences in recognition
and measurement
IFRSs Notes Line items under IFRSs
Assets Assets
Current assets Current assets
Cash and cash equivalents 434,793 (6,732) – 428,062 Cash and cash equivalents
Notes and accounts receivable 580,694 23,021 160,043 763,759 (1) (2) Trade and other receivables
Finished products 425,512 204,506 25,229 655,247 (1) (3) Inventories
Work in process 39,680 (39,680) – – (1)
Raw materials and supplies 163,228 (163,228) – – (1)
Marketable securities 144,438 13,923 (144,162) 14,200 (2) Other financial assets
Other current assets 134,675 (51,553) (5,639) 77,483 (1) Other current assets
Allowance for doubtful accounts (21,723) 21,723 – –
Total current assets 1,901,299 1,980 35,472 1,938,751 Subtotal
– 14,565 – 14,565 Non-current assets held for sale
Total current assets 1,901,299 16,545 35,472 1,953,317 Total current assets
Fixed assets Non-current assets
Property, plant and equipment 1,496,889 (80,729) 73,243 1,489,404 (1) (4) Property, plant and equipment
– 71,775 230,153 301,928 (1) (5) Right-of-use assets
Intangible assets
Goodwill 92,345 – 3,032 95,377 Goodwill
Other intangible fixed assets 113,269 3,960 (3,286) 113,943 Intangible assets
– 43,750 131 43,881 (1) Investments accounted for using equity method
Investments and other assets
Investments in securities 202,220 (12,556) 4,918 194,582 (1) Other financial assets
Deferred tax assets – 70,997 (7,270) 63,728 (6) Deferred tax assets
Other assets 151,579 (112,223) (3,291) 36,065 Other non-current assets
Allowance for doubtful accounts (1,058) 1,058 – –
Total fixed assets 2,055,245 (13,967) 297,630 2,338,907 Total non-current assets
Total assets 3,956,544 2,577 333,102 4,292,223 Total assets

Bridgestone Corporation (5108) First half results of fiscal 2020
- 21 -
(Millions of yen)
Line items under Japanese GAAP Japanese
GAAP Reclassification
Differences in recognition
and measurement
IFRSs Notes Line items under IFRSs
Liabilities Liabilities
Current liabilities Current liabilities
Notes and accounts payable 221,215 223,517 (4) 444,728 (1) Trade and other payables
Short-term debt 78,676 138,294 – 216,970 (1) Bonds and borrowings
Commercial paper 68,294 (68,294) – – (1)
Current portion of bonds 70,000 (70,000) – – (1)
Lease obligations 11,115 – 42,197 53,313 (5) Lease liabilities
Income taxes payable 26,663 7,703 9,496 43,862 Income taxes payable
– 24,683 – 24,683 Other financial liabilities
Provision for recall 5,310 31,394 (108) 36,597 Provisions
Accounts payable 141,478 (141,478) – – (1)
Other current liabilities 268,978 (142,862) 3,405 129,522 (1) Other current liabilities
Total current liabilities 891,731 2,957 54,987 949,676 Subtotal
– – – –
Liabilities directly associated with non-current assets held for sale
Total current liabilities 891,731 2,957 54,987 949,676 Total current liabilities
Long-term liabilities Non-current liabilities
Bonds 350,000 (350,000) – – (1)
Long-term debt 37,061 350,000 20,826 407,888 (1) (2) Bonds and borrowings
Lease obligations 64,579 – 187,853 252,432 (5) Lease liabilities
– 9,539 – 9,539 Other financial liabilities
Net defined benefit liability 189,242 7,646 9,826 206,715 Net defined benefit liability
– 21,075 1,347 22,422 Provisions
Deferred tax liabilities – 39,372 14,053 53,425 (6) Deferred tax liabilities
Other long-term liabilities 113,102 (78,012) (2,572) 32,518 Other non-current liabilities
Total long-term liabilities 753,986 (380) 231,333 984,939 Total non-current liabilities
Total liabilities 1,645,717 2,577 286,320 1,934,614 Total liabilities
Bridgestone Corporation (5108) First half results of fiscal 2020
- 22 -
(Millions of yen)
Line items under Japanese GAAP Japanese
GAAP Reclassification
Differences in recognition
and measurement
IFRSs Notes Line items under IFRSs
Equity Equity
Common stock 126,354 – – 126,354 Common stock
Capital surplus 121,997 – – 121,998 Capital surplus
Treasury stock (169,917) – – (169,918) Treasury stock
Net unrealized gain (loss) on available-for-sale securities 96,736 (336,227) 309,596 70,106 (7) Other components of equity
Deferred gain (loss) on derivative instruments 1,946 (1,946) – –
Foreign currency translation adjustments (214,652) 214,652 – –
Remeasurements of defined benefit plans (126,823) 126,823 – –
Stock acquisition rights 3,302 (3,302) – –
Retained earnings 2,419,084 – (263,336) 2,155,748 (7) (8) Retained earnings
2,304,287 Total equity attributable to owners of parent
Non-controlling interests 52,800 – 521 53,322 Non-controlling interests
Total equity 2,310,827 – 46,781 2,357,609 Total equity
Total liabilities and equity 3,956,544 2,577 333,102 4,292,223 Total liabilities and equity

Bridgestone Corporation (5108) First half results of fiscal 2020
- 23 -
Reconciliations of equity as of the end of the previous fiscal year (December 31, 2019) (Millions of yen)
Line items under Japanese GAAP Japanese
GAAP Reclassification
Differences in recognition
and measurement
IFRSs Notes Line items under IFRSs
Assets Assets
Current assets Current assets
Cash and cash equivalents 441,255 (8,331) – 432,924 Cash and cash equivalents
Notes and accounts receivable 583,223 22,608 149,513 755,344 (1) (2) Trade and other receivables
Finished products 406,119 190,999 33,044 630,162 (1) (3) Inventories
Work in process 39,360 (39,360) – – (1)
Raw materials and supplies 150,943 (150,943) – – (1)
Marketable securities 136,044 14,107 (135,841) 14,311 (2) Other financial assets
Other current assets 135,496 (51,685) (3,168) 80,643 (1) Other current assets
Allowance for doubtful accounts (21,377) 21,377 – –
Total current assets 1,871,066 (1,228) 43,547 1,913,385 Subtotal
– 5,023 – 5,023 Non-current assets held for sale
Total current assets 1,871,066 3,795 43,547 1,918,408 Total current assets
Fixed assets Non-current assets
Property, plant and equipment 1,562,160 (79,452) 72,461 1,555,170 (1) (4) Property, plant and equipment
– 74,035 224,535 298,569 (1) (5) Right-of-use assets
Intangible assets
Goodwill 91,410 – 6,935 98,346 Goodwill
Other intangible fixed assets 113,639 3,219 (3,195) 113,664 Intangible assets
– 46,873 198 47,071 (1) Investments accounted for using equity method
Investments and other assets
Investments in securities 141,820 (6,065) 4,706 140,462 (1) Other financial assets
Long-term loans receivable 7,980 (7,980) – –
Deferred tax assets 77,081 – (16,371) 60,711 (6) Deferred tax assets
Net defined benefit asset 7,797 (7,797) – –
Other assets 74,686 (25,980) (4,090) 44,616 Other non-current assets
Allowance for doubtful accounts (1,138) 1,138 – –
Total fixed assets 2,075,438 (2,010) 285,180 2,358,608 Total non-current assets
Total assets 3,946,505 1,785 328,727 4,277,016 Total assets

Bridgestone Corporation (5108) First half results of fiscal 2020
- 24 -
(Millions of yen)
Line items under Japanese GAAP Japanese
GAAP Reclassification
Differences in recognition
and measurement
IFRSs Notes Line items under IFRSs
Liabilities Liabilities
Current liabilities Current liabilities
Notes and accounts payable 202,048 250,207 814 453,069 (1) Trade and other payables
Short-term debt 76,745 58,696 – 135,442 (1) Bonds and borrowings
Commercial paper 58,696 (58,696) – – (1)
Lease obligations 12,094 – 40,733 52,827 (5) Lease liabilities
Income taxes payable 40,497 4,209 6,800 51,506 Income taxes payable
– 27,628 – 27,628 Other financial liabilities
Provision for sales returns 3,337 33,789 (2,194) 34,931 Provisions
Provision for recall 4,534 (4,534) – –
Accounts payable 175,562 (175,562) – – (1)
Accrued expenses 193,756 (193,756) – – (1)
Other current liabilities 71,039 60,655 7,286 138,980 (1) Other current liabilities
Total current liabilities 838,312 2,634 53,438 894,383 Subtotal
– 953 – 953
Liabilities directly associated with non-current assets held for sale
Total current liabilities 838,312 3,586 53,438 895,336 Total current liabilities
Long-term liabilities Non-current liabilities
Bonds 350,000 (350,000) – – (1)
Long-term debt 34,249 350,000 21,264 405,514 (1) (2) Bonds and borrowings
Lease obligations 65,673 – 185,011 250,685 (5) Lease liabilities
– 12,937 – 12,937 Other financial liabilities
Net defined benefit liability 201,412 7,001 3,206 211,619 Net defined benefit liability
Provision for product warranties 2,687 (2,687) – –
Provision for environmental remediation 874 (874) – –
– 22,510 838 23,348 Provisions
Deferred tax liabilities 34,977 – 9,266 44,243 (6) Deferred tax liabilities
Other long-term liabilities 74,026 (40,686) (2,485) 30,856 Other non-current liabilities
Total long-term liabilities 763,902 (1,800) 217,100 979,203 Total non-current liabilities
Total liabilities 1,602,215 1,785 270,538 1,874,539 Total liabilities

Bridgestone Corporation (5108) First half results of fiscal 2020
- 25 -
(Millions of yen)
Line items under Japanese GAAP Japanese
GAAP Reclassification
Differences in recognition
and measurement
IFRSs Notes Line items under IFRSs
Equity Equity
Common stock 126,354 – – 126,354 Common stock
Capital surplus 121,997 – – 121,998 Capital surplus
Treasury stock (232,330) – – (232,330) Treasury stock
Net unrealized gain (loss) on available-for-sale securities 55,363 (315,393) 302,691 42,661 (7) Other components of equity
Deferred gain (loss) on derivative instruments (342) 342 – –
Foreign currency translation adjustments (189,271) 189,271 – –
Remeasurements of defined benefit plans (129,054) 129,054 – –
Stock acquisition rights 3,275 (3,275) – –
Retained earnings 2,535,720 – (245,025) 2,290,696 (7) (8) Retained earnings
2,349,378 Total equity attributable to owners of parent
Non-controlling interests 52,576 – 523 53,099 Non-controlling interests
Total equity 2,344,290 – 58,188 2,402,477 Total equity
Total liabilities and equity 3,946,505 1,785 328,727 4,277,016 Total liabilities and equity

Bridgestone Corporation (5108) First half results of fiscal 2020
- 26 -
Notes on reconciliations of equity
(1) Reclassifications
The Group reclassified items between Japanese GAAP and IFRS to comply with provisions of IFRS. The
major reclassifications are as follows:
1) Accounts receivable - other, which were included in and presented as “Other current assets” in
current assets under Japanese GAAP, are reclassified and presented as “Trade and other
receivables” under IFRS.
2) “Finished products,” “Work in process,” and “Raw materials and supplies,” which were separately
presented under Japanese GAAP, are presented in aggregate as “Inventories” under IFRS.
3) Right-of-use assets, which were included in and presented as “Property, plant and equipment” under
Japanese GAAP, are separately presented as “Right-of-use assets” under IFRS.
4) Equity method investments, which were included in and presented as “Investments in securities” in
Fixed assets under Japanese GAAP, are separately presented as “Investments accounted for using
equity method” under IFRS.
5) “Notes and accounts payable,” “Accounts payable,” and “Accrued expenses,” which were separately
presented under Japanese GAAP, are presented as “Trade and other payables” and “Other current
liabilities” under IFRS.
6) “Short-term debt,” “Commercial paper,” and “Current portion of bonds,” which were separately
presented under Japanese GAAP, are presented in aggregate as “Bonds and borrowings” in current
liabilities under IFRS.
7) “Bonds” and “Long-term debt,” which were separately presented under Japanese GAAP, are
presented in aggregate as “Bonds and borrowings” in non-current liabilities under IFRS.
(2) Trade and other receivables
For liquidated receivables that were derecognized and included in and presented as “Marketable
securities” in current assets under Japanese GAAP, those that do not satisfy the derecognition criteria
under IFRS are included in and presented as “Trade and other receivables” in accordance with
provisions of IFRS 9. In addition, liabilities associated with the proceeds from the transfer of such assets
are included in and presented as “Bonds and borrowings” in non-current liabilities.
(3) Inventories
The Group changed the valuation method of “Inventories” from the last-in, first-out method to the moving
average method for the Americas Operations in accordance with provisions of IAS 2 “Inventories”
(hereinafter “IAS 2”).
(4) Property, plant and equipment
Under Japanese GAAP, depreciation of property, plant and equipment of the Company and its domestic
subsidiaries was computed by the declining-balance method, while the straight-line method was applied
to property, plant and equipment of the Company’s overseas subsidiaries. However, under IFRS, the
straight-line method is consistently applied to property, plant and equipment of the entire Group.
(5) Right-of-use assets and lease liabilities
The Group newly recognized right-of-use assets and lease liabilities principally for buildings and land as
a lessee of such leases principally in Japan and the Americas in accordance with provisions of IFRS 16.
(6) Deferred tax assets and deferred tax liabilities
The Group reconciled the amounts of deferred tax assets and deferred tax liabilities principally for the
temporary differences resulting from the reconciliations from Japanese GAAP to IFRS.
(7) Other components of equity
The Group applied the exemption set forth under IFRS 1 and transferred all foreign currency translation
adjustments under Japanese GAAP to retained earnings on the transition date.
Under Japanese GAAP, the Group prorated the amount of remeasurements of net defined benefit liability
(asset) on a straight-line method over a certain number of years within the average remaining service
period of employees when it was incurred, and expensed the prorated amount from the fiscal year
following the year in which it was incurred. However, under IFRS, the Group recognized such amount in
other comprehensive income when it was incurred, and immediately transferred it to retained earnings.

Bridgestone Corporation (5108) First half results of fiscal 2020
- 27 -
(8) Retained earnings
The effect of the reconciliations upon adoption of IFRS on retained earnings is as follows:
As of
January 1, 2019 (Transition date)
As of
June 30, 2019
As of December 31, 2019
Millions of yen Millions of yen Millions of yen
(2) Reconciliation of trade and other receivables (5,745) (4,945) (7,592)
(3) Reconciliation of inventories 34,720 25,229 33,044
(4) Reconciliation of property, plant and equipment 76,886 73,243 72,461
(5) Reconciliation of right-of-use assets and lease
liabilities (221) 103 (1,209)
(7) Reconciliation of exchange differences on
translation of foreign operations (174,850) (174,850) (174,850)
(7) Reconciliation of remeasurements of defined
benefit plans (135,696) (126,823) (129,054)
Other (23,198) (33,449) (11,665)
Subtotal (228,104) (241,492) (218,865)
(6) Reconciliation of tax effects (27,209) (21,323) (25,637)
Reconciliation of non-controlling interests (374) (521) (523)
Total (255,687) (263,336) (245,025)

Bridgestone Corporation (5108) First half results of fiscal 2020
- 28 -
Reconciliations of profit or loss and comprehensive income for the six months ended June 30,
2019 (January 1, 2019 - June 30, 2019)
(Millions of yen)
Line items under Japanese GAAP Japanese
GAAP Reclassification
Differences in recognition
and measurement
IFRSs Notes Line items under IFRSs
Net sales 1,744,662 (9,770) 5,034 1,739,926 Revenue
Cost of sales 1,084,689 (10,485) 18,068 1,092,271 (2) (3) Cost of sales
Gross profit 659,973 715 (13,034) 647,655 Gross profit
Selling, general and administrative expenses 502,411 7,116 (6,802) 502,725
(1) (3)
(4)
Selling, general and administrative expenses
– 10,505 (169) 10,336 (1) Other income
– 6,336 478 6,814 (1) Other expenses
Operating income 157,562 (2,232) (6,879) 148,451 Operating profit
Non-operating income 21,118 (21,118) – – (1)
Non-operating expenses 25,124 (25,124) – – (1)
Ordinary income 153,556 (153,556) – –
Extraordinary income 12,272 (12,272) – – (1)
Extraordinary loss 5,310 (5,310) – – (1)
– 20,257 (11,783) 8,473 (1) (5) Finance income
– 12,175 4,186 16,361 (1) (6) Finance costs
– (2,893) (55) (2,948) (1)
Share of profit (loss) of investments accounted for using equity method
Income before income taxes and non-controlling interests 160,518 – (22,903) 137,615 Profit before tax
Income taxes 38,367 – (3,279) 35,088 (7) Income tax expense
Income before non-controlling interests 122,151 – (19,624) 102,527 Profit
Profit attributable to
Profit attributable to owners of parent 118,353 – (19,650) 98,703 Owners of parent
Profit attributable to non-controlling interests 3,798 – 26 3,824 Non-controlling interests

Bridgestone Corporation (5108) First half results of fiscal 2020
- 29 -
(Millions of yen)
Line items under Japanese GAAP Japanese
GAAP Reclassification
Differences in recognition
and measurement
IFRSs Notes Line items under IFRSs
Income before non-controlling interests 122,151 – (19,624) 102,527 Profit
Other comprehensive income Other comprehensive income
Items that will not be reclassified to profit or loss
Net unrealized gain (loss) on available-for-sale securities (12,152) – 11,796 (356) (7)
Net change in fair value of financial assets measured through other comprehensive income
Remeasurements of defined benefit plans 8,661 – (9,106) (445) (7)
Remeasurements of defined benefit plans
(800) Total of items that will not be reclassified to profit or loss
Items that may be reclassified to profit or loss
Foreign currency translation adjustments (38,516) – 4,021 (34,495)
Exchange differences on translation of foreign operations
Deferred gain (loss) on derivative instruments 407 – – 407
Effective portion of change in fair value of cash flow hedges
Share of other comprehensive income in affiliates (987) – 10 (977)
Share of other comprehensive income of investments accounted for using equity method
(35,065) Total of items that may be reclassified to profit or loss
Total other comprehensive income (42,587) – 6,722 (35,865) Other comprehensive income, net of tax
Comprehensive income 79,564 – (12,902) 66,662 Comprehensive income
Comprehensive income attributable to
Comprehensive income attribute to owners of parent 75,482 – (13,338) 62,144 Owners of parent
Comprehensive income attribute to non-controlling interests 4,082 – 437 4,519 Non-controlling interests

Bridgestone Corporation (5108) First half results of fiscal 2020
- 30 -
Reconciliations of profit or loss and comprehensive income for the fiscal year ended December
31, 2019 (January 1, 2019 - December 31, 2019)
(Millions of yen)
Line items under Japanese GAAP Japanese
GAAP Reclassification
Differences in recognition
and measurement
IFRSs Notes Line items under IFRSs
Net sales 3,525,600 (18,061) (296) 3,507,243 Revenue
Cost of sales 2,201,684 (18,722) (408) 2,182,554 (2) (3) Cost of sales
Gross profit 1,323,916 660 112 1,324,689 Gross profit
Selling, general and administrative
expenses 997,817 13,169 (12,626) 998,360
(1) (3)
(4)
Selling, general and
administrative expenses
– 47,615 (9) 47,606 (1) Other income
– 23,547 1,052 24,599 (1) Other expenses
Operating income 326,098 11,560 11,678 349,336 Operating profit
Non-operating income 28,018 (28,018) – – (1)
Non-operating expenses 37,293 (37,293) – – (1)
Ordinary income 316,823 (316,823) – –
Extraordinary income 116,134 (116,134) – – (1)
Extraordinary loss 25,706 (25,706) – – (1)
– 94,366 (76,617) 17,748 (1) (5) Finance income
– 21,582 6,741 28,324 (1) (6) Finance costs
– (3,190) (61) (3,251) (1)
Share of profit (loss) of
investments accounted for using
equity method
Income before income taxes and
non-controlling interests 407,251 – (71,742) 335,510 Profit before tax
Income taxes 108,303 – (19,085) 89,219 (7) Income tax expense
Income before non-controlling
interests 298,947 – (52,657) 246,291 Profit
Profit attributable to
Profit attributable to owners of
parent 292,598 – (52,487) 240,111 Owners of parent
Profit attributable to non-
controlling interests 6,349 – (170) 6,179 Non-controlling interests

Bridgestone Corporation (5108) First half results of fiscal 2020
- 31 -
(Millions of yen)
Line items under Japanese GAAP Japanese
GAAP Reclassification
Differences in recognition
and measurement
IFRSs Notes Line items under IFRSs
Income before non-controlling
interests 298,947 – (52,657) 246,291 Profit
Other comprehensive income Other comprehensive income
Items that will not be reclassified
to profit or loss
Net unrealized gain (loss) on
available-for-sale securities (53,518) – 59,639 6,121 (7)
Net change in fair value of
financial assets measured
through other comprehensive
income
Remeasurements of defined
benefit plans 6,926 – (4,177) 2,749 (7)
Remeasurements of defined
benefit plans
– (6) (6)
Share of other comprehensive
income of investments
accounted for using equity
method
8,864 Total of items that will not be
reclassified to profit or loss
Items that may be reclassified to
profit or loss
Foreign currency translation
adjustments (11,647) – (4,544) (16,191)
Exchange differences on
translation of foreign operations
Deferred gain (loss) on derivative
instruments (864) – – (864)
Effective portion of change in
fair value of cash flow hedges
Share of other comprehensive
income in affiliates (2,213) – 108 (2,105)
Share of other comprehensive
income of investments
accounted for using equity
method
(19,159) Total of items that may be
reclassified to profit or loss
Total other comprehensive income (61,317) – 51,022 (10,295) Other comprehensive income, net
of tax
Comprehensive income 237,629 – (1,634) 235,995 Comprehensive income
Comprehensive income
attributable to
Comprehensive income attribute
to owners of parent 229,223 – (1,706) 227,517 Owners of parent
Comprehensive income attribute
to non-controlling interests 8,406 – 72 8,478 Non-controlling interests

Bridgestone Corporation (5108) First half results of fiscal 2020
- 32 -
Notes on reconciliations of profit or loss and comprehensive income
(1) Reclassifications
Items presented in “Non-operating income,” “Non-operating expenses,” “Extraordinary income,” and
“Extraordinary losses” under Japanese GAAP are reclassified as follows under IFRS: Items of financial
profit or loss are presented as “Finance income” or “Finance costs,” respectively, and the other items are
presented as “Selling, general and administrative expenses,” “Other income,” “Other expenses,” or
“Share of profit (loss) of investments accounted for using equity method.”
(2) Cost of sales
The Group reconciled “Cost of sales” since it changed the valuation method of “Inventories” from the last-
in, first-out method to the moving average method for the Americas Operations in accordance with
provisions of IAS 2.
(3) Cost of sales and selling, general and administrative expenses
Under Japanese GAAP, depreciation of property, plant and equipment of the Company and its domestic
subsidiaries was computed by the declining-balance method, while the straight-line method was applied
to property, plant and equipment of the Company’s overseas subsidiaries. However, under IFRS, the
straight-line method is consistently applied to property, plant and equipment of the Group. Due to this
change, the Group reconciled “Cost of sales” and “Selling, general and administrative expenses” that
include depreciation.
(4) Selling, general and administrative expenses
Under Japanese GAAP, goodwill was amortized on a straight-line method over the period for which
goodwill is expected to have an effect. However, under IFRS, the Group discontinued the amortization of
goodwill on and after the transition date.
(5) Finance income
Under Japanese GAAP, the Group recognized gain or loss on sales of equity instruments in profit or loss.
However, under IFRS, the Group recognized any change in fair value as other comprehensive income for
equity instruments designated as those measured at fair value through other comprehensive income, and
reconciled “Finance income” in order to transfer the change to retained earnings immediately when the
equity instruments are sold.
(6) Finance costs
Under Japanese GAAP, the Group calculated the interest cost by multiplying the defined benefit
obligations by the discount rate and the expected return on plan assets by multiplying the plan assets by
the expected rate of return on plan assets to recognize them as retirement benefit expenses. However,
under IFRS, the Group reconciled “Finance costs” as it recognized net interest by multiplying the defined
benefit obligation net of plan assets by the discount rate.
(7) Income tax expense and other comprehensive income
For gain or loss on sales of equity instruments recognized in profit or loss and income taxes on such gain
under Japanese GAAP, the Group reconciled “Income tax expense” and “Net change in fair value of
financial assets measured through other comprehensive income” since it did not recognize gain or loss
on sales of certain equity instruments designated as financial assets measured at fair value through other
comprehensive income in profit or loss under IFRS.
In addition, under Japanese GAAP, the Group prorated the amount of remeasurements of net defined
benefit liability (asset) on a straight-line method over a certain number of years within the average

Bridgestone Corporation (5108) First half results of fiscal 2020
- 33 -
remaining service period of employees when it was incurred, and recognized the prorated amount in
profit or loss from the fiscal year following the year in which it was incurred. However, under IFRS, the
Group recognized such amount in other comprehensive income when it was incurred, and reconciled
“Remeasurements of defined benefit plans” in order to transfer such amount to “Retained earnings”
immediately.
Reconciliations of cash flows for the six months ended June 30, 2019 (from January 1, 2019 to June 30,
2019) and the fiscal year ended December 31, 2019 (from January 1, 2019 to December 31, 2019)
The major difference between the consolidated statement of cash flows disclosed in accordance with the
Japanese GAAP and the consolidated statement of cash flows disclosed under IFRS is that “Lease
payments associated with operating leases” previously included in “Cash flows from operating activities”
are now included in “Cash flows from financing activities” as “Repayments of lease liabilities” due to the
application of IFRS 16. As a result, in the six months ended June 30, 2019, net cash provided by operating
activities increased by ¥20,873 million, and net cash used in financing activities increased by ¥20,873
million. Also, in the fiscal year ended December 31, 2019, net cash provided by operating activities
increased by ¥41,914 million, and net cash used in financing activities increased by ¥41,914 million.