consolidated financial statements eeiieiei1/2
TRANSCRIPT

GROUP CONSOLIDATED REPORTING
DEPARTMENT
EEIIEIEI1
/2
CONSOLIDATED FINANCIAL STATEMENTS
DECEMBER 31, 2013

COMPAGNIE DE SAINT-GOBAIN STATUTORY AUDITORS’ REPORT ON THE CONSOLIDATED FINANCIAL STATEMENTS Year ended December 31, 2013
The Statutory Auditors
PricewaterhouseCoopers Audit Crystal Park 63, rue de Villiers 92208 Neuilly-sur-Seine Cedex
KPMG Audit Immeuble KPMG 1, cours Valmy 92923 Paris La Défense
PricewaterhouseCoopers Audit Crystal Park 63, rue de Villiers 92208 Neuilly-sur-Seine Cedex
KPMG Audit Immeuble KPMG 1, cours Valmy 92923 Paris La Défense
STATUTORY AUDITORS' REPORT ON THE CONSOLIDATED FINANCIAL STATEMENTS Year ended December 31, 2013
This is a free translation into English of the Statutory Auditors’ report issued in French and is provided solely for the convenience of English speaking users. The Statutory Auditors’ report includes information specifically required by French law in such reports, whether modified or not. This information is presented below the audit opinion on the consolidated financial statements and includes an explanatory paragraph discussing the Auditors’ assessments of certain significant accounting and auditing matters. These assessments were considered for the purpose of issuing an audit opinion on the consolidated financial statements taken as a whole and not to provide separate assurance on individual account balances, transactions, or disclosures.
This report also includes information relating to the specific verification of information given in the Group’s management report and in the documents addressed to shareholders.
This report should be read in conjunction with, and construed in accordance with, French law and professional auditing standards applicable in France.
Compagnie de Saint-Gobain S.A. Les Miroirs 18, avenue d'Alsace 92400 Courbevoie
To the Shareholders,
In compliance with the assignment entrusted to us by your Annual General Meeting, we hereby report to you, for the year ended December 31, 2013, on:
the audit of the accompanying consolidated financial statements of Compagnie de Saint-Gobain;
the justification of our assessments;
the specific verification required by law.
These consolidated financial statements have been approved by the Board of Directors. Our role is to express an opinion on these consolidated financial statements based on our audit.

COMPAGNIE DE SAINT-GOBAIN STATUTORY AUDITORS’ REPORT ON THE CONSOLIDATED FINANCIAL STATEMENTS Year ended December 31, 2013 Page 3
I - Opinion on the consolidated financial statements
We conducted our audit in accordance with professional standards applicable in France; those standards require that we plan and perform the audit to obtain reasonable assurance about whether the consolidated financial statements are free of material misstatement. An audit involves performing procedures, using sampling techniques or other methods of selection, to obtain audit evidence about the amounts and disclosures in the consolidated financial statements. An audit also includes evaluating the appropriateness of accounting policies used and the reasonableness of accounting estimates made, as well as the overall presentation of the consolidated financial statements. We believe that the audit evidence we have obtained is sufficient and appropriate to provide a basis for our audit opinion.
In our opinion, the consolidated financial statements give a true and fair view of the assets and liabilities and of the financial position of the Group at December 31, 2013 and of the results of its operations for the year then ended in accordance with International Financial Reporting Standards as adopted by the European Union.
Without qualifying our opinion, we draw your attention to the Note 4 of the consolidated financial statements which describes the impact of the adoption of IAS 19 revised – method for recognizing employee benefits - at January 1st 2013.
II - Justification of our assessments
In accordance with the requirements of article L.823-9 of the French Commercial Code (Code de Commerce) relating to the justification of our assessments, we bring to your attention the following matters:
Measurement of property, plant and equipment and intangible assets
The Group regularly carries out impairment tests on its property, plant and equipment, goodwill and other intangible assets, and also assesses whether there is any indication of impairment of property, plant and equipment and amortizable intangible assets, based on the methods described in Note 1 to the consolidated financial statements (“Impairment of property, plant and equipment, intangible assets and goodwill”). We examined the methods applied in implementing these tests and the estimates and assumptions used, and we verified that the information disclosed in Note 1 to the consolidated financial statements is appropriate.

COMPAGNIE DE SAINT-GOBAIN STATUTORY AUDITORS’ REPORT ON THE CONSOLIDATED FINANCIAL STATEMENTS Year ended December 31, 2013 Page 4
Employee benefits
The methods applied for assessing employee benefits are set out in Note 1 to the consolidated financial statements (“Employee benefits – defined benefit plans”). These benefit obligations were reviewed by independent actuaries. Our work consisted of assessing the data and assumptions used, examining, on a test basis, the calculations performed and verifying that the information disclosed in Notes 1 and 16 to the consolidated financial statements is appropriate.
Provisions
As specified in Note 1 to the consolidated financial statements (“Other current and non-current liabilities and provisions”), the Group books provisions to cover risks. The nature of the provisions recorded under “Other current and non-current liabilities and provisions” are described in Note 18 to the consolidated financial statements. Based on the information available at the time of our audit, we ensured that the methods and data used to determine provisions, particularly relating to the European Commission’s decision concerning the automotive glass industry, as well as the disclosures regarding said provisions provided in the notes to the consolidated financial statements, are appropriate.
These assessments were made as part of our audit of the consolidated financial statements taken as a whole, and therefore contributed to the opinion we formed which is expressed in the first part of this report.
III - Specific verification As required by law, we have also verified in accordance with professional standards applicable in France the information presented in the Group’s management report. We have no matters to report as to its fair presentation and its consistency with the consolidated financial statements. Neuilly-sur-Seine and Paris La Défense, February 19, 2014
The Statutory Auditors
PricewaterhouseCoopers Audit
Pierre Coll Jean-Christophe Georghiou
KPMG Audit Department of KPMG S.A.
Jean-Paul Thill Philippe Grandclerc

Saint-Gobain Group Consolidated Financial Statements
2
CONSOLIDATED BALANCE SHEET
(in EUR millions)
Notes
Dec. 31, 2013 Dec. 31, 2012
restated*
ASSETSGoodwill (5) 10,413 10,936
Other intangible assets (6) 3,131 3,196
Property, plant and equipment (7) 12,635 13,696
Investments in associates (8) 216 206
Deferred tax assets (17) 1,125 1,247
Other non-current assets (9) 407 359
Non-current assets 27,927 29,640
Inventories (10) 5,997 6,133
Trade accounts receivable (11) 4,882 5,017
Current tax receivable (17) 238 204
Other receivables (11) 1,317 1,425
Assets held for sale (3) 974 936
Cash and cash equivalents (21) 4,391 4,179
Current assets 17,799 17,894
Total Assets 45,726 47,534
EQUITY AND LIABILITIESCapital stock (12) 2,221 2,125
Additional paid-in capital and legal reserve 6,265 5,699
Retained earnings and net income for the year 10,661 10,313
Cumulative translation adjustments (1,481) (523)
Fair value reserves 7 (15)
Treasury stock (12) (147) (181)
Shareholders' equity 17,526 17,418
Minority interests 344 412
Total equity 17,870 17,830
Long-term debt (21) 9,395 9,588
Provisions for pensions and other employee benefits (16) 2,785 3,470
Deferred tax liabilities (17) 712 792
Other non-current liabilities and provisions (18) 2,189 2,197
Non-current liabilities 15,081 16,047
Current portion of long-term debt (21) 1,721 1,732
Current portion of other liabilities (18) 479 458
Trade accounts payable (19) 5,928 6,143
Current tax liabilities (17) 67 70
Other payables and accrued expenses (19) 3,311 3,408
Liabilities held for sale (3) 473 497
Short-term debt and bank overdrafts (21) 796 1,349
Current liabilities 12,775 13,657
Total Equity and Liabilities 45,726 47,534
*The restatements are explained in Note 4.
The accompanying notes are an integral part of the consolidated financial statements.

Saint-Gobain Group Consolidated Financial Statements
3
CONSOLIDATED INCOME STATEMENT
(in EUR millions)Notes 2013 2012 restated*
Net sales (34) 42,025 43,198
Cost of sales (24) (31,996) (33,046)
Selling, general and administrative expenses including research (24) (7,265) (7,289)
Operating income 2,764 2,863
Other business income (24) 186 116
Other business expense (24) (1,059) (1,013)
Business income 1,891 1,966
Borrowing costs, gross (592) (627)
Income from cash and cash equivalents 33 40
Borrowing costs, net (559) (587)
Other financial income and expense (25) (236) (225)
Net financial expense (795) (812)
Share in net income of associates (8) 11 12
Income taxes (17) (476) (443)
Net income 631 723
Attributable to equity holders of the parent 595 693 Minority interests 36 30
Earnings per share (in EUR )
Weighted average number of shares in issue 538,912,431 526,399,944
Basic earnings per share (27) 1.10 1.32
Weighted average number of shares assuming full dilution 541,984,225 528,692,847
Diluted earnings per share (27) 1.10 1.31
*The restatements are explained in Note 4.
The accompanying notes are an integral part of the consolidated financial statements.

Saint-Gobain Group Consolidated Financial Statements
4
CONSOLIDATED STATEMENT OF RECOGNIZED INCOME AND EXP ENSE
(in EUR millions)
2013 2012 restated*
Net income 631 723Items that may be subsequently reclassified to profit or loss
Translation adjustments (1,018) (65)Changes in fair value 22 7Tax on items that may be subsequently reclassified to profit or loss (28) (24)
Items that will not be reclassified to profit or loss
Changes in actuarial gains and losses 696 (834)Tax on items that will not be reclassified to profit or loss (260) 267
Income and expense recognized directly in equity (588) (649)
Total recognized income and expense for the year 43 74
Attributable to equity holders of the parent 67 63Minority interests (24) 11
*The restatements are explained in Note 4.
The accompanying notes are an integral part of the consolidated financial statements.

Saint-Gobain Group Consolidated Financial Statements
5
CONSOLIDATED STATEMENT OF CASH FLOWS
(in EUR millions)Notes 2013 2012 restated*
Net income attributable to equity holders of the parent 595 693
Minority interests in net income (a) 36 30
Share in net income of associates, net of dividends received (8) (3) (6)
Depreciation, amortization and impairment of assets (24) 1,897 1,988
Gains and losses on disposals of assets (24) (99) (60)
Unrealized gains and losses arising from changes in fair value and share-based payments 34 (23)
Changes in inventories (10) (135) 252
Changes in trade accounts receivable and payable, and other accounts receivable and payable (11)(19) 22 429
Changes in tax receivable and payable (17) (8) (118)
Changes in deferred taxes and provisions for other liabilities and charges (16)(17)(18) (153) (623)
Net cash from operating activities 2,186 2,562
Purchases of property, plant and equipment [2013: (1,354), 2012: (1,773)] and intangible assets(6)(7)
(1,456) (1,883)
Increase (decrease) in amounts due to suppliers of fixed assets (19) (12) (67)
Acquisitions of shares in consolidated companies [2013: (63), 2012: (338)], net of cash acquired (2) (60) (323)
Acquisitions of other investments (9) (37) (15)
Increase in investment-related liabilities (18) 6 46
Decrease in investment-related liabilities (18) (3) (8)
Investments (1,562) (2,250)Disposals of property, plant and equipment and intangible assets (6)(7) 191 83
Disposals of shares in consolidated companies, net of cash divested (2) 152 81
Disposals of other investments (9) 0 1
Divestments 343 165Increase in loans and deposits (9) (54) (85)
Decrease in loans and deposits (9) 42 58
Changes in loans and deposits (12) (27)
Net cash from (used in) investing activities (1,231) (2,112)
Issues of capital stock (a) 662 127
(Increase) decrease in treasury stock (a) 31 (162)
Dividends paid (a) (654) (646)
Transactions with shareholders of parent company 39 (681)Minority interests’ share in capital increases of subsidiaries 4 13
Acquisitions of minority interests without gain of control 0 (1)
Disposals of minority interests without loss of control 13 5
Changes in investment related liabilities following the exercise of put options of minority 0 (69)Dividends paid to minority shareholders of consolidated subsidiaries and increase (decrease) in dividends payable (61) (55)
Transactions with minority interests (44) (107)Increase (decrease) in bank overdrafts and other short-term debt (576) 296
Increase in long-term debt (b) 1,479 2,808
Decrease in long-term debt (b) (1,562) (1,515)
Changes in gross debt (659) 1,589
Net cash from (used in) financing activities (664) 801
Increase (decrease) in cash and cash equivalents 291 1,251
Net effect of exchange rate changes on cash and cash equivalents (80) (16)
Net effect from changes in fair value on cash and cash equivalents 0 (4)
Cash and cash equivalents classified as assets held for sale (3) 1 (1)
Cash and cash equivalents at beginning of year 4,179 2,949Cash and cash equivalents at end of year 4,391 4,179 *The restatements are explained in Note 4.
(a) Refer to the consolidated statement of changes in equity.
(b) Including bond premiums, prepaid interest and issue costs.
Income tax paid amounted to €630 million in 2013 (2012: €730 million). Interest paid net of interest received amounted to €558 million (2012: €571 million).
The accompanying notes are an integral part of the consolidated financial statements.

Saint-Gobain Group Consolidated Financial Statements
6
CONSOLIDATED STATEMENT OF CHANGES IN EQUITY
Issued Outstanding (excluding
treasury stock)
Capital stock
Additional paid-in
capital and legal
reserve
Retained earnings and net income for the
year
Cumulative translation
adjustments
Fair value reserves
Treasury stock
Share-holders'
equity
Minority interests
Total equity
At January 1, 2012 published 535,563,723 526,205,696 2,142 5,920 10,654 (476) (22) (403) 17,815 403 18,218
Restatements* (10) (10) (10)
At January 1, 2012 restated* 535,563,723 526,205,696 2,142 5,920 10,644 (476) (22) (403) 17,805 403 18,208
Income and expenses recognized directly in equity 0 0 (590) (47) 7 0 (630) (19) (649)
Net income for the year 693 693 30 723 Total recognized income and expense for the year 0 0 103 (47) 7 0 63 11 74
Issues of capital stock
Group Savings Plan 4,387,680 4,387,680 18 107 125 125 Stock option plans 714,239 714,239 3 (1) 2 2
Other 0 13 13 Dividends paid (EUR 1.24 per share) (646) (646) (54) (700)
Treasury stock purchased (8,727,221) (280) (280) (280)
Treasury stock sold 3,854,183 (19) 137 118 118
Treasury stock canceled (9,540,000) (38) (327) 365 0 0
Forward purchases of treasury stock 197 197 197
Share-based payments 14 14 14
Changes in Group structure 20 20 39 59
At December 31, 2012 restated* 531,125,642 526,434,577 2,125 5,699 10,313 (523) (15) (181) 17,418 412 17,830
Income and expenses recognized directly in equity 0 0 408 (958) 22 0 (528) (60) (588)
Net income for the year 595 595 36 631 Total recognized income and expense for the year 0 0 1,003 (958) 22 0 67 (24) 43
Issues of capital stock
Group Savings Plan 4,499,142 4,499,142 18 93 111 111 Stock option plans 2,685,835 2,685,835 11 67 78 78 Dividends 16,866,171 16,866,171 67 406 473 473 Other 0 4 4
Dividends paid (EUR 1.24 per share) (654) (654) (60) (714)
Treasury stock purchased (1,799,334) (63) (63) (63)
Treasury stock sold 2,731,226 (3) 97 94 94
Share-based payments 14 14 14
Changes in Group structure (12) (12) 12 0
At December 31, 2013 555,176,790 551,417,617 2,221 6,265 10,661 (1,481) 7 (147) 17,526 344 17,870
(Number of shares) (in EUR millions)
* The restatements are explained in Note 4.
The accompanying notes are an integral part of the consolidated financial statements.

Saint-Gobain Group Consolidated Financial Statements
7
NOTES TO THE CONSOLIDATED FINANCIAL STATEMENTS
NOTE 1 - ACCOUNTING PRINCIPLES AND POLICIES BASIS OF PREPARATION The consolidated financial statements of Compagnie de Saint-Gobain and its subsidiaries (“the Group”) have been prepared in accordance with the International Financial Reporting Standards (IFRS) adopted for use in the European Union at December 31, 2013. With the exception of IFRS 10, 11 and 12, these consolidated financial statements have been prepared in accordance with the IFRS issued by the International Accounting Standards Board (IASB). The accounting policies applied are consistent with those used to prepare the financial statements for the year ended December 31, 2012, except for the application of the new standards and interpretations described below. The consolidated financial statements have been prepared using the historical cost convention, except for certain assets and liabilities that have been measured using the fair value model as explained in these notes. The standards, interpretations and amendments to published standards applicable for the first time in 2013 (see the table below) do not have a material impact on the Group’s consolidated financial statements, with the exception of the amendment to IAS 19 concerning employee benefits. The impact of this amendment is discussed in Note 4.The comparative information for 2012 included in these notes has been restated on the same basis. The Group has not early adopted any new standards, interpretations or amendments to published standards that are applicable for accounting periods beginning on or after January 1, 2014 (see the table below). Application of IFRS 10 – Consolidated Financial Statements and IFRS 11 – Joint Arrangements would have the effect of reducing consolidated revenue by 0.6%. These consolidated financial statements were adopted by the Board of Directors on February 20, 2014 and will be submitted to the Shareholders’ Meeting for approval. They are presented in millions of euros. ESTIMATES AND ASSUMPTIONS The preparation of consolidated financial statements in compliance with IFRS requires management to make estimates and assumptions that affect the reported amounts of assets and liabilities and the disclosure of contingent assets and liabilities at the date of the financial statements, as well as the reported amounts of income and expenses during the period. These estimates and assumptions are based on past experience and on various other factors in the prevailing deteriorated economic and financial environment, which makes it difficult to predict future business performance. Actual amounts may differ from those obtained through the use of these estimates and assumptions. The main estimates and assumptions described in these notes concern asset impairment tests (Note 1), share-based payments (Notes 13, 14 and 15), the measurement of employee benefit obligations (Note 16), deferred taxes (Note 17), provisions for other liabilities and charges (Note 18) and financial instruments (Note 22).
Saint-Gobain Group Consolidated Financial Statements
8
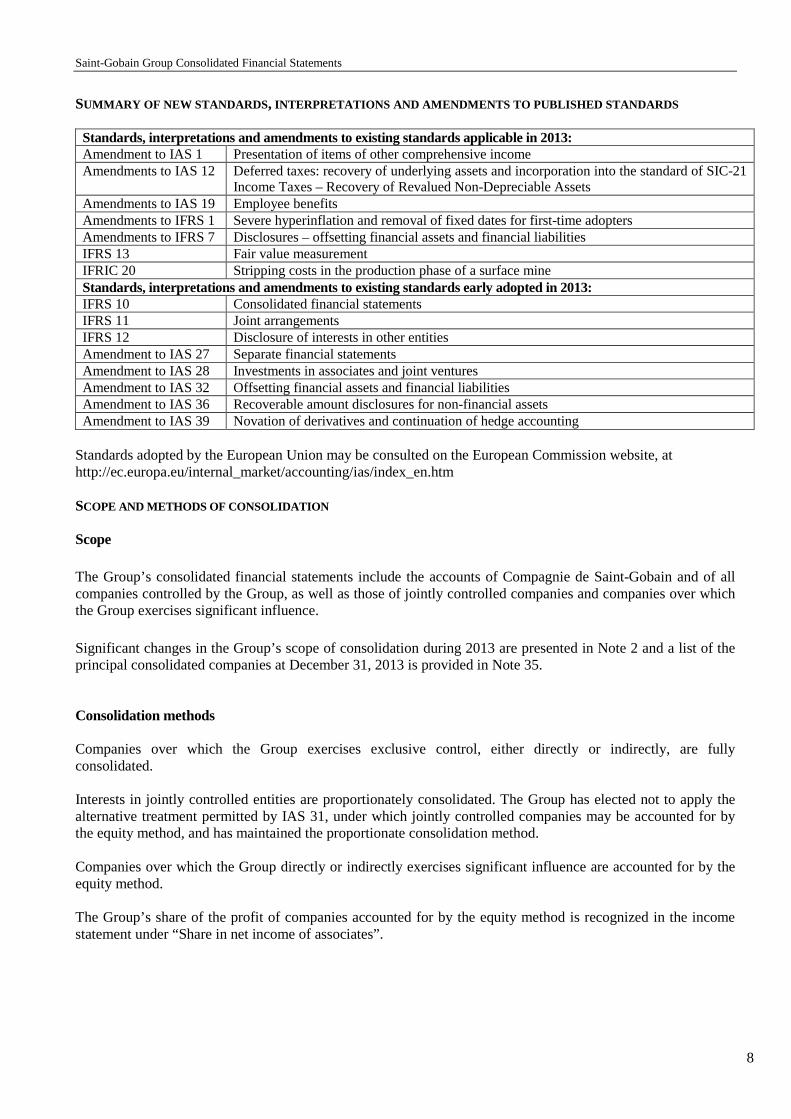
SUMMARY OF NEW STANDARDS , INTERPRETATIONS AND AMENDMENTS TO PUBLISHED STANDARDS Standards, interpretations and amendments to existing standards applicable in 2013: Amendment to IAS 1 Presentation of items of other comprehensive income Amendments to IAS 12 Deferred taxes: recovery of underlying assets and incorporation into the standard of SIC-21
Income Taxes – Recovery of Revalued Non-Depreciable Assets Amendments to IAS 19 Employee benefits Amendments to IFRS 1 Severe hyperinflation and removal of fixed dates for first-time adopters Amendments to IFRS 7 Disclosures – offsetting financial assets and financial liabilities IFRS 13 Fair value measurement IFRIC 20 Stripping costs in the production phase of a surface mine Standards, interpretations and amendments to existing standards early adopted in 2013: IFRS 10 Consolidated financial statements IFRS 11 Joint arrangements IFRS 12 Disclosure of interests in other entities Amendment to IAS 27 Separate financial statements Amendment to IAS 28 Investments in associates and joint ventures Amendment to IAS 32 Offsetting financial assets and financial liabilities Amendment to IAS 36 Recoverable amount disclosures for non-financial assets Amendment to IAS 39 Novation of derivatives and continuation of hedge accounting
Standards adopted by the European Union may be consulted on the European Commission website, at http://ec.europa.eu/internal_market/accounting/ias/index_en.htm SCOPE AND METHODS OF CONSOLIDATION Scope
The Group’s consolidated financial statements include the accounts of Compagnie de Saint-Gobain and of all companies controlled by the Group, as well as those of jointly controlled companies and companies over which the Group exercises significant influence.
Significant changes in the Group’s scope of consolidation during 2013 are presented in Note 2 and a list of the principal consolidated companies at December 31, 2013 is provided in Note 35. Consolidation methods Companies over which the Group exercises exclusive control, either directly or indirectly, are fully consolidated. Interests in jointly controlled entities are proportionately consolidated. The Group has elected not to apply the alternative treatment permitted by IAS 31, under which jointly controlled companies may be accounted for by the equity method, and has maintained the proportionate consolidation method. Companies over which the Group directly or indirectly exercises significant influence are accounted for by the equity method. The Group’s share of the profit of companies accounted for by the equity method is recognized in the income statement under “Share in net income of associates”.

Saint-Gobain Group Consolidated Financial Statements
9
Business combinations The Group has applied IFRS 3R and IAS 27A on a prospective basis starting from January 1, 2010. As a result, business combinations completed prior to that date are recognized in accordance with the previous versions of IFRS 3 and IAS 27.
� Goodwill When an entity is acquired by the Group, the identifiable assets and assumed liabilities of the entity are recognized at their fair value. Any adjustments to provisional values as a result of completing the initial accounting are recognized within 12 months and retrospectively at the acquisition date. The final acquisition price (referred to as “consideration transferred” in IFRS 3R), including the estimated fair value of any earn-out payments or other deferred consideration (referred to as “contingent consideration”), is determined in the 12 months following the acquisition. Under IFRS 3R, any adjustments to the acquisition price beyond this 12-month period are recorded in the income statement. Since January 1, 2010, all costs directly attributable to the business combination, i.e. costs that the acquirer incurs to effect a business combination such as professional fees paid to investment banks, attorneys, auditors, independent valuers and other consultants, are no longer capitalized as part of the cost of the business combination, but are recognized as expenses as incurred. In addition, since January 1, 2010, goodwill is recognized only at the date that control is achieved (or joint control is achieved in the case of proportionately consolidated companies or significant influence is obtained in the case of entities accounted for by the equity method). Any subsequent increase in ownership interest is recorded as a change in equity attributable to the equity holders of the parent without adjusting goodwill. Goodwill is recorded in the consolidated balance sheet as the difference between the acquisition-date fair value of (i) the consideration transferred plus the amount of any minority interests and (ii) the identifiable net assets of the acquiree. Minority interests are measured either as their proportionate interest in the net identifiable assets (partial goodwill method) or at their fair value at the acquisition date (full goodwill method). As the Group generally applies the partial goodwill method, goodwill calculated by the full goodwill method is not material. Goodwill represents the excess of the cost of an acquisition over the fair value of the Group’s share of the assets and liabilities of the acquired entity. If the cost of the acquisition is less than the fair value of the net assets and liabilities acquired, the difference is recognized directly in the income statement.
� Step acquisitions and partial disposals When the Group acquires control of an entity in which it already held an equity interest, the transaction is treated as a step acquisition (an acquisition in stages), as follows: (i) as a disposal of the previously-held interest, with recognition of any gain or loss in the consolidated financial statements, and (ii) as an acquisition of the entire interest, with recognition of the corresponding goodwill (on both the old and new acquisitions). When the Group disposes of part of an equity interest, leading to the loss of control (with a minority interest retained), the transaction is also treated as both a disposal and an acquisition, as follows: (i) as a disposal of the entire interest, with recognition of any gain or loss in the consolidated financial statements, and (ii) as an acquisition of the retained non-controlling (minority) interest, measured at fair value.

Saint-Gobain Group Consolidated Financial Statements
10
� Potential voting rights and share purchase commitments Potential voting rights conferred by call options on minority interests (non-controlling interests) are taken into account in determining whether the Group exclusively controls an entity only when the options are currently exercisable. When calculating its percentage interest in controlled companies, the Group considers the impact of cross put and call options on minority interests in the companies concerned. This approach gives rise to the recognition in the financial statements of an investment-related liability (included within “Other liabilities”) corresponding to the present value of the estimated exercise price of the put option, with a corresponding reduction in minority interests and equity attributable to equity holders of the parent. Any subsequent changes in the fair value of the liability are recognized by adjusting equity.
� Minority interests Up to December 31, 2009, transactions with minority interests were treated in the same way as transactions with parties external to the Group. As from January 1, 2010, changes in minority interests (referred to as “non-controlling interests” in IFRS 3R) are accounted for as equity transactions between two categories of owners of a single economic entity in accordance with IAS 27A. As a result, they are recorded in the statement of changes in equity and have no impact on the income statement or balance sheet, except for changes in cash and cash equivalents. Non-current assets and liabilities held for sale – Discontinued operations Assets and liabilities that are immediately available for sale and for which a sale is highly probable are classified as non-current assets and liabilities held for sale. When several assets are held for sale in a single transaction, they are accounted for as a disposal group, which also includes any liabilities directly associated with those assets. The assets or disposal groups held for sale are measured at the lower of carrying amount and fair value less costs to sell. Depreciation ceases when non-current assets or disposal groups are classified as held for sale. When the assets held for sale are consolidated companies, deferred tax is recognized on the difference between the consolidated carrying amount of the shares and their tax basis, in accordance with IAS 12. Non-current assets and liabilities held for sale are presented separately on the face of the consolidated balance sheet, and income and expenses continue to be recognized in the consolidated income statement on a line-by-line basis. Income and expenses arising on discontinued operations are recorded as a single amount on the face of the consolidated income statement. At each balance sheet date, the value of the assets and liabilities is reviewed to determine whether any provision adjustments should be recorded due to a change in their fair value less costs to sell. Intragroup transactions All intragroup balances and transactions are eliminated in consolidation. Translation of the financial statements of foreign companies The consolidated financial statements are presented in euros, which is Compagnie de Saint-Gobain’s functional and presentation currency.

Saint-Gobain Group Consolidated Financial Statements
11
Assets and liabilities of subsidiaries outside the euro zone are translated into euros at the closing exchange rate and income and expense items are translated using the average exchange rate for the period, except in the case of significant exchange rate volatility. The Group’s share of any translation gains or losses is included in equity under “Cumulative translation adjustments” until the foreign operations to which they relate are sold or liquidated, at which time they are taken to the income statement, if the transaction results in a loss of control, or recognized directly in the statement of changes in equity, if the change in ownership interest does not result in a loss of control. Foreign currency transactions Foreign currency transactions are translated into the Company’s functional currency using the exchange rates prevailing at the transaction date. Assets and liabilities denominated in foreign currencies are translated at the closing rate and any exchange differences are recorded in the income statement. As an exception to this principle, exchange differences relating to loans and borrowings between Group companies are recorded, net of tax, in equity under “Cumulative translation adjustments”, as in substance they are an integral part of the net investment in a foreign subsidiary. BALANCE SHEET ITEMS Goodwill See the section above on “Business combinations”. Other intangible assets Other intangible assets primarily include patents, brands, software and development costs. They are measured at historical cost less accumulated amortization and impairment. Acquired retail brands and certain manufacturing brands are treated as intangible assets with indefinite useful lives as they have a strong national and/or international reputation. These brands are not amortized but are tested for impairment on an annual basis. Other brands are amortized over their useful lives, not to exceed 40 years. Costs incurred to develop software in-house – primarily configuration, programming and testing costs – are recognized as intangible assets. Patents and purchased computer software are amortized over their estimated useful lives, not exceeding 20 years for patents and three to five years for software. Research costs are expensed as incurred. Development costs meeting the recognition criteria under IAS 38 are included in intangible assets and amortized over their estimated useful lives (not to exceed five years) from the date when the products to which they relate are first marketed. Concerning greenhouse gas emissions allowances, a provision is recorded in the consolidated financial statements to cover any difference between the Group’s emissions and the allowances granted.

Saint-Gobain Group Consolidated Financial Statements
12
Property, plant and equipment Land, buildings and equipment are carried at historical cost less accumulated depreciation and impairment. Cost may also include incidental expenses directly attributable to the acquisition, such as transfers from equity of any gains/losses on qualifying cash flow hedges of property, plant and equipment purchases. Expenses incurred in exploring and evaluating mineral resources are included in property, plant and equipment when it is probable that associated future economic benefits will flow to the Group. They include mainly the costs of topographical or geological studies, drilling costs, sampling costs and all costs incurred in assessing the technical feasibility and commercial viability of extracting the mineral resource. Material borrowing costs incurred for the construction and acquisition of property, plant and equipment are included in the cost of the related asset. Property, plant and equipment are considered as having no residual value, as they consist for the most part of industrial assets that are intended to be used until the end of their useful lives. Property, plant and equipment other than land are depreciated using the components approach on a straight-line basis over the following estimated useful lives, which are regularly reviewed:
• Major factories and offices 30-40 years • Other buildings 15-25 years • Production machinery and equipment 5-16 years • Vehicles 3-5 years • Furniture, fixtures, office and computer equipment 4-16 years
Gypsum quarries are depreciated over their estimated useful lives, based on the quantity of gypsum extracted during the year compared with the extraction capacity. Provisions for site restoration are recognized as components of assets whenever the Group has a legal or constructive obligation to restore a site in accordance with contractually determined conditions or in the event of a sudden or gradual deterioration in site conditions. These provisions are reviewed periodically and may be discounted over the expected useful lives of the assets concerned. The component is depreciated over the same useful life as that used for mines and quarries. Government grants for purchases of property, plant and equipment are recorded under “Other payables” and taken to the income statement over the estimated useful lives of the relevant assets. Finance leases and operating leases Assets held under leases that transfer to the Group substantially all of the risks and rewards of ownership (finance leases) are recognized as property, plant and equipment. They are recognized at the commencement of the lease term at the lower of the fair value of the leased property and the present value of the minimum lease payments. Property, plant and equipment acquired under finance leases are depreciated on a straight-line basis over the shorter of the estimated useful life of the asset – determined using the same criteria as for assets owned by the Group – or the lease term. The corresponding liability is shown in the balance sheet net of related interest.

Saint-Gobain Group Consolidated Financial Statements
13
Rental payments under operating leases are expensed as incurred. Non-current financial assets Non-current financial assets include available-for-sale and other securities, as well as other non-current assets, which primarily comprise long-term loans and deposits. Investments classified as “available-for-sale” are carried at fair value. Unrealized gains and losses on these investments are recognized in equity, unless the investments have suffered an other-than-temporary or material decline in value, in which case an impairment loss is recorded in the income statement. Impairment of property, plant and equipment, intangible assets and goodwill Property, plant and equipment, goodwill and other intangible assets are tested for impairment on a regular basis. These tests consist of comparing the asset’s carrying amount to its recoverable amount. Recoverable amount is the higher of the asset’s fair value less costs to sell and its value in use, calculated by reference to the present value of the future cash flows expected to be derived from the asset. For property, plant and equipment and amortizable intangible assets, an impairment test is performed whenever revenues from the asset decline or the asset generates operating losses due to either internal or external factors, and no material improvement is forecast in the annual budget or the business plan. For goodwill and other intangible assets (including brands with indefinite useful lives), an impairment test is performed at least annually based on the business plan. Goodwill is reviewed systematically and exhaustively at the level of each cash-generating unit (CGU). The Group’s reporting segments are its business sectors, which may each include several CGUs. A CGU is a reporting sub-segment, generally defined as a core business of the segment in a given geographical area. It typically reflects the manner in which the Group organizes its business and analyzes its results for internal reporting purposes. A total of 36 CGUs had been identified at December 31, 2013. Goodwill is allocated mainly to the Gypsum CGU (€3,162 million at December 31, 2013), the Industrial Mortars CGU (€1,962 million at December 31, 2013) and the Building Distribution CGUs (€3,135 million at December 31, 2013), primarily in the United Kingdom, France and Scandinavia. Details of goodwill and unamortizable brands by Sector are provided in the segment information tables in Note 34. The method used for these impairment tests is consistent with that employed by the Group for the valuation of companies acquired in business combinations or acquisitions of equity interests. The carrying amount of the CGUs is compared to their value in use, corresponding to the present value of future cash flows excluding interest but including tax. Cash flows for the last year of the business plan are rolled forward over the following two years. For impairment tests of goodwill, normative cash flows (corresponding to cash flows at the mid-point in the business cycle) are then projected to perpetuity using a low annual growth rate (generally 1.5%, except for emerging markets or businesses with a high organic growth potential where a 2% rate may be used). The discount rate applied to these cash flows corresponds to the Group’s average cost of capital (7.25% in both 2013 and 2012) plus a country risk premium where appropriate depending on the geographic area concerned. The discount rates applied in 2013 for the main operating regions were 7.25% for the euro zone and North America, 8.25% for Eastern Europe and China and 8.75% for South America.

Saint-Gobain Group Consolidated Financial Statements
14
The recoverable amount calculated using a post-tax discount rate gives the same result as a pre-tax rate applied to pre-tax cash flows. Different assumptions measuring the method’s sensitivity are systematically tested using the following parameters:
• 0.5-point increase or decrease in the annual average rate of growth in cash flows projected to perpetuity; • 0.5-point increase or decrease in the discount rate applied to cash flows.
When the annual impairment test reveals that the recoverable amount of an asset is less than its carrying amount, an impairment loss is recorded. Tests performed in 2013 led to the recognition of a €206 million impairment loss on Distribution Sector goodwill (mainly concerning the Lapeyre sub-group), along with impairment losses on various items of property, plant and equipment held by the other Sectors, particularly the Flat Glass Activity. The breakdown of asset impairments by Sector and by Activity for 2013 and 2012 is provided in the segment information tables in Note 34. Based on projections made at December 31, 2013, a 0.5-point decrease in projected average annual growth in cash flows to perpetuity for all the CGUs would lead to approximately €20 million in additional write-downs of intangible assets, while a 0.5-point increase in the discount rate applied to all the CGUs would result in additional write-downs of around €50 million. Impairment losses on goodwill can never be reversed through income. For property, plant and equipment and other intangible assets, an impairment loss recognized in a prior period may be reversed if there is an indication that the impairment no longer exists and that the recoverable amount of the asset concerned exceeds its carrying amount. Inventories Inventories are stated at the lower of cost and net realizable value. The cost of inventories includes the costs of purchase, costs of conversion, and other costs incurred in bringing the inventories to their present location and condition. It is generally determined using the weighted-average cost method, and in some cases the First-In-First-Out (FIFO) method. Cost of inventories may also include the transfer from equity of any gains/losses on qualifying cash flow hedges of foreign currency purchases of raw materials. Net realizable value is the selling price in the ordinary course of business, less estimated costs to completion and costs to sell. No account is taken in the inventory valuation process of the impact of below-normal capacity utilization rates. Operating receivables and payables Operating receivables and payables are stated at nominal value as they generally have maturities of less than three months. Provisions for impairment are established to cover the risk of total or partial non-recovery. The Group considers that its exposure to concentrations of credit risk is limited due to its diversified business line-up, broad customer base and global presence. Past-due trade receivables are regularly monitored and analyzed, and provisions are set aside when appropriate. Trade and other accounts receivable and payable are due mainly within one year, with the result that their carrying amount approximates fair value.

Saint-Gobain Group Consolidated Financial Statements
15
For trade receivables transferred under securitization programs, the contracts concerned are analyzed and if substantially all the risks associated with the receivables are not transferred to the financing institutions, they remain on the balance sheet and a corresponding liability is recognized in short-term debt. Net debt
� Long-term debt Long-term debt includes bonds, Medium Term Notes, perpetual bonds, participating securities and all other types of long-term financial liabilities including lease liabilities and the fair value of derivatives qualifying as interest rate hedges. Under IAS 32, the distinction between financial liabilities and equity is based on the substance of the contracts concerned rather than their legal form. As a result, participating securities are classified as debt. At the balance sheet date, long-term debt is measured at amortized cost. Premiums and issuance costs are amortized using the effective interest method.
� Short-term debt Short-term debt includes the current portion of the long-term debt described above, short-term financing programs such as commercial paper or “Billets de Trésorerie” (French Commercial Paper), bank overdrafts and other short-term bank borrowings, as well as the fair value of credit derivatives not qualifying for hedge accounting. At the balance sheet date, short-term debt is measured at amortized cost, with the exception of derivatives that are held as hedges of debt. Premiums and issuance costs are amortized using the effective interest method.
� Cash and cash equivalents Cash and cash equivalents mainly consist of cash on hand, bank accounts and marketable securities that are short-term (i.e. generally with maturities of less than three months), highly liquid investments readily convertible into known amounts of cash and subject to an insignificant risk of changes in value. Marketable securities are measured at fair value through profit or loss. Further details about long- and short-term debt are provided in Note 21. Foreign exchange, interest rate and commodity derivatives (swaps, options, futures) The Group uses interest rate, foreign exchange and commodity derivatives to hedge its exposure to changes in interest rates, exchange rates and commodity prices that may arise in the normal course of business. In accordance with IAS 32 and IAS 39, all of these instruments are recognized in the balance sheet and measured at fair value, irrespective of whether or not they are part of a hedging relationship that qualifies for hedge accounting under IAS 39. Changes in fair value of both derivatives that are designated and qualify as fair value hedges and derivatives that do not qualify for hedge accounting are taken to the income statement (in business income for foreign exchange and commodity derivatives qualifying for hedge accounting, and in net financial expense for all other derivatives). However, in the case of derivatives that qualify as cash flow hedges, the effective portion of the gain or loss arising from changes in fair value is recognized directly in equity, and only the ineffective portion is recognized in the income statement.

Saint-Gobain Group Consolidated Financial Statements
16
� Fair value hedges Most interest rate derivatives used by the Group to swap fixed rates for variable rates are designated and qualify as fair value hedges. These derivatives hedge fixed-rate debts exposed to a fair value risk. In accordance with hedge accounting principles, debt included in a designated fair value hedging relationship is remeasured at fair value. As the effective portion of the gain or loss on the fair value hedge offsets the loss or gain on the underlying hedged item, the income statement is only impacted by the ineffective portion of the hedge.
� Cash flow hedges Cash flow hedge accounting is applied by the Group mainly for derivatives used to fix the cost of future investments in financial assets or property, plant and equipment, future purchases of gas and fuel oil (fixed-for-variable price swaps) and future purchases of foreign currencies (forward contracts). The transactions hedged by these instruments are qualified as highly probable. The application of cash flow hedge accounting allows the Group to defer the impact on the income statement of the effective portion of changes in the fair value of these instruments by recording them in a special hedging reserve in equity. The reserve is reclassified into the income statement when the hedged transaction occurs and the hedged item affects income. In the same way as for fair value hedges, cash flow hedging limits the Group’s exposure to changes in the fair value of these price swaps to the ineffective portion of the hedge.
� Derivatives that do not qualify for hedge accounting Changes in the fair value of derivatives that do not qualify for hedge accounting are recognized in the income statement. The instruments concerned mainly include cross-currency swaps; gas, currency and interest rate options; currency swaps; and futures and forward contracts. Fair value of financial instruments The fair value of financial assets and financial liabilities quoted in an active market corresponds to their quoted price, classified as level 1 in the fair value hierarchy defined in IFRS 7 and IFRS 13. The fair value of financial assets and financial liabilities not quoted in an active market is established by a recognized valuation technique such as reference to the fair value of another recent and similar transaction, or discounted cash flow analysis based on observable market data, classified as level 2 in the IFRS 7 and IFRS 13 fair value hierarchy. The fair value of short-term financial assets and liabilities is considered as being the same as their carrying amount due to their short maturities. Employee benefits – defined benefit plans After retirement, the Group’s former employees are eligible for pension benefits in accordance with the applicable laws and regulations in the respective countries in which the Group operates. There are also additional pension obligations in certain Group companies, both in France and in other countries. In France, employees receive length-of-service awards on retirement based on years of service and the calculation methods prescribed in the applicable collective bargaining agreements. The Group’s obligation for the payment of pensions and length-of-service awards is determined at the balance sheet date by independent actuaries, using a method that takes into account projected final salaries at retirement and economic conditions in each country. These obligations may be financed by pension funds, with a provision recognized in the balance sheet for the unfunded portion.

Saint-Gobain Group Consolidated Financial Statements
17
In accordance with the amendment to IAS 19 applicable from January 1, 2013, the effect of any plan amendments (past service cost) is recognized immediately in the income statement. Actuarial gains or losses reflect year-on-year changes in the actuarial assumptions used to measure the Group’s obligations and plan assets, experience adjustments (differences between the actuarial assumptions and what has actually occurred), and changes in legislation. They are recognized in equity as they occur. In the United States, Spain and Germany, retired employees receive benefits other than pensions, mainly concerning healthcare. The Group’s obligation under these plans is determined using an actuarial method and is covered by a provision recorded in the balance sheet. Provisions are also set aside on an actuarial basis for other employee benefits, such as jubilees or other long-service awards, deferred compensation, specific welfare benefits, and termination benefits in various countries. Any actuarial gains and losses relating to these benefits are recognized immediately. The interest costs for these obligations and the expected return on the related plan assets are measured using the discount rate applied to estimate the obligation at the beginning of the period, and are recognized as financial expense or income. Employee benefits – defined contribution plans Contributions to defined contribution plans are expensed as incurred. Employee benefits – share-based payments
� Stock option plans The cost of stock option plans is calculated using the Black & Scholes option pricing model, based on the following parameters:
• volatility assumptions that take into account the historical volatility of the share price over a rolling ten-year period, as well as implied volatility from traded share options. Periods of extreme share price volatility are disregarded;
• assumptions relating to the average holding period of options, based on observed behavior of option holders;
• expected dividends, as estimated on the basis of historical information dating back to 1988; • a risk-free interest rate corresponding to the yield on long-term government bonds; • the effect of any stock market performance conditions, which is taken into account in the initial
measurement of the plan cost under IFRS 2. The cost calculated using this method is recognized in the income statement over the vesting period of the options, ranging from three to four years. For options exercised for new shares, the sum received by the Company when the options are exercised is recorded in “Capital stock” for the portion representing the par value of the shares, with the balance – net of directly attributable transaction costs – recorded under “Additional paid-in capital”.

Saint-Gobain Group Consolidated Financial Statements
18
� Group Savings Plan The method used by Saint-Gobain to calculate the costs of its Group Savings Plan (“PEG”) takes into account the fact that shares granted to employees under the plan are subject to a five- or ten-year lock-up. The lock-up cost is measured and deducted from the 20% discount granted by the Group on employee share awards. The calculation parameters are defined as follows:
• the exercise price, as set by the Board of Directors, corresponds to the average of the opening share prices quoted over the twenty trading days preceding the date of grant, less a 20% discount;
• the grant date of the options is the date on which the plan is announced to employees. For the Saint-Gobain Group, this is the date when the plan’s terms and conditions are announced on the Group’s intranet;
• the interest rate used to estimate the cost of the lock-up feature of employee share awards is the rate that would be charged by a bank to an individual with an average risk profile for a general purpose five- or ten-year consumer loan repayable at maturity.
Leveraged plan costs are calculated under IFRS 2 in the same way as for non-leveraged plans, but also take into account the advantage accruing to employees who have access to share prices with a volatility profile adapted to institutional investors. The cost of the plans is recognized in full at the end of the subscription period.
� Performance shares and performance unit grants The Group set up a worldwide share grant plan in 2009 whereby each Group employee was awarded seven shares, while since 2009, performance share plans have been established for certain categories of employees. These plans are subject to eligibility criteria based on the grantee’s period of service with the Group. The plan costs calculated under IFRS 2 take into account the eligibility criteria, the performance criteria – which are described in Note 15 – and the lock-up feature. They are determined after deducting the present value of forfeited dividends on the performance shares and are recognized over the vesting period, which ranges from two to four years depending on the country. Since 2012, performance unit plans have been set up for certain employees in France. These plans are also subject to eligibility criteria based on the grantee’s period of service with the Group and to certain performance criteria. The costs calculated under IFRS 2 therefore take into account these factors, as well as the fact that the units are cash-settled. IFRS 2 stipulates that for cash-settled share-based payment transactions, the granted instruments are initially measured at fair value at the grant date, then remeasured at each period end, with the cost adjusted accordingly pro rata to the rights that have vested at the period-end. The cost is recognized over the vesting period of the rights. Equity
� Additional paid-in capital and legal reserve This item includes capital contributions in excess of the par value of capital stock as well as the legal reserve, which corresponds to a cumulative portion of the net income of Compagnie de Saint-Gobain.
� Retained earnings and net income for the year Retained earnings and net income for the year correspond to the Group’s share in the undistributed earnings of all consolidated companies.

Saint-Gobain Group Consolidated Financial Statements
19
� Treasury stock Treasury stock is measured at cost and recorded as a deduction from equity. Gains and losses on disposals of treasury stock are recognized directly in equity and have no impact on net income for the period. Forward purchases of treasury stock are treated in the same way. When a fixed number of shares is purchased forward at a fixed price, this amount is recorded in “Other liabilities” and as a deduction from equity under “Retained earnings and net income for the year”. Other current and non-current liabilities and provi sions
� Provisions for other liabilities and charges A provision is booked when (i) the Group has a present legal or constructive obligation towards a third party as a result of a past event, (ii) it is probable that an outflow of resources will be required to settle the obligation, and (iii) the amount of the obligation can be estimated reliably. If the timing or the amount of the obligation cannot be measured reliably, it is classified as a contingent liability and reported as an off-balance sheet commitment. Provisions for other material liabilities and charges whose timing can be estimated reliably are discounted to present value.
� Investment-related liabilities Investment-related liabilities correspond to put options granted to minority shareholders of subsidiaries and liabilities relating to the acquisition of shares in Group companies, including additional purchase consideration. They are reviewed on a periodic basis and any subsequent changes in the fair value of minority shareholder puts are recognized by adjusting equity. INCOME STATEMENT ITEMS Revenue recognition Revenue generated by the sale of goods or services is recognized net of rebates, discounts and sales taxes (i) when the risks and rewards of ownership have been transferred to the customer, or (ii) when the service has been rendered, or (iii) by reference to the stage of completion of the services to be provided. Construction contracts are accounted for using the percentage of completion method, as explained below. When the outcome of a construction contract can be estimated reliably, contract revenue and costs are recognized as revenue and expenses, respectively, by reference to the stage of completion of the contract activity at the balance sheet date. When the outcome of a construction contract cannot be estimated reliably, contract revenue is recognized only to the extent of contract costs incurred that it is probable will be recovered. When it is probable that total contract costs will exceed total contract revenue, the expected loss is recognized as an expense immediately. Construction contract revenues are not material in relation to total consolidated net sales.

Saint-Gobain Group Consolidated Financial Statements
20
Operating income Operating income is a measure of the performance of the different Sectors and has been used by the Group as its key external and internal management indicator for many years. Foreign exchange gains and losses are included in operating income, as are changes in the fair value of financial instruments that do not qualify for hedge accounting when they relate to operating items. Other business income and expense Other business income and expense mainly include movements in provisions for claims and litigation and environmental provisions, gains and losses on disposals of assets, impairment losses, restructuring costs incurred upon the disposal or discontinuation of operations and the costs of workforce reduction measures. Business income Business income includes all income and expenses other than borrowing costs and other financial income and expense, the Group’s share in net income of associates, and income taxes. Net financial expense Net financial expense includes borrowing and other financing costs, income from cash and cash equivalents, interest cost for pension and other post-employment benefit plans, net of the return on plan assets, and other financial income and expense such as exchange gains and losses and bank charges. Income taxes Current income tax is the estimated amount of tax payable in respect of income for a given period, calculated by reference to the tax rates that have been enacted or substantively enacted at the balance sheet date, plus any adjustments to current taxes recorded in previous financial periods. Deferred taxes are recorded using the balance sheet liability method for temporary differences between the carrying amount of assets and liabilities and their tax basis. Deferred tax assets and liabilities are measured at the tax rates expected to apply to the period when the asset is realized or the liability settled, based on the tax laws that have been enacted or substantively enacted at the balance sheet date. Deferred tax assets are recognized only if it is considered probable that there will be sufficient future taxable income against which the temporary difference can be utilized. They are reviewed at each balance sheet date and written down to the extent that it is no longer probable that there will be sufficient taxable income against which the temporary difference can be utilized. In determining whether to recognize deferred tax assets for tax loss carryforwards, the Group applies a range of criteria that take into account the probable recovery period based on business plan projections and the strategy for the long-term recovery of tax losses applied in each country. No deferred tax liability is recognized in respect of undistributed earnings of subsidiaries that are not intended to be distributed. Deferred taxes are recognized as income or expense in the income statement, except if they relate to items that are recognized directly in equity, in which case the deferred tax is also recognized in equity.

Saint-Gobain Group Consolidated Financial Statements
21
Earnings per share Basic earnings per share are calculated by dividing net income by the weighted average number of shares in issue during the period, excluding treasury stock. Diluted earnings per share are calculated by adjusting earnings per share (see Note 27) and the average number of shares in issue for the effects of all dilutive potential common shares, such as stock options and convertible bonds. The calculation is performed using the treasury stock method, which assumes that the proceeds from the exercise of dilutive instruments are assigned on a priority basis to the purchase of common shares in the market. Recurring net income Recurring net income corresponds to income after tax and minority interests but before capital gains or losses, asset impairment losses, material non-recurring provisions and the related tax and minority interests. The method used for calculating recurring net income is explained in Note 26. PERFORMANCE INDICATORS EBITDA EBITDA corresponds to operating income before depreciation and amortization. The method used for calculating EBITDA is explained in Note 26. Return on capital employed Return on capital employed (ROCE) corresponds to annualized operating income adjusted for changes in the scope of consolidation, expressed as a percentage of total assets at the period-end. Total assets include net property, plant and equipment, working capital, net goodwill and other intangible assets, but exclude deferred tax assets arising from non-amortizable brands and land. Cash flow from operations Cash flow from operations corresponds to net cash generated from operating activities before the impact of changes in working capital requirement, changes in current taxes and movements in provisions for other liabilities and charges and deferred taxes. Cash flow from operations is adjusted for the effect of material non-recurring provision charges. The method used for calculating cash flow from operations is explained in Note 26. Cash flow from operations before tax on capital gains and losses and non-recurring provisions This item corresponds to cash flow from operations less the tax effect of asset disposals and of non-recurring provision charges and reversals. The method used for calculating cash flow from operations before tax on capital gains and losses and non-recurring provisions is explained in Note 26.

Saint-Gobain Group Consolidated Financial Statements
22
SEGMENT INFORMATION In compliance with IFRS 8, segment information reflects the Group’s internal presentation of operating results to senior management. The Group has chosen to present segment information by Sector and Activity, without any further aggregation compared with the internal presentation. There were no changes in the presentation of segment information in 2013 compared with prior years.
NOTE 2 - CHANGES IN GROUP STRUCTURE Changes in the number of consolidated companies
France Outside France Total
Fully consolidated companies
At January 1, 2013 166 719 885Newly consolidated companies 4 11 15
Merged companies (7) (44) (51)
Deconsolidated companies (1) (2) (3)
Change in consolidation method 0
At December 31, 2013 162 684 846
Proportionately consolidated companies
At January 1, 2013 3 23 26Newly consolidated companies 0
Deconsolidated companies 0
Change in consolidation method 0
At December 31, 2013 3 23 26
Companies accounted for by the equity method
At January 1, 2013 4 78 82Newly consolidated companies 3 3
Merged companies (6) (6)
Deconsolidated companies (7) (7)
Change in consolidation method 0
At December 31, 2013 4 68 72
TOTAL at January 1, 2013 173 820 993
TOTAL at December 31, 2013 169 775 944 Significant changes in Group structure 2013 On December 19, 2013, the Group signed an agreement for the sale of its US-based Fiber Cement siding business to Plycem USA, a subsidiary of Elementia of Mexico. This business was part of Saint-Gobain’s Exterior Products Activity of the Construction Products Sector. It manufactures and sells fiber cement siding, trim and accessory products for the United States and Canadian residential and commercial construction markets. The transaction was finalized in early 2014.

Saint-Gobain Group Consolidated Financial Statements
23
On March 7, 2013, the Group signed an agreement for the sale of its US-based PVC Pipe and Foundations business to North American Pipe Corporation, a subsidiary of Westlake Chemical Corporation. The sale was completed on May 1, 2013 once anti-trust approvals had been obtained.
2012 On June 8, 2012, Saint-Gobain signed an agreement for the acquisition of the Celotex Group, one of the United Kingdom’s leading manufacturers of high performance insulating foam. The transaction was completed in the second half of the year and Celotex was consolidated from September 1, 2012. On March 30, 2012, Saint-Gobain completed the acquisition of Brossette from Wolseley, after the transaction was approved by France’s competition authorities on March 23. Brossette is a distributor of plumbing-heating-sanitaryware products in France. It was consolidated as from April 1, 2012. Impact on the consolidated balance sheet The impact on the balance sheet at December 31, 2013 of changes in Group structure and in consolidation methods was as follows:
(in EUR millions)
Companies consolidated for
the first time
Companies removed from
the scope of consolidation
Total
Impact on assetsNon-current assets 63 (37) 26
Inventories 7 (27) (20)
Trade accounts receivable 3 (27) (24)
Other current assets excluding cash and cash equivalents 8 (1) 7
81 (92) (11)Impact on equity and liabilities
Shareholders’ equity and minority interests 2 78 80
Provisions for pensions and other employee benefits 0 0 0
Non-current liabilities 1 (1) 0
Trade accounts payable 5 (12) (7)
Other payables and accrued expenses 6 (3) 3
14 62 76
Enterprise value of consolidated companies acquired/divested (a) 67 (154) (87)Impact on consolidated net debt*
Impact on cash and cash equivalents (3) 1 (2)
Impact on net debt excluding cash and cash equivalents (b) 7 (2) 5
4 (1) 3
Acquisitions/disposals of shares in consolidated companies net of cash acquired/divested (a) - (b) 60 (152) (92) *Corresponding to the debt, short-term credit facilities and cash and cash equivalents of acquired/divested companies.

Saint-Gobain Group Consolidated Financial Statements
24
NOTE 3 – ASSETS AND LIABILITIES HELD FOR SALE On January 17, 2013, Compagnie de Saint-Gobain signed an agreement for the sale of Saint-Gobain Containers, Inc. (SGCI) to Ardagh. On July 1, the US Federal Trade Commission (FTC) filed a complaint in Federal Court seeking to prevent the sale from being consummated. Discussions have been initiated in an effort to resolve the FTC’s concerns. As these discussions were still ongoing as of January 13, 2014, Saint-Gobain and Ardagh decided to extend their agreement concerning the sale until April 30, 2014. As required by IFRS 5, the assets and liabilities of Verallia North America (Saint-Gobain Containers, Inc. and its subsidiaries) are reported in the consolidated balance sheets at December 31, 2013 and December 31, 2012 under “Assets held for sale” and “Liabilities held for sale”. A deferred tax asset relating to the cumulative reserves carried in respect of Verallia North America was recognized at December 31, 2012 for an amount of €20 million, in accordance with IAS 12. This asset was reduced to €12 million at December 31, 2013, based on an updated estimate. Assets and liabilities held for sale (in EUR millions) Dec. 31, 2013 Dec. 31, 2012
Goodwill and other intangible assets 185 195
Property, plant and equipment, net 506 449
Other non-current assets 9 12
Inventories, trade accounts receivable and other accounts receivable 274 279
Cash and cash equivalents 0 1
Total assets held to sale 974 936
Provisions for pensions and other employee benefits 228 348
Deferred tax liabilities and other non-current liabilities 78 6
Trade accounts payable, other payables and accrued expenses, and other current liabilities 167 143
Short term debt and bank overdrafts 0 0
Total liabilities held for sale 473 497 Commitments In the same way as at the 2012 year-end, Verallia North America’s off-balance sheet commitments have been excluded from the Group’s off-balance sheet commitments at December 31, 2013. They concern future minimum lease payments due under operating leases and other commitments for approximately €37 million (December 31, 2012: €50 million). Employees The average number of employees of Verallia North America (4,384 in 2013) is included in the average number of Group employees for the year (Note 33).

Saint-Gobain Group Consolidated Financial Statements
25
NOTE 4 – IMPACT OF CHANGES IN ACCOUNTING METHODS
Impact of applying the amendments to IAS 19 – Employee Benefits The amendments to IAS 19 – Employee Benefits are applicable from January 1, 2013 with retrospective application to all periods presented. The main changes for the Group are as follows:
• Unvested past service costs, which were previously deferred and recognized over the average vesting period, are now recognized immediately;
• The return on plan assets, which was previously estimated based on the expected return, is now determined using the discount rate applied to calculate the projected benefit obligation.
If the amended standard had been applied from January 1, 2012, the impact on the 2012 financial statements would have been as follows:
• Financial expenses would have been €88 million higher (€62 million after tax), as a result of calculating the return on plan assets using the discount rate applied to the projected benefit obligation instead of the expected rate of return;
• Operating expenses would have been €18 million higher (€11 million after tax), due to the immediate recognition of the effects of plan amendments (past service cost);
• Opening equity at January 1, 2012 would have been €14 million lower (€10 million after tax), due mainly to the immediate recognition of past service costs (€8 million impact). The combined impact of all of these adjustments on closing equity at December 31, 2012 would have been a negative €32 million (€21 million after tax), plus €62 million in actuarial gains and losses corresponding to income and expenses recognized directly in equity.
The impact on each of the financial statements is presented below:
� Impact on the consolidated balance sheet The balance sheets at January 1 and December 31, 2012 have been adjusted as follows:
(in EUR millions)
Dec. 31, 2011 published
restatements At January 1st, 2012 restated
Dec. 31, 2012 published
restatements Dec. 31, 2012 restated
AssetsGoodwill 11,041 11,041 10,936 10,936
Deferred tax assets 949 4 953 1,236 11 1,247
Other non-current assets 17,887 17,887 17,457 17,457
Current assets 16,357 16,357 17,894 17,894
Total assets 46,234 4 46,238 47,523 11 47,534
Equity and liabilitiesShareholders' equity 17,815 (10) 17,805 17,439 (21) 17,418
Minority interests 403 403 412 412
Long-term debt 8,326 8,326 9,588 9,588
Provisions for pensions and other employee benefits 3,458 (13) 3,445 3,465 5 3,470
Deferred tax liabilities 893 893 792 792
Other non-current liabilities and provisions 2,143 26 2,169 2,171 26 2,197
Current liabilities 13,196 1 13,197 13,656 1 13,657
Total equity and liabilities 46,234 4 46,238 47,523 11 47,534

Saint-Gobain Group Consolidated Financial Statements
26
� Impact on the consolidated income statement The impact on the 2012 consolidated income statement can be summarized as follows:
(in EUR millions)2012 published restatements 2012 restated
Business income 1,984 (18) 1,966
Borrowing costs, net (587) (587)
Other financial income and expense (137) (88) (225)
Net financial expense (724) (88) (812)
Share in net income of associates 12 12
Income taxes (476) 33 (443)
Net income 796 (73) 723
Attributable to equity holders of the parent 766 (73) 693 Minority interests 30 0 30
� Impact on the statement of recognized income and expense The impact on the 2012 consolidated statement of recognized income and expense can be summarized as follows:
(in EUR millions)
2012 published restatements 2012 restated
Net income 796 (73) 723Items that may be subsequently reclassified to profit or loss
Translation adjustments (65) (65)Change in fair value 7 7Tax on items that may be subsequently reclassified to profit or loss (24) (24)
Items that will not be reclassified to profit or loss
Changes in actuarial gains and losses (922) 88 (834)Tax on items that will not be reclassified to profit or loss 293 (26) 267
Income and expense recognized directly in equity (711) 62 (649)
Total recognized income and expense for the year 85 (11) 74
Attributable to equity holders of the parent 74 (11) 63Minority interests 11 0 11

Saint-Gobain Group Consolidated Financial Statements
27
� Impact on the consolidated statement of cash flows The impact on the 2012 consolidated statement of cash flows can be summarized as follows:
(in EUR millions)
2012 published restatements 2012 restated
Net income attributable to equity holders of the parent 766 (73) 693
Other profit or loss items 1,929 1,929
Changes in working capital 563 563
Changes in deferred taxes and provisions for other liabilities and charges (696) 73 (623)
Net cash from operating activities 2,562 0 2,562
Net cash from (used in) investing activities (2,112) 0 (2,112)
Net cash from (used in) financing activities 801 0 801
Increase (decrease) in cash and cash equivalents 1,251 0 1,251
Net effect of exchange rate changes on cash and cash equivalents (16) (16)
Net effect from changes in fair value on cash and cash equivalents (4) (4)
Cash and cash equivalents classified as assets held for sale (1) (1)
Cash and cash equivalents at beginning of year 2,949 0 2,949Cash and cash equivalents at end of year 4,179 0 4,179
NOTE 5 – GOODWILL
(in EUR millions)2013 2012
At January 1Gross value 11,765 11,903
Accumulated impairment (829) (862)
Net 10,936 11,041
Movements during the year
Changes in Group structure 12 143
Reclassification to assets held for sale 8 (191)
Impairment (216) (67)
Translation adjustments (327) 10
Total (523) (105)
At December 31Gross value 11,415 11,765
Accumulated impairment (1,002) (829)
Net 10,413 10,936
In 2013, movements in goodwill mainly arose from translation adjustments and impairment losses on Building Distribution Sector goodwill.
In 2012, movements in goodwill mainly arose from changes in the scope of consolidation, with the acquisition of Celotex by the Construction Products Sector and Brossette by the Building Distribution Sector, and the reclassification as “Assets held for sale” of the remaining Verallia North America goodwill (Note 3).

Saint-Gobain Group Consolidated Financial Statements
28
NOTE 6 – OTHER INTANGIBLE ASSETS
(in EUR millions)
Patents Non-amortizable
brands
Software Develop-ment costs
Other Total
At January 1, 2012 restatedGross value 141 2,778 834 80 334 4,167
Accumulated amortization and impairment (108) (681) (48) (182) (1,019)
Net 33 2,778 153 32 152 3,148
Movements during the yearChanges in Group structure and reclassifications (4) (1) 11 2 11 19
Reclassification to assets held for sale 0 0 (4) 0 0 (4)
Acquisitions 3 62 36 9 110
Disposals 0 (2) 0 (2) (4)
Translation adjustments 0 29 (1) 0 (2) 26
Amortization and impairment (4) (64) (17) (14) (99)
Total movements (5) 28 2 21 2 48
At December 31, 2012 restatedGross value 140 2,806 870 118 342 4,276
Accumulated amortization and impairment (112) (715) (65) (188) (1,080)
Net 28 2,806 155 53 154 3,196
Movements during the yearChanges in Group structure and reclassifications 1 (1) 6 (4) (15) (13)
Reclassification to assets held for sale 0 0 2 0 0 2
Acquisitions 3 55 22 22 102
Disposals 0 (1) 0 (2) (3)
Translation adjustments (1) (39) (7) (1) (6) (54)
Amortization and impairment (4) (64) (20) (11) (99)
Total movements (1) (40) (9) (3) (12) (65)
At December 31, 2013Gross value 139 2,766 890 127 317 4,239
Accumulated amortization and impairment (112) (744) (77) (175) (1,108)
Net 27 2,766 146 50 142 3,131
The “Other” column includes amortizable manufacturing brands totaling €47 million at December 31, 2013 (December 31, 2012: €54 million).

Saint-Gobain Group Consolidated Financial Statements
29
NOTE 7 – PROPERTY, PLANT AND EQUIPMENT
(in EUR millions)
Land and quarries
Buildings Machinery and equipment
Assets under construction
Total
At January 1, 2012Gross value 2,462 8,529 21,660 1,518 34,169
Accumulated depreciation and impairment (420) (4,524) (14,959) (41) (19,944)
Net 2,042 4,005 6,701 1,477 14,225
Movements during the yearChanges in Group structure and reclassifications 29 45 15 44 133
Reclassification to assets held for sale (10) (66) (338) (35) (449)
Acquisitions 65 97 414 1,197 1,773
Disposals (14) (17) (32) (7) (70)
Translation adjustments (13) (2) (48) (31) (94)
Depreciation and impairment (43) (311) (1,407) (61) (1,822)
Transfers 239 948 (1,187) 0
Total movements 14 (15) (448) (80) (529)
At December 31, 2012Gross value 2,512 8,697 21,377 1,500 34,086
Accumulated depreciation and impairment (456) (4,707) (15,124) (103) (20,390)
Net 2,056 3,990 6,253 1,397 13,696
Movements during the yearChanges in Group structure and reclassifications 20 (7) 13 (14) 12
Reclassification to assets held for sale 1 4 (61) (1) (57)
Acquisitions 17 64 272 1,001 1,354
Disposals (42) (65) (30) (16) (153)
Translation adjustments (71) (162) (311) (91) (635)
Depreciation and impairment (35) (333) (1,207) (7) (1,582)
Transfers 240 963 (1,203) 0
Total movements (110) (259) (361) (331) (1,061)
At December 31, 2013Gross value 2,408 8,557 21,202 1,169 33,336
Accumulated depreciation and impairment (462) (4,826) (15,310) (103) (20,701)
Net 1,946 3,731 5,892 1,066 12,635
In 2013, other movements in property, plant and equipment included assets acquired under finance leases for an amount of €18 million (2012: €18 million). These finance leases are not included in the cash flow statement, in accordance with IAS 7. At December 31, 2013, total property, plant and equipment acquired under finance leases amounted to €77 million (December 31, 2012: €109 million) (Note 28).

Saint-Gobain Group Consolidated Financial Statements
30
NOTE 8 – INVESTMENTS IN ASSOCIATES
(in EUR millions)2013 2012
At January 1Equity in associates 157 129
Goodwill 49 38
Investments in associates 206 167
Movements during the yearChanges in Group structure (7) 31
Translation adjustments (11) 2
Transfers, share issues and other movements 25 0
Dividends paid (8) (6)Share in net income of associates 11 12
Total movements 10 39
At December 31Equity in associates 167 157
Goodwill 49 49
Investments in associates 216 206
Annual net sales recorded in the individual financial statements of associates totaled €830 million in 2013 (2012: €984 million) and their aggregate net income totaled €34 million (2012: €32 million). At December 31, 2013, total assets and liabilities of these companies amounted to €1,099 million and €497 million, respectively (December 31, 2012: €1,082 million and €535 million).
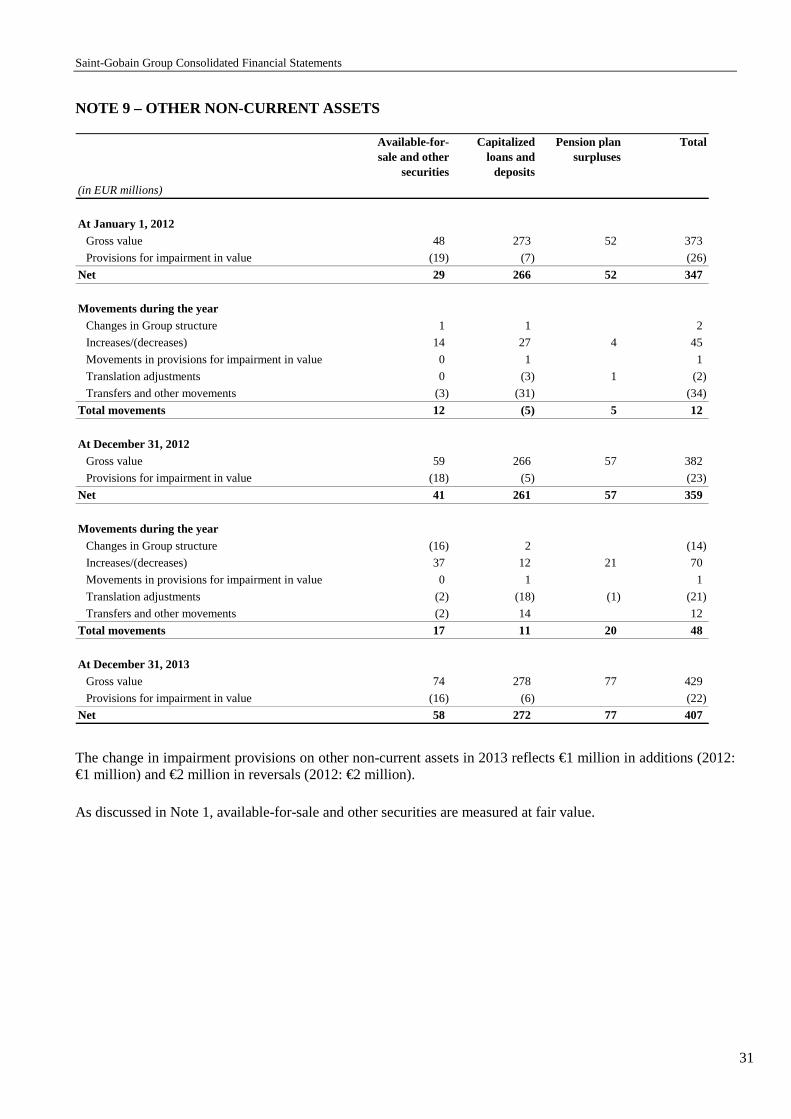
Saint-Gobain Group Consolidated Financial Statements
31
NOTE 9 – OTHER NON-CURRENT ASSETS
(in EUR millions)
Available-for-sale and other
securities
Capitalized loans and
deposits
Pension plan surpluses
Total
At January 1, 2012Gross value 48 273 52 373
Provisions for impairment in value (19) (7) (26)
Net 29 266 52 347
Movements during the yearChanges in Group structure 1 1 2
Increases/(decreases) 14 27 4 45
Movements in provisions for impairment in value 0 1 1
Translation adjustments 0 (3) 1 (2)
Transfers and other movements (3) (31) (34)
Total movements 12 (5) 5 12
At December 31, 2012Gross value 59 266 57 382
Provisions for impairment in value (18) (5) (23)
Net 41 261 57 359
Movements during the yearChanges in Group structure (16) 2 (14)
Increases/(decreases) 37 12 21 70
Movements in provisions for impairment in value 0 1 1
Translation adjustments (2) (18) (1) (21)
Transfers and other movements (2) 14 12
Total movements 17 11 20 48
At December 31, 2013Gross value 74 278 77 429
Provisions for impairment in value (16) (6) (22)
Net 58 272 77 407
The change in impairment provisions on other non-current assets in 2013 reflects €1 million in additions (2012: €1 million) and €2 million in reversals (2012: €2 million).
As discussed in Note 1, available-for-sale and other securities are measured at fair value.

Saint-Gobain Group Consolidated Financial Statements
32
NOTE 10 – INVENTORIES
(in EUR millions)December 31,
2013December 31,
2012
Gross value
Raw materials 1,407 1,463
Work in progress 248 249
Finished goods 4,824 4,910
Gross inventories 6,479 6,622
Provisions for impairment in value
Raw materials (143) (134)
Work in progress (9) (10)
Finished goods (330) (345)
Provisions for impairment in value (482) (489)
Net 5,997 6,133
In 2013, cost of sales came to €31,996 million (2012: €33,046 million).
Impairment losses on inventories recorded in the 2013 income statement totaled €158 million (2012: €174 million).Impairment reversals, due to increases in the net realizable value of inventories, amounted to €123 million in 2013 (2012: €130 million) and were recorded as a deduction from impairment losses for the year.
NOTE 11 – TRADE AND OTHER ACCOUNTS RECEIVABLE
(in EUR millions)December 31,
2013December 31,
2012
Gross value 5,383 5,512
Provisions for impairment in value (501) (495)
Trade accounts receivable 4,882 5,017
Advances to suppliers 548 621
Prepaid payroll taxes 21 20
Other prepaid and recoverable taxes (other than income tax) 350 351
Other 402 438
Less:
France 96 94
Other Western European countries 149 165
North America 15 22
Emerging countries and Asia 142 157
Provisions for impairment in value (4) (5)
Other receivables 1,317 1,425
The change in impairment provisions for trade accounts receivable in 2013 reflects €126 million in additions (2012: €107 million) and €102 million in reversals (2012: €98 million) – resulting from recoveries as well as write-offs. Bad debt write-offs are also reported under this caption, for €83 million (2012: €71 million).
Saint-Gobain Group Consolidated Financial Statements
33
Net past-due trade receivables amounted to €938 million at December 31, 2013, after deducting provisions of €426 million (December 31, 2012: €874 million, after deducting provisions of €436 million), including €208 million over three months past due (December 31, 2012: €206 million).
NOTE 12 – EQUITY Number of shares outstanding At December 31, 2013, Compagnie de Saint-Gobain’s capital stock comprised 555,176,790 shares of common stock with a par value of €4 each, all in the same class (December 31, 2012: 531,125,642 shares).
During 2013, 4,499,142 new shares were issued to members of the 2013 Group Savings Plan at a price of €24.77, representing total proceeds of €111 million.
Treasury stock Saint-Gobain shares held by Compagnie de Saint-Gobain and Saint-Gobain Corporation are shown as a deduction from equity under “Treasury stock” at historical cost. At December 31, 2013, 3,759,173 shares were held in treasury (December 31, 2012: 4,691,065). 1,799,334 shares were bought back on the market during the year (2012: 8,727,221) and 2,731,226 shares were sold (2012: 3,854,183). No shares were cancelled (2012: 9,540,000). The liquidity contract set up with Exane BNP Paribas on November 16, 2007 was rolled over in 2013 and 2012. In addition, for the purposes of a compensation plan set up in January 2008 for certain employees in the United States, Compagnie de Saint-Gobain shares are held by a trust administered by Wachovia Bank, National Association. In the consolidated financial statements these shares are treated as being controlled by Saint-Gobain Corporation.
NOTE 13 – STOCK OPTION PLANS Compagnie de Saint-Gobain has stock option plans available to certain employees. The options are exercisable for Saint-Gobain shares at a price based on the average share price for the 20 trading days preceding the grant date. Since 1999, no stock options have been granted at a discount to the average price. Since the November 2007 plan, all stock options are subject to a four-year vesting period. Under earlier plans, the vesting period was three years for non-residents and four years for tax residents. Options must be exercised within ten years of the date of grant. All rights to options are forfeited if the holder leaves the Group, unless expressly agreed otherwise by both the Chairman and Chief Executive Officer of Compagnie de Saint-Gobain and the Appointments, Compensation and Governance Committee of the Board of Directors.

Saint-Gobain Group Consolidated Financial Statements
34
All options granted between 1999 and 2002 were exercisable for existing shares, while those granted between 2003 and 2007 and in 2012 were exercisable for new shares. For plans launched between 2008 and 2011 and in 2013, the origin of the shares is determined at the latest at the end of the vesting period, with any options exercised before the decision is made being exercised for new shares. The Board of Directors decided that options granted under the 2008 and 2009 plans would be exercisable for new shares. Until 2008, options were subject to a performance condition for certain grantees only. Since 2009, the plans are subject to a performance condition for all grantees. For options granted under the 2013 plan, the value used to calculate the 30% contribution sociale tax due by grantees employed by French companies in the Group is €5.97 per option. The following table presents changes in the number of outstanding options:
EUR 4 par value shares
Average exercise price
(in EUR )
Options outstanding at December 31, 2011 25,799,443 41.54
Options granted 253,000 27.71
Options exercised (815,091) 21.68
Options forfeited (855,949) 30.13
Options outstanding at December 31, 2012 24,381,403 42.46
Options granted 247,250 38.80
Options exercised (2,497,850) 31.26
Options forfeited* (667,106) 32.26
Options outstanding at December 31, 2013 21,463,697 44.05 *Options granted under the 2003 plan that had not been exercised when the plan expired on November 19, 2013.
Stock option expense recorded in the income statement amounted to €4 million in 2013 (2012: €2 million). The fair value of options granted in 2013 amounted to €1 million. The table below summarizes information about stock options outstanding at December 31, 2013, after taking into account the partial fulfillment of the performance criteria attached to certain plans.
Total options outstanding
Exercise price (in EUR )
Number of options
Weighted average contractual life
(in months)
Exercise price (in EUR )
Number of options
Number of options
2004 39.39 3,947,594 11 3,947,594 Subscription
2005 41.34 4,051,181 23 4,051,181 Subscription
2006 52.52 4,306,454 35 4,306,454 Subscription
2007 64.72 3,403,171 47 3,403,171 Subscription
2008 25.88 2,664,966 59 2,664,966 Subscription
2009 36.34 963,541 71 963,541 Subscription
2010 83 35.19 1,144,390 1,144,390Subscription or Purchase*
2011 95 31.22 482,150 482,150Subscription or Purchase*
2012 107 27.71 253,000 253,000 Subscription
2013 119 38.80 247,250 247,250 Subscription or Purchase*
Total 19,336,907 2,126,790 21,463,697
Options exercisable Options not exercisable
Grant date Type of options
*2010, 2011 and 2013 plans: see text above

Saint-Gobain Group Consolidated Financial Statements
35
At December 31, 2013, 19,336,907 stock options were exercisable (at an average price of €45.17) and 2,126,790 options (average price €33.82) had not yet vested.
NOTE 14 – GROUP SAVINGS PLAN The Group Savings Plan (“PEG”) is an employee stock purchase plan open to all Group employees in France and in most other countries where the Group does business. Eligible employees must have completed a minimum of three months’ service with the Group. The purchase price of the shares, as set by the Chairman and Chief Executive Officer on behalf of the Board of Directors, corresponds to the average of the opening share prices quoted over the 20 trading days preceding the pricing date. In 2013, the Group issued 4,499,182 shares with a par value of €4 (2012: 4,387,680 shares) to members of the PEG, for a total of €111 million (2012: €125 million). In some years, as well as the standard plans, leveraged plans are offered to employees in countries where this is allowed under local law and tax rules.
� Standard plans Under the standard plans, eligible employees are offered the opportunity to invest in Saint-Gobain stock at a 20% discount. The stock is subject to a 5- or 10-year lock-up, except following the occurrence of certain events. The compensation cost recorded in accordance with IFRS 2 is measured by reference to the fair value of a discount offered on restricted stock (i.e. stock subject to a lock-up). The cost of the lock-up for the employee is defined as the cost of a two-step strategy that involves first selling the restricted stock forward five or ten years and then purchasing the same number of shares on the spot market and financing the purchase with debt. The borrowing cost is estimated at the rate that would be charged by a bank to an individual with an average risk profile for a general purpose five- or ten-year consumer loan repayable at maturity (see Note 1 for details of the calculation).
The standard plan cost recorded in the income statement amounted to €0 in 2013 (2012: €0 million), net of the lock-up cost for employees of €20 million (2012: €19 million).
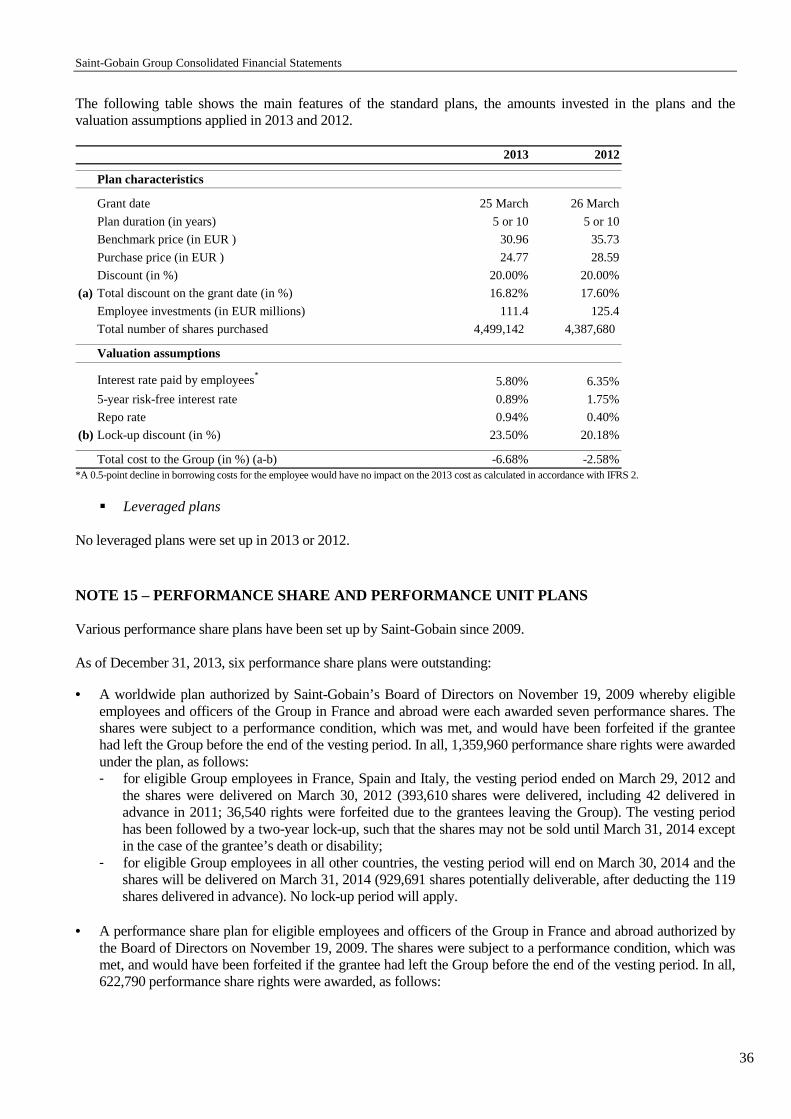
Saint-Gobain Group Consolidated Financial Statements
36
The following table shows the main features of the standard plans, the amounts invested in the plans and the valuation assumptions applied in 2013 and 2012.
2013 2012
Plan characteristics
Grant date 25 March 26 March
Plan duration (in years) 5 or 10 5 or 10
Benchmark price (in EUR ) 30.96 35.73
Purchase price (in EUR ) 24.77 28.59
Discount (in %) 20.00% 20.00%
(a) Total discount on the grant date (in %) 16.82% 17.60%
Employee investments (in EUR millions) 111.4 125.4
Total number of shares purchased 4,499,142 4,387,680
Valuation assumptions
Interest rate paid by employees*5.80% 6.35%
5-year risk-free interest rate 0.89% 1.75%
Repo rate 0.94% 0.40%
(b) Lock-up discount (in %) 23.50% 20.18%
Total cost to the Group (in %) (a-b) -6.68% -2.58% *A 0.5-point decline in borrowing costs for the employee would have no impact on the 2013 cost as calculated in accordance with IFRS 2.
� Leveraged plans
No leveraged plans were set up in 2013 or 2012.
NOTE 15 – PERFORMANCE SHARE AND PERFORMANCE UNIT PL ANS Various performance share plans have been set up by Saint-Gobain since 2009. As of December 31, 2013, six performance share plans were outstanding:
• A worldwide plan authorized by Saint-Gobain’s Board of Directors on November 19, 2009 whereby eligible employees and officers of the Group in France and abroad were each awarded seven performance shares. The shares were subject to a performance condition, which was met, and would have been forfeited if the grantee had left the Group before the end of the vesting period. In all, 1,359,960 performance share rights were awarded under the plan, as follows: - for eligible Group employees in France, Spain and Italy, the vesting period ended on March 29, 2012 and
the shares were delivered on March 30, 2012 (393,610 shares were delivered, including 42 delivered in advance in 2011; 36,540 rights were forfeited due to the grantees leaving the Group). The vesting period has been followed by a two-year lock-up, such that the shares may not be sold until March 31, 2014 except in the case of the grantee’s death or disability;
- for eligible Group employees in all other countries, the vesting period will end on March 30, 2014 and the shares will be delivered on March 31, 2014 (929,691 shares potentially deliverable, after deducting the 119 shares delivered in advance). No lock-up period will apply.
• A performance share plan for eligible employees and officers of the Group in France and abroad authorized by
the Board of Directors on November 19, 2009. The shares were subject to a performance condition, which was met, and would have been forfeited if the grantee had left the Group before the end of the vesting period. In all, 622,790 performance share rights were awarded, as follows:

Saint-Gobain Group Consolidated Financial Statements
37
- for eligible Group employees in France, the vesting period ended on March 29, 2012 and the shares were delivered on March 30, 2012 (245,320 shares were delivered; 15,080 rights were forfeited due to the grantees leaving the Group). The vesting period has been followed by a two-year lock-up, such that the shares may not be sold until March 31, 2014 except in the case of the grantee’s death or disability;
- for eligible Group employees in all other countries, the vesting period will end on March 30, 2014 and the shares will be delivered on March 31, 2014 (345,160 shares will be potentially deliverable, after deducting the 1,500 shares delivered in advance and the 15,730 rights forfeited due to the grantees leaving the Group). No lock-up period will apply.
• A performance share plan for eligible employees and officers of the Group in France and abroad authorized by
the Board of Directors on November 18, 2010. The shares were subject to a performance condition, which was partially met, and would be forfeited if the grantee left the Group before the end of the vesting period. In all, 737,550 performance share rights were awarded, as follows: - for eligible Group employees in France, the vesting period ended on March 29, 2013 and the shares were
delivered on March 30, 2013 (186,495 shares were delivered, including 590 shares delivered in advance. 126,565 rights were forfeited because the performance conditions were not fully met, and 12,000 rights were forfeited due to the grantees leaving the Group). The vesting period has been followed by a two-year lock-up, such that the shares may not be sold until March 31, 2015 except in the case of the grantee’s death or disability;
- for eligible Group employees in all other countries, the vesting period will end on March 30, 2015 and the shares will be delivered on March 31, 2015 (249,520 shares will be potentially deliverable, after deducting the 700 shares delivered in advance, the 143,320 rights forfeited because the performance conditions were not fully met and the 18,950 rights forfeited due to the grantees leaving the Group). No lock-up period will apply.
• A performance share plan for eligible employees and officers of the Group in France and abroad authorized by
the Board of Directors on November 24, 2011. The shares were subject to a performance condition, which was partially met, and would be forfeited if the grantee left the Group before the end of the vesting period. In all, 942,920 performance share rights were awarded, as follows: - for eligible Group employees in France, the vesting period will end on March 29, 2014 and the shares will
be delivered on March 30, 2014 (170,164 shares will be potentially deliverable after deducting the 2,813 shares delivered in advance, the 238,313 rights forfeited because the performance conditions were not fully met and the 4,270 rights forfeited due to the grantees leaving the Group). The vesting period will be followed by a two-year lock-up, such that the shares may not be sold until March 31, 2016 except in the case of the grantee’s death or disability;
- for eligible Group employees in all other countries, the vesting period will end on March 30, 2016 and the shares will be delivered on March 31, 2016 (238,926 shares will be potentially deliverable, after deducting the 279,634 rights forfeited because the performance conditions were not fully met and the 8,800 rights forfeited due to the grantees leaving the Group). No lock-up period will apply.
• A performance share plan for eligible employees and officers of the Group in France and abroad authorized by
the Board of Directors on November 22, 2012. The shares are subject to a performance condition and will be forfeited if the grantee leaves the Group before the end of the vesting period. The plan involves a total of 542,370 performance share rights. Grantees will be allocated existing shares of the Company. The vesting period will end on November 21, 2016 and the shares will be delivered on November 22, 2016. No lock-up period will apply.
• A performance share plan for eligible employees and officers of the Group outside France authorized by the
Board of Directors on November 21, 2013. The shares are subject to a performance condition and will be forfeited if the grantee leaves the Group before the end of the vesting period. The plan involves a total of 541,655 performance share rights. Grantees will be allocated existing shares of the Company. The vesting period will end on November 20, 2017 and the shares will be delivered on November 21, 2017. No lock-up period will apply.

Saint-Gobain Group Consolidated Financial Statements
38
The table below shows changes in the number of performance share rights:
Number of rights
Number of performance share rights at December 31, 2011 3,662,387
Performance share rights granted in November 2012 542,370
Shares issued/delivered (641,669)
Lapsed and canceled rights (897,242)
Number of performance share rights at December 31, 2012 2,665,846
Performance share rights granted in November 2013 541,655
Shares issued/delivered (188,055)
Lapsed and canceled rights (1,960)
Number of performance share rights at December 31, 2013 3,017,486 The fair value of the performance shares corresponds to the Saint-Gobain share price on the grant date less (i) the value of dividends not payable on the shares during the vesting period, and (ii) as for the Group Savings Plan, less the discount on restricted stock (i.e. stock subject to a 4-year lock-up), which has been estimated at around 30%. The compensation cost is recognized over the 2- or 4-year vesting period of the performance shares. The cost recorded in the income statement for the two plans amounted to €10 million in 2013 (2012: €12 million). The following table shows the expected dates when vested performance shares will be issued/delivered under the six plans, except in the case of the grantee’s death or disability or departure from the Group before the end of the vesting period:
Grant dateNumber of rights at December 31,
2013
End of the vesting period
Type of rights
November 19, 2009 929,691 March 2014 transmitting
November 19, 2009 345,160 March 2014 transmitting
November 18, 2010 249,520 March 2015 transmitting
November 24, 2011 170,164 March 2014 transmitting
November 24, 2011 238,926 March 2016 transmitting
November 22, 2012 542,370 November 2016 existing
November 21, 2013 541,655 November 2017 existing
Total 3,017,486 Performance unit plans Performance unit plans were set up in 2012 and 2013. The units are subject to a performance condition and will be forfeited if the grantee leaves the Group before the end of the vesting period. The units will not give rise to the allocation of new or existing shares of the Company, but will entitle grantees to deferred cash compensation determined by reference to the Company’s share price.

Saint-Gobain Group Consolidated Financial Statements
39
As of December 31, 2013, two performance unit plans were outstanding: • A long-term incentive plan involving the award of performance units for certain eligible employees and officers
of the Group in France, approved in principle by the Board of Directors on November 22, 2012. In all, 536,400 performance units were awarded. The exercise period for the units runs from November 22, 2016 to November 21, 2022;
• A long-term incentive plan involving the award of performance units for certain eligible employees and officers of the Group in France, approved in principle by the Board of Directors on November 21, 2013. In all, 588,535 performance units were awarded. The exercise period for the units runs from November 21, 2017 to November 20, 2023.
The expense recognized in 2013 in respect of these plans amounted to €5 million.
NOTE 16 – PROVISIONS FOR PENSIONS AND OTHER EMPLOYEE BENEFITS
(in EUR millions)
December 31, 2013
December 31, 2012 restated
Pensions 2,007 2,521
Length-of-service awards 296 304
Post-employment healthcare benefits 352 500
Total provisions for pensions and other post-employment benefit obligations 2,655 3,325
Healthcare benefits 23 27
Long-term disability benefits 18 23
Other long-term benefits 89 95
Provisions for pensions and other employee benefits 2,785 3,470 The following table shows defined benefit obligations under pension and other post-employment benefit plans and the related plan assets:
(in EUR millions)
December 31, 2013
December 31, 2012 restated
Provisions for pensions and other post-employment benefit obligations 2,655 3,325
Pension plan surpluses (77) (57)
Net pension and other post-employment benefit obligations 2,578 3,268

Saint-Gobain Group Consolidated Financial Statements
40
Changes in pension and other post-employment benefit obligations are as follows:
(in EUR millions)
Pension and other post-
employment benefit
obligations
Fair value of plan assets
Other Net pension and other post-
employment benefit
obligations
At January 1, 2012 restated 9,807 (6,593) 6 3,220
Movements during the year
Service cost 188 188
Interest cost/return on plan assets*439 (315) 124
Contributions to pension (470) (470)
Employee contributions (14) (14)
Actuarial gains and losses and asset ceiling 1,212 (388) 10 834
Currency translation adjustment 2 (24) (22)
Benefit payments (493) 393 (100)
Past service cost**(176) (176)
Changes in Group structure 39 (23) 16
Curtailments/settlements (5) (5)
Other 8 (4) (2) 2
Reclassification to liabilities held for sale (977) 648 (329)
Total movements 237 (197) 8 48
At December 31, 2012 restated 10,044 (6,790) 14 3,268
Movements during the year
Service cost 213 213
Interest cost/return on plan assets*396 (277) 119
Contributions to pension (184) (184)
Employee contributions (11) (11)
Actuarial gains and losses and asset ceiling (595) (107) 6 (696)
Currency translation adjustment (292) 224 (1) (69)
Benefit payments (468) 376 (92)
Past service cost (58) (58)
Changes in Group structure 0
Curtailments/settlements (31) (31)
Changes in liabilities held for sale 150 (31) 119
Total movements (685) (10) 5 (690)
At December 31, 2013 9,359 (6,800) 19 2,578
*The actual return on plan assets came to €384 million for the year (2012: €703 million). **Including the changes in reference and calculation assumptions in the United Kingdom explained in the paragraphs on actuarial assumptions.

Saint-Gobain Group Consolidated Financial Statements
41
The following tables show the funded status of pension and other post-employment benefit obligations by geographic area:
December 31, 2013
(in EUR millions)
Average duration (in years) 13 17 13 9 16
Defined benefit obligation - funded plans 478 5,694 2,085 122 8,379
Defined benefit obligation - unfunded plans 309 312 334 25 980
Fair value of plan assets (282) (4,803) (1,614) (101) (6,800)
Deficit/(surplus) 505 1,203 805 46 2,559
Asset ceiling 19
Net pension and other post-employment benefit obligations 2,578
Net totalFrance Other Western European countries
North America Rest of the World
December 31, 2012 restated
(in EUR millions)
Defined benefit obligation - funded plans 505 5,728 2,421 147 8,801
Defined benefit obligation - unfunded plans 310 386 500 47 1,243
Fair value of plan assets (285) (4,769) (1,619) (117) (6,790)
Deficit/(surplus) 530 1,345 1,302 77 3,254
Asset ceiling 14
Net pension and other post-employment benefit obligations 3,268
France Other Western European countries
North America Rest of the World
Net total
Description of defined benefit plans The Group’s main defined benefit plans are as follows: In France, in addition to length-of-service awards, there are three defined benefit plans all of which are final salary plans. These plans were closed to new entrants by the companies concerned between 1969 and 1997. Effective March 1, 2012, a new defined benefit plan complying with Article L.137-11 of France’s Social Security Code was set up by Compagnie de Saint-Gobain.
In Germany, retirement plans provide pensions and death and disability benefits for employees. These plans have been closed to new entrants since 1996.
In the Netherlands, ceilings have been introduced for defined benefit supplementary pension plans, above which they are converted into defined contribution plans.
In the United Kingdom, retirement plans provide pensions as well as death and permanent disability benefits. These defined benefit plans – which are based on employees’ average salaries over their final years of employment – have been closed to new entrants since 2001.
Saint-Gobain Group Consolidated Financial Statements
42
In the United States and Canada, the Group’s defined benefit plans are final salary plans. Since January 1, 2001, new employees have been offered a defined contribution plan. Provisions for other long-term employee benefits amounted to €130 million at December 31, 2013 (December 31, 2012: €145 million), and covered all other employee benefits, notably long-service awards in France, jubilees in Germany and employee benefits in the United States. The related defined benefit obligation is generally calculated on an actuarial basis using the same rules as for pension obligations.
Measurement of pension and other post-employment benefit obligations
Pensions and other post-employment benefit obligations are determined on an actuarial basis using the projected unit credit method, based on estimated final salaries. The Group’s total pension and other post-employment benefit obligations amounted to €9,359 million at December 31, 2013 (December 31, 2012: €10,044 million).
Plan assets For defined benefit plans, plan assets have been progressively built up by contributions, primarily in the United States, the United Kingdom and Germany. Contributions paid by the Group totaled €184 million in 2013 (2012: €470 million). The actual return on plan assets came to €384 million for the year (2012: €703 million). The fair value of plan assets – which came to €6,800 million at December 31, 2013 (December 31, 2012: €6,790 million) – is deducted from the Group’s defined benefit obligation, as estimated using the projected unit credit method, in order to calculate the unfunded obligation to be covered by a provision. Plan assets are mainly composed of equities (39%) and bonds (38%), with the remaining 23% invested in other asset classes. Projected contributions to pension plans for 2014 are estimated at around €240 million. Actuarial assumptions used to measure defined benefit obligations and plan assets
Assumptions related to mortality, employee turnover and future salary increases take into account the economic conditions specific to each country and company.

Saint-Gobain Group Consolidated Financial Statements
43
The assumptions used in 2013 for the Group’s main plans were as follows:
Other European countries
(in %)Euro zone United
Kingdom
Discount rate 3.50% 3.50% 4.45% 4.75%
Salary increases 2.50% 2.00% to 2.60% 2.00%* 3.00%
Return on plan assets 3.50% 3.50% 4.45% 4.75%
Inflation rate 1.90% 1.80% to 2.00% 2.25% 2.10%
France United States
*A cap applies to the reference salaries used to calculate benefit entitlements.
The assumptions used in 2012 for the Group’s main plans, as adjusted based on IAS 19, were as follows:
Other European countries
(in %)Euro zone United
Kingdom
Discount rate 3.25% 3.25% 4.15% 3.75%
Salary increases 2.50% 2.00% to 2.60% 2.00%* 3.00%
Return on plan assets 3.25% 3.25% 4.15% 3.75%
Inflation rate 1.90% 1.75% to 2.00% 1.65% 2.00%
France United States
*A cap applies to the reference salaries used to calculate benefit entitlements.
Discount rates were set by region or country based on observed bond rates at December 31, 2013. A 0.5-point decrease (increase) in the discount rate would lead to an increase (decrease) in defined benefit obligations of around €170 million for the North American plans, €200 million for the euro-zone plans and €320 million for the UK plans. A 0.5-point increase in the inflation rate would lead to an overall increase in defined benefit obligations of €430 million. The same assumptions concerning mortality, employee turnover and interest rates are used to determine the Group’s defined benefit obligations for other long-term employee benefits. In the United States, retirees’ healthcare costs are projected to rise by 7.61% per year. A 1-point increase in this rate would lead to an increase in the related projected benefit obligation of around €35 million. Calculation assumptions in the United Kingdom have been partly modified by the introduction, in 2012, of a cap on reference salaries and the adjustment of benefit entitlements for employees taking early retirement or retiring for health reasons. The resulting reduction in the related benefit obligation, for the amount of £140 million in 2012, has been recognized under “Past service cost” in the table analyzing changes in pension and other post-employment benefit obligations.
Actuarial gains and losses In 2006, the Group elected to apply the option available under IAS 19 and to record in equity actuarial gains and losses and the change in the asset ceiling (Note 1). In 2013, €696 million was recognized in equity (decrease in provisions). This amount corresponds to €595 million in actuarial differences, including a €34 million experience adjustment (corresponding to the effects of differences between previous actuarial assumptions and what has actually occurred), €6 million due to the raising of the asset ceiling, and a €107 million increase in plan assets.

Saint-Gobain Group Consolidated Financial Statements
44
Firm equity and bond markets helped to add €384 million to the value of plan assets, compared with an estimated increase of €277 million. A 0.5-point increase or decrease in the actual return on plan assets would have an impact of approximately €35 million on equity. Plan surpluses and the asset ceiling When plan assets exceed the defined benefit obligation, the excess is recognized in other non-current assets under “Plan surplus” (Note 9) provided that it corresponds to future economic benefits. The asset ceiling corresponds to the maximum future economic benefit. Changes in the asset ceiling are recognized in equity.
Plan surpluses and provisions for pensions and other post-employment benefits classified as assets and liabilities held for sale In accordance with IFRS 5, the provisions for pensions and other post-employment benefits for employees of Verallia North America were classified as liabilities held for sale at December 31, 2013, for an amount of €210 million (December 31, 2012: €329 million). Including provisions for other long-term benefits in the amount of €18 million (December 31, 2012: €19 million), the total amount reclassified as “Liabilities held for sale” was €228 million (December 31, 2012: €348 million) (Note 3).
Employee benefits expense The cost of the Group’s pension and other post-employment benefit plans (excluding other employee benefits) is as follows:
(in EUR millions)2013 2012 restated
Service cost 213 188
Interest cost 396 439
Expected return on plan assets (277) (315)
Curtailments and settlements (89) (181)
Pensions, length-of-service awards and other post-employment benefits 243 131
Employee contributions (11) (14)
Total 232 117
Additional information about defined contribution p lans Contributions to defined contribution plans for 2013 represented an estimated €644 million (2012: €681 million), including €447 million for government-sponsored basic pension schemes (2012: €473 million), €138 million for government-sponsored supplementary pension schemes, mainly in France (2012: €138 million), and €59 million for corporate-sponsored supplementary pension plans (2012: €70 million).

Saint-Gobain Group Consolidated Financial Statements
45
NOTE 17 – CURRENT AND DEFERRED TAXES The pre-tax income of consolidated companies is as follows:
(in EUR millions)2013 2012 restated
Net income 631 723
Less:
Share in net income of associates 11 12
Income taxes (476) (443)
Pre-tax income of consolidated companies 1,096 1,154 Income tax expense breaks down as follows:
(in EUR millions)2013 2012 restated
Current taxes (622) (612)France (123) (151)
Outside France (499) (461)
Deferred taxes 146 169 France 38 64
Outside France 108 105
Total income tax expense (476) (443)
The effective tax rate breaks down as follows:
(in %)2013 2012 restated
Tax rate in France 34.4 34.4
Impact of tax rates outside France (8.9) (3.8)
Impact of Finance Law in France (add-in 10.7% in 2013 and add-in 5% in 2012) 3.6 1.7
Capital gains and losses and asset impairments 12.2 4.3
Provisions for deferred tax assets 11.7 4.3
Effect of changes in future tax rates (6.4) (3.7)
Research tax credit (2.2) (1.6)
Other deferred and miscellaneous taxes (1.0) 2.8
Effective tax rate 43.4 38.4

Saint-Gobain Group Consolidated Financial Statements
46
In the balance sheet, changes in net deferred tax liability break down as follows:
(in EUR millions)
Net deferred tax
assets/(liability)
At January 1, 2012 restated 60
Deferred tax (expense)/benefit 169
Changes in deferred taxes on actuarial gains and losses recognized in accordance with IAS 19 (note 16)
267
Translation adjustments (19)
Impact of changes in Group structure and other (22)
At December 31, 2012 restated 455
Deferred tax (expense)/benefit 146
Changes in deferred taxes on actuarial gains and losses recognized in accordance with IAS 19 (note 16)
(260)
Translation adjustments (10)
Impact of changes in Group structure and other 82
At December 31, 2013 413
The table below shows the principal components of the deferred tax:
(in EUR millions)
December 31, 2013
December 31, 2012 restated
Deferred tax assets 1,125 1,247
Deferred tax liabilities (712) (792)
Net deferred tax 413 455
Pensions 680 946
Brands (738) (781)
Depreciation & amortization, accelerated capital allowances and tax-driven provisions (985) (1,005)
Tax loss carryforwards 873 748
Other 583 547
Total 413 455 Deferred taxes are offset at the level of each tax entity, i.e., by tax group where applicable (mainly in France, the United Kingdom, Spain, Germany, the United States and the Netherlands). Deferred tax assets of €1,125 million were recognized at December 31, 2013 (December 31, 2012: €1,247 million). They include deferred tax assets of €523 million in the United States that are expected to be recovered within the maximum utilization period of 20 years and €157 in Germany, where the “Organschaft” group relief system allows deferred tax assets to be recovered within a short period. Deferred tax liabilities recognized at December 31, 2013 amounted to €712 million (December 31, 2012: €792 million), including €254 million in France and €174 million in the United Kingdom. Deferred tax liabilities recognized in other countries represented considerably smaller amounts. Deferred tax assets whose recovery is not considered probable totaled €349 million at December 31, 2013 (December 31, 2012: €261 million) and are fully accrued.

Saint-Gobain Group Consolidated Financial Statements
47
NOTE 18 – OTHER CURRENT AND NON-CURRENT LIABILITIES AND PROVISIONS
(in EUR millions)
Provisions for claims and
litigation
Provisions for environ-mental
risks
Provisions for restruc-turing
costs
Provisions for personnel costs
Provisions for customer
warranties
Provisions for other contin-
gencies
Total provision for other liabilities
Investment-related
liabilities
Total
At January 1, 2012 restatedCurrent portion 117 33 93 36 113 138 530 204 734
Non-current portion 1,384 136 90 37 142 255 2,044 125 2,169Total 1,501 169 183 73 255 393 2,574 329 2,903
Movements during the yearAdditions 157 8 151 24 95 88 523 523
Reversals (7) (2) (37) (8) (24) (53) (131) (131)
Utilizations (97) (13) (112) (18) (66) (77) (383) (383)
Changes in Group structure 0 0 5 1 0 4 10 10
Other (reclassifications and translation adjustments) (6) (11) (5) (5) (4) 9 (22) (245) (267)
Total movements 47 (18) 2 (6) 1 (29) (3) (245) (248)
At December 31, 2012 restatedCurrent portion 102 16 98 32 105 103 456 2 458
Non-current portion 1,446 135 87 35 151 261 2,115 82 2,197
Total 1,548 151 185 67 256 364 2,571 84 2,655
Movements during the yearAdditions 168 12 184 35 96 60 555 555
Reversals (25) (7) (32) (11) (25) (46) (146) (146)
Utilizations (109) (9) (140) (16) (50) (37) (361) (361)
Changes in Group structure 0 0 0 0 0 1 1 1
Other (reclassifications and translation adjustments) (18) 13 (1) (4) (8) (33) (51) 15 (36)
Total movements 16 9 11 4 13 (55) (2) 15 13
At December 31, 2013Current portion 111 27 113 28 148 51 478 1 479
Non-current portion 1,453 133 83 43 121 258 2,091 98 2,189Total 1,564 160 196 71 269 309 2,569 99 2,668
Provisions for claims and litigation In 2013, provisions for claims and litigation covered potential costs arising from investigations by the competition authorities involving the Flat Glass business and from asbestos-related litigation. These provisions are described in further detail in Note 29. Provisions for environmental risks Provisions for environmental risks cover costs relating to environmental protection measures, as well as site rehabilitation and clean-up costs. Provisions for restructuring costs Provisions for restructuring costs came to €196 million at December 31, 2013 (December 31, 2012: €185 million), including net additions of €152 million during the year. The provisions primarily concern Benelux (€45 million), Germany (€39 million), France (€35 million) and the United Kingdom (€25 million).

Saint-Gobain Group Consolidated Financial Statements
48
Provisions for personnel costs These provisions primarily cover indemnities due to employees that are unrelated to the Group’s reorganization plans. Provisions for customer warranties These provisions cover the Group’s commitments under the warranties granted to customers in the United States and other markets. They are determined on a statistical basis using a range of criteria and take into account contractual warranty payments made in prior years in the business and region concerned. In addition, specific provisions may be set aside for identified risks. Provisions for other contingencies At December 31, 2013, provisions for other contingencies amounted to €309 million and mainly concerned France (€89 million), Germany (€82 million), the United States (€47 million) and Latin America (€42 million). Investment-related liabilities Changes in investment-related liabilities primarily concerned liabilities arising from put options granted to minority shareholders in subsidiaries.
NOTE 19 – TRADE AND OTHER ACCOUNTS PAYABLE AND ACCR UED EXPENSES
(in EUR millions)December 31,
2013December 31,
2012
Trade accounts payable 5,928 6,143
Customer deposits 826 795
Payable to suppliers of non-current assets 282 298
Grants received 89 125
Accrued personnel expenses 1,135 1,173
Accrued taxes other than on income 395 408
Other 584 609
France 76 89
Germany 58 57
United Kingdom 108 120
Other Western European countries 104 109
North America 41 32
Emerging countries and Asia 197 202
Total other payables and accrued expenses 3,311 3,408
Trade and other accounts payable are due mainly within one year, with the result that their carrying amount approximates fair value.

Saint-Gobain Group Consolidated Financial Statements
49
NOTE 20 – RISK FACTORS MARKET RISKS (LIQUIDITY, INTEREST RATE, FOREIGN EXCHANGE, ENERGY AND CREDIT RISKS) Liquidity risk on financing In a crisis environment, the Group could be unable to raise the financing or refinancing needed to cover its investment plans on the credit market or the capital market, or to obtain such financing or refinancing on acceptable terms. There is also no guarantee that the Company’s credit rating will remain at the current level. The Group’s overall exposure to liquidity risk on net debt is managed by the Treasury and Financing Department of Compagnie de Saint-Gobain. Except in special cases, all of the Group companies’ long-term financing needs and the majority of their short-term financing needs are met by Compagnie de Saint-Gobain or by the Delegations’ cash pools. The main objective of liquidity risk management processes is to guarantee that the Group’s financing sources will be rolled over at maturity and to optimize annual borrowing costs. Long-term debt therefore systematically represents a high percentage of overall debt. At the same time, the maturity schedules of long-term debt are set in such a way that replacement capital market issues are spread over time. Medium-term notes are the main source of long-term financing used by the Group, along with bonds. However it also uses perpetual bonds, participating securities, a long-term securitization program, bank borrowings and lease financing. Short-term debt is composed of borrowings under French Commercial Paper (Billets de Trésorerie) programs and, from time to time, Euro Commercial Paper and US Commercial Paper programs, but also includes receivables securitization programs and bank overdrafts. Short-term financial assets comprise marketable securities and cash equivalents. To maintain secure sources of financing, Compagnie de Saint-Gobain has various confirmed syndicated lines of credit. A breakdown of long- and short-term debt is provided by type and maturity in Note 21. The amounts, currencies, and acceleration clauses of the Group’s financing programs and confirmed credit lines are also discussed in Note 21. Saint-Gobain’s long-term debt issues have been rated BBB with a negative outlook by Standard & Poor’s since October 29, 2012 and Baa2 with a negative outlook by Moody’s since November 12, 2012. Liquidity risk on investments Short-term investments consist of bank deposits and mutual fund units. To reduce liquidity or volatility risk, whenever possible, the Group invests in money market and/or bond funds.

Saint-Gobain Group Consolidated Financial Statements
50
Interest rate risks The Group’s overall exposure to interest rate risk on net debt is managed by the Treasury and Financing Department of Compagnie de Saint-Gobain. Where subsidiaries use derivatives to hedge interest rate risks, their counterparty is generally Compagnie de Saint-Gobain, the Group’s parent company. The Group’s overall exposure to interest rate risk on consolidated debt is managed primarily with the objective of fixing the cost of medium-term debt and optimizing annual borrowing costs. According to Group policy, the derivative financial instruments used to hedge these risks comprise interest rate swaps, cross-currency swaps, options – including caps, floors and swaptions – and forward rate agreements. Based on a sensitivity analysis of the Group’s total net debt after hedging, a 50-basis point increase in euro interest rates at the balance sheet date would lead to an €12 million increase in net income, and a 50-basis point increase in euro and sterling interest rates at the balance sheet date would lead to a €6 million increase in equity. Foreign exchange risk The currency hedging policies described below could be inadequate to protect the Group against unexpected or sharper than expected fluctuations in exchange rates resulting from economic and financial market conditions. Foreign exchange risks are managed by hedging commercial transactions carried out by Group entities in currencies other than their functional currencies. Compagnie de Saint-Gobain and its subsidiaries use foreign exchange contracts and currency options to hedge exposures arising from current and future commercial transactions. The subsidiaries generally set up options through the Group’s parent company, Compagnie de Saint-Gobain, which then takes a reverse position on the market. Most forward contracts have short maturities, of around three months. However, forward contracts taken out to hedge firm orders may have terms in excess of one year. Wherever possible, foreign exchange risks are hedged with Compagnie de Saint-Gobain upon receipt of the orders sent by the subsidiaries, or with the local delegations’ cash pools. In other cases, hedges are contracted with the subsidiaries’ banks. The Group monitors its exposure to foreign exchange risk using a monthly reporting system that captures the foreign exchange positions taken by subsidiaries. At December 31, 2013, 98% of the Group’s foreign exchange position was hedged. The net foreign exchange exposure of subsidiaries whose functional currency is not one of those presented below was as follows at December 31, 2013:
(in millions of euro equivalents)Long Short
EUR 1 2
USD 3 8
Other currencies 0 6
Total 4 16

Saint-Gobain Group Consolidated Financial Statements
51
Based on a sensitivity analysis at December 31, 2013, a 10% increase in the exchange rates of the main currencies used by subsidiaries would have the following impact on net income:
(in EUR millions)Net gain or
loss
EUR (0.1)
USD (0.5) A 10% fall in exchange rates would have a reverse impact in the same amounts, assuming that all other variables were unchanged. Energy and raw materials risk The Group is exposed to changes in the price of raw materials used in its products and in energy prices. The energy and raw materials hedging programs may be inadequate to protect the Group against significant or unforeseen price swings that could result from the prevailing financial and economic environment. The Group may limit its exposure to energy price fluctuations by using swaps and options to hedge part of its fuel oil, natural gas and electricity purchases. The swaps and options are mainly contracted in the functional currency of the entities concerned. Hedges of gas and fuel oil purchases are managed by a steering committee comprising members of the Group Finance Department, the Group Purchasing Department (Saint-Gobain Achats – SGA) and the relevant Delegations. Hedges of energy purchases (excluding fixed-price purchases negotiated directly with suppliers by the Purchasing Department) are generally arranged by the Group Treasury and Financing Department (or with the Delegations’ treasury departments) in accordance with instructions received from SGA. The steering committee does not manage hedges not mentioned above because:
� the volumes involved are not material, or � there are no international price indexes used by local players and transactions are therefore based on either
administered prices or strictly national indexes. In both of these cases, local purchasing units manage energy risk primarily through fixed-price purchases. The Group may from time to time enter into contracts to hedge purchases of other commodities, in accordance with the principles outlined above for energy purchases. Credit risk The Group may be exposed to the risk of losses on cash and other financial instruments held or managed on its behalf by financial institutions, if any of its counterparties defaults on its obligations. Group policy is to limit its exposure by dealing solely with leading counterparties and monitoring their credit ratings, in line with guidelines approved by the Board of Directors. However, credit risks arising from transactions with financial counterparties can escalate rapidly and a high credit rating is no guarantee that an institution will not experience a rapid deterioration of its financial position. As a result, there is no guarantee that this policy will be effective in entirely eliminating counterparty risk. Any default by a counterparty could have a material adverse effect on the Group’s objectives, operating income and financial position.

Saint-Gobain Group Consolidated Financial Statements
52
To limit the Group’s exposure to credit risk, the Treasury and Financing Department deals primarily with counterparties with a long-term rating of A- or above from Standard & Poor’s or A3 or above from Moody’s. Concentrations of credit risk are closely monitored to ensure that they remain at reasonable levels. Note 22 provides details of the Group’s interest rate and energy hedges, and the interest rates for the main items of debt. It also provides a breakdown of debt by currency and interest rate (fixed or variable).
NOTE 21 – NET DEBT Long- and short-term debt
Long- and short-term debt consists of the following:
(in EUR millions)December 31,
2013December 31,
2012
Bond issues and Medium-Term Notes 8,374 8,989
Perpetual bonds and participating securities 203 203
Securitizations long-term 400 0
Other long-term debt including finance leases 383 374
Fair value of interest rate hedges 35 22
Total long-term debt (excluding current portion) 9,395 9,588
Current portion of long-term debt 1,721 1,732
Short-term financing programs (US CP, Euro CP, Billets de trésorerie) 110 691
Bank overdrafts and other short-term bank borrowings 597 570
Securitizations short-term 91 89
Fair value of derivatives not qualified as hedges of debt (2) (1)
Short-term debt and bank overdrafts 796 1,349
TOTAL GROSS DEBT 11,912 12,669
Cash at bank (1,312) (1,400)
Mutual funds and other marketable securities (3,079) (2,779)
Cash and cash equivalents (4,391) (4,179)
TOTAL NET DEBT, INCLUDING ACCRUED INTEREST 7,521 8,49 0 The fair value of gross long-term debt (including the current portion) managed by Compagnie de Saint-Gobain amounted to €10.5 billion at December 31, 2013, for a carrying amount of €9.9 billion. The fair value of bonds corresponds to the market price on the last day of the year. For other borrowings, fair value is considered as being equal to the amount repayable.

Saint-Gobain Group Consolidated Financial Statements
53
Debt repayment schedule
Debt at December 31, 2013 can be analyzed as follows by maturity:
(in EUR millions) CurrencyWithin 1 year 1 to 5 years Beyond 5 years Total
Bond issues and Medium-Term Notes EUR 1,187 3,822 3,415 8,424
GBP 359 655 1,014
JPY 34 34
NOK 89 89
Perpetual bonds and participating securities EUR 203 203
Securitizations long-term EUR 181 400 581
Other long-term debt including finance leases All currencies 144 223 160 527
Fair value of interest rate hedges EUR 35 35
Accrued interests long-term debt All currencies 209 209
TOTAL LONG-TERM DEBT 1,721 4,927 4,468 11,116
Borrowings due within one year and other short-term financing All currencies 795 795
Fair value of derivatives not qualified as hedges of debt All currencies (2) (2)
Accrued interests short-term debt All currencies 3 3
TOTAL SHORT-TERM DEBT 796 0 0 796
TOTAL GROSS DEBT 2,517 4,927 4,468 11,912
At December 31, 2013, future interest payments on gross long-term debt (including the current portion) managed by Compagnie de Saint-Gobain were due as follows:
(in EUR millions)Within 1 year 1 to 5 years Beyond 5 years Total
Future interest payments on gross long-term debt 409 1,101 840 2,350
Interest on perpetual bonds and participating securities is calculated through to 2033. Bonds During 2013, Compagnie de Saint-Gobain carried out the following debt management transactions to extend the average maturity of debt while reducing average borrowing costs. • On March 27, 2013, NOK 750 million 5-year 4% bond issue, due 2018; • On March 28, 2013, €100 million 20-year 3.875% private placement, due 2033; • On June 5, 2013, €164 million 10.5-year 2.875% private placement, due December 2023, increased to €362
million through five tap issues: - On July 3, for €70 million ; - On October 21, for €66 million (two issues); - On November 26, for €62 million (two issues).
• On September 25, 2013, €37 million 20-year 4.18% private placement, due September 2033;

Saint-Gobain Group Consolidated Financial Statements
54
• On September 27, 2013, €10 million 20-year 4.16% private placement, due September 2033. On January 29, 2013, a €155 million bank loan was repaid at maturity. On May 20, 2013, a €575 million bond issue was redeemed at maturity. On September 16, 2013, a €606 million bond issue was redeemed at maturity. Perpetual bonds In 1985, Compagnie de Saint-Gobain issued €125 million worth of perpetual bonds (25,000 bonds with a face value of €5,000). Up to December 31, 2013, 18,496 perpetual bonds had been bought back and canceled, and 6,504 perpetual bonds were outstanding, representing a total face value of €33 million. The bonds pay interest at a variable rate indexed to Euribor. Interest paid in 2013 amounted to €31.68 per bond. The bonds are not redeemable and interest on them is classified as a component of finance costs. Participating securities In June 1983, Compagnie de Saint-Gobain issued 1,288,299 non-voting participating securities with a face value of FRF 1,000. Their face value is now €152.45, following their conversion into euros in 1999. A certain number of securities have been bought back over the years. At December 31, 2013, 606,883 securities were outstanding with an aggregate face value of €92.5 million. Interest on the securities ranges from 75% to 125% of the average corporate bond rate (TMO), based on the Group’s consolidated income. Interest paid in 2013 amounted to €5.30 per security. In April 1984, 194,633 non-voting participating securities were issued with a face value of ECU 1,000, now €1,000. A certain number of securities have been bought back over the years. At December 31, 2013, 77,516 securities were outstanding with an aggregate face value of €77.5 million. Interest comprises (i) a fixed portion of 7.5% per year applicable to 60% of the security, and (ii) a variable portion applicable to the remaining 40% of the security, which is linked to consolidated net income of the previous year, subject to the cap specified in the issue agreement. In all, depending on the level of consolidated net income, the interest rate ranges from a minimum of 4.5% to a maximum of 6.75% if the TMOE rate is below 5% or TMOE + 175bps if the TMOE rate is above 5%. Interest for 2013 amounted to €63.70 per security, paid in two installments (€33.55 and €30.15). These securities are not redeemable and the interest paid on them is reported under “Borrowing costs”.

Saint-Gobain Group Consolidated Financial Statements
55
Financing programs Compagnie de Saint-Gobain has a number of medium and long-term financing programs (Medium Term Notes) and short-term financing programs (Commercial Paper and Billets de Trésorerie). At December 31, 2013, issuance under these programs was as follows:
Programs Currency Maturities Authorized program at Dec.
31, 2013
Outstanding issues at Dec. 31, 2013
Outstanding issues at Dec. 31, 2012
(in millions of currency units)
Medium Term Notes EUR 1 to 30 years 15,000 9,375 9,246
US Commercial Paper USD Up to 12 months 1,000* 0 0
Euro Commercial Paper USD Up to 12 months 1,000* 0 0
Billets de Trésorerie EUR Up to 12 months 3,000 110 691
*Equivalent to €725 million based on the exchange rate at December 31, 2013.
In accordance with market practices, Billets de Trésorerie, Euro Commercial Paper and US Commercial Paper are generally issued with maturities of one to six months. They are treated as variable-rate debt, because they are rolled over at frequent intervals. Syndicated lines of credit Compagnie de Saint-Gobain has various syndicated lines of credit that are intended to provide a secure source of financing for the Group (including as additional backing for its US Commercial Paper, Euro-Commercial Paper and Billets de Trésorerie programs). They include: • An initial €1.5 billion syndicated line of credit expiring in December 2017, that was obtained in December
2012. The facility was renegotiated in December 2013 and rolled over until December 2018 for €1.46 billion. • A second €2.54 billion syndicated line of credit expiring in December 2018 with two one-year rollover options
that was obtained in December 2013. At the same time, the €2.5 billion line of credit expiring in December 2015 was canceled.
Based on Saint-Gobain’s current credit rating for long-term debt issues, the two facilities are not subject to any hard covenants. Neither of these two lines of credit was drawn down at December 31, 2013. Receivables securitization programs The Group has set up two receivables securitization programs, one through its French subsidiary GIE Point-P Finances, and the other through its US subsidiary, Saint-Gobain Receivables Corporation. The €600 million French program was set up on December 2, 2013. At December 31, 2013, it amounted to €581 million. Based on observed seasonal fluctuations in receivables included in the program and on the contract's features, €400 million of this amount was classified as non-current and the balance as current.

Saint-Gobain Group Consolidated Financial Statements
56
Interest on the program amounted to €0.2 million in 2013. The US program, which is rolled over each year, amounted to €91 million at December 31, 2013 (December 31, 2012: €89 million). Interest on the program amounted to €1.8 million in 2013 (2012: €2.5 million). Bank overdrafts and other short-term bank borrowings
This item includes bank overdrafts, local short-term bank borrowings taken out by subsidiaries, and accrued interest on short-term debt. Collateral
At December 31, 2013, €49 million of Group debt was secured by various non-current assets (real estate and securities).
NOTE 22 - FINANCIAL INSTRUMENTS Derivatives The following table presents a breakdown of the principal derivatives used by the Group:
(in EUR millions)
Derivatives recorded in
assets
Derivatives recorded in
liabilities
Total Within 1 year 1 to 5 years Beyond 5 years
Total
Fair value hedges 0 0 0 0 0 0 0 0
Cash flow hedges
Currency 12 (4) 8 1 1,101 18 0 1,119
Interest rate 4 (39) (35) (22) 0 0 395 395
Energy and commodity 0 0 0 (2) 42 4 0 46
Other risks 3 0 3 0 0 41 0 41
Cash flow hedges - total 19 (43) (24) (23) 1,143 63 395 1,601
Derivatives not qualifying for hedge accounting
Currency 4 (9) (5) 6 1,508 1 0 1,509
Interest rate 0 0 0 0 0 0 0 0
Energy and commodity 0 0 0 0 0 0 0 0
Derivatives non qualifying for hedge accounting - total 4 (9) (5) 6 1,508 1 0 1,509
TOTAL 23 (52) (29) (17) 2,651 64 395 3,110
"o/w derivatives used to hedge net debt" 14 (47) (33) (21) 0
Fair value at December 31, 2013 Nominal value broken down by maturity at December 31, 2013Fair value at December 31,
2012

Saint-Gobain Group Consolidated Financial Statements
57
Currency instruments
� Currency swaps The Group uses currency swaps mainly to convert euro-denominated funds into foreign currencies for cash management purposes.
� Forward foreign exchange contracts and currency options Forward foreign exchange contracts and currency options are used to hedge foreign currency transactions, particularly commercial transactions (purchases and sales) and investments. Interest rate instruments
� Interest rate swaps The Group uses interest rate swaps to convert part of its fixed (variable) rate bank debt and bond debt to variable (fixed) rates.
� Cross-currency swaps The Group uses cross-currency swaps to convert foreign currency debt (euro debt) into euro debt (foreign currency debt). Energy and commodity instruments
� Energy and commodity swaps Energy and commodity swaps are used to hedge the risk of changes in the price of certain purchases used in the subsidiaries’ operating activities, particularly energy (fuel oil, natural gas and electricity) purchases. Other risks
� Equity derivatives Equity derivatives are used to hedge the risk of changes in the Saint-Gobain share price in connection with the performance units-based long-term incentive plan. Credit value adjustments to derivative instruments Credit value adjustments to derivative instruments are calculated in accordance with IFRS 13 based on historical probabilities of default derived from calculations performed by a leading rating agency and on the estimated loss given default. At December 31, 2013, credit value adjustments were not material. Impact on equity of financial instruments qualifying for hedge accounting At December 31, 2013, the cash flow hedging reserve carried in equity in accordance with IFRS had a credit balance of €7 million, mainly breaking down as follows:

Saint-Gobain Group Consolidated Financial Statements
58
• €25 million debit balance corresponding to the interest rate component of cross-currency swaps designated as cash flow hedges that are used to convert a bond issue into euros;
• €23 million credit balance corresponding to fair value adjustments to currency instruments qualified as cash flow hedges;
• €4 million credit balance corresponding to fair value adjustments to interest rate instruments qualified as cash
flow hedges; • €3 million credit balance corresponding to fair value adjustments to equity-based instruments qualified as cash
flow hedges. • €2 million credit balance corresponding to fair value adjustments to other instruments qualified as cash
flow hedges to be reclassified to income when the hedged items affect income.
The ineffective portion of gains and losses on cash flow hedges is not material. Impact on income of financial instruments not qualifying for hedge accounting The fair value of derivatives classified as financial assets and liabilities at fair value through profit or loss represented a €5 million loss at December 31, 2013 (December 31, 2012: €6 million profit). Embedded derivatives Saint-Gobain regularly analyzes its contracts in order to separately identify financial instruments classified as embedded derivatives under IFRS. At December 31, 2013, no embedded derivatives deemed to be material at Group level were identified. Group debt structure The weighted average interest rate on total debt under IFRS, after hedging (using currency swaps, cross-currency swaps and interest rate swaps) was 4.4% at December 31, 2013 (December 31, 2012: 4.7%).
� Internal rate of return on long-term debt
The average internal rate of return for the main component of long-term debt before hedging (bonds and medium-term notes) was 4.89% at December 31, 2013 (December 31, 2012: 5.17%).
The table below presents the breakdown by interest rate (fixed or variable) of the Group’s gross debt at December 31, 2013, after giving effect to interest rate swaps, cross-currency swaps and currency swaps. Gross debt denominated in foreign currencies
(in EUR millions)Variable rate Fixed
rateTotal
EUR 910 8,802 9,712
Other currencies 984 971 1,955
TOTAL 1,894 9,773 11,66716% 84% 100%
Fair value of related derivatives 33
Accrued interest 212
TOTAL GROSS DEBT 11,912
After hedging

Saint-Gobain Group Consolidated Financial Statements
59
NOTE 23 – FINANCIAL ASSETS AND LIABILITIES Financial assets and liabilities are classified as follows in accordance with IFRS 7:
Dec. 31, 2013(in EUR millions)
Balance sheet headings and classes of instrument
Notes Financial instruments
throught profit or loss
Derivatives designated as
hedges
Assets and liabilities
measured at fair value (fair value
option)
Available-for-sale financial
assets
Loans and receivables
Liabilities at amortized cost
Level 1: quoted prices and cash
Level 2: internal model using
observable factors
Level 3: internal model using non
observable factors
Trade and other accounts receivables (11) 0 6,199 6,199 0
Loans and deposits (9) 0 272 272 0
Available for sale and other securities (9) 0 58 58 0
Derivatives recorded in assets (21)(22) 3 11 14 14 14 14
Cash and cash equivalents (21) 4,391 4,391 4,391 4,391 4,391
Total assets 3 11 4,391 4,405 58 6,471 0 10,934 4,391 14 0 4,405
Trade and other accounts payable (19) 0 (9,239) (9,239) 0
Long and short-term debt (21) 0 (11,879) (11,879) 0
Derivatives recorded in liabilities (21)(22) (8) (39) (47) (47) (47) (47)
Total liabilities (8) (39) 0 (47) 0 0 (21,118) (21,165) 0 (47) 0 (47)
Total (5) (28) 4,391 4,358 58 6,471 (21,118) (10,231) 4,391 (33) 0 4,358
Finzncial instruments at fair value Total financial instruments measured at
fair value
Other financial instruments Total financial instruments
Financial instrument at fair value hierarchy under IFRS 7
Total financial instruments measured at
fair value
Dec. 31, 2012(in EUR millions)
Balance sheet headings and classes of instrument
Notes Financial instruments
throught profit or loss
Derivatives designated as
hedges
Assets and liabilities
measured at fair value (fair value
option)
Available-for-sale financial
assets
Loans and receivables
Liabilities at amortized cost
Level 1: quoted prices and cash
Level 2: internal model using
observable factors
Level 3: internal model using non
observable factors
Trade and other accounts receivables (11) 0 6,442 6,442 0Loans and deposits (9) 0 261 261 0Available for sale and other securities (9) 0 41 41 0Derivatives recorded in assets (21)(22) 3 3 3 3 3Cash and cash equivalents (21) 4,179 4,179 4,179 4,179 4,179
Total assets 3 0 4,179 4,182 41 6,703 0 10,926 4,179 3 0 4,182
Trade and other accounts payable (19) 0 (9,551) (9,551) 0Long and short-term debt (21) (155) (155) (12,493) (12,648) (155) (155)Derivatives recorded in liabilities (21)(22) (2) (22) (24) (24) (24) (24)
Total liabilities (2) (22) (155) (179) 0 0 (22,044) (22,223) 0 (179) 0 (179)
Total 1 (22) 4,024 4,003 41 6,703 (22,044) (11,297) 4,179 (176) 0 4,003
Finzncial instruments at fair value Total financial instruments measured at
fair value
Other financial instruments Total financial instruments
Financial instrument at fair value hierarchy under IFRS 7
Total financial instruments measured at
fair value

Saint-Gobain Group Consolidated Financial Statements
60
NOTE 24 – BUSINESS INCOME BY EXPENSE TYPE
(in EUR millions)2013 2012 restated
Net sales 42,025 43,198
Personnel costs
Salaries and payroll taxes (8,218) (8,431)
Share-based payments(a)(19) (14)
Pensions(b)(129) (23)
Depreciation and amortization (1,425) (1,550)
Other(c)(29,470) (30,317)
Operating income 2,764 2,863
Other business income(d)186 116
Negative goodwill recognized in income 0 0
Other business income 186 116
Restructuring costs(e)(308) (285)
Provisions and expenses relating to claims and litigation(f)(145) (152)
Impairment of assets and other business expenses(g)(568) (505)
Other (38) (71)
Other business expense (1,059) (1,013)
Business income 1,891 1,966 (a) Details of share-based payments (IFRS 2 expense) are provided in Notes 13, 14 and 15.
(b) Changes in pension costs are presented in Note 16 “Provisions for pensions and other employee benefits”.
(c) This item corresponds to Building Distribution Sector cost of sales, supplier discounts and selling expenses, and to transport costs, raw materials costs, and other production costs for the other Sectors. This item also includes net foreign exchange gains and losses, representing a net gain of €12 million in 2013 (2012: net gain of €13 million). In 2013, research and development costs recorded under operating expenses amounted to €418 million (2012: €451 million).
(d) This item includes capital gains on disposals of property, plant and equipment and intangible assets.
(e) Restructuring costs in 2013 mainly consisted of employee termination benefits in an amount of €187 million (2012: €180 million).
(f) In the periods presented, provisions and expenses relating to claims and litigation corresponded for the most part to asbestos-related litigation and the provision for the competition litigation discussed in Notes 18 and 29.
(g) Impairment losses on assets in 2013 included €216 million on goodwill (2012: €67 million) and €256 million on property, plant and equipment and intangible assets (2012: €371 million). In addition, €4 million in impairment losses on financial assets and current assets were recorded (2012: €2 million in impairment losses reversed). The caption “Other” includes capital losses on disposals of assets and scrapping for €87 million (2012: €56 million) and acquisition costs incurred in connection with business combinations for €5 million (2012: €13 million).
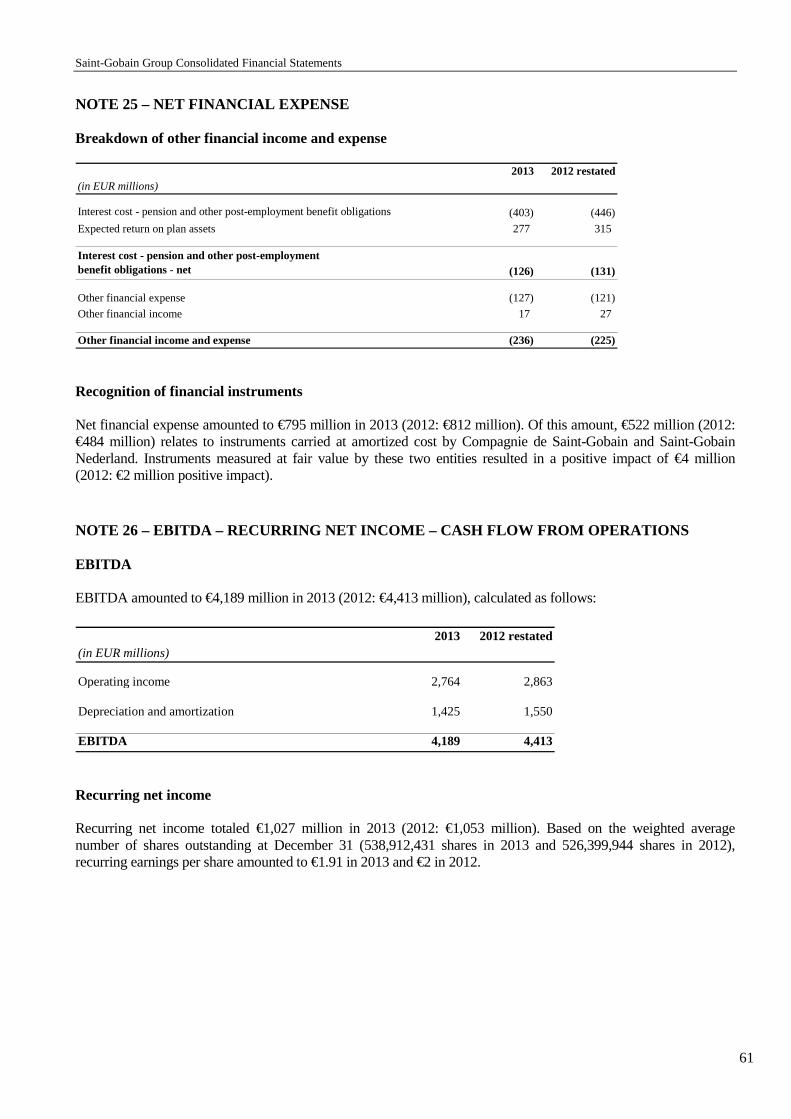
Saint-Gobain Group Consolidated Financial Statements
61
NOTE 25 – NET FINANCIAL EXPENSE Breakdown of other financial income and expense
(in EUR millions)2013 2012 restated
Interest cost - pension and other post-employment benefit obligations (403) (446)
Expected return on plan assets 277 315
Interest cost - pension and other post-employment benefit obligations - net (126) (131)
Other financial expense (127) (121)
Other financial income 17 27
Other financial income and expense (236) (225) Recognition of financial instruments Net financial expense amounted to €795 million in 2013 (2012: €812 million). Of this amount, €522 million (2012: €484 million) relates to instruments carried at amortized cost by Compagnie de Saint-Gobain and Saint-Gobain Nederland. Instruments measured at fair value by these two entities resulted in a positive impact of €4 million (2012: €2 million positive impact).
NOTE 26 – EBITDA – RECURRING NET INCOME – CASH FLOW FROM OPERATIONS EBITDA EBITDA amounted to €4,189 million in 2013 (2012: €4,413 million), calculated as follows:
(in EUR millions)2013 2012 restated
Operating income 2,764 2,863
Depreciation and amortization 1,425 1,550
EBITDA 4,189 4,413 Recurring net income Recurring net income totaled €1,027 million in 2013 (2012: €1,053 million). Based on the weighted average number of shares outstanding at December 31 (538,912,431 shares in 2013 and 526,399,944 shares in 2012), recurring earnings per share amounted to €1.91 in 2013 and €2 in 2012.

Saint-Gobain Group Consolidated Financial Statements
62
The difference between net income and recurring net income (attributable to equity holders of the parent) corresponds to the following items:
(in EUR millions)2013 2012 restated
Net income attributable to equity holders of the parent 595 693
Less:
Gains on disposals of assets 99 60Impairment of assets and acquisition costs incurred in connexion with business combinations (480) (449)Provision for competition litigation and other non-recurring provision charges (77) (96)
Impact of minority interests 0 2
Tax impact 26 123
Recurring net income attributable to equity holders of the parent 1,027 1,053 Cash flow from operations Cash flow from operations for 2013 amounted to €2,537 million (2012: €2,718 million). Excluding tax on capital gains and non-recurring provision charges, cash flow from operations came to €2,511 million in 2013 (2012: €2,595 million). These amounts are calculated as follows:
(in EUR millions)2013 2012 restated
Net income attributable to equity holders of the parent 595 693
Minority interests in net income 36 30Share in net income of associates, net of dividends received (3) (6)
Depreciation, amortization and impairment of assets 1,897 1,988
Gains and losses on disposals of assets (99) (60)
Non-recurring charges to provisions 77 96Unrealized gains and losses arising from changes in fair value and share-based payments 34 (23)
Cash flow from operations 2,537 2,718
Tax on capital gains and losses and non-recurring charges to provisions (26) (123)
Cash flow from operations before tax on capital gains and losses and non-recurring charges to provisions 2,511 2,595

Saint-Gobain Group Consolidated Financial Statements
63
NOTE 27 – EARNINGS PER SHARE The calculation of earnings per share is shown below.
Net income attributable to equity holders
of the parent (in EUR millions)
Number of shares
Earnings per share
(in EUR )
2013
Weighted average number of shares outstanding 595 538,912,431 1.10Weighted average number of shares assuming full dilution 595 541,981,225 1.10
2012 restated
Weighted average number of shares outstanding 693 526,399,944 1.32Weighted average number of shares assuming full dilution 693 528,692,847 1.31 The weighted average number of shares outstanding is calculated by deducting treasury stock (3,759,173 shares at December 31, 2013) from the average number of shares outstanding during the year. The weighted average number of shares assuming full dilution is calculated based on the weighted average number of shares outstanding, assuming conversion of all dilutive instruments. The Group’s dilutive instruments include stock options and performance share grants corresponding to a weighted average of 737,508 and 2,331,286 shares respectively in 2013.
NOTE 28 – COMMITMENTS
Commitments related to shares in subsidiaries and associates Puts granted to minority shareholders are carried in the balance sheet under investment-related liabilities. They are reviewed on a periodic basis and any subsequent changes in their fair value are recognized by adjusting equity.
Financing-related commitments The Group’s commitments related to debt and financial instruments are discussed in Notes 21 and 22, respectively.
Commitments related to operating activities
� Obligations under finance leases Non-current assets acquired under finance leases are recognized as an asset and a liability in the consolidated balance sheet.

Saint-Gobain Group Consolidated Financial Statements
64
At December 31, 2013, €26 million of future minimum lease payments due under finance leases concerned land and buildings. Total assets under finance leases recognized in consolidated assets amounted to €77 million at December 31, 2013 (December 31, 2012: €109 million).
(in EUR millions)December 31,
2013December 31,
2012
Future minimum lease payments
Due within 1 year 19 21
Due in 1 to 5 years 42 43
Due beyond 5 years 14 10
Total 75 74 Less finance charge (12) (9)
Present value of future minimum lease payments 63 65
� Obligations under operating leases The Group leases equipment, vehicles and office, manufacturing and warehouse space under various non-cancelable operating leases. Lease terms generally range from one to nine years. The commitment corresponding to total future minimum payments over the lease term is discounted. The leases contain rollover options for varying periods of time and some include clauses covering the payment of real estate taxes and insurance. In most cases, management expects that these leases will be rolled over or replaced by other leases in the normal course of business.
Net rental expense was €841 million in 2013, corresponding to rental expense of €860 million – of which €561 million for property leases – less €19 million in revenue from subleases.
Future minimum payments due under non-cancelable operating leases are as follows:
(in EUR millions)Within 1 year In 1 to 5 years Beyond 5 years
Operating leasesRental expense 3,068 744 1,538 786 3,022
Subletting revenue (60) (17) (27) (16) (56)
Total 3,008 727 1,511 770 2,966
Total 2013 Total 2012Payments due

Saint-Gobain Group Consolidated Financial Statements
65
� Non-cancelable purchase commitments Non-cancelable purchase commitments include commitments to purchase raw materials and services and firm orders for property, plant and equipment.
(in EUR millions)Within 1 year In 1 to 5 years Beyond 5 years
Non-cancelable purchase commitmentsNon-current assets 58 43 15 0 128
Raw materials and energy 1,183 376 618 189 1,096
Services 312 100 192 20 218
Investments and other 40 31 9 0 57
Total 1,593 550 834 209 1,499
Total 2013 Total 2012Payments due
The €94 million increase in non-cancelable purchase commitments in 2013 mainly concerned purchases of energy and services.
� Guarantee commitments In some cases, the Group grants seller’s warranties to the buyers of divested businesses. A provision is set aside whenever a risk is identified and the related cost can be estimated reliably. The Group also receives guarantees, amounting to €118 million at December 31, 2013 (December 31, 2012: €110 million).
� Commercial commitments
(in EUR millions)Within 1 year In 1 to 5 years Beyond 5 years
Commercial commitmentsSecurity for borrowings 49 13 22 14 45
Other commitments given 166 43 61 62 163
Total 215 56 83 76 208
Total 2013 Total 2012Payments due
At December 31, 2013, pledged assets amounted to €618 million (December 31, 2012: €708 million). The year-on-year net decline mainly reflected a decrease in pledges of fixed assets in India and an increase in pledges of financial assets in the United Kingdom. Guarantees given to the Group in respect of receivables amounted to €122 million at December 31, 2013 (December 31, 2012: €136 million).
� Other commitments
Greenhouse gas emissions allowances granted to Group companies under the 2008-2012 plan represent approximately 6.9 million metric tons of CO2 emissions per year. The 2013 and 2012 allowances are above the greenhouse gas emissions for those years and, consequently, no provision has been recorded in this respect in the Group accounts.

Saint-Gobain Group Consolidated Financial Statements
66
NOTE 29 – LITIGATION Asbestos-related litigation in France
• Inexcusable fault lawsuits In France, further individual lawsuits were filed in 2013 by former employees (or persons claiming through them) of Everite and Saint-Gobain PAM (“the employers”) – which in the past had carried out fiber-cement operations – for asbestos-related occupational diseases, with the aim of obtaining supplementary compensation over and above the amounts paid by the French Social Security authorities in this respect. A total of 767 such lawsuits have been issued against the two companies since 1997. At December 31, 2013, 704 of these 767 lawsuits had been completed in terms of both liability and quantum. In all of these cases, the employers were held liable on the grounds of “inexcusable fault”. Compensation paid by Everite and Saint-Gobain PAM in settlement of these lawsuits totaled approximately €1.4 million. Concerning the 63 lawsuits outstanding against Everite and Saint-Gobain PAM at December 31, 2013, the merits of eight have been decided but the compensation awards have not yet been made, pending issue of medical reports or Appeal Court rulings. A further 31 of these 63 lawsuits have been completed in terms of both liability and quantum, but liability for the payment of compensation has not yet been assigned. Out of the 24 remaining lawsuits, at December 31, 2013 the procedures relating to the merits of 20 cases were at different stages, with two in the process of being investigated by the French Social Security authorities and 18 pending before the Social Security courts. The final four suits have been struck out. The plaintiffs can ask for them to be re-activated at any time within a two-year period. In addition, as of December 31, 2013, 198 similar suits had been filed since the outset by current or former employees of fourteen other French companies in the Group (excluding Saint-Gobain Desjonquères and Saint-Gobain Vetrotex, which have been sold), in particular involving circumstances where equipment containing asbestos had been used to protect against heat from furnaces. As of December 31, 2013, 135 lawsuits had been completed. In 62 of these cases, the employer was held liable for inexcusable fault. Compensation paid by the companies totaled approximately €0.9 million. For the 63 suits outstanding at December 31, 2013, arguments were being prepared by the French Social Security authorities in four cases, 49 were being investigated – including 34 pending before the Social Security courts and 15 before the Courts of Appeal – and seven had been completed in terms of liability but not in terms of quantum or liability for paying the compensation, of which six pending before the Courts of Appeal and one before the Court of Cassation. The final three suits have been struck out. The plaintiffs can ask for them to be re-activated at any time within a two-year period.

Saint-Gobain Group Consolidated Financial Statements
67
• Anxiety claims Nine of the Group’s French subsidiaries, including five that operate or have operated facilities in France classified as presenting an asbestos hazard, are the subject of damages claims that are different from those described above. “Facilities classified as presenting an asbestos hazard” are defined as manufacturing facilities that have been closed or are still operating which previously manufactured materials containing asbestos or used asbestos protection and insulation equipment and are included on the official list of facilities whose current or former employees are entitled to the asbestos workers benefit (ACAATA). At December 31, 2013, a total of 765 suits had been brought by current or former employees claiming compensation for various damages suffered as a result of their alleged exposure to asbestos. None of these plaintiffs were suffering from an asbestos-related disease and some of them were not receiving the ACAATA benefit. Of these 765 suits, 51 have been terminated. Three plaintiffs had their claims dismissed, while 48 others were recognized as having been exposed to an asbestos risk, and their claims were accepted, leading to payment of total compensation of €0.6 million. Of the remaining 714 suits, 78 are pending before the competent Courts of Appeal – including one where the appellant is the plaintiff and 77 where the appellants are the companies concerned – and 635 before the competent labor tribunals. These 635 suits are at different stages in the procedure. One has been struck out by the labor tribunal’s conciliation board, with the plaintiff entitled to ask for it to be re-activated at any time within a two-year period. Asbestos-related litigation in the United States In the United States, several companies that once manufactured products containing asbestos such as asbestos-cement pipes, roofing products, specialized insulation or gaskets, are facing legal action from persons other than their employees or former employees. These claims for compensatory – and in many cases punitive – damages are based on alleged exposure to the products, although in many instances the claimants cannot demonstrate any specific exposure to one or more products, or any specific illness or physical disability. The vast majority of these claims are made simultaneously against many other non-Group entities which have been manufacturers, distributors, installers or users of products containing asbestos.
• Developments in 2013 About 4,500 new claims were filed against CertainTeed in 2013, compared to about 4,000 in 2012 and 2011, 5,000 in 2010, and 4,000 in 2009. Over the last five years the number of new claims has remained relatively stable. Almost all of the claims against CertainTeed are settled out of court or dismissed. Approximately 4,500 of the pending claims were resolved in 2013, compared to 9,000 in 2012, 8,000 in 2011, 13,000 in 2010, and 8,000 in 2009. Taking into account the 43,000 outstanding claims at the end of 2012 and the new claims having arisen during the year, as well as claims settled, some 43,000 claims were outstanding at December 31, 2013. A large number of these pending claims were filed more than five years ago by individuals without any significant asbestos-related impairment, and it is likely that many of these claims ultimately will be dismissed.
• Impact on the Group’s accounts The Group recorded a €90 million charge in 2013 to cover future developments in relation to claims. This amount is identical to the amount recorded in 2012 and 2011, lower than the €97 million recorded in 2010, and higher than the €75 million recorded in 2009. At December 31, 2013, the Group reserve for asbestos-related claims against CertainTeed in the United States amount to €407 million (USD 561 million), compared with €417 million (USD €550 million) at December 2012, €389 million (USD 504 million) at December 31,2011, €375 million, (USD 501 million) at December 31, 2010, and €347 million, (USD 500 million) at December 31, 2009.

Saint-Gobain Group Consolidated Financial Statements
68
• Cash flow impact Compensation paid in respect of these claims against CertainTeed, including claims settled prior to 2013 but only paid out in 2013, and those fully resolved and paid in 2013, and compensation paid (net of insurance) in 2013 by other Group businesses in connection with asbestos-related litigation, amounted to €66 million (USD 88 million), compared to €52 million (USD 67 million) in 2012, €59 million (USD 82 million) in 2011, €78 million (USD 103 million) in 2010, and €55 million (USD 77 million) in 2009.
*** In Brazil, former Group employees suffering from asbestos-related occupational illness are offered either exclusively financial compensation or lifetime medical assistance combined with financial compensation. Only a small number of asbestos-related lawsuits brought by former employees (or persons claiming through them) were outstanding at December 31, 2013, and they do not currently represent a material risk for the companies concerned.
*** Ruling by the European Commission following the investigation into the automotive glass industries In the November 12, 2008 decision concerning its investigation into automotive glass manufacturers, the European Commission held that actions carried out between 1998 and 2003 by Saint-Gobain Glass France, Saint-Gobain Sekurit France and Saint-Gobain Sekurit Deutschland GmbhH had violated Article 81 of the Treaty of Rome and fined them €896 million. Compagnie de Saint-Gobain was held jointly and severally liable for the payment of this amount. The companies concerned believe the fine is excessive and disproportionate, and have appealed the decision before the General Court of the European Union. The European Commission has granted them a stay of payment until the appeal has been heard, in exchange for a bond covering the €896 million fine and the related interest, calculated at the rate of 5.25% from March 9, 2009. The necessary steps were taken to set up this bond within the required timeframe. The appeal was heard by the General Court of the European Union in Luxembourg on December 11, 2012. The Court was expected to hand down its ruling within six to twelve months, but had still not done so as of February 1, 2014. The ruling is now expected during 2014.
In a decision dated February 28, 2013, the European Commission reduced by €16 million the fine announced in November 2008, to correct a mistake that it had made in calculating the sales on which the fine was based. The reduced fine imposed by the Commission amounts to €880 million. The provision set aside to cover the fine, the late interest, the cost of the above bond and the related legal costs amounted to €1,119 million at December 31, 2013.

Saint-Gobain Group Consolidated Financial Statements
69
NOTE 30 – RELATED-PARTY TRANSACTIONS Balances and transactions with associates (in EUR millions) 2013 2012
AssetsFinancial receivables 3 1
Inventories 0 0
Short-term receivables 5 3
Cash and cash equivalents 0 0
Provisions for impairment in value 0 0
LiabilitiesShort-term debt 1 2
Cash advances 0 0
ExpensesPurchases 3 5
IncomeSales 30 35
Revenue from transactions with proportionately consolidated companies Transactions with proportionately consolidated companies are treated as transactions with external parties and the Group’s share of revenue arising from such transactions is not eliminated on consolidation. In 2013, these revenues amounted to 26 million (2012: €23 million). Transactions with key shareholders Some Group subsidiaries, particularly in the Building Distribution Sector, carry out transactions with subsidiaries of the Wendel group. All of these transactions are on an arm’s length basis.
NOTE 31 – JOINT VENTURES The amounts recorded in the balance sheet and income statement corresponding to the Group’s interest in its proportionately consolidated companies are as follows: (in EUR millions) 2013 2012
AssetsNon-current assets 278 277 Current assets 132 134
LiabilitiesNon-current liabilities 1 1 Current liabilities 86 90
ExpensesOperating expenses 260 258
IncomeSales 290 293
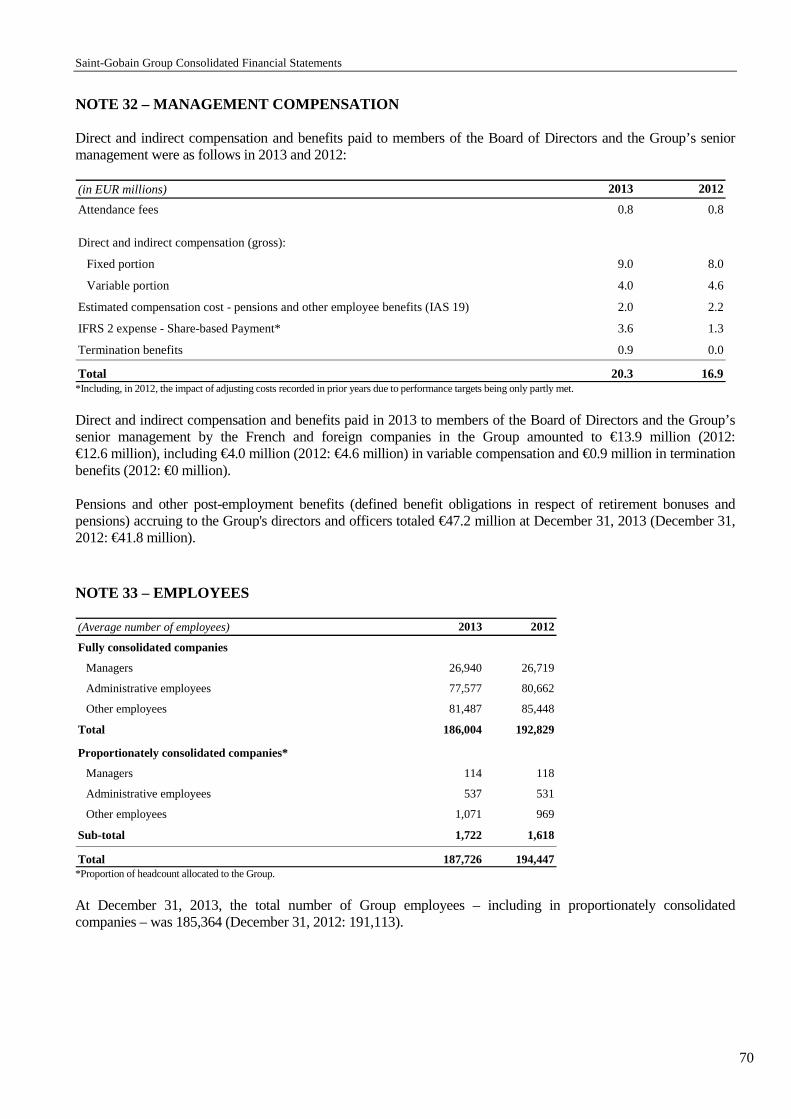
Saint-Gobain Group Consolidated Financial Statements
70
NOTE 32 – MANAGEMENT COMPENSATION Direct and indirect compensation and benefits paid to members of the Board of Directors and the Group’s senior management were as follows in 2013 and 2012: (in EUR millions) 2013 2012
Attendance fees 0.8 0.8
Direct and indirect compensation (gross):
Fixed portion 9.0 8.0
Variable portion 4.0 4.6
Estimated compensation cost - pensions and other employee benefits (IAS 19) 2.0 2.2
IFRS 2 expense - Share-based Payment* 3.6 1.3
Termination benefits 0.9 0.0
Total 20.3 16.9 *Including, in 2012, the impact of adjusting costs recorded in prior years due to performance targets being only partly met.
Direct and indirect compensation and benefits paid in 2013 to members of the Board of Directors and the Group’s senior management by the French and foreign companies in the Group amounted to €13.9 million (2012: €12.6 million), including €4.0 million (2012: €4.6 million) in variable compensation and €0.9 million in termination benefits (2012: €0 million). Pensions and other post-employment benefits (defined benefit obligations in respect of retirement bonuses and pensions) accruing to the Group's directors and officers totaled €47.2 million at December 31, 2013 (December 31, 2012: €41.8 million).
NOTE 33 – EMPLOYEES (Average number of employees) 2013 2012
Fully consolidated companies
Managers 26,940 26,719
Administrative employees 77,577 80,662
Other employees 81,487 85,448
Total 186,004 192,829
Proportionately consolidated companies*
Managers 114 118
Administrative employees 537 531
Other employees 1,071 969
Sub-total 1,722 1,618
Total 187,726 194,447 *Proportion of headcount allocated to the Group.
At December 31, 2013, the total number of Group employees – including in proportionately consolidated companies – was 185,364 (December 31, 2012: 191,113).

Saint-Gobain Group Consolidated Financial Statements
71
NOTE 34 – SEGMENT INFORMATION Segment information by Sector and Activity Segment information is presented as follows: • Innovative Materials (IM) Sector
� Flat glass � High-Performance Materials (HPM)
• Construction Products (CP) Sector � Interior Solutions: Insulation and Gypsum � Exterior Solutions: Industrial Mortars, Pipe and Exterior Fittings
• Building Distribution Sector • Packaging Sector
Management uses several different internal indicators to measure operational performance and to make resource allocation decisions. These indicators are based on the data used to prepare the consolidated financial statements and meet financial reporting requirements. Intragroup (“internal”) sales are generally carried out on the same terms as sales to external customers and are eliminated in consolidation. The accounting policies used are the same as those applied for consolidated financial reporting purposes, as described in Note 1. The column “Other” corresponds solely to holding companies and certain corporate support functions (tax, cash management, purchasing, etc.)
2013BUILDING
DISTRI-BUTION
PACKAGING Other* Total
(in EUR millions)
Flat Glass
High Performance
Materials
Intra-Segment Elimi-nations
TotalInterior
SolutionsExterior Solutions
Intra-Segment Elimi-nations
Total
External sales 4,957 3,987 8,944 5,331 5,347 10,678 18,769 3,616 18 42,025
Internal sales 39 99 (12) 126 574 331 (58) 847 4 0 (977) 0Net sales 4,996 4,086 (12) 9,070 5,905 5,678 (58) 11,525 18,773 3,616 (959) 42,025Operating income/(loss) 138 520 658 480 519 999 638 462 7 2,764Business income/(loss) (210) 459 249 439 473 912 329 422 (21) 1,891Share in net income/(loss) of associates 0 0 0 7 0 7 1 2 1 11Depreciation and amortization 316 155 471 313 175 488 261 175 30 1,425Impairment of assets 141 26 167 15 75 90 210 5 0 472Capital expenditure** 234 178 412 246 187 433 205 270 34 1,354Cash flow from operations 580 722 420 436 379 2,537EBITDA 454 675 1,129 793 694 1,487 899 637 37 4,189Goodwill, net 1,535 5,684 3,135 59 0 10,413Non-amortizable brands 0 847 1,919 0 0 2,766Total segment assets and liabilities***
6,951 11,780 8,138 1,947 152 28,968
INNOVATIVE MATERIALS CONSTRUCTION PRODUCTS
*“Other” corresponds to a) the elimination of intragroup transactions for internal sales and b) holding company transactions for the other captions. **Capital expenditure does not include the cost of acquiring non-current assets under finance leases. ***Segment assets and liabilities include net property, plant and equipment, working capital, goodwill and net other intangible assets, after deducting deferred taxes on brands and land.
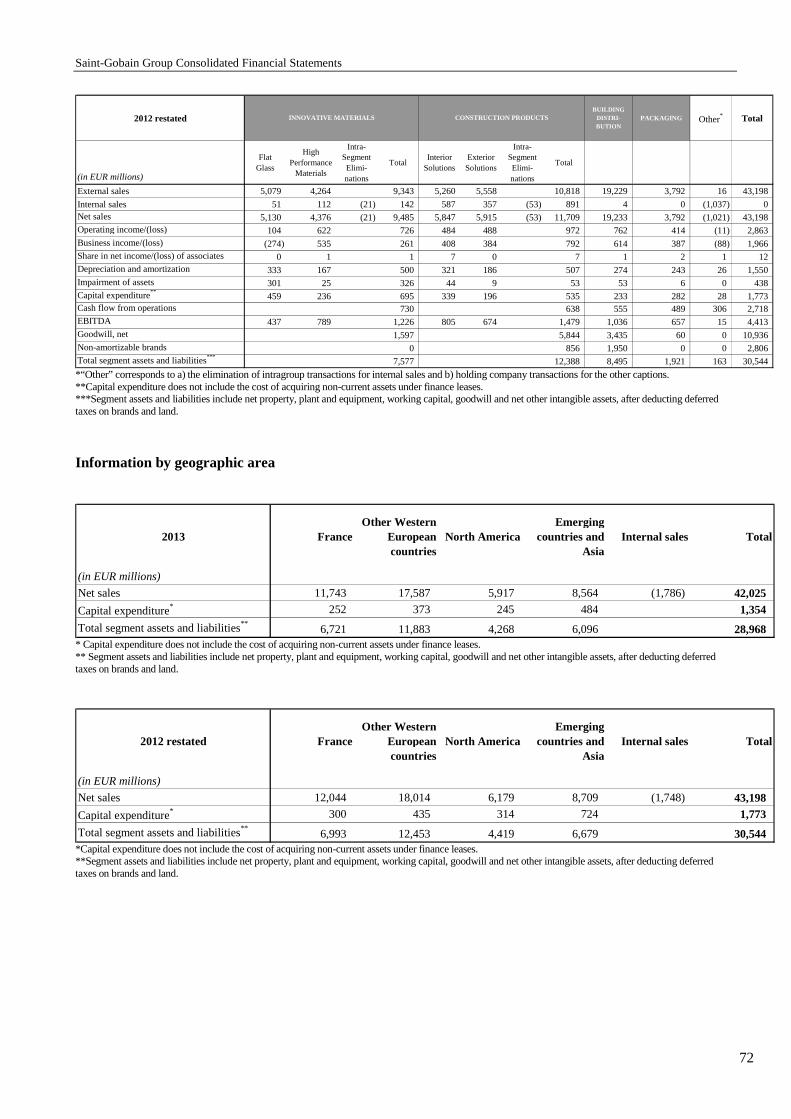
Saint-Gobain Group Consolidated Financial Statements
72
2012 restatedBUILDING
DISTRI-BUTION
PACKAGING Other* Total
(in EUR millions)
Flat Glass
High Performance
Materials
Intra-Segment Elimi-nations
TotalInterior
SolutionsExterior Solutions
Intra-Segment Elimi-nations
Total
External sales 5,079 4,264 9,343 5,260 5,558 10,818 19,229 3,792 16 43,198
Internal sales 51 112 (21) 142 587 357 (53) 891 4 0 (1,037) 0Net sales 5,130 4,376 (21) 9,485 5,847 5,915 (53) 11,709 19,233 3,792 (1,021) 43,198Operating income/(loss) 104 622 726 484 488 972 762 414 (11) 2,863Business income/(loss) (274) 535 261 408 384 792 614 387 (88) 1,966Share in net income/(loss) of associates 0 1 1 7 0 7 1 2 1 12Depreciation and amortization 333 167 500 321 186 507 274 243 26 1,550Impairment of assets 301 25 326 44 9 53 53 6 0 438Capital expenditure** 459 236 695 339 196 535 233 282 28 1,773Cash flow from operations 730 638 555 489 306 2,718EBITDA 437 789 1,226 805 674 1,479 1,036 657 15 4,413Goodwill, net 1,597 5,844 3,435 60 0 10,936Non-amortizable brands 0 856 1,950 0 0 2,806Total segment assets and liabilities***
7,577 12,388 8,495 1,921 163 30,544
INNOVATIVE MATERIALS CONSTRUCTION PRODUCTS
*“Other” corresponds to a) the elimination of intragroup transactions for internal sales and b) holding company transactions for the other captions. **Capital expenditure does not include the cost of acquiring non-current assets under finance leases. ***Segment assets and liabilities include net property, plant and equipment, working capital, goodwill and net other intangible assets, after deducting deferred taxes on brands and land.
Information by geographic area
2013 FranceOther Western
European countries
North AmericaEmerging
countries and Asia
Internal sales Total
(in EUR millions)
Net sales 11,743 17,587 5,917 8,564 (1,786) 42,025
Capital expenditure* 252 373 245 484 1,354
Total segment assets and liabilities**6,721 11,883 4,268 6,096 28,968
* Capital expenditure does not include the cost of acquiring non-current assets under finance leases. ** Segment assets and liabilities include net property, plant and equipment, working capital, goodwill and net other intangible assets, after deducting deferred taxes on brands and land.
2012 restated FranceOther Western
European countries
North AmericaEmerging
countries and Asia
Internal sales Total
(in EUR millions)
Net sales 12,044 18,014 6,179 8,709 (1,748) 43,198
Capital expenditure* 300 435 314 724 1,773
Total segment assets and liabilities**6,993 12,453 4,419 6,679 30,544
*Capital expenditure does not include the cost of acquiring non-current assets under finance leases. **Segment assets and liabilities include net property, plant and equipment, working capital, goodwill and net other intangible assets, after deducting deferred taxes on brands and land.

Saint-Gobain Group Consolidated Financial Statements
73
NOTE 35 – PRINCIPAL FULLY CONSOLIDATED COMPANIES The table below shows the Group’s principal consolidated companies, typically those with annual sales of over €100 million.
INNOVATIVE MATERIALS SECTOR
FLAT GLASSSaint-Gobain Glass France France 100.00%
Saint-Gobain Sekurit France France 100.00%
Saint-Gobain Glass Logistics France 100.00%
Saint-Gobain Sekurit Deutschland GmbH & CO Kg Germany 99.99%
Saint-Gobain Glass Deutschland GmbH Germany 99.99%
Saint-Gobain Deutsche Glas GmbH Germany 99.99%
Saint-Gobain Glass Benelux Belgium 99.97%
Saint-Gobain Sekurit Benelux SA Belgium 99.99%
Saint-Gobain Autover Distribution SA Belgium 99.99%Cebrace Cristal Plano Ltda Brazil 50.00%
Saint-Gobain Do Brasil Ltda Brazil 100.00%
Hankuk Glass Industries Inc. South Korea 80.47%
Hankuk Sekurit Limited South Korea 90.13%
Saint-Gobain Cristaleria S.L Spain 99.83%
Saint-Gobain Glass India Ltd India 98.71%
Saint-Gobain Glass Italia S.p.a Italy 100.00%
Saint-Gobain Sekurit Italia Italy 100.00%
Saint-Gobain Glass Mexico Mexico 99.83%
Koninklijke Saint-Gobain Glass Nederland Netherlands 100.00%
Saint-Gobain Glass Polska Sp Zoo Poland 99.99%
Saint-Gobain Sekurit Hanglas Polska Sp Zoo Poland 97.61%
Glassolutions Saint-Gobain Ltd (Solaglas) United Kingdom 99.99%
Saint-Gobain Glass UK Limited United Kingdom 99.99%
HIGH PERFORMANCE MATERIALSSaint-Gobain Abrasifs France 99.97%
Société Européenne des Produits Réfractaires France 100.00%
Saint-Gobain Abrasives GmbH Germany 100.00%
Saint-Gobain Do Brasil Ltda Brazil 100.00%
Saint-Gobain Abrasives Canada, Inc. Canada 100.00%
Saint-Gobain Abrasives, Inc. United States 100.00%
Saint-Gobain Ceramics & Plastics, Inc. United States 100.00%
Saint-Gobain Performance Plastics Corporation United States 100.00%
Saint-Gobain Solar Gard, LLC United States 100.00%
Saint-Gobain Abrasivi S.p.a Italy 99.97%
SEPR Italia S.p.a Italy 100.00%
Saint-Gobain Abrasives BV Netherlands 100.00%
Saint-Gobain Abrasives Ltd United Kingdom 99.99%
Saint-Gobain Adfors CZ S.R.O. Czech Republic 100.00%

Saint-Gobain Group Consolidated Financial Statements
74
CONSTRUCTION PRODUCTS SECTOR
INTERIOR SOLUTIONSPlacoplatre SA France 99.75%
Saint-Gobain Isover France 100.00%
Saint-Gobain Rigips GmbH Germany 100.00%
Saint-Gobain Isover G+H AG Germany 99.91%
Saint-Gobain Construction Products Belgium Belgium 100.00%
Saint-Gobain Construction Products South Africa Ltd South Africa 100.00%
Certain Teed Gypsum Canada, Inc. Canada 100.00%
Saint-Gobain Placo Iberica Spain 99.83%
CertainTeed Corporation United States 100.00%
Certain Teed Gypsum & Ceillings USA, Inc. United States 100.00%
Gypsum Industries Ltd Ireland 100.00%
Saint-Gobain PPC Italia S.p.a Italy 100.00%
Mag-Isover K.K. Japan 99.98%
BPB United Kingdom Ltd United Kingdom 100.00%
BPB Plc United Kingdom 100.00%
Saint-Gobain Construction Product Russia Insulation Russia 100.00%
Saint-Gobain Isover AB Sweden 100.00%
Saint-Gobain Ecophon AB Sweden 100.00%
Thai Gypsum Products PLC Thailand 99.69%
Izocam Ticaret VE Sanayi A.S. Turkey 47.53%
Celotex Group Limited United Kingdom 100.00%
EXTERIOR SOLUTIONSSaint-Gobain Weber France 100.00%
Saint-Gobain PAM France 100.00%
Saint-Gobain Weber GmbH Germany 100.00%
Saint-Gobain PAM Deutschland GmbH Germany 100.00%
Saint-Gobain Do Brasil Ltda Brazil 100.00%
Saint-Gobain Canalizaçao Ltda Brazil 100.00%
Saint-Gobain (Xuzhou) Pipe Co., Ltd China 100.00%
Saint-Gobain Pipelines Co., Ltd China 100.00%
Saint-Gobain Weber Cemarksa SA Spain 99.83%Saint-Gobain PAM España SA Spain 99.83%
CertainTeed Corporation United States 100.00%
Saint-Gobain PAM Italia S.p.a Italy 100.00%
Saint-Gobain PAM UK Ltd United Kingdom 99.99%
Saint-Gobain Byggprodukter AB Sweden 100.00%
Saint-Gobain Weber AG Switzerland 100.00%

Saint-Gobain Group Consolidated Financial Statements
75
BUILDING DISTRIBUTION SECTOR
Distribution Sanitaire Chauffage France 100.00%
Lapeyre France 100.00%
Point.P France 100.00%
Saint-Gobain Building Distribution Deutschland GmbH Germany 100.00%
Saint-Gobain Distribuiçao Brasil Ltda Brazil 100.00%
Saint-Gobain Distribution Denmark Denmark 100.00%
Saint-Gobain Distribucion Construccion, S.L Spain 99.83%
Norandex Building Material Distribution, Inc. United States 100.00%
Optimera As Norway 100.00%
Saint-Gobain Distribution The Netherlands B.V Netherlands 100.00%
Saint-Gobain Dystrybucja Budowlana Sp Zoo Poland 99.99%
Saint-Gobain Building Distribution Ltd United Kingdom 99.99%
Saint-Gobain Building Distribution CZ, Spol S.R.O. Czech Republic 100.00%
Saint-Gobain Distribution Nordic Ab Sweden 100.00%
Sanitas Troesch Ag Switzerland 100.00%
PACKAGING SECTOR
Saint-Gobain Emballage France 100.00%
Saint-Gobain Oberland Aktiengesellschaft Germany 96.67%
Saint-Gobain Vidros SA Brazil 100.00%
Saint-Gobain Vicasa SA Spain 99.75%
Saint-Gobain Containers, Inc. United States 100.00%
Saint-Gobain Vetri S.p.a Italy 99.99%

Saint-Gobain Group Consolidated Financial Statements
76
NOTE 36 – SUBSEQUENT EVENTS None.

Saint-Gobain Group Consolidated Financial Statements
77
CONTENTS
CONSOLIDATED BALANCE SHEET ......................................................................................................... 2
CONSOLIDATED INCOME STATEMENT ................................................................................................ 3 CONSOLIDATED STATEMENT OF RECOGNIZED INCOME AND EXP ENSE ................................ 4
CONSOLIDATED STATEMENT OF CASH FLOWS ................................................................................ 5 CONSOLIDATED STATEMENT OF CHANGES IN EQUITY ....... ......................................................... 6 NOTE 1 - ACCOUNTING PRINCIPLES AND POLICIES ....... ................................................................. 7 NOTE 2 - CHANGES IN GROUP STRUCTURE ...................................................................................... 22 NOTE 3 – ASSETS AND LIABILITIES HELD FOR SALE...... ............................................................... 24 NOTE 4 – IMPACT OF CHANGES IN ACCOUNTING METHODS .. ................................................... 25
NOTE 5 – GOODWILL ................................................................................................................................. 27
NOTE 6 – OTHER INTANGIBLE ASSETS ............................................................................................... 28 NOTE 7 – PROPERTY, PLANT AND EQUIPMENT ............................................................................... 29 NOTE 8 – INVESTMENTS IN ASSOCIATES ........................................................................................... 30 NOTE 9 – OTHER NON-CURRENT ASSETS ........................................................................................... 31 NOTE 10 – INVENTORIES .......................................................................................................................... 32
NOTE 11 – TRADE AND OTHER ACCOUNTS RECEIVABLE ..... ....................................................... 32 NOTE 12 – EQUITY ...................................................................................................................................... 33
NOTE 13 – STOCK OPTION PLANS ......................................................................................................... 33
NOTE 14 – GROUP SAVINGS PLAN ......................................................................................................... 35
NOTE 15 – PERFORMANCE SHARE AND PERFORMANCE UNIT PL ANS .................................... 36
NOTE 16 – PROVISIONS FOR PENSIONS AND OTHER EMPLOYEE BENEFITS ......................... 39 NOTE 17 – CURRENT AND DEFERRED TAXES ................................................................................... 45 NOTE 18 – OTHER CURRENT AND NON-CURRENT LIABILITIES AND PROVISIONS ............. 47 NOTE 19 – TRADE AND OTHER ACCOUNTS PAYABLE AND ACCR UED EXPENSES ............... 48 NOTE 20 – RISK FACTORS ........................................................................................................................ 49
NOTE 21 – NET DEBT .................................................................................................................................. 52
NOTE 22 - FINANCIAL INSTRUMENTS .................................................................................................. 56
NOTE 23 – FINANCIAL ASSETS AND LIABILITIES ........ .................................................................... 59 NOTE 24 – BUSINESS INCOME BY EXPENSE TYPE ........................................................................... 60 NOTE 25 – NET FINANCIAL EXPENSE ................................................................................................... 61
NOTE 26 – EBITDA – RECURRING NET INCOME – CASH FLOW FROM OPERATIONS .......... 61 NOTE 27 – EARNINGS PER SHARE ......................................................................................................... 63
NOTE 28 – COMMITMENTS ...................................................................................................................... 63
NOTE 29 – LITIGATION ............................................................................................................................. 66
NOTE 30 – RELATED-PARTY TRANSACTIONS ................................................................................... 69 NOTE 31 – JOINT VENTURES ................................................................................................................... 69
NOTE 32 – MANAGEMENT COMPENSATION ...................................................................................... 70 NOTE 33 – EMPLOYEES ............................................................................................................................. 70
NOTE 34 – SEGMENT INFORMATION ................................................................................................... 71 NOTE 35 – PRINCIPAL FULLY CONSOLIDATED COMPANIES .. .................................................... 73
NOTE 36 – SUBSEQUENT EVENTS .......................................................................................................... 76