consolidated financial statements -...
TRANSCRIPT

- 1 -
CONSOLIDATED FINANCIAL STATEMENTS
30 JUNE 2017 & 30 JUNE 2016
PREPARED IN ACCORDANCE WITH IFRS AS ADOPTED BY THE EUROPEAN UNION
NOVACYT
Limited liability company (société anonyme) with capital of 1,472,482 euros Versailles Trade and Companies Register 491,062,527
Registered office: 13, avenue Morane Saulnier 78140 Vélizy Villacoublay

- 2 -
Consolidated income statement at 30 June 2017
(*) There are no non-controlling interest.
Amounts in '000 € Notes
Six months
ended 30
June 2017
Six months
ended 30
June 2016
(unaudited) (unaudited)
Revenue 5 7 029 4 950
Cost of sales 7 - 2 771 - 2 345
Gross profit 4 258 2 605
Sales and marketing costs 8 - 1 615 - 1 483
Research and development 9 - 397 - 429
General & administrative expenses 10 - 3 389 - 2 596
Governmental subsidies 12 144 88
Operating loss before exceptional items - 998 - 1 815
Costs related to acquisitions - - 464
Impairment of goodwill 17 - -
Other operating income 13 7 22
Other operating expenses 13 - 144 - 376
Operating loss - 1 135 - 2 633
Financial income 14 301 92
Financial expense 14 - 878 - 982
Loss before tax - 1 712 - 3 523
Tax expense 15 - - 2
Loss after tax - 1 712 - 3 525
Attributable to owners of the company (*) - 1 712 - 3 525
Earnings per share 16 0,09 - - 0,37
Diluted earnings per share 16 0,09 - - 0,37

- 3 -
Consolidated statement of comprehensive income at 30 June 2017
(*) There are no non-controlling interest.
Amounts in '000 €
Six months
ended 30
June 2017
Six months
ended 30
June 2016
(unaudited) (unaudited)
Consolidated net loss for the year - 1 712 - 3 525
Items that will not be reclassified subsequently to
profit or loss:
Actuarial differences IAS19R - -
Income tax relating to items that will not be reclassified
subsequently to profit and loss - -
Items that may be reclassified subsequently to
profit or loss:
Translation reserves - 7 202
Income tax relating to items that may be reclassified
subsequently to profit and loss - -
Total comprehensive income - 1 719 - 3 323
Comprehensive income attributable to:
Owners of the company (*) - 1 719 - 3 323

- 4 -
Statement of financial position at 30 June 2017
Amounts in '000 € Notes
Year ended
31 December
2016
Six months
ended 30
June 2017
(unudited)
Goodwill 17 16 466 16 466
Intangible assets 18 5 333 5 050
Property, plant and equipment 19 1 096 1 112
Non-current financial assets 20 138 235
Deferred tax assets 21 - -
Other long-term assets 22 48 -
Non-current assets 23 082 22 863
Inventories and work in progress 23 1 614 1 810
Trade and other receivables 24 2 356 2 983
Tax receivables 211 272
Prepayments 25 313 827
Short-term financial investments 10 10
Cash & cash equivalents 26 2 856 2 577
Current assets 7 360 8 478
Total assets 30 442 31 341
Bank overdrafts and current portion of
long-term borrowings27 3 499 3 062
Contingent consideration (current portion) 27 1 646 1 664
Provisions (current portion) 28 66 66
Trade and other payables 30 3 504 3 283
Tax liabilities 77 -
Other current liabilities 31 24 20
Total current liabilities 8 816 8 096
Net current assets/(liabilities) - 1 456 382
Borrowings and convertible bond notes 27 2 756 2 324
Contingent consideration (non-current
portion)27 946 1 000
Retirement benefit obligations 28 14 16
Long-term provision 28 89 86
Deferred tax liabilities 53 -
Other long term liabilities 29 - -
Total non-current liabilities 3 857 3 426
Non-curent liabilities 12 673 11 522
Net assets 17 769 19 819

- 5 -
Statement of financial at 30 June 2017 (cont.)
Amounts in '000 € Notes
Year ended
31 December
2016
Six months
ended 30
June 2017
(unaudited)
Share capital 32 1 161 1 472
Share premium account 33 47 120 50 585
Own shares - 165 180 -
Other reserves 34 123 116
Retained losses 34 - 30 470 32 174 -
Equity attributable to owners of the
company 17 769 19 819
Total equity 17 769 19 819

- 6 -
Statement of changes in equity at 30 June 2017
Amounts in '000 €
Share
capital
Share
premium
Own
shares
Retained
earnings Total equity
Translation
reserve
OCI on
retirement
benefits Total
Balance at 31 December 2014 418 28 184 - 86 - 21 - 9 - 30 - 8 213 20 273
Actuarial gains on retirement benefits - - - - - 3 - 3 - - 3
Translation differences - - - - 49 - - 49 - - 49
Loss for the period - - - - - - - 13 908 - 13 908
Total profits and loss of the period - - - - 49 - 3 - 52 - 13 908 - 13 959
Issue of share capital 61 4 198 - - - - - 4 259
Own shares acquired/sold in the period - - - 12 - - - - - 12
Other changes - - - - - - - 37 - 37
Balance at 31 December 2015 479 32 382 - 98 - 69 - 12 - 81 - 22 157 10 524
Actuarial gains on retirement benefits - - - - - 1 - 1 - - 1
Translation differences - - - 206 - 206 - 206
Loss for the period - - - - - - - 5 711 - 5 711
Total profits and loss of the period - - - 206 - 1 205 - 5 711 - 5 506
Issue of share capital 682 14 738 - - - - - 15 420
Own shares acquired/sold in the period - - - 67 - - - - - 67
Other changes - - - - - 2 602 - 2 602
Balance at 31 December 2016 1 161 47 120 - 165 136 - 13 123 - 30 470 17 769
Translation differences - - - - 7 - - 7 - - 7
Loss for the period - - - - - - - 1 712 - 1 712
Total profits and loss of the period - - - - 7 - - 7 - 1 712 - 1 719
Issue of share capital 311 3 465 - - - - - 3 776
Own shares acquired/sold in the period - - - 15 - - - - - 15
Other changes - - - - 9 9
Balance at 30 June 2017 (unaudited) 1 472 50 585 - 180 129 - 13 116 - 32 174 19 819
Other group reserves
- 7 -
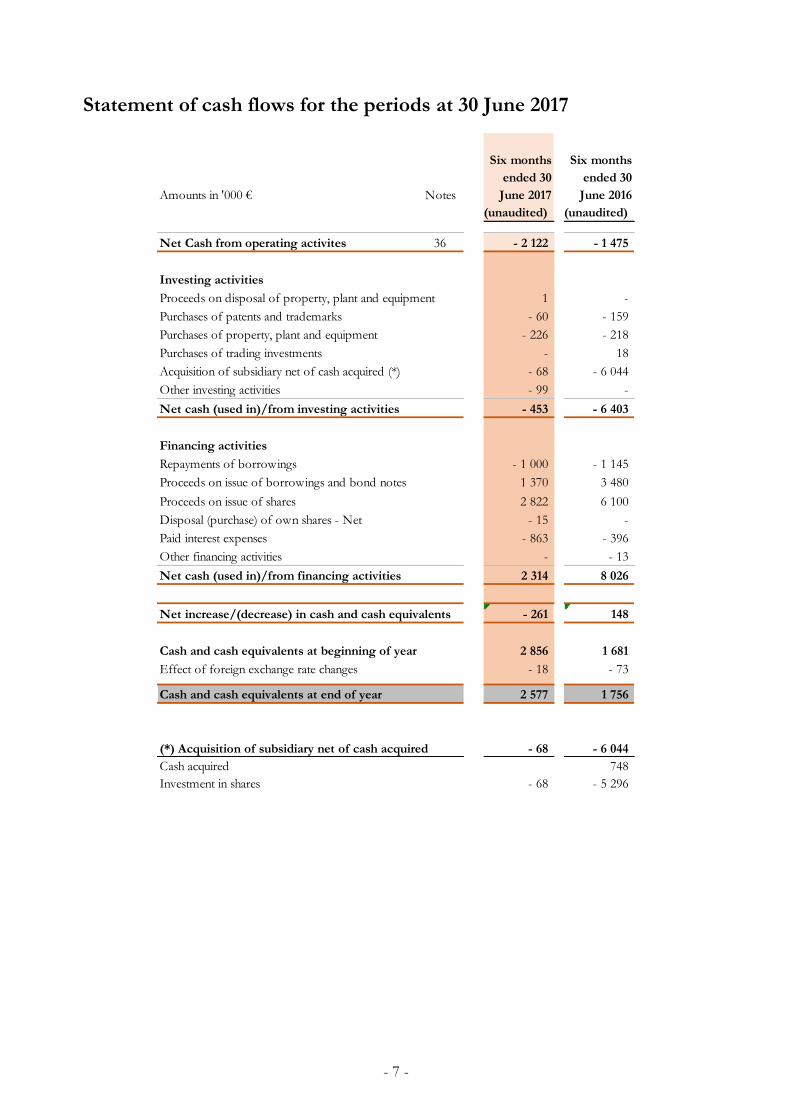
Statement of cash flows for the periods at 30 June 2017
Amounts in '000 € Notes
Six months
ended 30
June 2017
Six months
ended 30
June 2016
(unaudited) (unaudited)
Net Cash from operating activites 36 - 2 122 - 1 475
Investing activities
Proceeds on disposal of property, plant and equipment 1 -
Purchases of patents and trademarks - 60 - 159
Purchases of property, plant and equipment - 226 - 218
Purchases of trading investments - 18
Acquisition of subsidiary net of cash acquired (*) - 68 - 6 044
Other investing activities - 99 -
Net cash (used in)/from investing activities - 453 - 6 403
Financing activities
Repayments of borrowings - 1 000 - 1 145
Proceeds on issue of borrowings and bond notes 1 370 3 480
Proceeds on issue of shares 2 822 6 100
Disposal (purchase) of own shares - Net - 15 -
Paid interest expenses - 863 - 396
Other financing activities - - 13
Net cash (used in)/from financing activities 2 314 8 026
Net increase/(decrease) in cash and cash equivalents - 261 148
Cash and cash equivalents at beginning of year 2 856 1 681
Effect of foreign exchange rate changes - 18 - 73
Cash and cash equivalents at end of year 2 577 1 756
(*) Acquisition of subsidiary net of cash acquired - 68 - 6 044
Cash acquired 748
Investment in shares - 68 - 5 296
- 8 -
NOTES TO THE FINANCIAL STATEMENTS
1. APPLICABLE ACCOUNTING STANDARDS
Novacyt (hereinafter “the Company” or “Novacyt”), specialises in cancer and infectious disease diagnostics. Its registered office is located at 13 avenue Morane Saulnier, 78140 Vélizy Villacoublay. The Historical Financial Information include the accounts of the Company and its subsidiaries (hereinafter referred to collectively as “the Group”). They are prepared and presented in thousands of euros.
The consolidated interim financial statements presented below have been drawn in compliance with IAS 34 standard applicable to interim financial information, which provides for presentation a selection of notes to the financials statements. As such, they must be read together with the financial statements at 31 December 2016.
The accounting policies set out below have, unless otherwise stated, been applied consistently to all periods presented in these consolidated financial statements.
2. ADOPTION OF NEW STANDARDS AND AMENDMENTS TO EXISTING STANDARDS
- Standards, interpretations and amendments to standards with mandatory application for periods beginning on or after 1 January 2017
- Amendments to IAS 7: “disclosures enabling users of financial statements to evaluate changes in liabilities arising from financing activities, whether or not such changes result from cash flows”;
- Amendments to IAS 12: “clarify how to account for deferred tax assets related to debt instruments measured at fair value”.
- Standards, interpretations and amendments to standards already published by the IASB and endorsed by the European Union but not yet mandatory as of 30 June 2017
- IFRS 9 “Financial Instruments”;
- IFRS 15 and amendments to IFRS 15 “Revenue from Contracts with Customers”;
- IFRS 16 “Leases”.
These standards and interpretations have not been early adopted. The Group is currently examining the impact on the financial statements of applying these.
The texts adopted by the European Union are available on the website of the European Commission at the following address: http://ec.europa.eu/finance/company-reporting/ifrs-financial-statements/index_en.htm
The interim financial statements were approved by the Board of Directors at its meeting of 10 August 2017, which authorised their publication.
These interim financial statements were prepared for the purpose of an initial public offering on AIM, part of the London Stock Exchange.

- 9 -
3. SUMMARY OF ACCOUNTING POLICIES APPLIED BY THE GROUP
The financial statements were prepared primarily on the basis of the historical cost principle, with the exception of optional instruments, for which the fair value model was used.
The preparation of financial statements under IFRS requires management to exercise judgement on the application of accounting policies, and to make estimates and assumptions that affect the amounts of assets and liabilities, and income and expenses. The underlying estimates and assumptions, made in accordance with the going concern principle, are based on past experience and other factors deemed reasonable in the circumstances. They serve as the basis for the exercise of judgement required in determining the carrying amounts of assets and liabilities that cannot be obtained directly from other sources. Actual amounts may differ from these estimates. The underlying estimates and assumptions are reviewed continuously. The impact of changes in accounting estimates is recognised in the period of the change if it affects only that period, or in the period of the change and subsequent periods if such periods are also affected.
The areas where assumptions and estimates are material in relation to the consolidated financial statements are the measurement of goodwill resulting from Novacyt’s acquisition of the Lab21 subgroup and Primer Design (see note 17), the carrying amounts and useful lives of intangible assets (see note 18), deferred taxes (see note 21), trade receivables (see note 24) and provisions for risks and other provisions related to the operating activities (see note 28).
The consequences of the financial crisis, especially as regards the volatility of the capital markets and economic growth, make it difficult to assess a business’s medium-term outlook. As such, the consolidated financial statements were established in reference to the immediate environment, notably as regards the estimates presented below.
The accounting policies set out below have been applied consistently to all periods presented in the consolidated financial statements.
Going concern
The June 2017 consolidated financial statements were prepared in accordance with the going concern principle. Cash flow projections for the next 12 months point to a positive cash position. They take particular account of the following factors:
- Available cash as of 30 June 2017 amounted to €2,577,000;
- The drawing of an additional €2,000,000 on the Yorkville convertible bonds facility (€1m drawn down in July 2017);
- The payment of the first part of the contingent consideration in 2017 for the amount of approximately €1,725,000;
- Assumptions of capital increases or equivalent financing to a total amount of approximately €3,700,000 to be carried out between the fourth quarter of 2017 and the third quarter of 2018.
No agreement has been reached, and no undertaking can be given that these assumptions will be confirmed by actual transactions. Failure to obtain a satisfactory outcome in terms of prospective financing or revenue would place uncertainty on the going concern principle applied in preparing the financial statements insofar as the company may in this case not be able to repay its debts and dispose of its assets in the ordinary course of its business. The going concern principle applied for the period ended 30 June 2017 could in that case prove inappropriate.

- 10 -
Basis of consolidation
Novacyt’s consolidated financial statements include all companies under exclusive control. The Company does not exercise joint control or have significant influence over other companies. Subsidiaries are consolidated from the date on which the Group obtains effective control.
Exclusively controlled companies are consolidated by the full consolidation method with recognition of non-controlling interests. Under IFRS 10, an investor controls an investee when it is exposed, or has rights, to variable returns from its involvement with the investee and has the ability to affect those returns through its power over the investee.
The determination of control takes into account potential voting rights that give access to additional voting rights when they are currently exercisable or convertible.
As of 30 June 2017, Novacyt’s scope of consolidation included the following companies, all fully consolidated:
Legend: FC: Full consolidation
NC: Not consolidated
Novacyt acquiered Primer Design at the 12 may 2016.
Consolidation methods
The consolidated financial statements are prepared using uniform accounting policies for transactions and other similar events in similar circumstances.
Elimination of intercompany transactions
The intercompany balances arising from transactions between consolidated companies, as well as the transactions themselves, including income, expenses and dividends, are eliminated.
Translation of accounts denominated in foreign currency
Novacyt’s financial statements are presented in euros. The financial statements of companies whose functional currency is not the euro are translated into euros as follows:
Closing Opening
Companies Interest
percentage
Control
percentage
Consolidation
method
Interest
percentage
Control
percentage
Consolidation
method
Biotec laboratories ltd 100,00 % 100,00 % FC 100,00 % 100,00 % FC
Healthcare 100,00 % 100,00 % FC 100,00 % 100,00 % FC
Lab21 ltd 100,00 % 100,00 % FC 100,00 % 100,00 % FC
Microgen Bioproducts ltd 100,00 % 100,00 % FC 100,00 % 100,00 % FC
Myconostica ltd 100,00 % 100,00 % FC 100,00 % 100,00 % FC
Novacyt SA 100,00 % 100,00 % FC 100,00 % 100,00 % FC
Novacyt Asia 100,00 % 100,00 % FC 100,00 % 100,00 % FC
Novacyt China 100,00 % 100,00 % FC 100,00 % 100,00 % FC
Np Tech Services ltd 100,00 % 100,00 % FC 100,00 % 100,00 % FC
Selah technologies llc 100,00 % 100,00 % FC 100,00 % 100,00 % FC
Primer Design ltd 100,00 % 100,00 % FC - - NC

- 11 -
- balance sheet items are translated at the closing exchange rate, excluding equity items, which are stated at historical rates;
- transactions in the income statement and statement of cash flows are translated at the average annual exchange rate.
Translation differences on earnings and equity are recognised directly in other comprehensive income under “Translation reserve” for the portion attributable to the Group. On disposal of a foreign company, the translation differences relating thereto and recognised in other comprehensive income are reclassified to profit or loss.
Exchange differences arising from intragroup balances are recognised as exchange losses or gains in the consolidated income statement.
Business combinations and measurement of goodwill
Business combinations
Business combinations are accounted for using the purchase method (see IFRS 3R).
Each time it takes over a company or group of companies constituting a business, the Group identifies and measures the assets acquired and liabilities assumed, most of which are carried at fair value. The difference between the fair value of the consideration transferred, including the recognised amount of any non-controlling interest in the acquiree and the net amount recognised in respect of the identifiable assets acquired and liabilities assumed measured at fair value, is recognised as goodwill.
Pursuant to IFRS 3R, the Group applies the following principles:
- transaction costs are recognised immediately as operating expenses when incurred;
- any prospective price adjustment of an asset or a liability assumed is estimated at fair value at the acquisition date, and the initial assessment may only subsequently be adjusted against goodwill in the event of new information related to facts and circumstances existing at the acquisition date if this assessment occurs within the 12-month allocation period after the acquisition date. Any adjustment of the financial liability recognised in respect of an additional price subsequent to the interim period or not meeting these criteria is recognised in the Group’s comprehensive income;
- any negative goodwill arising on acquisition is immediately recognised as income;
- for step acquisitions, the achievement of control triggers the remeasurement at fair value of the interest previously held by the Group in profit or loss; loss of control results in the remeasurement of the possible residual interest at fair value in the same way.
For companies acquired during the year, only the results for the period following the acquisition date are included in the consolidated income statement.
Measurement of goodwill
Goodwill is broken down by cash-generating unit (CGU) or group of CGUs, depending on the level at which goodwill is monitored for management purposes. In accordance with IAS 36, none of the CGUs or groups of CGUs defined by the Group are greater in size than an operating segment.
Impairment testing
Goodwill is not amortised, but is subject to impairment testing when there is an indication of loss of value, and at least once a year at the reporting date.
Such testing consists of comparing the carrying amount of an asset to its recoverable amount. The recoverable amount of an asset, a CGU or a group of CGUs is the greater of its fair value less costs to

- 12 -
sell and its value in use. Fair value less costs to sell is the amount obtainable from the sale of an asset, a CGU or a group of CGUs in an arm’s length transaction between well-informed, willing parties, less the costs of disposal. Value in use is the present value of future cash flows expected to arise from an asset, a CGU or a group of CGUs.
It is not always necessary to determine both the fair value of an asset less costs to sell and its value in use. If either of these amounts exceeds the carrying amount of the asset, the asset is not impaired and it is not necessary to estimate the other amount.
Intangible fixed assets
Patents
Patents on the balance sheet were acquired or created internally.
These patents have been recognised in accordance with the following rules:
- Research phase: recognition of expenses in operating expenses;
- Development phase: recognition in assets insofar as the patents are identifiable assets controlled by the Company and from which future economic benefits will arise.
Each patent has been recognised in accordance with its value, corresponding to the costs incurred during the development phase or the acquisition price.
The event generating amortisation is the start of use, i.e. the filing date of the patent. Patents are amortised on a straight-line basis over 20 years.
Customer relationships
In accordance with IFRS 3, Novacyt’s acquisition of Primer Design resulted in the recognition of the value of the acquired customer base on the balance sheet. The value of this asset was determined by discounting the additional margin generated by customers after remuneration of the contributing assets.
Customer relationships will be amortised on a straight-line basis over nine years.
Trademark
The acquisition price of Primer Design by Novacyt was also “allocated” in part to the Primer Design trademark. The value of this asset was determined by discounting the cash flows that could be generated by licensing the trademark, estimated as a percentage of revenue derived from information available on comparable assets.
The trademark will also be amortised on a straight-line basis over nine years.
Other intangible assets
Intangible assets include licences recognised at cost and amortised over useful lives of between 7 and 20 years.
Assets under construction
Pursuant to IAS 38, Novacyt capitalises development costs (external costs and personnel expenses), provided that they meet the following criteria:
- the Group has the intention, as well as the financial and technical capacity, to complete the development project,
- the asset will generate future economic benefits, and

- 13 -
- the cost of the intangible asset can be measured reliably.
Assets under construction are not amortised until the development programme has been completed and the asset brought into use. Other research and development expenses not meeting the criteria set out above are expensed directly.
Property, plant and equipment
Items of property, plant and equipment are recognised at their acquisition cost (purchase price plus incidental expenses and acquisition costs).
Depreciation and amortisation
Property, plant and equipment and intangible assets are depreciated or amortised on a straight-line basis, with major components identified separately where appropriate, based on the following estimated useful lives:
- Patents: Straight-line basis – 20 years
- Trademark: Straight-line basis – 9 years
- Customers: Straight-line basis – 9 years
- Industrial machinery and equipment: Straight-line basis – 3 to 6 years
- General fittings, improvements: Straight-line basis – 3 to 5 years
- Transport equipment: Straight-line basis – 5 years
- Office equipment: Straight-line basis – 3 years
- Computer equipment: Straight-line basis – 2 to 3 years
The depreciation or amortisation of fixed assets begins when they are ready for use and ceases at their disposal, scrapping or reclassification as assets held for sale in accordance with IFRS 5.
Given the nature of its assets, the Group does not recognise residual value on the items of property, plant and equipment it uses.
Depreciation and amortisation methods and useful lives are reviewed at each reporting date and revised prospectively if necessary.
Asset impairment
Depreciable assets are subject to impairment testing when indications of loss of value are identified. In assessing whether there is any indication that an asset may be impaired, the Company considers the following external and internal indicators:
External indicators:
- drop in the market value of the asset (to a greater extent than would be expected solely from the passage of time or the normal use of the asset);
- significant changes with an adverse effect on the entity, either having taken place during the period or expected to occur in the near future, in the technical, economic or legal environment in which the Company operates or in which the asset is used;
- increases in market interest rates or other market rates of return during the year when it is likely that such increases will significantly reduce the market value and/or value in use of the asset.

- 14 -
Internal indicators:
- existence of indication of obsolescence or physical damage of an asset unforeseen in the depreciation or amortisation schedule;
- significant changes in the way the asset is used;
- weaker-than-expected performance by the asset;
- significant reduction in the level of cash flow generated by the asset.
If there is an indication of impairment, the recoverable amount of the asset is compared with its carrying amount. The recoverable amount is the greater of fair value less costs to sell and value in use. Value in use is the present value of future cash flows expected to flow from an asset over its estimated useful life.
The recoverable amount of assets that do not generate independent cash flows is determined by that of the cash-generating unit (CGU) to which it belongs, a CGU being the smallest homogeneous group of identifiable assets generating cash flows that are largely independent of other assets or groups of assets.
The carrying amount of an asset is its gross value less, for depreciable fixed assets, accumulated depreciation and impairment losses.
In the event of loss of value, an impairment charge is recognised in profit or loss. Impairment is reversed in the event of a change in the estimate of the recoverable value or if indications of loss of value disappear. Impairment is recognised under “Depreciation, amortisation and provisions for impairment of property, plant and equipment and intangible assets” in the income statement.
Intangible assets not subject to amortisation are tested for impairment at least once a year.
Leases
Leases in which the Novacyt group is the lessee are analysed on the basis of their substance and financial reality, and are classified either as operating leases or finance leases.
Finance leases
A finance lease is a lease that transfers substantially all the risks and rewards incidental to ownership of an asset to the lessee. It is treated as the acquisition of an asset by the lessee, financed by a loan granted by the lessor.
The Group has not concluded any such contracts.
Operating leases
An operating lease is a contract that does not transfer substantially all the risks and rewards incidental to ownership to the lessee. Lease payments under an operating lease are expensed on a straight-line basis over the entire lease term, even if payments are not made with the same regularity.
The lease agreement for Novacyt’s offices in Vélizy can be analysed as an operating lease.
A provision for restoration of leased office space to good condition has been set aside to address the contractual obligations arising from lease contracts (see 2.8).
- 15 -
Inventories
Inventories are carried at the lesser of their acquisition cost and their recoverable amount. The acquisition cost of inventories includes materials and supplies, and, where applicable, personnel expenses incurred in transforming inventories into their current state. It is calculated using the weighted average cost method. The recoverable amount represents the estimated selling price less any marketing, sales and distribution expenses.
Inventories are measured at their purchase cost.
The gross value of goods and supplies includes the purchase price and incidental expenses.
A provision for impairment, equal to the difference between the gross value determined in accordance with the above terms and the current market price or the realisable value less any proportional selling costs, is recognised when the gross value is greater than the other stated item.
Trade receivables
Trade receivables are recognised upon transfer of ownership, which generally corresponds to delivery for sales of goods and the rendering of the service for services.
Receivables are recorded at their fair value, which corresponds most often to their nominal value. Receivables may be impaired by means of a provision, to take into account any difficulties in recovering the outstanding amounts. Provisions for impairment are determined by comparing the acquisition cost and the likely realisable value, which is defined as the present value of the estimated recoverable amounts.
Trade receivables have not been discounted, because the effect of doing so would be immaterial.
Cash and cash equivalents
Cash equivalents are held in order to meet short-term cash commitments rather than for investment or other purposes. For an investment to qualify as a cash equivalent, it must be readily convertible into a known amount of cash and be subject to an insignificant risk of change in value. Cash and cash equivalents comprise cash funds, current bank accounts and marketable securities (cash UCITS, negotiable debt securities, etc.) that can be liquidated or sold within a very short time (generally less three months at the acquisition date) and which have a negligible risk of change in value. All such items are measured at fair value; any adjustments are recognised in profit or loss.
Financial liabilities
Borrowings are initially recognised at fair value. They are subsequently accounted for using the amortised cost method, based on the effective interest rate. Under this principle, any arranging costs are carried in the balance sheet item relating to the relevant borrowings and amortised in financial expense over the life of the loan.
• Compound financial instruments
Some financial instruments contain both a liability and an equity component. This is notably the case of the OCABSAs, which are bonds convertible into shares with warrants. The various components of these instruments are accounted for and presented separately according to their substance, as defined in IAS 32 “Financial Instruments: Disclosure and Presentation”. The amortised cost is calculated on the basis of the liability only, once the equity component and, in this case, the embedded derivative have been separated.

- 16 -
• Primer Design contingent consideration
Novacyt negotiated a contingent consideration for the acquisition of the Primer Design securities with the company’s former shareholders, subject to the achievement of a revenue target. Payment will be made in cash in 2017 and May 2018.
In accordance with IAS 39, the financial liability has been remeasured at its fair value as of the balance sheet date to take into account changes in the exchange rate of sterling on the one hand and the accretion expense of the liability on the other hand.
• Trade payables Trade payables are obligations to provide cash or other financial assets. They are recognised in the balance sheet when the Group becomes a party to a transaction generating liabilities of this nature. Trade and other payables are recognised in the balance sheet at fair value on initial recognition, except if settlement is to occur more than 12 months after recognition. In such cases, they are measured using the amortised cost method. The use of the effective interest rate method will result in the recognition of a financial expense in the income statement. Trade and other payables are eliminated from the balance sheet when the corresponding obligation is extinguished.
Trade payables have not been discounted, because the effect of doing so would be immaterial.
Provisions
In accordance with IAS 37 “Provisions, Contingent Liabilities and Contingent Assets”, a provision is recognised when the Group has a current obligation as of the reporting date in respect of a third party and it is probable or certain that there will be an outflow of resources to this third party, without at least equivalent consideration from the said third party. Provisions for risks and charges cover the amount corresponding to the best estimate of the future outflow of resources required to settle the obligation.
They consist of provisions for restoration of leased premises and a provision for industrial relations litigation.
Employee benefits
Group employees receive short-term benefits (paid leave, sick leave, etc.) and post-employment benefits via defined-contribution or -benefit plans (retirement bonuses, pensions, etc.).
For defined-contribution plans, payments made by the Group are expensed in the period in respect of which they are due.
Post-employment benefits relate mainly to retirement bonuses, and solely cover Novacyt employees. Defined benefits are the subject of a calculation performed by an actuary, based on the following parameters:
- retirement at the age of 64 for managers, - retirement at the age of 62 for non-managers, - wage increases at a rate of 3% per annum, i.e. the long-term inflation rate plus 1%, - discount rate of 1.5% in 2016, in line with the average rate of private sector bonds issued in
euros (blue chip) for durations equivalent to the commitments in question, - staff turnover based on the Group’s actual experience: projection of 0.5 resignations over the
next 12 months, - life expectancy based on the Insee 2012-2014 mortality table, - Average rate of social security contributions of 41.10%.

- 17 -
Rights expressed as months of wages resulting from the application of national agreements and the “Pharmaceuticals, pharmacy, veterinary products: production & trade” collective agreement. Retirement benefits are expensed when due. The provision for this expense is reversed in the same period.
The amount of the provision for employee benefits is considered insignificant in relation to other assets and liabilities. As such, it was not subject to an actuarial calculation for the six-month periods ended 30 June 2016 and 30 June 2017.
Discontinued operations and assets held for sale
Discontinued operations and assets held for sale are restated in accordance with IFRS 5. There were no discontinued operations or assets held for sale during the periods presented.
Consolidated revenue
The applicable standard is IAS 18 “Revenue”.
Novacyt’s activity
Revenue from “sales of goods” consists primarily of the sale of machines (automated equipment, accessories and spare parts to distributors and industrial partners or sold directly from laboratories or hospitals). Revenue is recognised upon transfer of the risks and rewards incidental to ownership, which corresponds to the date on which the machines are delivered to the distributor or the end customer in the case of direct sales.
Revenue from “production sold” is the activity involving the distribution of consumables such as bottles and settling systems.
The activity of Lab21 and its subsidiaries
Lab21 provides laboratory-based diagnostic services. Revenue is recognised when the service is rendered (diagnosis made).
Lab21’s subsidiaries manufacture and sell reagents and kits for bacterial and blood tests.
Revenue is recognised upon delivery of products sold and, where appropriate, after formal customer acceptance.
Primer Design’s activity
Primer Design designs, manufactures and distributes test kits for certain diseases in humans, animals and food products. These kits are intended for laboratory use and rely on “polymerase chain reaction” technology. Revenue is recognised when the test kits are sold. The company accounts for the sale of the product upon delivery.
Current and deferred tax
The tax expense for the year comprises current tax and deferred tax. A deferred tax asset is recognised for deductible temporary differences and the carryforward of tax losses and tax credits insofar as their future utilisation appears probable and determinable in time. A deferred tax liability is recognised on timing differences related to accelerated depreciation. It only covers Primer Design.

- 18 -
Treatment of tax credits
Directly taxed industrial and commercial companies that record research expenditure are entitled to a tax credit in France, which is the case of Novacyt. The tax credit is calculated per calendar year and deducted from the tax payable by the company in respect of the year during which research expenses were incurred. Tax credits that cannot be deducted from tax expense are refunded to the company. The granting of the tax credit is independent of the Group’s tax position. Novocyt has accordingly elected to treat it as a subsidy. It appears in an item covering subsidies in the income statement.
The Lab21 subgroup companies and Primer Design also benefit from tax credits for their research activities. Such tax credits are treated as subsidies in the income statement.
In France, the law amending the 2012 budget introduced a new tax credit from 1 January 2013, known as the competitiveness and employment tax credit (crédit d’impôt pour la compétitivité et l’emploi – CICE). Its calculation is based on a portion of the salaries paid to employees of French companies. It is paid by the state, regardless of the position of the entity in respect of corporation tax. It has been decided to classify this income as a reduction in personnel expenses.
Earnings per share
The Group reports basic and diluted earnings per common share. Basic earnings per share is calculated by dividing the profit attributable to common shareholders of the Company by the weighted average number of common shares outstanding during the period.
Diluted earnings per share is determined by adjusting the profit attributable to common shareholders by the weighted average number of common shares outstanding, taking into account the effects of all potential dilutive common shares, including options.
4. CRITICAL ACCOUNTING JUDGEMENTS AND KEY SOURCES OF ESTIMATE UNCERTAINTY
The preparation of financial statements in accordance with IFRS requires management to exercise judgement on the application of accounting policies, and to make estimates and assumptions that affect the amounts of assets and liabilities, and income and expenses. The underlying estimates and assumptions, made in accordance with the going concern principle, are based on past experience and other factors deemed reasonable in the circumstances. They serve as the basis for the exercise of judgement required in determining the carrying amounts of assets and liabilities that cannot be obtained directly from other sources. Actual amounts may differ from these estimates. The underlying estimates and assumptions are reviewed continuously. The impact of changes in accounting estimates is recognised in the period of the change if it affects only that period, or in the period of the change and subsequent periods if such periods are also affected.
Critical accounting judgements
The following are the critical judgements, apart from those involving estimations (which are dealt with separately below), that the directors have made in the process of applying the Group’s accounting policies and that have the most significant effect on the amounts recognised in financial statements.
Discount rate used to determine the carrying amount of the Group’s defined benefit obligation
The Group’s defined benefit obligation is discounted at a rate set by reference to market yields at the end of the reporting period on high quality corporate bonds. Significant judgement is required when

- 19 -
setting the criteria for bonds to be included in the population from which the yield curve is derived. The most significant criteria considered for the selection of bonds include the issue size of the corporate bonds, quality of the bonds and the identification of outliers which are excluded. The areas where assumptions and estimates are material in relation to the consolidated financial statements are the measurement of goodwill resulting from Novacyt’s acquisition of the Lab21 subgroup and Primer Design (see note 17), the carrying amounts and useful lives of intangible assets (see note 18), deferred taxes (see note 21), trade receivables (see note 24) and provisions for risks and other provisions related to the operating activities (see note 28).
Estimate uncertainty
Measurement of goodwill
Goodwill is tested for impairment. The recoverable amount of goodwill is determined mainly on the basis of forecasts of future cash flows. The total amount of anticipated cash flows reflects management’s best estimate of the future benefits and liabilities expected for the relevant cash-generating unit (CGU). The assumptions used and the resulting estimates sometimes cover very long periods, taking into account the technological, commercial and contractual constraints associated with each CGU. These estimates are mainly subject to assumptions in terms of volumes, selling prices and related production costs, and the exchange rates of the currencies in which sales and purchases are denominated. They are also subject to the discount rate used for each CGU. The value of the goodwill is tested whenever there are indications of impairment and reviewed at each annual closing date or more frequently should this be justified by internal or external events. The carrying amount of goodwill at the balance sheet and related impairment loss over the periods are shown below:
Measurement and useful lives of intangible assets
Other intangible assets (except for goodwill) are considered to have a finite economic useful life. They are amortized over their estimated useful lives that are reviewed at each reporting date. In the event of impairment, an estimate of the asset's recoverable amount is made. The main intangible assets requiring estimates and assumptions are the Primer Design trademark and the customer relationships attached to Primer Design.
Amounts in '000 €
Year ended
31 December
2016
Six months
ended 30 June
2017
(unaudited)
Goodwill Lab21 19 042 19 042
Impairment of goodwill 9 786 - 9 786 -
Net value 9 256 9 256
Goodwill PrimerDesign 7 210 7 210
Impairment of goodwill - -
Net value 7 210 7 210
16 466 16 466
- 20 -
Trademark The value of this asset was determined by discounting the cash flows that could be generated by licensing the trademark, estimated as a percentage of revenue derived from information available on comparable assets. This asset is amortised on a straight-line basis over a period of nine years, estimated as its useful life. It is also is tested for impairment. Its recoverable amount is determined on the basis of forecasts of future cash flows. The total amount of anticipated cash flows reflects management’s best estimate of the future benefits and liabilities expected from the operation of the trademark. The assumptions used and the resulting estimates are subject to discount rate, percentage of revenue and useful life assumptions. The carrying amount of the Primer Design trademark at 30 June 2017 is € 577 thousand after a amortization of € 82 thousand recognised in 2016 and 2017.
Customer relationships The value of this asset was determined by discounting the additional margin generated by customers after remuneration of the contributing assets. Customer relationships are amortised on a straight-line basis over a period of nine years, estimated as its useful life. It is also is tested for impairment. Its recoverable amount is determined on the basis of forecasts of future cash flows over an estimated period of time. The total amount of anticipated cash flows reflects management’s best estimate of the future benefits and liabilities expected from customer relationships. The assumptions used and the resulting estimates are subject to assumptions in respect of the discount rate, additional margin generated by customers after remuneration of contributing assets and useful lives. The carrying amount of the Primer Design customer relationship at 30 June 2017 is € 3,217 thousand after amortization of € 459 thousand recognised in 2016 and 2017.
Deferred taxes
Deferred tax assets are only recognised only insofar as it is probable that the Group will have future taxable profits against which the corresponding temporary difference can be offset. Deferred tax assets are reviewed at each balance sheet date and impaired in the event of a risk of non-recovery. For deferred tax assets on tax loss carryforwards, the Group uses a multi-criteria approach that takes into account the recovery timeframe based on the strategic plan, but which also factors in the strategy for the long-term recovery of tax losses in each country. On the basis of the analysis performed, considering that the deferred tax losses could not be used within a reasonable period of time, the Group has decided not to recognise any deferred tax asset.
Trade and other receivables
An estimate of the risks of non-receipt based on commercial information, current economic trends and the solvency of individual customers is made in order to determine the need for impairment on a customer-by-customer basis.
- 21 -
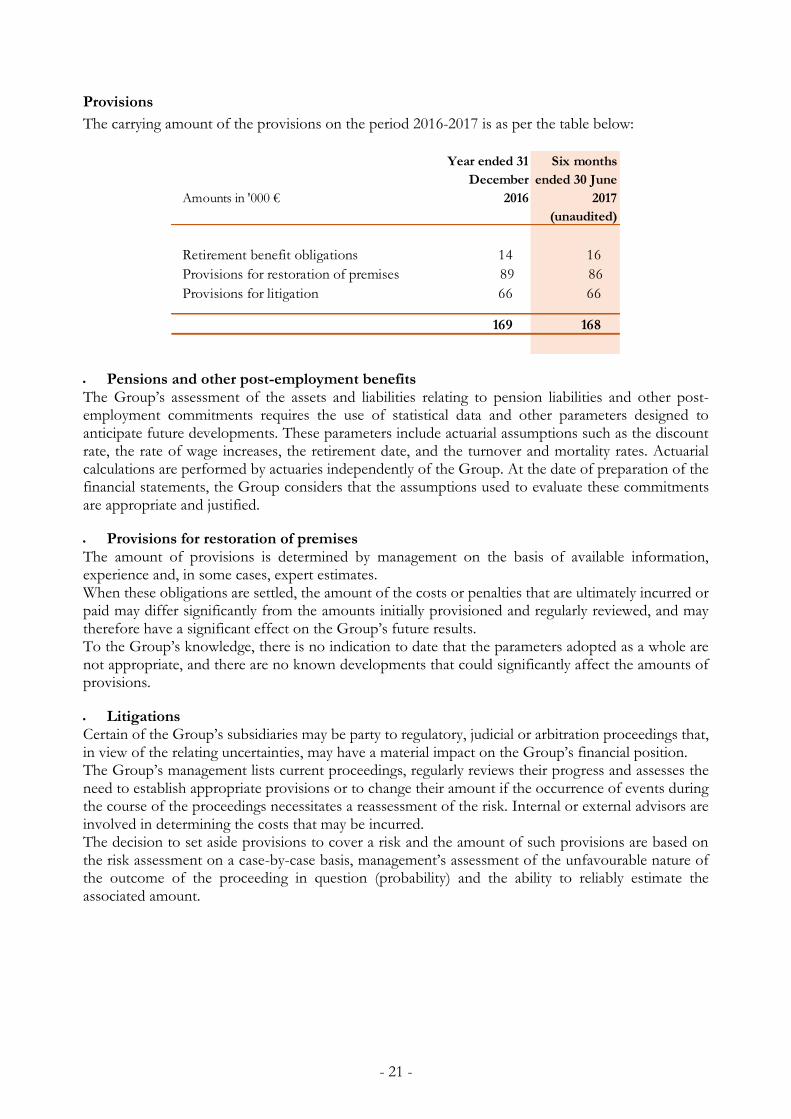
Provisions
The carrying amount of the provisions on the period 2016-2017 is as per the table below:
Pensions and other post-employment benefits The Group’s assessment of the assets and liabilities relating to pension liabilities and other post-employment commitments requires the use of statistical data and other parameters designed to anticipate future developments. These parameters include actuarial assumptions such as the discount rate, the rate of wage increases, the retirement date, and the turnover and mortality rates. Actuarial calculations are performed by actuaries independently of the Group. At the date of preparation of the financial statements, the Group considers that the assumptions used to evaluate these commitments are appropriate and justified.
Provisions for restoration of premises The amount of provisions is determined by management on the basis of available information, experience and, in some cases, expert estimates. When these obligations are settled, the amount of the costs or penalties that are ultimately incurred or paid may differ significantly from the amounts initially provisioned and regularly reviewed, and may therefore have a significant effect on the Group’s future results. To the Group’s knowledge, there is no indication to date that the parameters adopted as a whole are not appropriate, and there are no known developments that could significantly affect the amounts of provisions.
Litigations Certain of the Group’s subsidiaries may be party to regulatory, judicial or arbitration proceedings that, in view of the relating uncertainties, may have a material impact on the Group’s financial position. The Group’s management lists current proceedings, regularly reviews their progress and assesses the need to establish appropriate provisions or to change their amount if the occurrence of events during the course of the proceedings necessitates a reassessment of the risk. Internal or external advisors are involved in determining the costs that may be incurred. The decision to set aside provisions to cover a risk and the amount of such provisions are based on the risk assessment on a case-by-case basis, management’s assessment of the unfavourable nature of the outcome of the proceeding in question (probability) and the ability to reliably estimate the associated amount.
Amounts in '000 €
Year ended 31
December
2016
Six months
ended 30 June
2017
(unaudited)
Retirement benefit obligations 14 16
Provisions for restoration of premises 89 86
Provisions for litigation 66 66
169 168
- 22 -
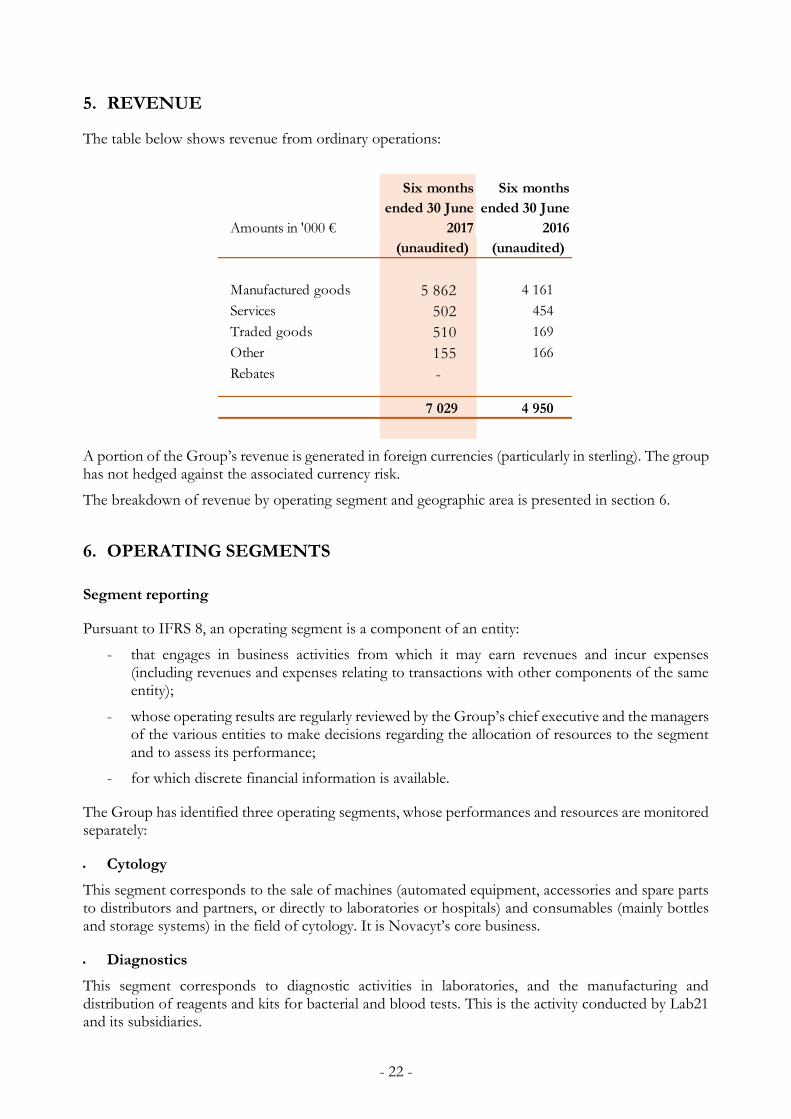
5. REVENUE
The table below shows revenue from ordinary operations:
A portion of the Group’s revenue is generated in foreign currencies (particularly in sterling). The group has not hedged against the associated currency risk.
The breakdown of revenue by operating segment and geographic area is presented in section 6.
6. OPERATING SEGMENTS
Segment reporting
Pursuant to IFRS 8, an operating segment is a component of an entity:
- that engages in business activities from which it may earn revenues and incur expenses (including revenues and expenses relating to transactions with other components of the same entity);
- whose operating results are regularly reviewed by the Group’s chief executive and the managers of the various entities to make decisions regarding the allocation of resources to the segment and to assess its performance;
- for which discrete financial information is available.
The Group has identified three operating segments, whose performances and resources are monitored separately:
Cytology
This segment corresponds to the sale of machines (automated equipment, accessories and spare parts to distributors and partners, or directly to laboratories or hospitals) and consumables (mainly bottles and storage systems) in the field of cytology. It is Novacyt’s core business.
Diagnostics
This segment corresponds to diagnostic activities in laboratories, and the manufacturing and distribution of reagents and kits for bacterial and blood tests. This is the activity conducted by Lab21 and its subsidiaries.
Amounts in '000 €
Six months
ended 30 June
2017
Six months
ended 30 June
2016
(unaudited) (unaudited)
Manufactured goods 5 862 4 161
Services 502 454
Traded goods 510 169
Other 155 166
Rebates -
7 029 4 950

- 23 -
Molecular testing
This segment represents the activities of recently acquired Primer Design, which designs, manufactures and distributes test kits for certain diseases in humans, animals and food products. These kits are intended for laboratory use and rely on “polymerase chain reaction” technology.
Identifying of operating segment managers (chief operating decision-makers)
The Chief Operating Decision Maker is the Chief Executive officer.
Reliance on major customers
The Group is not dependent on a particular customer, no customers generating sales accounting for over 10% of revenue.
Breakdown of revenue by operating segment and geographic area
At 30 June 2017 (unaudited)
At 30 June 2016 (unaudited)
Amounts in '000 € Cytology Diagnostics
Molecular
products Total
Geographical area
Africa - 138 172 310
Europe 711 1 688 1 345 3 744
Asia-Pacific 346 754 383 1 483
America - 364 657 1 021
Middle East 44 357 70 470
Revenue 1 101 3 300 2 628 7 029
Amounts in '000 € Cytology Diagnostics
Molecular
products Total
Geographical area
Africa - 209 78 287
Europe 647 1 624 508 2 779
Asia-Pacific 101 778 132 1 011
America - 233 204 437
Middle East 98 288 50 436
Revenue 846 3 132 972 4 950

- 24 -
Breakdown of result by operating segment
Six months ended 30 June 2017 (unaudited)
Amounts in '000 € Cytology Diagnostics
Molecular
products Total
Revenue 1 101 3 301 2 628 7 029
Cost of sales 580 - 1 802 - 390 - 2 771 -
Sales and marketing costs 658 - 502 - 455 - 1 615 -
Research and development 97 - 64 - 236 - 397 -
General & administrative expenses 1 059 - 1 453 - 877 - 3 389 -
Governmental subsidies 50 30 64 144
Operating profit/(loss) before
exceptional items1 242 - 491 - 734 998 -
Other operating income 3 4 - 7
Other operating expenses 53 - 64 - 27 - 144 -
Operating profit/(loss) 1 292 - 551 - 708 1 135 -
Financial income 291 9 - 301
Financial expense 701 - 158 - 19 - 878 -
Profit/(Loss) before tax 1 701 - 700 - 689 1 712 -
Tax expense - - - -
Profit/(Loss) after tax 1 701 - 700 - 689 1 712 -
Attributable to owners of the company 1 701 - 700 - 689 1 712 -
Attributable to non-controlling interests - - - -
- 25 -
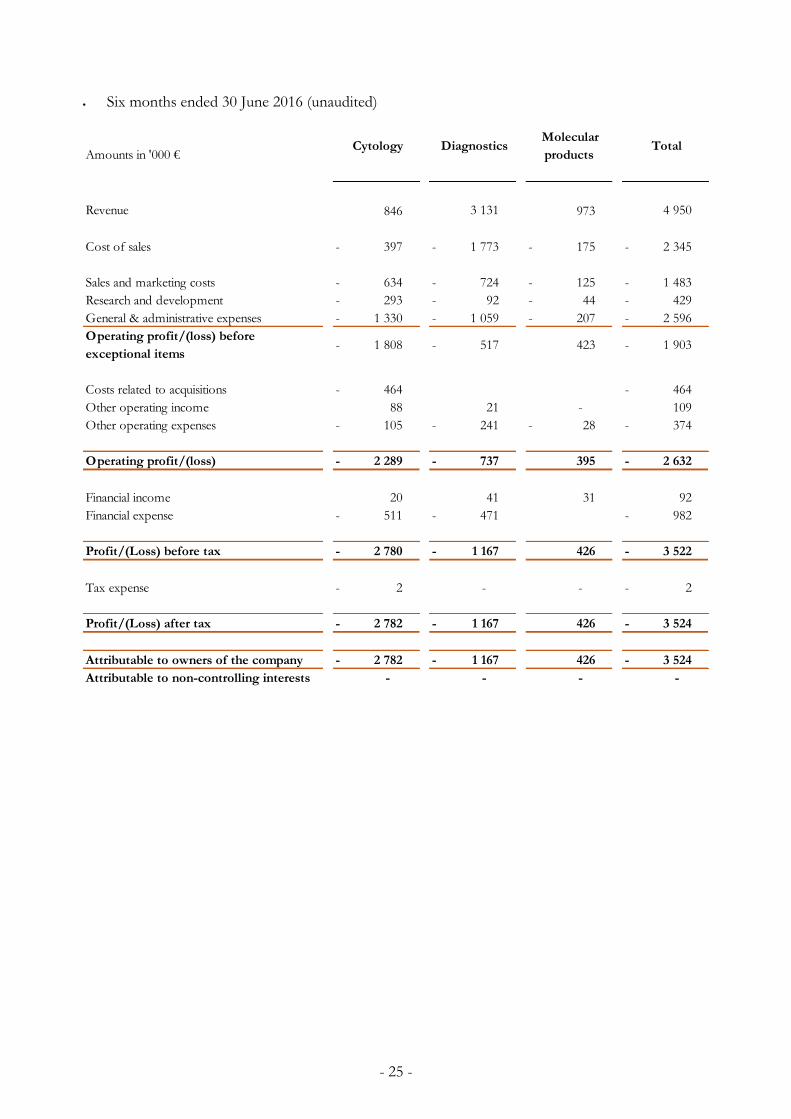
Six months ended 30 June 2016 (unaudited)
Amounts in '000 € Cytology Diagnostics
Molecular
products Total
Revenue 846 3 131 973 4 950
Cost of sales 397 - 1 773 - 175 - 2 345 -
Sales and marketing costs 634 - 724 - 125 - 1 483 -
Research and development 293 - 92 - 44 - 429 -
General & administrative expenses 1 330 - 1 059 - 207 - 2 596 -
Operating profit/(loss) before
exceptional items1 808 - 517 - 423 1 903 -
Costs related to acquisitions 464 - 464 -
Other operating income 88 21 - 109
Other operating expenses 105 - 241 - 28 - 374 -
Operating profit/(loss) 2 289 - 737 - 395 2 632 -
Financial income 20 41 31 92
Financial expense 511 - 471 - 982 -
Profit/(Loss) before tax 2 780 - 1 167 - 426 3 522 -
Tax expense 2 - - - 2 -
Profit/(Loss) after tax 2 782 - 1 167 - 426 3 524 -
Attributable to owners of the company 2 782 - 1 167 - 426 3 524 -
Attributable to non-controlling interests - - - -

- 26 -
7. COST OF SALES
The table below shows the main items of expenses that comprise “Cost of revenue”:
8. SALES AND MARKETING EXPENSES
The table below shows the main items of expenses that comprise “Sales and marketing expenses”:
Amounts in '000 €
Six months
ended 30 June
2017
Six months
ended 30 June
2016
(unaudited) (unaudited)
Purchases and movement in inventories of raw materials
and other supplies 1 708 1 519
Purchases and movement in inventories of traded goods 248 103
Movement in finished goods and work in progress 55 31
Change in stock provision 20 - -
Non-stock items and supplies 40 46
Freight costs 76 61
Direct labour 642 573
Other 24 12
2 771 2 345
Amounts in '000 €
Six months
ended 30 June
2017
Six months
ended 30 June
2016
(unaudited) (unaudited)
Remuneration of intermediaries and fees 177 168
Advertising costs 130 86
Transport of sales 135 136
Employee compensation and social security
contributions797 841
Travel and representation expenses 109 115
Other sales and marketing expenses 266 137
1 615 1 483
- 27 -
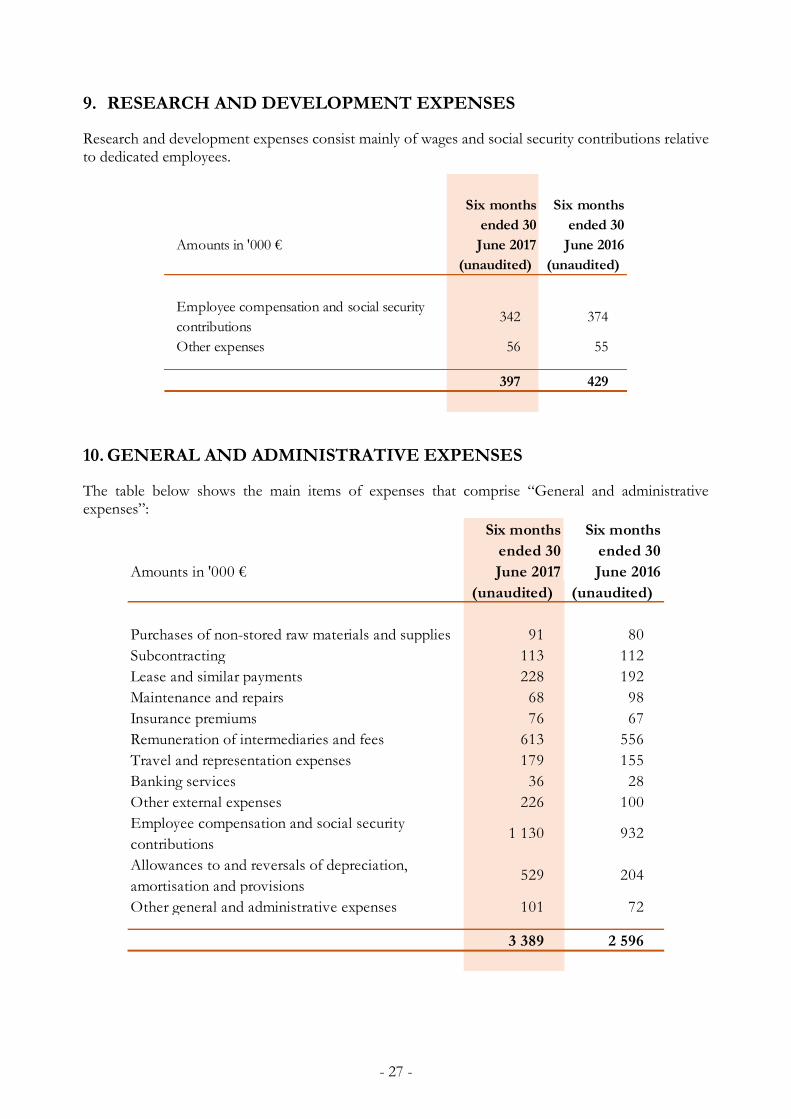
9. RESEARCH AND DEVELOPMENT EXPENSES
Research and development expenses consist mainly of wages and social security contributions relative to dedicated employees.
10. GENERAL AND ADMINISTRATIVE EXPENSES
The table below shows the main items of expenses that comprise “General and administrative expenses”:
Amounts in '000 €
Six months
ended 30
June 2017
Six months
ended 30
June 2016
(unaudited) (unaudited)
Employee compensation and social security
contributions342 374
Other expenses 56 55
397 429
Amounts in '000 €
Six months
ended 30
June 2017
Six months
ended 30
June 2016
(unaudited) (unaudited)
Purchases of non-stored raw materials and supplies 91 80
Subcontracting 113 112
Lease and similar payments 228 192
Maintenance and repairs 68 98
Insurance premiums 76 67
Remuneration of intermediaries and fees 613 556
Travel and representation expenses 179 155
Banking services 36 28
Other external expenses 226 100
Employee compensation and social security
contributions1 130 932
Allowances to and reversals of depreciation,
amortisation and provisions529 204
Other general and administrative expenses 101 72
3 389 2 596

- 28 -
11. WORKFORCE
The breakdown of employees between the three segments as of the reporting date is as follows:
12. GOVERNMENTAL SUBSIDIES
Directly taxed industrial and commercial companies that record research expenditure are entitled to a tax credit in France, which is the case of Novacyt. Other companies within the Group, located chiefly in the United Kingdom, benefit from a similar scheme. The tax credit is calculated per calendar year and deducted from the tax payable by the company in respect of the year during which research expenses were incurred. Tax credits that cannot be deducted from tax expense are refunded to the company. The granting of the tax credit is independent of the Group’s tax position.
This tax credit is treated an operating subsidy or, more exactly, as a governmental subsidy.
13. OTHER OPERATING INCOME AND EXPENSES
Six months
ended 30 June
2017
Six months
ended 30 June
2016
(unaudited) (unaudited)
Cytology 13 11
Diagnostics 62 60
Molecular products 38 30
113 101
Amounts in '000 €
Six months
ended
30 June 2017
Six months
ended
30 June 2016
(unaudited) (unaudited)
Reversal of depreciation allowance for doubtful accounts - -
Other income 7 22
Other operating income 7 22
Exceptional bonus to some employees - -
Loss resulting from irrecoverable trade receivables - -
Provision for litigation with employees - -
Restructuring expenses: indemnities to employees - -
Set-up China structure - -
IFRS transition expenses - 95 -
IPO preparation 65 - 214 -
Relocation expenses - 57 -
Other expenses 79 - 10 -
Other operating expenses 144 - 376 -

- 29 -
14. FINANCIAL INCOME AND EXPENSE
Exchange losses in 2016 are mainly those recorded by British company Lab21 Ltd on its operations. The change in Novacyt equity warrants granted to former Primer Design shareholders in the 6 months ended 30 June 2017 was recorded in financial income in the amount of €182 thousand. The accretion expenses in 2016 and 2017 relate to the change in the contingent consideration liability in favour of Primer Design shareholders.
15. INCOME TAX EXPENSE
Amounts in '000 €
Six months
ended
30 June 2017
Six months
ended
30 June 2016
(unaudited) (unaudited)
Exchange gains 109 62
Change in fair value of options 182 -
Reversals of financial provisions - -
Other financial income 9 30
Financial income 301 92
Interest on loans 534 - 396 -
Exchange losses 157 - 585 -
Accretion expense 140 - -
Other financial expense 48 - 1 -
Financial expense 878 - 982 -
Year ended
31 December
2016
Local tax rate 33,33%
Txa FR/UK spread -13,33%
Corporation tax: -
Current year -
Adjustments in respect of prior years -
Deferred tax -
Total tax expense for the year -
- 30 -
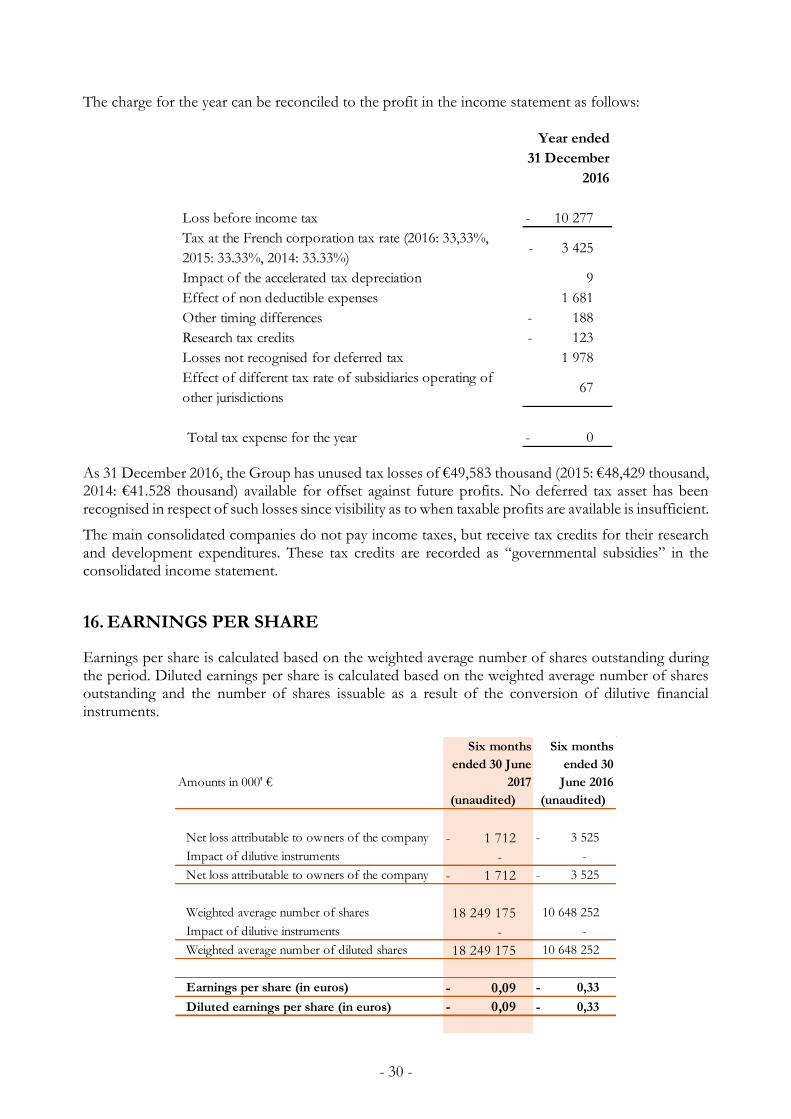
The charge for the year can be reconciled to the profit in the income statement as follows:
As 31 December 2016, the Group has unused tax losses of €49,583 thousand (2015: €48,429 thousand, 2014: €41.528 thousand) available for offset against future profits. No deferred tax asset has been recognised in respect of such losses since visibility as to when taxable profits are available is insufficient.
The main consolidated companies do not pay income taxes, but receive tax credits for their research and development expenditures. These tax credits are recorded as “governmental subsidies” in the consolidated income statement.
16. EARNINGS PER SHARE
Earnings per share is calculated based on the weighted average number of shares outstanding during the period. Diluted earnings per share is calculated based on the weighted average number of shares outstanding and the number of shares issuable as a result of the conversion of dilutive financial instruments.
Year ended
31 December
2016
Loss before income tax 10 277 -
Tax at the French corporation tax rate (2016: 33,33%,
2015: 33.33%, 2014: 33.33%)3 425 -
Impact of the accelerated tax depreciation 9
Effect of non deductible expenses 1 681
Other timing differences 188 -
Research tax credits 123 -
Losses not recognised for deferred tax 1 978
Effect of different tax rate of subsidiaries operating of
other jurisdictions67
Total tax expense for the year 0 -
Amounts in 000' €
Six months
ended 30 June
2017
Six months
ended 30
June 2016
(unaudited) (unaudited)
Net loss attributable to owners of the company 1 712 - 3 525 -
Impact of dilutive instruments - -
Net loss attributable to owners of the company 1 712 - 3 525 -
Weighted average number of shares 18 249 175 10 648 252
Impact of dilutive instruments - -
Weighted average number of diluted shares 18 249 175 10 648 252
Earnings per share (in euros) 0,09 - 0,33 -
Diluted earnings per share (in euros) 0,09 - 0,33 -

- 31 -
Pursuant to IAS 33, options whose exercise price is higher than the value of the Novacyt security were not taken into account in determining the effect of dilutive instruments.
17. GOODWILL
Goodwill is the difference recognised, upon consolidation of a company, between the fair value of the purchase price of its shares and the net assets acquired and liabilities assumed, measured in accordance with IFRS 3.
Primer Design
Primer Design entered the scope of consolidation on 12 May 2016. Goodwill totalling €7,210 thousand has been identified:
Components of the purchase price of securities:
Value of Novacyt securities tendered €3,430k
Option to purchase Novacyt securities €445k
Cash disbursed €7,081k
Contingent consideration payable in 2017 and 2018 €2,610k
Total purchase price €13,566k
Value at the date of acquisition of assets and liabilities on the Primer Design balance sheet: €2,021k
Value of the Primer Design customer base: €3,676k
Value of the Primer Design trademark: €660k
Goodwill €7,210k
The contingent consideration of €2,610 thousand is due in the event of the achievement of revenue targets; payment is scheduled in 2017 and May 2018. The value of this liability was determined based on the best estimates of management at the date of the acquisition.
In accordance with IFRS 3, Novacyt’s acquisition of Primer Design resulted in the recognition of assets consisting of “customer relationships” and the trademark separately from goodwill. These assets fit the definition posed by the IASB’s conceptual framework, which cites resources controlled by the company as the result of past transactions and from which the company expects to obtain future economic benefits.
The value of “customer relationships” was determined by discounting the additional margin generated by customers after remuneration of the contributing assets.
The value of the trademark was determined by discounting the cash flows that could be generated by licensing the Primer Design trademark, estimated as a percentage of revenue derived from information available on comparable assets.
IFRS 3 provides for a period of 12 months from the takeover to complete the identification and measurement of the fair value of assets acquired and liabilities assumed. The gross amount of goodwill is therefore no longer subject to adjustment.
Lab21
The Lab21 Ltd subgroup entered the scope of consolidation on 30 June 2014. Goodwill totalling €19,042 thousand has been identified:
- Purchase price of securities: €18,847k
- Share of Lab21’s adjusted equity as of 30 June 2014: negative €1,952k

- 32 -
- Goodwill transferred from Lab21: €2,147k
- Goodwill: €19,042k
The deadline for the identification and measurement of assets and liabilities has expired. The gross amount of goodwill can therefore no longer be changed.
Goodwill is subject to impairment testing annually, and whenever there is an indication of loss of value. To perform this testing, goodwill is deemed to have been assigned to the subgroup of the British companies comprising Lab21 and its subsidiaries, housed in the “Diagnostics” operating segment.
The goodwill impairment testing performed on 31 December 2015 resulted in a goodwill impairment in the amount of €9,786 thousand, bringing goodwill to a recoverable amount of €9,256 thousand.
The impairment testing of the CGU as of 31 December 2016 was conducted by the DCF (discounted cash flow) method, with the key assumptions as follows:
o Five-year business plan
o Extrapolation of cash flows beyond five years based on a growth rate of 1.5%.
o Discount rate corresponding to the expected rate of return on the market for a similar investment, regardless of funding sources, equal to 15%.
The implementation of this approach demonstrated that the value of goodwill amounted to €9,558 thousand, greater than the carrying amount of this asset. As such, no impairment was recognised in the year ended 31 December 2016.
Sensitivity of the value derived from the DCF model to change in the assumptions used
This sensitivity table shows the difference in the recoverable amounts of goodwill depending on change in the discount rate (WACC) and the perpetual growth rate. Our sensitivity analysis shows that an increase of 1 point in the WACC would result in the need to impair the Lab21 goodwill.
The Group did not identify any indications of loss of value requiring the implementation of further impairment tests in the six months to 30 June 2017.
9 558 0,0% 0,5% 1,0% 1,5% 2,0% 2,5% 3,0%
13,0% 10 685 10 896 11 119 11 355 11 607 11 877 12 165
13,5% 10 243 10 436 10 638 10 852 11 079 11 322 11 580
14,0% 9 832 10 008 10 193 10 387 10 594 10 812 11 044
14,5% 9 449 9 611 9 779 9 957 10 145 10 343 10 553
15,0% 9 091 9 240 9 395 9 558 9 729 9 910 10 100
15,5% 8 756 8 894 9 036 9 186 9 343 9 508 9 681
16,0% 8 442 8 569 8 701 8 839 8 983 9 134 9 293
16,5% 8 147 8 265 8 387 8 514 8 647 8 786 8 931
17,0% 7 869 7 979 8 092 8 210 8 333 8 461 8 594
Terminal growth rates
WA
CC
rat
es

- 33 -
18. OTHER INTANGIBLE ASSETS
None of the above assets were developed internally.
19. PROPERTY, PLANT AND EQUIPMENT
Amounts in '000 €
At 1
January
2017 Additions
Acquisition
of a
subsidiary Disposals
Charge
for the
period
Effect of
fx rate
changes
At 30 June
2017
Cost
Development costs 207 - 5 202
Concessions, patents and similar rights 1 701 32 - 1 1 732
Software 141 3 - 4 140
Trademark 659 659
Customer base 3 676 3 676
Other intangible assets 43 25 - 1 67
6 427 60 - - - 11 - 6 476
Amortisation
Amt/Dep. development costs - 20 - 21 1 - 40
Amt/Imp. concessions, patents and similar rights - 604 - 72 1 - 675
Amt/Imp. software - 126 - 5 3 - 128
Amt/Dep. trademarks - 46 - 37 - 83
Amt/Dep. customer base - 255 - 204 - 459
Amt/Imp. other intangible assets - 43 1 - 42
- 1 093 - - - 339 6 - - 1 426
Carrying amount 5 333 60 - - 339 - 5 - 5 050
Amounts in 000' €
At 1 January
2017 Additions
Acquisition of
a subsidiary Disposals
Charge for
the period
Effect of fx
rate
changes
Reclass. &
transfers
At 30 June
2017
(unaudited)
Cost
Technical facilities, equipment and tools 2 305 76 - 3 - 29 2 349
Office equipment 45 6 - 1 50
Transport equipment 47 - 12 - 35
Computer equipment 271 21 - 7 285
Other property, plant and equipment 512 122 - 16 618
Property, plant and equipment under construction 348 348
3 528 225 - - 15 - - 53 - 3 685
Accumulated depreciation and impairment
Dep./Imp. technical facilities, equipment and tools - 1 550 2 - 138 21 - 1 665
Dep./Imp. office equipment - 39 - 2 1 - 40
Dep./Imp. transport equipment: - 30 12 - 3 - - 21
Dep./Imp. computer equipment - 231 - 15 6 - 240
Dep./Imps. other property, plant and equipment - 233 - 32 7 - 258
Dep./Imp. tangible assets under construction - 348 - - - 348
- 2 432 - - 14 - 190 35 - - 2 573
Carrying amount 1 096 225 - - 1 - 190 - 18 - 1 112

- 34 -
20. -CURRENT FINANCIAL ASSETS
21. DEFERRED TAX ASSETS
As of 30 June 2017, each of the Group’s major companies had tax loss carryforwards. Their period of use is unlimited. With the exception of Primer Design, no deferred tax assets have been recognised in the accounts since visibility as to when it will be possible to utilise the carryforwards against taxable profits is insufficient.
The following table shows the deferred tax assets not presented in the balance sheet at 31 December 2016.
Amounts in '000 €
Year ended
31 December
2016
Six months
ended
30 June 2017
(unaudited)
Rental deposits 24 132
Liquidity contract 20 5
Deposit - negotiation Primer Design - -
Guaranty deposit - Distributor in China 94 94
Other - 4
138 235
Amounts in '000 €
Year ended 31
December
2016
Novacyt 5 899
Lab21 4 346
Healthcare 1 041
Microgen 34
Total unrecognised deferred tax assets 11 320

- 35 -
22. OTHER LONG-TERM ASSETS
23. INVENTORIES
The cost of inventories recognised as an expense includes €1 thousand (Dec. 2016: €20 thousand,) in respect of write-downs of inventory to net realisable value, and has been reduced by €20 thousand (Dec. 2016: €6 thousand) in respect of the reversal of such write-downs.
24. TRADE AND OTHER RECEIVABLES
Trade and other receivables
Amounts in '000 €
Year ended 31
December
2016
Six months
ended 30 June
2017
(unaudited)
Borrowing issuance costs 39 -
Prepayments – long term part 9 - Other receivables
48 -
Amounts in '000 €
Year ended
31 December
2016
Six months
ended
30 June 2017
(unaudited)
Raw materials 820 1 030
Work in progress 173 159
Finished goods 489 432
Traded goods 152 189
1 634 1 810
Amounts in '000 €
Year ended
31 December
2016
Six months
ended
30 June 2017
(unaudited)
Trade and other receivables 2 072 2 419
Allowance for doubtful debts 139 - 135 -
Clients - invoices to raise 89 113
Tax receivables (excluding income tax) 284 410
Other receivables 155 176
Impairment of other receivables 105 - -
Total Trade and other receivables 2 356 2 983
- 36 -
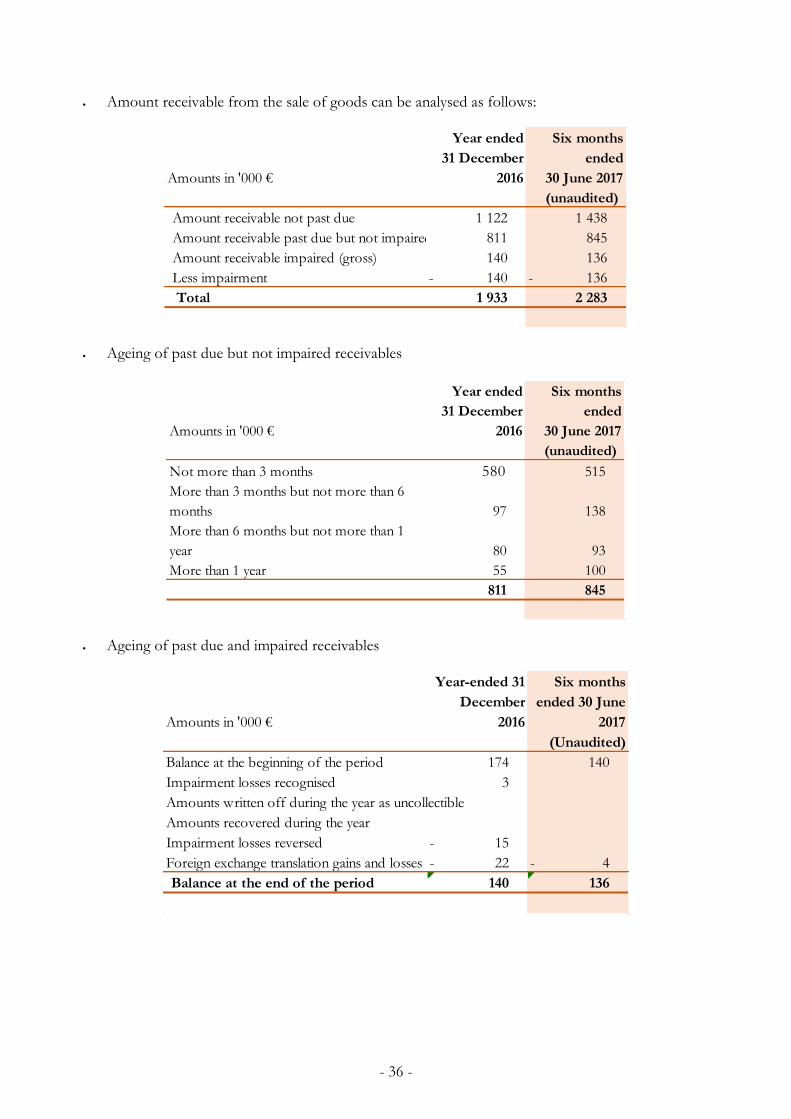
Amount receivable from the sale of goods can be analysed as follows:
Ageing of past due but not impaired receivables
Ageing of past due and impaired receivables
Amounts in '000 €
Year ended
31 December
2016
Six months
ended
30 June 2017
(unaudited)
Amount receivable not past due 1 122 1 438
Amount receivable past due but not impaired 811 845
Amount receivable impaired (gross) 140 136
Less impairment 140 - 136 -
Total 1 933 2 283
Amounts in '000 €
Year ended
31 December
2016
Six months
ended
30 June 2017
(unaudited)
Not more than 3 months 580 515
More than 3 months but not more than 6
months 97 138
More than 6 months but not more than 1
year 80 93
More than 1 year 55 100
811 845
Amounts in '000 €
Year-ended 31
December
2016
Six months
ended 30 June
2017
(Unaudited)
Balance at the beginning of the period 174 140
Impairment losses recognised 3
Amounts written off during the year as uncollectible
Amounts recovered during the year
Impairment losses reversed 15 -
Foreign exchange translation gains and losses 22 - 4 -
Balance at the end of the period 140 136
- 37 -
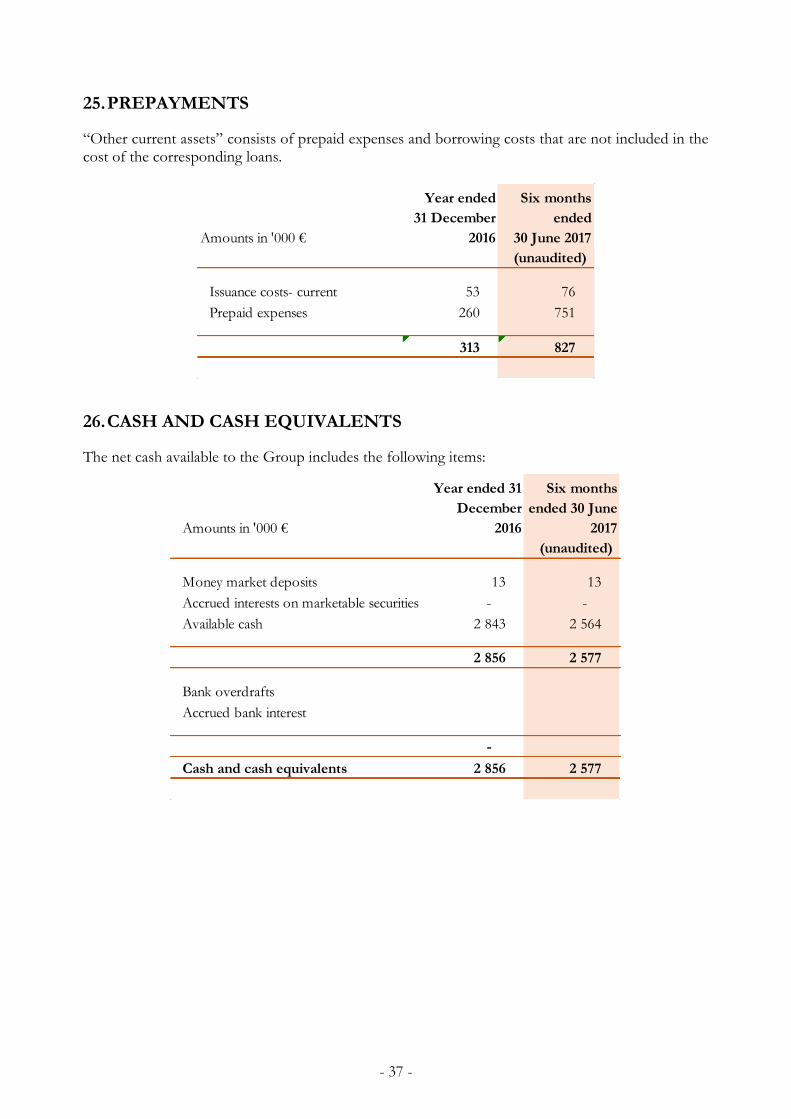
25. PREPAYMENTS
“Other current assets” consists of prepaid expenses and borrowing costs that are not included in the cost of the corresponding loans.
26. CASH AND CASH EQUIVALENTS
The net cash available to the Group includes the following items:
Amounts in '000 €
Year ended
31 December
2016
Six months
ended
30 June 2017
(unaudited)
Issuance costs- current 53 76
Prepaid expenses 260 751
313 827
Amounts in '000 €
Year ended 31
December
2016
Six months
ended 30 June
2017
(unaudited)
Money market deposits 13 13
Accrued interests on marketable securities - -
Available cash 2 843 2 564
2 856 2 577
Bank overdrafts
Accrued bank interest
-
Cash and cash equivalents 2 856 2 577

- 38 -
27. BORROWINGS
The following tables show borrowings and financial liabilities carried at amortised cost.
Maturities as of 30 June 2017
Maturities as of 31 December 2016
Amounts in '000 €
Amount due
for settlement
within 12
months
Amount due
for settlement
after 12
months
Total
Bond notes 2 919 2 204 5 123
Bank borrowings 66 120 186
Accrued interest on borrowings 76 - 76
Contingent consideration liability 1 665 1 000 2 665
Total financial liabilities 4 726 3 324 8 050
Amounts in '000 €
Amount due
for settlement
within 12
months
Amount due
for settlement
after 12
months
Total
Bond notes 3 017 2 603 5 620
Bank borrowings 67 153 220
Accrued interest on borrowings 414 414
Contingent consideration liability 1 647 946 2 593
Total financial liabilities 5 145 3 702 8 848

- 39 -
Change in borrowings and financial liabilities in 2017
Change in borrowings and financial liabilities in 2016
As of 31 December 2016, the Group’s financing primarily comprised:
- The bond subscribed by Kreos Capital IV Ltd in the amount of €3.5 million;
- A second bond subscribed by Kreos Capital V Ltd in the amount of €3.0 million issued on 12 May 2016, with an interest rate of 12.5% for a term of three years, with a first redemption due on 1 November 2016.
As of 30 June 2017, the Group’s financing primarily comprised:
- A bond subscribed by Kreos Capital IV Ltd in the amount of €3.5 million on 15 July 2015;
- A bond subscribed by Kreos Capital V Ltd in the amount of €3 million issued on 12 May 2016;
- A convertible bond subscribed by Vatel in the amount of €1.5 million issued on 31 March 2017, with an interest rate of 7.9 % for a term of 3 years.
In addition to the loans above, the Group financed its short term working capital needs through convertible notes issued with warrants. The paragraphs below describe the related movements.
On 31 July 2015, the Board of Directors, making use of the delegation of powers and authorisations granted at the Annual General Meeting of 29 June 2015, approved the principle of the issue of 20
Amounts in '000 €
At 31
December
2016
IncreaseRepayment /
conversion
Fair value
adjust.
At 30 June
2017
Bond notes 5 620 1 843 2 340 - 5 123
Bank borrowings 220 - 34 - 186
Accrued interest on borrowings 414 76 414 - 76
Contingent consideration liability 2 593 72 2 665
Total financial liabilities 8 847 1 919 2 788 - 72 8 050
Amounts in 000' €
At 31
December
2015
IncreaseRepayment /
conversion
At 31
December
2016
Bond notes 3 284 4 221 1 885 - 5 620
Bank borrowings 32 250 62 - 220
Accrued interest on borrowings 57 429 72 - 414
Contingent consideration liability - 2 845 252 - 2 593
Total financial liabilities 3 373 7 745 2 271 - 8 847

- 40 -
OCABSA warrants (the “Warrants”) exercisable at the discretion of Novacyt over the subsequent 36 months, in several successive tranches representing bond debt in a maximum amount of €5 million, as part of a private placement subscribed by the YA Global Master SPV Ltd private equity fund.
Novacyt immediately exercised (1) Warrant, resulting in the subscription of 25 OCABSAs, i.e. bond debt of €250,000. The 475 remaining convertible bonds may be issued during the subsequent 36 months through the exercise of the 19 remaining Warrants, it being stipulated that Novacyt is under no obligation to exercise these Warrants.
The convertible bonds (OCA) issued on 31 July 2015, and which will subsequently be issued upon exercise of the Warrants, have the same characteristics.
OCAs are issued at par, i.e. €10,000 each, with an interest rate of 2% per annum, and have a maturity of nine months from issue. Novacyt must redeem unconverted OCAs upon maturity.
The bond debt represented by the OCAs (par value of an OCA taking into account, if applicable, the corresponding interest) can be converted into shares at the request of the holder, on the basis of the following conversion rate: 95% of the lowest of the five (5) average daily prices of the Novacyt share weighted by volume (as reported by Bloomberg) immediately preceding the request for the conversion of the relevant OCA, without its being possible for this amount to be lower than the par value of the Novacyt share, i.e. 1/15th of a euro. The OCAs are transferable subject to Novacyt’s prior written consent.
The number of equity warrants to be issued upon each issuance of OCABSAs is that which will be multiplied by the exercise price of the equity warrants (determined under the terms set out below). The amount received will be equal to half of the par value of the 25 OCAs issued, i.e. €125,000.
The equity warrants will be immediately detached from the OCAs and will be transferable from issue. They may be exercised from issue until the 36th month inclusive following their issue date (the “Exercise Period”). Each equity warrant will entitle the holder thereof, during the Exercise Period, to subscribe for one (1) new Novacyt share.
The exercise price of the equity warrants will be equal to 110% of the closing price of the Novacyt share on the day immediately preceding the Warrant exercise request date giving rise to the issuance of the OCAs from which the equity warrants will be detached (or the issue date of the OCAs for the first tranche of OCAs, i.e. 31 July 2015).
The OCAs and the warrants will not be the subject of a request for admission to trading on Alternext Paris, and as such will not be listed.
In accordance with IAS 32, the first tranche of the bond issued on 31 July in the amount of €250,000 (tranche 1) breaks down as follows:
- the conversion option, treated in this case as an embedded derivative under IAS 32, worth €13,158, was recorded at “fair value through profit or loss” in current borrowings,
- the equity warrants, valued at €9,831 overall, were treated as equity instruments and accounted for net of tax, i.e. €6,554,
- lastly, the residual amount, €227,011, was recognised at amortised cost under current financial liabilities.
As of 31 December 2015, all OCAs had been converted, 5 OCAs on 31 July 2015, 15 OCAs on 9 October 2015 and the remaining 5 OCAs on 3 December 2015.
Between 1 January 2016 and 31 December 2016, Novacyt exercised 8 Warrants (OCABSA warrants), each resulting in the issuance of 25 OCABSAs in a total amount of €250,000. In accordance with IAS 32, each tranche of bonds issued during the year has been broken down in the same way as the first instalment and in identical amounts. Issuance is as follows:

- 41 -
- Issuance of the second tranche on 1 March 2016 (tranche 2): all OCABSAs were converted during the year;
- Concurrent issuance of the third and fourth tranches on 18 April 2016 (tranches 3 and 4): all OCABSAs were converted during the year;
- Concurrent issuance of the fifth and sixth tranches on 2 August 2016 (tranches 5 and 6): all OCABSAs were converted during the year;
- Concurrent issuance of the seventh, eighth and ninth tranches on 26 September 2016 (tranches 7, 8 and 9): only the tranche 7 OCABSAs were converted during the year. (It should nevertheless be noted that 20 tranche 8 OCABSAs were converted on 4 January 2017, i.e. after the reporting date.)
Between 1 January 2017 and 30 June 2017, Novacyt has converted all OCABSA bonds issued in the eighth and ninth tranches: 20 OCABSAs on 4 January 2017 and 5 OCABSAs on 23 February 2017 for tranche 8, and 10 OCABSAs on 23 February 2017 and 15 OCABSAs on 13 April 2017 for tranche 9.
Novacyt also exercised 2 OCABSA warrants on 17 February 2017, each giving rise to the issuance of a tranche of 25 OCABSAs totalling €250,000 (tranches 10 and 11), all 50 OCABSAs having been converted on 15 May 2017.
Since 1 July 2017, Novacyt exercised the tranches 12, 13, 14, and 15 of the contract, representing 4 Warrants (OCABSA warrants) each resulting in the issuance of 25 OCABSAs in a total amount of €.1,000,000. All OCABSAs were converted.
Contingent liabilities
The Contingent liabilities related to the acquisition of the Primer Design Shares amounts to €.2,665 thousand at 30 June 2017 and €.2,593 thousand at 31 December 2016. The liability between the two dates is explained as follows: - A decrease by €.68 thousand as a result of the variation of the foreign exchange rate (the contingent
liability is denominated in sterling pounds); - An increase by €.140 thousand resulting from the accreation of the non-current portion of the
liability.
28. PROVISIONS
Nature of and change in provisions for risks and charges for the period from 1 January 2016 to 30 June 2017
Amounts in 000' €
At 1 January
2017 Increase Reduction
Change in
exchange
rates
Acquisition of
subsidiary
At 30 June
2017
(unaudited)
Retirement benefit obligations 14 2 16
Provisions for restoration of premises 89 3 - 86
Long-term provision 103 2 - 3 - - 102
Provisions for litigation 66 - 66
Provisions (current portion) 66 - - - - 66

- 42 -
Provisions chiefly cover:
- Provision for retirements benefits payable to Novacyt employees, the calculation of which is described in section 5.1;
- A provision for litigation with personnel ;
- And provisions for the restoration of the premises as per the lease agreements.
The provisions for the restoration of the premises should generate a cash payment at the end of the rental periods, thus at the following dates:
- Lab21 Ltd : March – April 2019,
- Lab21 Healthcare Ltd : September 2018,
- Microgen Ltd : September 2017.
The provision for litigation may generate a cash payment in December 2017.
29. TRADE AND OTHER PAYABLES
Amounts in 000' €
At 1 January
2016 Increase Reduction
Change in
exchange
rates
Acquisition of
subsidiary
At 31
December
2016
Retirement benefit obligations 40 1 27 - 14
Provisions for restoration of premises 103 - - 14 - - 89
Long-term provision 143 1 27 - 14 - - 103
Provisions for litigation 66 66
Provisions (current portion) 66 - - - - 66
Amounts in '000 €
Year ended 31
December
2016
Six months
ended 30 June
2017
(unaudited)
Trade payables 2 087 1 922
Accrued invoices 694 793
Social security liabilities 348 336
Tax liabilities 53 143
Other liabilities 29 5
Debts with sharesholders - -
Options classified as liabilities 293 84
3 504 3 283
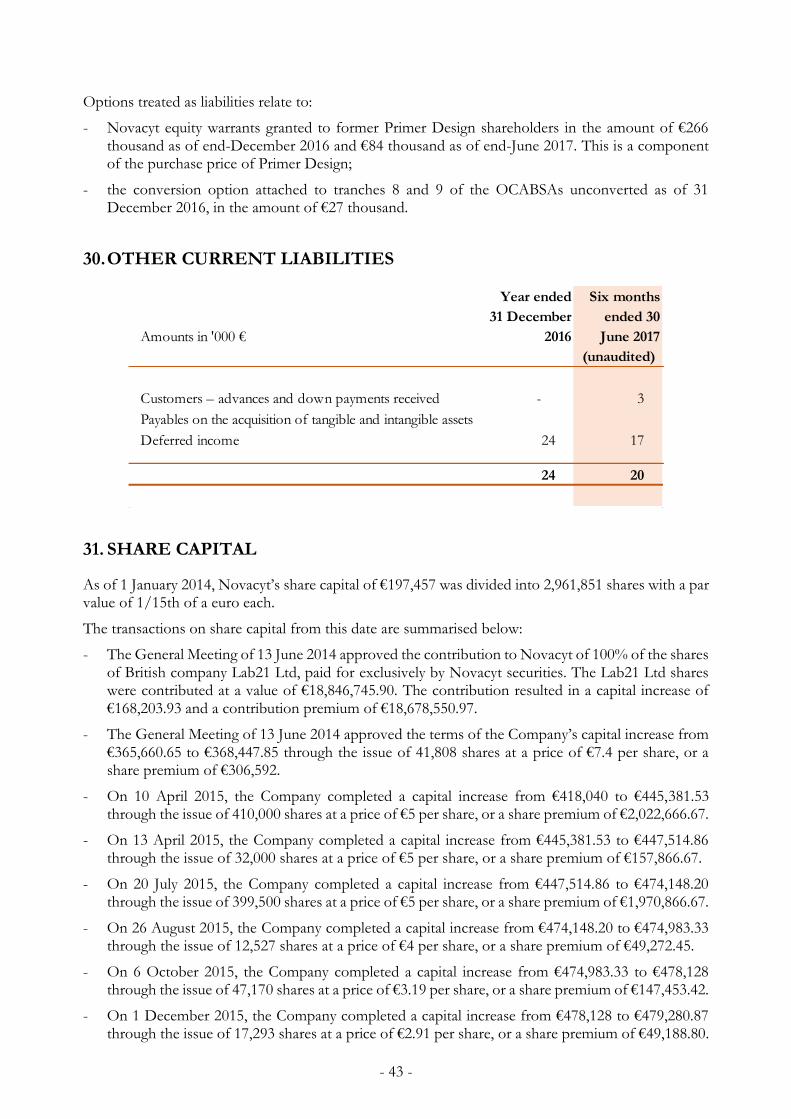
- 43 -
Options treated as liabilities relate to:
- Novacyt equity warrants granted to former Primer Design shareholders in the amount of €266 thousand as of end-December 2016 and €84 thousand as of end-June 2017. This is a component of the purchase price of Primer Design;
- the conversion option attached to tranches 8 and 9 of the OCABSAs unconverted as of 31 December 2016, in the amount of €27 thousand.
30. OTHER CURRENT LIABILITIES
31. SHARE CAPITAL
As of 1 January 2014, Novacyt’s share capital of €197,457 was divided into 2,961,851 shares with a par value of 1/15th of a euro each.
The transactions on share capital from this date are summarised below:
- The General Meeting of 13 June 2014 approved the contribution to Novacyt of 100% of the shares of British company Lab21 Ltd, paid for exclusively by Novacyt securities. The Lab21 Ltd shares were contributed at a value of €18,846,745.90. The contribution resulted in a capital increase of €168,203.93 and a contribution premium of €18,678,550.97.
- The General Meeting of 13 June 2014 approved the terms of the Company’s capital increase from €365,660.65 to €368,447.85 through the issue of 41,808 shares at a price of €7.4 per share, or a share premium of €306,592.
- On 10 April 2015, the Company completed a capital increase from €418,040 to €445,381.53 through the issue of 410,000 shares at a price of €5 per share, or a share premium of €2,022,666.67.
- On 13 April 2015, the Company completed a capital increase from €445,381.53 to €447,514.86 through the issue of 32,000 shares at a price of €5 per share, or a share premium of €157,866.67.
- On 20 July 2015, the Company completed a capital increase from €447,514.86 to €474,148.20 through the issue of 399,500 shares at a price of €5 per share, or a share premium of €1,970,866.67.
- On 26 August 2015, the Company completed a capital increase from €474,148.20 to €474,983.33 through the issue of 12,527 shares at a price of €4 per share, or a share premium of €49,272.45.
- On 6 October 2015, the Company completed a capital increase from €474,983.33 to €478,128 through the issue of 47,170 shares at a price of €3.19 per share, or a share premium of €147,453.42.
- On 1 December 2015, the Company completed a capital increase from €478,128 to €479,280.87 through the issue of 17,293 shares at a price of €2.91 per share, or a share premium of €49,188.80.
Amounts in '000 €
Year ended
31 December
2016
Six months
ended 30
June 2017
(unaudited)
Customers – advances and down payments received - 3
Payables on the acquisition of tangible and intangible assets
Deferred income 24 17
24 20
- 44 -
- On 22 February 2016, the company decided to increase its capital through the issue of 2,365,815 shares subject to one or more capital increases in a total amount of at least 7,000,000 euros or the receipt of an equivalent amount. This transaction subject to a condition precedent is consideration for the contribution of 59,893 shares of Primer Design Limited by its shareholders.
- On 29 March 2016, the Company completed a capital increase from €479,280.87 to €569,423.20 through the issue of 1,352,135 shares at a price of €1.40 per share, with a share premium of €1,802,846.67.
- On 29 March 2016, the Company completed a capital increase from €569,423.20 to €574,089.87 through the issue of 70,000 shares at a price of €1.40 per share, with a share premium of €93,333.33.
- On 21 April 2016, the Company completed a capital increase from €574,089.87 to €669,328 through the issue of 1,428,572 shares at a price of €1.40 per share, with a share premium of €1,904,762.67.
- On 26 April 2016, the Company completed a capital increase from €669,328 to €674,101.27 through the issue of 71,599 shares at a price of €1.401 per share, with a share premium of €95,537.84.
- On 3 May 2016, the Company completed a capital increase from €674,101.27 to €678,963.40 through the issue of 72,932 shares at a price of €1.376 per share, with a share premium of €95,493.43.
- On 11 May 2016, the Company noted that the condition precedent on the capital increase through a contribution in kind approved on 22 February 2016 had been lifted. Share capital was consequently increased from €678,963.40 to €836,684.40 through the issue of 2,365,815 shares at a price of €2.696 per share, or a share premium of €6,220,514.
- On 19 May 2016, the Company completed a capital increase from €836,684.40 to €842,372.20 through the issue of 85,317 shares at a price of €1.176 per share, with a share premium of €94,645.53.
- On 23 May 2016, the Company completed a capital increase from €842,372.20 to €867,933.40 through the issue of 383,418 shares at a price of €1.176 per share, with a share premium of €425,338.80.
- On 1 June 2016, the Company completed a capital increase from €867,933.40 to €935,650.53 through the issue of 1,015,757 shares at a price of €1.40 per share, with a share premium of €1,354,342.67.
- On 25 August 2016, the Company completed a capital increase from €935,650.53 to €943,967.66 through the issue of 124,757 shares at a price of €1.20 per share, with a share premium of €141,766.20.
- On 7 September 2016, the Company completed a capital increase from €943,967.66 to €949,438.26 through the issue of 82,059 shares at a price of €1.22 per share, with a share premium of €94,723 84.
- On 21 September 2016, the Company completed a capital increase from €949,438.26 to €957,421.66 through the issue of 119,751 shares at a price of €1.26 per share, with a share premium of €150,408.33.
- On 5 October 2016, the Company completed a capital increase from €957,421.66 to €962,942.86 through the issue of 82,818 shares at a price of €1.21 per share, with a share premium of €100,458.34.
- On 1 December 2016, the Company completed a capital increase from €962,942.86 to €969,517.06 through the issue of 98,613 shares at a price of €1.02 per share, with a share premium of €100,388.89.
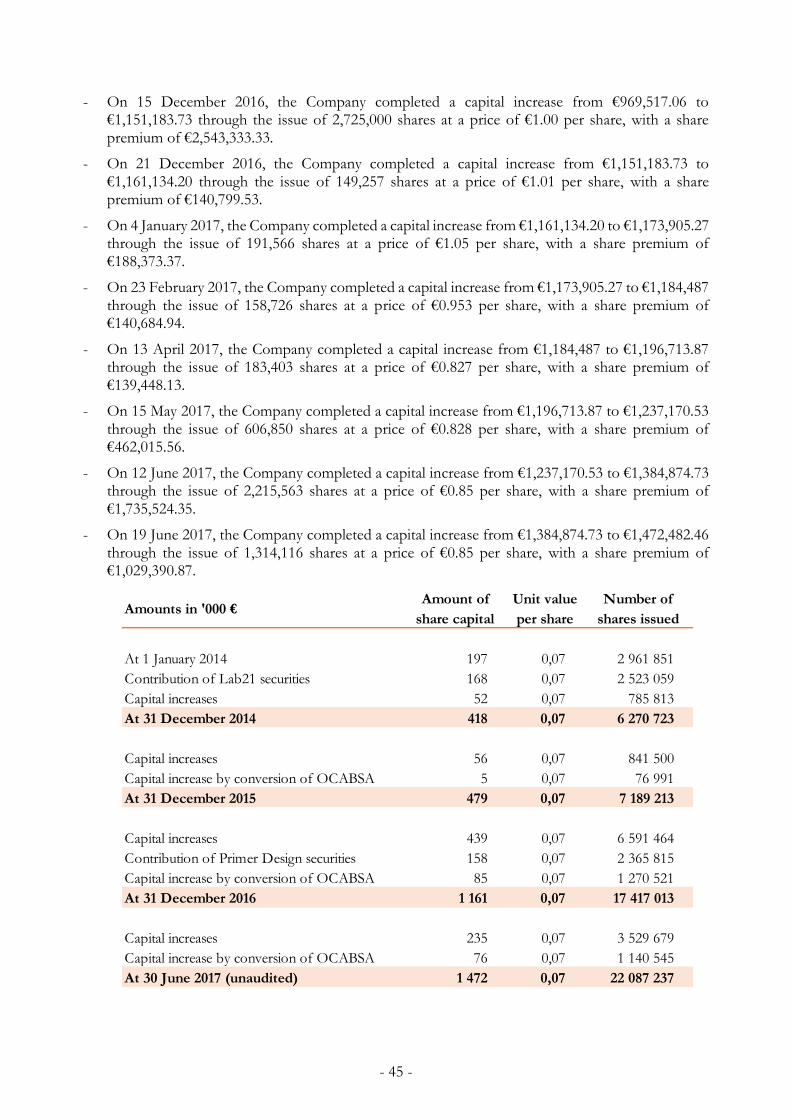
- 45 -
- On 15 December 2016, the Company completed a capital increase from €969,517.06 to €1,151,183.73 through the issue of 2,725,000 shares at a price of €1.00 per share, with a share premium of €2,543,333.33.
- On 21 December 2016, the Company completed a capital increase from €1,151,183.73 to €1,161,134.20 through the issue of 149,257 shares at a price of €1.01 per share, with a share premium of €140,799.53.
- On 4 January 2017, the Company completed a capital increase from €1,161,134.20 to €1,173,905.27 through the issue of 191,566 shares at a price of €1.05 per share, with a share premium of €188,373.37.
- On 23 February 2017, the Company completed a capital increase from €1,173,905.27 to €1,184,487 through the issue of 158,726 shares at a price of €0.953 per share, with a share premium of €140,684.94.
- On 13 April 2017, the Company completed a capital increase from €1,184,487 to €1,196,713.87 through the issue of 183,403 shares at a price of €0.827 per share, with a share premium of €139,448.13.
- On 15 May 2017, the Company completed a capital increase from €1,196,713.87 to €1,237,170.53 through the issue of 606,850 shares at a price of €0.828 per share, with a share premium of €462,015.56.
- On 12 June 2017, the Company completed a capital increase from €1,237,170.53 to €1,384,874.73 through the issue of 2,215,563 shares at a price of €0.85 per share, with a share premium of €1,735,524.35.
- On 19 June 2017, the Company completed a capital increase from €1,384,874.73 to €1,472,482.46 through the issue of 1,314,116 shares at a price of €0.85 per share, with a share premium of €1,029,390.87.
Amounts in '000 €Amount of
share capital
Unit value
per share
Number of
shares issued
At 1 January 2014 197 0,07 2 961 851
Contribution of Lab21 securities 168 0,07 2 523 059
Capital increases 52 0,07 785 813
At 31 December 2014 418 0,07 6 270 723
Capital increases 56 0,07 841 500
Capital increase by conversion of OCABSA 5 0,07 76 991
At 31 December 2015 479 0,07 7 189 213
Capital increases 439 0,07 6 591 464
Contribution of Primer Design securities 158 0,07 2 365 815
Capital increase by conversion of OCABSA 85 0,07 1 270 521
At 31 December 2016 1 161 0,07 17 417 013
Capital increases 235 0,07 3 529 679
Capital increase by conversion of OCABSA 76 0,07 1 140 545
At 30 June 2017 (unaudited) 1 472 0,07 22 087 237

- 46 -
As of 30 June 2017, Novacyt’s share capital of €1,472,482.46 was divided into 22,087,237 shares with a par value of 1/15th of a euro each.
Capital increases over the period can be classified in two categories:
The Company’s share capital consists of one class of share.
All outstanding shares have been subscribed, called and paid.
32. SHARE PREMIUM
33. RETAINED EARNINGS AND OTHER RESERVES
Amounts in '000 €
Share
premium
Balance at 1 January 2014 6 405
Premium arising on issue of equity shares 22 022
Expenses of issue of equity shares - 243
Balance at 31 December 2014 28 184
Premium arising on issue of equity shares 4 397
Expenses of issue of equity shares - 197
Balance at 31 December 2015 32 384
Premium arising on issue of equity shares 15 338
Expenses of issue of equity shares - 602
Balance at 31 December 2016 47 120
Premium arising on issue of equity shares 3 695
Expenses of issue of equity shares - 231
Balance at 30 June 2017 (unaudited) 50 585
Amounts in '000 €
Balance at 1 January 2014 - 4 302
Net loss for the year - 3 912
Other comprehensive income arising from measurement of defined
benefit obligation net of income tax- 10
Translation reserves - 21
Other variations 2
Balance at 31 December 2014 - 8 243
Net loss for the year - 13 908
Other comprehensive income arising from measurement of defined
benefit obligation net of income tax- 3
Translation reserves - 48
Other variations - 36
Balance at 31 December 2015 - 22 238
Net loss for the period - 5 711
Other comprehensive income arising from measurement of defined
benefit obligation net of income tax- 1
Translation reserves 206
Acquisition of the shares of Primer Design - 2 948
Grant to Kreos Capital of Novacyt warrants 283
Conversion of the OCABSA Yorkville 62
Balance at 31 December 2016 - 30 347
Net loss for the period - 1 712
Translation reserves - 7
Other variations 9
Balance at 30 June 2017 (unaudited) - 32 058

- 47 -
34. ACQUISITION OF SUBSIDIARIES
Acquisition of Primer Design
On 12 May 2016, the Group took control of British company Primer Design, through the acquisition of 100% of its shares by Novacyt SA. For the purpose of simplification, the initial consolidation is deemed to have taken place on 1 May 2016. Primer Design specialises in the design, manufacture and sale of molecular diagnostic kits. It also markets a molecular biology technology platform. This acquisition offers the Group scope to extract synergies derived from the commercialisation of the Primer Design offering via the Novacyt network and from the complementary technological nature of the cytology and molecular biology sectors. The purchase price was €13,566 thousand, breaking down as follows: Value of Novacyt securities tendered €3,430k
Option to purchase Novacyt securities €445k Cash disbursed €7,081k Contingent consideration payable in 2017 and 2018 €2,610k
Total purchase price €13,566k The assets acquired and the liabilities assumed are as follows: Net property, plant and equipment and intangible assets €473k Customer relationships €3,676k Trademark €660k Inventories €462k Trade receivables €531k Other receivables €487k Net cash and cash equivalents €764k Trade payables €(281)k Other liabilities €(415)k
Fair value of assets acquired and liabilities assumed €6,357k Goodwill €7,210k The net cash impact of the acquisition of Primer Design is as follows: Cash disbursed €(9,691)k Cash acquired €749k
Net cash impact €(8,942)k
The fair value of assets includes unimpaired trade receivables with a net value of €531 thousand. Goodwill is a residual component calculated as the difference between the purchase price for the acquisition of control and the fair value of the assets acquired and liabilities assumed. It includes unrecognised assets such as the value of the personnel and know-how of the acquiree. The fair value of the Novacyt securities tendered as consideration for the acquisition of the Primer Design securities was determined on the basis of the market price on the date of the transaction. The contingent consideration was estimated at the sum of £2.5 million payable in the event of achievement of sales targets in the three years following the acquisition. The contingent consideration was estimated on the basis of estimated revenue and has been discounted. The acquisition costs amounted to €508 thousand. They are included in “Other operating income and expenses”.

- 48 -
Primer Design contributed €3,288 thousand to consolidated revenue in the year ended 31 December 2016 and €971 thousand to net profit or loss attributable to owners of the company between its consolidation on 1 May 2016 and 31 December 2016. If the acquisition of Primer Design were deemed to have been completed on 1 January 2016, the opening date of the Group’s 2016 financial year, consolidated revenue would have amounted to €12,925 thousand and net profit or loss attributable to owners of the company to a loss of €5,424 thousand. The table below presents the group income statement for the 12 months period ended on 31 December 2016 as if the acquisition of Primer Design had been completed on 1st January 2016.
Amounts in 000' €
2016.12
Proforma
Revenue 12 925
Cost of sales 5 297 -
Gross profit 7 628
Sales and marketing costs 3 451 -
Research and development 895 -
General & administrative costs 6 410 -
Governmental subsidies 372
Recurring operating loss 2 755 -
Costs related to acquisitions 508 -
Other operating income 20
Other operating expenses 935 -
Operating loss - 4 178
Financial income 781
Financial expenses 1 983 -
Loss before tax - 5 380
Tax expense 44 -
Loss after tax 5 424 -
Total net loss 5 424 -
Attributable to owners of the company 5 424 -
Attributable to non-controlling interests -

- 49 -
The table below presents the group income statement for the 6 months period ended on 30 June 2016 as if the acquisition of Primer Design had been completed on 1st January 2016.
Amounts in 000' €
2016.06
Proforma
Revenue 6 795
Cost of sales - 2 642
Gross profit 4 154
Sales and marketing costs - 1 762
Research and development - 527
General & administrative costs - 3 449
Governmental subsidies 88
Recurring operating loss - 1 497
Other operating income 22
Other operating expenses - 876
Operating loss - 2 350
Cost of net financial debt 138
Other financial income and expenses - 982
Loss before tax - 3 194
Tax expense - 105
Loss after tax - 3 299
Total net loss - 3 299
Attributable to owners of the company - 3 299
Attributable to non-controlling interests

- 50 -
Acquisition of the Lab21 subgroup
On 13 June 2014, the Group took control of the Lab21 subgroup through the acquisition by Novacyt SA of 100% of Lab21, which wholly owns Lab21 Healthcare, Biotec Laboratories, Microgen Bioproducts and Selah Technologies. For the purpose of simplification, the subgroup is deemed to have entered the scope of consolidation on 30 June 2014. Lab21 and its subsidiaries have the following activities: - the provision of specialised and routine clinical laboratory testing services to clinicians, healthcare providers and patients; - the manufacture and distribution of high-quality diagnostic products for clinical and food laboratories (through Microgen Bioproducts). This acquisition places the Group at the forefront of the diagnostics sector, with a diversified portfolio of cancer and infectious disease tests. The Group now intends to develop synergies resulting from Novacyt’s research and development capabilities, and Lab21’s commercial infrastructure, production units and network of partnerships and cooperation agreements. The purchase price was €18,847 thousand, breaking down as follows: Value of Novacyt securities tendered €18,847k
Total purchase price €18,847k
The assets acquired and the liabilities assumed are as follows: Net property, plant and equipment and intangible assets €123k Inventories €917k Trade receivables €1,031k Other receivables €243k Net cash and cash equivalents €979k Trade payables €(1,537)k Other liabilities €(1,951)k
Fair value of assets acquired and liabilities assumed €(195)k
Goodwill €19,042k The net cash impact of the acquisition of Lab21 and its subsidiaries is as follows: Cash disbursed €0k Cash acquired €873k
Net cash impact €873k
The fair value of assets includes trade receivables with a net value of €1,031 thousand, after impairment of €342 thousand Goodwill is a residual component calculated as the difference between the purchase price for the acquisition of control and the fair value of the assets acquired and liabilities assumed. It includes unrecognised assets such as the value of the personnel and know-how of the acquiree. The fair value of the Novacyt securities tendered as consideration for the acquisition of the Lab21 securities was determined on the basis of the market price on the date of the transaction.

- 51 -
The acquisition costs amounted to €1,297 thousand. They are included in “Other operating income and expenses”. The Lab21 subgroup contributed €3,520 thousand to consolidated revenue in the year ended 31 December 2014 and € 96 thousand to net profit or loss attributable to owners of the company between its consolidation on 1 July 2014 and 31 December 2014. If the acquisition of the Lab21 subgroup were deemed to have been completed on 1 January 2014, the opening date of the Group’s 2014 financial year, consolidated revenue would have amounted to €12,925 thousand and net profit or loss attributable to owners of the company to a loss of €4,406 thousand. The table below presents the group income statement for the 12 months period ended on 31 December 2014 as if the acquisition of the Lab21 group of companies had been completed on 1st January 2014.
Proforma
Amounts in '000 €
Year ended
31 December
2014
000 €
Revenue 7 761
Cost of sales - 4 300
Gross profit 6 955
Operating loss - 3 577
Loss before tax - 4 406
Tax expense -
Loss after tax - 4 406
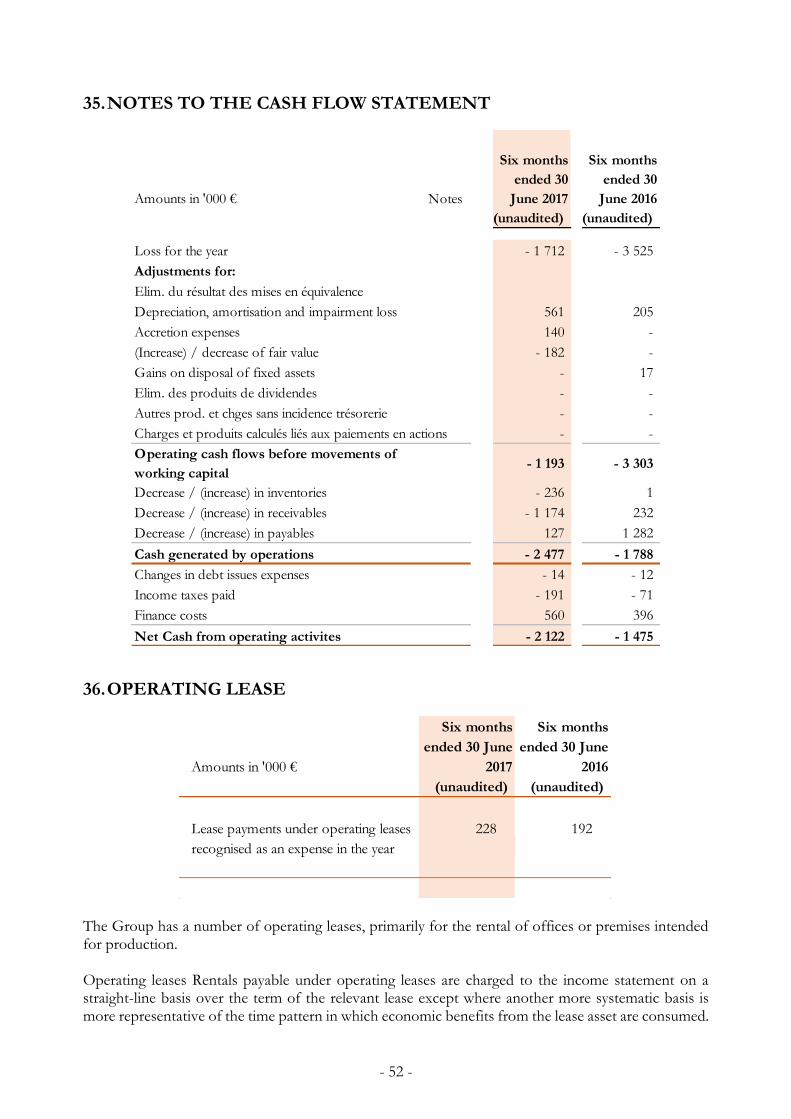
- 52 -
35. NOTES TO THE CASH FLOW STATEMENT
36. OPERATING LEASE
The Group has a number of operating leases, primarily for the rental of offices or premises intended for production. Operating leases Rentals payable under operating leases are charged to the income statement on a straight-line basis over the term of the relevant lease except where another more systematic basis is more representative of the time pattern in which economic benefits from the lease asset are consumed.
Amounts in '000 € Notes
Six months
ended 30
June 2017
Six months
ended 30
June 2016
(unaudited) (unaudited)
Loss for the year - 1 712 - 3 525
Adjustments for:
Elim. du résultat des mises en équivalence
Depreciation, amortisation and impairment loss 561 205
Accretion expenses 140 -
(Increase) / decrease of fair value - 182 -
Gains on disposal of fixed assets - 17
Elim. des produits de dividendes - -
Autres prod. et chges sans incidence trésorerie - -
Charges et produits calculés liés aux paiements en actions - -
Operating cash flows before movements of
working capital- 1 193 - 3 303
Decrease / (increase) in inventories - 236 1
Decrease / (increase) in receivables - 1 174 232
Decrease / (increase) in payables 127 1 282
Cash generated by operations - 2 477 - 1 788
Changes in debt issues expenses - 14 - 12
Income taxes paid - 191 - 71
Finance costs 560 396
Net Cash from operating activites - 2 122 - 1 475
Amounts in '000 €
Six months
ended 30 June
2017
Six months
ended 30 June
2016
(unaudited) (unaudited)
Lease payments under operating leases 228 192
recognised as an expense in the year

- 53 -
Novacyt
In France, Novacyt has taken out a nine-year lease for its offices, with three periods ending on 14 February 2017, 2019 and 2022, each of which representing a firm commitment. The lease contract contains clauses relating to membership in the inter-company restaurant, the payment of insurance premiums and other rental charges. The rent is revised on each anniversary because it is indexed to the national cost of construction index.
Primer Design ltd
An operating lease currently exists for the York House site which is currently a mixed use for office, storage, and laboratory purposes. The lease originally commenced in November 2015 for a five-year period to November 2020. A variation to the lease was signed in March 2017 to enable increased capacity at the site and the use of all the upstairs of the York House site. This was led to an additional annual charge of £27,072 (including service charges). The annual charge for the site (service charges) is now £111,672 per annum.
Microgen Ltd
An operating lease currently exists for the Admiralty Way site which is currently a mixed use for office, storage, and laboratory purposes. The lease originally commenced in October 2015 for a two-year period to September 2017. The annual charge is £93,539. The existing site is to be vacated due to redevelopment. As a consequence, a new lease has been signed for the Watchmoor Park site which will again be mixed use. This commenced in May 2017, and will run until May 2032. There are rent review clauses in May 2022 and 2027. The annual charge for the site is £158,613 per annum.
Healthcare ltd
An operating lease currently exists for the Bridport site which is currently used for manufacturing, storage, and laboratory purposes. The lease originally commenced in October 2013 for a five-year period to September 2018. There is an option to extend. The annual charge for the site is £38,903 per annum.
Lab 21 ltd
An operating lease currently exists for the Park House site which is currently a mixed use for office, storage, and laboratory purposes. The lease originally commenced in April 2014 for a five-year period to April 2019. The annual charge for the site including service charges is £63,700 per annum (which includes a £4,550 rent free period).
The transactions performed on assets received under operating leases are subject to contracts providing the following minimum future payments:
Amounts in '000 €
Year ended 31
December
2016
Six months
ended 30 June
2017
(unaudited)
Future minimum payments in respect of non-cancellable contracts
Payments due in less than 1 year 334 481
Payment due in more than 1 year and less than 5 years 288 1 377
Total 623 1 857
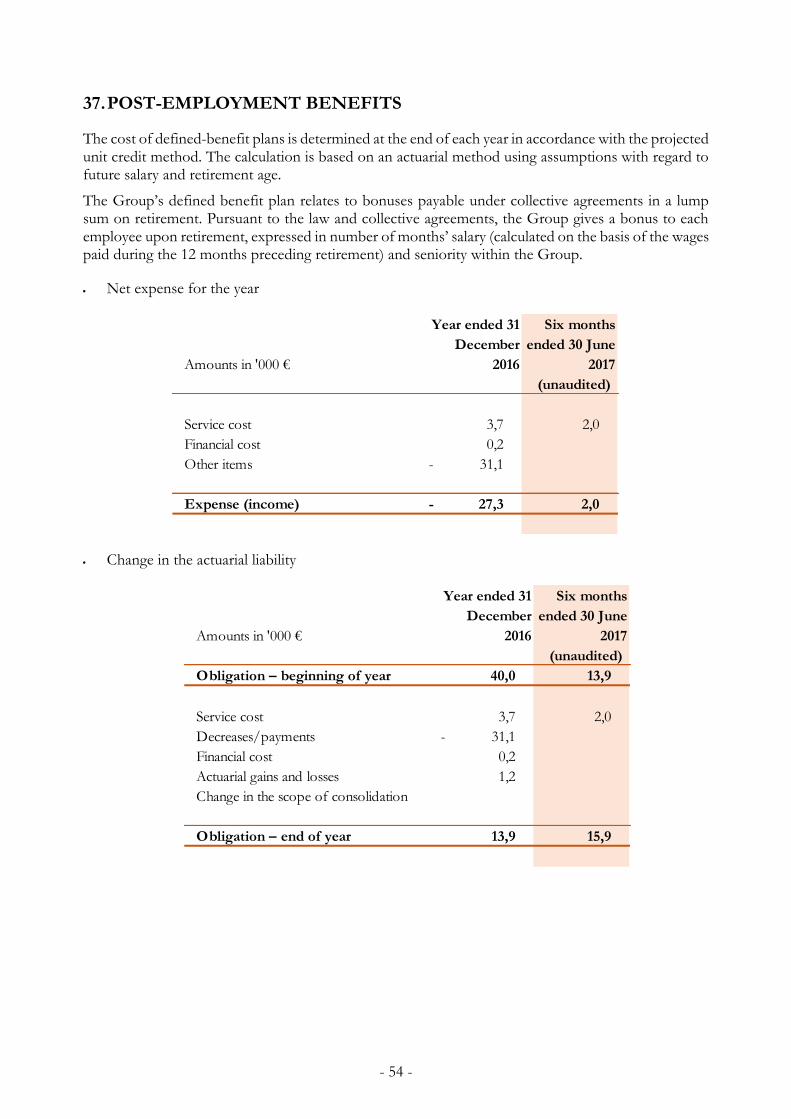
- 54 -
37. POST-EMPLOYMENT BENEFITS
The cost of defined-benefit plans is determined at the end of each year in accordance with the projected unit credit method. The calculation is based on an actuarial method using assumptions with regard to future salary and retirement age.
The Group’s defined benefit plan relates to bonuses payable under collective agreements in a lump sum on retirement. Pursuant to the law and collective agreements, the Group gives a bonus to each employee upon retirement, expressed in number of months’ salary (calculated on the basis of the wages paid during the 12 months preceding retirement) and seniority within the Group.
Net expense for the year
Change in the actuarial liability
Amounts in '000 €
Year ended 31
December
2016
Six months
ended 30 June
2017
(unaudited)
Service cost 3,7 2,0
Financial cost 0,2
Other items 31,1 -
Expense (income) 27,3 - 2,0
Amounts in '000 €
Year ended 31
December
2016
Six months
ended 30 June
2017
(unaudited)
Obligation – beginning of year 40,0 13,9
Service cost 3,7 2,0
Decreases/payments 31,1 -
Financial cost 0,2
Actuarial gains and losses 1,2
Change in the scope of consolidation
Obligation – end of year 13,9 15,9

- 55 -
• Breakdown of actuarial gains and losses
Actuarial assumptions
The assumptions used for measuring change in obligations in respect of retirement benefits are presented in the table below:
38. COMMITMENTS GIVEN AND RECEIVED
The guarantees given by the Group are as follows:
Under the terms of the bond contracts subscribed by Kreos Capital IV Ltd and Kreos Capital V Ltd, and as a guarantee of perfect repayment of this loan and interest, fees, commissions or other amounts due, the Group has agreed to the following guarantees in favour of the two structures:
- Pledge of the business;
- Senior pledge on receivables;
- Non-possessory pledge of inventories;
- Senior and non-recourse pledge of bank accounts.
The amount of guaranteed loans is presented in section 3.8 “Borrowings”.
The Company has also granted Primer Design shareholders a variable contingent consideration, settlement of which is scheduled for 2017 and 2018. As security for the payment of such sums, third-line pledge on business assets and collateral subject to English law (mortgage debentures) have been implemented.
Amounts in '000 €
Year ended 31
December
2016
Six months
ended 30 June
2017
(unaudited)
- Effect of experience 0,5
- Change in demographic assumptions 0,0
- Change in financial assumptions 0,6
Actuarial gains and losses 1,2
Amounts in '000 €
Year ended 31
December
2016
Six months
ended 30 June
2017
(unaudited)
Retirement age – managers 64 64
Retirement age – non-managers 62 62
Wage increases 3,00% 3,00%
Rate of social security contributions 41,10% 41,10%
Discount rate 1,50% 2,00%
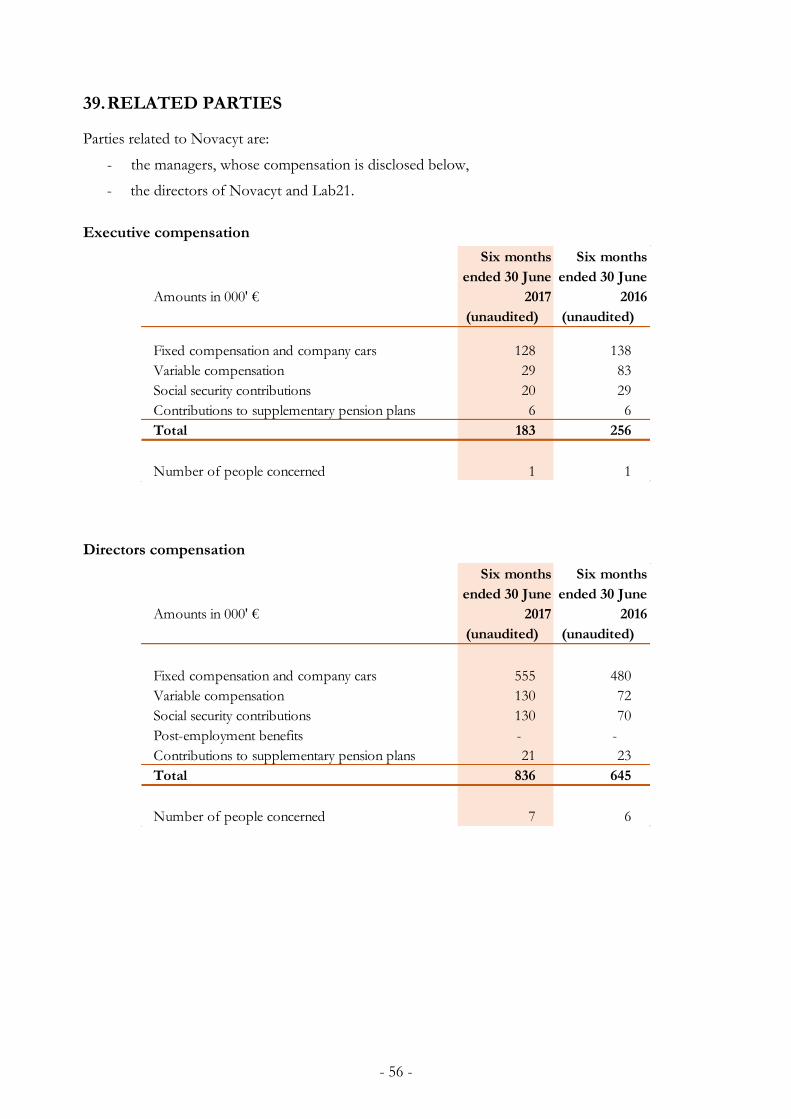
- 56 -
39. RELATED PARTIES
Parties related to Novacyt are:
- the managers, whose compensation is disclosed below,
- the directors of Novacyt and Lab21.
Executive compensation
Directors compensation
Amounts in 000' €
Six months
ended 30 June
2017
Six months
ended 30 June
2016
(unaudited) (unaudited)
Fixed compensation and company cars 128 138
Variable compensation 29 83
Social security contributions 20 29
Contributions to supplementary pension plans 6 6
Total 183 256
Number of people concerned 1 1
Amounts in 000' €
Six months
ended 30 June
2017
Six months
ended 30 June
2016
(unaudited) (unaudited)
Fixed compensation and company cars 555 480
Variable compensation 130 72
Social security contributions 130 70
Post-employment benefits - -
Contributions to supplementary pension plans 21 23
Total 836 645
Number of people concerned 7 6

- 57 -
Liabilities in respect of related parties
Liabilities in respect of related parties are as follows:
Related party transactions were made on terms equivalent to those that prevail in arm's length transactions.
40. IMPACT OF BREXIT ON THE GROUP’S ACTIVITY
Companies in operating in the “Diagnostics” and “Molecular testing” sectors are established in the United Kingdom. It is difficult to anticipate the impact of Brexit on trade relations and regulatory constraints. The tax consequences depend on the outcome of negotiations between Europe and the United Kingdom, and to date are undetermined. Management is seeking to identify market, operational and legal risks and to take the appropriate adaptation measures as required.
41. SUBSEQUENT EVENTS
The following significant events have taken place since 1 July 2017, the opening date of the H2 reporting period:
Following the end of the Period, Novacyt has raised an additional €1.0m by the drawing of the twelfth, thirteenth, fourteenth and fifteenth tranches of OCABSA. The framework of the contract was put in place on July 30, 2015 with YA Global Master SPV Ltd. The draw down relates to the issue of 100 bonds convertible into shares ("OCA") with a nominal value of €10,000 each representing a €1,000,000 bond issue
No other significant events have taken place since the reporting date.
Amounts in 000' €
Year-ended 31
December
2016
Six months
ended 30 June
2017
(unaudited)
CUP92 (director company, J.P. Crinelli) 41
J.P. Crinelli 8 -
E. Peltier
A. Howard, Director 35 16
A. Snape, Director 17 17
93 25