consolidated financial statements - cmic group
TRANSCRIPT

CMIC Co., Ltd
Consolidated Financial Statements For the Years ended September 30,
2005 and 2006 Together with Independent
Auditors’ Report
KPMG AZSA & Co.
© 2007 KPMG AZSA & Co., an audit corporation incorporated under the Japanese Certified Public Accountants Law and a member firm of the KPMG network of independent member firms affiliated
with KPMG International, a Swiss cooperative. All rights reserved.

CONSOLIDATED BALANCE SHEETSCMIC Co., Ltd. and consolidated subsidiariesAs of September 30, 2005 and 2006
Thousands of U.S. dollars
ASSETS 2005
Current assets:Cash on hand and in banks (Notes 2 and 7) ¥ 3,349,007 ¥ 4,365,351 $ 37,026Trade notes and accounts receivables:
Trade 3,317,985 4,447,572 37,723Allowance for doubtful accounts (Notes 2 ) (1,173) (1,460) (12)
Inventories (Notes 2 and 4 ) 472,485 512,395 4,346Deferred income taxes (Notes 2 and 12 ) 270,609 318,134 2,698Other current assets 338,536 385,892 3,273
Total current assets 7,747,449 10,027,884 85,054
Property, plant and equipments:Buildings and structures (Notes 2 and 3 ) 1,169,836 4,108,243 34,845Machinery and automobiles (Notes 2 ) 188,210 2,307,802 19,574Furniture and fixtures (Notes 2 ) 446,090 739,668 6,274Land (Notes 2 and 3 ) 351,818 1,830,950 15,530Less accumulated depreciation (Notes 2 ) (1,021,719) (5,005,202) (42,453)
Net property, plant and equipments 1,134,235 3,981,461 33,770
Intangible assets:Goodwill (Notes 2 ) 922,801 655,988 4,890Other intangible assets (Notes2 ) 171,311 152,628 1,969
Total intangible assets 1,094,112 808,616 6,859
Investments and other assets:Investments in securities (Notes 2 and 9 ) 457,203 534,605 4,534Deferred income taxes (Notes 2 and 12 ) 200,795 227,410 1,929Leasehold deposits 683,644 734,009 6,226Other investments 48,804 59,935 508
Total investments and other assets 1,390,446 1,555,959 13,197
Total assets ¥ 11,366,242 ¥ 16,373,920 $ 138,880
The accompanying notes to the consolidated financial statements are an integral part of theas statements
Thousands of yen (Note 1)2006 2006
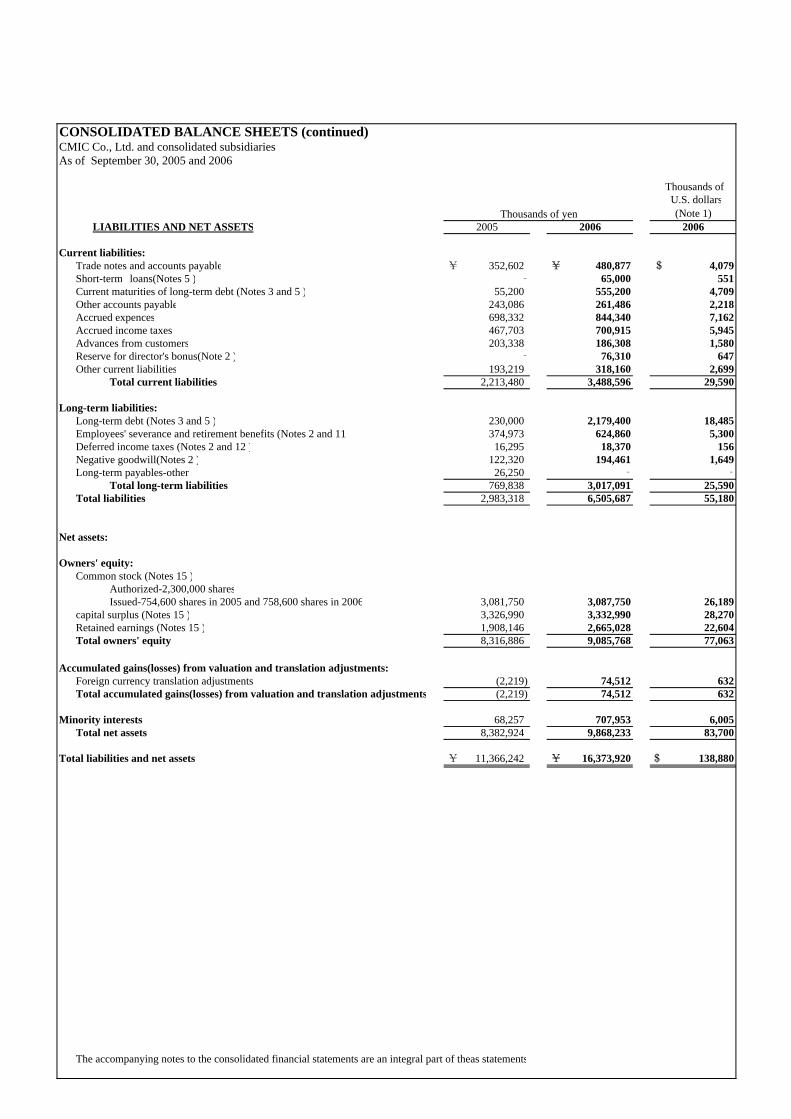
CONSOLIDATED BALANCE SHEETS (continued)CMIC Co., Ltd. and consolidated subsidiariesAs of September 30, 2005 and 2006
Thousands of U.S. dollars
LIABILITIES AND NET ASSETS 2005 2006 2006
Current liabilities:Trade notes and accounts payable ¥ 352,602 ¥ 480,877 $ 4,079Short-term loans(Notes 5 ) ‐ 65,000 551Current maturities of long-term debt (Notes 3 and 5 ) 55,200 555,200 4,709Other accounts payable 243,086 261,486 2,218Accrued expences 698,332 844,340 7,162Accrued income taxes 467,703 700,915 5,945Advances from customers 203,338 186,308 1,580Reserve for director's bonus(Note 2 ) ‐ 76,310 647Other current liabilities 193,219 318,160 2,699
Total current liabilities 2,213,480 3,488,596 29,590
Long-term liabilities:Long-term debt (Notes 3 and 5 ) 230,000 2,179,400 18,485Employees' severance and retirement benefits (Notes 2 and 11 ) 374,973 624,860 5,300Deferred income taxes (Notes 2 and 12 ) 16,295 18,370 156Negative goodwill(Notes 2 ) 122,320 194,461 1,649Long-term payables-other 26,250 ‐ ‐
Total long-term liabilities 769,838 3,017,091 25,590Total liabilities 2,983,318 6,505,687 55,180
Net assets:
Owners' equity: Common stock (Notes 15 )
Authorized-2,300,000 sharesIssued-754,600 shares in 2005 and 758,600 shares in 2006 3,081,750 3,087,750 26,189
capital surplus (Notes 15 ) 3,326,990 3,332,990 28,270Retained earnings (Notes 15 ) 1,908,146 2,665,028 22,604Total owners' equity 8,316,886 9,085,768 77,063
Accumulated gains(losses) from valuation and translation adjustments:Foreign currency translation adjustments (2,219) 74,512 632Total accumulated gains(losses) from valuation and translation adjustments (2,219) 74,512 632
Minority interests 68,257 707,953 6,005Total net assets 8,382,924 9,868,233 83,700
Total liabilities and net assets ¥ 11,366,242 ¥ 16,373,920 $ 138,880
The accompanying notes to the consolidated financial statements are an integral part of theas statements
Thousands of yen (Note 1)

CONSOLIDATED STATEMENTS OF INCOMECMIC Co., Ltd. and consolidated subsidiariesYears then ended September 30, 2005 and 2006
Thousands of U.S. dollars
2005 2006 2006
Net sales ¥ 14,028,233 ¥ 17,556,919 $ 148,914
Costs and expenses:Cost of sales (9,836,443) (12,305,772) (104,375)Selling, general and administrative expenses (2,798,278) (3,698,088) (31,366)
Total costs and expenses (12,634,721) (16,003,860) (135,741)
Operating income 1,393,512 1,553,059 13,173
Other income (expenses):Interest and dividend income 741 10,769 91Received commission 411 1,475 12Received rents 26,271 47,065 399Foreign exchange gains 22,684 18,662 158Amortization of negative goodwill - 43,474 369Equity in earnings of an affiliated company - 1,658 14Other non-operating profits 5,946 15,529 132Interest expenses (6,312) (11,593) (98)Stock issuance costs - (12,807) (109)Payment of commission (4,025) (26,767) (227)Write-down of investment securities - (13,522) (115)Other non-operating losses (6,337) (14,352) (122)Gain on sale of fixed assets - 414 4Gain on sales of investment in subsidiary - 194,964 1,654Gain(loss) on change in ownership percentage of a subsidiary (19,701) 190,930 1,619Loss on sale of fixed assets (314) - -Loss on disposal of fixed assets (74,997) (2,038) (17)Removal expenses of head quarters (56,043) - -Loss on devaluation of investment securities (9,277) - -Amortization of prior service cost - (25,849) (219)
Total other income (expenses) (120,953) 418,012 3,545
Income before income taxes and minority interests 1,272,559 1,971,071 16,718
Income taxes (Notes 2 and 12 ):Current 774,647 1,026,306 8,705Deferred (96,648) (66,322) (563)
Minority interests (24,742) 6,799 58
Net income ¥ 619,302 ¥ 1,004,288 $ 8,518
Yen Yen U.S. dollars (Note 1)Amount per share of common stock:
Net income ¥ 704.09 ¥ 1,328.23 $ 11.27Diluted net income 700.65 1,324.23 11.23Cash dividends applicable to the period 186.00 216.00 1.83
The accompanying notes to the consolidated financial statements are an integral part of theas statements
Thousands of yen (Note 1)

CONSOLIDATED STATEMENTS OF CHANGES IN NET ASSETSCMIC Co., Ltd. and consolidated subsidiariesYears then ended September 30, 2005 and 2006
2005 2006Numbers of shares of common stock:
Balance at beginning of the year 754,600 754,600Exercise of stock options - 4,000Balance at end of the year 754,600 758,600
2005 2006 2006Common stock:
Balance at beginning of the year ¥ 3,081,750 ¥ 3,081,750 $ 26,138Exercise of stock options - 6,000 51Balance at end of the year ¥ 3,081,750 ¥ 3,087,750 $ 26,189
Additional paid-in capital:Balance at beginning of the year ¥ 3,326,990 ¥ 3,326,990 $ 28,219Exercise of stock options - 6,000 51Balance at end of the year ¥ 3,326,990 ¥ 3,332,990 $ 28,270
Retained earnings:Balance at beginning of the year ¥ 1,486,653 ¥ 1,908,146 $ 16,184Net income 619,302 1,004,288 8,518Cash dividends paid - ¥176.00 per share in 2005 (132,809) - - - ¥211.00 ($1.790) per share in 2006 - (159,406) (1,352)Bonuses to directors (65,000) (88,000) (746)Balance at end of the year ¥ 1,908,146 ¥ 2,665,028 $ 22,604
Total owners' equity ¥ 8,316,886 ¥ 9,085,768 $ 77,063
Foreign currency translation adjustment:Balance at beginning of the year ¥ (868) ¥ (2,219) $ (19)Adjustments from translation of foreign currency financial statements (1,351) 76,731 651Balance at end of the year ¥ (2,219) ¥ 74,512 $ 632
Minority interests ¥ 68,257 ¥ 707,953 $ 6,005
Total net assets ¥ 8,382,924 ¥ 9,868,233 $ 83,700
The accompanying notes to the consolidated financial statements are an integral part of theas statements
Shares
Thousands ofU.S. dollars
(Note 1)Thousands of yen

CONSOLIDATED STATEMENTS OF CASH FLOWSCMIC Co., Ltd. and consolidated subsidiariesYears then ended September 30, 2005 and 2006
Thousands ofU.S. dollars
(Note 1)2005 2006 2006
Cash flows from operating activities:Income before income taxes and minority interests ¥ 1,272,559 ¥ 1,971,071 $ 16,718Depreciation and amortization 199,518 213,433 1,810Amortization of goodwill 59,718 45,767 388Increase of reserve for director's bonus ‐ 76,311 647Increase of allowance for doubtful accounts (21) 255 2Interest and dividend income (741) (10,769) (91)Interest expenses 6,312 11,593 98Equity in earnings of an affiliated company ‐ (1,658) (14)Foreign exchange gain and loss (24,073) (33,002) (280)Increase or decrease of employees' severance and retirement benefits 113,479 133,572 1,133Loss on devaluation of investment securities 9,277 ‐ ‐Loss on disposal of fixed assets 74,997 2,038 17Loss(gain) on sale of fixed assets 314 (414) (4)Loss(gain) on change in ownership percentage of a subsidiary 19,701 (190,930) (1,619)Gain on sales of investment in subsidiary ‐ (194,964) (1,654)Valuation loss of investment securities ‐ 13,522 115Increase of trade receivable (488,463) (982,038) (8,329)Increase of inventories assets (97,545) (13,667) (116)Increase of purchase liabilities 73,761 27,134 230Increase of accrued expenses 156,669 125,374 1,063Decrease of advances from customers (34,006) (22,005) (187)Increase of deposit received 11,649 63,515 539Other,net (119,554) (42,494) (359)
Subtotal 1,233,551 1,191,644 10,107Interest and dividends received 482 10,626 90Interest paid (6,312) (8,055) (68)Income taxes paid (863,710) (801,294) (6,797)
Net cash provided by operating activities 364,011 392,921 3,332
Cash flows from investing activities:Payments of time deposits (10,000) (310,942) (2,637)Withdrawal of time deposits - 181,209 1,537Purchase of property and equipment (220,173) (401,332) (3,404)Proceeds from sales of property and equipment 630 649 6Purchase of intangible assets (171,012) (34,479) (293)Pledging of leasehold deposit (192,755) (79,613) (675)Reversing of leasehold deposits 25,529 38,852 330Purchase of investment securities (410,750) (75,330) (639)Purchase of subsidiaries' stock (213,036) (2,157,038) (18,296)Proceeds from sales of investment in subsidiaries ‐ 465,000 3,944Payments for advances (110,000) ‐ ‐Proceeds from other investing activities 7,341 ‐ ‐Payments for other investing activities (45,143) ‐ ‐Other 1 ‐ ‐
Net cash used in investing activities (1,339,368) (2,373,024) (20,127)
Cash flows from financing activities:Increase in short-term loans ‐ 65,000 551Proceeds from long-term debt 60,000 2,500,000 21,204Repayment of long-term debt (53,200) (50,600) (429)Dividends paid (131,671) (158,783) (1,347)Proceeds from issuance of common stocks ‐ 12,000 102Proceeds from issuance of common stocks by minority shareholders 15,000 474,973 4,029
Net cash provided by (used in) financing activities (109,871) 2,842,590 24,110
Effect of exchange rate changes on cash and cash equivalents 2,781 18,262 155
Net increase (desrease) in cash and cash equivalents (1,082,447) 880,749 7,470
Cash and cash equivalents at beginning of year (Notes 2 ) 4,421,454 3,339,007 28,321
Cash and cash equivalents at end of year (Notes 2 and 7 ) ¥ 3,339,007 ¥ 4,219,756 $ 35,791
The accompanying notes to the consolidated financial statements are an integral part of theas statements
Thousands of yen

NOTES TO CONSOLIDATED FINANCIAL STATEMENTS CMIC Co., Ltd. and consolidated subsidiaries 1. Basis of presenting financial statements The accompanying consolidated financial statements have been prepared based on the accounts maintained by CMIC Co., Ltd. (the "Company") and its subsidiaries in accordance with the provisions set forth in the Commercial Code of Japan and the Securities and Exchange Law and its related accounting regulations, and in conformity with accounting principles and practices generally accepted in Japan (“Japanese GAAP”) which are different in certain respects as to application and disclosure requirements of international Financial reporting Standards. The accounts of overseas subsidiaries are based on their accounting records maintained in conformity with generally accepted accounting principles prevailing in the respective countries of domicile. The accompanying consolidated financial statements have been restructured and translated into English from the consolidated financial statements of the Company prepared in accordance with Japanese GAAP and filed with the appropriate Local Finance Bureau of the Ministry of Finance as required by the Securities and Exchange Law. Some supplementary information included in the statutory Japanese language consolidated financial statements, but not required for fair presentation, is not presented in the accompanying consolidated financial statements. As discussed in Note 2, the consolidated statement of changes in net assets for 2005 has been prepared for the purpose of inclusion in the consolidated financial statements although such statements were not required to be filed with the Local Finance Bureau prior to 2006. The U.S. dollar amounts shown in the accompanying consolidated financial statements and notes thereto have been translated from Japanese yen into U.S. dollars on the basis of ¥117.90 to U.S.$1.00, the rate of exchange prevailing at September 30, 2006, and have been then rounded to the nearest thousand. These U.S. dollar amounts are not intended to imply that the Japanese yen amounts have been, could have been or could in future be converted, realized or settled in U.S. dollars at this or any other rate of exchange. In preparing the accompanying consolidated financial statements, certain reclassifications have been made in the consolidated financial statements issued domestically in order to present them in a form which is more familiar to readers outside Japan. 2. Significant accounting policies Consolidation- The Company has 13 and 11subsidiaries at September 30, 2006 and 2005, respectively. The consolidated financial statements for the years ended September 30, 2006 and 2005 include the accounts of the Company and all of its subsidiaries (the “Companies”). The Company does not have unconsolidated subsidiary. The Company has an affiliate (20% to 50% owned) at September 30, 2006 and 2005. HAEDONG SS Pharmaceutical Co., Ltd. changed its year-end date from December 31 to September 30. Financial year-end of CMIC SS CMO Co., Ltd. is March 31. Financial year-end of CMIC (Beijing) Co., Ltd. and CMIC BRASIL RESQUISAS CLINICAS LIDA is December 31. Except for above subsidiaries the end of accounting period of the subsidiaries is September 30. However, necessary adjustments have been made for the consolidation concerning material transactions arising between those dates and the balance sheet date. In the elimination of investments in subsidiaries, the assets and liabilities of the subsidiaries, including the portion attributable to minority shareholders, are recorded based on the fair values at the time the Company acquired control of the respective subsidiaries.
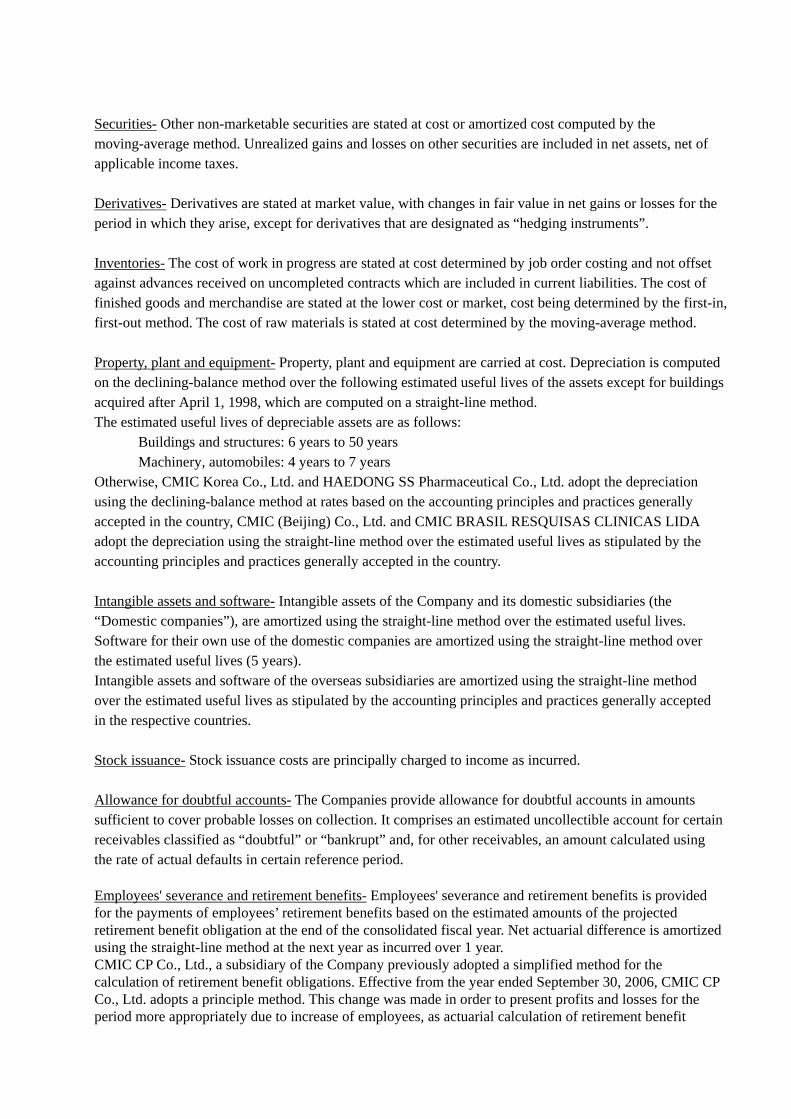
Securities- Other non-marketable securities are stated at cost or amortized cost computed by the moving-average method. Unrealized gains and losses on other securities are included in net assets, net of applicable income taxes. Derivatives- Derivatives are stated at market value, with changes in fair value in net gains or losses for the period in which they arise, except for derivatives that are designated as “hedging instruments”. Inventories- The cost of work in progress are stated at cost determined by job order costing and not offset against advances received on uncompleted contracts which are included in current liabilities. The cost of finished goods and merchandise are stated at the lower cost or market, cost being determined by the first-in, first-out method. The cost of raw materials is stated at cost determined by the moving-average method. Property, plant and equipment- Property, plant and equipment are carried at cost. Depreciation is computed on the declining-balance method over the following estimated useful lives of the assets except for buildings acquired after April 1, 1998, which are computed on a straight-line method. The estimated useful lives of depreciable assets are as follows:
Buildings and structures: 6 years to 50 years Machinery, automobiles: 4 years to 7 years
Otherwise, CMIC Korea Co., Ltd. and HAEDONG SS Pharmaceutical Co., Ltd. adopt the depreciation using the declining-balance method at rates based on the accounting principles and practices generally accepted in the country, CMIC (Beijing) Co., Ltd. and CMIC BRASIL RESQUISAS CLINICAS LIDA adopt the depreciation using the straight-line method over the estimated useful lives as stipulated by the accounting principles and practices generally accepted in the country. Intangible assets and software- Intangible assets of the Company and its domestic subsidiaries (the “Domestic companies”), are amortized using the straight-line method over the estimated useful lives. Software for their own use of the domestic companies are amortized using the straight-line method over the estimated useful lives (5 years). Intangible assets and software of the overseas subsidiaries are amortized using the straight-line method over the estimated useful lives as stipulated by the accounting principles and practices generally accepted in the respective countries. Stock issuance- Stock issuance costs are principally charged to income as incurred. Allowance for doubtful accounts- The Companies provide allowance for doubtful accounts in amounts sufficient to cover probable losses on collection. It comprises an estimated uncollectible account for certain receivables classified as “doubtful” or “bankrupt” and, for other receivables, an amount calculated using the rate of actual defaults in certain reference period. Employees' severance and retirement benefits- Employees' severance and retirement benefits is provided for the payments of employees’ retirement benefits based on the estimated amounts of the projected retirement benefit obligation at the end of the consolidated fiscal year. Net actuarial difference is amortized using the straight-line method at the next year as incurred over 1 year. CMIC CP Co., Ltd., a subsidiary of the Company previously adopted a simplified method for the calculation of retirement benefit obligations. Effective from the year ended September 30, 2006, CMIC CP Co., Ltd. adopts a principle method. This change was made in order to present profits and losses for the period more appropriately due to increase of employees, as actuarial calculation of retirement benefit

obligations based on the principal method has been adopted. The ¥25,849 thousand ($219 thousand) increase in retirement benefit obligations as a result of this change has been reported as “Other expenses”. As a result of this change, income before income taxes decreased by ¥ 28,181 thousand ($239 thousand) compared with what would have been recorded under the previous method. Allowance for directors’ bonuses- The Company and certain domestic consolidated subsidiaries provide allowance for director’s bonuses based on the estimate of amount payable. Translation of foreign currency- Receivables and payables of the domestic companies denominated in foreign currencies are translated into Japanese yen at the exchange rates prevailing at the balance sheet date. The balance sheets of overseas subsidiaries are translated into Japanese yen at the exchange rates prevailing at the balance sheet date except for owners’ equity, which is translated at historical rates. The revenues and expenses of overseas subsidiaries are translated into Japanese yen at the average rates of the year. Differences arising from such translation are shown as “Foreign currency translation adjustments” and are included in “Net assets”. Accounting for certain lease transactions- Finance leases which do not transfer ownership rights to lessee are not capitalized and accounted for in the same manner as operating leases. Accounting for Hedging-The Companies use the deferral method. Gains or losses arising from changes in fair value of the derivatives designated as “hedging instruments” are deferred as an asset or liability and included in net profit or loss in the same period during which the gains and losses on the hedged items or transactions are recognized. If interest rate swap contracts are used as hedge and meet certain hedging criteria, the net amount to be paid or received under the interest rate swap contract is added to or deducted from the interest on the assets or liabilities for which the swap contract was executed (“Exception”). The derivatives designated as hedging instruments are interest rate swap contracts. The related hedged items are interest on borrowings. The Companies’ policy to utilize the above hedging instruments in order to reduce the Companies’ exposure to the risk of interest rate fluctuation. The Companies evaluate effectiveness of its hedging activities by reference to the accumulated gains or losses on the hedging instruments and the related hedged items from the commencement of the hedges. The Companies omit to evaluate effectiveness of transaction to which the Exception is applied. Consumption Tax - The National Consumption Tax and Local Consumption Tax are excluded from transaction amounts. Amounts per share of common stock- Computations of net income per share of common stock are based on the weighted-average number of shares outstanding during the respective year. Diluted net income per share is computed based on the weighted-average number of shares of common stock and contingent issuance of common stock from warrants. Cash dividends per share represent the actual amount declared as applicable to the respective years. The Company adopted the Statement of Financial Accounting Standard No.2 “Earnings per Share” issued by the Accounting standards Board of Japan. Goodwill, including negative goodwill- The difference between the cost and the underlying net equity of investment in consolidated subsidiaries or associates accounted for by the equity method has been

allocated to identifiable assets based on fair market value at the date of acquisition. Any unassigned residual amount is recognized as goodwill and deferred and amortized on a straight-line basis over the estimated useful life, with the exception of minor amounts, which are charged to income in the year of acquisition. Cash and cash equivalents- In preparing the consolidated statements of cash flows, cash on hand, readily-available deposits and short-term highly liquid investments with maturity of not exceeding three months at the time of purchase without significant risk of change in value are considered to be cash and cash equivalents. Impairment of fixed assets- Effective from the year ended September 30, 2006, the Companies adopted the new accounting standard for impairment of Fixed Assets (“Opinion Concerning Establishment of Accounting Standard for Impairment of Fixed Assets” issued by the Business Accounting Deliberation Council on August 9, 2002) and the implementation guidance for the accounting standard for impairment of fixed assets (the Financial Accounting Standard Implementation Guidance No. 6 issued by the Accounting Standards Board of Japan on October 31, 2003). The adoption of the new accounting standard had no impact on the financial statements. Accounting Standard for Directors’ Bonus- Effective from the year ended September 30, 2006, the Companies adopted the Statement of Financial Accounting Standard No.4 “Accounting Standard for Director’s Bonus” issued by the Accounting Standards Board of Japan. The effect of the adoption of this standard was to decrease operating income and income before income taxes by ¥ 76,310 thousand ($647 thousand) for the year ended September 30, 2006. The effect of this change on segment information is explained in Note “Segment information”.
Accounting Standard for Presentation of Net Assets in the Balance Sheet - Effective for the year ended September 30, 2006, the Company and its consolidated subsidiaries adopted new accounting standards, “Accounting Standard for Presentation of Net Assets in the Balance Sheet” (Statement No.5 issued by the Accounting Standards Board of Japan on December 9, 2005), and the implementation guidance for the accounting standard for presentation of net assets in the balance sheet (the Financial Accounting Standard Implementation Guidance No. 8 issued by the Accounting Standards Board of Japan on December 9, 2005), (collectively, the “New Accounting Standards”). Under the New Accounting Standards, the balance sheet comprises the assets, liabilities and net assets sections. Previously, the balance sheet comprised the assets, liabilities, minority interests and the shareholders’ equity sections. The net assets section comprises four subsections, which are owners' equity, accumulated gains (losses) from valuation and translation adjustments, subscription rights to shares and minority interests, as applicable. The net assets section includes items which were not included in the previously presented shareholders` equity section. The previously presented shareholders’ equity and certain other balance sheet items for 2005 have been restated to conform to the 2006 presentation. As a result, minority interests amounting to ¥68,257 thousands are included in the net assets section as of September 30, 2005.

If the New Accounting Standards had not been adopted and the previous presentation method for the shareholders' equity had been applied, the shareholders' equity at September 30, 2005 and 2006, which comprised common stock, capital surplus, retained earnings and foreign currency translation adjustments, would have been ¥8,314,667 thousand and ¥9,160,280 thousand ($77,695 thousand), respectively. Accounting Standard for Statement of Changes in Net Assets- Effective for the year ended September 30, 2006, the Company and its consolidated subsidiaries adopted new accounting standards, “Accounting Standard for Statement of Changes in Net Assets” (Statement No.6 issued by the Accounting Standards Board of Japan on December 27, 2005), and the implementation guidance for the accounting standard for statement of changes in net assets (the Financial Accounting Standard Implementation Guidance No. 9 issued by the Accounting Standards Board of Japan on December 27, 2005), (collectively, the “New Accounting Standards”). Previously, consolidated statements of shareholders’ equity were prepared for purposes of inclusion in the consolidated financial statements although such statements were not required in Japan. Based on the reclassification of the previously presented shareholders` equity and certain other balance sheet items for 2005 as discussed above, the consolidated statement of changes in net assets for 2005 have been prepared in accordance with the New Accounting Standards. As result, minority interest of ¥68,257 thousands, which was not included in the 2005 consolidated statement of shareholders’ equity, is now presented in the consolidated statement of changes in net assets. Reclassification and restatement- Certain prior year amounts have been reclassified to conform to the current year presentation. Also, as described above, previously presented shareholders’ equity and certain other balance sheet items for 2005 and the consolidated statement of shareholders’ equity for 2005, which was voluntarily prepared for the purpose of inclusion in the 2005 consolidated financial statements, have been restated to conform to the new accounting standards adopted in 2006.These reclassifications and restatement had no impact on previously reported results of operations. 3. Pledged assets The following assets, at their respective net book values, are pledged as collateral for obligations of the Companies at September 30, 2005 and 2006.
Thousands of yen Thousands of U.S.
dollars 2005 2006 2006 Land ¥ 94,990 ¥ 94,990 $ 806Buildings and structures 68,364 118,667 1,006
¥ 163,354 ¥ 213,657 $ 1,812 The obligations secured by such collateral were as follows:

Thousands of yen Thousands of U.S.
dollars 2005 2006 2006 Current maturities of long-term debt ¥ 55,200 ¥ 55,200 $ 468Long-term debt 230,000 179,400 1,522
¥ 285,200 ¥ 234,600 $ 1,990 4. Inventories
Inventories at September 30, 2005 and 2006 comprised the following: Thousands of yen Thousands of
U.S. dollars 2005 2006 2006
Finished goods and merchandise ¥ 24,732 ¥ 17,294 $ 147Work in progress 394,408 444,578 3,771Raw materials 42,902 32,685 277Supplies 10,443 17,838 151 ¥ 472,485 ¥ 512,395 $ 4,346
5. Short-term loans and long-term debt
The weighted average interest rates of Short-term loans for the years ended September 30, 2006 was approximately 1.0%. Long-term debt at September 30, 2005 and 2006 consisted of the following:
Thousands of yen Thousands of U.S. dollars
2005 2006 2006 Long-term debt from banks:
Secured, due through 2006 at rate of 2.00 % ¥ 285,200 ¥ 2,734,600 $ 23,194Less:
Current maturities of long-term debt 55,200 555,200 4,709 ¥ 230,000 ¥ 2,179,400 $ 8,485 The annual maturities of long-term debt at September 30, 2006 were as follows:
Year ending September 30, Thousands of yen Thousands of U.S.
dollars
2007 ¥ 555,200 $ 4,709 2008 555,200 4,709 2009 555,200 4,709 2010 546,200 4,633 2011 522,800 4,434
6. Research and development expenses Research and development expenses included in cost of sales and selling, general and administrative expenses for the years ended September 30, 2005 and 2006 were as follows:

Thousands of yen Thousands of U.S.
dollars 2005 2006 2006 Cost of sales ¥ 116 ¥ 4,207 $ 36Selling general and administrative expenses
61,224 106,996 907
¥ 61,340 ¥ 111,203 $ 9437. Cash and cash equivalents The reconciliation between cash on hand and in banks shown in the consolidated balance sheets and cash and cash equivalents shown in the consolidated statements of cash flows as of September 30, 2005 and 2006 were as follows:
Thousands of yen Thousands of U.S.
dollars 2005 2006 2006 Cash on hand and in banks ¥ 3,349,007 ¥ 4,365,351 $ 37,026Less: The deposits over three months 10,000 145,595 1,235
Cash and cash equivalents ¥ 3,339,007 ¥ 4,219,756 $ 35,791 For the year ended September 30, 2005, the Company newly consolidated the subsidiary, HAEDONG SS Pharmaceutical Co., Ltd. Summary information on the assets and liabilities of the newly consolidated subsidiary was as follows: Thousands of yen 2005 Current assets ¥ 246,799 Non-current assets 381,508 Current liabilities (67,371) Non-current liabilities (26,375) Consolidation difference (122,319) Minority interests (53,456) Acquisition cost of the equity of the
subsidiary 358,786 Cash and cash equivalents of the newly
consolidated subsidiary (145,750) Net cash and cash equivalent decreased
due to the purchase of additional shares in the newly consolidated subsidiary ¥ 213,036

For the year ended September 30, 2006, the Company newly consolidated the subsidiary, CMIC SS CMO Co., Ltd. Summary information on the assets and liabilities of the newly consolidated subsidiary was as follows:
Thousands of yen Thousands of U.S.
dollars 2006 2006 Current assets ¥ 306,996 $ 2,604Non-current assets 2,599,279 22,047Current liabilities (126,058) (1,069)Non-current liabilities (216,314) (1,835)Negative goodwill (107,512) (912)Minority interest (256,391) (2,175)Acquisition cost of the equity of the
subsidiary
2,200,000 18,660Cash and cash equivalents of the newly
consolidated subsidiary
(42,962) (364)Net cash and cash equivalent decreased
due to the purchase of additional shares in the newly consolidated subsidiary
¥ 2,157,038 $ 18,296
8. Information for certain leases Lessee: Finance leases which do not transfer ownership rights to lessees If finance leases which do not transfer ownership rights to lessees had been capitalized at September 30, 2005 and 2006, they would have been recorded on the financial statements as follows:
Thousands of yen
Thousands of U.S. dollars
2005 2006 2006
Acquisition cost: ¥ 959,662 ¥ 1,389,635 $ 11,787
Buildings 29,401 51,400 436 Machinery 67,952 180,544 1,531 Furniture and fixtures 694,726 1,029,347 8,731 Intangible assets 167,583 128,344 1,089
Accumulated depreciation ¥ 534,147 ¥ 640,997 $ 5,437 Building 18,913 27,801 236 Machinery 18,031 48,006 407 Furniture and fixtures 394,915 490,435 4,160 Intangible assets 102,306 74,755 634 Net book value ¥ 425,514 ¥ 748,638 $ 6,350 Building 10,486 23,599 200 Machinery 49,938 132,538 1,124 Furniture and fixtures 299,812 538,912 4,571 Intangible assets 65,278 53,589 455

Lease payments under finance leases which are accounted for in the same manner as operating leases for the years ended September 30, 2005 and 2006, except to the interest, were ¥210,858 thousand and ¥314,952 thousand ($ 2,671 thousand), respectively. Future lease payments as of September 30, 2005 and 2006, exclusive of interest, under such leases were ¥439,274 thousand and ¥764,438 thousand ($ 6,484 thousand), including ¥178,416 thousand and ¥254,422 thousand ($ 2,158 thousand) due within one year. Equivalent amount of depreciation for the years ended September 30, 2005 and 2006 amounted to 193,048 thousand and ¥291,780 thousand ($2,475 thousand), respectively. The depreciation equivalents were calculated using the straight-line method over the lease terms assuming no residual value. Equivalent amount of interest expense for the years ended September 30, 2005 and 2006 amounted to ¥17,220 thousand and ¥25,391 thousand ($ 215 thousand), respectively. The interest equivalents were the deference between the sum of payments of lease and the acquisition equivalents of lease assets, and divided to the respective year using calculation of compound interest. Future lease payments for non-cancelable operating as of September 30, 2005 and 2006, were ¥13,661 thousand and ¥7,135 thousand ($ 61 thousand), including ¥4,798 thousand and ¥4,223 thousands ($36 thousand) due within one year, respectively. 9. Securities The Companies had no available-for-sale securities with available fair values as of September 30, 2005 and 2006. The following tables summarize book values of securities with no available fair values as of September 30, 2005.
Book value
Type Thousands
of yen
Available-for-sale securities Non-marketable foreign bonds ¥ 47 Non-listed equity securities 144,000 The amount of investment in investment
limited liability partnerships 273,156
The planned redemption schedule of available-for-sale securities with maturities were as follows:
(Thousands of yen)
Type Within 1 year Over 1 year but within 5
years Bonds ¥ 2 ¥ 45
The following tables summarize book values of securities with no available fair values as of September 30, 2006.

Book value
Type
Thousands of yen
Thousands of U.S. dollars
Available-for-sale securities Non-marketable foreign bonds ¥ 113 $ 1
Non-listed equity securities 164,000 1,391 The amount of investment in
investment limited liability partnerships
328,833 2,789
The planned redemption schedule of available-for-sale securities with maturities were as follows:
(Thousands of yen)
Type Within 1 year Over 1 year but within 5
years Bonds ¥ 3 ¥ 109
(Thousands of U.S. dollars)
Type Within 1 year Over 1 year but within 5
years Bonds $ 0 $ 1
10. Derivative financial instruments The Company utilized interest rate swap contracts as derivative financial instruments in order to avoid adverse effects of fluctuations of interest rate. The Company did not use derivatives for speculative purposes. The Company utilizes foreign currency forward contracts as derivative financial instruments in order to avoid adverse effects of fluctuations in foreign currency exchange rate. The Company does not use derivatives for speculative purposes. Forward foreign currency is subject to risks of foreign exchange. Derivative financial instruments are executed only with creditworthy banks and the management believes that there is little risk of default by counterparties. The following tables summarize market value information as of September 30, 2005 derivative transactions for which hedge accounting has not been applied: Currency related: (Thousands of yen)
Year ended September 30, 2005
For 2005
Type Contracted
amount Over one
year Market value
Recognized losses
Forward foreign exchange contracts:
Sell: Yen
Buy: ¥ 8,455 ¥ - ¥ 8,510 ¥ (55)
Items not traded on exchanges
Yen 39,913 - 38,657 (1,256)
Total - - - ¥ (1,311)

The following tables summarize market value information as of September 30, 2006 derivative transactions for which hedge accounting has not been applied: Currency related: (Thousands of yen)
Year ended September 30, 2006
For 2006
Type Contracted
amount Over one
year Market value
Recognized losses
Forward foreign exchange contracts:
Buy:
Items not traded on exchanges
Yen ¥ 21,628 - ¥ 20,594 ¥ (1,034)Total - - - ¥ (1,034)
(Thousands of U.S. dollars)
Year ended September 30, 2006
For 2006
Type Contracted
amount Over one
year Market value
Recognized losses
Forward foreign exchange contracts:
Buy:
Items not traded on exchanges
Yen $ 184 - $ 175 $ (9)Total - - - $ (9)
11. Employees' severance and retirement benefits The Company and its domestic consolidated subsidiaries provide unfunded lump-sum payment plan, under which all eligible employees are entitled to benefits based on the level of salaries at the time of retirement, length of service and certain other factors. Some consolidated subsidiaries have general type of employee pension plans and contributory funded defined benefit pension plans such as employee pension plans. The liabilities for severance and retirement benefits included in the liability section of the consolidated balance sheet as of September 30, 2005 and 2006 were as follows:
Thousands of yen Thousands of U.S. dollars
2005 2006 2006 Retirement benefit obligation ¥ (375,438) ¥ (809,320) $ (6,865) Plan assets - 193,933 1,645Unfunded projected benefit obligation (375,438) (615,387) (5,220)Unrecognized actuarial difference 465 (9,473) (80)Employees' severance and retirement benefits ¥ (374,973) ¥ (624,860) $ (5,300)
Included in the consolidated statement of income for the years ended September 30, 2005 and 2006 are severance and retirement benefit expenses comprised of the followings:

Thousands of yen Thousands of U.S. dollars
2005 2006 2006 Service costs ¥ 116,568 ¥ 148,317 $ 1,258 Interest cost 5,873 8,672 73 Amortization of unrecognized actuarial difference 21,770 465 4 Severance and retirement benefit expenses ¥ 144,211 ¥ 157,454 $ 1,335
Summary of assumption on benefit obligations, etc for the years ended September 30, 2005 and 2006 were as follows:
Periodic distribution method of expected benefit
Straight-line method
Discount rate 2.5% Amortization period of actuarial loss 1 year
12. Income taxes Income taxes in the consolidated statements of income consist of corporation tax, inhabitant taxes and enterprise tax. The aggregate statutory income tax rate was approximately 40.69% for 2005 and 2006.
The actual effective income tax rates in the accompanying consolidated statements of income differ from the statutory income tax rate due to such items as permanently non-deductible expenses.
Reconciliations of the difference between the statutory income tax rate and the actual effective income tax rates for the years ended September 30, 2005 and 2006 were as follows:
2005 2006 Statutory income tax rate 40.69 % 40.69 % Effect on operating carryforwards of subsidiaries 4.83 2.26 Permanently non-deductible expenses 1.68 1.31 Per capita inhabitants tax 1.40 1.06 Tax on undistributed earnings (of family corporation)
1.63 4.09
Amortization of consolidation adjustment account 1.91 - Amortization of negative goodwill - 0.40 Reserve for director‘s bonus - 1.58 Gain on sales of investment in affiliated companies
- 1.07
Loss from change in ownership percentage of a subsidiary
0.63
-
Gain from change in ownership percentage of a subsidiary
- (3.91)
Others 0.51 0.15 Actual effective income tax rate 53.28 % 48.70 %
Significant components of the deferred income taxes as of September 30, 2005 and 2006 were as follows:
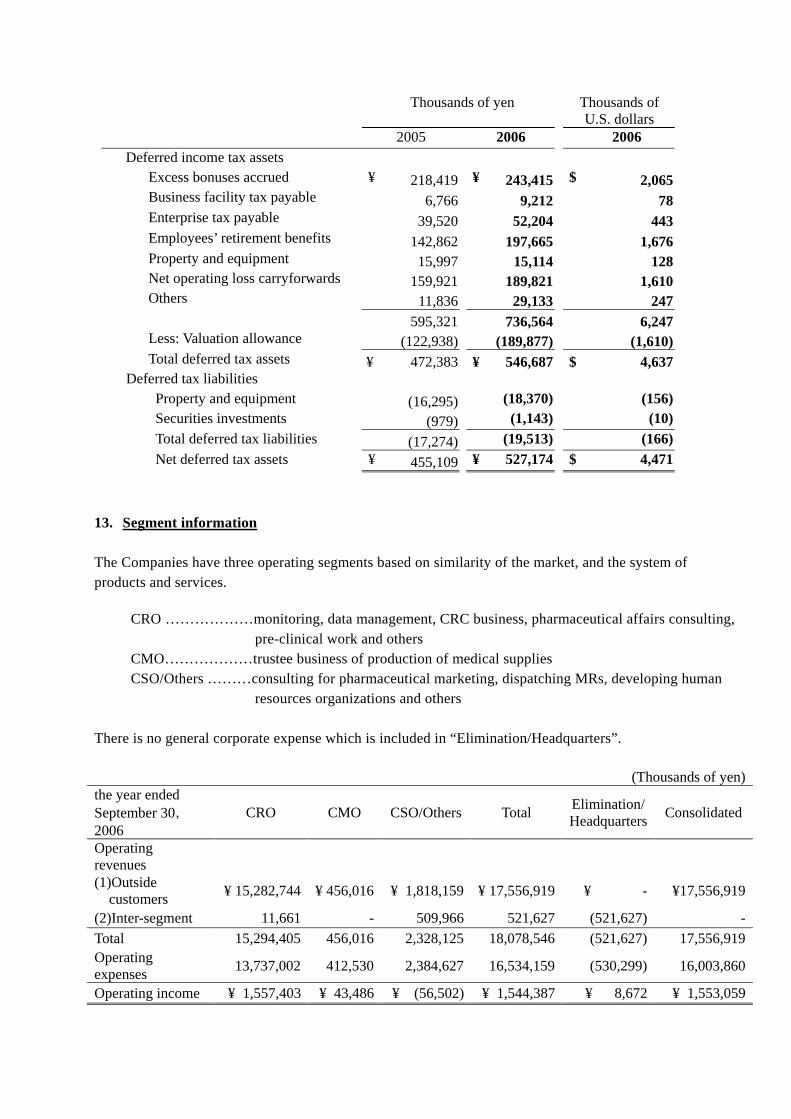
Thousands of yen Thousands of U.S. dollars
2005 2006 2006 Deferred income tax assets Excess bonuses accrued ¥ 218,419 ¥ 243,415 $ 2,065 Business facility tax payable 6,766 9,212 78 Enterprise tax payable 39,520 52,204 443 Employees’ retirement benefits 142,862 197,665 1,676 Property and equipment 15,997 15,114 128 Net operating loss carryforwards 159,921 189,821 1,610 Others 11,836 29,133 247 595,321 736,564 6,247 Less: Valuation allowance (122,938) (189,877) (1,610) Total deferred tax assets ¥ 472,383 ¥ 546,687 $ 4,637 Deferred tax liabilities Property and equipment (16,295) (18,370) (156) Securities investments (979) (1,143) (10) Total deferred tax liabilities (17,274) (19,513) (166) Net deferred tax assets ¥ 455,109 ¥ 527,174 $ 4,471
13. Segment information The Companies have three operating segments based on similarity of the market, and the system of products and services.
CRO ………………monitoring, data management, CRC business, pharmaceutical affairs consulting, pre-clinical work and others
CMO………………trustee business of production of medical supplies CSO/Others ………consulting for pharmaceutical marketing, dispatching MRs, developing human
resources organizations and others There is no general corporate expense which is included in “Elimination/Headquarters”. (Thousands of yen)the year ended September 30,2006
CRO CMO CSO/Others Total Elimination/ Headquarters Consolidated
Operating revenues
(1)Outside customers ¥ 15,282,744 ¥ 456,016 ¥ 1,818,159 ¥ 17,556,919 ¥ - ¥17,556,919
(2)Inter-segment 11,661 - 509,966 521,627 (521,627) -Total 15,294,405 456,016 2,328,125 18,078,546 (521,627) 17,556,919Operating expenses 13,737,002 412,530 2,384,627 16,534,159 (530,299) 16,003,860
Operating income ¥ 1,557,403 ¥ 43,486 ¥ (56,502) ¥ 1,544,387 ¥ 8,672 ¥ 1,553,059

Asset depreciation and capital expenditures
(1)Total assets ¥ 11,516,874 ¥ 3,642,953 ¥1,042,970 ¥16,202,797 ¥ 171,123 ¥16,373,920(2)Depreciation and
amortization 171,285 19,592 48,764 239,641 - 239,641
(3)Capital expenditures 376,982 7,181 6,056 390,219 - 390,219
(Thousands of U.S.dollars) The year ended September 30,2006 CRO CMO CSO/Others Total Elimination/
Headquarters Consolidated
Operating revenues (1)Outside customers $ 129,625 $ 3,868 $ 15,421 $ 148,914 $ - $ 148,914(2)Inter-segment 99 - 4,325 4,424 (4,424) -Total 129,724 3,868 19,746 153,338 (4,424) 148,914Operating expenses 116,514 3,499 20,226 140,239 (4,498) 135,741Operating income $ 13,210 $ 369 $ (480) $ 13,099 $ 74 $ 13,173 Asset depreciation and capital expenditures
(1)Total assets $ 97,683 $ 30,899 $ 8,846 $ 137,428 $ 1,452 $ 138,880(2)Depreciation and
amortization 1,453 166 414 2,033 - 2,033
(3)Capital expenditures 3,197 61 52 3,310 - 3,310 The Companies have changed its method of business segment classification to “CRO,” “CMO” and “CSO/Others” from previous segmentation of “CRO” and “Others” in the year ended September 30, 2006. Business segment information, which was reclassified in compliance with current business segmentation for year ended September 30, 2005, was as follows: (Thousands of yen)the year ended September 30,2005 CRO CMO CSO/Others Total Elimination/
Headquarters Consolidated
Operating revenues (1)Outside customers ¥ 13,000,812 ¥ - ¥ 1,027,421 ¥ 14,028,233 ¥ - ¥ 14,028,233(2)Inter-segment 2,443 - 358,393 360,836 (360,836) -Total 13,003,255 - 1,385,814 14,389,069 (360,836) 14,028,233Operating expenses 11,447,993 - 1,553,993 13,001,986 (367,265) 12,634,721Operating income ¥ 1,555,262 ¥ - ¥ (168,179) ¥ 1,387,083 ¥ 6,429 ¥ 1,393,512 Asset depreciation and capital expenditures
(1)Total assets ¥ 9,594,993 ¥ 628,308 ¥ 1,062,636 ¥ 11,285,937 ¥ 80,305 ¥ 11,366,242(2)Depreciation and
amortization 155,996 - 43,522 199,518 - 199,518
(3)Capital expenditures 239,624 - 222,254 461,878 (102) 461,776Notes: Changes in business segments

Business categories had previously been segmented into “CRO” and “Others”. However, as a result of reviewing the business segmentation, the Company changed its segmentation to “CRO”, “CMO”, and “CSO/Others” based on Expansion of business area along with the segmentation for management purpose effective from the year ended September 30, 2006. The business segment information for 2005 has been restated to conform to the 2006 presentation. CMIC CP Co., Ltd. previously adopted a simplified method for the calculation of retirement benefit obligations. Effective from the year ended September 30, 2006, CMIC CP Co., Ltd. adopts a principle method. The effect on the segment information of adopting the new method was not significant. The disclosure of geographical segment information has been omitted as net sales of the foreign operations constituted less than 10%, of the consolidated results for both the six months ended September 30, 2005 and 2006. Overseas sales of the Companies constituted less than 10%, of the consolidated net sales for both the six months ended September 30, 2005 and 2006. 14. Net assets and net income per share Yen U.S. dollars 2005 2006 2006 Net assets per share ¥ 10,902.02 ¥ 12,075.24 $ 102.42Net income per share 704.09 1,328.23 11.27 Diluted net income per share 700.65 1,324.23 11.23 15. Net assets As described in Note 2, net assets of the Company comprises three subsections, which are the owners’ equity, accumulated gains (losses) from valuation and translation adjustments and minority interests. Japanese Corporate Law (“the Law”) became effective on May 1, 2006, replacing the Japanese Commercial Code (“the Code”). Under the Japanese laws and regulations, the entire amount paid for new shares is required to be designated as common stock. However, a company may, by a resolution of the Board of Directors, designate an amount not exceeding one-half of the price of the new shares as additional paid-in capital, which is included in capital surplus. Under the Law, in cases where dividend distribution of surplus is made, the smaller of an amount equal to 10% of the dividend or the excess, if any, of 25% of common stock over the total of additional paid-in-capital and legal earnings reserve must be set aside as additional paid-in-capital or legal earnings reserve. Legal earnings reserve is included in retained earnings in the accompanying consolidated balance sheets. Under the Code, companies were required to set aside an amount equal to at least 10% of cash dividends and other cash appropriations as legal earnings reserve until the total of legal earnings reserve and additional paid-in capital equaled 25% of common stock. Under the Code, legal earnings reserve and additional paid-in capital could be used to eliminate or reduce a deficit by a resolution of the shareholders' meeting or could be capitalized by a resolution of the Board of
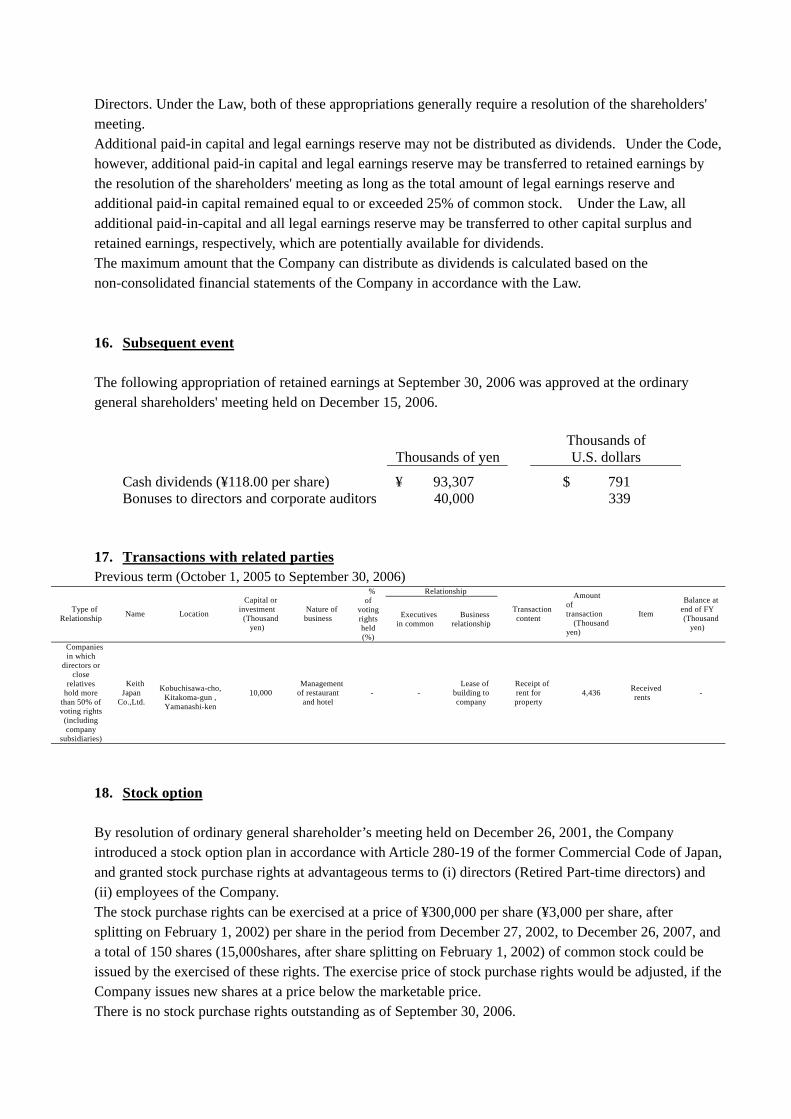
Directors. Under the Law, both of these appropriations generally require a resolution of the shareholders' meeting. Additional paid-in capital and legal earnings reserve may not be distributed as dividends. Under the Code, however, additional paid-in capital and legal earnings reserve may be transferred to retained earnings by the resolution of the shareholders' meeting as long as the total amount of legal earnings reserve and additional paid-in capital remained equal to or exceeded 25% of common stock. Under the Law, all additional paid-in-capital and all legal earnings reserve may be transferred to other capital surplus and retained earnings, respectively, which are potentially available for dividends. The maximum amount that the Company can distribute as dividends is calculated based on the non-consolidated financial statements of the Company in accordance with the Law. 16. Subsequent event The following appropriation of retained earnings at September 30, 2006 was approved at the ordinary general shareholders' meeting held on December 15, 2006.
Thousands of yen Thousands of U.S. dollars
Cash dividends (¥118.00 per share) ¥ 93,307 $ 791 Bonuses to directors and corporate auditors 40,000 339
17. Transactions with related parties Previous term (October 1, 2005 to September 30, 2006)
Relationship
Type of Relationship Name Location
Capital or investment
(Thousand yen)
Nature of business
% of
voting rights held (%)
Executives in common
Business relationship
Transaction content
Amount of transaction
(Thousand yen)
Item
Balance at end of FY (Thousand
yen)
Companies in which
directors or close
relatives hold more
than 50% of voting rights
(including company
subsidiaries)
Keith Japan
Co.,Ltd.
Kobuchisawa-cho,
Kitakoma-gun , Yamanashi-ken
10,000 Management
of restaurant and hotel
- - Lease of
building to company
Receipt of rent for property
4,436 Received rents -
18. Stock option By resolution of ordinary general shareholder’s meeting held on December 26, 2001, the Company introduced a stock option plan in accordance with Article 280-19 of the former Commercial Code of Japan, and granted stock purchase rights at advantageous terms to (i) directors (Retired Part-time directors) and (ii) employees of the Company. The stock purchase rights can be exercised at a price of ¥300,000 per share (¥3,000 per share, after splitting on February 1, 2002) per share in the period from December 27, 2002, to December 26, 2007, and a total of 150 shares (15,000shares, after share splitting on February 1, 2002) of common stock could be issued by the exercised of these rights. The exercise price of stock purchase rights would be adjusted, if the Company issues new shares at a price below the marketable price. There is no stock purchase rights outstanding as of September 30, 2006.
