consolidated financial statement of bank sinopac … · consolidated financial statement of bank...
TRANSCRIPT

81
ww
w.b
an
ksin
op
ac.c
om
.tw
BANK SINOPAC AND SUBSIDIARIES
The Board of Directors and Stockholders
Bank SinoPac
We have audited the consolidated balance sheets of Bank SinoPac and subsidiaries as of December 31, 2002 and2001, and the related consolidated statements of income, changes in stockholders’ equity and cash flows for theyears then ended. These consolidated financial statements are the responsibility of the Bank’s management. Ourresponsibility is to express an opinion on these consolidated financial statements based on our audits.
We conducted our audits in accordance with Regulations for Audit of Financial Statements of FinancialInstitutions by Certified Public Accountants and auditing standards generally accepted in the Republic of China.Those standards require that we plan and perform the audit to obtain reasonable assurance about whether theconsolidated financial statements are free of material misstatement. An audit includes examining, on a testbasis, evidence supporting the amounts and disclosures in the consolidated financial statements. An audit alsoincludes assessing the accounting principles used and significant estimates made by management, as well asevaluating the overall consolidated financial statement presentation. We believe that our audits provide areasonable basis for our opinion.
In our opinion, the consolidated financial statements referred to above present fairly, in all material respects, thefinancial position of Bank SinoPac and subsidiaries as of December 31, 2002 and 2001, and the results of itsoperations and its cash flows for the years then ended, in conformity with Guidelines for Securities Issuers’Financial Reporting and accounting principles generally accepted in the Republic of China.
T N Soong & CoAn Associate Member Firm of Deloitte Touche TohmatsuTaipei, TaiwanThe Republic of China
Independent Auditors’ Report
CONSOLIDATED FINANCIAL STATEMENT OF BANK SINOPAC AND SUBSIDIARIES
Notice to Readers
The accompanying financial statements are intended only to present the financial position, results of operationsand cash flows in accordance with accounting principles and practices generally accepted in the Republic of Chinaand not those of any other jurisdictions. The standards, procedures and practices to audit such financialstatements are those generally accepted and applied in the Republic of China.
January 24, 2003
BANK SINOPAC AND SUBSIDIARIES
82
20
02
AN
NU
AL
RE
PO
RT
BANK SINOPAC AND SUBSIDIARIES
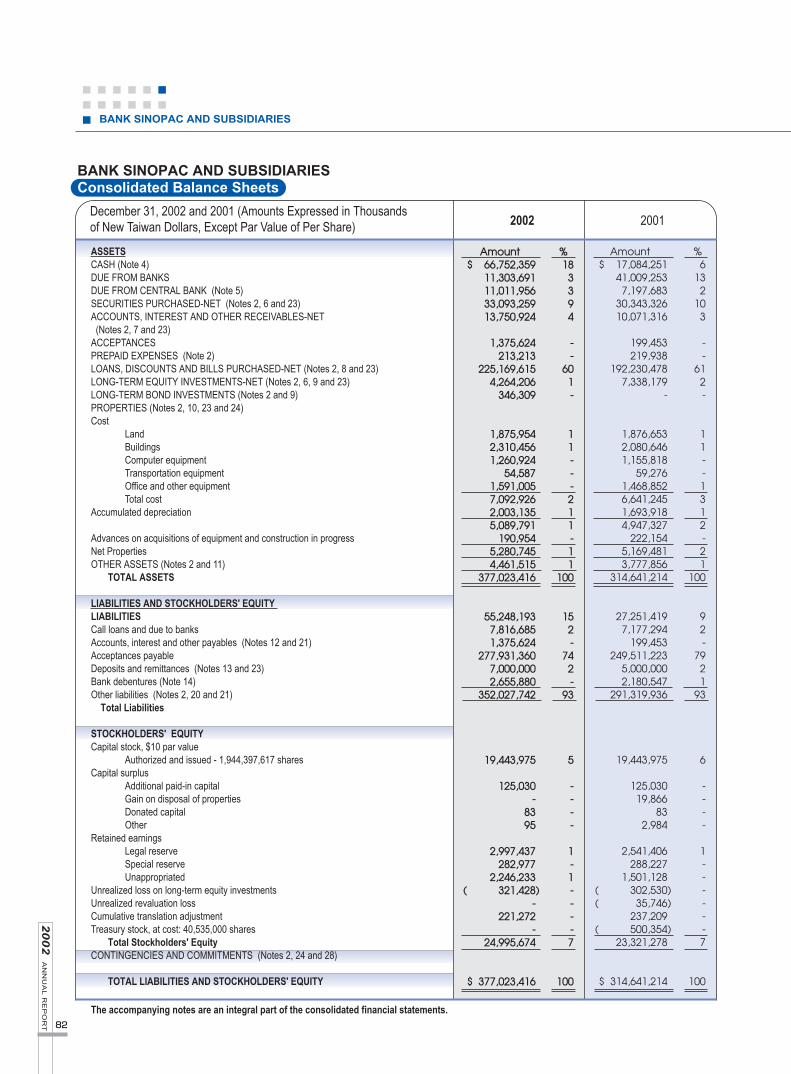
December 31, 2002 and 2001 (Amounts Expressed in Thousandsof New Taiwan Dollars, Except Par Value of Per Share) 2002 2001
Consolidated Balance Sheets
Amount$ 66,752,359
11,303,69111,011,95633,093,25913,750,924
1,375,624213,213
225,169,6154,264,206
346,309
1,875,9542,310,4561,260,924
54,5871,591,0057,092,9262,003,1355,089,791
190,9545,280,7454,461,515
377,023,416
55,248,1937,816,6851,375,624
277,931,3607,000,0002,655,880
352,027,742
19,443,975
125,030-
8395
2,997,437282,977
2,246,233( 321,428)
-221,272
-24,995,674
$ 377,023,416
Amount$ 17,084,251
41,009,2537,197,683
30,343,32610,071,316
199,453219,938
192,230,4787,338,179
-
1,876,6532,080,6461,155,818
59,2761,468,8526,641,2451,693,9184,947,327
222,1545,169,4813,777,856
314,641,214
27,251,4197,177,294
199,453249,511,223
5,000,0002,180,547
291,319,936
19,443,975
125,03019,866
832,984
2,541,406288,227
1,501,128( 302,530)( 35,746)
237,209( 500,354)
23,321,278
$ 314,641,214
%6
132
103
--
612-
11--1312-21
100
92-
7921
93
6
----
1------7
100
%183394
--
601-
11---211-11
100
152-
742-
93
5
----
1-1----7
100
ASSETSCASH (Note 4)DUE FROM BANKSDUE FROM CENTRAL BANK (Note 5)SECURITIES PURCHASED-NET (Notes 2, 6 and 23) ACCOUNTS, INTEREST AND OTHER RECEIVABLES-NET(Notes 2, 7 and 23)
ACCEPTANCESPREPAID EXPENSES (Note 2)LOANS, DISCOUNTS AND BILLS PURCHASED-NET (Notes 2, 8 and 23) LONG-TERM EQUITY INVESTMENTS-NET (Notes 2, 6, 9 and 23)LONG-TERM BOND INVESTMENTS (Notes 2 and 9) PROPERTIES (Notes 2, 10, 23 and 24)Cost
LandBuildingsComputer equipmentTransportation equipmentOffice and other equipmentTotal cost
Accumulated depreciation
Advances on acquisitions of equipment and construction in progressNet PropertiesOTHER ASSETS (Notes 2 and 11)
TOTAL ASSETS
LIABILITIES AND STOCKHOLDERS' EQUITY LIABILITIESCall loans and due to banks Accounts, interest and other payables (Notes 12 and 21)Acceptances payableDeposits and remittances (Notes 13 and 23)Bank debentures (Note 14)Other liabilities (Notes 2, 20 and 21)
Total Liabilities
STOCKHOLDERS' EQUITY Capital stock, $10 par value
Authorized and issued - 1,944,397,617 sharesCapital surplus
Additional paid-in capital Gain on disposal of propertiesDonated capitalOther
Retained earningsLegal reserveSpecial reserveUnappropriated
Unrealized loss on long-term equity investments Unrealized revaluation loss Cumulative translation adjustment Treasury stock, at cost: 40,535,000 shares
Total Stockholders' EquityCONTINGENCIES AND COMMITMENTS (Notes 2, 24 and 28)
TOTAL LIABILITIES AND STOCKHOLDERS' EQUITY
The accompanying notes are an integral part of the consolidated financial statements.

83
ww
w.b
an
ksin
op
ac.c
om
.tw
For the Years Ended December 31, 2002 and 2001 (Amounts Expressedin Thousands of New Taiwan Dollars, Except Earnings Per Share) 2002 2001
BANK SINOPAC AND SUBSIDIARIES Consolidated Statements Of Income
Amount
$ 13,744,294
1,275,228
2,160,647
168,235
170,425
329,622
17,848,451
7,642,473
180,707
13,753
-
1,435,889
5,585,608
62,791
14,921,221
2,927,230
165,790
( 56,154)
109,639
3,036,869
781,820
$ 2,255,049
Pre-tax
$ 1.59
Amount
$ 15,980,466
863,701
2,481,005
-
89,301
140,397
19,554,870
11,009,286
143,247
-
230,526
1,072,380
4,904,819
143,760
17,504,018
2,050,852
214,224
( 49,419)
164,805
2,215,657
664,531
$ 1,551,126
Pre-tax
$ 1.15
%
82
4
13
-
-
1
100
56
1
-
1
6
25
1
90
10
1
-
1
11
3
8
AfterTax
$0.81
%
77
7
12
1
1
2
100
43
1
-
-
8
31
-
83
17
-
-
-
17
4
13
AfterTax
$1.18
OPERATING REVENUESInterest (Note 2 and 8)
Service fees (Notes 2, 17 and 23)
Income from securities - net (Notes 2 and 18)
Income from long-term equity investments-net (Notes 2, 9 and 23)
Foreign exchange gain - net (Note 2)
Other (Note 28)
Total Operating Revenues
OPERATING EXPENSES
Interest (Note 2)
Service charges (Note 23)
Provision for trading losses
Loss from long-term equity investments -net (Notes 2 and 9)
Provision for credit losses (Notes 2, 7 and 8)
Operating and administrative expenses (Notes 2, 19, 20 and 23)
Other
Total Operating Expenses
OPERATING INCOME
NON-OPERATING INCOME (EXPENSES)
Income (Note 23)
Expenses
Non-Operating Income - Net
INCOME BEFORE INCOME TAX
INCOME TAX (Notes 2 and 21)
NET INCOME
EARNINGS PER SHARE (Note 22)
Based earnings per share
The accompanying notes are an integral part of the consolidated financial statements.
BANK SINOPAC AND SUBSIDIARIES
84
20
02
AN
NU
AL
RE
PO
RT
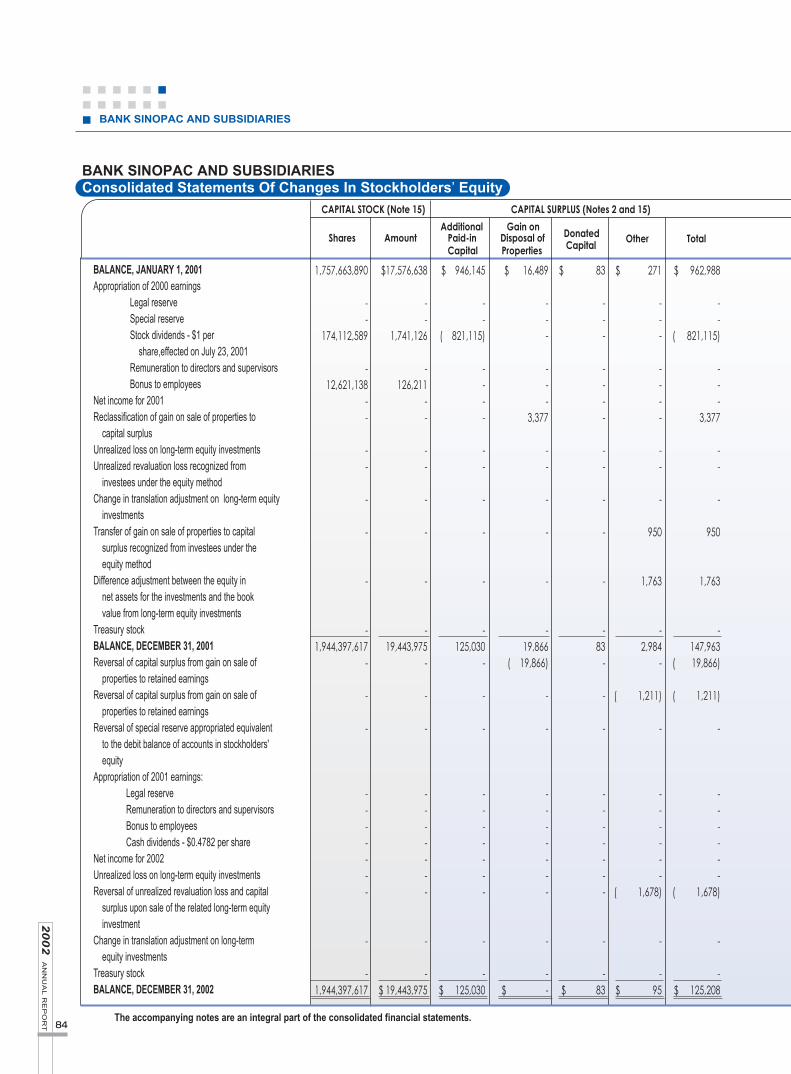
BANK SINOPAC AND SUBSIDIARIESConsolidated Statements Of Changes In Stockholders’ Equity
BALANCE, JANUARY 1, 2001 Appropriation of 2000 earnings
Legal reserveSpecial reserveStock dividends - $1 per
share,effected on July 23, 2001Remuneration to directors and supervisorsBonus to employees
Net income for 2001Reclassification of gain on sale of properties to
capital surplusUnrealized loss on long-term equity investmentsUnrealized revaluation loss recognized from
investees under the equity methodChange in translation adjustment on long-term equity
investmentsTransfer of gain on sale of properties to capital
surplus recognized from investees under the equity method
Difference adjustment between the equity in net assets for the investments and the book value from long-term equity investments
Treasury stock BALANCE, DECEMBER 31, 2001Reversal of capital surplus from gain on sale of
properties to retained earnings Reversal of capital surplus from gain on sale of
properties to retained earnings Reversal of special reserve appropriated equivalent
to the debit balance of accounts in stockholders' equity
Appropriation of 2001 earnings:Legal reserveRemuneration to directors and supervisorsBonus to employeesCash dividends - $0.4782 per share
Net income for 2002Unrealized loss on long-term equity investmentsReversal of unrealized revaluation loss and capital
surplus upon sale of the related long-term equity investment
Change in translation adjustment on long-term equity investments
Treasury stockBALANCE, DECEMBER 31, 2002
1,757,663,890
--
174,112,589
-12,621,138
--
--
-
-
-
-1,944,397,617
-
-
-
-------
-
-1,944,397,617
$ 946,145
--
( 821,115)
----
--
-
-
-
-125,030
-
-
-
-------
-
-$ 125,030
$17,576,638
--
1,741,126
-126,211
--
--
-
-
-
-19,443,975
-
-
-
-------
-
-$ 19,443,975
$ 16,489
---
---
3,377
--
-
-
-
-19,866
( 19,866)
-
-
-------
-
-$ -
$ 83
---
----
--
-
-
-
-83
-
-
-
-------
-
-$ 83
$ 271
---
----
--
-
950
1,763
-2,984
-
( 1,211)
-
------
( 1,678)
-
-$ 95
$ 962,988
--
( 821,115)
---
3,377
--
-
950
1,763
-147,963
( 19,866)
( 1,211)
-
------
( 1,678)
-
-$ 125,208
CAPITAL STOCK (Note 15) CAPITAL SURPLUS (Notes 2 and 15)
Additional Gain on Shares Amount Paid-in Disposal of Donated Other Total
Capital Properties Capital
The accompanying notes are an integral part of the consolidated financial statements.
85
ww
w.b
an
ksin
op
ac.c
om
.tw
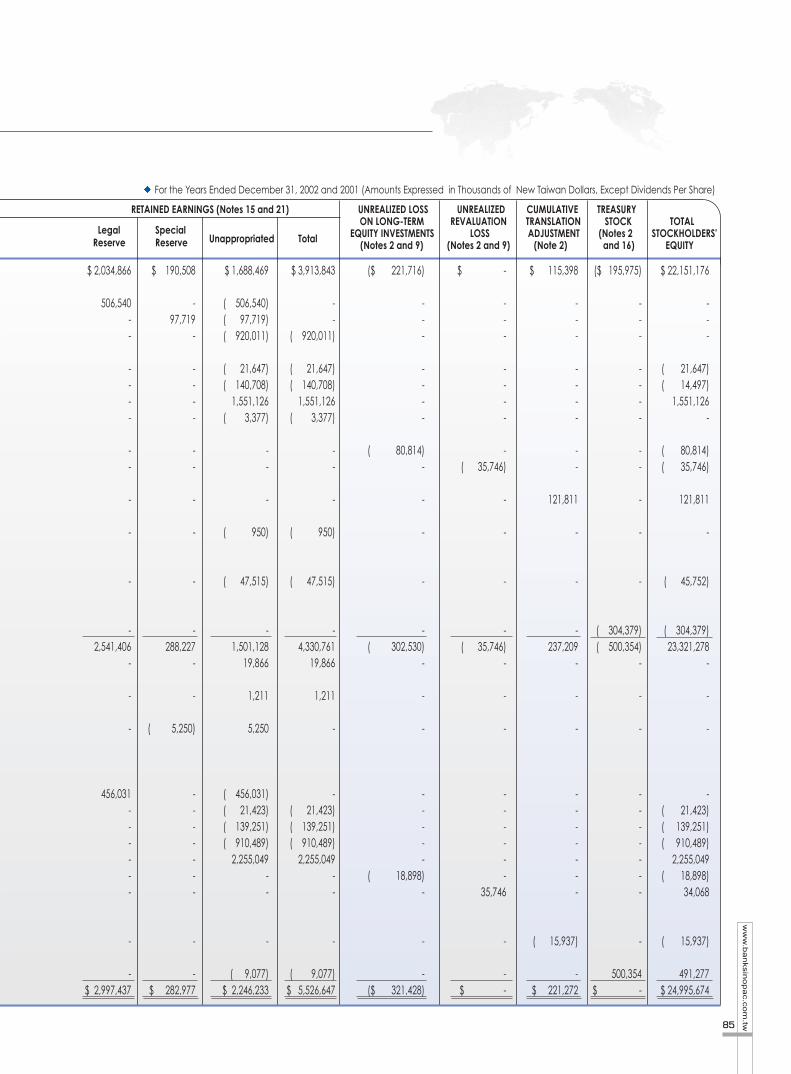
For the Years Ended December 31, 2002 and 2001 (Amounts Expressed in Thousands of New Taiwan Dollars, Except Dividends Per Share)
RETAINED EARNINGS (Notes 15 and 21) UNREALIZED LOSS UNREALIZED CUMULATIVE TREASURYON LONG-TERM REVALUATION TRANSLATION STOCK TOTAL
Legal Special EQUITY INVESTMENTS LOSS ADJUSTMENT (Notes 2 STOCKHOLDERS'Reserve Reserve Unappropriated Total
(Notes 2 and 9) (Notes 2 and 9) (Note 2) and 16) EQUITY
$ 2,034,866
506,540--
----
--
-
-
-
-2,541,406
-
-
-
456,031------
-
-$ 2,997,437
$ 190,508
-97,719
-
----
--
-
-
-
-288,227
-
-
( 5,250)
-------
-
-$ 282,977
$ 1,688,469
( 506,540)( 97,719)( 920,011)
( 21,647)( 140,708)
1,551,126( 3,377)
--
-
( 950)
( 47,515)
-1,501,128
19,866
1,211
5,250
( 456,031)( 21,423)( 139,251)( 910,489)
2,255,049--
-
( 9,077)$ 2,246,233
$ 3,913,843
--
( 920,011)
( 21,647)( 140,708)
1,551,126( 3,377)
--
-
( 950)
( 47,515)
-4,330,761
19,866
1,211
-
-( 21,423)( 139,251)( 910,489)
2,255,049--
-
( 9,077)$ 5,526,647
($ 221,716)
---
----
( 80,814)-
-
-
-
-( 302,530)
-
-
-
-----
( 18,898)-
-
-($ 321,428)
$ -
---
----
-( 35,746)
-
-
-
-( 35,746)
-
-
-
------
35,746
-
-$ -
$ 115,398
---
----
--
121,811
-
-
-237,209
-
-
-
-------
( 15,937)
-$ 221,272
($ 195,975)
---
----
--
-
-
-
( 304,379)( 500,354)
-
-
-
-------
-
500,354$ -
$ 22,151,176
---
( 21,647)( 14,497)
1,551,126-
( 80,814)( 35,746)
121,811
-
( 45,752)
( 304,379)23,321,278
-
-
-
-( 21,423)( 139,251)( 910,489)
2,255,049( 18,898)
34,068
( 15,937)
491,277$ 24,995,674
BANK SINOPAC AND SUBSIDIARIES
86
20
02
AN
NU
AL
RE
PO
RT
BANK SINOPAC AND SUBSIDIARIES
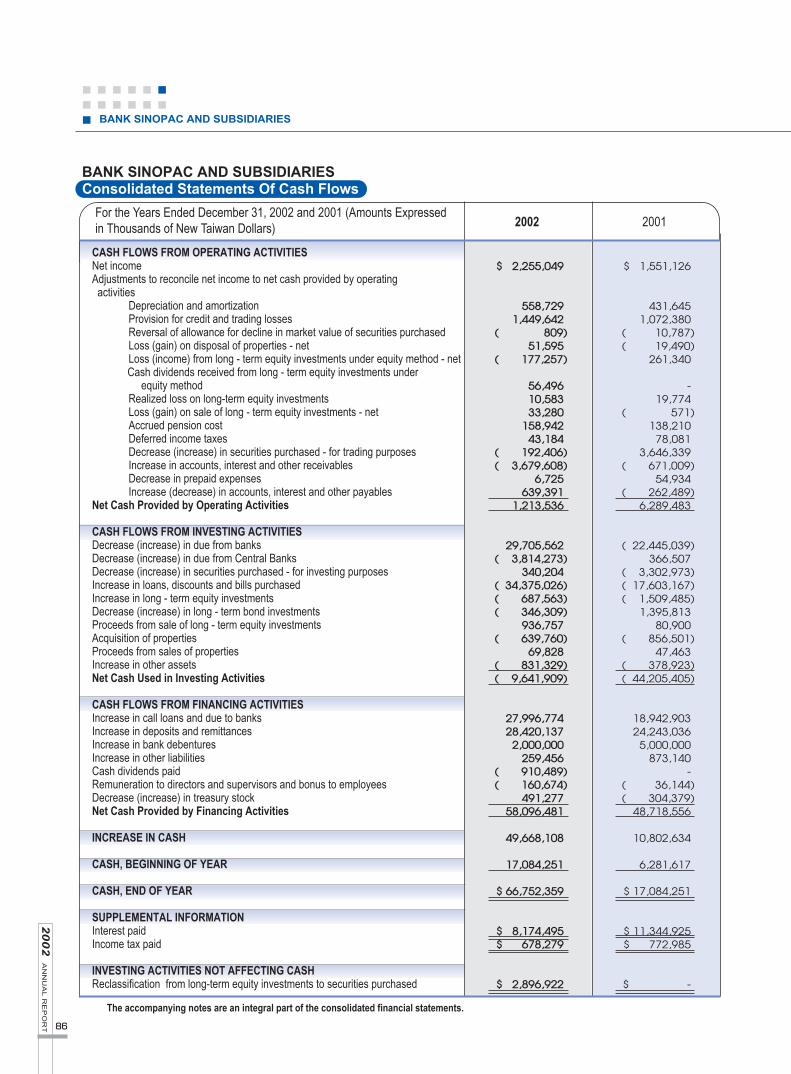
For the Years Ended December 31, 2002 and 2001 (Amounts Expressedin Thousands of New Taiwan Dollars) 2002 2001
Consolidated Statements Of Cash Flows
$ 2,255,049
558,7291,449,642
( 809)51,595
( 177,257)
56,49610,58333,280
158,94243,184
( 192,406)( 3,679,608)
6,725639,391
1,213,536
29,705,562( 3,814,273)
340,204( 34,375,026)( 687,563)( 346,309)
936,757( 639,760)
69,828( 831,329)( 9,641,909)
27,996,77428,420,137
2,000,000259,456
( 910,489)( 160,674)
491,27758,096,481
49,668,108
17,084,251
$ 66,752,359
$ 8,174,495$ 678,279
$ 2,896,922
$ 1,551,126
431,6451,072,380
( 10,787)( 19,490)
261,340
-19,774
( 571)138,21078,081
3,646,339( 671,009)
54,934( 262,489)
6,289,483
( 22,445,039)366,507
( 3,302,973)( 17,603,167)( 1,509,485)
1,395,81380,900
( 856,501)47,463
( 378,923)( 44,205,405)
18,942,90324,243,0365,000,000
873,140-
( 36,144)( 304,379)
48,718,556
10,802,634
6,281,617
$ 17,084,251
$ 11,344,925$ 772,985
$ -
CASH FLOWS FROM OPERATING ACTIVITIESNet incomeAdjustments to reconcile net income to net cash provided by operating activities
Depreciation and amortizationProvision for credit and trading lossesReversal of allowance for decline in market value of securities purchasedLoss (gain) on disposal of properties - netLoss (income) from long - term equity investments under equity method - netCash dividends received from long - term equity investments under
equity methodRealized loss on long-term equity investmentsLoss (gain) on sale of long - term equity investments - netAccrued pension costDeferred income taxesDecrease (increase) in securities purchased - for trading purposesIncrease in accounts, interest and other receivablesDecrease in prepaid expensesIncrease (decrease) in accounts, interest and other payables
Net Cash Provided by Operating Activities
CASH FLOWS FROM INVESTING ACTIVITIESDecrease (increase) in due from banksDecrease (increase) in due from Central BanksDecrease (increase) in securities purchased - for investing purposesIncrease in loans, discounts and bills purchasedIncrease in long - term equity investmentsDecrease (increase) in long - term bond investmentsProceeds from sale of long - term equity investmentsAcquisition of propertiesProceeds from sales of propertiesIncrease in other assetsNet Cash Used in Investing Activities
CASH FLOWS FROM FINANCING ACTIVITIESIncrease in call loans and due to banksIncrease in deposits and remittancesIncrease in bank debenturesIncrease in other liabilitiesCash dividends paidRemuneration to directors and supervisors and bonus to employeesDecrease (increase) in treasury stockNet Cash Provided by Financing Activities
INCREASE IN CASH
CASH, BEGINNING OF YEAR
CASH, END OF YEAR
SUPPLEMENTAL INFORMATIONInterest paidIncome tax paid
INVESTING ACTIVITIES NOT AFFECTING CASH Reclassification from long-term equity investments to securities purchased
The accompanying notes are an integral part of the consolidated financial statements.

87
ww
w.b
an
ksin
op
ac.c
om
.tw
1.ORGANIZATION AND OPERATIONS
The Bank obtained government approval to incorporate on August 8, 1991, and commenced operations on January28, 1992. The Bank is engaged in commercial banking, trust, and foreign exchange operations as prescribed bythe Banking Law.
As of December 31, 2002, the Bank’s operating units include Banking, Trust, International Division of the HeadOffice, an Offshore Banking Unit (OBU), forty-two domestic branches, two overseas branches and one overseasrepresentative office.
The operations of the Bank’s Trust Department consist of: (1) planning, managing and operating of trustbusiness; (2) custodianship of non-discretionary trust fund in domestic and overseas securities and mutual funds.The foregoing operations are regulated under the Banking Law and Trust Law.
The Bank, National Securities Co., Ltd. (the “NSC”, which has been renamed as SinoPac Securities Corporationon June 9, 2002) and SinoPac Securities Co., Ltd. (the “SPS”) have established SinoPac Holdings (the “SPH”), afinancial holding company, pursuant to the Financial Holding Company Law, as of May 9, 2002. The partiesestablished the holding company in order to maximize the benefit of their combined capital, pool their businesschannel, fully harness the synergy of their diversified business operations and establish one of the mostcompetitive organizations in the Pacific Rim. The Bank, the NSC and the SPS exchanged issued shares with SPHat ratios of 1:1.0267130836, 1:1.0098971566 and 1:0.7968960296, respectively, which has been approved both bystockholders on November 19, 2001 and by the Ministry of Finance (MOF) on November 28, 2001. Since May 9,2002, the effective date of the aforementioned stock exchange, the Bank has become an unlisted wholly-ownedsubsidiary of SPH which shares are traded on the Taiwan Stock Exchange (TSE).
SinoPac Securities Corporation (the “SinoPac Securities”, formerly NSC) merged with SPS on July 22, 2002 withSinoPac Securities as the surviving entity after a decision reached by the board of directors of the two companieson May 9, 2002. 1.2672884782 shares of common stock of SPS were exchanged for each share of common stock ofSinoPac Securities.
On August 15, 1997, Bank SinoPac acquired Far East National Bank (FENB), through SinoPac Bancorp, bypurchase of 100% of its shares. FENB was established in Los Angeles in 1974. It is a commercial bank engagedmainly in deposit taking and lending businesses. As of December 31, 2002, FENB has 15 branches in Los Angelesand San Francisco areas and one Beijing representative office. It also has four wholly-owned subsidiaries - FarEast Capital Corporation, a small business investment bank, FENB Securities Inc., a small securities corporation,FENB Loan Corp., an asset management corporation, and FENB Film Corp., a motion picture asset managementcorporation.
2.SIGNIFICANT ACCOUNTING POLICIES
The Bank’s significant accounting policies, which conform to accounting principles generally accepted in theRepublic of China (ROC), are summarized below:
BANK SINOPAC AND SUBSIDIARIESNOTES TO CONSOLIDATED FINANCIAL STATEMENTS
(Amounts Expressed in Thousands of New Taiwan Dollars, Unless Otherwise Stated)
BANK SINOPAC AND SUBSIDIARIES
88
20
02
AN
NU
AL
RE
PO
RT
Consolidation
The consolidated financial statements include the accounts of the Bank and its subsidiary, SinoPac Bancorp, as
consolidated with FENB. All significant inter-company transactions and balances have been eliminated for
consolidation purpose.
The operating revenues and total assets of the other five subsidiaries - SinoPac Leasing Corporation, SinoPac
Capital Limited, SinoPac Financial Consulting Co., Ltd., SinoPac Life Insurance Agent Co., Ltd. and SinoPac
Property Insurance Agent Co., Ltd. - are individually less than 10%, and are in aggregate less than 30%, of those
of the Bank. Accordingly, their accounts were not included in consolidated financial statements.
The consolidated balance sheet of Bank SinoPac and subsidiaries as of December 31, 2001 and the related
consolidated statements of income, changes in stockholders’ equity and cash flows for the year then ended have
been recompiled to reflect the change in the consolidated entities, although the effect of the change upon the
consolidated financial statements is insignificant.
Securities purchased
Securities purchased include short-term bills, stocks, beneficiary certificates and bonds.
Short-term bills are stated at cost (which approximates market value). Stocks, beneficiary certificates and
bonds are stated at the lower of cost or market. Market prices are determined as follows: (a) listed stocks -
average daily closing prices for the last month of the accounting period; (b) beneficiary certificates (open-end
fund) - net asset values as of the balance sheet dates; and (c) over-the-counter stocks - average daily closing
prices for the last month of the accounting period, published by the Republic of China Over the Counter
Securities Exchange (the OTC Exchange); and (d) bonds - period-end reference prices published by the OTC
Exchange.
Cost of securities sold is determined using the moving-average method, except that of short-term bills, which is
determined by the specific identification method.
For applying the lower of cost or market method, the SPH’s shares held by the Bank should be evaluated
separately from the other listed and over-the-counter stocks held by the Bank pursuant to the accounting
principles generally accepted in the ROC.
Sales and purchases of bonds and short-term bills under agreements to repurchase or to resell are, pursuant to a
directive issued by the MOF, treated as outright sales or purchase.
Non-performing loans
The balance of loans and other credits extended by the Bank and the related accrued interest thereon are
classified as non-performing when the loan is six months overdue pursuant to guidelines issued by the MOF
and, upon approval by the board of directors, those loans which are less than six months overdue will also be
classified as non-performing.
Allowance for credit losses and provision for losses on guarantees
In determining the allowance for credit losses and provision for losses on guarantees, the Bank evaluates the
losses on particular loans and overall credit portfolio considering the balances of loans, discounts and bills

89
ww
w.b
an
ksin
op
ac.c
om
.tw
purchased, accounts, interest and other receivables, non-performing loans, as well as guarantees and
acceptances as of the balance sheet dates.
Losses on overall credit portfolio are assessed on the basis of the Bank’s prior experiences.
The Bank evaluates losses on particular loans based on its borrowers’ /clients’ credit limit, collateral provided
and estimated level of collectibility in accordance with “The Rules for Bank Asset Evaluation, Loss Reserve
Provision, and Disposal of Overdue Loans and Bad Debts” (the “Rules”) issued by the MOF. The Rules provide
that the minimum amount requirement of provision for credit losses shall be equal to the aggregate of 50% of
the doubtful credits and 100% of the unrecoverable credits.
Write-offs of specific loans under the MOF guidelines, upon approved by the board of directors, are offset against
the recorded allowance for loan losses.
Long-term equity investments
Long-term equity investments are accounted for by the equity method if the Bank has significant influence over
the investees. Investments accounted for by the equity method are stated at cost plus (or minus) a proportionate
share in net earnings (losses) or changes in net worth of the investees. Any difference between the acquisition
cost and the equity of the investee acquired at the time of investment is amortized over 15 years. Long-term
equity investments are accounted for by the cost method if the Bank does not have significant influence over the
investees. Stock dividends result only in an increase in number of shares and are not recognized as investment
income.
If an investee issues new shares and the Bank does not purchase new shares proportionately, then the
investment percentage, and therefore the equity in net assets for the investment, will be changed. Such
difference shall be used to adjust the additional paid-in capital and the long-term equity investment. If the
carrying value of additional paid-in capital from long-term equity investment is not enough to be offset, then the
difference shall be debited to the retained earnings.
For listed and over-the-counter stocks accounted for by the cost method, when the aggregate market value is
lower than the total carrying value, an allowance for market value decline is provided and the unrealized loss is
charged against stockholders’ equity. If a decline in the value of an unlisted stock investment is considered as
permanent loss, the decline is charged to current income.
Cost of equity investments sold is determined by the weighted-average method.
For the listed stock investments reclassified from securities purchased to long-term equity investments or vice
versa, when the market value is lower than the carrying value, a realized loss for market value decline is
recognized and recorded at market value.
Long-term bond investments
Long-term bond investments, comprised of corporate bonds, are recorded at cost and adjusted for amortization of
premiums or discounts. Cost of bonds sold is calculated by the moving-average method.

BANK SINOPAC AND SUBSIDIARIES
90
20
02
AN
NU
AL
RE
PO
RT
Properties
Properties are stated at cost less accumulated depreciation. Major renewals and betterments are capitalized,
while repairs and maintenance are expensed as incurred.
Upon sale or disposal of properties, their cost and related accumulated depreciation are removed from the
respective accounts. Any resulting gain (loss) is credited (charged) to current income.
The gain on disposal of properties is not required to be transferred to capital surplus anymore starting the year
of 2001 according to the amendment of Company Law. The gain on disposal of properties for the year 2001
occurred before such amendment, has been transferred to capital surplus at the end of year, net of the applicable
income tax. In compliance with related regulations, the aforementioned capital surplus has been reversed to
retained earnings before December 31, 2002.
Depreciation is calculated by the straight-line method based on estimated service lives which range as follows:
Buildings, 8 to 55 years; computer equipment, 3 to 5 years; transportation equipment, 5 years; office and other
equipment, 5 to 8 years. For assets still in use beyond their original estimated service lives, further depreciation
is calculated on the basis of any remaining salvage value and the estimated additional service lives.
Intangible assets
Intangible assets (included in other assets), comprised of goodwill, are amortized on the straight-line basis over
15 years.
Collaterals assumed
Collaterals assumed are recorded at cost (included in other assets) and revalued by the lower of cost or net
realizable value as of the balance sheet dates.
Derivative financial instruments
a.Foreign exchange forward contractsForeign-currency assets and liabilities arising from forward exchange contracts, which are mainly to
accommodate customers’ needs or to manage the Bank’s currency positions, are recorded at the contracted
forward rates. Gains or losses arising from the differences between the contracted forward rates and spot rates
at settlement are credited or charged to current income. For contracts outstanding as of the balance sheet date,
the gains or losses arising from the differences between the contracted forward rates and the forward rates
available for the remaining maturities of the contracts are credited or charged to current income. Receivables
arising from forward exchange contracts are offset against related payables as of the balance sheet dates.
b.Forward rate agreementsForward rate agreements, which are mainly to accommodate customers’ needs or to manage the Bank’s interest
rate positions, are recorded by memorandum entries at the contract dates. Gains or losses arising from the
differences between the contracted interest rates and actual interest rates upon settlement or as of the balance
sheet dates are credited or charged to current income.
91
ww
w.b
an
ksin
op
ac.c
om
.tw
c.Currency swap contracts
Foreign-currency spot-position assets or liabilities arising from currency swap contracts, which are mainly toaccommodate customers’ needs or to manage the Bank’s currency positions, are recorded at the spot rates whenthe transactions occur, while the corresponding forward-position assets or liabilities are recorded at thecontracted forward rates; with receivables netted against the related payables.
The related discount or premium is amortized by the straight-line basis over the contract period.
d.Cross currency swaps
Cross currency swap contracts, which are intended for hedging purpose, are recorded at spot rates of thecontract dates. The net interest upon each settlement is recorded as adjustment to the revenue or expenseassociated with the item being hedged.
e.Options
Options bought and/or held and options written, which are mainly to accommodate customers’ needs or tomanage the Bank’s currency positions, are recorded as assets and liabilities when the transactions occur. Theseinstruments are marked to market as of the balance sheet dates. The carrying values of the instruments, whichare recovered either as assets or liabilities, are charged to income when they are not exercised. Gains or losseson the exercise of options are also included in current income.
f.Interest rate swaps
Interest rate swaps, which do not involve exchanges of the notional principals, are not recognized as eitherassets and/or liabilities on the contract dates. The swaps were entered into to accommodate customers’ needsor to manage the Bank’s interest rate positions. The interest received or paid at each settlement date arerecognized as interest income or expense. The instruments are marked to market as of the balance sheet dates.
For swaps entered into for hedging purposes, the net interest upon each settlement is recorded as anadjustment to interest income or expense associated with the item being hedged.
g.Asset swaps
Asset swaps involve exchanging the fixed rate interest of convertible bonds, bank debentures for floating rateinterest; in addition, asset swaps also involve exchanging the fixed or floating interest rate of credit link notesfor floating or fixed rate interest. These transactions are recorded by memorandum entries at the contractdates. Asset swaps are entered into for hedging purposes; they are used to hedge interest rate exposure inconvertible bonds, bank debentures and credit link notes denominated in foreign currency. Net interest uponeach settlement or balance sheet date is recorded as an adjustment to interest revenue or expenses associatedwith the bonds or notes being hedged.
h.Futures
Premiums paid by the Bank related to interest rate futures contracts entered into for trading purposes arerecognized as assets. Gains or losses as result of marking to market value of the interest rate futures contractsas of the balance sheet dates are recognized as current income. Gains or losses arising from the settlement ofthe interest rate futures contracts are also recognized as current income.
BANK SINOPAC AND SUBSIDIARIES
92
20
02
AN
NU
AL
RE
PO
RT
Recognition of interest revenue and service feesInterest revenue on loans is recorded using the accrual method. No interest revenue is recognized in theaccompanying financial statements on loans and other credits extended by the Bank that are classified as non-performing loans. The interest revenue on those loans/credits is recognized upon collection.
Pursuant to the regulations of the MOF, the interest revenue on credits covered by agreements that extend theirmaturities is recognized upon collection.
Service fees are recorded as income upon receipt and substantial completion of activities involved in theearnings process.
PensionPension expense is determined based on actuarial calculations.
Income taxInterperiod income tax allocation is applied, whereby tax effects of deductible temporary differences and unusedinvestment tax credits are recognized as deferred income tax assets and those of taxable temporary differencesare recognized as deferred income tax liabilities. A valuation allowance is provided for deferred income taxassets that are not certain to be realized.
Adjustments of prior years’ tax liabilities are included in the current year’s tax provision.
Tax credits, generated from acquisitions of equipment or technology, research and development expenditure,personnel training expenditure and equity investments acquisition, are accounted for by the flow-throughmethod.
Income taxes (10%) on unappropriated earnings is recorded as income tax in the year when the shareholdersresolve the appropriation of earnings.
ContingenciesA loss is recognized when it is probable that an asset has been impaired or a liability has been incurred and theamount of loss can be reasonably estimated. If the amount of the loss cannot be reasonably estimated or the lossis possible and remote, the related information is disclosed in the financial statements.
Foreign-currency transactionsThe Bank records foreign-currency transactions in the respective currencies in which these are denominated.Foreign-currency denominated income and expenses are translated into New Taiwan dollars at month-end spotrates. Foreign-currency assets and liabilities are translated into New Taiwan dollars at closing rates as of thebalance sheet dates. Realized and unrealized foreign exchange gains or losses are credited or charged to currentincome. Gains or losses resulting from restatement of year-end foreign-currency denominated long-term equityinvestments accounted for by the equity method are credited or charged to “cumulative translation adjustment”under stockholders’ equity.
Treasury stockCapital stock acquired is carried at cost and presented as a separate deduction from stockholders’ equity. Thetreasury stocks acquired are to be reissued to employees. The reissuance of the treasury stocks are accountedfor as follows: (a) reissue price higher than the acquisition cost - the excess is credited to paid-in capital ontreasury stock; and (b) reissue price less than the acquisition cost - initially charged to paid-in capital ontreasury stock with any remaining deficiency charged to retained earnings.

93
ww
w.b
an
ksin
op
ac.c
om
.tw
3.ELIMINATIONS OF SIGNIFICANT TRANSACTIONS BETWEEN PARENT COMPANY AND SUBSIDIARIES
Name of Corporation Elimination Account Amount Counterparties of Transaction
2002
Bank SinoPac Due from banks $ 220,368 SinoPac Bancorp and subsidiaries
SinoPac Bancorp and Call loans and due to 220,368 Bank SinoPac
subsidiaries banks
2001
Bank SinoPac Due from banks $ 448,199 SinoPac Bancorp and subsidiaries
SinoPac Bancorp and Call loans and due to 448,199 Bank SinoPac
subsidiaries banks
4.CASHDecember 31
2002 2001
Negotiable certificates of deposit $ 64,644,097 $ 15,247,337
Cash 1,656,948 1,447,191
Notes and checks in clearing 451,314 389,723
$ 66,752,359 $ 17,084,251
As of December 31, 2002 and 2001, negotiable certificates of deposit aggregating $23,600,000 and $3,500,000,
respectively, have maturities over one year and may be withdrawn momentarily.
To comply with the Central Bank’s clearing system of Real-time Gross Settlement (RTGS), negotiable certificates
of deposit aggregating $13,800,000 has been provided as collateral for the day-time overdrafts as of December 31,
2002, with the pledged amount which can be adjusted momentarily.
5.DUE FROM CENTRAL BANK
This account consists mainly of New Taiwan dollar and foreign currency denominated deposit reserves.
Pursuant to a directive issued by the Central Bank of the ROC, New Taiwan dollar denominated deposit reserves
are determined monthly at prescribed rates on average balances of customers’ New Taiwan dollar - denominated
deposits. These reserves include $5,437,730 and $4,726,084 as of December 31, 2002 and 2001, respectively,
which are subject to withdrawal restrictions.
In addition, the foreign-currency denominated deposit reserves are determined at prescribed rates on balances of
additional foreign-currency denominated deposits. These reserves may be withdrawn momentarily and are non-
interest earnings. As of December 31, 2002 and 2001, the balances of foreign-currency denominated deposit
reserves were $45,179 and $428,738, respectively.
BANK SINOPAC AND SUBSIDIARIES
94
20
02
AN
NU
AL
RE
PO
RT
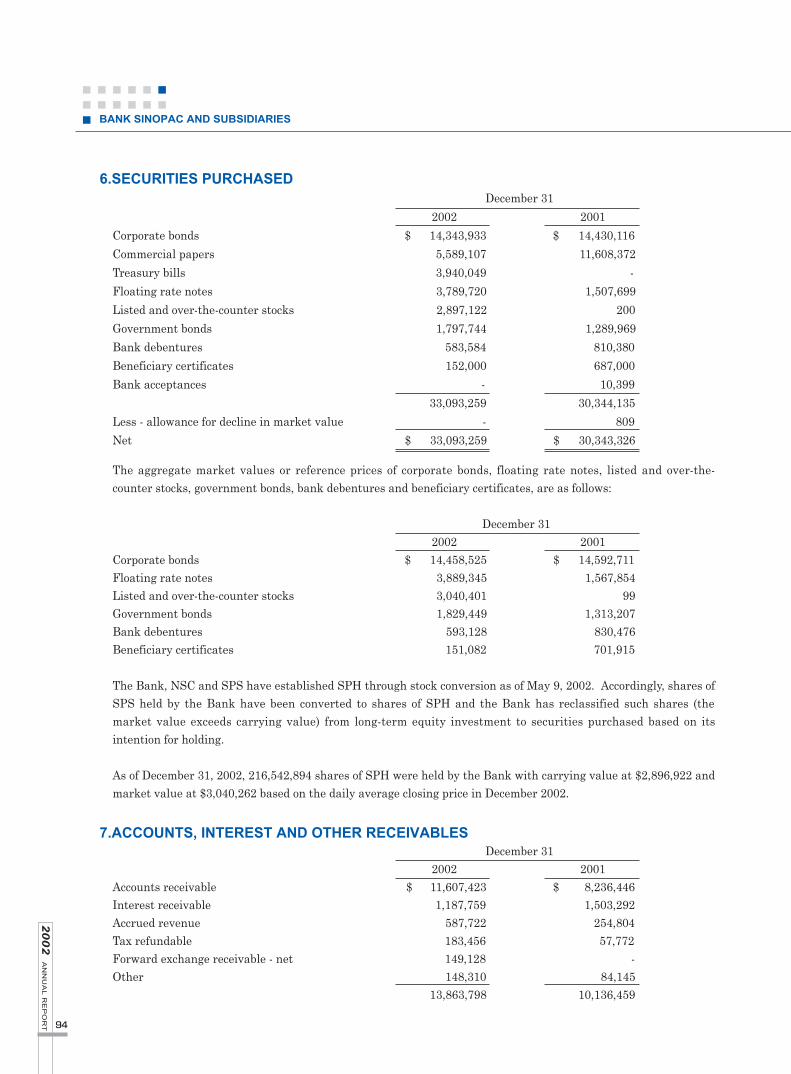
6.SECURITIES PURCHASEDDecember 31
2002 2001
Corporate bonds $ 14,343,933 $ 14,430,116
Commercial papers 5,589,107 11,608,372
Treasury bills 3,940,049 -
Floating rate notes 3,789,720 1,507,699
Listed and over-the-counter stocks 2,897,122 200
Government bonds 1,797,744 1,289,969
Bank debentures 583,584 810,380
Beneficiary certificates 152,000 687,000
Bank acceptances - 10,399
33,093,259 30,344,135
Less - allowance for decline in market value - 809
Net $ 33,093,259 $ 30,343,326
The aggregate market values or reference prices of corporate bonds, floating rate notes, listed and over-the-counter stocks, government bonds, bank debentures and beneficiary certificates, are as follows:
December 31 2002 2001
Corporate bonds $ 14,458,525 $ 14,592,711Floating rate notes 3,889,345 1,567,854Listed and over-the-counter stocks 3,040,401 99Government bonds 1,829,449 1,313,207Bank debentures 593,128 830,476Beneficiary certificates 151,082 701,915
The Bank, NSC and SPS have established SPH through stock conversion as of May 9, 2002. Accordingly, shares ofSPS held by the Bank have been converted to shares of SPH and the Bank has reclassified such shares (themarket value exceeds carrying value) from long-term equity investment to securities purchased based on itsintention for holding.
As of December 31, 2002, 216,542,894 shares of SPH were held by the Bank with carrying value at $2,896,922 andmarket value at $3,040,262 based on the daily average closing price in December 2002.
7.ACCOUNTS, INTEREST AND OTHER RECEIVABLESDecember 31
2002 2001Accounts receivable $ 11,607,423 $ 8,236,446Interest receivable 1,187,759 1,503,292Accrued revenue 587,722 254,804Tax refundable 183,456 57,772Forward exchange receivable - net 149,128 -Other 148,310 84,145
13,863,798 10,136,459

95
ww
w.b
an
ksin
op
ac.c
om
.tw
December 31 2002 2001
Less - allowance for credit losses 112,874 65,143
Net $ 13,750,924 $ 10,071,316
The balance of the accounts receivable as of December 31, 2002 and 2001 included $11,200,653 and $8,060,950,
respectively, representing accounts receivable acquired from other parties in the factoring business.
8.LOANS, DISCOUNTS AND BILLS PURCHASEDDecember 31
2002 2001
Overdrafts $ 2,834,970 $ 2,952,876
Short-term loans 52,844,007 46,564,173
Mid-term loans 58,389,464 51,693,517
Long-term loans 109,672,916 90,180,726
Import and export negotiations 1,320,750 407,653
Bills purchased 1,712 518
Non-performing loans 2,150,299 2,026,049
227,214,118 193,825,512
Less - allowance for credit losses 1,923,512 1,517,413
- unearned loan fees 120,991 77,621
Net $ 225,169,615 $ 192,230,478
Unearned loan fees pertain to nonrefundable loan fees and certain direct costs associated with originating andacquiring loans. The fees collected are not recognized at the time of origination but are deferred and amortizedusing the effective interest method over the life of the loan as an adjustment of the yield on the related loan.
As of December 31, 2002 and 2001, the balances of non-accrual loans were $3,709,926 and $3,474,146,respectively. The unrecognized interest revenue on non-accrual loans amounted to $187,803 and $212,377 for theyears ended December 31, 2002 and 2001, respectively.
For the years ended December 31, 2002 and 2001, the Bank had not written off credits for which legal proceedingshad not been initiated.
The details and changes in allowance for credit losses of loans, discounts and bills purchased for the years endedDecember 31, 2002 and 2001, respectively, are summarized below:
For the Years Ended December 31, 2002 For Losses on For Losses on the Overall Loan Portfolio
Particular Loans (Excluding the Particular Loans) TotalBalance, beginning of year $ 409,694 $ 1,107,719 $ 1,517,413Provision 1,365,525 70,364 1,435,889Write-off ( 1,181,091) - ( 1,181,091)Recovery of written-off credits 106,297 - 106,297Reclassifications 68,395 ( 23,391) 45,004Balance, end of year $ 768,820 $ 1,154,692 $ 1,923,512
BANK SINOPAC AND SUBSIDIARIES
96
20
02
AN
NU
AL
RE
PO
RT
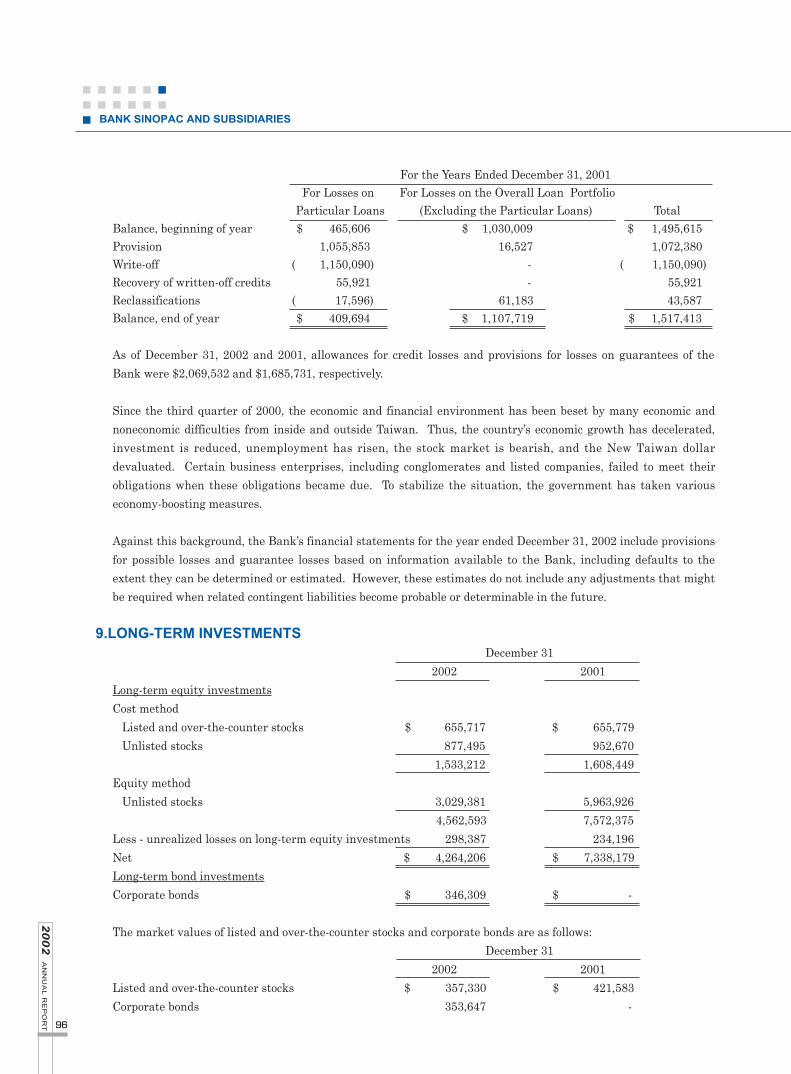
For the Years Ended December 31, 2001 For Losses on For Losses on the Overall Loan Portfolio
Particular Loans (Excluding the Particular Loans) TotalBalance, beginning of year $ 465,606 $ 1,030,009 $ 1,495,615Provision 1,055,853 16,527 1,072,380Write-off ( 1,150,090) - ( 1,150,090)Recovery of written-off credits 55,921 - 55,921Reclassifications ( 17,596) 61,183 43,587Balance, end of year $ 409,694 $ 1,107,719 $ 1,517,413
As of December 31, 2002 and 2001, allowances for credit losses and provisions for losses on guarantees of the
Bank were $2,069,532 and $1,685,731, respectively.
Since the third quarter of 2000, the economic and financial environment has been beset by many economic and
noneconomic difficulties from inside and outside Taiwan. Thus, the country’s economic growth has decelerated,
investment is reduced, unemployment has risen, the stock market is bearish, and the New Taiwan dollar
devaluated. Certain business enterprises, including conglomerates and listed companies, failed to meet their
obligations when these obligations became due. To stabilize the situation, the government has taken various
economy-boosting measures.
Against this background, the Bank’s financial statements for the year ended December 31, 2002 include provisions
for possible losses and guarantee losses based on information available to the Bank, including defaults to the
extent they can be determined or estimated. However, these estimates do not include any adjustments that might
be required when related contingent liabilities become probable or determinable in the future.
9.LONG-TERM INVESTMENTSDecember 31
2002 2001
Long-term equity investments
Cost method
Listed and over-the-counter stocks $ 655,717 $ 655,779
Unlisted stocks 877,495 952,670
1,533,212 1,608,449
Equity method
Unlisted stocks 3,029,381 5,963,926
4,562,593 7,572,375
Less - unrealized losses on long-term equity investments 298,387 234,196
Net $ 4,264,206 $ 7,338,179
Long-term bond investments
Corporate bonds $ 346,309 $ -
The market values of listed and over-the-counter stocks and corporate bonds are as follows:
December 31
2002 2001
Listed and over-the-counter stocks $ 357,330 $ 421,583
Corporate bonds 353,647 -

97
ww
w.b
an
ksin
op
ac.c
om
.tw
The carrying amounts of the investments accounted for by the equity method as of December 31, 2002 and 2001,
and the related investment income of $177,257 and investment loss of $261,340, respectively, for the years then
ended, were based on the investees’ audited financial statements, except for those of Rocorp Holding S.A., SinoPac
Financial Consulting Co., Ltd., SinoPac Property Insurance Agent Co., Ltd. which were based on the investees’
unaudited financial statements for 2002 and 2001, and SinoPac Life Insurance Agent Co., Ltd. which was based
on the unaudited financial statements for 2001. The Bank believes that any adjustments, if any, may have to be
made to these investments and investment income is insignificant if such financial statements had been audited.
As of December 31, 2002 and 2001, the unrealized loss on long-term equity investments resulted from market
value decline of over-the-counter stocks held by an investee accounted for by the equity method amounted to
$30,907 and $75,054, respectively.
The Bank recognized its equity in the unrealized revaluation loss of Aetna Sinopac Credit Card Co., Ltd., which
had been sold to SPH in December 2002, please see Note 23 (f), and renamed as AnShin Card Services Company
Limited (AnShin Card Services) on January 3, 2003 totaling $35,746. Such unrealized revaluation loss resulted
from the revaluation of financial instrument contracts.
10.PROPERTIESDecember 31
2002 2001
Cost $ 7,092,926 $ 6,641,245
Less - accumulated depreciation
Buildings 338,881 268,932
Computer equipment 728,600 612,862
Transportation equipment 39,051 35,644
Office and other equipment 896,603 776,480
2,003,135 1,693,918
5,089,791 4,947,327
Advances on acquisitions of equipment
and construction in progress 190,954 222,154
Net $ 5,280,745 $ 5,169,481
11.OTHER ASSETSDecember 31
2002 2001
Value of options purchased $ 1,124,421 $ 780,838
Guarantee deposits 979,952 680,353
Intangible assets 953,180 1,060,392
Collateral assumed 380,460 328,128
Suspense account 323,950 179,196
Computer system software 244,089 249,086
Other 455,463 499,863
$ 4,461,515 $ 3,777,856
BANK SINOPAC AND SUBSIDIARIES
98
20
02
AN
NU
AL
RE
PO
RT
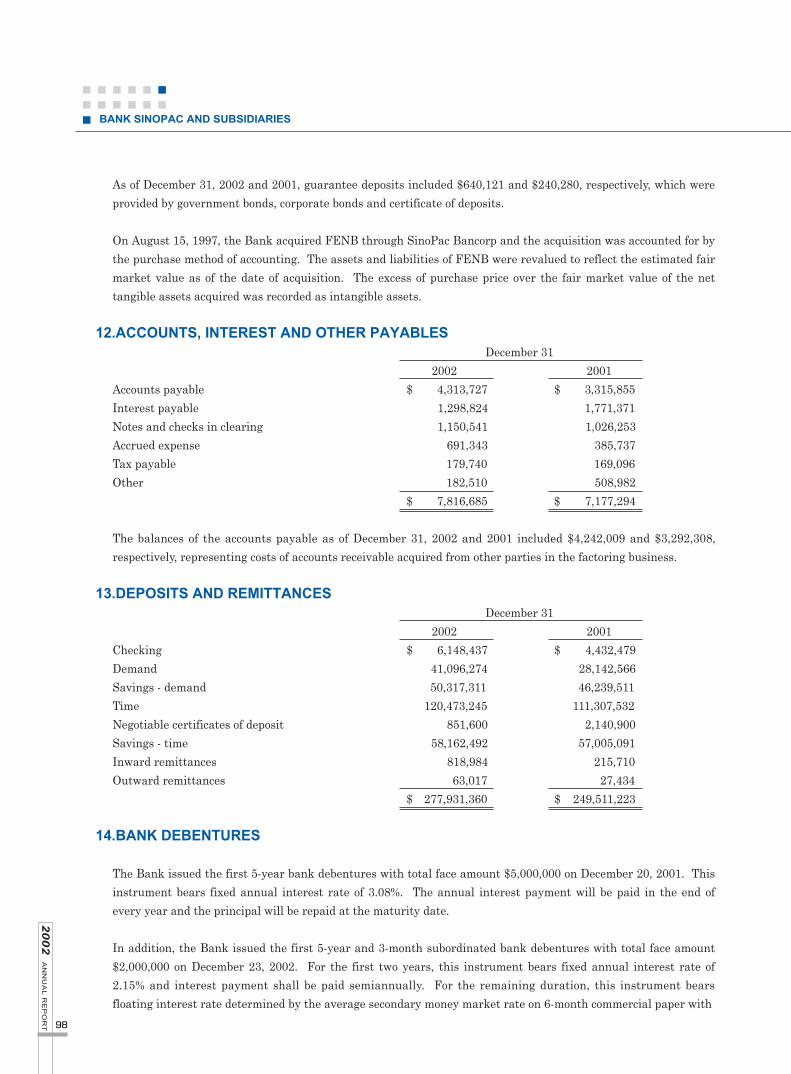
As of December 31, 2002 and 2001, guarantee deposits included $640,121 and $240,280, respectively, which were
provided by government bonds, corporate bonds and certificate of deposits.
On August 15, 1997, the Bank acquired FENB through SinoPac Bancorp and the acquisition was accounted for by
the purchase method of accounting. The assets and liabilities of FENB were revalued to reflect the estimated fair
market value as of the date of acquisition. The excess of purchase price over the fair market value of the net
tangible assets acquired was recorded as intangible assets.
12.ACCOUNTS, INTEREST AND OTHER PAYABLESDecember 31
2002 2001
Accounts payable $ 4,313,727 $ 3,315,855
Interest payable 1,298,824 1,771,371
Notes and checks in clearing 1,150,541 1,026,253
Accrued expense 691,343 385,737
Tax payable 179,740 169,096
Other 182,510 508,982
$ 7,816,685 $ 7,177,294
The balances of the accounts payable as of December 31, 2002 and 2001 included $4,242,009 and $3,292,308,
respectively, representing costs of accounts receivable acquired from other parties in the factoring business.
13.DEPOSITS AND REMITTANCESDecember 31
2002 2001
Checking $ 6,148,437 $ 4,432,479
Demand 41,096,274 28,142,566
Savings - demand 50,317,311 46,239,511
Time 120,473,245 111,307,532
Negotiable certificates of deposit 851,600 2,140,900
Savings - time 58,162,492 57,005,091
Inward remittances 818,984 215,710
Outward remittances 63,017 27,434
$ 277,931,360 $ 249,511,223
14.BANK DEBENTURES
The Bank issued the first 5-year bank debentures with total face amount $5,000,000 on December 20, 2001. This
instrument bears fixed annual interest rate of 3.08%. The annual interest payment will be paid in the end of
every year and the principal will be repaid at the maturity date.
In addition, the Bank issued the first 5-year and 3-month subordinated bank debentures with total face amount
$2,000,000 on December 23, 2002. For the first two years, this instrument bears fixed annual interest rate of
2.15% and interest payment shall be paid semiannually. For the remaining duration, this instrument bears
floating interest rate determined by the average secondary money market rate on 6-month commercial paper with

99
ww
w.b
an
ksin
op
ac.c
om
.tw
a 0.4% mark-up, as of two days prior to the interest calculation date every half year, quoted in the Telerate
information system (page 6165, 11:00 am). The principal will be repaid at the maturity date.
15.STOCKHOLDERS’ EQUITY
a.Capital surplusAccording to the Company Law, the component of capital surplus arising from issuance of shares in excess of
par value and donation can be appropriated transfer to the common stock with the approval of stockholders.
The component of capital surplus arising from issuance of shares in excess of par value can, except in the year it
arises, be distributed as stock dividends. Such distribution can be made only once a year and within other
specified limits. The foregoing restrictions are in accordance with regulations issued by the SFC.
The component of capital surplus arising from equity-accounted long-term equity investment can not be
distributed for any purpose.
b.Retained earningsThe Bank’s Articles of Incorporation provide that the Bank may declare dividends or make other distributions
from earnings after it has:
1)Applied such earnings to deficit suffered in previous years, if any;
2)Paid all outstanding taxes;
3)Set aside 30% of such earnings as legal reserve;
4)Set aside any special reserve or retained earnings allocated at its option
5)Allocated at least 1% of the remaining earnings as employee bonus.
Distribution of such earnings shall be proposed by the board of directors and approved by the shareholders.
In order to comply with the Bank’s globalization strategy, strengthen its market position, integrate its
diversified business operation and be major bank in domestic, the Bank has adopted the “Balanced Dividend
Policy”. Accordingly, dividends available for distribution is determined by reference to its Capital Adequacy
Ratio (CAR). Cash dividends declaration may be made if the Bank’s CAR is above 12% and stock dividends
may be declared if the CAR is equal to or less than 12%. However, the Bank may make a discretionary cash
distribution even if the CAR is below 12%, if approved at the stockholders’ meeting, for the purpose of
maintaining the cash dividend at a certain level in any given years.
Cash dividends and cash bonus are paid when approved by the stockholders, while the distribution of stock
dividends requires the approval of the authorities (in addition to the approval of the stockholders).
Under the Company Law, the aforementioned appropriation for legal reserve is made until the reserve equals
the aggregate par value of the outstanding capital stock of the Bank. This reserve is only used to offset a
deficit, or, when its balance reaches 50% of aggregate par value of the outstanding capital stock of the Bank, up
to 50% thereof can be distributed as stock dividends. In addition, the Banking Law provides that, before the
balance of the reserve reaches the aggregate par value of the outstanding capital stock, annual cash dividends,
remuneration to directors and supervisors and bonus to employees should not exceed 15% of aggregate par
value of the outstanding capital stock of the Bank.

BANK SINOPAC AND SUBSIDIARIES
100
20
02
AN
NU
AL
RE
PO
RT
Pursuant to the Financial Holding Company Law, the board of directors is entitled to execute the authority ofstockholders’ meeting, which is under no jurisdiction of the related regulations in the Company Law.
The appropriation of 2002 earnings has not yet been resolved by the board of directors by January 24, 2003 onwhich the date of auditors’ report. The related information regarding the proposed and resolved earningsappropriation can be referred from the SEC Market Observation Post System (M.O.P.S.) website.
On May 9, 2002, the board of directors resolved the appropriation of 2001 earnings as follows:
Legal reserve $ 456,031Remuneration to directors and supervisors 21,423Bonus to employees 139,251Cash dividends - NT$0.4782 per share 910,489
$ 1,527,194
In addition, had aforementioned remuneration to directors and supervisors and bonus to employees (included inthe appropriation of 2001 earnings) been recognized as expenses, the basic EPS (after tax) for 2001 would havebeen decreased from NT$0.81 to NT$0.72 per share.
16.TREASURY STOCK(Shares in Thousands)
Beginning EndReasons of Repurchase of Year Increase Decrease of YearFor the year ended December 31, 2002Re-issuance to employees 40,535 - 40,535 -For the year ended December 31, 2001Re-issuance to employees 16,538 23,997 - 40,535
The Bank is prohibited under the Securities and Exchange Law to acquire treasury stock in excess of 10% of thetotal shares issued and limited the purchase cost not to exceed the combined total of the retained earnings,additional paid-in capital in excess of par value, capital surplus arising from gains on disposal of properties anddonated capital. In addition, the Bank is prohibited from using the treasury stock to secure any of its obligationsand to exercise the rights of a stockholder in respect to those treasury stock.
Treasury stock of 40,535,000 shares repurchased by the Bank before the date of record for stock conversion hadbeen transferred to SPH’s stock with 41,617,816 shares. As of September 23, 2002, the aforementioned treasurystock had been transferred to employees at $11.84 dollars per share.
17.SERVICE FEESFor the Years Ended
December 31 2002 2001
Factoring and financing $ 260,717 $ 191,500Mutual funds and structured notes 231,922 148,382Custody 139,491 70,226Guarantees 94,406 104,715Loan documentation fee 56,382 43,343Index linked mortgage conversion 41,253 -Other 451,057 305,535
$ 1,275,228 $ 863,701

101
ww
w.b
an
ksin
op
ac.c
om
.tw
18.INCOME FROM SECURITIES - NETFor the Years Ended
December 31 2002 2001
Short-term billsCapital gain - net $ 105,340 $ 363,519Interest revenue 1,254,317 844,655
1,359,657 1,208,174BondsCapital gain - net 723,622 1,119,368Interest revenue 82,788 186,292Provision for decline in market value - ( 5,923)
806,410 1,299,737Stocks and beneficiary certificates Capital loss - net ( 5,420) ( 27,826)Dividends - 920
( 5,420) ( 26,906)$ 2,160,647 $ 2,481,005
19.OPERATING AND ADMINISTRATIVE EXPENSESFor the Years Ended
December 31 2002 2001
Salaries and wages $ 2,797,031 $ 2,270,616Depreciation and amortization 558,729 431,645Rental 414,177 367,137Taxes other than income tax 345,668 376,876Professional service charges 278,165 271,604Insurance 173,438 155,305Postage 100,065 109,619Other 918,335 922,017
$ 5,585,608 $ 4,904,819
20.PENSION
The Bank has a defined benefit contributory pension plan covering all regular employees. The Bank makesmonthly contributions, equal to 7% of employee salaries, to the pension fund. In addition, non-managementemployees also contribute a compulsory amount equivalent to 4% of their salaries to the fund. The employees willreceive benefits upon retirement computed based on length of services and average monthly salary uponretirement. Also, the employees will receive their cumulative contributions, if any, and the interest thereon.
a.The changes in the pension fund are summarized below:For the Years Ended
December 31 2002 2001
Balance, January 1 $ 733,237 $ 550,471Contributions 181,944 167,207Benefits paid ( 56,772) ( 39,021)Interest income 36,023 54,580Balance, December 31 $ 894,432 $ 733,237

BANK SINOPAC AND SUBSIDIARIES
102
20
02
AN
NU
AL
RE
PO
RT
The ending balances consist of:
December 31
2002 2001
Contributions by the Bank $ 549,315 $ 443,607
Contributions by employees 345,117 289,630
$ 894,432 $ 733,237
b.Net pension costs for the years ended December 31, 2002 and 2001 are summarized below:For the Years Ended
December 31
2002 2001
Service cost $ 132,201 $ 124,170
Interest cost 37,690 30,448
Expected return on plan assets ( 24,689) ( 22,774)
Net amortization and deferral 12,455 6,366
Net pension cost $ 157,657 $ 138,210
c.The reconciliations of the funded status of the plan and accrued pension cost as of December 31, 2002 and 2001 are as follows:December 31
2002 2001
Benefit obligation
Vested benefit obligation $ 85,950 $ 63,868
Nonvested benefit obligation 446,564 336,055
Accumulated benefit obligation 532,514 399,923
Additional benefits based on future salaries 376,387 361,884
Projected benefit obligation 908,901 761,807
Fair value of plan assets ( 549,315) ( 443,607)
Funded status 359,586 318,200
Unrecognized net transition obligation ( 39,819) ( 44,796)
Unrecognized prior service cost ( 812) ( 940)
Unrecognized pension loss ( 242,681) ( 237,882)
Accrued pension cost $ 76,274 $ 34,582
d.Vested benefit $ 180,274 $ 139,714
e.Actuarial assumptions1)Discount rate used in determining present values 4.0% 5.0%
2)Future salary increase rate 4.0% 5.0%
3)Expected rate of return on plan assets 4.0% 5.0%
FENB has a pension plan for regular employees who have been employed for at least one year. According to
this plan, employees may contribute up to 15% of their annual salary with FENB matching up to 3% of the
employee’s contribution. Management of the Bank believes that there would be no significant adjustments that
have to be made to the consolidated financial statements if FENB accrued its pension liability and pension cost
according to the actuary’s report.

103
ww
w.b
an
ksin
op
ac.c
om
.tw
21.INCOME TAXa.The compositions of income tax are as follows:
For the Years EndedDecember 31
2002 2001 Currently payable $ 411,820 $ 249,408Seperation taxes on short-term bills interest income 242,697 177,042Foreign income taxes over limitation 27,863 -Change in deferred income taxes 43,184 120,797Prior year’s adjustment ( 9,620) ( 27,029) Tax on unappropriated earnings (10%) 65,876 28,964Withholding tax on bonds interest income attributable to period that those bonds were held by other investors - 115,349
Income tax $ 781,820 $ 664,531
Income tax is based on taxable income from all sources. Foreign income taxes paid are creditable against thedomestic income tax obligations to the extent of domestic income tax applicable to the foreign-source income.
b.Reconciliations of tax on pretax income at statutory rate and currently income tax payable are as follows:
For the Years EndedDecember 31
2002 2001Tax on pretax income at statutory rate $ 963,936 $ 668,913Deduct tax effects of:
Tax-exempt income ( 43,499) ( 103,800)Permanent difference ( 480,714) ( 248,203)Temporary difference ( 19,992) ( 60,013) Investment tax credit ( 7,911) ( 7,489)
Currently payable $ 411,820 $ 249,408
c.Net deferred income tax assets (liabilities) of Bank SinoPac and SinoPac Bancorp as of December 31, 2002 and 2001
consist of the tax effects of the following:
December 31 2002 2001
Bank SinoPacInvestment income under the equity method ($ 311,778) ($ 228,894)Unrealized foreign exchange gain ( 6,971) ( 3,554)Other 373 24,622Deferred income tax - liabilities - net
(included in other liabilities) ($ 318,376) ($ 207,826)
SinoPac BancorpGoodwill amortization ($ 91,608) ($ 89,131)Deferred loan fees ( 150,706) ( 115,972)Provision for credit losses 258,793 109,515Other 9,360 54,061Deferred income tax assets (liabilities) - net $ 25,839 ($ 41,527)

BANK SINOPAC AND SUBSIDIARIES
104
20
02
AN
NU
AL
RE
PO
RT
d.The related information under the Integrated Income Tax System is as follows:
December 31
2002 2001
Balances of imputed tax credit account $ 191,766 $ 142,411
The projected ratio of imputed tax credit to earnings for 2002 is 10.55%, which is based on projected imputed
tax credit before dividend distribution in 2003.
The actual ratio of imputed tax credit to earnings for 2001 was 12.67%.
The tax credit allocated to stockholders are based on the balance of Imputation Credit Account (ICA) on the
dividend distribution date. Accordingly, 2002 projected tax credit ratio may change because the actual tax
credit may differ from the projected tax credit.
e.Income tax payable (included in other payables) as of December 31, 2002 and 2001 were net of prepayments of
$462,118 and $271,225, respectively. Income tax returns of up to 2000 had been examined by the taxauthorities except 1996 and 1999. As a result of those examination, in the income tax returns for 1994, 1995,1997, 1998 and 2000 tax returns, the tax authorities had denied the creditability of 10% withholding tax onbonds interest income totaling $69,766 attributable to period that those bonds were held by other investors.The Bank had appealed the decision of the tax authorities to deny the creditability of those type of withholdingtaxes. Pursuant to the decision made by the supreme court on the tax controversy, the original reinvestigationresult and decision made on the tax controversy regarding the tax return for 1994 shall be rescinded and otherproper judgment shall be made by the tax authority. The income tax returns for 1996, 1999 and 2001 alsoreflected reduction in income tax obligations totaling $41,443 attributable to similar type of withholding taxes;which returns were not yet examined by the tax authorities. However, the Bank had accrued liabilities andwritten-off any assets recognized related to the foregoing withholding taxes totaling $111,209 as a part ofincome tax expense in 2001.
22.EARNINGS PER SHARE
The numerators and denominators used in computing earnings per share (EPS) are summarized as follows:
Numerator (Amounts) Denominator EPS (NT$)
Pre-tax After tax (Shares in Thousands) Pre-tax After taxFor the year ended December 31, 2002Basic EPS
Net income belongs to stockholders of common stock $ 3,036,869 $ 2,255,049 1,914,968 $ 1.59 $ 1.18
For the year ended December 31, 2001Basic EPS
Net income belongs to stockholders of common stock $ 2,215,657 $ 1,551,126 1,919,570 $ 1.05 $ 0.81
105
ww
w.b
an
ksin
op
ac.c
om
.tw
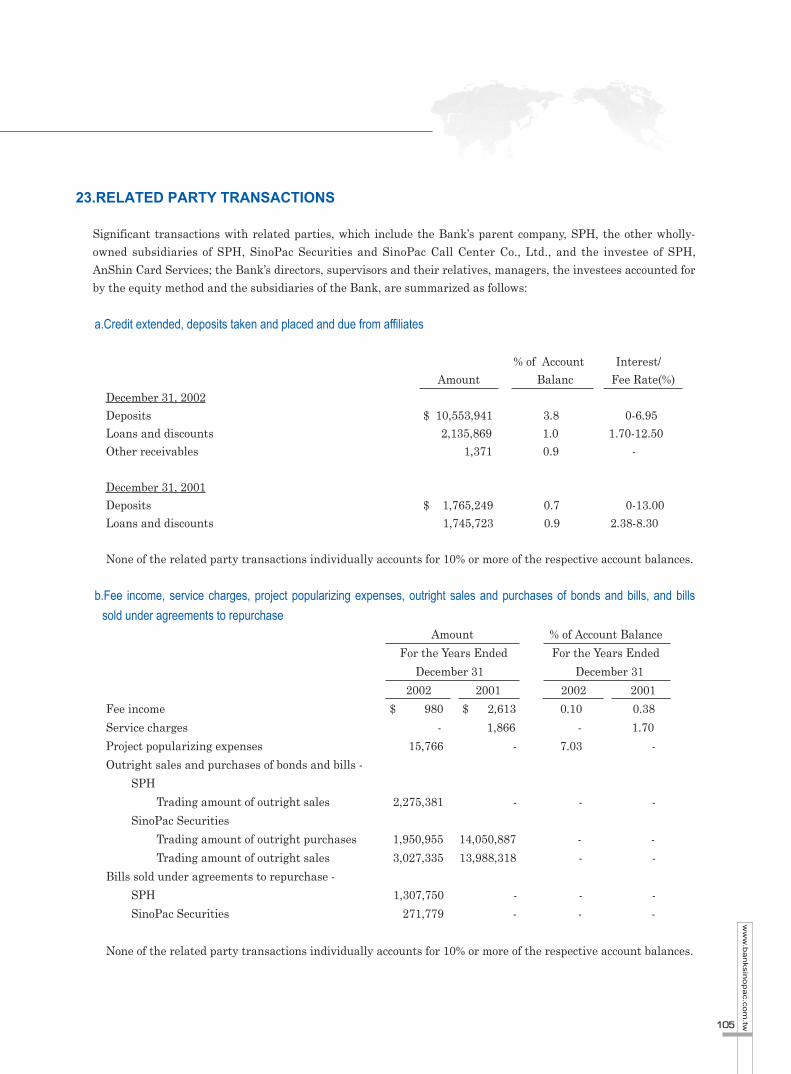
23.RELATED PARTY TRANSACTIONS
Significant transactions with related parties, which include the Bank’s parent company, SPH, the other wholly-owned subsidiaries of SPH, SinoPac Securities and SinoPac Call Center Co., Ltd., and the investee of SPH,AnShin Card Services; the Bank’s directors, supervisors and their relatives, managers, the investees accounted forby the equity method and the subsidiaries of the Bank, are summarized as follows:
a.Credit extended, deposits taken and placed and due from affiliates
% of Account Interest/Amount Balanc Fee Rate(%)
December 31, 2002Deposits $ 10,553,941 3.8 0-6.95 Loans and discounts 2,135,869 1.0 1.70-12.50Other receivables 1,371 0.9 -
December 31, 2001Deposits $ 1,765,249 0.7 0-13.00Loans and discounts 1,745,723 0.9 2.38-8.30
None of the related party transactions individually accounts for 10% or more of the respective account balances.
b.Fee income, service charges, project popularizing expenses, outright sales and purchases of bonds and bills, and bills
sold under agreements to repurchaseAmount % of Account Balance
For the Years Ended For the Years Ended
December 31 December 31
2002 2001 2002 2001
Fee income $ 980 $ 2,613 0.10 0.38
Service charges - 1,866 - 1.70
Project popularizing expenses 15,766 - 7.03 -
Outright sales and purchases of bonds and bills -
SPH
Trading amount of outright sales 2,275,381 - - -
SinoPac Securities
Trading amount of outright purchases 1,950,955 14,050,887 - -
Trading amount of outright sales 3,027,335 13,988,318 - -
Bills sold under agreements to repurchase -
SPH 1,307,750 - - -
SinoPac Securities 271,779 - - -
None of the related party transactions individually accounts for 10% or more of the respective account balances.

BANK SINOPAC AND SUBSIDIARIES
106
20
02
AN
NU
AL
RE
PO
RT
c.LeaseThe Bank leases certain office premises from China Television Co., Ltd. (the Bank is a director of China
Television Co., Ltd.) with rental paid monthly for a three-year period ending July 2004. Rentals for the years
ended December 31, 2002 and 2001 were $9,950 and $4,422, respectively.
The Bank leases certain office premises from Su Kwang Hui (son of a director of the Bank before April 18, 2001)
with rental paid monthly for a five-year period ending December 2003. Rentals for the years ended December
31, 2002 and 2001 were $6,476 and $6,286, respectively.
The Bank leases certain office premises from SinoPac Securities for the year ended December 2002. Rentals
were paid at the end of the year. Rentals for the year ended December 31, 2002 was $8,291.
The Bank leases certain office premises to SinoPac Securities Co., Ltd. (formerly SPS) with rental paid monthly
for a seven-year period ending July 2006. Rentals received for the years ended December 31, 2002 and 2001
were $1,554 and $1,684, respectively.
The Bank leases certain office premises from Ruentex Construction & Development Co., Ltd. (an affiliate) with
rental paid monthly for a five-year period ending September 2005. Rentals for the years ended December 31,
2002 and 2001 were $3,196 and $3,842, respectively.
The Bank leases an office premise from Hung-Guan Real Estate Development Corporation. Since the said
property had been purchased by SinoPac Leasing Corporation (SPL, a subsidiary of the Bank), rights on the
remaining term of the related lease agreement was assigned to SPL until July 2002. Rentals paid monthly to
SPL for the years ended December 31, 2002 and 2001 were $6,664 and $4,060, respectively.
d.Guarantee and securities purchasedAs of December 31, 2002 and 2001, the Bank had provided guarantees on commercial papers issued by Wal
Tech International Corporation (an affiliate), SinoPac Securities and Fortune Investment Co., Ltd. (a substance
related party). The aggregate face value are as follows:
December 31
2002 2001
Wal Tech International $ 168,000 $ 35,000
SinoPac Securities 48,000 -
Fortune Investment 19,000 -
$ 235,000 $ 35,000
Guarantees on Wal Tech International are collateralized by the following assets provided by SPL, Wal Tech
International Corporation and Grand Capital International Limited:
December 31
2002 2001
Properties - carrying value $ 1,551,724 $ 1,142,935
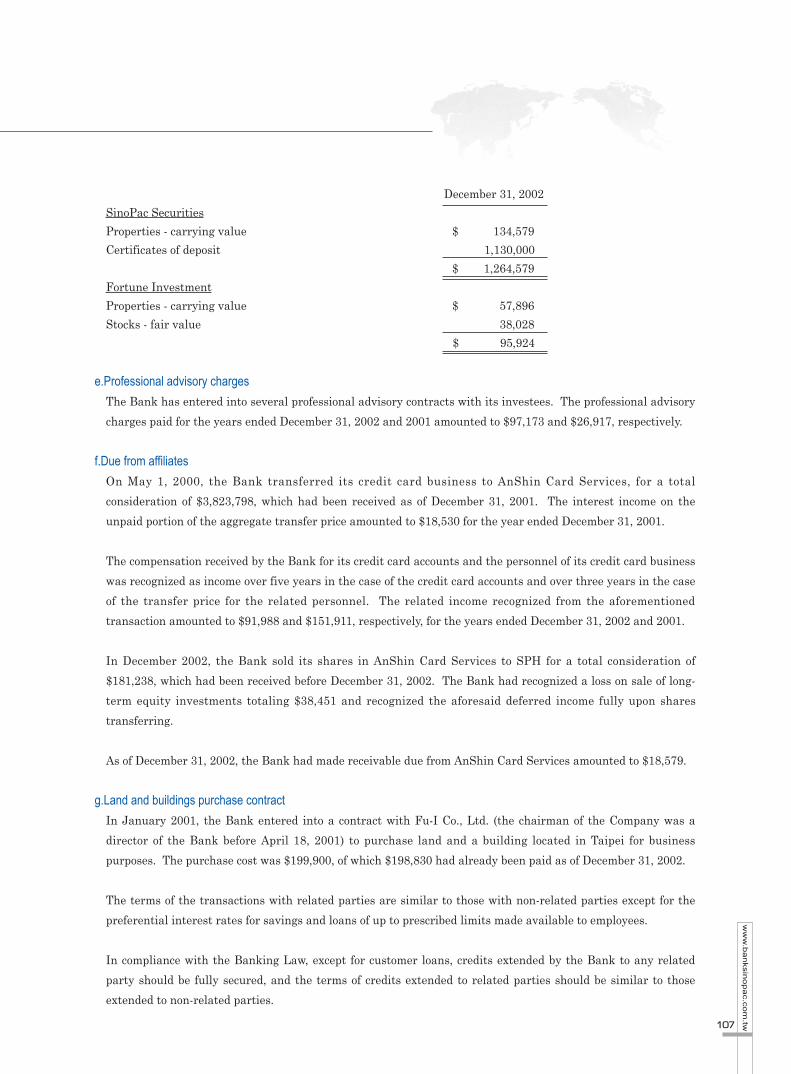
Guarantees on SinoPac Securities and Fortune Investment Co., Ltd. are collateralized by the followings:
107
ww
w.b
an
ksin
op
ac.c
om
.tw
December 31, 2002
SinoPac Securities
Properties - carrying value $ 134,579
Certificates of deposit 1,130,000
$ 1,264,579
Fortune Investment
Properties - carrying value $ 57,896
Stocks - fair value 38,028
$ 95,924
e.Professional advisory charges
The Bank has entered into several professional advisory contracts with its investees. The professional advisory
charges paid for the years ended December 31, 2002 and 2001 amounted to $97,173 and $26,917, respectively.
f.Due from affiliates
On May 1, 2000, the Bank transferred its credit card business to AnShin Card Services, for a total
consideration of $3,823,798, which had been received as of December 31, 2001. The interest income on the
unpaid portion of the aggregate transfer price amounted to $18,530 for the year ended December 31, 2001.
The compensation received by the Bank for its credit card accounts and the personnel of its credit card business
was recognized as income over five years in the case of the credit card accounts and over three years in the case
of the transfer price for the related personnel. The related income recognized from the aforementioned
transaction amounted to $91,988 and $151,911, respectively, for the years ended December 31, 2002 and 2001.
In December 2002, the Bank sold its shares in AnShin Card Services to SPH for a total consideration of
$181,238, which had been received before December 31, 2002. The Bank had recognized a loss on sale of long-
term equity investments totaling $38,451 and recognized the aforesaid deferred income fully upon shares
transferring.
As of December 31, 2002, the Bank had made receivable due from AnShin Card Services amounted to $18,579.
g.Land and buildings purchase contract
In January 2001, the Bank entered into a contract with Fu-I Co., Ltd. (the chairman of the Company was a
director of the Bank before April 18, 2001) to purchase land and a building located in Taipei for business
purposes. The purchase cost was $199,900, of which $198,830 had already been paid as of December 31, 2002.
The terms of the transactions with related parties are similar to those with non-related parties except for the
preferential interest rates for savings and loans of up to prescribed limits made available to employees.
In compliance with the Banking Law, except for customer loans, credits extended by the Bank to any related
party should be fully secured, and the terms of credits extended to related parties should be similar to those
extended to non-related parties.

BANK SINOPAC AND SUBSIDIARIES
108
20
02
AN
NU
AL
RE
PO
RT
24.CONTINGENCIES AND COMMITMENTS
In addition to financial instruments disclosed in Note 28, contingencies and commitments of the Bank aresummarized as follows:
a.Lease contract
The Bank leases certain office premises under several contracts for various periods ranging from one year toseven years, with rentals paid monthly, quarterly or semi-annually. Future rentals for the next five years areas follows:
Year Amount2003 $ 306,3882004 288,5102005 195,5132006 169,7702007 129,945
Rentals for the years beyond 2007 amount to $176,764, the present value of which is about $132,380 asdiscounted at the Bank’s one-year time deposit rate from 1.5% to 5.1% on January 1, 2003.
b.Land and buildings purchase contract
In January 2001, the Bank entered into contracts to purchased land and buildings located in Taipei for businesspurposes. The purchase cost was $199,900, of which $198,830 had already been paid as of December 31, 2002.(Please see Note 23.g)
c.Equipment purchase contract
The Bank entered into contracts to purchase computer hardware and software for $115,910, of which $66,882had already been paid as of December 31, 2002.
d.Renovation agreementThe Bank entered into contracts to renovate office premises for $66,626, of which $54,964 has already been paid
as of December 31, 2002.
e.Short-term bills and bonds sold under agreements to repurchase - treated as outright salesAs of December 31, 2002, short-term bills and bonds with a total face value of $12,292,400 were sold under
agreements to repurchase at $12,590,329 between January and April 2003.
f.Short-term bills purchased under agreements to resell - treated as outright purchasesAs of December 31, 2002, short-term bills with a total face value of $285,000 were purchased under agreements
to resell at $284,014 between January and February 2003.
g.Balance sheet and trust property of trust accountsBALANCE SHEET OF TRUST ACCOUNTS
December 31, 2002
Trust Assets Trust Liabilities
$ 40,808,630 $ 40,808,630
109
ww
w.b
an
ksin
op
ac.c
om
.tw
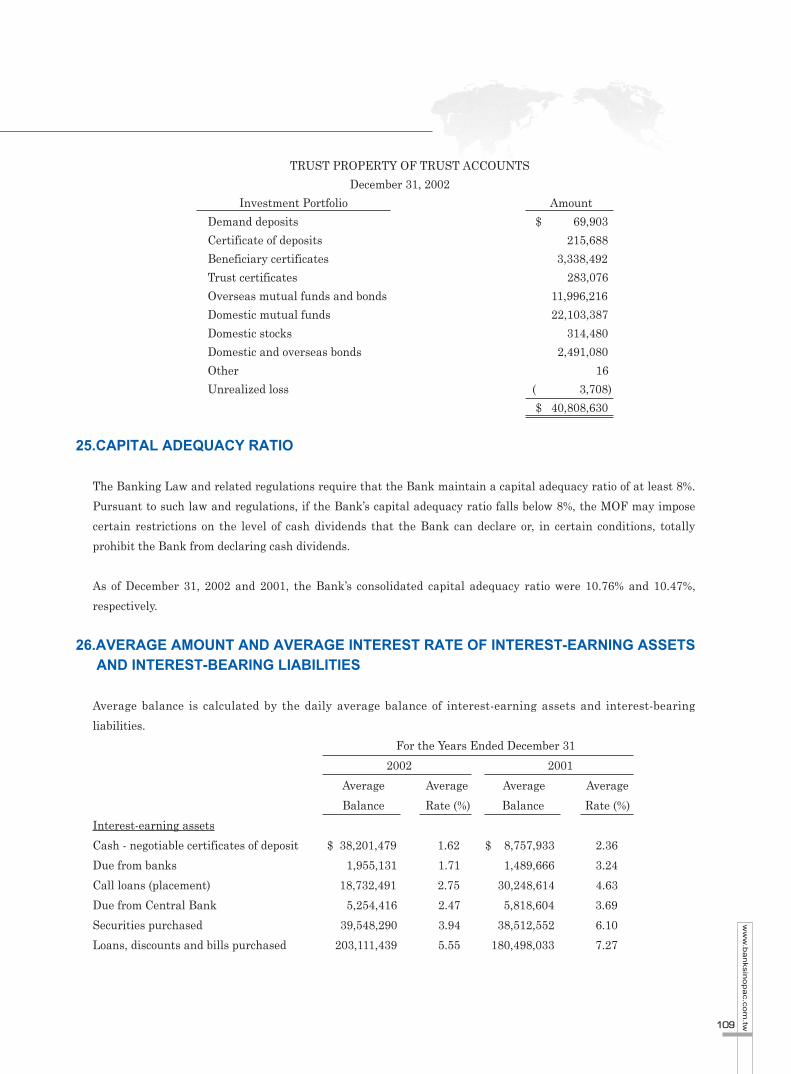
TRUST PROPERTY OF TRUST ACCOUNTS
December 31, 2002
Investment Portfolio Amount
Demand deposits $ 69,903
Certificate of deposits 215,688
Beneficiary certificates 3,338,492
Trust certificates 283,076
Overseas mutual funds and bonds 11,996,216
Domestic mutual funds 22,103,387
Domestic stocks 314,480
Domestic and overseas bonds 2,491,080
Other 16
Unrealized loss ( 3,708)
$ 40,808,630
25.CAPITAL ADEQUACY RATIO
The Banking Law and related regulations require that the Bank maintain a capital adequacy ratio of at least 8%.
Pursuant to such law and regulations, if the Bank’s capital adequacy ratio falls below 8%, the MOF may impose
certain restrictions on the level of cash dividends that the Bank can declare or, in certain conditions, totally
prohibit the Bank from declaring cash dividends.
As of December 31, 2002 and 2001, the Bank’s consolidated capital adequacy ratio were 10.76% and 10.47%,
respectively.
26.AVERAGE AMOUNT AND AVERAGE INTEREST RATE OF INTEREST-EARNING ASSETSAND INTEREST-BEARING LIABILITIES
Average balance is calculated by the daily average balance of interest-earning assets and interest-bearing
liabilities.
For the Years Ended December 31
2002 2001
Average Average Average Average
Balance Rate (%) Balance Rate (%)
Interest-earning assets
Cash - negotiable certificates of deposit $ 38,201,479 1.62 $ 8,757,933 2.36
Due from banks 1,955,131 1.71 1,489,666 3.24
Call loans (placement) 18,732,491 2.75 30,248,614 4.63
Due from Central Bank 5,254,416 2.47 5,818,604 3.69
Securities purchased 39,548,290 3.94 38,512,552 6.10
Loans, discounts and bills purchased 203,111,439 5.55 180,498,033 7.27
BANK SINOPAC AND SUBSIDIARIES
110
20
02
AN
NU
AL
RE
PO
RT
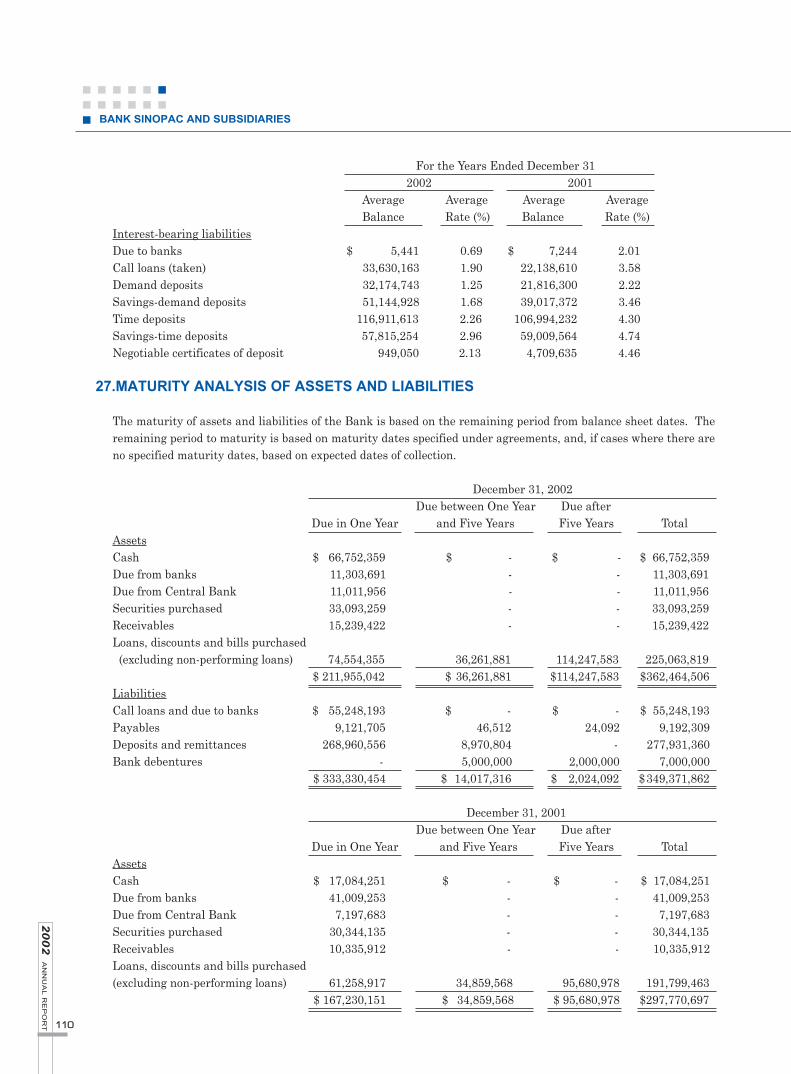
For the Years Ended December 31 2002 2001
Average Average Average Average Balance Rate (%) Balance Rate (%)
Interest-bearing liabilitiesDue to banks $ 5,441 0.69 $ 7,244 2.01Call loans (taken) 33,630,163 1.90 22,138,610 3.58 Demand deposits 32,174,743 1.25 21,816,300 2.22Savings-demand deposits 51,144,928 1.68 39,017,372 3.46Time deposits 116,911,613 2.26 106,994,232 4.30Savings-time deposits 57,815,254 2.96 59,009,564 4.74Negotiable certificates of deposit 949,050 2.13 4,709,635 4.46
27.MATURITY ANALYSIS OF ASSETS AND LIABILITIES
The maturity of assets and liabilities of the Bank is based on the remaining period from balance sheet dates. Theremaining period to maturity is based on maturity dates specified under agreements, and, if cases where there areno specified maturity dates, based on expected dates of collection.
December 31, 2002Due between One Year Due after
Due in One Year and Five Years Five Years TotalAssetsCash $ 66,752,359 $ - $ - $ 66,752,359Due from banks 11,303,691 - - 11,303,691Due from Central Bank 11,011,956 - - 11,011,956Securities purchased 33,093,259 - - 33,093,259Receivables 15,239,422 - - 15,239,422 Loans, discounts and bills purchased (excluding non-performing loans) 74,554,355 36,261,881 114,247,583 225,063,819
$ 211,955,042 $ 36,261,881 $114,247,583 $362,464,506LiabilitiesCall loans and due to banks $ 55,248,193 $ - $ - $ 55,248,193Payables 9,121,705 46,512 24,092 9,192,309Deposits and remittances 268,960,556 8,970,804 - 277,931,360Bank debentures - 5,000,000 2,000,000 7,000,000
$ 333,330,454 $ 14,017,316 $ 2,024,092 $349,371,862
December 31, 2001Due between One Year Due after
Due in One Year and Five Years Five Years TotalAssetsCash $ 17,084,251 $ - $ - $ 17,084,251Due from banks 41,009,253 - - 41,009,253Due from Central Bank 7,197,683 - - 7,197,683Securities purchased 30,344,135 - - 30,344,135Receivables 10,335,912 - - 10,335,912Loans, discounts and bills purchased (excluding non-performing loans) 61,258,917 34,859,568 95,680,978 191,799,463
$ 167,230,151 $ 34,859,568 $ 95,680,978 $297,770,697
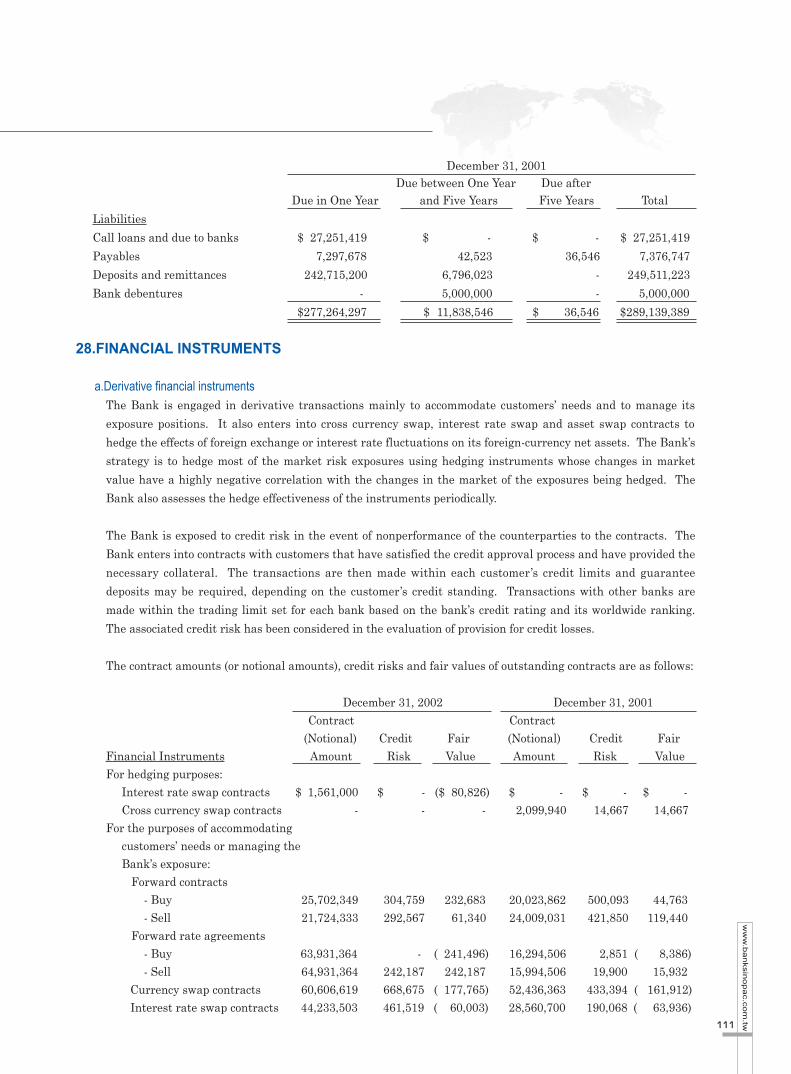
111
ww
w.b
an
ksin
op
ac.c
om
.tw
December 31, 2001Due between One Year Due after
Due in One Year and Five Years Five Years Total
Liabilities
Call loans and due to banks $ 27,251,419 $ - $ - $ 27,251,419
Payables 7,297,678 42,523 36,546 7,376,747
Deposits and remittances 242,715,200 6,796,023 - 249,511,223
Bank debentures - 5,000,000 - 5,000,000
$277,264,297 $ 11,838,546 $ 36,546 $289,139,389
28.FINANCIAL INSTRUMENTS
a.Derivative financial instrumentsThe Bank is engaged in derivative transactions mainly to accommodate customers’ needs and to manage its
exposure positions. It also enters into cross currency swap, interest rate swap and asset swap contracts to
hedge the effects of foreign exchange or interest rate fluctuations on its foreign-currency net assets. The Bank’s
strategy is to hedge most of the market risk exposures using hedging instruments whose changes in market
value have a highly negative correlation with the changes in the market of the exposures being hedged. The
Bank also assesses the hedge effectiveness of the instruments periodically.
The Bank is exposed to credit risk in the event of nonperformance of the counterparties to the contracts. The
Bank enters into contracts with customers that have satisfied the credit approval process and have provided the
necessary collateral. The transactions are then made within each customer’s credit limits and guarantee
deposits may be required, depending on the customer’s credit standing. Transactions with other banks are
made within the trading limit set for each bank based on the bank’s credit rating and its worldwide ranking.
The associated credit risk has been considered in the evaluation of provision for credit losses.
The contract amounts (or notional amounts), credit risks and fair values of outstanding contracts are as follows:
December 31, 2002 December 31, 2001Contract Contract
(Notional) Credit Fair (Notional) Credit Fair Financial Instruments Amount Risk Value Amount Risk ValueFor hedging purposes:
Interest rate swap contracts $ 1,561,000 $ - ($ 80,826) $ - $ - $ -Cross currency swap contracts - - - 2,099,940 14,667 14,667
For the purposes of accommodatingcustomers’ needs or managing the Bank’s exposure:
Forward contracts - Buy 25,702,349 304,759 232,683 20,023,862 500,093 44,763- Sell 21,724,333 292,567 61,340 24,009,031 421,850 119,440
Forward rate agreements- Buy 63,931,364 - ( 241,496) 16,294,506 2,851 ( 8,386)- Sell 64,931,364 242,187 242,187 15,994,506 19,900 15,932
Currency swap contracts 60,606,619 668,675 ( 177,765) 52,436,363 433,394 ( 161,912)Interest rate swap contracts 44,233,503 461,519 ( 60,003) 28,560,700 190,068 ( 63,936)

BANK SINOPAC AND SUBSIDIARIES
112
20
02
AN
NU
AL
RE
PO
RT
December 31, 2002 December 31, 2001
Value of Value of
Contract Options Contract Options
(Notional) Credit Purchased (Notional) Credit Purchased
Financial Instrument Amount Risk / Written Amount Risk / Written
For the purposes of accommodating
customers’ needs or managing the
Bank’s exposure:
Options
- As buyer $ 50,020,459 $ 578,594 $1,215,070 $30,632,833 $369,608 $780,838
- As seller 50,785,417 - 1,210,393 29,782,357 - 777,766
The fair value of each contract is determined using the quotation from Reuters or Telerate Information System.
As of December 31, 2002 and 2001, the Bank entered into asset swap contracts for hedging purpose in which
the notional amounts were $4,830,283 and $1,572,855, respectively. The Bank entered into these contracts with
counterparties that have splendid worldwide ranking and credit rating, thus, no significant credit risk is
expected.
The Bank has entered into certain derivative financial contracts in which the notional amounts are used solely
as a basis for calculating the amounts receivable and payable under the contracts. Thus, the notional amounts
do not represent the actual cash inflows or outflows. The possibility that derivative financial instruments held
or issued by the Bank can not be sold at reasonable price is remote; accordingly, no significant cash demand is
expected.
The gains and losses on derivative financial instruments for the years ended December 31, 2002 and 2001 are
as follows:
For the Years Ended
December 31
Account 2002 2001
For hedging purposes:
Cross currency swap contracts Interest revenue $ 31,690 $ 107,409
- Realized Interest expense ( 14,425) ( 94,606)
For the purposes of accommodating
customers’ needs or managing the
Bank’s exposure:
Forward contracts
- Realized Foreign exchange gain 128,377 8,012
- Unrealized Foreign exchange gain 358,774 73,289
Forward rate agreements
- Realized Income from derivative
financial transactions 10,033 2,836
- Unrealized Income (loss) from
derivative financial
transactions ( 6,855) 7,546

113
ww
w.b
an
ksin
op
ac.c
om
.tw
For the Years Ended
December 31
Account 2002 2001
Currency swap contracts
- Realized Interest revenue $ 368,811 $ 156,442
Interest expense ( 402,643) ( 146,167)
Interest rate swap contracts
- Realized Interest revenue 571,601 108,169
Interest expense ( 627,702) ( 109,954)
- Unrealized Income (loss) from
derivative financial
transactions 17,263 ( 77,266)
Options contracts
- Realized Income from derivative
financial transactions 268,438 126,853
Foreign exchange loss ( 48,152) ( 11,384)
- Unrealized Income from derivative
financial transactions 17,007 20,910
Interest rate futures contracts
- Realized Loss from derivative
financial transactions ( 3,423) -
Cross currency swap contracts
- Realized Interest revenue - 2,517
Interest expense - ( 3,070)
b.Fair value of non-derivative financial instrumentsDecember 31
2002 2001
Carrying Carrying
Amount Fair Value Amount Fair ValueAssetsFinancial assets - with fair values
approximating carrying amounts $ 104,194,554 $104,194,554 $ 75,561,956 $ 75,561,956Securities purchased 33,093,259 33,491,086 30,343,326 30,625,033Loans, discounts and bills purchased 225,169,615 225,169,615 192,230,478 192,230,478Long-term equity investments 4,264,206 4,264,206 7,338,179 7,338,179Long-term bond investments 346,309 353,647 - -Other assets - guarantee deposits 979,952 986,251 680,353 681,148

BANK SINOPAC AND SUBSIDIARIES
114
20
02
AN
NU
AL
RE
PO
RT
December 31
2002 2001
Carrying Carrying
Amount Fair Value Amount Fair ValueLiabilitiesFinancial liabilities - with fair values
approximating carrying amounts $ 64,440,502 $ 64,440,502 $ 34,628,166 $ 34,628,166Deposits and remittances 277,931,360 277,931,360 249,511,223 249,511,223Bank debentures 7,000,000 7,000,000 5,000,000 5,000,000Other liabilities 104,463 104,463 77,178 77,178
Methods and assumptions applied in estimating the fair values of non-derivative financial instruments are asfollows:
1)The carrying amounts of cash, due from banks, due from Central Bank, acceptances, receivables, call loansand due to banks, acceptances payable and payables approximate their fair values because of the shortmaturities of these instruments.
2)The fair values of securities purchased, long-term equity investments and long-term bond investments arebased on their market prices, if such market prices are available. Otherwise, fair values are estimated attheir carrying amounts.
3)Loans, discounts and bills purchased, deposits and remittances, bank debentures and funds received forsubloans are interest-earning assets and interest-bearing liabilities. Thus, their carrying amounts representfair values. Fair value of non-performing loans is based on the carrying amount, which is net of allowance forcredit losses.
4)The fair values of government bonds and corporate bonds submitted as guarantee deposits are based onmarket values while those submitted as certificates of deposits are estimated at their carrying amounts. Fairvalues of other guarantee deposits and guarantee deposits received are estimated at their carrying amountsince such deposits do not have specific due dates.
Certain financial instruments and all nonfinancial instruments are excluded from disclosure of fair value.Accordingly, the aggregate fair values presented above do not represent the underlying values of the Bank.
c.Off-balance-sheet credit risksThe Bank has significant credit commitments principally relating to customer financing activities. The terms ofmost of the credit commitments are under seven years. For the year ended December 31, 2002, the interestrates of the loans range from 0.38% to 12.75%. The Bank also issues financial guarantees and standby lettersof credit to guarantee the performance of customer obligations to a third party. The terms of these guaranteesare usually one year, and their maturity dates are not concentrated in any particular period.
The contract amounts of financial instruments with off-balance-sheet credit risks as of December 31, 2002 and2001 are as follows:
December 31 2002 2001
Irrevocable loan commitments $ 14,310,438 $ 10,031,483Financial guarantees and standby letters of credit 10,113,474 11,379,004Credit card commitments for credit cards 58,507 53,765

115
ww
w.b
an
ksin
op
ac.c
om
.tw
Since most of the commitments are expected to expire without being drawn upon, the total commitmentamounts do not necessarily represent future cash demands. The Bank’s maximum credit risk relative to thesecommitments is the amount of the commitment assuming that the customer uses the full amount of thecommitment and the related collateral or the security turn out to be worthless.
The Bank makes credit commitments and issues financial guarantees and standby letters of credit only aftercareful evaluation of customers’ credit standing. Based on the result of the credit evaluation, the Bank mayrequire collateral before drawings are made against the credit facilities. As of December 31, 2002 and 2001,secured loans amounted to about 79% and 81%, respectively, of the total loans. Collaterals held vary but mayinclude cash, inventories, marketable securities, and other properties. When the customers default, the Bank will,as required by circumstances foreclose the collateral or execute other rights arising out of the guarantees given.
29.INFORMATION ON CONCENTRATIONS OF RISK
The Bank has no credit risk concentration arising from any individual counterparty or groups of counterpartiesengaged in similar business activities. Industries which account for 5% or more of the outstanding loans as ofDecember 31, 2002 and 2001 are as follows:
December 31 2002 2001
Natural person $ 136,867,030 $ 123,710,167Foreign corporation 25,639,592 19,091,036 Real estate 23,449,870 16,153,900Manufacturing 15,510,637 11,489,773
The net positions on foreign-currency transactions as of December 31, 2002 and 2001 are insignificant.
30.ADDITIONAL DISCLOSURES
a.Following are the additional disclosures required by the SFC for the Bank and affiliates:(Please see Financial Report of
Bank SinoPac’s Table l~Table 5).
1)Financing provided: Please see Table 1;
2)Collateral/guarantee provided: Please see Table 2;
3)Marketable securities held: Please see Table 3;
4)Marketable security acquired and disposed of, at costs or prices of at least NT$100 million or 20% of the
issued capital: Please see Table 4;
5)Acquisition of individual real estate at cost of at least NT$100 million or 20% of the issued capital: None;
6)Disposal of individual real estates at price of at least NT$100 million or 20% of the issued capital: None;
7)Total purchase from or sales or related parties amounting to at least NT$100 million or 20% of the issuedcapital: Not applicable;

BANK SINOPAC AND SUBSIDIARIES
116
20
02
AN
NU
AL
RE
PO
RT
8)Receivables from related parties amounting to NT$100 million or 20% of the issued capital: None;
9)Names, locations, and other information of investees on which the Bank exercises significant influences:
Please see Table 5;
10)Derivative instrument transactions: Please see Note 28;
b.Information Related to Investment in Mainland China: None.
31.SEGMENT AND GEOGRAPHIC INFORMATION
The Bank is engaged only in banking activities as prescribed by the Banking Law and has no single customer thataccounts for 10% or more of the Bank’s operating revenues. Geographic information is as follows:
Adjustments andDomestic United States Eliminations Total
For the year ended December 31, 2002Revenues from third parties $ 14,323,107 $ 3,348,087 $ - $ 17,671,194Segment income $ 2,101,047 $ 758,565 $ - $ 2,859,612Investment income under the
equity method 177,257Income before income tax $ 3,036,869
December 31, 2002Identifiable assets $315,193,433 $ 59,020,970 ($ 220,368) $373,994,035Long-term equity investments -
the equity method 3,029,381Total assets $377,023,416
For the year ended December 31, 2001Revenues from third parties $ 16,106,888 $ 3,447,982 $ - $ 19,554,870Segment income $ 2,031,117 $ 445,880 $ - $ 2,476,997Investment loss under the equity method ( 261,340)Income before income tax $ 2,215,657
December 31, 2001Identifiable assets $262,759,902 $ 46,365,585 ($ 448,199) $308,677,288Long-term equity investments -
the equity method 5,963,926Total assets $ 314,641,214

117
ww
w.b
an
ksin
op
ac.c
om
.tw
Note:Based on financials of Bank SinoPac only, not consolidated figures.
Six-year Financial Ratios of Bank SinoPac
ltem / year
Total Liabilities / Total Assets
Deposits / Equity
Fixed Assets / Equity
Liquidity Reserve Ratio
Loans / Deposits
Past Due Ratio
Interest Expenses / Average Deposits
Interest Revenues / Average Loans
Turnover of Total Assets
Revenues Per Employee(In NT$ thousands)
Net Profit Per Employee (In NT$ thousands)
Return on Total Assets
Return on Equity
Operating Revenues / Capital Stock
Net Profit Before Tax / Capital Stock
Net Profit Rate
Earnings Per Share
2002
92.44%
940.62%
19.18%
32.17%
80.18%
1.73%
2.16%
5.53%
0.05
7,144
1,064
0.74%
9.33%
13.63%
14.20%
14.89%
1.18
2001
91.62%
932.05%
20.29%
15.03%
77.48%
1.80%
4.01%
7.13%
0.06
9,161
868
0.60%
6.82%
9.52%
10.37%
9.48%
0.81
2000
90.58%
898.66%
19.78%
12.46%
78.65%
1.04%
4.90%
8.00%
0.07
9,272
980
0.77%
7.92%
12.60%
12.84%
10.75%
0.88
1999
89.81%
788.67%
20.83%
13.10%
82.38%
0.99%
5.34%
8.29%
0.08
9,268
1,091
0.90%
8.89%
12.75%
12.75%
11.77%
0.92
1998
89.83%
824.84%
19.63%
20.45%
75.22%
0.70%
6.17%
8.90%
0.08
11,098
785
0.55%
5.72%
8.55%
8.63%
7.07%
0.52
1997
90.87%
880.75%
15.99%
13.08%
82.72%
0.61%
5.79%
8.83%
0.08
11,437
1,219
0.84%
8.82%
12.41%
12.62%
10.65%
0.64
SIX-YEAR FINANCIAL RATIOS OF Bank SinoPac


120
20
02
AN
NU
AL
RE
PO
RT
Key Economic Indicators
ltem Economic Growth
1.Economic Growth Rate 2.GNP 3.Per capital GNP 4.Structure of domestic production
Agriculture Industries Services
5.Gross national savings/GNP Prices (annual changes)
1.Consumer price index 2.Wholesale price index 3.Import price index 4.Export price index
Production (annual changes)1.Industrial production 2.Manufacturing production
Heavy industry Light industry
3.Floor Areas of applying construction permit Expenditure (growth rate)
1.Private consumption expenditure 2.Outbound departure of nationals
Investment1.Growth rate of fixed capital formation 2.Growth rate of private fixed catpial formation 3.Annual changes of approved foreign
investment4.Increase rate of capital goods import
Trade (annual changes)1.Imports on customs basis 2.Exports on customs basis 3.Export orders received
Finance (fiscal year) *1.Central government expenditures/GNP 2.Central government balance
% of GNP % of expenditures
3.Central Government debts % of GNP
4.Annual changes in tax revenue 5.Tax revenue/GNP
Banking 1.Foreign reserves 2.Government foreign debt(June 30) 3.Stock price index 4.Annual changes of (M2) 5.Rediscount rate 6.Foreign exchange
Labor force 1.Unemployment rate export : import :
2002
3.54288.9
12,900100.0
1.931.067.125.4
-0.20.10.4
-1.5
6.98.1
10.9-1.2-24
1.94.4
-21.6
-36.2
-3.5
56.3
11.2
16.4
2.917.9
2.9-3.112.3
161.70.33
5,2263.6
1.62534.753
5.17130.6112.6
2001
-2.18286.8
12,876100.0
2.031.067.024.0
-0.01-1.3-1.30.3
-7.3-8.0-7.6-9.4-11
1.0-1.9
-20.6-29.2-32.6
-31.6
-23.4-17.2-11.5
17.6
2.514.1
27.9-6.7
13
122.20.56
4,9075.8
2.12534.999
4.57122.9
107.24
2000
5.86 313.9
14,188 100.0
2.1 32.4 65.5 25.4
1.3 1.8 4.6
-0.9
7.4 8.0
11.1 -1.0
-15.1
4.9 11.7
8.6 15.779.8
34.3
26.5 22.0 20.4
16.3
1.37.7
241.4
13.2
106.7 0.75
7,847 7.0
4.625 32.99
2.99 148.32 140.01
1999
5.42 290.5
13,235 100.0
2.6 33.2 64.2 26.1
0.2 -4.5 -4.1 -8.5
7.7 8.1
11.1 0.4 6.6
5.4 10.9
1.8 -0.7 13.2
20.3
5.8 10.0 7.3
14.2
-0.5 -3.4
13.2 -3.0 14.7
106.2 1.06
7,4278.3 4.5
31.4
2.92 121.59 110.69
1998
4.57 269.2
12,360 100.0
2.5 34.50 63.0 26.0
1.7 0.6 0.7 5.6
2.6 2.4 4.6
-3.1 -0.6
6.5 -4.0
8.0 11.8
-12.4
11.9
-8.5 -9.4 -4.0
13.2
-1.2 -9.3
15.8 9.9
16.0
90.34 1.88
7,714 8.8
4.75 33.44
2.69 110.58 114.66
1997
6.68 293.3
13,592 100.0
2.6 35.3 62.1 26.4
0.9 -0.5 -1.4 2.1
7.4 8.7
13.1 -0.7
-15.9
7.3 7.9
10.7 18.6 72.7
18.5
11.8 5.3 4.1
15.9
2.4 15.2
17.3 6.1
15.7
83.50 2.48
8,411 8.3
5.25 32.64
2.72 122.08 114.42
1996
6.10 283.6
12,260 100.0
3.2 35.7 61.1 26.7
3.1 -1.0 -2.5 1.7
2.0 2.9 4.8
-0.8 -17.3
6.5 10.1
1.7 3.4
-15.9
8.8
-1.1 3.8 4.8
15.1
1.7 11.3
16.6 -2.8 16.1
88.04 3.92
6,004 9.2
5.00 27.49
2.60 115.94102.37
Unit
% Billion US$
US$ % % % %%
% %% %
% %% % %
%%
% % %
%
% % %
%
% %
% % %
Billion US$ Billion NT$ 1966=100
% %
NT$/US$
%Billion US$Billion US$
Explanation:* Data of Finance refer to fiscal year, starting from July 1 through June 30.** Data Source: Directorate-General of Budget, Accounting and Statistics, Executive Yuan, R.O.C.
Key Economic Indicators