consolidated financial results for the three months · pdf fileconsolidated financial results...
TRANSCRIPT

1
Consolidated Financial Results for the Three Months Ended June 30, 2015
(Prepared in Accordance with IFRS) August 6, 2015
KONAMI CORPORATION
Address: 7-2, Akasaka 9-chome, Minato-ku, Tokyo, Japan
Stock code number, TSE: 9766
Ticker symbol, LSE: KNM
URL: http://www.konami.co.jp/en
Shares listed: Tokyo Stock Exchange and London Stock Exchange
Representative: Takuya Kozuki, Representative Director, President
Contact: Junichi Motobayashi, General Manager, Finance and Accounting
(Phone: +81-3-5771-0222)
(Amounts are rounded to the nearest million, except percentages and per share amounts)
1. Consolidated Financial Results for the Three Months Ended June 30, 2015
(1) Consolidated Results of Operations
Revenue Operating
profit Profit before income taxes
Profit for the period
Profit attributable to owners of the
parent
Total comprehensive income for the
period
Three months ended June 30, 2015
% change from previous year
51,202
5.3%
6,484
86.7%
6,862
135.1%
4,288
157.0%
4,282
159.9%
4,909
304.0%
Three months ended June 30, 2014
% change from previous year
48,606
-
3,472
-
2,918
-
1,668
-
1,647
-
1,214
-
Basic earnings per share (attributable to owners of the parent)
(yen)
Diluted earnings per share (attributable to owners of the parent)
(yen)
Three months ended June 30, 2015 30.89 -
Three months ended June 30, 2014 11.88 -
(2) Consolidated Financial Position (Millions of Yen, except percentages and per share amounts)
Total assets Total equity
Total equity attributable to owners
of the parent
Ratio of equity attributable to owners
of the parent
June 30, 2015 312,568 221,673 220,957 70.7%
March 31, 2015 311,592 218,499 217,789 69.9%
2. Cash Dividends
Record Date
Cash dividends per share (yen)
First quarter end
Second quarter end
Third quarter end
Year end Annual
Year ended March 31, 2015 - 8.50 - 12.50 21.00
Year ending March 31, 2016 -
Year ending March 31, 2016
-Forecast- 10.50 - 10.50 21.00
Note: Recently announced change in dividend forecasts for the fiscal year ending March 31, 2016
during the three months ended June 30, 2015: None

2
3. Consolidated Earnings Forecast for the Year Ending March 31, 2016
(Millions of Yen, except percentages and per share data)
Revenue Operating
profit Profit before income tax
Profit attributable to owners of the
parent
Basic earnings per share
(attributable to owners of the parent) (yen)
Year ending March 31, 2016
% change from previous year
228,000
4.5%
17,000
11.1%
16,000
(5.7)%
9,500
(4.2)% 68.54
Note: Recently announced change in earnings forecasts for the fiscal year ending March 31, 2016 during the three
months ended June 30, 2015: None
Noted Items
(1) Changes in significant consolidated subsidiaries during the period (status changes of subsidiaries
due to changes in the scope of consolidation): None
(2) Changes in accounting policies and accounting estimate
1. Changes in accounting policies required by IFRS: No
2. Other changes: No
3. Changes in accounting estimate: No
(3) Number of shares issued (Share capital)
1. Number of shares issued: (Treasury shares included)
As of June 30, 2015 143,500,000 shares
As of March 31, 2015 143,500,000 shares
2. Number of treasury shares :
As of June 30, 2015 4,891,944 shares
As of March 31, 2015 4,890,951 shares
3. Average number of shares outstanding:
Three months ended June 30, 2015 138,608,645 shares
Three months ended June 30, 2014 138,612,200 shares
Information regarding the audit review procedure:
This report is outside the scope of the procedures for review of quarterly consolidated financial
statements as required under the Financial Instruments and Exchange Act of Japan. The aforementioned
procedures have not been completed for the quarterly financial statements included in this document as
of the time of disclosure of this document.
Cautionary statement with respect to forward-looking statements and other matters:
Statements made in this document with respect to our current plans, estimates, strategies and beliefs,
including the above forecasts, are forward-looking statements about our future performance. These
statements are based on management's assumptions and beliefs in light of information currently
available to it and, therefore, you should not pl ace undue reliance on them. A number of important
factors could cause actual resul ts to be materially different from and worse than those discussed in
forward-looking statements. Such factors include, but are not limited to: (i) changes in economic
conditions affecting our operations; (ii) fluctuations in currency exchange rates, particularly with respect
to the value of the Japanese yen, the U.S. dollar and the Euro; (iii) our ability to continue to win
acceptance of our products, which are offered in highly competitive markets characterized by the

3
continuous introduction of new products, rapid developments in technology and subjective and changing
consumer preferences; (iv) the timing of the release of new game titles and products, especially game
titles and products that are part of historically popul ar series; (v) our ability to successfully expand
internationally with a focus on our Digital Entertainment business and Gaming & Systems business; (vi)
our ability to successfully expand the scope of our business and broaden our customer base through our
Health & Fitness business; (vii) regul atory developments and changes and our ability to respond and
adapt to those changes; (viii) our expectations with regard to further acquisitions and the integration of
any companies we may acquire; and (ix) the outcome of existing contingencies.
Please refer to pages 10, 11, 12 and 13 for further information regarding our business forecasts.
The Company disclosed the suppl emental data for the consolidated financial statements via the
Company's website on August 6, 2015.

4
1. Business Performance
(1) Analysis of Business Performance
(i) Business Overview
The business environment surrounding the Konami Group showed signs of slow
recovery, including improvement in a segment of corporate earnings and
employment situation in Japan, supported by the economic and financial policies
of the government and the additional monetary easing policies implemented by
the Bank of Japan. In terms of the global economy, the economic environment for
growth remained uncertain, such as Greek debt crisis. While the U.S. economy
continued to recover, the growth rate in emerging markets, including China, has
slowed down.
In the entertainment market, along with improving performance in mobile devices
due to the rapid spread of smartphones and tablet PCs and the development of
information and telecommunications infrastructure, game contents continues to
diversify. As new video game consoles continue to be released at a record-setting
pace in Western countries, business opportunities in the game industry are
increasing. In the gaming industry, the development of resources related to
tourism continues to help spread the casino market worldwide. In Japan, gaming
business is expected to continue to grow, including the anticipated submittal to the
Diet of a draft bill for Integrated Resort (IR) Promotion.
In connection with the health and fitness industry, there is a growing health
consciousness throughout society, especially among senior citizens and women,
who year after year have shown an increasing tendency to focus their leisure
activities on improving health and physical strength. We continue to see growing
health-consciousness, a preference for sports and an interest in preventing the
need for nursing care in old age.
Against this background, in the Digital Entertainment segment of the Konami
Group, mobile games, including JIKKYOU PAWAFURU PUROYAKYU and the World
Soccer Collection series, continued to enjoy steady sales.
In our Health & Fitness segment, we continued to develop our pricing and
membership plans. These plans enable customers to select a pricing plan based on
the number of times they use our facilities and to use more than one facility. We
intend to promote and spread services supporting the concept of “sustainable
fitness.”
In our Gaming & Systems segment, sales of the Podium video slot machine and the
SYNKROS casino management system continued to be favorable, mainly in the U.S.
and Australian markets.
In the Pachislot and Pachinko Machines segment, we released a new pachislot
machine, GUN SWORD, which is derived from the popular animation series, as well
5
as we had resale orders for SENGOKU COLLECTION 2, against a backdrop of the
higher rate of operation, which continued to perform steadily in the market.
In terms of the consolidated results for the fiscal year ended June 30, 2015, total
revenue amounted to ¥51,202 million (a year-on-year increase of 5.3%), operating
profit was ¥6,484 million (a year-on-year increase of 86.7%), profit before income
taxes was ¥6,862 million (a year-on-year increase of 135.1%), and profit
attributable to owners of the parent was ¥4,282 million (a year-on-year increase
of 159.9%).
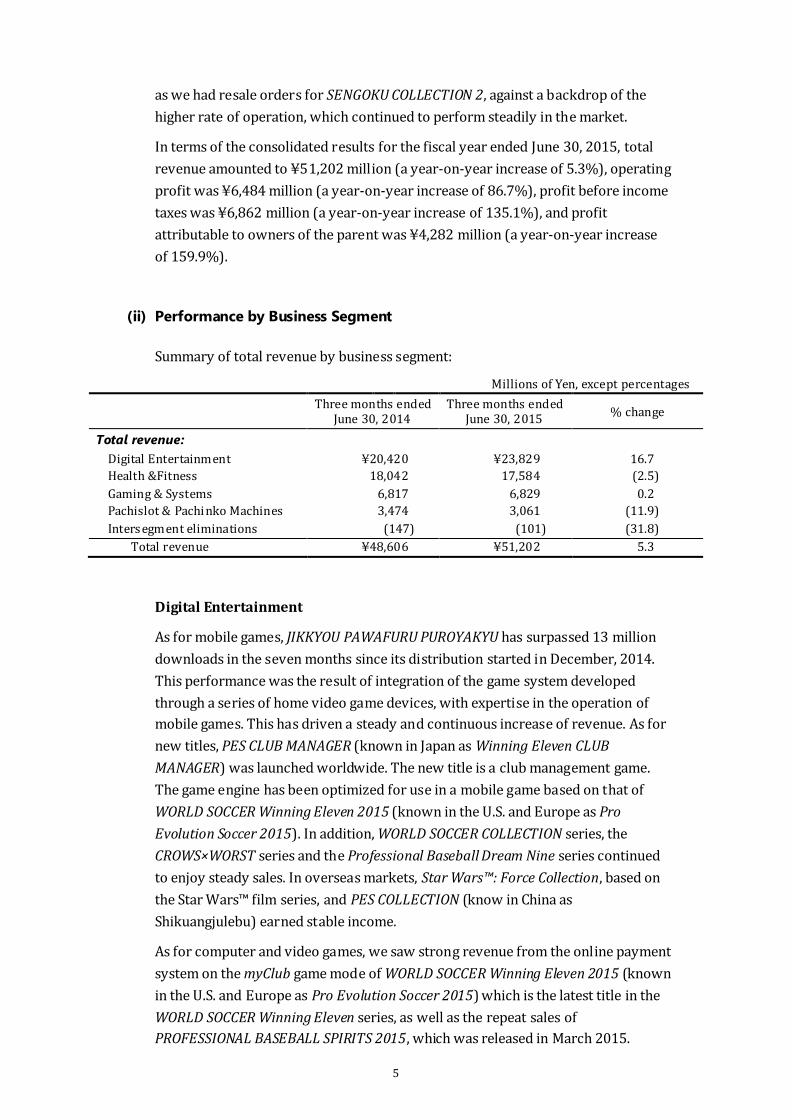
(ii) Performance by Business Segment
Summary of total revenue by business segment:
Millions of Yen, except percentages
Three months ended June 30, 2014
Three months ended June 30, 2015
% change
Total revenue:
Digital Entertainment ¥20,420 ¥23,829 16.7
Health &Fitness 18,042 17,584 (2.5)
Gaming & Systems 6,817 6,829 0.2
Pachislot & Pachinko Machines 3,474 3,061 (11.9)
Intersegment eliminations (147) (101) (31.8)
Total revenue ¥48,606 ¥51,202 5.3
Digital Entertainment
As for mobile games, JIKKYOU PAWAFURU PUROYAKYU has surpassed 13 million
downloads in the seven months since its distribution started in December, 2014.
This performance was the result of integration of the game system developed
through a series of home video game devices, with expertise in the operation of
mobile games. This has driven a steady and continuous increase of revenue. As for
new titles, PES CLUB MANAGER (known in Japan as Winning Eleven CLUB
MANAGER) was launched worldwide. The new title is a club management game.
The game engine has been optimized for use in a mobile game based on that of
WORLD SOCCER Winning Eleven 2015 (known in the U.S. and Europe as Pro
Evolution Soccer 2015). In addition, WORLD SOCCER COLLECTION series, the
CROWS×WORST series and the Professional Baseball Dream Nine series continued
to enjoy steady sales. In overseas markets, Star Wars™: Force Collection, based on
the Star Wars™ film series, and PES COLLECTION (know in China as
Shikuangjulebu) earned stable income.
As for computer and video games, we saw strong revenue from the online payment
system on the myClub game mode of WORLD SOCCER Winning Eleven 2015 (known
in the U.S. and Europe as Pro Evolution Soccer 2015) which is the latest title in the
WORLD SOCCER Winning Eleven series, as well as the repeat sales of
PROFESSIONAL BASEBALL SPIRITS 2015, which was released in March 2015.

6
In regards to arcade games, our e-AMUSEMENT Participation system titles,
centered on MAH-JONG FIGHT CLUB and music genre games, continued to operate
steadily. Meanwhile, Disney TSUM TSUM, a smartphone application converted into
an arcade game, received favorable reviews. The kids’ card game machine, Monster
Retsuden ORECA BATTLE, continued to be extremely popular, especially among
elementary school age boys.
The Yu-Gi-Oh! TRADING CARD GAME series continued to perform strongly in the
global market.
In terms of financial performance, total revenue for the three months ended June
30, 2015 in this segment amounted to ¥23,829 million (a year-on-year increase of
16.7%) and segment profit for the three months ended June 30, 2015 amounted to
¥6,449 million (a year-on-year increase of 78.5%).
Health & Fitness
With respect to the management of facilities that we operate directly, we
developed a free exercise plan in which customers can use certain facilities
(nearby facilities plus some further away) any number of times. We also revised
pricing plans so that customers can select the pricing plan based on frequency of
use. We also developed the corporate health and fitness services to respond to
customer demands, such as the addition of a free exercise plan without limitation
on frequency of use and discounted ticket books to be sold year-round. We also
renewed the programs in the facilities, including V-BODY, a body conditioning
program, and BIOMETRICS, a dieting program. The personal training programs,
which combine training, diet and supplements, are receiving favorable reviews
from a wide range of customers, both men and women. At the OyZ exercise school
program which mainly targets individuals ages 60 and older, we added the new
program, “brain activation course,” aimed at preventing senile dementia, to the
existing national program “strengthening legs and hip course.”
As for healthcare related products, we released LOCOPIN, an amino acid beverage
produced in response to OyZ customer feedback. Sales were stable from outside
facility services due to the home fitness bike S-BODY, released in 2014. We also
launched Kaimin Seikatsu (sound sleep life), the 3rd application in the series of
healthcare applications for smartphones. These developments were part of our
efforts to support exercise and health promotion in a variety of settings.
For the three months ended June 30, 2015, sales from this business decreased
mainly due to the closing of large-scale facilities and a reduction in the number of
facilities with management outsourced to Konami Group in the previous fiscal year.
On the other hand, expenses were reduced due to improved operational efficiency.

7
In terms of financial performance, total revenue for the three months ended June
30, 2015 in this segment amounted to ¥17,584 million (a year-on-year decrease of
2.5%) and segment profit for the three months ended June 30, 2015 amounted to
453 million (a year-on-year increase of 124.9%).
Gaming & Systems
The North American market environment was in severe conditions due to affected
by the entry of European manufacturers and the resulting intensified competition,
the closing of casino facilities in Atlantic City, New Jersey, and increasingly prudent
investments by casino operators when purchasing machines. On the other hand,
we have expanded the category of the Podium series video slot machine and
accelerated the development of products which precisely meet each market’s
demands, including a wider offering in the Central and South American market. We
also expanded our lineup of premium products, which raised higher expectations
from players, by introducing products such as Podium Goliath, a larger size version
of Podium, a product that is subject to a participation agreement (in which profits
are shared with casino operators). These products contributed stable revenues.
The SYNKROS casino management system was sequentially introduced into
multiple states in North America, and enjoyed strong sales.
In the Oceania market, we continued to roll out a richly diverse product lineup,
including Podium Stack of the Podium series. Full-scale marketing is also in
progress in Asia and Africa, where we are working on building distribution
networks. In the fastest-growing market of the Philippines, product sales were
strong.
In addition, we exhibited our products at the largest gaming industry trade expo in
Asia, Global Gaming Expo Asia, held in Macau. The titles we exhibited included
Podium series and Rapid Revolver, with featuring with vertically-mounted
mechanical drums on the top box. These rich products and new lineup received
high acclaim from operators.
Profit of this segment for the three months ended June 30, 2015, however,
decreased mainly due to advance investments in the North American market,
including increases in product approval fees and personnel expenses for product
development and maintenance resulting from expansion of the product lineup and
enhancement of the services.
In terms of financial performance, total revenue for the three months ended June
30, 2015 in this segment amounted to ¥6,829 million (a year-on-year increase of
0.2%) and segment profit for the three months ended June 30, 2015 amounted to
¥636 million (a year-on-year decrease of 50.2%).
8
Pachislot & Pachinko Machines
As for pachislot machines, we released GUN SWORD, which was derived from the
popular animation series. This is the first model adapted to new regulations after
the test-methods changed, and is loaded onto the original cabinet Original 7, which
features flexible rendering. In addition, we had resale orders for SENGOKU
COLLECTION 2, which was released in the previous fiscal year, by virtue of
continuing to operate steadily at pachinko parlors.
In terms of financial performance, total revenue for the three months ended June
30, 2015 in this segment amounted to ¥3,061 million (a year-on-year decrease of
11.9%) and segment profit for the three months ended June 30, 2015 amounted to
238 million (for the three months ended June 30, 2014, segment loss amounted to
560 million).
(2) Consolidated Financial Position
(i) Total Assets, Total Liabilities and Total equity
Total Assets:
Total assets amounted to ¥312,568 million as of June 30, 2015, increasing by ¥976
million compared with March 31, 2015. This increase mainly resulted from
increases in cash and cash equivalents and intangible assets despite a decrease in
and trade and other receivables.
Total Liabilities:
Total liabilities amounted to ¥90,895 million as of June 30, 2015, decreasing by
¥2,198 million compared with March 31, 2015. This decrease primarily resulted
from decreases in trade and other payables and other financial liabilities despite
an increase in income tax payables.
Total Equity:
Total equity amounted to ¥221,673 million as of June 30, 2015, increasing by
¥3,174 million compared with March 31, 2015. This mainly resulted from the
recognition of profit for the period. Total equity attributable to owners of the
parent was 70.7%, increasing by 0.8 points compared with March 31, 2015.

9
(ii) Cash Flows
Millions of Yen
Three months ended
June 30, 2014
Three months ended
June 30, 2015 Change
Cash flow summary:
Net cash provided by operating activities ¥13,754 ¥13,422 ¥(332)
Net cash used in investing activities (7,935) (4,897) 3,038
Net cash used in financing activities (7,247) (2,257) 4,990
Effect of exchange rate changes on cash and cash equivalents (118) 130 248
Net increase (decrease) in cash and cash equivalents (1,546) 6,398 7,944
Cash and cash equivalents at end of the period ¥48,478 ¥71,052 ¥22,574
Cash and cash equivalents (hereafter, referred to as “Net cash”), as of June 30,
2015, amounted to ¥71,052 million, an increase of ¥6,398 million compared to the
year ended March 31, 2015, and a year-on-year increase of 46.6%.
Cash flow summary for each activity for the three months ended June 30, 2015 is
as follows:
Cash flows from operating activities:
Net cash provided by operating activities amounted to ¥13,422 million for the
three months ended June 30, 2015, a year-on-year decrease of 2.4%. This
primarily resulted from a decrease in deferred revenue and an increase in the
payment amount of income tax, which offset a decrease in trade and other
receivables.
Cash flows from investing activities:
Net cash used in investing activities amounted to ¥4,897 million for the three
months ended June 30, 2015, a year-on-year decrease of 38.3%. This mainly
resulted from a decrease in capital expenditures for property, plant and
equipment.
Cash flows from financing activities:
Net cash used in financing activities amounted to ¥2,257 million for the three
months ended June 30, 2015, a year-on-year decrease of 68.9%. This primarily
resulted from a decrease in dividends paid and there has been no repayment of
short-term borrowings which had been during the three months ended June 30,
2014.

10
(3) Outlook for the Fiscal Year Ending March 31, 2016
Digital Entertainment
With the spread of smartphones and tablet PCs worldwide, the available means of
providing games continue to diversify, and opportunities to reach an even greater
audience for games are increasing. Against this background, we intend to develop
ways of playing games that match the characteristics of each device.
As for mobile games, the total number of registered users of all contents we
developed continues to increase steadily. JIKKYOU PAWAFURU PUROYAKYU was
downloaded 14 million times up to July 2015 and PES CLUB MANAGER (known in
Japan as Winning Eleven CLUB MANAGER) launched worldwide in June 2015.
These games are expected to continue to contribute toward our profits. We are
further focusing our managerial resources on the development of content that we
believe will become major hits in order to produce more hit content, especially in
the native application market. Looking ahead, we will continue to expand our
lineup, utilizing previously established production and operational expertise and
rich content resources. We also intend to develop more content for new platforms
overseas, not only for the U.S. and European markets but also for Asian markets.
We also plan to enhance new releases with attractive content by creating synergies
with our established content.
As for computer and video games, we are working toward inclusion of a sustained
operation game mode that utilizes the operational expertise of mobile games,
while also continuing global introduction of titles that have been carefully chosen
according to selection and concentration. Further, the new game mode myClub,
which has been newly adopted for WORLD SOCCER Winning Eleven 2015 (known in
the U.S. and Europe as Pro Evolution Soccer 2015), is expected to provide a
sustained contribution to our profits from online payments. As for the latest titles
of Konami Group’s leading products, the upcoming September 2015 release of
METAL GEAR SOLID V: THE PHANTOM PAIN, which is the latest title in the METAL
GEAR series, and Winning Eleven 2016 (known in the U.S. and Europe as PES 2016 -
Pro Evolution Soccer -) have generated great expectations, such as these were
honored with a variety of awards by multiple major games media outlets, including
several "Best of E3" awards at the largest game conference in the world, E3 2015,
held in North America.
As for arcade games, Konami Group intends to work to revitalize the amusement
arcade industry by providing new entertainment that can be enjoyed only at an
amusement facility through “interpersonal communication” using the
e-AMUSEMENT system. We intend to propose innovative services that will lead the
industry. This will involve promoting the continual development of equipment
compatible with the PASELI e-money service and e-AMUSEMENT Participation, as
well as enhancements to and the expansion of various services.

11
As for card games, we will continue the global development of the Yu-Gi-Oh!
TRADING CARD GAME series. Its popularity is rising exceptionally in anticipation of
the world tournament to be held in Kyoto, Japan, in August 2015.
Health & Fitness
In our Health and Fitness business, we will continue striving to accurately grasp
the needs of our increasingly diverse customer base and to increase the value of
Konami Sports Clubs by offering a new lifestyle.
We entered the second year since introducing the revised pricing plan based on
usage frequency, and we are pleased to inform that many customers think the
pricing plan meets the theme of “sustainable fitness.” The plan has received
favorable reviews especially from beginner customers who have never been to
sports clubs before, and there is a rise in new member registrations. In addition,
we will open a golf course targeting beginners at Nasu Kogen, Tochigi prefecture,
in August 2015. Through the innovative concept of offering a full-scale golf course
to beginners, we will continue to make efforts to convey the pleasures of playing
golf and to promote exercise habits to various ages.
As Japan’s population continues to age, the government continues to take
measures to combat lifestyle diseases and also develop new plans for boosting
sports clubs and other aspects of the healthy prolonged life industry as part of the
governmental growth strategy. As part of an integrated approach from national
and private organizations, we intend to continue to promote fitness club operation
and health and fitness equipment development and marketing. The aim of these
efforts is to enhance customer satisfaction for a variety of users with diverse
lifestyles and age ranges as the leading company in the health and fitness industry.
Gaming & Systems
In regard to slot machine sales, we will strengthen sales and product expansion,
focusing on the Podium series video slot machines, Podium Monument, Podium
Stack and Rapid Revolver, all which have received positive reviews. We also intend
to stabilize our operational results by increasing periodical income through the
expansion of participation agreements to enhance sales and address the needs of
casino operators by expanding our product lineup. In the Asian, Central and South
American and European markets, we plan to continue to develop sales by adapting
to local needs.
We introduced the SYNKROS casino management system and its many functions at
various trade shows and business conferences, including demonstrations of
SYNKiosk, a newly equipped casino management tool. They received positive
reviews from major operators. Looking ahead, we intend to actively pursue sales

12
and make efforts to enhance product strength while developing new product
features.
Pachislot & Pachinko Machines
As for pachislot machines in our Pachislot & Pachinko Machines business, we
intend to release SKYGIRLS―Zero, Again, a second, improved version of our
popular original content SKYGIRLS with enhanced game properties. To achieve a
higher rate of operation, we intend to focus on production and sales activities of
our pachislot machines by incorporating anticipated user demands into product
development and leveraging Konami Group’s original contents.
In addition, we plan to launch a new pachinko machine following the release of CR
PACHINKO MAGICAL HALLOWEEN, the first pachinko machine developed by our
group. We intend to continue to offer products with a higher rate of operation and
to stabilize profitability in the business to boost our market presence by working
integrally with production, manufacture and sales in addition to making efforts to
reinforce development.
Projected consolidated results for the fiscal year ending March 31, 2016 are as
follows: revenue of ¥228,000 million; operating profit of ¥17,000 million; profit
before income tax of ¥16,000 million; and profit attributable to owners of the
parent of ¥9,500 million. Thus, there is no change from the forecast figures
released in the “Consolidated Financial Results for the Year Ended March 31, 2015”
dated May 8, 2015.
KONAMI, as a business affected by “hit” products, requires flexibility in how its
products are released and is subject to fluctuations in sales throughout the course
of the fiscal year. For this reason, projected consolidated results for the half year
are not disclosed.
We will to continue to elaborate on the disclosure for the quarterly financial
results.
Special Note:
This document contains “forward-looking statements,” or statements related to
future events that are based on management’s assumptions and beliefs in light of
information currently available. These statements are subject to various risks and
uncertainties.

13
When relying on forward-looking statements to make investments, you should not
place undue reliance on such forward-looking statements. Actual results may be
affected by a number of important factors and may be materially different from
those discussed in forward-looking statements. Such factors include, but are not
limited to, changes in economic conditions affecting our operations, market trends
and fluctuations in currency exchange rates, particularly with respect to the value
of the Japanese yen, the U.S. dollar and the Euro.
2. Other
(1) Changes in significant consolidated subsidiaries during the period (status
changes of subsidiaries due to changes in the scope of consolidation):
None
(2) Changes in accounting principles, procedures and reporting policies:
None

14
3. Condensed Consolidated Financial Statements
(1) Condensed Consolidated Statement of Financial Position
Millions of Yen
As of
March 31, 2015
As of
June 30, 2015
Assets
Current assets
Cash and cash equivalents ¥64,654 ¥71,052
Trade and other receivables 30,869 21,658
Inventories 12,844 12,375
Income tax receivables 2,055 1,764
Other current assets 5,951 7,293
Total current assets 116,373 114,142
Non-current assets
Property, plant and equipment, net 79,261 79,844
Goodwill and intangibl e assets 61,037 62,492
Investments accounted for using the equity method 2,370 2,341
Other investments 1,323 1,281
Other financial assets 24,257 24,445
Deferred tax assets 23,019 24,058
Other non-current assets 3,952 3,965
Total non-current assets 195,219 198,426
Total assets 311,592 312,568
Liabilities and equity
Liabilities
Current liabilities
Bonds and borrowings 6,009 6,123
Other financial liabilities 4,355 4,241
Trade and other payabl es 27,717 25,392
Income tax payables 1,248 2,792
Other current liabilities 12,270 11,547
Total current liabilities 51,599 50,095
Non-current liabilities
Bonds and borrowings 14,943 14,947
Other financial liabilities 18,448 17,962
Deferred tax liabilities 708 741
Other non-current liabilities 7,395 7,150
Total non-current liabilities 41,494 40,800
Total liabilities 93,093 90,895
Equity
Share capital 47,399 47,399
Share premium 74,175 74,175
Treasury shares (11,271) (11,273)
Other components of equity 5,012 5,633
Retained earnings 102,474 105,023
Total equity attributabl e to owners of the parent 217,789 220,957
Non-controlling interests 710 716
Total equity 218,499 221,673
Total liabilities and equity ¥311,592 ¥312,568

15
(2) Condensed Consolidated Statements of Profit or Loss and Comprehensive Income
Condensed Consolidated Statements of Profit or Loss
Millions of Yen
Three months ended
June 30, 2014
Three months ended
June 30, 2015
Revenue
Product sales revenue ¥18,694 ¥19,512
Service and other revenue 29,912 31,690
Total revenue 48,606 51,202
Cost of revenue
Cost of product sales revenue (10,464) (11,020)
Cost of service and other revenue (22,554) (22,190)
Total cost of revenue (33,018) (33,210)
Gross profit 15,588 17,992
Selling, general and administrative expenses (11,897) (11,164)
Other income and other expenses, net (219) (344)
Operating profit 3,472 6,484
Finance income 102 617
Finance costs (669) (243)
Profit from investments accounted for using the equity method 13 4
Profit before income taxes 2,918 6,862
Income taxes (1,250) (2,574)
Profit for the period 1,668 4,288
Profit attributable to:
Owners of the parent 1,647 4,282
Non-controlling interests ¥21 ¥6
Yen
Three months ended June 30, 2014
Three months ended June 30, 2015
Earnings per share (attributable to owners of the parent)
Basic ¥11.88 ¥30.89
Diluted - -

16
Condensed Consolidated Statement of Comprehensive Income
Millions of Yen
Three months ended June 30, 2014
Three months ended June 30, 2015
Profit for the period ¥1,668 ¥4,288
Other comprehensive income
Items that may be reclassified to profi t or loss:
Exchange differences on foreign operations (442) 653
Net change in fair values of available-for-sale financial assets (12) (32)
Total items that may be reclassified to profit or loss (454) 621
Total other comprehensive income (454) 621
Total comprehensive income for the period 1,214 4,909
Comprehensive income attributabl e to:
Owners of the parent 1,193 4,903
Non-controlling interests ¥21 ¥6

17
(3) Condensed Consolidated Statement of Changes in Equity
Millions of Yen
Equity attributable to owners of the parent Non-
controlling interest
Total equity Share
capital
Share
premium
Treasury
shares
Other components
of equity
Retained
earnings Total
Balance at April 1, 2014 ¥47,399 ¥74,175 ¥(11,264) ¥1,779 ¥96,091 ¥208,180 ¥659 ¥208,839
Profit for the period 1,647 1,647 21 1,668
Other comprehensive income (454) (454) (454)
Total comprehensive income for the period - - - (454) 1,647 1,193 21 1,214
Purchase of treasury
shares (0) (0) (0)
Disposal of treasury shares 0 0 0 0
Dividends (2,356) (2,356) (2,356)
Total transactions with the owners - 0 0 - (2,356) (2,356) - (2,356)
Balance at June 30, 2014 ¥47,399 ¥74,175 ¥(11,264) ¥1,325 ¥95,382 ¥207,017 ¥680 ¥207,697
Millions of Yen
Equity attributable to owners of the parent Non-
controlling interest
Total equity Share
capital
Share
premium
Treasury
shares
Other components
of equity
Retained
earnings Total
Balance at April 1, 2015 ¥47,399 ¥74,175 ¥(11,271) ¥5,012 ¥102,474 ¥217,789 ¥710 ¥218,499
Profit for the period 4,282 4,282 6 4,288
Other comprehensive income 621 621 621
Total comprehensive income for the period - - - 621 4,282 4,903 6 4,909
Purchase of treasury
shares (2) (2) (2)
Disposal of treasury shares - -
Dividends (1,733) (1,733) (1,733)
Total transactions with the owners - - (2) - (1,733) (1,735) - (1,735)
Balance at June 30, 2015 ¥47,399 ¥74,175 ¥(11,273) ¥5,633 ¥105,023 ¥220,957 ¥716 ¥221,673

18
(4) Condensed Consolidated Statement of Cash Flows
Millions of Yen
Three months ended June 30, 2014
Three months ended June 30, 2015
Operating activities
Profit for the period ¥1,668 ¥4,288
Depreciation and amortization 4,825 3,307
Impairment losses 195 83
Interest and dividends income (98) (80)
Interest expense 283 244
Loss on sale or disposal of property, plant and equipment 24 18
Profit from investments accounted for using the equity method (13) (4)
Income taxes 1,250 2,574
Decrease in trade and other receivables 7,134 9,572
Decrease (increase) in inventories (1,375) 652
Decrease in trade and other payables (1,047) (3,226)
Increase in prepaid expense (19) (942)
Increase (decrease) in deferred revenue 614 (1,661)
Other, net 911 472
Interest and dividends received 126 88
Interest paid (261) (239)
Income taxes paid (463) (1,724)
Net cash provided by operating activities 13,754 13,422
Investing activities
Capital expenditures (7,683) (4,951)
Decrease in lease deposits, net 138 61
Increase in term deposits, net (391) (5)
Other, net 1 (2)
Net cash used in investing activities (7,935) (4,897)
Financing activities
Decrease in short-term borrowings, net (4,400) -
Principal payments under capital lease and financing obligations (531) (544)
Dividends paid (2,316) (1,711)
Other, net (0) (2)
Net cash used in financing activities (7,247) (2,257)
Effect of exchange rate changes on cash and cash equivalents (118) 130
Net increase (decrease) in cash and cash equivalents (1,546) 6,398
Cash and cash equivalents at the beginning of the period 50,024 64,654
Cash and cash equivalents at the end of the period ¥48,478 ¥71,052

19
(5) Going concern assumption
None
(6) Significant changes in the equity attributable to owners of the parent
None
(7) Segment Information
(i) Operating segment information
Millions of Yen
Three months ended
June 30, 2014
Three months ended
June 30, 2015
Revenue:
Digital Entertainment –
External customers ¥20,363 ¥23,814
Intersegment 57 15
Total ¥20,420 ¥23,829
Health &Fitness –
External customers ¥17,953 ¥17,498
Intersegment 89 86
Total ¥18,042 ¥17,584
Gaming & Systems –
External customers ¥6,817 ¥6,829
Intersegment - -
Total ¥6,817 ¥6,829
Pachislot & Pach inko Machines –
External customers ¥3,473 ¥3,061
Intersegment 1 0
Total ¥3,474 ¥3,061
Intersegment eliminations and Eliminations (147) (101)
Consolidated ¥48,606 ¥51,202

20
Millions of Yen
Three months ended
June 30, 2014
Three months ended
June 30, 2015
Segment profit (loss):
Digital Entertainment ¥3,613 ¥6,449
Health &Fitness 201 453
Gaming & Systems 1,276 636
Pachislot & Pachinko Machines (560) 238
Total segment profit and loss, net 4,530 7,776
Corporate expenses and eliminations (839) (948)
Other income and other expenses, net (219) (344)
Finance income and finance costs, net (567) 374
Profit from investments accounted for using the equity method 13 4
Profit before income taxes ¥2,918 ¥6,862
(Notes)
1. Konami Group operates on a worldwide basis principally with the following
four business segments:
a) Digital
Entertainment:
Production, manufacture and sale of digital content and
related products including mobile games, computer and
video games, arcade games and card games.
b) Health & Fitness:
Operation of health and fitness clubs, and production,
manufacture and sale of health and fitness related goods.
c) Gaming & Systems: Development, manufacture, sale and service of gaming
machines and casino management systems for overseas
markets.
d) Pachislot & Pachinko
Machines:
Production, manufacture and sale of pachislot machines
and pachinko machines.
2. Segment profit (loss) is determined by deducting “cost of revenue” and “selling,
general and administrative expenses” from “revenue,” which does not include
corporate expenses, finance income and finance costs, and certain non-regular
expenses associated with each segment such as impairment losses on property,
plant and equipment, goodwill and intangible assets.
3. Corporate expenses primarily consist of administrative expenses not directly
associated with specific segments.
4. Intersegment eliminations primarily consist of eliminations of intercompany
sales.

21
5. Other income and other expenses, net include impairment losses on property,
plant and equipment and goodwill and intangible assets and profit or loss of
sales and disposal on property, plant and equipment.
(ii) Geographic Information
Revenue from external customers
Millions of Yen
Three months ended
June 30, 2014
Three months ended
June 30, 2015
Revenues:
Japan ¥37,871 ¥38,665
United States 7,739 8,104
Europe 1,318 2,437
Asia/Oceania 1,678 1,996
Consolidated ¥48,606 ¥51,202
(Note)
For the purpose of presenting operations in the geographic areas above, Konami
Group attributes revenues from external customers to individual countries in each
area based on where Konami Group sold products or rendered services, and
attributes assets based on where assets are located.