consolidated basis (japanese gaap) - yamaha · pdf fileconsolidated basis (japanese gaap) ......
TRANSCRIPT

YAMAHA CORPORATION Flash Report
Consolidated Basis (Japanese GAAP) Results for the fiscal year ended March 31, 2016
April 28, 2016
Company name: YAMAHA CORPORATION (URL http://www.yamaha.com) Code number: 7951 Stock listing: Tokyo Stock Exchange (First Section)
Address of headquarters: 10-1, Nakazawa-cho, Naka-ku, Hamamatsu, Shizuoka 430-8650, Japan Representative director: Takuya Nakata, President and Representative Director For further information, please contact: Yasushi Nishiyama, General Manager, Corporate Finance Division Telephone: +81-53-460-2158 Scheduled date of Ordinary General Shareholders’ Meeting: June 22, 2016
Scheduled date to submit Securities Report: June 23, 2016 Scheduled date to begin dividend payments: June 23, 2016 Supplementary materials to the financial statements have been prepared: Yes
Presentation will be held to explain the financial statements: Yes (for securities analysts and institutional investors)
1. Results for FY2016.3 (April 1, 2015–March 31, 2016)
Figures of less than ¥1 million have been omitted.
(1) Consolidated Operating Results
(Percentage figures are changes from the previous fiscal year.)
Net sales Operating income Ordinary income Net income attributable to owners of parent
Millions of yen
% change from the previous
fiscal year
Millions of yen
% change from the previous
fiscal year
Millions of yen
% change from the previous
fiscal year
Millions of yen
% change from the previous
fiscal year
FY2016.3 (Ended March 31, 2016)
¥435,477 0.8% ¥40,663 34.9% ¥40,907 31.0% ¥32,633 30.9%
FY2015.3 (Ended March 31, 2015)
¥432,177 5.3% ¥30,135 15.9% ¥31,231 19.4% ¥24,929 8.9%
Note: Comprehensive income: FY2016.3 ¥(19,887) million, —% FY2015.3 ¥82,118 million, 60.4%
Net income
per share Net income per share
after full dilution Return on equity Ratio of ordinary income to total assets
Ratio of operating income to net sales
Yen Yen % % %
FY2016.3 (Ended March 31, 2016)
¥168.90 ¥— 10.1% 8.2% 9.3%
FY2015.3 (Ended March 31, 2015)
¥128.75 ¥— 8.1% 6.4% 7.0%
(For reference) Equity in earnings of non-consolidated subsidiaries and affiliates: FY2016.3 ¥(6) million FY2015.3 ¥(20) million

(2) Consolidated Financial Data
Total assets Net assets Shareholders’ equity ratio Net assets per share
Millions of yen Millions of yen % Yen
FY2016.3 (As of March 31, 2016)
¥469,745 ¥303,889 64.2% ¥1,601.55
FY2015.3 (As of March 31, 2015)
¥530,034 ¥348,752 65.3% ¥1,787.42
(For reference) Shareholders’ equity: FY2016.3 ¥301,544 million FY2015.3 ¥346,086 million
(3) Consolidated Cash Flows
Cash flows from operating activities
Cash flows from investing activities
Cash flows from financing activities
Cash and cash equivalents at end of period
Millions of yen Millions of yen Millions of yen Millions of yen
FY2016.3 (Ended March 31, 2016)
¥42,399 ¥591 ¥(30,349) ¥85,018
FY2015.3 (Ended March 31, 2015)
¥31,729 ¥(11,700) ¥(5,909) ¥76,159
2. Dividends
Annual dividends Total dividends
(annual)
Dividend propensity
(consolidated)
Ratio of dividends to
net assets (consolidated)
End of first quarter
End of second quarter
End of third quarter
End of fiscal year Full fiscal year
Yen Yen Yen Yen Yen Millions of yen % %
FY2015.3 — ¥13.50 — ¥22.50 ¥36.00 ¥6,970 28.0% 2.3%
FY2016.3 — ¥18.00 — ¥26.00 ¥44.00 ¥8,501 26.1% 2.6%
FY2017.3 (Forecast)
— ¥26.00 — ¥26.00 ¥52.00 21.4%
3. Consolidated Financial Forecasts for FY2017.3 (April 1, 2016–March 31, 2017) (Percentage figures for the full fiscal year are changes from the previous fiscal year, and those for the first half are changes from the previous same period.)
Net sales Operating income Ordinary income
Net income attributable to owners of the parent
company
Net income per share
Millions of yen % Millions of
yen % Millions of yen % Millions of
yen % Yen
FY2017.3 (First Half) ¥204,000 (6.2)% ¥21,000 (1.1)% ¥21,000 (5.6)% ¥29,500 69.4% ¥157.39
FY2017.3 (Full Year) ¥420,000 (3.6)% ¥42,000 3.3% ¥42,000 2.7% ¥45,500 39.4% ¥242.75

Footnote Items: (1) Changes in the state of material subsidiaries during the period (Changes regarding significant subsidiaries accompanying
changes in the scope of consolidation): None (2) Changes in accounting principles, changes in accounting estimates, and changes in presentation due to revisions
(a) Changes in accounting principles accompanying revisions in accounting standards: Yes (b) Changes other than those in (a) above: None (c) Changes in accounting estimates: None (d) Changes in presentation due to revisions: None
(3) Number of shares issued (common shares)
(For Reference) Non-Consolidated Results
1. Non-consolidated results for FY2016.3 (April 1, 2015–March 31, 2016) (1) Non-consolidated operating results (Percentage figures are changes from the previous fiscal year.)
Net sales Operating income Ordinary income Net income
Millions of yen % Millions of yen % Millions of yen % Millions of yen %
FY2016.3 (Ended March 31, 2016)
¥232,830 (0.4)% ¥15,237 45.0% ¥27,141 10.7% ¥20,160 (20.2)%
FY2015.3 (Ended March 31, 2015)
¥233,744 4.5 % ¥10,507 29.2% ¥24,520 58.1% ¥25,264 42.9 %
Net income per share Net income per share
after full dilution
Yen Yen
FY2016.3 (Ended March 31, 2016)
¥104.34 ¥—
FY2015.3 (Ended March 31, 2015)
¥130.48 ¥—
(2) Non-consolidated financial data Total assets Net assets Shareholders’ equity ratio Net assets per share
Millions of yen Millions of yen % Yen
FY2016.3 (As of March 31, 2016)
¥331,943 ¥222,177 66.9% ¥1,180.02
FY2015.3 (As of March 31, 2015)
¥390,220 ¥259,025 66.4% ¥1,337.78
(For reference) Shareholders’ equity: FY2016.3 ¥222,177 million FY2015.3 ¥259,025 million
(a) Number of shares issued at the end of the period (including treasury stock)
FY2016.3 197,255,025 shares FY2015.3 197,255,025 shares
(b) Number of treasury stock at the end of the period
FY2016.3 8,971,933 shares FY2015.3 3,631,425 shares
(c) Average number of shares issued during the period FY2016.3 193,210,820 shares FY2015.3 193,625,357 shares
Footnote Items:
Status of Performance of Auditing Procedures This flash report is exempt from the auditing procedures based on Japan’s Financial Instruments and Exchange Law. At the time when this flash report was disclosed, the auditing procedures based on the Financial Instruments and Exchange Law had not been completed. Explanation of the Appropriate Use of Performance Forecasts and Other Related Items Consolidated financial forecasts were prepared based on information available at the time of the announcement and do not represent promises by the Company or its management that these performance figures will be attained. Actual consolidated results may differ from forecasts owing to a wide range of factors.
For further information regarding consolidated financial forecasts, please refer to page 4. Please note that in the consolidated performance outlook, “net income per share” was computed using the average number of shares issued during the period, taking into consideration of treasury stock acquisition based on the news release “Notice Concerning the Status and Completion of Acquisition of Treasury Stock,” which was announced on April 11, 2016. The materials to be distributed for this earnings presentation and other materials will be posted on the Company’s website immediately after the presentation is concluded.

1
Table of Contents of Supplementary Materials
1. Management Performance …………………………………………………………………………………………………… 2
(1) Analysis of Management Performance …………………………………………………………………………………… 2
(2) Analysis of Financial Position …………………………………………………………………………………………… 4
(3) Basic Policy for Allocation of Profit and Dividends for FY2016.3 and FY2017.3 ……………………………………… 5
2. Management Policies ………………………………………………………………………………………………………… 6
(1) Basic Management Policy ……………………………………………………………………………………………… 6
(2) Management Indicators Taken as Objectives …………………………………………………………………………… 6
(3) The Group’s Medium- to Long-Term Management Strategy ……………………………………………………………… 7
(4) Issues to Be Addressed ………………………………………………………………………………………………… 7
3. Basic Approach to Selection of Accounting Standards ………………………………………………………………………… 9
4. Consolidated Financial Statements …………………………………………………………………………………… 10
(1) Consolidated Balance Sheets …………………………………………………………………………………………… 10
(2) Consolidated Statements of Operations and Consolidated Statements of Comprehensive Income ……………………… 12
(3) Consolidated Statements of Changes in Shareholders’ Equity …………………………………………………………… 14
(4) Consolidated Statements of Cash Flows ………………………………………………………………………………… 16
(5) Notes to the Consolidated Financial Statements ………………………………………………………………………… 18
Notes Regarding Assumptions as a Going Concern …………………………………………………………………………18
Changes in Accounting Principles …………………………………………………………………………………………18
Additional Information ………………………………………………………………………………………………………18
Consolidated Statements of Operations ………………………………………………………………………………… 19
Segment Information ……………………………………………………………………………………………… 21
Per Share Information …………………………………………………………………………………………………… 26
Important Subsequent Events …………………………………………………………………………………………… 26
5. Other ………………………………………………………………………………………………………………………… 26
(1) Management Appointment and Resignations …………………………………………………………………………… 26

2
1. Management Performance
(1) Analysis of Management Performance
1. Review of the Fiscal Year (FY2016.3) Looking back at the operating environment during the fiscal year ended March 31, 2016, the economy of the United States continued to move toward recovery due to firmness in private consumption amid improvement in employment and income conditions. In Europe, private consumption improved due to a reduction in the unemployment rate, and economic conditions showed a gradual recovery. In contrast, the economic slowdowns in China and other emerging countries intensified. In Japan, although the economy improved due to government monetary policies, a sense of economic uncertainty due to the effects of a decline in stock prices and strength of the yen arose from January 2016 onward. Amid this operating environment, the Yamaha Group was in the final year of implementing its medium-term management plan, Yamaha Management Plan 2016 (YMP2016), which started on April 1, 2013. During the fiscal year under review, the Group continued initiatives to carry out its key strategies of “accelerating growth in China and other emerging countries,” “expanding sales in the electronics business domain,” “strengthening cost-competitiveness,” and “developing new businesses.”
Regarding the strategy of “accelerating growth in China and other emerging countries,” in addition to expanding its sales channels via existing musical instrument and audio equipment dealers, the Group steadily expanded its markets while innovatively leveraging online sales stores and distributors. Despite the slowdown in the Chinese macroeconomy, there was steady sales expansion across all musical instrument categories—including acoustic pianos, where the bids for orders were favorable—and China contributed greatly to growth in musical instrument and audio equipment sales. In other emerging countries, although there were divergences by country and region, the overall pace of growth slowed. Under those kinds of conditions, as measures looking ahead to a future increase in the musical instrument-playing population, the Group developed the School Project hand in hand with elementary and high school music tuition and promoted innovative activities geared toward spreading the appeal of music and the promotion of a music culture by, for example, developing the markets in Malaysia and Indonesia.
In implementing the key strategy of “expanding sales in the electronics business domain,” digital pianos, a mainstay Yamaha product among electronic keyboard instruments, succeeded in gaining high acclaim from the market in terms of the design and function of new products. And centered on ClavinovaTM digital pianos, the significant growth in global sales of the previous period continued and contributed to improved profitability. In the case of portable keyboards, a product aimed at emerging countries, Yamaha worked to launch localized models suited to the needs of each country and region and expanded sales. In audio products, MusicCast1 network audio contributed to sales in Europe and Australia. In the market for professional audio equipment, in addition to the favorable sales of digital mixer models priced for the mass market, Yamaha achieved steady growth in the market for professional audio equipment following the market entry of the flagship RIVAGE PM10 model.
In “strengthening cost-competitiveness,” Yamaha steadily produced results due to activities to reduce costs, for example, by lowering procurement costs and improving productivity, structural reforms in Japan that included the semiconductor business, and transferring part of the domestic manufacturing process to manufacturing bases overseas. The Group thus realized cost reductions at a pace that surpassed the overall achievement of targets despite of the increase in labor costs overseas.
In the area of “developing new businesses,” the Yamaha Group did not acquire any new companies but advanced the joint development of products that will create new value for customers by working with both Line 6, Inc. and Revolabs, Inc., which had become wholly owned subsidiaries in the fiscal year ended March 31, 2014. The action will take more time compared with initial plans, however, the Group upgraded its sales structure and worked to realize synergies through the optimization of mutual sales channels. In addition, as a measure to tap into new business, the Group had started in the previous period its in-house Value Amplifier business and product proposal system, from the many proposals of which the Omotenashi Guide2 became a hot topic in the mass media. Net sales for the fiscal year under review were ¥435,477 million (edging up 0.8% from the previous fiscal year). In terms of profits, the Group achieved operating income of ¥40,663 million (an increase of 34.9% from the previous fiscal year), ordinary income of ¥40,907 million (an increase of 31.0% from the previous fiscal year), and net income attributable to owners of the parent company of ¥32,633 million (an increase of 30.9% from the previous fiscal year). As a result, having recorded increases in both net sales and income over four consecutive fiscal years, the Group achieved all its numerical targets set under its medium-term management plan YMP2016. 1 MusicCast: A new function to simply share music by means of audio equipment set up in a number of rooms in the home. 2 Omotenashi Guide: A Yamaha technology and specialty application providing a service that receives announcements at public facilities and commercial complexes and displays them in multiple languages on a mobile device such as a smartphone.

3
Results of operations by segment were as follows: Musical Instruments Excluding the ElectoneTM sales of which had been favorable in the previous fiscal year due to the effect of the introduction of new products, all products in the musical instrument product group recorded increased revenue.
In acoustic pianos, in addition to burgeoning sales in China, sales of products in the medium- to high-priced range were favorable in Europe. In digital pianos, sales were favorable in all regions and were a major driver in expanding overall sales in the musical instrument segment due to growth in sales of products priced for the mass market to major mass retailers in the United States. In portable keyboards, Yamaha experienced difficulties in making sales in South America, but sales of new products were favorable in other regions and sales increased. In the wind instruments business, sales expanded especially in North America and showed growth in all other regions, including in Japan. Sales of guitars grew in Europe, China, and Japan. As a result of the above, despite the effective ¥12.4 billion reduction in sales associated with transferring the operations of Yamaha Music Schools in Japan to the Yamaha Music Foundation during the fiscal year under review, the sales of this segment amounted to ¥278,872 million (edging down 1.0% from the previous fiscal year), and operating income was ¥31,530 million (a gain of 25.8% over the previous fiscal year). Audio Equipment In audio products, sales increased due to sales growth centered on MusicCast-compatible products, such as AV receiver and powered speakers, in Europe and Australia as well as due to expanding the product lineup that has become a regular feature at major mass retailers in the United States. In the professional audio equipment business, in addition to launching sales of large-scale digital mixing systems as flagship models, sales of MG Series digital mixer products that are priced for the mass market were also favorable. In Japan, professional audio equipment and acoustic equipment installations recorded favorable sales. Although sales of commercial online karaoke equipment decreased, voice communication equipment—such as routers and conferencing systems among Information & Communication Technology (ICT) equipment—recorded strong sales.
As a result, sales of this segment were ¥119,378 million (an increase of 5.8% from the previous fiscal year), and operating income amounted to ¥8,693 million (an increase of 41.7% from the previous fiscal year). Electronic Devices In the semiconductor business, although sales of LSIs for amusement equipment expanded, sales of digital amps for mobile devices were weak.
As a result of the above, overall sales for this segment amounted to ¥13,068 million (a decrease of 2.7% from the previous fiscal year), and operating income amounted to ¥107 million (compared with an operating loss of ¥1,446 million incurred in the previous fiscal year). Others In the Others business, in addition to increased sales of factory automation (FA) equipment, favorable sales in the golf products and resort businesses compensated for a drop in automobile interior components, and overall sales were thus on par with those of the previous fiscal year.
As a result, sales of this segment as a whole amounted to ¥24,156 million (edging down 0.3% compared with the previous fiscal year), and operating income amounted to ¥332 million (a decrease of 13.5% compared with the previous fiscal year). Sales by region, based on the location of customers, are as follows: The percentage of consolidated net sales in overseas markets for the fiscal year was 66.7%, 3.8 percentage points higher than in the previous fiscal year. Japan Sales on a consolidated basis in Japan for the fiscal year were ¥145,033 million, ¥15,340 million (or 9.6%) lower than in the previous fiscal year. Despite increased sales of wind instruments and professional audio equipment, sales decreased mainly due to transferring the operations of Yamaha Music Schools in Japan to the Yamaha Music Foundation. North America Sales in North America amounted to ¥88,234 million, ¥8,487 million (or 10.6%) higher than in the previous fiscal year. This increase was accounted for mainly by expansion in sales of digital musical instruments and wind instruments. Europe Sales in Europe were ¥82,205 million, ¥1,927 million (or 2.4%) above the previous fiscal year. The increase was mainly attributable to sales of digital musical instruments and professional audio equipment. Asia, Oceania, and Other Areas Sales in Asia (excluding Japan), Oceania, and other areas amounted to ¥120,003 million, ¥8,225 million (or 7.4%) higher than in the previous fiscal year. Sales of pianos and digital musical instruments in China rose, and, in Other Areas, there were increases in sales of professional audio equipment.

4
2. Forecast for FY2017.3 The forecast for consolidated performance for the year ending March 2017 calls for net sales of ¥420.0 billion (an increase of 3.6%), operating income of ¥42.0 billion (an increase of 3.3%), ordinary income of ¥42.0 billion (an increase of 2.7%), and net income attributable to the owners of the parent company of ¥45.5 billion (an increase of 39.4%). This forecast takes account of a ¥4.2 billion decline in sales accompanying the transfer of Yamaha’s music school business in Japan to the Yamaha Music Foundation as well as a decrease in sales due to foreign currency fluctuations. In addition, the forecast includes income taxes––deferred of ¥13.5 billion accompanying the reporting of deferred tax assets after reviewing recoverability of such assets based on the recent trends in performance. The forward-looking statements in this flash report contain inherent risks and uncertainties insofar as they are based on future projections and plans that may differ materially from the actual results achieved.
(2) Analysis of Financial Position
1. Consolidated Financial Position 1) Assets Total assets decreased ¥60,289 million (or 11.4%) from the end of the previous fiscal year, to ¥469,745 million. Of this total, current assets rose ¥7,503 million (or 3.0%), to ¥255,135 million, due to rises in cash and deposits as well as in merchandise and finished goods. In addition, noncurrent assets decreased ¥67,792 million (or 24.0%), to ¥214,610 million, due to a decrease in investment securities associated with a decrease in the current market price of available-for-sale securities. 2) Liabilities Total liabilities decreased ¥15,426 million (or 8.5%) from the end of the previous fiscal year, to ¥165,856 million. Of this total, current liabilities decreased ¥5,516 million (or 6.8%), to ¥75,459 million. Noncurrent liabilities decreased ¥9,909 million (or 9.9%), to ¥90,396 million. 3) Net Assets Net assets decreased ¥44,862 million (or 12.9%) from the end of the previous fiscal year, to ¥303,889 million. This decrease was due to a decline in total accumulated other comprehensive income resulting from a decrease in the current market price of available-for-sale securities and a widening of the negative gap in the foreign currency translation adjustment due to fluctuations in the exchange rate. 2. Cash Flows Cash and cash equivalents (hereinafter, cash) at the end of the fiscal year ended March 31, 2016, showed an increase of ¥8,858 million (compared with an increase of ¥18,634 million in the previous fiscal year), and stood at ¥85,018 million. Cash Flows from Operating Activities As a result mainly of the contribution to cash flows of income before income taxes, cash flows provided by operating activities amounted to ¥42,399 million (compared with cash flows provided by operating activities of ¥31,729 million in the previous fiscal year). Cash Flows from Investing Activities Net cash provided by investing activities amounted to ¥591 million (compared with net cash flows used in investing activities of ¥11,700 million in the previous fiscal year). This net cash inflow arose primarily from proceeds from sales of property, plant and equipment and certain other items. Cash Flows from Financing Activities Net cash used in financing activities amounted to ¥30,349 million (compared with net cash used in financing activities of ¥5,909 million in the previous fiscal year). This net cash outflow was due mainly to purchase of treasury stock, cash dividends paid, and certain other items.
5
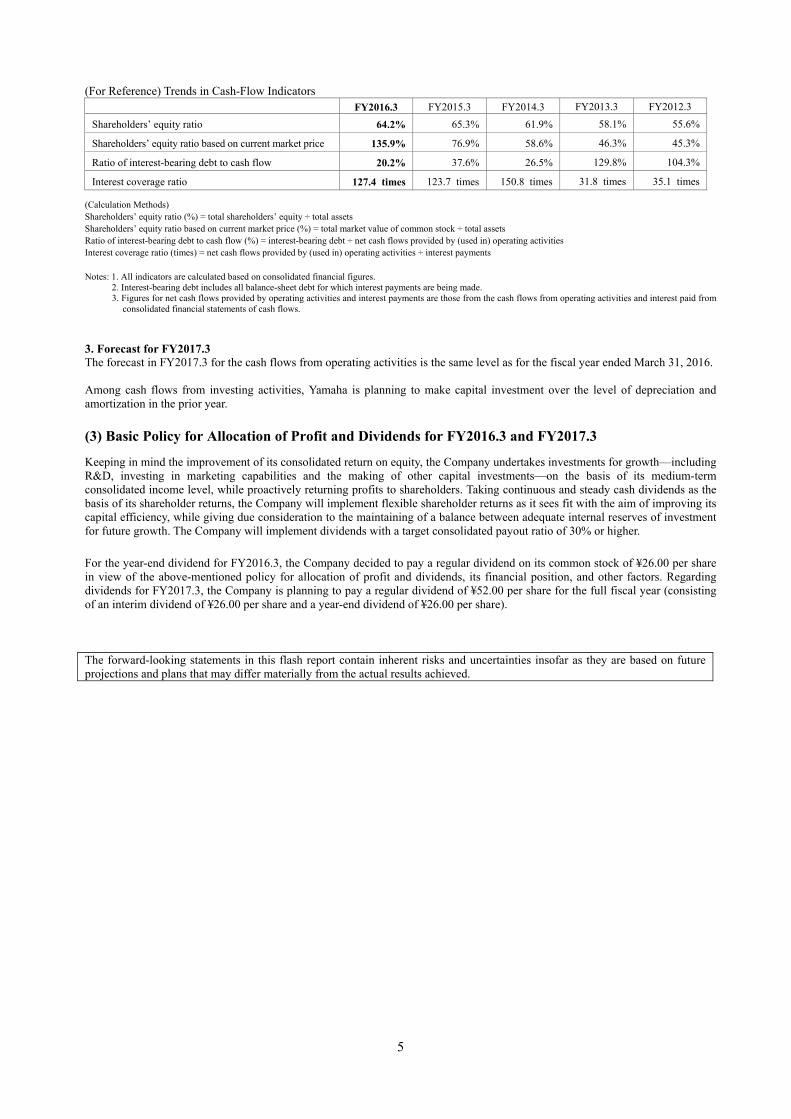
(For Reference) Trends in Cash-Flow Indicators FY2016.3 FY2015.3 FY2014.3 FY2013.3 FY2012.3
Shareholders’ equity ratio 64.2% 65.3% 61.9% 58.1% 55.6%
Shareholders’ equity ratio based on current market price 135.9% 76.9% 58.6% 46.3% 45.3%
Ratio of interest-bearing debt to cash flow 20.2% 37.6% 26.5% 129.8% 104.3%
Interest coverage ratio 127.4 times 123.7 times 150.8 times 31.8 times 35.1 times
(Calculation Methods) Shareholders’ equity ratio (%) = total shareholders’ equity ÷ total assets Shareholders’ equity ratio based on current market price (%) = total market value of common stock ÷ total assets Ratio of interest-bearing debt to cash flow (%) = interest-bearing debt ÷ net cash flows provided by (used in) operating activities Interest coverage ratio (times) = net cash flows provided by (used in) operating activities ÷ interest payments Notes: 1. All indicators are calculated based on consolidated financial figures.
2. Interest-bearing debt includes all balance-sheet debt for which interest payments are being made. 3. Figures for net cash flows provided by operating activities and interest payments are those from the cash flows from operating activities and interest paid from
consolidated financial statements of cash flows. 3. Forecast for FY2017.3 The forecast in FY2017.3 for the cash flows from operating activities is the same level as for the fiscal year ended March 31, 2016. Among cash flows from investing activities, Yamaha is planning to make capital investment over the level of depreciation and amortization in the prior year. (3) Basic Policy for Allocation of Profit and Dividends for FY2016.3 and FY2017.3
Keeping in mind the improvement of its consolidated return on equity, the Company undertakes investments for growth—including R&D, investing in marketing capabilities and the making of other capital investments—on the basis of its medium-term consolidated income level, while proactively returning profits to shareholders. Taking continuous and steady cash dividends as the basis of its shareholder returns, the Company will implement flexible shareholder returns as it sees fit with the aim of improving its capital efficiency, while giving due consideration to the maintaining of a balance between adequate internal reserves of investment for future growth. The Company will implement dividends with a target consolidated payout ratio of 30% or higher. For the year-end dividend for FY2016.3, the Company decided to pay a regular dividend on its common stock of ¥26.00 per share in view of the above-mentioned policy for allocation of profit and dividends, its financial position, and other factors. Regarding dividends for FY2017.3, the Company is planning to pay a regular dividend of ¥52.00 per share for the full fiscal year (consisting of an interim dividend of ¥26.00 per share and a year-end dividend of ¥26.00 per share). The forward-looking statements in this flash report contain inherent risks and uncertainties insofar as they are based on future projections and plans that may differ materially from the actual results achieved.

6
2. Management Policies (1) Basic Management Policy Yamaha Corporation and our Group companies (hereinafter referred to as “Yamaha” or “the Company” and the “Yamaha Group” or “the Group”) have issued the Yamaha Philosophy as our corporate philosophy and our Promises to Stakeholders, which we have made to all related parties, starting with our shareholders. By fulfilling our social responsibilities in such areas as compliance, the environment, safety, and contribution to the community even as we ensure a high level of profitability based on our global competitive prowess and increased business efficiency, we are working to ensure sustainable growth and to enhance the enterprise value over the medium-to-longer term. [Yamaha Philosophy] Corporate Slogan Sharing Passion & Performance Corporate Philosophy With our unique expertise and sensibilities, gained from our devotion to sound and music, we are
committed to creating excitement and cultural inspiration together with people around the world. Customer Experience*1 Joy, Beauty, Confidence, Discovery Yamaha Quality*2 Excellence, Authenticity, Innovation Yamaha Way*3 Embrace Your Will, Stand on Integrity, Take Proactive Actions, Go Beyond the Limits, Stick to the
Goals *1 The Customer Experience exemplifies the meaning of “Sharing Passion & Performance” from the customer’s viewpoint. When
customers experience, use, or own Yamaha products and services they should experience a profound response that will stimulate both their emotions and senses.
*2 The Yamaha Quality is a set of criteria that supports Yamaha’s insistence on quality in products and services and our dedication to excellence in manufacturing. These criteria assist in making the Corporate Philosophy a reality.
*3 The Yamaha Way explains the mindset that all employees of the Yamaha Group should adopt, and the manner in which they should act on a daily basis, in order to put the corporate philosophy into practice.
[Promises to Stakeholders] Customer-Oriented and Quality-Conscious Management Yamaha fully satisfies its customers by offering quality products and services that incorporate new and traditional technologies as well as refined creativity and artistry. Transparent and Sound Management Yamaha delivers proper returns to shareholders by ensuring a solid business performance and achieves lasting development through transparent and sound management. Valuing People Yamaha strives to be an organization where each person’s individuality and creativity are respected and all can demonstrate their full potential through their work. Harmony with Society Yamaha is a good corporate citizen that contributes to the development of society, culture, and the economy by observing laws, demonstrating high ethical standards, and endeavoring to protect the environment. (2) Management Indicators Taken as Objectives The management objectives and financial numerical targets set under the medium-term management plan (from the fiscal year ending March 31, 2017 to the fiscal year ending March 31, 2019) are outlined and described in the following sections of this report: Page 9: “(3) The Group’s Medium- to Long-Term Management Strategy and (4) Issues to Be Addressed: 7. Quantitative Business Targets. The targets for the next fiscal year ending March 31, 2017, are outlined and described in the following sections of this report: “3. Consolidated Financial Forecasts for FY2017.3” in the summary information; Page 4: “(1) Analysis of Management Performance: 2. Forecast for FY2017.3;” and Page 5: “(2) Analysis of Financial Position: 3. Forecast for FY2017.3.”
7
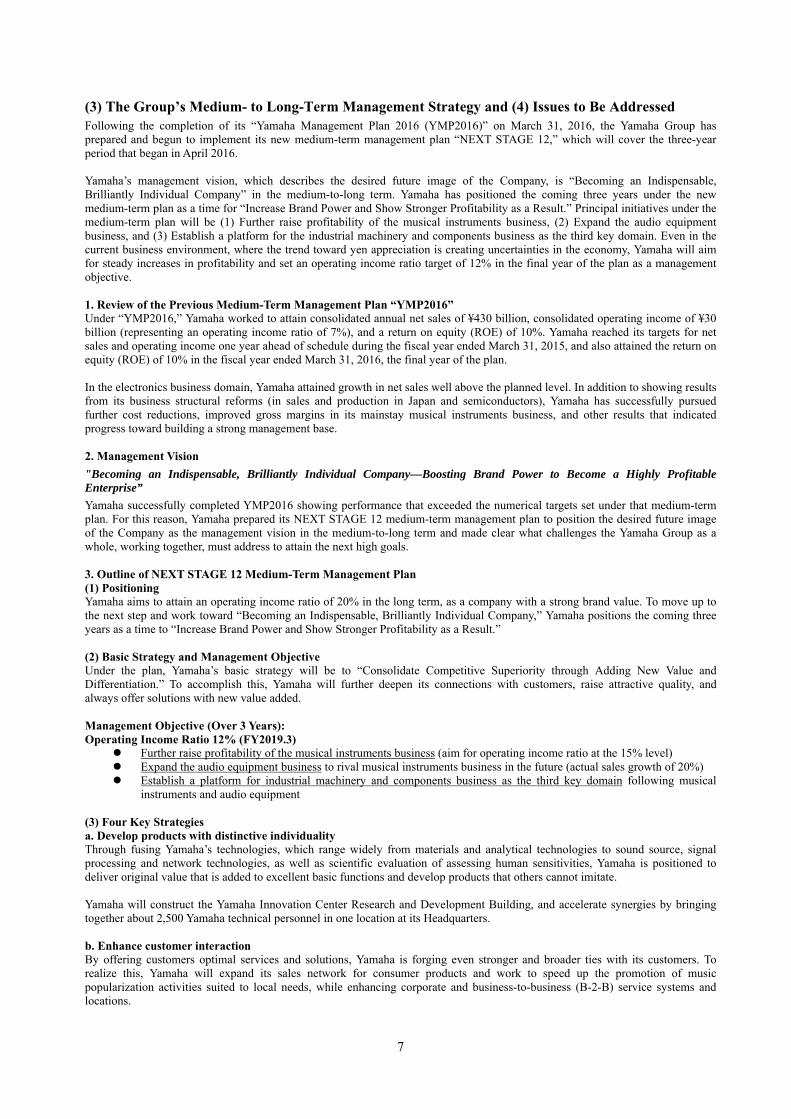
(3) The Group’s Medium- to Long-Term Management Strategy and (4) Issues to Be Addressed Following the completion of its “Yamaha Management Plan 2016 (YMP2016)” on March 31, 2016, the Yamaha Group has prepared and begun to implement its new medium-term management plan “NEXT STAGE 12,” which will cover the three-year period that began in April 2016. Yamaha’s management vision, which describes the desired future image of the Company, is “Becoming an Indispensable, Brilliantly Individual Company” in the medium-to-long term. Yamaha has positioned the coming three years under the new medium-term plan as a time for “Increase Brand Power and Show Stronger Profitability as a Result.” Principal initiatives under the medium-term plan will be (1) Further raise profitability of the musical instruments business, (2) Expand the audio equipment business, and (3) Establish a platform for the industrial machinery and components business as the third key domain. Even in the current business environment, where the trend toward yen appreciation is creating uncertainties in the economy, Yamaha will aim for steady increases in profitability and set an operating income ratio target of 12% in the final year of the plan as a management objective. 1. Review of the Previous Medium-Term Management Plan “YMP2016” Under “YMP2016,” Yamaha worked to attain consolidated annual net sales of ¥430 billion, consolidated operating income of ¥30 billion (representing an operating income ratio of 7%), and a return on equity (ROE) of 10%. Yamaha reached its targets for net sales and operating income one year ahead of schedule during the fiscal year ended March 31, 2015, and also attained the return on equity (ROE) of 10% in the fiscal year ended March 31, 2016, the final year of the plan. In the electronics business domain, Yamaha attained growth in net sales well above the planned level. In addition to showing results from its business structural reforms (in sales and production in Japan and semiconductors), Yamaha has successfully pursued further cost reductions, improved gross margins in its mainstay musical instruments business, and other results that indicated progress toward building a strong management base. 2. Management Vision "Becoming an Indispensable, Brilliantly Individual Company—Boosting Brand Power to Become a Highly Profitable Enterprise” Yamaha successfully completed YMP2016 showing performance that exceeded the numerical targets set under that medium-term plan. For this reason, Yamaha prepared its NEXT STAGE 12 medium-term management plan to position the desired future image of the Company as the management vision in the medium-to-long term and made clear what challenges the Yamaha Group as a whole, working together, must address to attain the next high goals. 3. Outline of NEXT STAGE 12 Medium-Term Management Plan (1) Positioning Yamaha aims to attain an operating income ratio of 20% in the long term, as a company with a strong brand value. To move up to the next step and work toward “Becoming an Indispensable, Brilliantly Individual Company,” Yamaha positions the coming three years as a time to “Increase Brand Power and Show Stronger Profitability as a Result.” (2) Basic Strategy and Management Objective Under the plan, Yamaha’s basic strategy will be to “Consolidate Competitive Superiority through Adding New Value and Differentiation.” To accomplish this, Yamaha will further deepen its connections with customers, raise attractive quality, and always offer solutions with new value added. Management Objective (Over 3 Years): Operating Income Ratio 12% (FY2019.3)
Further raise profitability of the musical instruments business (aim for operating income ratio at the 15% level) Expand the audio equipment business to rival musical instruments business in the future (actual sales growth of 20%) Establish a platform for industrial machinery and components business as the third key domain following musical
instruments and audio equipment
(3) Four Key Strategies a. Develop products with distinctive individuality Through fusing Yamaha’s technologies, which range widely from materials and analytical technologies to sound source, signal processing and network technologies, as well as scientific evaluation of assessing human sensitivities, Yamaha is positioned to deliver original value that is added to excellent basic functions and develop products that others cannot imitate. Yamaha will construct the Yamaha Innovation Center Research and Development Building, and accelerate synergies by bringing together about 2,500 Yamaha technical personnel in one location at its Headquarters. b. Enhance customer interaction By offering customers optimal services and solutions, Yamaha is forging even stronger and broader ties with its customers. To realize this, Yamaha will expand its sales network for consumer products and work to speed up the promotion of music popularization activities suited to local needs, while enhancing corporate and business-to-business (B-2-B) service systems and locations.

8
c. Continually reduce costs Under the new medium-term plan, Yamaha continues to reduce manufacturing costs (through reorganizing production processes, reducing purchasing costs, introducing new production methods, and other means) and to increase the productivity of administrative functions to realize about ¥8.0 billion (net over a three-year period) in cost reductions. d. Strengthen global business platforms Yamaha endeavors to facilitate international careers by assigning personnel to positions that are the most suited to them and to further their career development. In addition, Yamaha is working to globally optimize its IT, logistics, finance, and administrative functions to strengthen its global business platforms and to further promote operational efficiency. 4. Major Business Strategies (1) Musical Instruments Yamaha will aim to increase profitability through technology development capabilities and marketing that takes advantage of Yamaha’s business scale. To improve profitability, Yamaha will expand sales of high-margin digital musical instruments and improve gross margins by reviewing the product mix and selling prices. In addition, Yamaha will accelerate its activities to enhance product competitiveness through pursuing the essence of musical instruments using its original assessment technology of scientific evaluation of assessing human sensitivities and offering new value in digital musical instruments, hybrid pianos, and other products. Moreover, Yamaha will optimize its marketing and points of contact with customers by region to increase its brand power and enhance its customer interaction. (2) Audio Equipment Yamaha will work to accelerate growth by promoting technological innovation based on its signal processing and network technologies and enhancing customer support. In the professional audio equipment domain, Yamaha will provide audio systems that increase value added of audio contractors who partner with Yamaha. It will also expand its systems engineering and marketing staff worldwide and, in addition to providing services for concert halls and other venues, will work to broaden its customer base in other markets, including background music (BGM) for retail stores and corporate conferencing markets. In the consumer audio products domain, Yamaha will aim to strengthen its brand power by moving forward with its initiatives to propose freer music listening styles to meet customer needs, focusing on its strategic product MusicCast. (3) Industrial Machinery and Components Yamaha will establish a base that will enable it to make its industrial machinery and components business the third platform of Yamaha business activities. In this business, Yamaha will transform its focus from a semiconductor manufacturer to become a solutions vendor. Yamaha will endeavor to expand sales by offering solutions that are comfortable, secure, and safe, focusing especially on sound technology in the domains of onboard devices, home healthcare, and industrial machinery. In the onboard device domain, in addition to providing comprehensive sound systems, Yamaha will proceed with the development of thermoelectric solutions that contribute to the realization of an eco-friendly motorized society. In addition, in the home healthcare domain, Yamaha will move forward with applying its sound and sensor technologies to propose new solutions. 5. ESG With the aim of creating a sustainable society, Yamaha will continue to implement various activities from the perspective of “E” (Environment), “S” (Society), and “G” (Governance). Yamaha will work toward the solution of social issues through business activities that are based on business strategies, give due regard to the natural environment and society in its business processes and continue to implement various activities, and aim to conduct transparent, high-quality management by strengthening its corporate governance and internal control systems. 6. Investment and Return to Shareholders After the allocation of cash generated to strategic investments, Yamaha actively provides returns to shareholders. Capital expenditure: ¥40 billion Strategic investments: ¥50 billion (including M&A) Strategic marketing and R&D investments: ¥10 billion Yamaha’s basic policy is to pay continuing and stable dividends to shareholders, and give consideration to the balance between the appropriate level of retained earnings for investments for future growth, while flexibly providing appropriate returns to shareholders to increase capital efficiency. Note that, regarding dividends, Yamaha’s target ratio for its consolidated dividend payout is 30% or higher.

9
7. Quantitative Business Targets For the last year of “NEXT STAGE 12” (FY2019.3), Yamaha has set an operating income ratio target of 12% as a management objective. Note that the financial numerical targets (Currency exchange rates assumed: Yen per U.S. dollar: ¥115, Yen per euro: ¥125) are as follows.
Net sales: ¥465 billion Operating income: ¥55 billion ROE: 10% level Earnings per share (EPS): ¥200 level
3. Basic Approach to Selection of Accounting Standards For the time being, the Group will continue to adopt generally accepted accounting principles in Japan, and the timing for adopting the International Financial Reporting Standards (IFRS) has not been decided. However with an eye to the adoption of IFRS in the fiscal year ending March 2020, the Group is continuing to consider related issues and practical operational matters.

10
4. Consolidated Financial Statements (1) Consolidated Balance Sheets
(Millions of yen) FY2016.3 FY2015.3 (As of Mar. 31, 2016) (As of Mar. 31, 2015) ASSETS
Current assets: Cash and deposits ¥ 88,166 ¥ 79,300 Notes and accounts receivable—trade 49,026 61,663 Merchandise and finished goods 63,232 58,477 Work in process 12,825 13,303 Raw materials and supplies 15,808 16,002 Deferred tax assets 8,802 7,947 Other 18,521 12,293 Allowance for doubtful accounts (1,247) (1,354) Total current assets 255,135 247,632
Noncurrent assets: Property, plant and equipment:
Buildings and structures, net 33,728 35,754 Machinery, equipment and vehicles, net 12,722 13,405 Tools, furniture and fixtures, net 9,889 10,275 Land 46,061 49,207 Lease assets, net 333 375 Construction in progress 1,544 4,139 Total property, plant and equipment 104,280 113,158
Intangible assets: Goodwill 2,456 12,179 Other 3,104 3,455 Total intangible assets 5,560 15,635
Investments and other assets: Investment securities 96,911 144,836 Long-term loans receivable 122 135 Net defined benefit assets 6 74 Deferred tax assets 2,123 2,020 Lease and guarantee deposits 4,330 4,673 Other 1,379 2,018 Allowance for doubtful accounts (104) (151) Total investments and other assets 104,769 153,608
Total noncurrent assets 214,610 282,402 Total assets ¥469,745 ¥530,034
Note: Figures of less than ¥1 million have been omitted.

11
(Millions of yen) FY2016.3 FY2015.3 (As of Mar. 31, 2016) (As of Mar. 31, 2015) LIABILITIES
Current liabilities: Notes and accounts payable—trade ¥ 19,353 ¥ 23,194 Short-term loans payable 8,409 11,748 Current portion of long-term loans payable 30 28 Accounts payable—other and accrued expenses 37,222 34,902 Income taxes payable 2,307 2,156 Deferred tax liabilities 2 31 Provision for product warranties 2,526 2,511 Provision for directors’ bonuses ― 77 Provision for sales returns 93 127 Provision for business structural reform expenses ― 1,190 Provision for loss on construction contracts ― 8 Other 5,513 4,999 Total current liabilities 75,459 80,976
Noncurrent liabilities: Long-term loans payable 71 92 Deferred tax liabilities 24,750 39,422 Deferred tax liabilities for land revaluation 9,878 11,133 Net defined benefit liabilities 38,024 31,712 Long-term deposits received 15,041 15,152 Other 2,631 2,792 Total noncurrent liabilities 90,396 100,306
Total liabilities 165,856 181,282 NET ASSETS
Shareholders’ equity: Capital stock 28,534 28,534 Capital surplus 40,054 40,054 Retained earnings 213,050 186,436 Treasury stock (20,945) (3,711) Total shareholders’ equity 260,694 251,314
Accumulated other comprehensive income: Valuation difference on available-for-sale securities 55,038 87,188 Deferred gains or losses on hedges (97) 215 Revaluation reserve for land 16,743 18,085 Foreign currency translation adjustment (19,513) (9,106) Remeasurements of defined benefit plans (11,320) (1,611) Total accumulated other comprehensive income 40,850 94,771
Non-controlling interests 2,344 2,666 Total net assets 303,889 348,752
Total liabilities and net assets ¥469,745 ¥530,034
Note: Figures of less than ¥1 million have been omitted.

12
(2) Consolidated Statements of Operations and Consolidated Statements of Comprehensive Income Consolidated Statements of Operations
(Millions of yen) FY2016.3 FY2015.3
(Apr. 1, 2015–Mar. 31, 2016) (Apr. 1, 2014–Mar. 31, 2015) Net sales ¥435,477 ¥432,177 Cost of sales 262,406 270,357 Gross profit 173,070 161,820 Selling, general and administrative expenses 132,407 131,684 Operating income 40,663 30,135 Non-operating income:
Interest income 699 692 Dividends income 2,377 2,191 Patent income ― 623 Tariff refund 693 ―
Other 1,106 1,179 Total non-operating income 4,876 4,687
Non-operating expenses: Interest expenses 338 253 Sales discounts 2,909 2,641 Foreign exchange losses 598 84 Other 785 612 Total non-operating expenses 4,632 3,591
Ordinary income 40,907 31,231 Extraordinary income:
Gain on sales of noncurrent assets 8,963 161 Gain on sales of investment securities 3 1 Gain on liquidation of investment securities 13 ― Gain on liquidation of subsidiaries and affiliates ― 6 Total extraordinary income 8,979 168
Extraordinary loss: Loss on retirement of noncurrent assets 666 208 Loss on valuation of investment securities 0 ― Loss on sales of stocks of subsidiaries and affiliates ― 17 Impairment loss 882 861 Amortization of goodwill 6,759 ― Business structural reform expenses ― 1,786 Total extraordinary loss 8,309 2,874
Income before income taxes 41,578 28,526 Income taxes―current 9,541 7,317 Income taxes―deferred (656) (3,896) Total income taxes 8,885 3,420 Net income for the period 32,693 25,105 Net income attributable to non-controlling interests 59 176 Net income attributable to owners of parent ¥ 32,633 ¥ 24,929
Note: Figures of less than ¥1 million have been omitted.
13
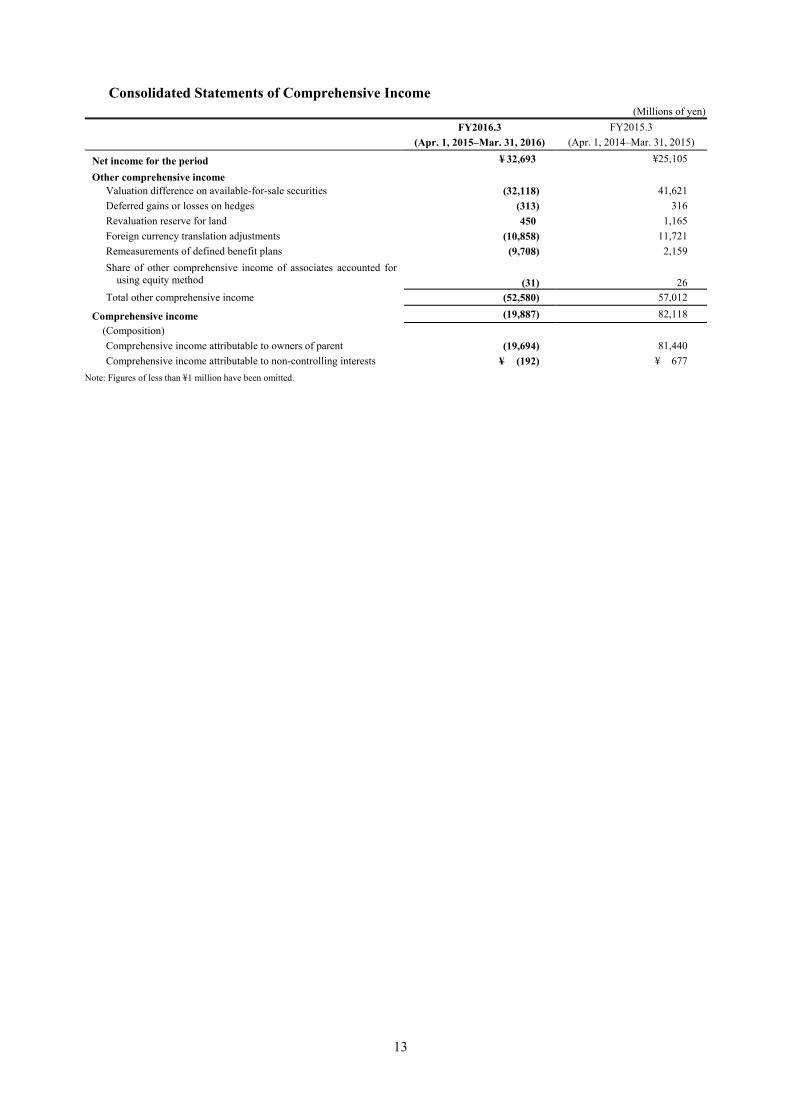
Consolidated Statements of Comprehensive Income (Millions of yen)
FY2016.3 FY2015.3 (Apr. 1, 2015–Mar. 31, 2016) (Apr. 1, 2014–Mar. 31, 2015)
Net income for the period ¥ 32,693 ¥25,105
Other comprehensive income Valuation difference on available-for-sale securities (32,118) 41,621 Deferred gains or losses on hedges (313) 316 Revaluation reserve for land 450 1,165 Foreign currency translation adjustments (10,858) 11,721 Remeasurements of defined benefit plans (9,708) 2,159 Share of other comprehensive income of associates accounted for
using equity method (31) 26 Total other comprehensive income (52,580) 57,012
Comprehensive income (19,887) 82,118 (Composition) Comprehensive income attributable to owners of parent (19,694) 81,440 Comprehensive income attributable to non-controlling interests ¥ (192) ¥ 677
Note: Figures of less than ¥1 million have been omitted.

14
(3) Consolidated Statements of Changes in Shareholders’ Equity
FY2016.3 (April 1, 2015-March 31, 2016) (Millions of yen) Shareholders’ equity
Capital stock Capital surplus Retained earnings Treasury stock Total shareholders’ equity
Balance at beginning of period ¥28,534 ¥40,054 ¥186,436 ¥ (3,711) ¥251,314
Changes of items during the period Dividends from surplus (7,841) (7,841) Net income attributable to owners of parent 32,633 32,633
Change of scope of consolidation 29 29 Reversal of revaluation reserve for land 1,791 1,791
Purchase of treasury stock (17,234) (17,234) Net changes of items other than shareholders’ equity
Total changes of items during the period ― ― 26,613 (17,234) 9,379 Balance at the end of period ¥28,534 ¥40,054 ¥213,050 ¥(20,945) ¥260,694
Accumulated other comprehensive income
Non-controlling interests Total net assets Valuation
difference on available-for-sale
securities
Deferred gains or losses on hedges
Revaluation reserve for land
Foreign currency translation adjustment
Remeasurements of defined benefit
plans
Total accumulated other
comprehensive income
Balance at beginning of period ¥87,188 ¥215 ¥18,085 ¥ (9,106) ¥ (1,611) ¥94,771 ¥2,666 ¥348,752
Changes of items during the period Dividends from surplus (7,841)Net income attributable to owners of parent 32,633
Change of scope of consolidation 29Reversal of revaluation reserve for land 1,791
Purchase of treasury stock (17,234)Net changes of items other than shareholders’ equity (32,150) (313) (1,341) (10,406) (9,708) (53,920) (321) (54,242)
Total changes of items during the period (32,150) (313) (1,341) (10,406) (9,708) (53,920) (321) (44,862)Balance at the end of period ¥55,038 ¥ (97) ¥16,743 ¥(19,513) ¥(11,320) ¥40,850 ¥2,344 ¥303,889

15
FY2015.3 (April 1, 2014-March 31, 2015) (Millions of yen) Shareholders’ equity
Capital stock Capital surplus Retained earnings Treasury stock Total shareholders’ equity
Balance at beginning of period ¥28,534 ¥40,054 ¥168,338 ¥(3,705) ¥233,222
Changes of items during the period
Dividends from surplus (6,389) (6,389)
Net income attributable to owners of parent 24,929 24,929
Change of scope of consolidation (661) (661)
Reversal of revaluation reserve for land 219 219
Purchase of treasury stock (5) (5)
Net changes of items other than shareholders’ equity
Total changes of items during the period ― ― 18,097 (5) 18,092
Balance at the end of period ¥28,534 ¥40,054 ¥186,436 ¥(3,711) ¥251,314
Accumulated other comprehensive income
Non-controlling interests Total net assets Valuation
difference on available-for-sale
securities
Deferred gains or losses on hedges
Revaluation reserve for land
Foreign currency translation adjustment
Remeasurements of defined benefit
plans
Total accumulated other
comprehensive income
Balance at beginning of period ¥45,540 ¥(101) ¥17,139 ¥(20,347) ¥(3,771) ¥38,459 ¥3,161 ¥274,843
Changes of items during the period
Dividends from surplus (6,389)
Net income attributable to owners of parent 24,929
Change of scope of consolidation (661)
Reversal of revaluation reserve for land 219
Purchase of treasury stock (5)
Net changes of items other than shareholders’ equity
41,648 316 945 11,241 2,159 56,312 (495) 55,816
Total changes of items during the period 41,648 316 945 11,241 2,159 56,312 (495) 73,908
Balance at the end of period ¥87,188 ¥ 215 ¥18,085 ¥ (9,106) ¥(1,611) ¥94,771 ¥2,666 ¥348,752

16
(4) Consolidated Statements of Cash Flows (Millions of yen)
FY2016.3 FY2015.3 (Apr. 1, 2015–Mar. 31, 2016) (Apr. 1, 2014–Mar. 31, 2015)Net cash provided by (used in) operating activities:
Income before income taxes ¥41,578 ¥28,526 Depreciation and amortization 12,681 12,597 Impairment loss 882 861 Amortization of goodwill 9,553 2,913 Increase (decrease) in allowance for doubtful accounts (91) 192 (Gain) on liquidation of subsidiaries and affiliates ― (6) Loss (gain) on valuation of investment securities 0 ― (Gain) on sales of investment securities (3) (1) (Gain) on liquidation of investment securities (13) ― (Decrease) in net defined benefit liabilities (3,172) (2,889) Interest and dividends income (3,077) (2,884) Interest expenses 338 253 Foreign exchange (gains) losses 286 (465) Equity in losses of affiliates 6 20 Loss on sales of stocks of subsidiaries and affiliates ― 17 (Gain) on sales of noncurrent assets (8,963) (161) Loss on retirement of noncurrent assets 666 208 Business structural reform expenses ― 1,786 (Increase) decrease in notes and accounts receivable—trade 9,947 (473) (Increase) in inventories (8,523) (267) (Decrease) in notes and accounts payable—trade (1,921) (1,185) Other, net 273 (1,496) Subtotal 50,449 37,547 Interest and dividends income received 3,137 2,859 Interest expenses paid (332) (256) Payment of business structural reform expenses (1,543) (340) Income taxes paid (9,311) (8,080) Net cash provided by (used in) operating activities ¥42,399 ¥31,729

17
(Millions of yen) FY2016.3 FY2015.3 (Apr. 1, 2015–Mar. 31, 2016) (Apr. 1, 2014–Mar. 31, 2015)
Net cash provided by (used in) investing activities: Net decrease (increase) in time deposits ¥ (300) ¥ 290 Purchase of property, plant and equipment (11,432) (12,530) Proceeds from sales of property, plant and equipment 12,811 809 Purchase of investment securities (250) (219) Proceeds from sales of investment securities 41 90 Proceeds from liquidation of investment securities 27 ― Payments for investments in capital (0) (3) Payments of loans receivable (93) (147) Collection of loans receivable 43 138 Other, net (255) (126) Net cash provided by (used in) investing activities 591 (11,700)
Net cash provided by (used in) financing activities: Net increase (decrease) in short-term loans payable (2,188) 1,925 Proceeds from long-term loans payable 93 18 Repayment of long-term loans payable (111) (63) Proceeds from deposits received from membership 150 157 Repayments for deposits received from membership (261) (343) Purchase of treasury stock (17,234) (5) Payments made to trust account for purchase of treasury stock (2,793) ― Cash dividends paid (7,841) (6,389) Cash dividends paid to non-controlling interests (129) (1,173) Other, net (31) (34) Net cash provided by (used in) financing activities (30,349) (5,909)
Effect of exchange rate change on cash and cash equivalents (3,782) 3,573 Net increase (decrease) in cash and cash equivalents 8,859 17,692 Cash and cash equivalents at beginning of period 76,159 57,524 Increase in cash and cash equivalents from newly consolidated
subsidiary 858 950
Decrease in cash and cash equivalents resulting from exclusion of subsidiaries from consolidation (858) (8)
Cash and cash equivalents at end of period ¥85,018 ¥76,159
Note: Figures of less than ¥1 million have been omitted.

18
(5) Notes to the Consolidated Financial Statements Notes Regarding Assumptions as a Going Concern
None applicable
Changes in Accounting Principles
The “Revised Accounting Standard for Business Combinations” (ASBJ Statement No. 21, September 13, 2013, hereinafter referred to as the “Business Combinations Accounting Standards”), the “Revised Accounting Standard for Consolidated Financial Statements” (ASBJ Statement No. 22, September 13, 2013, hereinafter referred to as the “Consolidated Financial Statements Accounting Standard”), and the “Revised Accounting Standard for Business Divestitures” (ASBJ Statement No. 7, September 13, 2013, hereinafter referred to as the “Business Divestitures Accounting Standard”) became applicable at the beginning of FY2016.3. As a result, for subsidiaries the Company continues to control, differences arising due to changes in the equity portion are entered in capital surplus, and costs associated with the acquisition of shares are now treated as expenses in the consolidated fiscal year in which they are incurred. In addition, for business combinations that are implemented on and after the beginning of FY2016.3, the allocation of the cost of acquisitions, as determined after review of provisional accounting treatment, is reflected in the consolidated financial statements in which the business combination took place. Additionally, the Company has changed the method of presenting consolidated net income and moved minority interests in income to the non-controlling interest item. To reflect these changes, the Company has reclassified the consolidated financial statements for the previous fiscal year. Regarding the application of the Business Combinations Accounting Standards, the Company has applied the provisional accounting treatment contained in Business Combination Accounting Standard 58-2 (4), Consolidated Financial Statements Accounting Standard 44-5 (4), and Business Divestitures Accounting Standard 57-4 (4) and will continue to apply these standards from the beginning of FY2016.3 into the future. In the consolidated cash flow statements for the period under review, the following changes are made in the method of classification. Cash flows related to purchases or sales of shares of subsidiaries that are not accompanied by a change in the scope of consolidation have been included in “Cash flows from financing activities.” Cash flows related to expenses arising due to purchases of shares of subsidiaries accompanying a change in the scope of consolidation or cash flows related to expenses due to purchases or sales of shares of subsidiaries that are not accompanied by a change of the scope of consolidation have been included in “Cash flows from operating activities.” Please note there was no material impact on the consolidated financial statements and the per share information of FY2016.3.
Additional Information
Extraordinary losses due to impairment loss on stock of consolidated subsidiary and immediate amortization of goodwill
The Company reported extraordinary losses in FY2016.3 because of the impairment loss on stock of a consolidated subsidiary held by the Company (in the non-consolidated closing) and the immediate amortization of goodwill (in the consolidated closing). 1. Impairment loss of stock of consolidated subsidiary (in the non-consolidated closing) The Company reported ¥8,493 million of extraordinary losses as loss on valuation of stocks of subsidiaries and affiliates, namely, Line 6, Inc., a company that became a wholly owned subsidiary in January 2014, with its subsidiaries. This course of action was taken because performance results and results expected from drawing on the product planning and development capabilities of those subsidiaries diverged from initial plans. In addition, the Company reported extraordinary losses due to ¥420 million in provisions for loss on support of subsidiaries. Also, the Company reported ¥3,603 million of extraordinary losses due to loss on valuation of stocks of subsidiaries and affiliates, namely, Revolabs, Inc., a company that became a wholly owned subsidiary in March 2014, together with its subsidiaries. This course of action was taken because performance results of those subsidiaries diverged from initial plans. Please note that the extraordinary losses shown in the non-consolidated closing have been eliminated in consolidation; therefore, the impact of these extraordinary losses in the consolidated closing are equal to those shown in section 2. 2. Immediate amortization of goodwill (in the consolidated closing) Accompanying the impairment loss in the non-consolidated closing noted in the previous item, in its consolidated closing, the Company reported extraordinary losses on the immediate amortization of goodwill related to Line 6, Inc., and its subsidiaries of ¥4,457 million and ¥2,302 million related to Revolabs, Inc., and its subsidiaries.
19
Amendment to deferred tax asset and deferred tax liability amounts due to a change of the tax rate for taxes, such as corporation tax
Accompanying the implementation on March 29, 2016, of the Law Revising a Portion of Income Taxation, Etc. and the Law Revising a Portion of Local Taxation, Etc., the legal effective tax rate applicable to the calculation of consolidated deferred tax assets and tax liabilities (applicable only to such assets and liabilities that will expire on and after April 1, 2016) that was used was 32.11% for recoveries and payments that are expected from April 1, 2015, to March 31, 2016, and 31.33% for those expected on April 1, 2016, and later. For recoveries and payments that are expected from April 1, 2016, through March 31, 2018, the tax rate has been changed to 30.21%, and then 29.99% for recoveries and payments expected after April 1, 2018. As a result of this change, the net value of the Group’s deferred tax liabilities (after the deduction of the amount of deferred tax assets) decreased ¥1,170 million, and income taxes––deferred, valuation difference on available-for-sale securities, and revaluation reserve for land increased ¥289 million, ¥1,021 million, and ¥441 million, respectively, while deferred gains or losses on hedges decreased ¥2 million.
Consolidated Statements of Operations
Impairment Losses
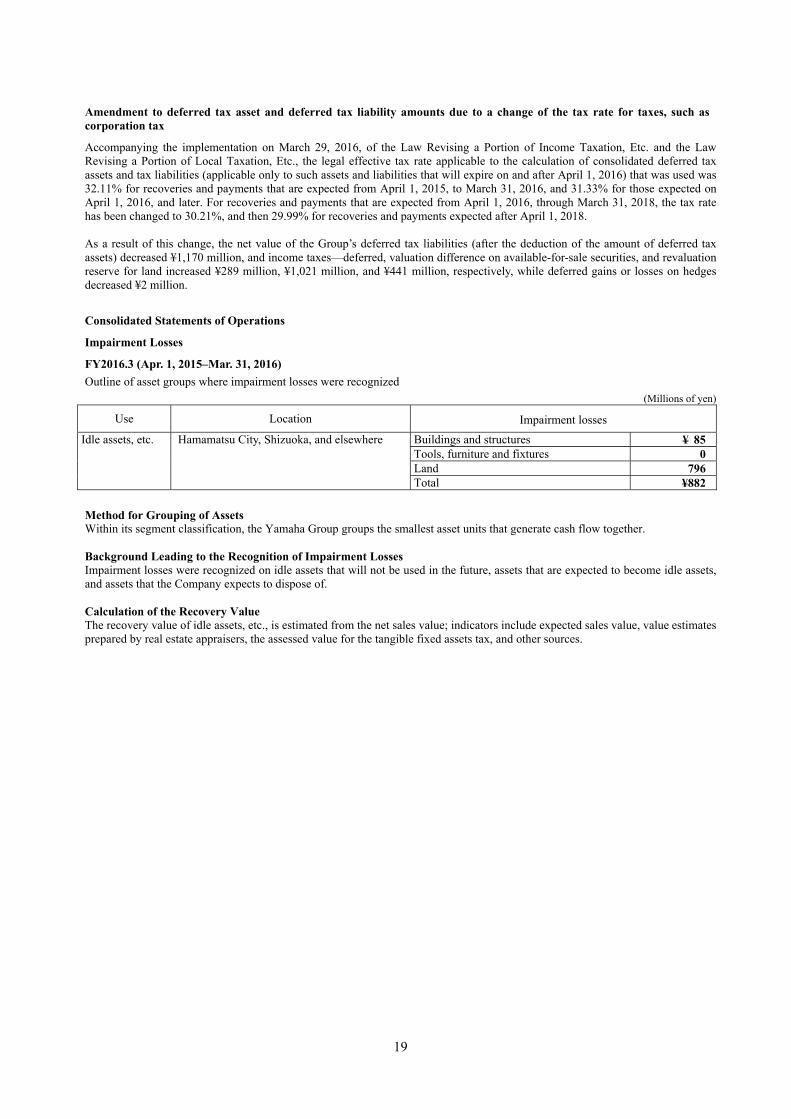
FY2016.3 (Apr. 1, 2015–Mar. 31, 2016) Outline of asset groups where impairment losses were recognized
(Millions of yen)
Use Location Impairment losses
Idle assets, etc. Hamamatsu City, Shizuoka, and elsewhere Buildings and structures ¥ 85 Tools, furniture and fixtures 0 Land 796 Total ¥882 Method for Grouping of Assets Within its segment classification, the Yamaha Group groups the smallest asset units that generate cash flow together. Background Leading to the Recognition of Impairment Losses Impairment losses were recognized on idle assets that will not be used in the future, assets that are expected to become idle assets, and assets that the Company expects to dispose of. Calculation of the Recovery Value The recovery value of idle assets, etc., is estimated from the net sales value; indicators include expected sales value, value estimates prepared by real estate appraisers, the assessed value for the tangible fixed assets tax, and other sources.
20
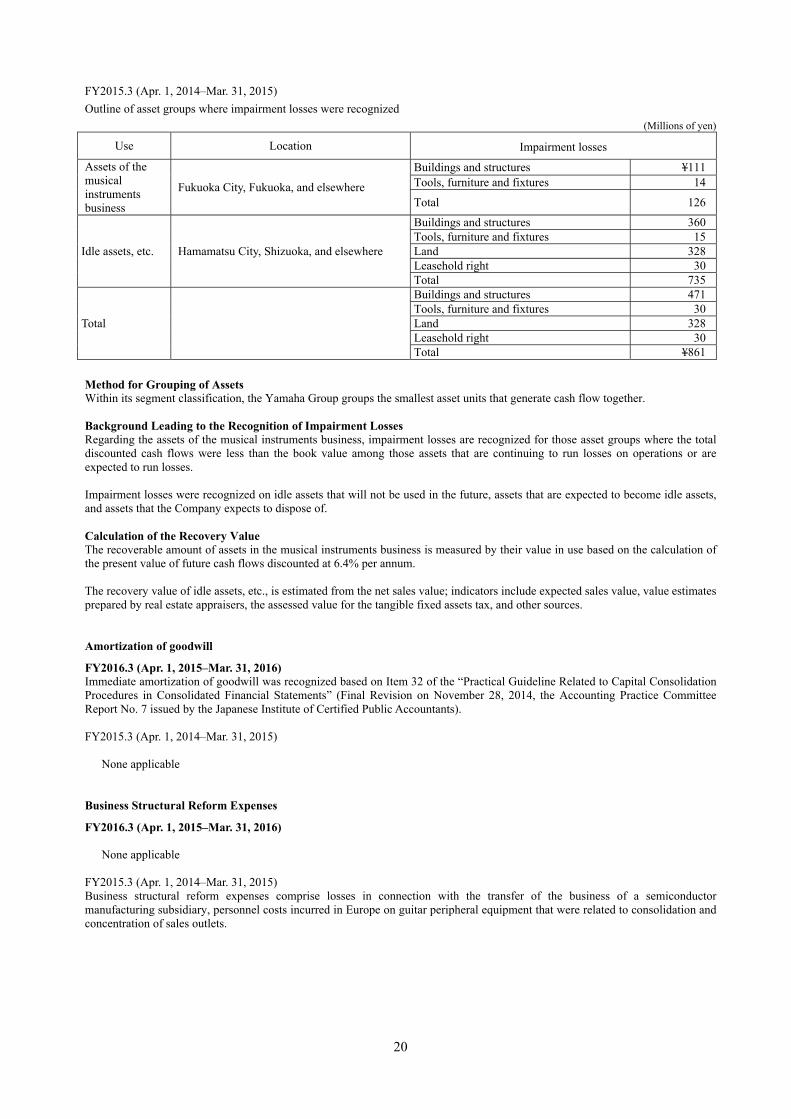
FY2015.3 (Apr. 1, 2014–Mar. 31, 2015) Outline of asset groups where impairment losses were recognized
(Millions of yen)
Use Location Impairment losses
Assets of the musical instruments business
Fukuoka City, Fukuoka, and elsewhere
Buildings and structures ¥111Tools, furniture and fixtures 14
Total 126
Idle assets, etc. Hamamatsu City, Shizuoka, and elsewhere
Buildings and structures 360Tools, furniture and fixtures 15Land 328Leasehold right 30Total 735
Buildings and structures 471 Tools, furniture and fixtures 30Total Land 328 Leasehold right 30 Total ¥861 Method for Grouping of Assets Within its segment classification, the Yamaha Group groups the smallest asset units that generate cash flow together. Background Leading to the Recognition of Impairment Losses Regarding the assets of the musical instruments business, impairment losses are recognized for those asset groups where the total discounted cash flows were less than the book value among those assets that are continuing to run losses on operations or are expected to run losses. Impairment losses were recognized on idle assets that will not be used in the future, assets that are expected to become idle assets, and assets that the Company expects to dispose of. Calculation of the Recovery Value The recoverable amount of assets in the musical instruments business is measured by their value in use based on the calculation of the present value of future cash flows discounted at 6.4% per annum. The recovery value of idle assets, etc., is estimated from the net sales value; indicators include expected sales value, value estimates prepared by real estate appraisers, the assessed value for the tangible fixed assets tax, and other sources. Amortization of goodwill
FY2016.3 (Apr. 1, 2015–Mar. 31, 2016) Immediate amortization of goodwill was recognized based on Item 32 of the “Practical Guideline Related to Capital Consolidation Procedures in Consolidated Financial Statements” (Final Revision on November 28, 2014, the Accounting Practice Committee Report No. 7 issued by the Japanese Institute of Certified Public Accountants). FY2015.3 (Apr. 1, 2014–Mar. 31, 2015)
None applicable Business Structural Reform Expenses
FY2016.3 (Apr. 1, 2015–Mar. 31, 2016)
None applicable FY2015.3 (Apr. 1, 2014–Mar. 31, 2015) Business structural reform expenses comprise losses in connection with the transfer of the business of a semiconductor manufacturing subsidiary, personnel costs incurred in Europe on guitar peripheral equipment that were related to consolidation and concentration of sales outlets.

21
Segment Information
1. Summary of Reporting Segments Business segments are composed of business units that provide separate financial information, and are regularly reviewed by the Board of Directors of the Company for the purpose of business performance evaluation and management resource allocation decisions. The Company’s business segments, based on its economic features and similarity of products and services, comprise its three principal reporting segments, which are musical instruments, audio equipment, and electronic devices. Other businesses have been grouped together in the “Others” segment. The musical instruments business segment includes the manufacture and sales of pianos; digital musical instruments; wind, string, and percussion instruments; and other music-related activities. The audio equipment business segment includes the manufacture and sales of audio products, professional audio equipment, information and telecommunication equipment, and certain other products. The electronic devices business segment includes the manufacture and sales of semiconductor products. The “Others” segment includes automobile interior components, factory automation (FA) equipment, golf products, recreation, and certain other lines of business. 2. Method for Calculating the Sales, Income (Loss), Assets, Liabilities, and Other Items for Reporting Segments The accounting treatment for reporting business segments is carried out through principles and procedures that are all the same as the methods adopted for preparation of the consolidated financial statements. Figures for income in reporting segments are on an operating income basis. Intersegment sales and transfers are based on prevailing market prices. 3. Information on the Amounts of Sales, Income (Loss), Assets, Liabilities, and Other Items for Reporting Segments FY2016.3 (April 1, 2015-March 31, 2016) (Millions of yen)
Musical instruments
Audio equipment
Electronic devices Others Total Adjustments Consolidated
Sales to external customers ¥278,872 ¥119,378 ¥13,068 ¥ 24,156 ¥435,477 ¥435,477 Intersegment sales or
transfers 544 544 (544)
Total 278,872 119,378 13,613 24,156 436,021 (544) 435,477
Segment income ¥ 31,530 ¥ 8,693 ¥ 107 ¥ 332 ¥ 40,663 ¥ 40,663
Segment assets 272,690 81,052 10,292 105,710 469,745 469,745
Other items Depreciation and
amortization 8,390 3,075 464 750 12,681 12,681
Impairment loss 882 882 882 Increase in property, plant
and equipment and intangible assets
¥ 6,778 ¥ 3,145 ¥ 617 ¥ 801 ¥ 11,341 ¥ 11,341
Notes: 1. The item “Adjustments” contains the following: The sales adjustment item of ¥(544) million, which comprises eliminations of transactions among the Company’s business segments.
2. “Segment income (loss)” means the operating income (loss) of the segment as presented in the Consolidated Statements of Operations. 3. Among the assets of the Others segment, the amount of investment securities related to Yamaha Motor Co., Ltd. (the market value reported on the Consolidated
Balance Sheets) is ¥79,827 million.
22
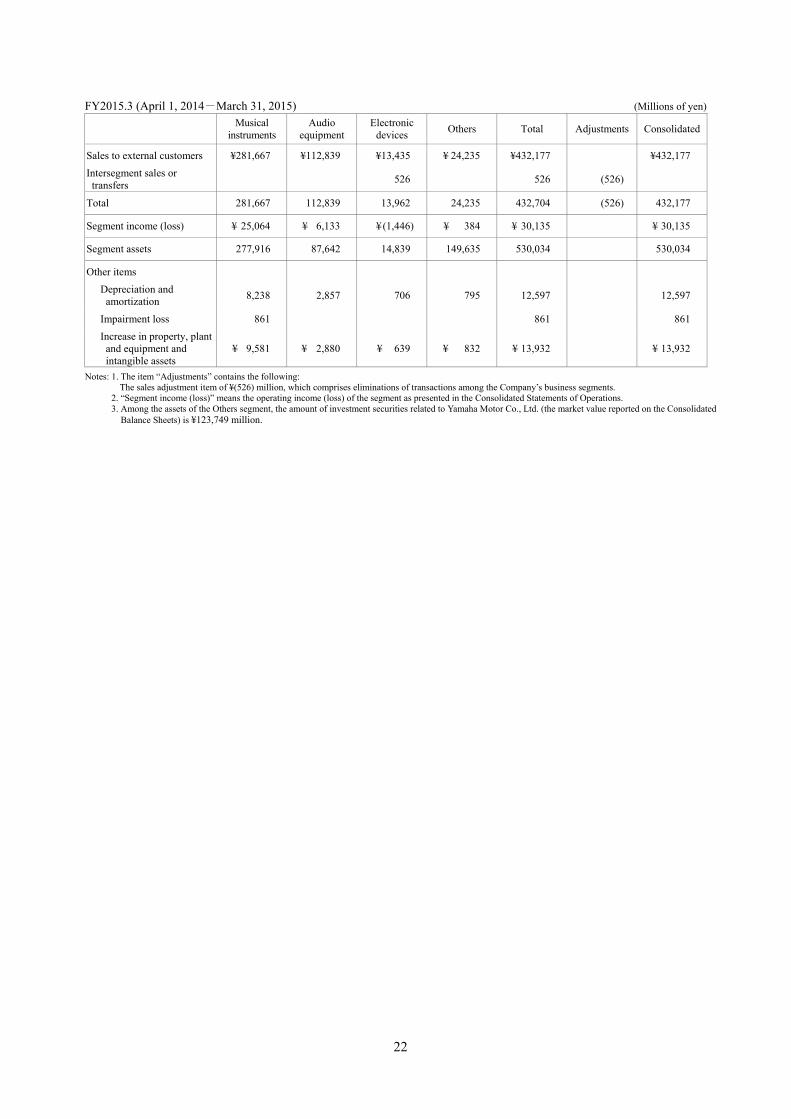
FY2015.3 (April 1, 2014-March 31, 2015) (Millions of yen)
Musical instruments
Audio equipment
Electronic devices Others Total Adjustments Consolidated
Sales to external customers ¥281,667 ¥112,839 ¥13,435 ¥ 24,235 ¥432,177 ¥432,177 Intersegment sales or
transfers 526 526 (526)
Total 281,667 112,839 13,962 24,235 432,704 (526) 432,177
Segment income (loss) ¥ 25,064 ¥ 6,133 ¥ (1,446) ¥ 384 ¥ 30,135 ¥ 30,135
Segment assets 277,916 87,642 14,839 149,635 530,034 530,034
Other items Depreciation and
amortization 8,238 2,857 706 795 12,597 12,597
Impairment loss 861 861 861 Increase in property, plant
and equipment and intangible assets
¥ 9,581 ¥ 2,880 ¥ 639 ¥ 832 ¥ 13,932 ¥ 13,932
Notes: 1. The item “Adjustments” contains the following: The sales adjustment item of ¥(526) million, which comprises eliminations of transactions among the Company’s business segments.
2. “Segment income (loss)” means the operating income (loss) of the segment as presented in the Consolidated Statements of Operations. 3. Among the assets of the Others segment, the amount of investment securities related to Yamaha Motor Co., Ltd. (the market value reported on the Consolidated
Balance Sheets) is ¥123,749 million.
23
Related Information
1. Information by product and service Since the Company discloses the same information in its segment information section, it has been omitted.
2. Information by geographical segment
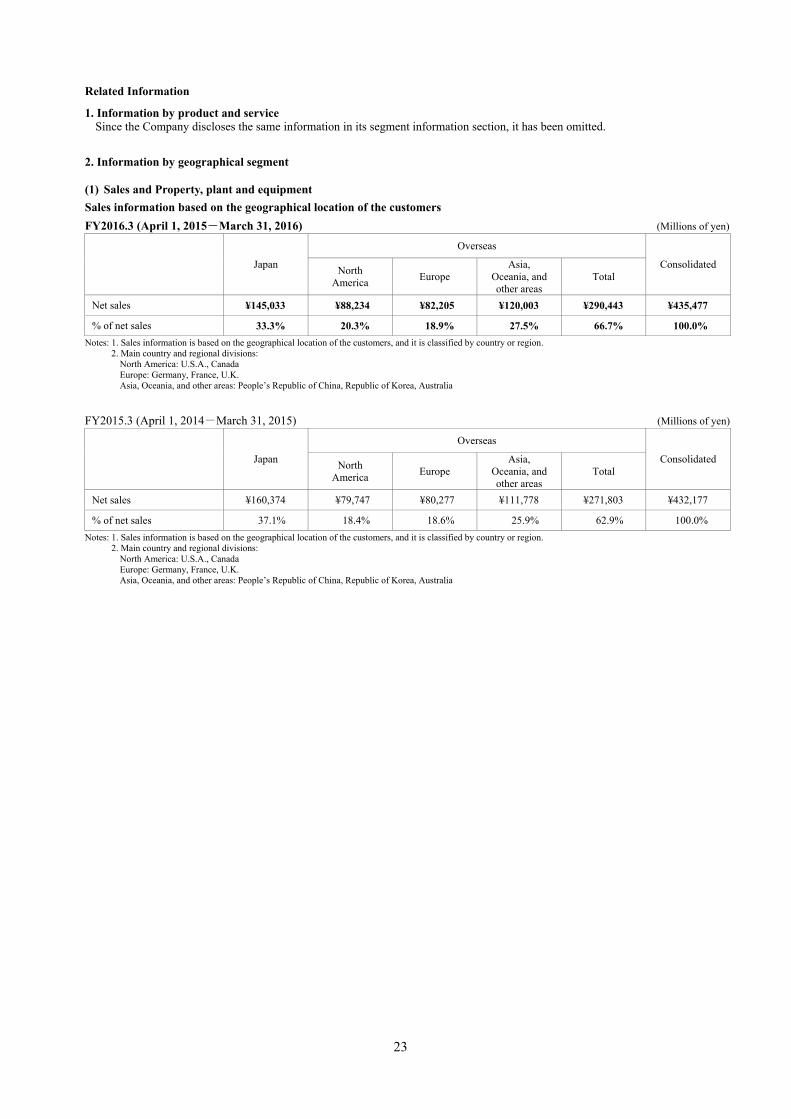
(1) Sales and Property, plant and equipment Sales information based on the geographical location of the customers FY2016.3 (April 1, 2015-March 31, 2016) (Millions of yen)
Japan
Overseas
Consolidated North America Europe
Asia, Oceania, and other areas
Total
Net sales ¥145,033 ¥88,234 ¥82,205 ¥120,003 ¥290,443 ¥435,477
% of net sales 33.3% 20.3% 18.9% 27.5% 66.7% 100.0% Notes: 1. Sales information is based on the geographical location of the customers, and it is classified by country or region.
2. Main country and regional divisions: North America: U.S.A., Canada Europe: Germany, France, U.K. Asia, Oceania, and other areas: People’s Republic of China, Republic of Korea, Australia
FY2015.3 (April 1, 2014-March 31, 2015) (Millions of yen)
Japan
Overseas
Consolidated North America Europe
Asia, Oceania, and other areas
Total
Net sales ¥160,374 ¥79,747 ¥80,277 ¥111,778 ¥271,803 ¥432,177
% of net sales 37.1% 18.4% 18.6% 25.9% 62.9% 100.0% Notes: 1. Sales information is based on the geographical location of the customers, and it is classified by country or region.
2. Main country and regional divisions: North America: U.S.A., Canada Europe: Germany, France, U.K. Asia, Oceania, and other areas: People’s Republic of China, Republic of Korea, Australia

24
Sales information based on Group locations where sales take place FY2016.3 (April 1, 2015-March 31, 2016) (Millions of yen)
Japan North
America Europe Asia,
Oceania, andother areas
Total Adjustments Consolidated
Sales to external customers ¥154,957 ¥93,577 ¥82,685 ¥104,256 ¥435,477 ¥435,477
Intersegment sales or transfers 170,025 3,566 2,332 101,290 277,215 (277,215)
Total 324,983 97,143 85,017 205,547 712,692 (277,215) 435,477
Segment income ¥ 20,396 ¥ 2,161 ¥ 4,424 ¥ 14,193 ¥ 41,175 (512) ¥ 40,663
Segment assets 303,374 42,482 39,890 112,469 498,217 (28,472) 469,745
Property, plant and equipment ¥ 75,155 ¥ 1,608 ¥ 3,303 ¥ 24,215 ¥104,280 ¥104,280 Notes: 1. Sales information is based on Group locations where sales take place, and it is classified by country or region.
2. Main country and regional divisions: This classification is the same as the one for “Sales information based on the geographical location of the customers.”
3. The item “Adjustments” contains the following: The sales adjustment item of ¥(277,215) million, which comprises eliminations of transactions among the Company’s business segments.
4. “Segment income” means the operating income of the segment as presented in the Consolidated Statements of Operations.
FY2015.3 (April 1, 2014-March 31, 2015) (Millions of yen)
Japan North
America Europe Asia,
Oceania, andother areas
Total Adjustments Consolidated
Sales to external customers ¥171,882 ¥85,517 ¥78,516 ¥ 96,261 ¥432,177 ¥432,177
Intersegment sales or transfers 155,004 1,385 2,342 91,295 250,027 (250,027)
Total 326,887 86,903 80,858 187,556 682,205 (250,027) 432,177
Segment income (loss) ¥ 15,439 ¥ (309) ¥ 3,581 ¥ 11,997 ¥ 30,708 (572) ¥ 30,135
Segment assets 350,928 52,277 38,794 115,825 557,825 (27,790) 530,034
Property, plant and equipment ¥ 81,473 ¥ 1,508 ¥ 3,433 ¥ 26,745 ¥113,158 ¥113,158 Notes: 1. Sales information is based on Group locations where sales take place, and it is classified by country or region.
2. Main country and regional divisions: This classification is the same as the one for “Sales information based on the geographical location of the customers.”
3. The item “Adjustments” contains the following: The sales adjustment item of ¥(250,027) million, which comprises eliminations of transactions among the Company’s business segments.
4. “Segment income (loss)” means the operating income (loss) of the segment as presented in the Consolidated Statements of Operations.

25
3. Information by principal customer
None applicable Information on impairment losses on noncurrent assets by reporting segment
Since the Company discloses the same information in its segment information section, it has been omitted. Information related to the amount of amortization of goodwill and the unamortized amount of goodwill by reporting segment FY2016.3 (April 1, 2015-March 31, 2016) (Millions of yen) Musical instruments Audio equipment Electronic devices Others Total Amount amortized in FY2016.3 ¥5,651 ¥3,901 ¥― ¥― ¥9,553
Balance as of March 31, 2016 ¥ 113 ¥2,342 ¥― ¥― ¥2,456
FY2015.3 (April 1, 2014-March 31, 2015) (Millions of yen) Musical instruments Audio equipment Electronic devices Others Total Amount amortized in FY2015.3 ¥1,452 ¥1,460 ¥― ¥― ¥ 2,913
Balance as of March 31, 2015 ¥5,779 ¥6,400 ¥― ¥― ¥12,179
Information on profit arising from negative goodwill by reporting segment
None applicable
26
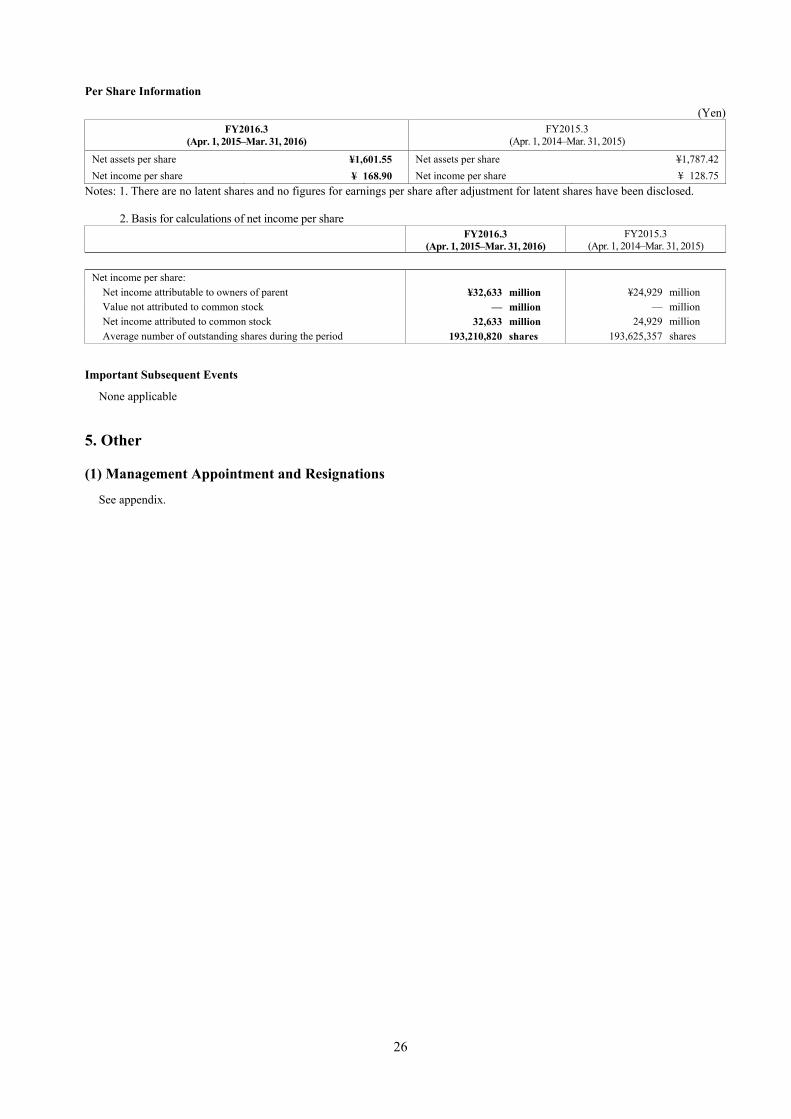
Per Share Information
(Yen)
FY2016.3 (Apr. 1, 2015–Mar. 31, 2016)
FY2015.3 (Apr. 1, 2014–Mar. 31, 2015)
Net assets per share ¥1,601.55 Net assets per share ¥1,787.42Net income per share ¥ 168.90 Net income per share ¥ 128.75
Notes: 1. There are no latent shares and no figures for earnings per share after adjustment for latent shares have been disclosed.
2. Basis for calculations of net income per share FY2016.3
(Apr. 1, 2015–Mar. 31, 2016) FY2015.3
(Apr. 1, 2014–Mar. 31, 2015)
Net income per share: Net income attributable to owners of parent ¥32,633 million ¥24,929 million Value not attributed to common stock — million — million Net income attributed to common stock 32,633 million 24,929 million Average number of outstanding shares during the period 193,210,820 shares 193,625,357 shares
Important Subsequent Events
None applicable 5. Other
(1) Management Appointment and Resignations
See appendix.