consolidated accounts - biesse group accounts for the year ending 31 ... and to incorporate this in...
TRANSCRIPT


�
Consol idated accounts
for the year ending
3 1 december 2010
indexTHE BIESSE GROUP
Company Office Holders 8
Group structure 10
Financial Highlights 1�
The Group 15
The Brands 16
DIRECTORS’ REPORT
The market �4
Events �8
Employees 30
Customers 31
Business sector review �5
Trend of the 2010 �6
Corporate Governance 33
Summary income statements 39
Summary statement of financial position 44
Research and development 49
Reconciliation between the equity and result of the parent and consolidated equity and results 56
Transactions with associates, parents and companies controlled by them 56
Other related party transactions 57
Personnel 57
Shares in Biesse and/or companies controlled by Biesse, held directly and indirectly by members of the Board of Directors, the Board of Statutory Auditors and the General Manager,as well as by their respective spouses where not legally separated and by their children
59
Atypical and/or unusual transactions of the year 59
Significant subsequent events and outlook 59
Directors’ report on the performance of Biesse S.p.A. 60
Other information 64
Proposal to the Ordinary Meeting of Shareholders 64
FINANCIAL STATEMENTS AS AT AND FOR THE YEAR ENDED 31 DECEMBER 2010
Income Statement 68
Statement of Comprehensive Income 69
Statement of Financial Position 69
Statement of Cash Flows 71
Statement of changes in equity 7�
NOTES TO THE CONSOLIDATED FINANCIAL STATEMENTS
Notes to the consolidated financial statements 75
APPENDIx 1 1�6
Income statement in accordance with Consob regulation no.15519 of 27/07/06 1�6
Statement of financial position in accordance with Consob regulation no.15519 of 27/07/06 1�7
Certification of the consolidated financial statements in accordance with article 81ter of Consob Regulation no.11971 1�9
Independent Auditors’ report for the year ended 31/12/2010 130 3

we have completed transactions such as that involving the Viet brand (Wood), which has a historical presence in the calibrating and sanding segment, and which became part of the Biesse Group at the end of 2010. The synergies expected from the inclusion of an important brand like Viet – renowned for the innovation and quality of its products - are numerous and unquestionably useful for the growth of Biesse in this strategic market segment.On 21 December 2010 Biesse’s Board of Directors approved the new Three Year Industrial Plan for 2011-2013 which indicates compound average growth of revenues of between 11% and 12%. In 2013 we expect to generate an EBITDA marginof more than 14% and a positive Net Financial Position thanks to total cash flow over the three years in excess of € 40 million. The key elements of the Plan clearly highlight our focus on reducing industrial costs, reinforcing the distribution network, technical innovation through investments aimed at renewing and expanding our range of products and improving after-sales technical assistance. In addition to this, constant attention on developing management leadership skills will be a key element in the sustainable growth of the value of the company over the long term. Giorgio Pitzurra was appointed the Group’s Chief Executive Officer at the start of 2011, he is a manager with a well-established background and specific skills, which confirms our willingness to strengthen the management team with a gradual separation of responsibilities in particular with reference to the controlling shareholder. In conclusion we can say 2010 saw Biesse return to encouraging levels of production and results. Our focus in 2011 will therefore be on the execution of the planned industrial projects as a determining factor in arriving in 2012 with the necessary velocity to reach the objectives set out in the three year strategic plan. We are convinced that a further important contribution to that end will come from greater utilisation of the Indian production location in Bangalore as a true business centre for all of Asia. Our presence and the specific investments in this geographical area will facilitate the growth of Biesse’s commercial penetration in markets that, even on the basis of the most recent macro-economic forecasts, have excellent development potential over the short and medium term.
Chairman Managing DirectorRoberto Selci Giancarlo Selciiii
Dear shareholders,The results for the financial year 2010 reveal a significant increase in sales volumes and a return to operating profit, despite fluctuations in the global economy and particularly in the sectors in which we operate. The economy continued to expand over the past 12 months with a return to global GDP growth (+4.6%) although this was lower than expected. This indicator masks the differences between the mature economies and the emerging countries which represent the real driving force behind world growth. The strength of demand in our core industrial sector was also highly differentiated: it was difficult for the domestic market to recover decisively, partly because of the expire of Tremonti-ter capital allowances which simply resulted in what few capital investment programmes there were being brought forward. The recovery of orders from abroad was augmented by China, India, Brazil and the Middle East which were not supported by the traditional European markets which have not yet returned to pre-crisis levels of development. The figures for Italian industrial order intake in the fourth quarter of 2010 were positive with growth of 12.3% compared with the same period of the previous year. Despite this economic environment with large geographical areas of business still suffering uncertainty we have succeeded in taking advantage of the positive, if volatile, demand in our core markets thanks to the innovative nature and increasing validity of our products, our widespread international presence and the strength of our distribution network. Biesse’s commitment to research and development has allowed us to increasingly position ourselves as a global partner providing technological solutions and not just as a simple supplier of machinery. We are emphasising this process of continuous innovation through increasing investment both in the Wood-Glass & Stone sector while also exploring applications in other materials, such as plastics. In 2010 we launched the innovative Green project for the production of highly technological solutions capable of reducing energy consumption, while guaranteeing the client tangible and measurable savings with greater respect for the environment. We have decided to acknowledge the full importance of ecological awareness and to incorporate this in our corporate philosophy and positioning in order to become an eco-technological company; sustainable technology hand-in-hand with convenience for the client. In line with this approach, Biesse entered an important collaboration with Beckhoff and Bosch Rexroth which led to the creation of the B-cubed Line, a series of machines with low consumption motors but high levels of efficiency. In pursuing the direction of reinforcing our offer through a wider product range,

7
the biesse group

8 9
board of directors
Board of DirectorsChairman and Managing Director Roberto Selci
Managing Director 1 Giancarlo Selci
Managing Director Giorgio Pitzurra
Chief Executive Officer Alessandra Parpajola
Chief Executive Officer Stefano Porcellini
Director Leone Sibani
Director Giampaolo Garattoni
Director Salvatore Giordano
Board of Statutory AuditorsChairman Giovanni Ciurlo
Standing Statutory Auditor Claudio Sanchioni
Standing Statutory Auditor Cristina Amadori
Internal Control CommitteeRemuneration CommitteeLeone Sibani
Giampaolo Garattoni
Salvatore Giordano
Supervisory BodyLeone Sibani
Giampaolo Garattoni
Salvatore Giordano
Cristian Berardi
Elena Grassetti
Independent AuditorsKPMG S.p.A.
1 With exclusive mandate for the strategic direction and co-ordination of the Group
annual report 2010
company office holders
company office holders
9

10 11group structure
annual report 2010
The consolidation area has changed compared to the last approved financial statements following several reorganisation transactions (which were implemented through the merger by incorporation of some companies belonging to the Biesse Group) involving Biesse S.p.A., Biesse America Inc. and Biesse Canada Inc., being the incorporating companies; the companies Digipac S.r.l., Bifin Ltd. and Sel Realty Ltd. were the companies respectively subject to merger by incorporation into the companies listed above.
In the first case, the economic reasons underlying the merger relate to the gradual company streamlining and organisational integration process aimed at achieving a more efficient utilisation of personnel and technical resources involved in the production process with a consequent improvement in the absorption of overheads.
The mergers involving Bifin Ltd. and Sel Realty Ltd. - exclusively dedicated to real estate management (their sole assets being the buildings housing the headquarters of the two North American subsidiaries) – were implemented with the sole purpose of simplifying the administration of the company.
In addition to the aforementioned transactions, it should be noted that three new companies were set up at the year end: Biesse Tecno System S.r.l., Viet Italia S.r.l. (by Biesse S.p.A.) and Biesse Indonesia Pt (by Biesse Asia Pte Ltd.).
The first company is established in partnership with one of the Group’s Italian suppliers, which is involved in design solutions and realization of integrated production lines and turnkey solutions both for large companies operating in the furniture industry and companies in other industrial sectors.
Viet Italia S.r.l. is a new company set up to rent and subsequently acquire (an irrevocable purchase offer has been made to the liquidator) the business activities of the eponymous Pesaro-based brand - Viet – market leader in the wood calibrating and sanding sector, which were part of a company that was put into liquidation in November 2010 following a severe financial crisis. The synergy opportunities arising from the inclusion of an important brand such as Viet – renowned for the innovation and quality of its products – are numerous and unquestionably useful in the expansion of Biesse’s presence in a strategically important market segment.
Finally Biesse Indonesia Pt. Is involved in marketing and providing after-sales services for the Group’s machinery in Indonesia as well as the sale of Diamut-branded machine tools and grinders.
Given that these three new companies were set up close to the end of the financial reporting period ended 31/12/2010, they have made no contribution to the income reported for the year just ended.
group structure
Biesse Group UK Ltd.United Kingdom
100%
Biesse Group Australia Pty Ltd.
Australia 100%
BRE.MA. Brenna Macchine S.r.l.
Italy 60%
H.S.D. S.p.A. Italy 100%
Biesse France SarlFrance 100%
HSD USA, Inc.U.S.A. 100%
Biesse America Inc.USA 100%
Biesse GroupNew Zealand Ltd.
New Zealand 100%
BIESSE S.p.A.Parent
BiesserviceScandinavia ABSweden 60%
HSD Deutschland GmbH
Germany 100%
Biesse Manufacturing Co. Pvt. Ltd.India 100%
Biesse Schweiz GmbH Switzerland 100%
Biesse GroupDeutschland GmbH
Germany 100%
Wood MachineryPortugal Lda
Portugal 100%
Biesse IbericaWood Machinery S.L.
Spain100%
BiesseAsia Pte Ltd.
Singapore 100%
Biesse Trading (Shanghai) Co. Ltd.
China 100%
Biesse Indonesia Pt.Indonesia 90%
HSD Mechatronic (Shanghai) Co. Ltd.
China 100%
Biesse Canada Inc.Canada 100%
Biesse Tecno System S.r.l.
Italy 50%
Viet Italia S.r.l.Italy 100%

1� 13
annual report 2010
financial highlights
PerSonnel31 December 2010 31 December 2009
Number of employees at year end* 2,372 2,292
* data includes temporary staff
(1) Notes explaining the criteria for determining amounts relating to interim results and combined capital and financial data are contained in the directors’ report and the Notes to the financial statements.
financial highlights
INCOME STATEMENT DATA
€ ‘00031
December2010
% ofsales
31 December
2009
% ofsales Change %
Revenue from sales and services 327,522 100.0% 268,006 100.0% 22.2%
Added value (1) 123,382 37.7% 84,062 31.4% 46.8%
Ebitda (Gross operating profit/loss) (1) 15,700 4.8% (8,436) (3.1%) --
Normalised Ebit (Normalised net operating income) (1)
674 0.2% (27,874) (10.4%) --
Ebit (Net operating profit/loss) (1) 106 0.0% (32,979) (12.3%) --
Loss for the year (5,741) (1.8%) (27,192) (10.1%) (78.9%)
STATEMENT OF FINANCIAL POSITION
€ ‘000 31 December 2010 31 December 2009
Net Invested Capital (1) 141,835 159,555
Equity 122,914 126,850
Net financial position (1) 18,921 32,704
Net operating working capital (1) 60,582 79,572
Gearing (net financial position/equity) (0.15) (0.26)
Fixed asset/standing capital ratio 1.23 1.29
Order intake 278,699 206,699
Ebitda
0
-5
�009 �010
-3.1 4.8
Ebit
-10.4% -12.3% 0.2% 0.0%
10.0
5.0
0
-5.0
-10.0
-15.0
2009* �009 2010* 2010
Net financial indebtedness
€ ‘000
-32,704 -18,921
0
-10,000
-20,000
-30,000
-40,000
�009 2010
Net operating working capital
€ ‘000
79,572 60,582
125,000
100,000
75,000
50,000
25,000
0
�009 2010
Average number of employees
2,292 2,372
2,500
2,000
1,500
1,000
500
0
�009 2010
Turnover per employee
114.5 140.5
�50
�00
150
100
50
0
�009 2010
15.0
10.0
5.0

14 15
The Biesse Group, with Headquarters in Pesaro, is primarily engaged in the production, marketing and after-sales service of machines and systems for the wood, glass and stone processing sectors. Production activity is concentrated in Italy and in India. Marketing and after-sales support are organised both through the direct geographical presence of companies belonging to the Group which is composed of 30 subsidiaries and commercial offices, and through a select network of 300 importers, distributors and agents. The Group is composed of three main business divisions each of which is highly specialised in its own sector:- Biesse Wood Division- Intermac Glass & Stone Division- HSD Mechatronic DivisionThe Group is also involved in other activities such as the production of precision mechanical, electrical, electronic and pneumodynamic industrial components.
the group annual report 2010
the group

16 17
the brands annual report 2010
the brands
Produces plants and systems for drilling and dril-ling-inserting of hardware, flexible machines for companies offering a customizable product and giving importance to the ‘lead time’ and to the re-duction of the half-finished products stock.Moreover, Comil produces machines and plants for the assembling of furniture and doors and packa-ging machines with thermoretractable shrink film.
Produces complete solutions for panel handling. The main feature of the Rbo product is the ca-pacity to find the best solution to meet the cu-stomers’ requests with always reliable and highly engineered products.
Presents a complete range of Easy Tech solutions, specialized in the production of woodworking ma-chines mainly designed for small and medium-si-zed companies. The company’s extensive experien-ce, service and widespread distribution network make BiesseArtech a brand name synonymous with reliability and profitable investment. This line of products, in fact, is destined to revolutionize production times and phases, while offering highly personalized and innovative technical and logisti-cs support. BiesseArtech solutions are designed for all the various panel machining phases: panel sizing, edgebanding, boring, milling, sanding and assembly of furniture items.
ARTECHPresents its complete range of CNC machines and systems dedicated to panel processing, and win-dow and door manufacturing; CNC machining cen-tres for milling, boring and edgebanding; CNC rou-ters. Biesse is able to provide numerous solutions to increase productivity, reliability and machining quality, all made-to-measure for the customer.
Produces edgebanding and squaring-edgeban-ding machines for the furniture industry. Our dedication to satisfying the needs of even our most demanding customers remains constant by granting high-speed, flexible and high precision machining solutions.
Produces automatic calibrating and sanding ma-chines for medium and large industries.These machines are capable of carrying out con-tinuous machining, giving maximum reliability and producing excellent quality results on any type of article.

18 19
Biessesystems
Offers design and execution of turnkey plant, automatic and integrated processing lines to satisfy the automation needs of the furniture industry including an integrated boring and insertion line managed by a supervisor.
the brands
the brands
Is specialized in the production of NC vertical processing cells for boring, routing, milling and hardware inserting operations.All Bre.Ma. installations allow to process in se-quence, panels with different dimensions without any manual set-up interventions.
Is the Biesse Wood Division Brand that produces and distributes single line sizing centres, angular systems and integrated cutting cells with auto-matic storage and unloading solutions.
Viet calibrating and sanding machines adapt to any context: from the needs of small carpen-try workshops to the production chains of large-scale industry. Moreover, our solid specialisa-tion makes it possible to create unique products on customer re-quest to satisfy the single requi-rements of specific processes.
annual report 2010

�0 �1
annual report 2010
the brands
Complete range of tools for the working of glass and stone. Diamut products can be used on all the machines on the market always granting the maximum quality of the final result.
Leading brand in the segment of double edging machines and lines for flat glass. The vast expe-rience and profound knowledge of the market nee-ds allow the development of solutions that are able to meet the needs of the customers. The product range is completed with vertical and horizontal glass drilling machines.
World leader in the production of multi function work centres for flat glass working. Intermac has revolutioned the technological standards in this sector since the release of its first line of machi-nery. Completes his offer with a range of machines and systems for the cutting of monolithic and lami-nated glass. Intermac occupies a leading position also in the production of technologies for natural and synthetic stone processing with its complete line of multi function work centres.
the brands
The production unit Cosmec manufactures high-precision mechanical components, which allows Biesse to guarantee perfect control and consistent quality of its processes throughout the product life cycle, from conception and design through manu-facturing, distribution and after-sale service.
COSTRUZIONI MECCANICHEDI PRECISIONE
COSMEC
Specialised in the design and production of auto-matic stretch film wrapping machines to protect and stabilise pallet loads.
The Mechatronic Division supplies and manufactu-res high precision mechanical and electronic com-ponents for machines and systems designed for the Biesse Group and other companies.

�3
directors’ report
�4 �5
annual report 2010
the market
RISING CONSUMER PRICES REFLECTS THE INCREASE IN RAW MATERIAL COSTS – Consumer price inflation in developed countries – which has since autumn reflected increased raw material prices driven primarily by rising demand in the emerging economies – was slowed by the substantial level of underutilised capacity, to the extent that, net of energy costs, inflation levels remain modest; monetary policies remain expansionary.
CONTINUED GROWTH IN THE EUROZONE... Eurozone GDP grew by 0.3% in the third and fourth quarters compared to the previous period (1.0 in the second). German GDP continues to grow at a much faster rate than the average for the area. Consumer price inflation rose above 2% in December, mainly because of an acceleration in the cost of energy; this was augmented by increases in indirect taxation imposed during the second half of the year by some Eurozone countries. Medium-Long term inflation indicators remain consistent with the objective of maintaining price stability in the Euro area.
...AND IN ITALY – Italian GDP growth slowed to 0.3% in the third quarter of 2010 compared with the previous period, similar to the trend in the rest of the Eurozone. This slowdown continued in the fourth quarter, with a quarter-on-quarter increase of just 0.1% (+1.5% compared with the fourth quarter of 2009). Exports continued to be the main driver of economic activity, while the contribution from domestic demand, already modest, fell as a result of a deceleration in capital investment in machinery and equipment following the end of capital allowances on taxes (Tremonti ter). Economic activity, and industrial production in particular, weakened towards the end of the year. Household spending remains cautious as lower disposable income and labour market uncertainty affect consumption.
STILL NO RECOVERY IN EMPLOYMENT – Employment levels continued to fall slightly in the third quarter continuing the trend that has prevailed since the start of the crisis. The decline in employment is most marked amongst young people. Given the scenario of slow recovery back to pre-crisis levels of production, employers prefer more flexible employment agreements to taking on full-time permanent staff.
ITALIAN GROWTH IS LIKELY TO REMAIN MODEST IN THE TWO YEAR PERIOD 2011-12 – According to the most recent estimates – which for global growth are based on the assumptions underlying the forecasts for the region published
in December by Eurosistema – Italian GDP growth in both 2010 and 2011 is likely to continue at the low levels recorded last year, i.e. about 1%. Growth in production, held back by weak domestic demand, is likely to remain below Eurozone levels, which consensus estimates put at 1.5%. This scenario is unlikely to generate a strong recovery in employment. Consumer price inflation is likely to be about 2% over the two year period 2011-12.
THIS SCENARIO COULD CHANGE IN EITHER DIRECTION – The outlook is conditioned by a significant degree of uncertainty. On one hand, renewed concerns about the sustainability of sovereign debt in some Eurozone countries could result in increased cost of finance for the private sector too. On the other hand, global growth in demand could turn out to be stronger than expected, with a possible increase to 7%, about a percentage point higher than the scenario outlined last July.
Business sector review
According to the figures for orders acquired by Italian industry in the fourth quarter of 2010 published by Acimall - the national association of producers of woodworking machinery – in its press release of 3 February “The sector has risen 12.3% compared with the same period of the previous year (foreign orders have risen 13.4% while domestic orders have risen by just 9.1%)”.
“The attractiveness of the various markets” – Acimall stated – “is highly differentiated: the domestic market is struggling to recover decisively, partly due to the end of the Tremonti-ter capital allowances which encouraged machine users to bring forward their limited investment plans. The recovery in order intake is helped by growth from abroad, from China, India and the Middle-East. ‘Traditional’ European markets, meanwhile, have not yet returned to pre-crisis levels”.
Meanwhile, figures reported by the the Business Culture and Research Centre of UCIMU, the association of Italian producers of machine tools, robots and automated equipment indicate that “the index of Italian machine tool orders, in the fourth quarter of 2010, registered an increase of 45% compared with the same period of 2009, continuing the growth trend that began at the start of 2010; the absolute value of the index, 108.6, has therefore returned to a level that is higher than the base year index (2005=100)”
However, the figures published by the Research Centre indicate a distinct variance between the
General Economic Overview
GLOBAL ECONOMIC GROWTH CONTINUES – While robust economic growth continued in the emerging economies, and in Germany amongst the developed economies, the economic outlook also improved for the American economy. Following the sharp increase reported in 2010, which led to a return to pre-crisis volume levels, international trade
is likely to grow at a slower rate in the current year, although they are likely to be high on a historical comparison. The imbalance in the current account of the balance of payments once again increased in the first nine months of the year. The heads of state and the governments which met in November at the G20 summit in Seoul approved a plan of action aimed at co-ordinating economic policy to achieve more balanced global economic growth.
the market

�6 �7
annual report 2010
the market
operating in the furniture industry and companies in other industrial sectors.
Biesse Indonesia Pt. Is involved in marketing and providing after-sales services for the Group’s machinery in Indonesia as wells as the sale of Diamut branded machine tools and grinders.
Towards the end of the financial year (on 22 December 2010), Biesse SpA implemented another new industrial initiative by setting up Viet Italia S.r.l., a new company that was set up to rent and subsequently acquire (an irrevocable purchase offer has been made to the liquidator) the business activities of the eponymous Pesaro-based brand - Viet – market leader in the wood calibrating and sanding sector, which were part of a company that was put into liquidation in November 2010 following a severe financial crisis. The synergy opportunities arising from the inclusion of an important brand such as Viet – renowned for the innovation and quality of its products – are numerous and unquestionably useful in the expansion of Biesse’s presence in a strategically important market segment.
In the fourth quarter of the year the Group started work on a substantial order for its leading Libyan client for a total value of over € 12 million, 80% guaranteed by a letter of credit backed by a leading Italian bank. The contract stipulates that the balance of the order will be paid once the installation and testing phases have been completed. At 31 December 2010 the order was completed to 70% of its revenue value and at the reporting date the full consignment of machinery had been dispatched; with regard to the letter of credit, at the date of approval of the financial statements all of the amount receivable, totalling € 9,616 thousand, had been credited to the Group’s bank account. Given the current crisis in Libya the Group has decided to recognise in its financial statements just those revenues covered by guarantee (excluding therefore the 20% that was not covered by guarantee and relating to testing of the machinery which is, for the moment, uncertain and the timing of which cannot be predicted).
In October 2010 Biesse SpA and the Chief Executive, Giovanni Barra, mutually agreed his resignation from all duties and offices held within the Biesse Group. This decision came about as a result of differences between the controlling shareholder and Mr. Barra regarding the strategic development of the Group. In January 2011 Mr.
Giorgio Pitzurra was co-opted as the new Chief Executive of the Group.
The statement of financial position indicators have maintained a positive trend compared with the figures reported at December 2009, with net working capital falling by about € 19 million and net debt falling by about € 13.8 million.
Net invested capital declined by € 17,720 thousand, from € 159,555 thousand to € 141,835 thousand, the fixed asset cover ratio fell from 1.29 a 1.23, while gearing improved from – 0.26 to – 0.13. The Group’s financial and capital solidity at the end of 2010 was confirmed by the notable reduction in outside financing: while equity declined (because of the loss reported for the period) and the fixed asset cover ratio fell in consequence, the mix of sources of financing reflects an increase in self-financing and an increase the Group’s capacity to service its financing requirements internally.
domestic order intake and orders received from export markets. The index for foreign order intake rose by 80.7% compared with the fourth quarter of 2009, while the index for domestic orders received actually fell by 8.3%.
Order intake rose by 36% on an annual basis, compared with 2009, due to the increase in foreign orders (+50.2%) and domestic orders (+15.5%, accumulated in the first six months).
“The trend of domestic orders received - UCIMU-PRODUCTION SYSTEMS stated – clearly shows that Italian manufacturing companies have invested as much as they could as long as capital allowances were available, in particular until the expiry of the ‘Tremonti Ter’. Demand for technology that helps innovate production systems is, therefore, strong, but remains latent in the current difficult market circumstances. Since the renewal of the production infrastructure is an essential condition for the growth of the whole national economy, the adoption of measures to support demand for new means of production cannot be postponed any further”.
The annual order intake reported by the German association VDMA (Erband Deutscher Maschinen- und Anlagenbau - German Engineering Federation) registered a 44% increase in cumulative order intake for the full year 2010; figures for the German market rose 38%, while orders received from international markets rose by 46%.
Trend of 2010
Following the good results achieved at the end of the first half of 2010, which benefited from the effect of the Tremonti-ter capital allowances, the Group ended 2010 with a strong increase in volumes and a return to operating profit. In particular the third quarter, with revenues of € 103,961 thousand, enabled us to beat our planned objectives for the year, in volume terms, and in particular in terms of cash generation. It should be noted that revenues in the last quarter of 2010 were substantially in line with those for the same period of 2009 (€ 109,573 thousand) and, above all, the Gross Operating profit was 7.5% of revenues in the last quarter (compared with 8% reported for the last quarter of 2009).
Order intake continued to be positive compared with the same period of 2009, with an increase of 35% (Wood Division +37%), but slowed down compared with the figure reported at end-June
(+61%, Wood Division +71%), which was partly attributable to the progressive comparison with a period (II° semestre 2009) that was positively affected by the recovery in demand.
Although the economic situation remained uncertain, the Group nevertheless succeeded in taking advantage of the positive, though volatile, trend in demand for capital goods in its core markets, thanks to its innovative product range and the strength of its distribution network.
Since the end of 2009, Biesse’s industrial strategy involved the implementation of an ambitious project to restore the profitability of its products, by reducing costs significantly through the optimal standardisation of its production solutions and components and through Purchasing department optimisation programmes: the results achieved have been very positive (significant growth in added value).
The 2010 financial year was characterised by a significant effort by the Group and the Trade Unions to manage the issues arising from the continuing economic crisis; as a result, thanks to continuous dialogue with Workforce Institutions, Trade Unions and Labour Representatives, the Group benefited from a year of Extraordinary State Subsidised Lay-Off assistance for the Pesaro-based workforce (starting from 10 January 2010) and for employees based in Como (from 22 March 2010). The utilisation of these schemes involved all operating areas and departments of the company and covered a reduction in working time of about about 340,000 hours.
In 2010 Company also decided to concentrate some production at its facilities in Pesaro. This operation primarily involved the production facility located in the province of Bergamo, for which Extraordinary State Subsidised Lay-off Schemes for Termination of Activity were activated from 1 July 2010, as part of a broader programme of employment protection involving transfer incentives and/or early retirement incentives.
As outlined in the Three Year Business Plan guidelines, approved on the 21/12/2010, two new companies have been set up, Biesse Tecno System S.r.l. and Biesse Indonesia Pt.
The first company is a joint-venture, established in partnership with one of the Group’s Italian supplier, which is involved in design solutions, consultancy services regarding integrated production lines and turnkey solutions both for large companies

�8 �9
annual report 2010
The Biesse Group sponsors and promotes over 150 events around the globe, such as exhibitions, open-house and tech tours showing customers our know-how, technology and innovation. The Group reinforces partnerships with its customers by giving them the possibility to touch and test the machine portfolio and cutting-edge solutions available in multiple showrooms throughout the 30 worldwide subsidiaries and commercial offices. BIESSEINSIDE is the initiative promoted by the Biesse Group to “open” the doors to the world of Biesse woodworking processes and technology to customers and operators in the woodworking sector from all over the world. A direct link with the market, providing a live demonstration of the Group’s potential and the innovations in products and processes.
exhib it ionstech tour open house
events

30 31
annual report 2010
employees
employeesOur most valuable asset: people. The more than 2,300 em-ployees in our production plants and subsidiaries all over the world are critical to the process of continuing success that has taken Biesse to the highest levels of our industry.Certain in the belief that each individual has the potential to make a uniquely valuable contribution, Biesse constan-tly invests in employee training through the Biesse Cor-porate School, established to develop skills and provide hands-on training.Furthermore, by applying an efficient organizational model, compliant with the Code of Ethics and Company Governan-ce, Biesse can count on employees with a strong sense of belonging and responsibility.
customers
The satisfaction and success of our customers is para-mount. We strive to earn the trust of our customers with effective service and support, combined with the excellence of products Made in Biesse.Regardless of where our customers may be, Biesse is there, always. Years of experience achieved in every corner of the globe makes Biesse the ideal partner, one that is able to antici-pate market demands, satisfy customer needs, supply the right solution and offer consulting, services and products with high added value.
3� 33corporate governance
annual report 2010
corporategovernancePremise
The Biesse Group adheres to and complies with the Self-Regulatory Code for Italian quoted companies published in March 2006, with the additions and adjustments applicable to the characteristics of the Group.In accordance with regulatory requirements it annually prepares its “Corporate Governance Report” which contains a general description of the system of corporate governance adopted by the Group and which provides information on the ownership structure and compliance with the Self-Regulatory Code, including the main governance procedures applied and the characteristics of the systems of risk ma-nagement and internal control relating to financial information processes. The aforementioned Report, which may be accessed on the company website, www.biesse.com, in the Investor Relations section, is composed of three parts: the first provides information on the ownership structure, the second contains a description of the governance structure, and the third contains summary tables. The following sections summarise the relevant aspects relating to this Directors’ Report. The Self-Regu-latory Code may be accessed on the website of Borsa Italiana S.p.A., www.borsaitaliana.it.Biesse S.p.A.’s model of management and control is a traditional model (as provided in Italian Law), which calls for Shareholders’ Meetings, a Board of Directors, a Board of Statutory Auditors and Inde-pendent Auditors.
Activities relating to management and co-ordination
Biesse S.p.A. is controlled by BI.FIN S.r.l., which is not itself subject to control, in accordance with article 93 of Decree Law 58/1998, by any legal person. The controlling shareholder of BI.FIN S.r.l. exercises activity of management and coordination over the Issuer.In accordance with article 2497bis of the Italian Civil Code, almost all of the Italian companies directly controlled by Biesse S.p.A. have declared the latter as the entity which exercises management and control on them. This activity consists of providing general strategic and operating objectives for the Group and consists in defining and supervising the internal control system and the governance model of the company structures, in issuing a Code of Conduct adopted at Group level and in the preparation of general policies for managing human resources and financing requirements, procurement of the factors of production, marketing and communication. In addition Group coordination involves the centralised management of treasury, corporate and administrative services and the internal audit.The aforementioned practices allow subsidiaries, which retain full managerial and operational auto-nomy, to benefit from economies of scale and to take advantage of professional and specialist services with growing levels of quality and to concentrate their resources on the management of their core businesses.

34 35
Stefano Porcellini, as Manager in charge of financial reporting. The aforementioned manager, taking into consideration the recent amendments to the Articles, possesses the required credentials to occupy the position of Manager in charge of financial reporting as he is an expert in administration, finance and con-trol and is also in posession of the credentials regarding personal integrity as required by the directors. The Manager was also granted all necessary powers, as defined in article 154 bis Decree Law no. 58 of 24/2/1998, as introduced by article 14 paragraph 1, no. 262, by way of example and not exhaustively:
• power to introduce adequate administrative and accounting procedures in the parent and in all subsi-diaries, both in Italy and abroad;
• power to employ staff with duties to carry out specific activities, establishing their remuneration within the framework of group policy and power to dismiss the same;
• power to confer and revoke appointments of Italian and foreign professionals to carry out specific du-ties and to fix their duration and fees;
• power to make purchases directly or to lease goods and software necessary to carry out accounting procedures and procedures relating to the financial statements;
• all necessary powers, including spending powers, necessary for the correct execution of the duties conferred.
At 31 December 2010 the Board of Directors was composed of four executive directors (following the re-signation of Giovanni Barra on 22/10/10) and three non-executive directors, i.e. director with no specific title, functional mandate or executive functions in the Company or the Group and who are qualified as independent on the basis of the requirements set out in the Shareholders’ Meeting of 28 April 2009, as previously adopted. Adequate representation by independent directors is fundamental to the protection of shareholders’ interests, in particularly minority shareholders and third parties.
The credentials determining the independence of directors is subsequent to annual examination and re-late to the inexistence or the non-materiality over the preceding three years of economic relations with or shareholding of any kind, held directly, indirectly or by third parties in the Company, its executive directors and managers with strategic responsibilities, its controlling shareholder or subsidiaries or with any person or persons associated in any way with the Company. The outcome of this examination is reported in the Corporate Governance Report.
The Executive Directors do not hold similar positions in other companies quoted on regulated markets, in financial companies, banks, insurance companies or companies of a significant size, while those for Independent Directors are shown in the following list of positions held:
• Leone Sibani - Chairman of the Board of Directors of IMI Investimenti S.p.A., Chairman of the Board of Directors of IMI Fondi Chiusi sgr S.p.A., Chairman of the Board of Directors and Chief Executive Officer of Cassa di Risparmio della Repubblica di San Marino S.p.A., Director of Banca dell’Adriatico S.p.A., Director of Tregi Fin, Acting Statutory Auditor of Lineapelle S.p.A., Member of the Direction Committee in the Foundation of the Cassa di Risparmio of Bologna, President of the Supervisory Body of Bologna Fiere S.p.A;
• Giampaolo Garattoni - Director Aksia Group SGR SpA, Sole Director Regatta Srl, Onboard Srl Sole Director, Sole Director Welcome Srl;
• Salvatore Giordano - Director General of Confindustria Pesaro-Urbino, Executive Director of Assindu-stria Consulting Srl and Chairman of Centrale GPA S.p.A.
The Board of Directors in recognition of the fact that international best practice recommends avoiding concentration of authority in a single person without adequate counterbalances and recognising that such concentration currently exists in Biesse (the Chairman of the Board of Directors is also the Chief Executive Officer) in order to comply fully with the Principles of the Code, has set up the position of Lead Independent Director and has appointed the independent Director Mr. Leone Sibani to this position. The Non-Executive Directors report to the Lead Independent Director to provide a better contribution to the operation and functioning of the Board of Directors.
corporate governance
annual report 2010
Board of directors
The appointment of Directors takes place according to transparent procedures, which are also aimed at ensuring adequate and prompt information regarding the curriculum vitae of the candidates for each post. As stated in article 16 of the Company’s Articles of Association, the nominations for the position of Director must be accompanied by exhaustive information regarding the personal and professional credentials of the candidates, with indications, if required, of their suitability to qualify as Independent Directors. In order to comply with Law no. 262 of 28 December 2005, the Issuer has amended its Articles of As-sociation to change the procedures for appointing Directors by including a “list voting” mechanism in the Articles. In addition, amendments made to the Articles of Association in 2010 (hereinafter “Amendments to the Articles”) to comply with Decree Law no. 27/10, introduced a requirement to deposit lists at the Company’s registered office by the twenty-fifth day preceding the date set for the Shareholders’ Meeting and to make these lists publicly available, in accordance with the procedures established by law and by Consob’s Regulations, at least twenty-one days before the Shareholders’ Meeting. The Articles, including the Amendments to the Articles, state that only those shareholders who, jointly or severally, represent at least 2.5% (two point five percent) of the ordinary share capital or who are shareholders of any different minimum shareholding established in Consob’s Issuers’ Regulation have the right to present lists,No shareholder can present in person, in combination with others, by proxy, nominee or through other third parties more than one list or to vote for more than one list.
Elections to the Board of Directors must adhere to the following procedures:
a) names are drawn from the list which has obtained the greatest number of votes at the Shareholders’ Meeting in the order in which they are presented on the list, and as many directors as represent the totality of those to be elected less one are selected;
b) the remaining director is drawn from the second list which has obtained the greatest number of votes in the Shareholders’ Meeting and is the first named candidate on this list.
In accordance with article 16 of the Articles of Association, the Board of Directors may be composed of a variable number of Directors, from a minimum of two to a maximum of fifteen members, including non-shareholders, as determined by the Shareholders’ Meeting. The current Board of Directors is composed of eight members whose mandate will expire with the approval of the Financial Statements for the year ending 31 December 2011: of these, seven were appointed by the Shareholders’ Meeting of 28 April 2009 on the basis of the single list presented by the shareholder Bi.Fin. S.r.l., which received the vote of shareholders representing 16,015,000 shares equal to 58.464% of the share capital. No other lists were presented.The eighth member of the board (Giovanni Barra), subsequently appointed by the Shareholders’ Meeting of 12 November 2009 having agreed the prior increase in the number of board members from 7 to 8, submitted his resignation on 22 October 2010; consequently, the Board of Directors, on 18 January 2011, agreed, with the approval of the Board of Statutory Auditors, to co-opt, Mr. Giorgio Pitzurra as a new director in the specific role of Chief Executive Officer. Mr. Pitzurra will remain in office until the next suitable Shareholders’ Meeting, expected to be convened on 28 April 2011, which will be asked to approve his appointment. In applying the provisions of the Articles the Board of Directors has, as in the past, adopted a model of delegation that confers full operating powers on the Chairman and Chief Executive Officer. They may consequently, severally, carry out all acts of ordinary and extraordinary administration that are part of the company’s objects and that are not reserved by law or otherwise delegated or attributed by the Board of Directors. In practice, where the Board of Directors is concerned, the Chairman exercises a role of strategic coordination and direction while the Chief Executive Officer is responsible for the executive management of the Group.
In accordance with the Articles – and in compliance with Law no. 262 of 28 December 2005 - on 14 May 2007 the Board of Directors, at the Chairman’s proposal, having received the opinion of the Board of Statutory Auditors, unanimously appointed the Director for Administration, Finance and Control, Mr.
annual report 2010

36 37
annual report 2010
corporate governance
Biesse has defined a system of risk management and internal control with regard to the processing of fi-nancial information that is based on the standard model “COSO Report”, according to which “the Internal Control System may be defined as a combination of mechanisms, procedures and instruments aimed at ensuring the achievement of company objectives”. In relation to the processing of financial information, these objectives may be identified by their reliability, accuracy, credibility and promptness of the said information. The activity of risk management constitutes an integral part of the internal control system. The periodic evaluation of the internal control system on the processing of financial information is aimed at assuring that the components of the COSO Framework (control environment, risk evaluation, control activity, information and communication, monitoring) function together to achieve the aforementioned objectives. As previously noted the main characteristics of the risk management and internal control sy-stems relating to financial information are detailed in the Corporate Governance Report. With regard to the “conditions for listing shares of companies which control other companies constituted in and regulated by countries which do not belong to the European Union” as defined in articles 36 and 39 of Market Regulations, the Company and its subsidiaries, as reported in the Corporate Governance Re-port, are equipped with administrative-accounting systems which allow them to make available to the pu-blic the accounting position of the companies as reported in the consolidated accounts which fall within the parameter of this regulation and which are suitably prepared to provide management and the Parent independent auditor with the necessary information for the preparation of the consolidated financial sta-tements. Biesse also provides for the effective flow of information to the central auditor, and continuous information regarding the composition of the corporate bodies of its subsidiaries with definitions of the roles covered and provides for the systematic and centralised gathering, as well as regular updating, of the formal documentation pertaining to the articles and to the conferral of powers on the officers of these companies. Therefore the conditions exist to satisfy the requirements referred to in article 36 sections a), b) and c) of the Market Regulations issued by Consob. No acquisitions were made during the year of companies with registered offices outside the EU which, considered independently, would be materially relevant with regard to the regulations in question.
The Board of Statutory Auditors
The Statutory Auditors monitor observance of the law and the Company articles of association and monitor operations whilst financial control is not part of their remit but is assigned to independent auditors appoin-ted by the shareholders’ meeting from among those companies listed in the register held by Consob.The Company articles of association lay down that the Statutory Auditors must be three standing auditors and two alternate auditors and that their names must be from lists drawn up by shareholders having at least 2% (two percent) of the share capital with voting rights in ordinary shareholders’ meetings or, on the basis of the recent amendments to the Articles any different minimum shareholding established by Consob in its Regulation. Each shareholder, as well as those shareholders belonging to the same group of shareholders, cannot themselves, or through a nominee or trustee, put forward more than one list or vote for different lists. In the event of violation of this rule, the vote of the shareholder for every list pre-sented will not be considered. Each candidate may only be proposed in one list only at the risk of being considered ineligible. Procedures for the appointment of Statutory Auditors are as follows: from the list which received the highest number of votes in the Shareholders’ Meeting are drawn two standing statutory auditors and one alternate statutory auditor, in the order in which they are presented in the sections of the list; from the list which received the second highest number of votes in the Shareholders’ Meeting is drawn the name of the remaining acting statutory auditor in the order in which the names are presented in the sections of the list, who will also assume the position of Chairman and the remaining alternate Statutory Auditor. In the event that two or more lists receive an equal number of votes the Statutory Auditors will be appointed on the basis of seniority in competition for the positions to be assigned.Due to the recent amendments to the Articles of Association the list must be deposited by the twen-ty-fifth day preceding the date set for the Shareholders’ Meeting and must be made publicly available according to the means established by law and Consob in its Regulation, at least twenty-one days before the Shareholders’ Meeting. The names proposed must be accompanied by the curriculum vitae of each candidate and by declarations in which each candidates accept his/her candidacy and certify that there is no grounds for ineligibility or incompatibility, and that they meet the legal and statutory qualifications required by the respective positions.
annual report 2010
The Lead Independent Director has the following specific responsibilities:
• to co-operate with the Chairman and Chief Executive Officer to guarantee complete and prompt infor-mation flows to the directors;
• to convene, independently or at the request of other directors, appropriate meetings of independent directors for the discussion of subjects judged to be of interest with respect to the functioning of the Board of Directors or the management of the Company.
During 2010 the Lead Independent Director was responsible for convening:
• meetings of the Internal Control Committee;
• the meeting of the Remuneration Committee.
With regard to Related Party transactions (related parties are defined as those thus designated by law, particularly article 2391 bis of the Italian Civil Code, and by the regulations) – in accordance with the Regulations adopted by CONSOB with resolution no. 17221 of 12 March 2010 as amended by resolution no. 17389 of 23 June 2010 (hereinafter “CONSOB Regulation”) and article 9.C.1 of the Self-Regulatory Code for Listed Companies listed by Borsa Italiana S.p.A. – the Board of Directors of the Company, on 12 November 2010, agreed to adopt, with the prior approval of the Internal Control Committee, the procedu-re governing related party transactions that regulates related party transactions with the aim of ensuring, on its own behalf and on behalf of the companies controlled by it, transparency and the substantive and procedural correctness of transactions with related parties carried out by the Company. The Company, as small cap listed company and as recent Statutory Changes related, uses, in accordance with article 10 of the CONSOB Regulation, the facility to apply the procedures applicable to Related Party Transactions of Lesser Importance to Related Party Transactions of Major Importance.
Committees established by the board of directors
The Board of Directors with a resolution of 28 April 2009 set up a committee that carries out the duties the Code requires of the Internal Control Committee and the Remuneration Committee composed of three independent directors.The Board of Directors decided not to set up an Appointments Committee because of the modest size of the said board of directors and the statutory provisions governing the voting lists mechanism, which guarantee the transparency of appointment procedures and the balanced composition of the Board of Directors.
Internal control system
The Board of Directors has prepared “Guidelines for the Internal Control System” which became operative on 1 January 2003 and which also incorporate the amendments introduced by the Self Regulatory Code.An essential part of the Internal Control System is the Code of Conduct – which from 2010 incorporates the Code of Ethics adopted in 2002 – and the Organisational and Management Model (hereinafter the “Model”) adopted by the Board of Directors in implementation of the regulations regarding the “Discipline regarding the administrative management of organisations” in accordance with Decree Law no. 231/2001 and subsequent amendments. The Code of Conduct expresses the principles of corporate conduct that Biesse recognises as its own and which it requires Directors, Statutory Auditors, employees, consultants and partners to observeThe Model was also adopted with the necessary adaptations by the Italian companies of the Biesse Group, in compliance with legal and judicial development and during 2010 the Company updated the Model following the introduction of new legislations; Law no. 94 of 15 July 2009, Law no. 99 of 23 July 2009 and Law no. 116 of 3 August 2009 which introduced new types of offences.The Supervisory Body, a collective body, is composed of Independent Directors, the Manager of the Legal affairs office of Biesse and by the Internal Auditing Manager, has its own Internal Regulations and operates on the basis of a specific Supervisory Programme. It meets at least once a quarter and reports to the Board of Directors, directly and also through the Internal Control Committee, and to the Board of Statutory Auditors.

38 39
annual report 2010
directors’ report
The current Board of Statutory Auditors was appointed by the Shareholders’ Meeting of 28 April 2009 and will remain in office until approval of the financial statements as at and for the year ending 31 Decem-ber 2011. The members of the Board of Statutory Auditors were all candidates on the sole list presented by the Shareholder Bi.Fin. S.r.l., which received the votes of shareholders representing 16,015,000 sha-res corresponding to 58.464% of the share capital. No other lists were presented.
At the end of the 2010 financial year the Board of Statutory Auditors was composed of the following members.
Giovanni Ciurlo (Chairman) whose main directorships and other positions held are: Banco di San Giorgio S.p,A. (standing statutory auditor), AEB S.p.A. (chairman of the board of statutory auditors) Stroili Oro S.p.A. (standing statutory auditor), Salmoiraghi & Viganò S.p.A. (director), Holdco Afrodite S.r.l. (standing statutory auditor), Italmatch Chemicals S.p.A. (standing statutory auditor), Vistasì S.p.A. (director).
Adriano Franzoni (standing statutory auditor) whose main other positions held are: I.F.I. S.r.l. (Chairman of the Board of Statutory Auditors), DI ZIO Costruzioni Macchine S.p.A. (standing statutory auditor), Metalfond S.r.l. (Chairman of the Board of Statutory Auditors), Sorbini S.r.l. (Chairman of the Board of Statutory Auditors) Alluflon S.p.A. (standing statutory auditor), VIET S.p.A. (standing statutory auditor), Salfina S.r.l. (standing statutory auditor).
Claudio Sanchioni (standing statutory auditor) whose main other positions held are: technical consultant at the Pesaro Regional Court, Official Liquidator at the Pesaro Regional Court, Chairman of the Board of Statutory Auditors in several unlisted companies, Director of the Chartered Accountancy body of Pesaro – Urbino and Chairman of the Tutelary Commission.
Daniela Gabucci (Alternate Statutory Auditor) whose main other positions held are: standing statutory auditor and Chairman of the Board of Statutory Auditors in various unlisted companies.
Cristina Amadori (Alternate Statutory Auditor) whose main other positions held are: standing statutory auditor in various unlisted companies.
After the end of the financial year, following the premature death of the Standing Statutory Auditor, Mr.Franzoni, on 8 January 2011 and the resignation on the same day of the alternate auditor, Ms. Gabuc-ci, Ms. Amadori became a standing statutory auditor in accordance with the law. The latter will remain in office until the first available shareholders’ meeting that will therefore be requested to restore the composition of the Board of Statutory Auditors.
The Board of Statutory Auditors has undertaken to submit to an annual examination to verify that each of its members is stil in possession of the required status of independence required by prevailing regulations and by the Code with regard to the independence of its directors.
In carrying out its duties the Board of Statutory Auditors monitors on the independence of the audit com-pany and verifies compliance with the regulations regarding the nature and type of the services other than the audit carried out on the Issuer and its subsidiaries by the said audit company.
In carrying out its duties the Board of Statutory Auditors co-ordinates its activities with the Internal Audit department and the Internal Control Committee.
annual report 2010
SUMMARY OF FINANCIAL DATA
Net revenues for the financial year 2010 were € 327,522 thousand, compared to € 268,006 thousand in the year ended 31 December 2009, representing an increase of 22.2% over the previous year. Following a financial year in 2009 that was heavily impacted by the collapse in markets, related to the exceptional factors that took place between the end of 2008 and mid-2009 (global financial crisis, combi-ned with an economic crisis in our core market), the Group succeeded in taking advantage of a recovery in its key markets in 2010, consolidating its leadership position and confirming its status amongst the world’s leading companies in the sector.
Before analysing the result by segment it should be noted that, beginning with the present financial sta-tements, there has been a change to the segment information (required by IFRS 8) to bring it up to date with the changed internal structure of the Group. As explained in greater detail in the relevant section of the notes, the organisational changes carried out have had an impact on the Corporate Reporting system, the updating of which – a process that is ongoing – has allowed us to adopt a new system of segmentation for internal and external reporting purposes. The process of change, which began in January 2010, has resulted in the identification of two new operating segments (Service and Tooling), which were previou-sly included in the traditional Wood and Glass & Stone segments. The first segment is dedicated to the management of replacement parts and after-sales support for the machines produced by the Wood and Glass & Stone divisions, while the second segment is specifically dedicated to the production and sale of
ICOME STATEMENT TO 31 DECEMBER 2010
€ ‘000 December2010
% on sales
December 2009
% on sales Δ %
Net revenue 327,522 100.0% 268,006 100.0% 22.2%
Change in inventories, wip, semi-finished and finished goods 5,897 1.8% (23,414) (8.7)% --
Other revenues 4,316 1.3% 4,699 1.8% (8.2)%
Value of Production 337,735 103.1% 249,292 93.0% 35.5%
Consumption of raw materials, consumables supplies and goods (143,639) (43.9)% (105,839) (39.5)% 35.7%
Other operating expenses (70,714) (21.6)% (59,391) (22.2)% 19.1%
Added value 123,382 37.7% 84,062 31.4% 46.8%
Personnel expense (107,683) (32.9)% (92,498) (34.5)% 16.4%
Gross Operating profit (loss) 15,700 4.8% (8,436) (3.1)% --
Depreciation and amortisation (12,454) (3.8)% (13,318) (5.0)% (6.5)%
Provisions (2,572) (0.8)% (6,120) (2.3)% (58.0)%
Normalised Operating profit (loss) 674 0.2% (27,874) (10.4)% --
Impairment losses and non recurring items (568) (0.2)% (5,105) (1.9)% (88.9)%
Net Operating profit (loss) 106 0.0% (32,979) (12.3)% --
Finance income/expense (2,157) (0.7)% (3,204) (1.2)% (32.7)%
Exchange rate differences gains (losses) (478) (0.1)% (131) 0.0% -
Pre-tax loss (2,529) (0.8)% (36,314) (13.5)% (93.0)%
Income taxes (3,211) (1.0)% 9,122 3.4% --
Loss for the year (5,741) (1.8)% (27,192) (10.1)% (78.9)%

40 41
annual report 2010
directors’ report
31/12/2010 31/12/2009
grinders and tools for the Glass, Stone and other composite materials industries. The following analysis illustrates revenues by segment as presented to the Group’s Management. Please re-fer to the relevant section of the notes for information regarding the figures compiled on the basis of IFRS. The figures relating to 2009 have been restated to ensure comparability with the reported data. The analysis of revenue by segment illustrates the positive results achieved by the Wood, Glass & Stone and the Service divisions (+24.1%, +18.9% and +22.4% respectively) and the strong progress made by the Mechatronics division (+41.7%).
BREAKDOWN OF REVENUE BY OPERATING SEGMENT
€ ‘000 31 December 2010 % 31 December
2009 % Δ %
Wood Division 195,230 59.6% 157,293 58.7% 24.1%
Glass/Marble Division 51,700 15.8% 43,500 16.2% 18.9%
Mechatronic Division 44,475 13.6% 31,382 11.7% 41.7%
Service Division 54,349 16.6% 44,388 16.6% 22.4%
Tooling Division 7,416 2.3% 6,376 2.4% 16.3%
Components Division 25,472 7.8% 11,300 4.2% 125.4%
Intragroup eliminations (51,119) (15.7)% (26,233) (9.8)% 94.9%
TOTAL 327,522 100.0% 268,006 100.0% 22.2%
BREAKDOWN OF REVENUE BY OPERATING SEGMENTWood Division Glass/Marble
DivisionMechatronic
DivisionService Division
Tooling Division
Components Division
Intragroup eliminations
59.6 58.7 15.8 16.2 13.2 11.7 16.6 16.6 2.3 2.4 7.8 4.2 -15.7 -9.8
80
70
60
50
40
30
�0
10
0
-10
-20
annual report 2010
BREAKDOWN OF REVENUE BY GEOGRAPHICAL AREA31 December
2010 % 31 December 2009 % Δ %
Western Europe 162,402 49.6% 155,371 58.0% 4.5%
Asia-Pacific 54,835 16.7% 41,050 15.3% 33.6%
Eastern Europe 51,043 15.6% 27,741 10.4% 84.0%
North America 30,615 9.3% 23,336 8.7% 31.2%
Rest of the World 28,627 8.7% 20,508 7.7% 39.6%
GROUP TOTAL 327,522 100.0% 268,006 100.0% 22.2%
€ ‘000 31 December 2010 % 31 December 2009 %
Value of Production 337,735 100.0% 249,292 100.0%
Consumption of raw materials and goods (143,639) (42.5)% (105,839) (42.5)%
Other operating expenses (70,714) (20.9)% (59,391) (23.8)%
Service costs (58,721) (17.4)% (47,642) (19.1)%
Use of third parties assets (6,394) (1.9)% (6,599) (2.6)%
Other operating expense (5,599) (1.7)% (5,150) (2.1)%
Added value 123,382 36.5% 84,062 33.7%
The Value of Production was € 337,735 thousand, compared with € 249,292 thousand in the year ended 31 December 2009, representing an increase of 35.5% compared with the previous year, due to a more expansive showroom network strategy and the availability of machinery for immediate delivery, compared to the more cautious approach adopted at the end of 2009. Cost as a percentage of value of production is presented to give a clearer indication of the Group’s profitability.
31/12/2010 31/12/2009
The breakdown of sales by geographical area reveals an increase of +84.0% in Eastern Europe and good results in Asia-Pacific and North America (both up by more than 30%). The lowest growth rate was re-corded in Western Europe (+4.5%) which, though it remains the Group’s most important market, saw its share of total revenue decline from 58% to 49.6%.
Western Europe
Asia-Pacific
Eastern Europe
North America
Rest of the World
49.6% 16.7%
15.6%
9.3%8.7%
58.0% 15.3%
10.4%
8.7%
7.7%

4� 43
annual report 2010
directors’ report
Exchange rate management in 2010 resulted in a loss of € 478 thousand (loss of € 131 thousand in 2009).
The pre-tax loss therefore shows a loss of € 2,529 thousand, compared to a loss in 2009 of € 36,314 thousand.
Income taxes were a negative for a total of € 3,211 thousand. The negative balance is attributable to the following factors: € 2,368 thousand relating to IRAP for the year, € 1,038 thousand relating to taxes on the income of foreign subsidiaries and € 128 thousand relating to the balance of deferred tax income and expense; positive components of € 323 thousand regards prior year taxes relating to the positive outcome of prior year tax disputes for which accruals had been made to the provision for tax and duties against the risk of an unfavourable outcome in these disputes.
There was no IRES current tax applicable to the 2010 financial year, because the amount of tax calcula-ted on taxable income was entirely offset by losses reported by other companies under the national tax consolidation scheme.
The negative balance of deferred tax is also composed of deferred tax assets calculated on the tax losses of companies which are likely to return to profitability in future years.
The difference between effective tax expenses (calculated net of the items relating to IRAP and taxes relating to prior years) equal to 44.02% and theoretical tax income (applying the national IRES tax rate of 27.5%) is due to the non-recognition of deferred tax assets on the tax losses of some foreign companies, as the recovery of these items is considered to be unlikely in future periods, and to the recalculation of initial deferred tax assets and the weight of permanent differences.
The Group therefore recognised a loss of € 5,741 thousand.
annual report 2010
Added value calculated as a percentage of the value of production increased by 2.8 percentage points compared with the previous year, largely due to operating leverage which allowed a better absorption of inelastic costs relative to the trend of revenue; these inelastic costs include rental costs, hire charges, consultancy fees, travel and lodging expenses, utility costs, trade fairs and events etc.. included amongst other operating expense. The cost of raw materials and goods as a percentage of the value of production, excluding the effect of exchange rate fluctuations, improved by 1.3 percentage points (42.5% vs 43.8%): the different sales mix (a higher proportion of revenue from Mechatronic and Tooling products) and par-tially the impact of the aforementioned project to recover product profitability offset the inflationary trend of raw material costs.
Personnel expense in 2010 was € 107,683 thousand, compared to € 92,498 thousand in the year ended 31 December 2009, representing 32.9% of net revenue, down from 34.5% in the previous year despite a € 15.2 million increase in value terms.
€ 5 milion of the cumulative increase is attributable to the variable element of these costs (e.g. results related bonuses, other bonuses and related contribution charges), which combined to give the Group a result that is more or less consistent with its “target” nominal value, whereas the value reported for 2009 revealed a decline of more than 70% below the targeted value, because of the negative result for the period.
The fixed component rose by about € 10.5 million, as a result of the greater requirement for skilled workers, particularly direct labour, to meet the increase in volumes, with a consequent reduction in the utilisation of state subsidised lay-off schemes compared to 2009. It should be noted that the figure for 2009 included costs of € 911 thousand relating to the staff re-settlement expenses relating to the closure of the HSD factory in Turin.
Capitalisation of employee wages and salaries rose slightly compared to 2009 (€ 4,934 thousand compa-red to € 4,604 thousand in 2009) due to the almost total return to the workplace of personnel belonging to the product development area.
Consequently the Gross Operating profit was € 15,700 thousand.
Depreciation and amortisation fell by 6.5% (from € 13,318 thousand to € 12,454 thousand): deprecia-tion of property, plant and equipment amounted to € 6,531 thousand (down by 12.1%), while amortisa-tion of intangible assets was € 5,922 thousand (down 0.6%). The lower amount of property, plant and equipment depreciation confirms a trend that began in March 2009 and which is due to the streamlining of production related locations and investments, with greater utilisation of existing locations and infra-structure. Please note with regard to this the revision of estimates of the useful life of some automated operating machinery (used in the Italian plants), to reflect a better estimate regarding utilisation of the same: the change to the depreciation rate has resulted in lower depreciation of € 345 thousand.
Provisions amounting to € 2,572 thousand fell sharply compared with the previous year which was af-fected by the impact of adverse market conditions on trade receivables. The reported amount is com-posed of accruals of € 912 thousand made to the provision for product guarantees (€ 253 thousand in 2009), provisions of € 784 thousand to the allowance for impairment (€ 4,554 thousand in 2009) and provisions for risks and charges of € 876 thousand (€ 1,313 thousand in 2009).
Consequently the normalised Operating profit was positive at € 674 thousand.
Impairment and other non-recurring costs fell significantly compared to 2009, when the exceptionally severe recession resulted in expenses of € 5,105 thousand (principally related to the inclusion in the accounts of a € 3.1 million provision for restructuring and the impairment of about € 1 million of prepaid project development costs of uncertain recoverability). The value reported for 2010 is mainly attributable to the setting up of a further provision for € 500 thousand corporate restructuring, which relates to the completion of extraordinary personnel and production site re-organisation programmes which were begun during 2010.
Consequently the Operating profit was positive at € 106 thousand.
Net Financial Expense of € 2,157 thousand, were down by 32.7% compared to the previous year (€ 3,204 thousand). The main components of this item are represented by bank interest expense, which, net of interest income, amounted to € 1,167 thousand (€ 2,182 thousand in 2009), costs relating to the discounting to present value of long-term financial assets, totalling € 545 thousand (€ 121 thousand in 2009) and financial discounts to clients, of € 419 thousand (€ 368 thousand in 2009).

44 45
annual report 2010
directors’ report annual report 2010
SUMMARY STATEMENT OF FINANCIAL POSITION
Intangible assets increased partly as a result of investment in new product development projects and the implementation of the new Oracle ERP system, which totalled more than € 8.2 million, while related amorti-sation was € 5.9 million. Net investment in property, plant and equipment amounted to € 3.6 million, while depreciation was € 6.5 million. Exchange rate fluctuations and other variations resulted in an increase in the opening balances of € 0.5 million and € 1.3 million respectively.
Inventories rose by € 18,084 thousand, of which € 2,533 thousand was attributable to exchange rate fluc-tuations. The change is the result of the positive trend of orders received, which resulted in an increase in semi-finished goods of € 1,429 thousand and in raw materials for production of € 9,570 thousand. The € 5,893 thousand increase in inventories of finished goods (of which € 1,683 thousand was due to exchange rate factors) is also attributable to the improved order inflow; most of the increase is attributable to Asia-Pacific and North America.
SUMMARY STATEMENT OF FINANCIAL POSITION AT 31 DECEMBER 2010
€ ‘000 31 December2010
31 December�009
Intangible assets 44,281 41,073
Property, plant and equipment 55,834 57,431
Finacial assets 738 616
Non current assets 100,853 99,119
Inventories 81,326 63,242
Trade receivables 90,391 77,307
Trade payables (111,134) (60,977)
Net Operating Working Capital 60,582 79,572
Net Operating Working Capital (10,855) (11,857)
Post-employment benefits (8,547) (10,067)
Provision for risk and charges (16,407) (13,018)
Other net receivables/payables 16,210 15,805
Net deferred tax assets/liabilities (19,600) (19,137)
Net Invested Capital 141,835 159,555
Share capital 27,393 27,393
Result of the previous year and other reserves 100,694 125,636
Loss for the year (5,392) (26,696)
Non controlling interests 220 517
Equity 122,914 126,850
Due to bank and other finacial institutions 44,733 63,853
Cash and cash equivalents (25,812) (31,148)
Net financial indebtedness 18,921 32,704
TOTAL SOURCE OF FUNDING 141,835 159,555
At end-December 2010 Group net indebtedness was significantly lower at € 18.9 million (gearing = 0.15), a decline of € 13.8 million, compared with the amount reported at end-December 2009.
In the absence of significant extraordinary factors, the result is attributable to the improvement in net working capital and the return to profit at the EBITDA level.
NET FINANCIAL INDEBTEDNESS
€ ‘000 31 December2010
30 September2010
30 June2010
31 March2010
31 December2009
Financial assets: 25,812 24,786 29,799 31,517 31,148
Liquidity 25,812 24,786 29,799 31,517 31,148
ST finance lease liabilities (2,217) (2,188) (2,185) (2,219) (2,290)
Bank and other ST financial debt (33,535) (33,796) (35,770) (44,756) (42,988)
Net Short Term Financial Indebtedness (9,940) (11,198) (8,156) (15,458) (14,130)
M/L term finance lease liabilities (2,998) (4,040) (4,120) (5,133) (5,225)
M/L term bank debt (5,983) (7,463) (8,116) (10,079) (13,349)
Net M/L Term Financial Indebtedness (8,981) (11,503) (12,236) (15,211) (18,575)
Total Net Financial Indebtedness (18,921) (22,700) (20,392) (30,669) (32,704)
The remaining components of Net Operating Working Capital (trade payables and receivables) reflect the beneficial impact of the tighter management of production factors and the supply chain. The total improve-ment of € 18,989 thousand in Net Operating Working Capital is attributable to an increase in trade payables (€ 50,157 thousand), which more than compensated for the aforementioned increase in inventories and the increase in trade receivables (€ 13,058 thousand), arising from the increase in sales. The change in trade payables is largely due to the increase in production volumes in the last quarter of 2010 (compared with the same period of 2009) and to an extension of the payment period to suppliers; the improvement was also helped by an increase in customer deposits (closely correlated to the positive trend of orders received) and to the suspension of revenues for product installation and testing already invoiced but not yet completed.

46 47
annual report 2010
directors’ report
PRINCIPAL RISKS AND UNCERTAINTIES TO WHICH BIESSE S.P.A. AND THE GROUP ARE ExPOSED
OPERATING RISKS
Risks relating to general economic conditions
The Group’s financial position, results and cash flow are influenced by several macro-economic factors – including the trend of global and domestic GDP, the level of business confidence, the trend of interest rates and the cost of raw materials– in the various countries in which the Group operatesFor example, the global economic recession that afflicted the first half of 2009 had a negative impact on the Group’s operating result. The significant and widespread deterioration in market conditions was exacerbated by severe and gene-ralised difficulty in gaining access to credit, both for consumers of finished goods (furniture, fixtures and finishings) that our machinery is used in producing and for client businesses, and began to result in a scarcity of credit that was reflected definitively in the industrial development of many sectors, amongst which, and in particular, those in which the Group operates (capital equipment)As previously mentioned, the weakness of the general conditions affecting the economy and the sectors in which Biesse operates and the progressive deterioration of the credit market are reflected, particularly in the first half of 2009, in a significant decline in demand in the Group’s core markets; a significant reversal of this trend began in the second half of 2009 and continued through the first half of 2010 sustained by considerable public spending aimed at reviving the economy.The termination of economic support measures introduced by some governments lowered expectations of recovery in the markets affected. In the meantime, penetration of new markets and, above all, the increase in exports to the so-called BRIC countries enabled industrial production to return to break-even levels, even if they were insufficient to allow a return to profit.
Because of the difficulties in forecasting the magnitude and duration of economic cycles, no assurances can be given about the future trend of demand for the Group’s products in the markets in which it ope-rates. In addition, several important economies are still in recession or have experienced very low rates of growth or even economic stagnation. This and new recessionary conditions in markets that have barely emerged from recession may ultimately affect the industrial development of many businesses including that of the Group. There is no certainty that the measures put in place by governments and monetary authorities in response to the current situation will re-establish the conditions for sustainable economic growth. Consequently, there is still much uncertainty regarding global economic forecasts and it is still possible that the economies of some countries may experience periods of slow growth or recession.
Risks relating to Group results
The Biesse Group operates primarily in a sector, mechanical goods, that is subject to a high level of cyclicality.It should be born in mind that it is difficult to predict the extent and duration of economic cycles; the cyclical nature of the sector in which the Biesse Group operates tends also to reflect the general economic trend, in some cases even amplifying its impact. Therefore, each macro-economic event, such as a significant fall in one of the principal markets, the vo-latility of financial markets and the consequent deterioration of the capital markets, an increase in energy prices, fluctuations in the prices of commodities and other raw materials, adverse fluctuations in specific factors such as interest rates, exchange rates etc. are capable of having a significantly negative effect on the prospects and the activities of the Group, as well as its results and financial position. In addition, the profitability of the Group is subject to risks related to the fluctuation of rates of interest and inflation, to the solvency of counterparties and the general economic situation of the countries in which it conducts its business.
Risks relating to fluctuations in the prices of raw materials and components
The Group’s exposure to increases in the prices of raw materials mainly derives from the purchase of
annual report 2010
components and semi-finished goods given that the direct purchase of raw materials for production is not significant. The Group, therefore, does not take any specific hedging measures against these risks but it tends to try to transfer the management and the economic impact to its own suppliers, agreeing with them, where necessary, purchase prices that guarantee stability for periods of no less than a single quarter.The impact of raw material prices on the average price of the Group’s products does not exceed 4%. The high degree of competition and fragmentation of the sector in which Biesse operates frequently makes it difficult to pass on entirely to sales prices any rapid or significant increrase in the cost of raw materials.
Risks relating to relations with employees
In several countries in which the Group operates, its employees are protected by various laws and/or collective labour contracts that guarantee them, through local and national representation, the right to be consultation regarding specific questions, including restructuring or closure of departments or staff reductions. The laws and/or collective labour contracts applicable to the Group could have an influence on its flexibility in redefining and/or strategically repositioning its operations. Biesse’s ability to reduce em-ployee numbers or other measures of interrupting working relationships, even temporarily, is conditioned by government authorisations and union agreement. Industrial action by unionized employees could have a negative impact on the company’s business.
Risks relating to supplier relationships
The Group purchases raw materials, semi-finished goods and components from a large number of sup-pliers and relies on services and products provided by other companies outside the Group. Close collaboration between producers and suppliers is customary in the sectors in which Biesse operates and if, on the one hand, it can result in economic benefits in terms of cost reduction, the Group’s reliance on these suppliers raises the possible consequence that difficulties encountered by them (whether due to internal or external factors) can have negative repercussions for the Group.
Risks relating to management
The success of the Group depends in large part on the ability of its executives and other managers to ef-fectively manage the Group and its individual business divisions. The loss of an executive director, senior manager or other key individual with no adequate substitution, and any inability to attract and keep new and qualified staff, could therefore have a negative impact on the Group’s business prospects as well as on its results and/or its financial position.
Risks relating to sales in international markets and exposure to changeable local conditions
A significant part of the Group’s production and sales are carried out in countries outside the European Union. The Group is exposed to risks inherent in operating on a global scale, including risks relating to exposure to local economic and political conditions and the possible application of policies restricting imports and/or exports. The Biesse Group is also exposed to compliance with several tax regimes, in particular with reference to transfer pricing.The Biesse Group operates in several emerging markets including India, Russia, China and Brazil. The Group’s exposure to these countries has increased in recent years, so that any unfavourable political or economic developments in these areas could have a negative impact on the Group’s prospects and its activities as well as on its results.
Risks relating to the capacity to offer innovative products
The success of the Group’s activities depends on its ability to maintain or increase its share of the markets in which it currently operates and/or to expand in new markets by offering innovative, high quality pro-ducts that guarantee adequate levels of profitability. Should the Group be unable to develop and offer innovative and competitive products compared to those of its main competitors in terms of, amongst other things, price, quality, functionality, or should there be any delay in launching on the market new models that are strategic to the Group’s business, the Group’s market share may decline with a negative impact on its business prospects and on its results and/or financial position.

48 49
annual report 2010
directors’ report
FINANCIAL RISKS
Risks relating to financial requirements
The evolution of the financial situation of the Group depends on numerous conditions, particularly inclu-ding its ability to achieve stated objectives, as well as the general trend of the economy, financial markets and the sectors in which the Group operates.
The Biesse Group expects to meet its financial requirements through the cash flow generated by its ope-rating activities, available liquidity and the renewal or re-financing of bank loans. As much as the Group has put in place measures to ensure that adequate levels of working capital and liquidity are maintained, potential reductions in sales volumes could have a negative impact on the ability of the Group’s operations to generate cash. However, the sharp improvement in the Group’s net financial indebtedness has significantly reduced the risk of it having to seek new sources of financing and re-finan-cing existing debt.
Credit risk
The Group is exposed to various concentrations of credit risk in various markets, mitigated by the fact that credit exposure is divided amongst a large number of counterparties and clients. Financial assets are reported in the financial statements net of impairment calculated on the basis of risk of default by the counterparty, taking into account the information available on the client’s solvency and also taking historic data into consideration.
Risks relating to exchange rate fluctuations
The Biesse Group, which operates in several markets around the world, is naturally exposed to market risks relating to the fluctuation of interest and exchange rates. Its exposure to exchange rate risk is related primarily to the geographical diversification of its commercial operations, which leads to revenue from exports denominated in currencies different to that of the country of production; in particular the Biesse Group is principally exposed to net exports from the Euro area to other currency zones (mainly the US dollar, the Australian dollar, Sterling and the Indian Rupee). Consistent with its policy of risk management, Biesse Group seeks to hedge its exposure to the risk of fluctuations in exchange rates through the use of financial hedging instruments. Despite these financial hedging transactions, sudden fluctuations in exchange rates could have a negative impact on the results of the Group.
Risks relating to interest rate fluctuations
Biesse Group utilizes various types of financing in order to cover the requirements of its industrial activi-ties. Changes in the level of interest rates could lead to increases or reductions in the cost of finance.
annual report 2010
research and development activity 2010The following list details research and development initiatives undertaken in 2010:
WOOD DIVISION
Biesse Brand
KLEVER machining centreDevelopment has begun on an entry-level machining centre for processing plastic and wood-based ma-terials.
ROVER A machining centre Development continued on enhancing the processing performance of low end machining centres for both the solid board market and the panel market and to introduce optimal solutions to increase the profitabi-lity of the product.
ROVER B machining centreDevelopment continued on enhancing the processing performance of mid-range machining centres and to introduce optional units for the transfer and completion processing stages for solid board in ‘work cell’ configuration.
ROVER C machining centreDesign continued on the development of optional units for the transfer and completion stages for proces-sing solid board in ‘work cell’ configuration and to insert new edgebanding groups.
Rover G machining centreDesign work was completed on a range of machinery dedicated to panel nesting processing. This range was equipped both with panel loading and unloading systems for automatic transfer of panels and panel labelling equipment.
UNIWIN machining centreDesign and development work was completed on projects to increase work areas and to insert new per-formance -enhanced tool magazines.
Workbench rev.02Development continued on a new workbench to increase the rigidity of the clamping systems and flexi-bility of use.
UNIWIN HP machining centreDevelopment began on the UniWin 2011 on the insertion of more optionals for the processing of solid board.Edgebanding GroupsDevelopment began on a unit for the application of borders to the edges of both square and shaped panels which can be used on panels of varying thicknesses and with various types of border and adhesives.
Rover CHP 320 machining centreDevelopment began on the prototype for an innovative machining centre prototype to carry out tests on new mechatronic solutions for increasing performance and productivity while adhering to regulatory re-quirements regarding noise and dust emission levels.
WinProf profiling machine for windows and doorsDevelopment continued on the WinProf profiling module for windows and doors. This module forms part of the Biesse Multicentri range and produces a significant increase in productivity.

50 51directors’ report
annual report 2010
EXCEL multi-head machining centreDevelopment was completed on adding more operating units to this machine that are all capable of working simultaneously thereby improving productivity.
Measuring benchDevelopment began on a machine that checks the measurements of window and door fittings and applies adhesive bar-code identification labels.
MultilevelDevelopment began on a range of buffers for managing solid board items to be processed on window and door profile machining centres.
Test BenchDevelopment began on a test bench for nesting cell modules to allow tests to be carried out on the as-sembly station.
GreenDevelopment began on features to reduce the energy management costs of machining centres.
Nesting CellsAt the lower end of the range of panel machining centres development began on optional units for label-ling and the transfer of panels through the adoption of optimal solutions to increase the profitability of the product.
TECHNO B-Cubed drilling machineA prototype was built of a linear drilling machine aimed at processing medium/large batches as part of lines dedicated to or integrated with the upstream processes of panel sawing and squaring and edgeban-ding. The machine is equipped with an innovative control system.
NEXT STEPA prototype was built of a Next Step work cell, for panel processing by primary customers. This is a solu-tion aimed at specialised processing functions in large industries or as the principal machine of a small producer of furniture.
SKIPPER 130 Flexible drilling machineDesign was completed and prototypes built for the full range of the new Skipper 130 drilling machine, with optionals for milling, cutting and dowel insertion. This machine was conceived in response to the production requirements not just of kitchen manufacturers but also of producers of bedrooms/children’s rooms and offices.
TECHNO ONE FDT drilling machineDesign work was completed on an economically-priced linear drilling machine, aimed at processing me-dium/large batches on dedicated lines or integrated with upstream processes of sizing and square-edge-banding or on manually-loaded machines in work cells.
TECHNO ONE S drilling machineDesign work continued on an economically-priced linear drilling and wood dowel insertion machine, aimed at processing medium/large batches on dedicated lines or integrated with upstream processes of sizing and square-edgebanding or on manually-loaded machines in work cells.
annual report 2010
Comil Brand
MATRIX FT drilling machineDesign was completed and prototypes built for the full range of the new compact and modular Matrix drilling machine. This was augmented by the addition of units for milling, drilling, tool changes, measuring systems and panel loading.
MATRIX KT drilling and insertion machineDesign was completed and prototypes built for the full range of the new Matrix drilling and insertion ma-chine. This was augmented by the addition of units for the insertion of hinges, plates and brackets.
MATRIX Guide drilling-insertion machineDesign work continued on a drilling-insertion machine for the insertion of lateral drawer guides on furni-ture panel components.The machine is completed by drawer guide loading and transfer systems.
INSIDER B - WRT drilling-insertion machineDesign work was completed on a flexible linear drilling-insertion machine for the insertion of cabinet doors, frontal elements and furniture frameworks.
Selco Brand
SEKTOR Serie 4 panel sizing machineDesign work has begun on a new range of panel sizing machines for the lower end of the market. The range is expected to incorporate features and functions that would normally only be available on higher category machines.
WN Series 6 panel sizing machineDesign work continued on a new mid-range sizing machine, characterised by high performance, flexibility, a high degree of configuration and a high degree of standardization with higher- category models.
WNA Series 6 panel sizing centreDesign work continued on the new range of mid-market angular panel sizing centres, characterised by high standardisation of components with the single cutting line versions. The centres under development will incorporate new loading and cutting features that will enable them to carry out complex operations automatically.
WNA Series 7/8 panel sizing centre Design work began on a new range of upmarket angular panel sizing centres, characterised by high levels of productivity and integration with feeders (automatic loading an unloading systems). This will also in-volve development of certain features relating to the use of higher power motors and optimisation of the cutting pattern pushing system.
Optiplanning (Optimisation Software)Development continues on the optimiser and of new algorithms that will be useful for increasing produc-tivity and reducing waste.
Biesseedge Brand
New STREAM squaring and edgebanding machine rangeA new range of upmarket squaring and edgebanding machines is in development: new technological features allow management both of high production levels and single batch processing favouring design to cost concepts and industrialisation of components. The prototype of a single-sided edgebander was completed. The new range will be characterised by new concept operator units capable of improving performance and reliability.

5� 53directors’ report
annual report 2010
STREAM edgebanding machinesA new and innovative system of adhesive application is being designed which uses LASER technology systems to fuse the adhesive and/or the edge to be applied to the panel. The results obtained show a significant improvement in the application of the border to the panel with signs of the joint between them having been eliminated.
STREAM (MDS) square-edgebanding moduleDevelopment was completed on a square-edgebanding module that can be coupled with STREAM edge-banding machines. The solution that was devised allows the offer of highly flexible edgebanding machine, capable of working on very small batches, even potentially on single items (batch-one).
“B-Cubed” Square-edgebanding machine As part of the new STREAM range, development continued on a square-edgebanding machine which incorporates an innovative control and management system for operator units and the belt (electronic axis).
Rbo Brand
ASTER Pluris LoaderWork was completed on building a prototype loader for flexible drilling and dowel insertion lines.
WINNER “B-Cubed” Loader/UnloaderWork was completed on building prototype loading/unloading bridges for flexible panel processing lines. An innovative control and management system for moving axes can be integrated into in-line machines.
GPK “B-Cubed” Panel turnerWork was completed on building a prototype of a device for turning panels on panel processing lines. An innovative control and management system for moving axes can be integrated into in-line machines.
Artech Brand
LEVIA 400 Sanding machineDevelopment continued on a wide band sander aimed at the small workshop and smaller company market. One of the special features of this new line, is to be able to present highly developed and easily configura-ble sanders at competitive prices. The operator units were completely redesigned and the new machines will incorporate features until now only available on the upper range models.
Biessesand Brand
REGAL 800 Sanding machineDesign work continued on the new heavy duty range including 3 and 5 operator unit versions.
Brema Brand
VEKTOR optionalsDesign work continued on a system of high productivity drilling jigs and optionals to complete the Vektor range.
VEKTOR restylingDesign work was completed on a vertical work centre for panel processing. The objective of this project is to revise the existing machine to obtain improved performance and reduce dust emissions and noise.
VEKTOR PDesign work was completed on a vertical work centre for panel processing. A new system of panel tran-sport and insertion features was introduced on the vertical machines to help reduce costs.
annual report 2010
Software development projectsDevelopment was completed on software packages to improve the functionality of the Vektor range e.g. processing of the resting side, programming of tool replacement times, updating of processing program-mes, optimisation of work cycles.
Vertical transfer projectDesign continued on the main feeder devices for vertical work centres to optimise panel processing cycles and work cell automation.
GLASS & STONE DIVISION
Intermac Brand
GENIUS 37 LM cutting bench + GENIUS CT (comby)Development was completed on a combined cutting bench, designed to cut laminated and monolithic sheets, for use in the construction and furnishing sectors, necessary for restricted space requirements to achieve a balance between building and furnishing production.
GENIUS 37 LM-A cutting bench + service benchDevelopment was completed on the first version of an up-market cutting bench for cutting laminated sheets, primarily for use in the construction sector. The LM-A series benches are constructed on an innovative mono-bridge structure, which enables cutting cycles to be monitored and processing times to be reduced, and offering the possibility of cutting different thicknesses. It is possible to automatically square and define the amount of the first cut and related traverse. A service bench was also developed for combining with the machine, which incorporates sheet loading, support and ventose features to reduce the dimensions of the line.
GENIUS 46 LM-A cutting bench + service benchDesign work began on an up-market cutting bench for cutting laminated sheets, primarily for use in the construction sector. The LM-A series benches are constructed on an innovative mono-bridge structure, which enables cutting cycles to be monitored and processing times to be reduced, and offering the possi-bility of cutting different thicknesses. It is possible to automatically square and define the amount of the first cut and related traverse. A service bench was also developed for combining with the machine, which incorporates sheet loading, support and ventose features to reduce the dimensions of the line.
Intensifier for 5 axis headDevelopment of a water intensifier with iso couplings, for use on numerically controlled machining cen-tres.
Up-market machining centreDesign work began on a machining centre for natural or synthetic stone products. This model is intended to broaden the range of models at the upper end of the market.
PRIMUS 184 5 axis headDevelopment work was completed on a high pressure water cutter for cutting glass, stone, steel, alu-minium and plastics, which, if necessary can use sand for cutting extremely hard materials. Water jet cutters allow cutting of complex profiles and combines flexibility and cut quality without requiring subse-quent runs to clean off residue which occur in other metal cutting processes.
PRIMUS series 3 water jet cutterDevelopment began on a high pressure water cutter for cutting glass, stone, steel, aluminium and plasti-cs, which, if necessary can use sand for cutting extremely hard materials. Water jet cutters allow cutting of complex profiles and combines flexibility and cut quality without requiring subsequent runs to clean off residue which occur in other metal cutting processes.

54 55directors’ report
annual report 2010
Busetti Brand
F 10 - F12 double edging machines (flat edge) Development was completed on a flat profile double edging machine with modular characteristics for industrial use to combine the multiple requirements of quality, profile form and sheet dimension in the context of a product that may be equipped with optionals in order to obtain a single machine or a plant that may also be fully automatically managed.
MECHATRONICS DIVISION
HSD Brand
Birotary electrospindle.Design work began on the new HS 300 range of heads. The new model is targeted at the entry-level ma-chining centre segment dedicated to processing wood, plastic and aluminium products. It is an extremely compact unit connected to a high power electrospindle.
High frequency motorsDesign work began on the new ES 794 and ES 330 range of electrospindles. This new range was concei-ved to satisfy the high performance and size demands of the new range of metal processing machining centres. They are designed for use in light milling operations.
Smart motorDesign work continued on the new integrated action SM141 servomotor. This new model is adapted for performance and precision operation of machine axes. The new model is designed for wood milling appli-cations on entry-level machining centres.
Electronic cardsDesign work was completed on the new digital receiver card with related Bus converter. These cards are equipment on the new HS350 head range, and allow it to stay within the size limitations imposed by the application.
Independent spindle drilling headsDesign work began on a new independent spindle drilling head, characterised by a sleeve equipped with axes blocking pads. This solution permits greater rigidity and precision in drilling operations.
Combined linesRe-design work began on the combined wood processing line. The objective of this activity is to stream-line the range and a simplification of design activity with subsequent cost benefits.
SOFTWARE PLATFORMS AND COMPONENTS
Family FeelingThe Family Feeling project continues. Its objectives are:
• to strengthen branding and consolidate the look of the graphic interfaces of all software produced by Biesse;
• increase the degree of usability of products to facilitate consistency of user methodology and workflow;
• promote the re-use of software components, reducing costs and increasing reusability of the products.
B-Cubed LineThe development of the B-Cubed project continues, related to the building of wood production plants. Amongst its multiple objectives are the experimentation of innovative solutions in terms of motorisation and other electronic components.These objectives are, in more detail:
annual report 2010
• Reduction in HW and SW design, assembly, cabling and testing times;
• Reduction in the total cost of the distributed application;
• Energy saving on inverter and motorisation;
• Standardised layout of cabinet;
• Standardisation of machine components;
• Size reduction;
• Opening towards machines / lines requiring hybrid technology;
• Use of ethernet real-time technology.
BiesseLink (Production monitoring and management software)The PlantVision project flows into the larger BiesseLink which originated from the necessity of finding a proprietary solution for the monitoring and control of processing platforms for wood, glass and marble evolving into factory production control solutions. The principal objectives are:
• to develop a set of software components that can satisfy the specific monitoring and control functions of equipment distributed by Biesse;
• to readily obtain an extension of the applications supplied, to satisfy requests relating to particular items of plant or to particular production processes of the client;
• to allow integration of all phases of processing by the client and to trace them to a single application;
• to allow planning throughout the entire production chain.
BSolid (CAD/CAM)This is a new system of integrated programming for wood, stone and glass processing. The main focus was on the development of 3 features:
• New 3D operator interface (in re-development phase);
• New 5 axes processing;
• Realistic machine simulation.
The “renewed interface” a pilot exercise following the guidelines of the “Family Feeling” project.The 5 axes processing allows optimum exploitation of all production possibilities of the most innovative Biesse machines. Realistic machine simulation allows the user to be aware of the highest levels of potential of a machine and to gain experience of working with it on a simulator before actually working with the real machine, thereby preventing problems that could arise when working on the real machine. It also facilitates intuitive setting up of machine surfaces and tools and identifies potential anomalies.
BiesseWinAdditional application for the design and production of window and door fittings.It enables the design of the most common forms of window and door fittings with the additional feature of strong integration potential with the production features of Biesse machines.
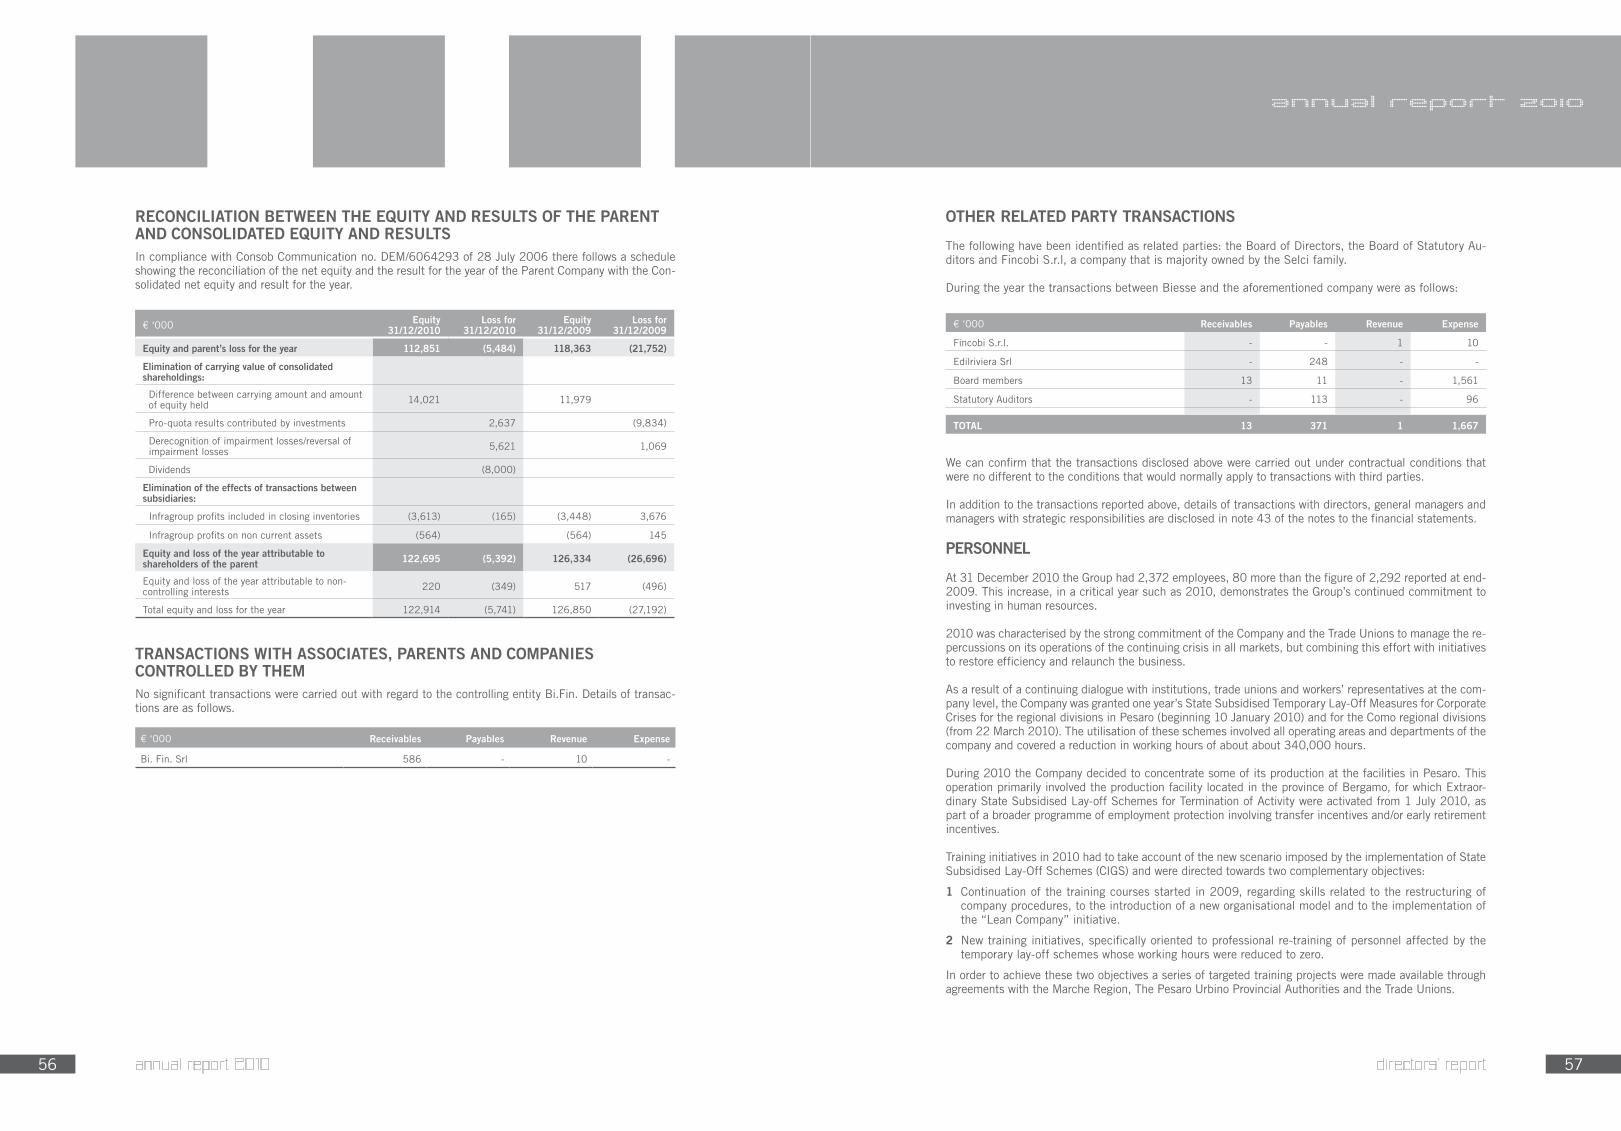
56 57directors’ report
annual report 2010
€ ‘000 Equity 31/12/2010
Loss for 31/12/2010
Equity 31/12/2009
Loss for 31/12/2009
Equity and parent’s loss for the year 112,851 (5,484) 118,363 (21,752)
Elimination of carrying value of consolidated shareholdings:
Difference between carrying amount and amount of equity held 14,021 11,979
Pro-quota results contributed by investments 2,637 (9,834)
Derecognition of impairment losses/reversal of impairment losses 5,621 1,069
Dividends (8,000)
Elimination of the effects of transactions between subsidiaries:
Infragroup profits included in closing inventories (3,613) (165) (3,448) 3,676
Infragroup profits on non current assets (564) (564) 145
Equity and loss of the year attributable to shareholders of the parent 122,695 (5,392) 126,334 (26,696)
Equity and loss of the year attributable to non-controlling interests ��0 (349) 517 (496)
Total equity and loss for the year 122,914 (5,741) 126,850 (27,192)
RECONCILIATION BETWEEN THE EQUITY AND RESULTS OF THE PARENT AND CONSOLIDATED EQUITY AND RESULTSIn compliance with Consob Communication no. DEM/6064293 of 28 July 2006 there follows a schedule showing the reconciliation of the net equity and the result for the year of the Parent Company with the Con-solidated net equity and result for the year.
TRANSACTIONS WITH ASSOCIATES, PARENTS AND COMPANIES CONTROLLED BY THEMNo significant transactions were carried out with regard to the controlling entity Bi.Fin. Details of transac-tions are as follows.
€ ‘000 Receivables Payables Revenue Expense
Bi. Fin. Srl 586 - 10 -
annual report 2010
We can confirm that the transactions disclosed above were carried out under contractual conditions that were no different to the conditions that would normally apply to transactions with third parties.
In addition to the transactions reported above, details of transactions with directors, general managers and managers with strategic responsibilities are disclosed in note 43 of the notes to the financial statements.
PERSONNEL
At 31 December 2010 the Group had 2,372 employees, 80 more than the figure of 2,292 reported at end-2009. This increase, in a critical year such as 2010, demonstrates the Group’s continued commitment to investing in human resources.
2010 was characterised by the strong commitment of the Company and the Trade Unions to manage the re-percussions on its operations of the continuing crisis in all markets, but combining this effort with initiatives to restore efficiency and relaunch the business.
As a result of a continuing dialogue with institutions, trade unions and workers’ representatives at the com-pany level, the Company was granted one year’s State Subsidised Temporary Lay-Off Measures for Corporate Crises for the regional divisions in Pesaro (beginning 10 January 2010) and for the Como regional divisions (from 22 March 2010). The utilisation of these schemes involved all operating areas and departments of the company and covered a reduction in working hours of about about 340,000 hours.
During 2010 the Company decided to concentrate some of its production at the facilities in Pesaro. This operation primarily involved the production facility located in the province of Bergamo, for which Extraor-dinary State Subsidised Lay-off Schemes for Termination of Activity were activated from 1 July 2010, as part of a broader programme of employment protection involving transfer incentives and/or early retirement incentives.
Training initiatives in 2010 had to take account of the new scenario imposed by the implementation of State Subsidised Lay-Off Schemes (CIGS) and were directed towards two complementary objectives:
1 Continuation of the training courses started in 2009, regarding skills related to the restructuring of company procedures, to the introduction of a new organisational model and to the implementation of the “Lean Company” initiative.
2 New training initiatives, specifically oriented to professional re-training of personnel affected by the temporary lay-off schemes whose working hours were reduced to zero.
In order to achieve these two objectives a series of targeted training projects were made available through agreements with the Marche Region, The Pesaro Urbino Provincial Authorities and the Trade Unions.
OTHER RELATED PARTY TRANSACTIONS
The following have been identified as related parties: the Board of Directors, the Board of Statutory Au-ditors and Fincobi S.r.l, a company that is majority owned by the Selci family.
During the year the transactions between Biesse and the aforementioned company were as follows:
€ ‘000 Receivables Payables Revenue Expense
Fincobi S.r.l. - - 1 10
Edilriviera Srl - �48 - -
Board members 13 11 - 1,561
Statutory Auditors - 113 - 96
TOTAL 13 371 1 1,667

58 59
annual report 2010
The first objective was pursued through three training courses called respectively: New Organisation, Com-pany Procedures and Skills for the Procedures. In total 37 classes were organised involving 808 hours of teaching for a total of 570 participants in the courses. At the same time the Biesse Kaizen Academy continued its own activity involving Biesse personnel, through substantial workshop and training activities. A training model based on two modules was offered in support of this activity. The first module, Principles of Lean Organization, a brief introductory course, was aimed at a large section of the workforce involved in the Lean reorganisation process. The second, more specialist, module, the Lean Organization Academy, was aimed at personnel with a key role in the re-organisation process.
In order to reach the second objective, following implementation of the state subsidised lay-off scheme reducing working hours to zero, a wide-ranging training and re-training course was made available to those employees who were temporarily suspended. The programme was developed in agreement with the Employ-ment Centre with the contribution of experts from the Centre for Research on Employment Transition at the University of Bologna.
The course involved a first stage of involvement and support of the participants, followed by a person ap-pointed as partner, with the aim of preparing a resume of the skills of each participant. Subsequently, with help from the experts, each participant was able to prepare a personalised training course.
The classroom stages consisted of modular courses that followed the choices and courses identified by the participants.
In total the programme involved 81 students and more than 554 hours of classroom time.
The results of the initiative were presented to the authorities and Trade Unions at a special sitting of the Provincial Labour Commission (Commissione Provinciale Lavoro) as an exemplary case of good practice.
The Employer Branding programme which began in 2009 continued in 2010 and focused on raising the awareness and attractiveness of the Company among talented young University students. The management of contacts with schools and universities was cultivated largely through participation in Career Days and company presentations at Universities involving not just local schools and universities but expanding contacts to institutions throughout Italy. This activity generated two important results in 2010.Focus on technical/engineering skills resulted in a programme of collaboration with Milan Polytechnic, involving both direct engagement in the classroom and training internships directed at the international development of young interns.
The continuous attention devoted to offering training opportunities to young people with secondary school education, particularly technical training, led to the agreement, in December 2010, of a programme with the Pesaro Province Employment Centre. The programme is aimed at developing 20 technical and economics-related internships for young graduates and undergraduates in 2011.This programme, agreed with the employment authorities, is confirmation of the Company’s willingness to invest in young people, providing training opportunities in a professional environment and providing a certi-ficate of the skills acquired at the end of the training period. This initiative was officially presented on 7 March at a press conference involving the Provincial Authorities, the Company and Trade Unions as an example of good practice in public-private partnerships aimed at development and as a model to be replicated at a national level.
directors’ report annual report 2010
SHARES IN BIESSE AND/OR COMPANIES CONTROLLED BY BIESSE, HELD DIRECTLY AND INDIRECTLY BY MEMBERS OF THE BOARD OF DIRECTORS, THE BOARD OF STATUTORY AUDITORS AND THE GENERAL MANAGER, AS WELL AS BY THEIR RESPECTIVE SPOUSES WHERE NOT LEGALLY SEPARATED AND BY THEIR CHILDREN
ATYPICAL AND/OR UNUSUAL TRANSACTIONS OF THE YEARDuring the course of 2010 no transactions of this nature were reported.
SIGNIFICANT SUBSEQUENT EVENTS AND OUTLOOK As already mentioned in the preceding paragraphs, on 18 January 2011 Viet Italia S.r.l. became fully operational, which will lease the business operations of Viet S.p.A., in liquidation, a company that - following a severe financial crisis - requested to be put into voluntary administration.
Between January and February 2011, Biesse S.p.A. completed the production and dispatch of the aforemen-tioned order to its leading Libyan client; as previously stated –– payment of € 9,616 thousand has so far been received, representing the amount guaranteed by the letter of credit and subject to the dispatch of the machinery that was ordered. No further revenues associated with the order have been accounted for given the current poli-tical situation in Libya.
In January 2011 Mr. Giorgio Pitzurra was co-opted as the new Chief Executive Officer of the Group, to substitute the outgoing Chief Executive Officer, Mr. Giovanni Barra.
With regard to the prospects for 2011, on 21 December 2010 the Board of Directors of Biesse approved the customary revision of the business plan that now includes the financial year 2013 and updates the estimates for 2011 and 2012 on the basis of the final results for 2010, which now projects revenue of about € 24 million higher than in the previous version of the plan.
The order backlog at 31 December 2010 and the trend of orders in January and February 2011 are substantially in line with the objectives stated in the plan for 2011; consolidated revenue in the first quarter will reflect the need to rebuild inventories of finished goods at foreign subsidiaries; that will also result in an increase in inventories (with a consequent temporarily negative impact on the Net Financial Position), but the following three quarters are reasonably expected to converge on the economic and financial objectives for 2011 set out in the three year plan. This trend is expected despite the various political crises (Tunisia, Egypt, Libya) and natural disasters (Japan) which in recent weeks/months have reduced demand by a not inconsiderable amount compared to the estimates made in previous months.
Underlining the difficulties in forecasting in an industry that operates on average with a two-month order backlog (source: Acimall), the Directors of Biesse – on the basis of the most respected macro-economic forecasts and the Group’s strategies of product innovation and market penetration – are confident of being able to achieve the objectives that have been set.
No. of shares held directly
and indirectly at 31/12/2009
No. of shares sold in 2010
No. of shares purchased
in 2010
No. of shares held directly
and indirectly at 31/12/2010
% of share capital
Roberto SelciChairman 31,944 - - 31,944 0.12%
Giancarlo SelciManaging Director 16,015,000 - - 16,015,000 58.46%
Alessandra ParpajolaDirector 600 - - 600 0.00%
Salvatore GiordanoIndependent Director �00 - - �00 0.00%
Leone SIbaniIndependent Director 500 - - 500 0.00%
Giampaolo GarattoniIndependent Director 30,000 - - 30,000 0.11%

60 61
annual report 2010
directors’ report on the performance of biesse s.p.a.
SUMMARY INCOME STATEMENT
Net revenues for 2010 were € 251,515 thousand, compared with € 187,105 thousand in the year to 31 December 2009, representing an increase of 34.4% over the previous year.
Following the 2009 financial year which was severely impacted by the collapse in the markets relating to the excep-tional circumstances that occurred between the end of 2008 and mid-2009 (financial crisis, combined with eco-nomic crisis in our core markets), the Company succeeded in taking advantage of the recovery in its export markets in 2010, consolidating its leadership position and confirming its status as one of the world’s leading companies in its industry.
The value of production was € 256,725 thousand, compared with € 182,723 thousand in the year ended 31 De-cember 2009, representing an increase of 40.3% over the previous year. Costs as a percentage of value of (including non-recurring income and expense) are presented to give a clearer indication of the Group’s profitability.
directors’ report
INCOME STATEMENT FOR THE YEAR ENDED 31 DECEMBER 2010
€ ‘00031
December2010
% of revenue
31 December
2009
% of revenue
change %
Net revenue 251,515 100.0% 187,105 100.0% 34.4%
Change in inventories, wip, semi-finished and finished goods 964 0.4% (8,883) (4.7)% -
Other revenue 3,795 1.5% 4,502 2.4% (15.7)%
Value of Production 256,275 101.9% 182,723 97.7% 40.3%
Consumption of raw materials, consumables, supplies and goods (138,884) (55.2)% (97,365) (52.0)% 42.6%
Other operating expense (39,749) (15.8)% (34,651) (18.5)% 14.7%
Added value 77,641 30.9% 50,708 27.1% 53.1%
Personnel expense (72,858) (29.0)% (59,132) (31.6)% 23.2%
Gross Operating profit (loss) 4,783 1.9% (8,425) (4.5)% -
Depreciation and amortisation (9,284) (3.7)% (10,142) (5.4)% (8.5)%
Provisions (2,376) (0.9)% (7,650) (4.1)% (68.9)%
Normalised Operating Loss (6,877) (2.7)% (26,216) (14.0)% (73.8)%
Impairment losses and non recurring items (58) (0.0)% (1,020) (0.5)% (94.3)%
Operating Loss (6,935) (2.8)% (27,237) (14.6)% (74.5)%
Finance income/expense (390) (0.2)% (1,412) (0.8)% (72.4)%
Exchange rate differences gains (losses) (803) (0.3)% (444) (0.2)% 80.9%
Impairment losses/reversal of impairment losses on financial assets (5,505) (2.2)% (830) (0.4)% -
Dividends 8,000 3.2% - 0.0% NA
Pre-tax loss (5,633) (2.2)% (29,922) (16.0)% (81.2)%
Income taxes 149 0.1% 8,170 4.4% (98.2)%
Loss for the year (5,484) (2.2)% (21,752) (11.6)% (74.8)%
annual report 2010
Added value calculated as a percentage of the value of production increased by 2.5 percentage points compared with the previous year, largely due to operating leverage which allowed a better absorption of inelastic costs relative to the trend of revenue; these inelastic costs include rental costs, hire charges, consultancy fees, travel and lodging expenses, utility costs, trade fairs and events etc. included amongst other operating expense.
Personnel expense in 2010 was € 72,858 thousand, compared to € 59,132 thousand in the year ended 31 December 2009, representing 29.0% of net revenue, down from 31.6% in the previous year. The in-crease in the absolute value is attributable to the variable elementv of personnel expense (results related and other bonuses) and the requirement for skilled workers particularly direct labour, to meet the increase in volumes with a consequent reduction in the utilisation of state subsidised lay-off schemes.
Consequently the Gross Operating profit was € 4,783 thousand.
Depreciation and amortisation fell by 8.5% (from € 10,142 thousand to € 9,284 thousand): depreciation of property, plant and equipment amounted to € 4,308 thousand (down by 16.5%), while amortisation of intangible assets was € 4,976 thousand (down 0.2%). The lower amount of property, plant and equi-pment depreciation confirms a trend that began in March 2009 and which is due to the streamlinining of production-related locations and investments, with greater utilisation of existing locations and infra-structure. Please note with regard to this the revision of estimates of the useful life of some automated operating machinery (used in the Italian plants), to reflect a better estimate regarding utilisation of the same: the change to the depreciation rate has resulted in lower depreciation of € 345 thousand.
Provisions amounting to € 2,376 thousand fell sharply compared with the previous year which was af-fected by the impact of adverse market conditions on trade receivables. The reported amount is compo-sed of provisions of € 754 thousand made to the provision for product guarantees (no such provisions were made in 2009), provisions of € 355 thousand to the allowance for impairment (€ 3,277 thousand in 2009) and provisions for risks and charges of € 766 thousand (€ 1,973 thousand in 2009).
Consequently the Normalised Operating profit was € 6,877 thousand.
Therefore, the Operating loss – which was last year at € 27,237 thousand – was € 6,935 thousand, re-presenting a negative 2.8% as a percentage of revenue.
Lower utilisation of short and medium term credit resulted in a reduction of financial expense payable to banks and other financial institutions from € 1,412 thousand to € 390 thousand. Exchange rate manage-ment in 2010 resulted in a loss of € 803 thousand. Financial items also include the net impairment los-ses recognised on financial assets, of € 5,505 thousand: this amount relates to the impairment of equity investments in Bre.Ma. Brenna Macchine S.r.l. (€ 2,516 thousand, plus a provision for the reconstitution of the deficit of € 480 thousand), Biesse Iberica Woodworking S.l. (€ 1,799 thousand) and Biesse Group New Zealand Ltd. (€ 710 thousand). These impairment losses were recognised following the outcome of impairment tests on the carrying amount of these shareholdings calculated on the basis of a discounted cash flow analysis.
€ ‘000 31 December 2010 % 31 December 2009 %
Value of Production 256,275 100.0% 182,723 100.0%
Consumption of raw materials and goods (138,884) (54.2)% (97,365) (53.3)%
Other operating expenses (39,749) (15.5)% (34,651) (19.0)%
Service costs (33,972) (13.3)% (28,225) (15.4)%
Use of third parties assets (3,272) (1.3)% (3,384) (1.9)%
Other operating expense (2,506) (1.0)% (3,043) (1.7)%
Added value 77,641 30.3% 50,708 27.8%

6� 63
annual report 2010
directors’ report
During the year the Company received dividend income of € 8 million from its subsidiary HSD S.p.A..
The Pre-Tax loss was therefore € 5,633 thousand, compared to a pre-tax loss in 2009 of € 29,922 thousand.
Income taxes were a positive € 149 thousand. In terms of IRES, the Company recognised deferred tax income of € 1,465 thousand, since it was able to offset part of its own current losses with the profits of other Italian companies which come within the scope of the national consolidated tax scheme. In addition, the Company recognised deferred IRES tax of € 214 thousandf.In terms of IRAP, the Company accounted for current taxes of € 1,794 thousand, while the deferred tax expense in this case amounted to € 41 thousand.Finally, the total tax charge also reflects positive adjustments made to provisions for prior year taxes (€ 304 thousand) attributable to the favourable outcome of tax disputes relating to previous years for which accruals had been made to the provision for tax and duties against the risk of an unfavourable outcome in these disputes.
Consequently the Company recognised a loss of € 5,484 thousand.
It should be noted that during the financial years 2007, 2008, 2009 and 2010 Biesse S.p.A. parti-cipated, via the CO-ENV consortium, in the project known as “CO-ENV: Environment and innovative instruments for the collective planning of the development of programmable manufacturing products” referring to the concession decree no. 01396 of 28.10.2008, project no. D05/0572/00/X08, L.46/82 – FIT – Thematic Section Corporate Strategic Processes, incurring the following pre-competitive industrial research and development costs:
2007 € 366,566.782008 € 1,009,428.582009 € 1,117,718.812010 € 335,935.54
For a total of € 2,829,649.71.
The project commenced on 03/05/2007 and was completed on 02/05/2010.
annual report 2010
Intangible assets increased partly as a result of investment in new product development projects and the implementation of the new Oracle ERP system..Net Working Capital – compared to the figure at end-December 2009 – declined by € 20.8 million; due principally to an increase in trade payables that more than offset the increase in inventories (particularly raw materials) and trade receivables related to the increase in sales volumes.
SUMMARY BALANCE SHEET
SUMMARY BALANCE SHEET FOR THE YEAR ENDED 31 DECEMBER 2010
€ ‘000 31 December2010
31 December2009
Intangible assets 28,648 25,878
Property, plant and equipment 36,103 38,666
Finacial assets 35,195 34,117
Non current assets 99,946 98,661
Inventories 40,778 35,837
Trade receivables 55,131 46,816
Trade receivables due from Group companies 34,964 24,622
Trade payables (77,794) (43,414)
Trade payables to Group companies (17,758) (7,694)
Net Operating Working Capital 35,322 56,166
Post-employment benefits (9,802) (10,540)
Provision for risk and charges (5,774) (7,582)
Other net receivables/payables (4,484) (8,521)
Net deferred tax assets/liabilities 10,884 10,450
Other net assets/liabilities (9,177) (16,194)
NET INVESTED CAPITAL 126,091 138,633
Share capital 27,393 27,393
Result of the previous year and other reserves 90,942 112,722
Loss for the year (5,484) (21,752)
Equity 112,851 118,363
Due to bank and other finacial institutions 38,385 58,330
Financial payables due to Group companies 5,974 -
Other financial assets (22,407) (28,050)
Cash and cash equivalents (8,711) (10,011)
Net financial indebtedness 13,241 20,269
TOTAL SOURCE OF FUNDING 126,091 138,633

64 65
NET FINANCIAL INDEBTEDNESS
At end-December 2010 the Company had net indebtedness of € 13.2 million, significantly down by € 7 million compared to the amount reported at end-December 2009.
In the absence of significant extraordinary factors, this result is attributable to the improvement in net working capital plus the return to profit at the level of EBITDA.
OTHER INFORMATION
In accordance with the resolution approved by the Biesse S.p.A. shareholders’ meeting of 12 November 2009, the company has renewed its treasury share buyback programme, which at 31 December 2010 amounted to € 4,675,804.36, equal to 486,359 shares (1.8% of the share capital) at an average purcha-se price of € 9.61. No further movement has occurred at the date of the present report.Finally it must be noted that the parent, Biesse S.p.A. does not own shares or shareholdings in parents, nor did it own or trade any shares or shareholdings in parents during 2010. There is therefore nothing to disclose in relation to Art. 2428 paragraph 2 sections 3 and 4 of the Italian Civil Code.
PROPOSAL TO THE ORDINARY MEETING OF SHAREHOLDERS
Dear shareholders,
You are invited to approve the financial statements as at and for the year ended 31 December 2010, with the present Directors’ Report on Operations as they stand. The Board of Directors, taking into account the financial position and results for the financial year 2010 proposes not to distribute a dividend to shareholders and seeks approval to cover the loss for the year of € 5,484,382.68 through the utilisation of part of the Extraordinary Reserve. We also propose to supplement the reserve for unrealised exchange rate gains by € 1,673,491.65 through utilisation of the Extraordinary Reserve.
Pesaro, 16/03/2011 Chairman of the Board of Directors Roberto Selci
€ ‘000 31 December 2010 31 December 2009
Current financial assets due from related parties 22,407 28,050
Cash and cash equivalents 8,711 10,011
ST finance lease liabilities (1,881) (1,940)
Bank and other ST financial debt (30,498) (42,323)
Other current financial liabilities due to related parties (5,974) -
Net Short Term Financial Indebtedness (7,234) (6,202)
M/L term finance lease liabilities (180) (2,061)
M/L term bank debt (5,826) (12,007)
Net M/L Term Financial Indebtedness (6,006) (14,068)
Total Net Financial Indebtedness (13,241) (20,269)
annual report 2010
annual report 2010
directors’ report

67
financial statements as at and for the year ended 31 december 2010

68 69financial statements
annual report 2010
3 In accordance with Consob Resolution no. 15519 of 27 July 2006, the effects of related party transactions and non-recurring transactions on the Income Statement are shown in the relevant schedule in Appendix 1 and, respectively, in notes 43 and 14.
STATEMENT OF COMPREHENSIVE INCOME FOR THE YEAR ENDING 31/12/2010Note 31 December 2010 31 December 2009
Loss for the year (5,741) (27,192)
- Other comprehensive income components
Foreign currency translation differences for foreign operations �4 1,898 708
Gain/(Losses) on cash flow hedges �4 (171) (128)
Income tax relating to components of other comprehensive income 1� 47 35
Total Other comprehensive income, net of tax 1,774 615
Total comprehensive loss for the year (3,967) (26,577)
Total comprehensive income attributable to:
Shareholder of the parent (3,647) (26,092)
Non-controlling interests (320) (484)
Total comprehensive loss for the year (3,967) (26,577)
STATEMENT OF FINANCIAL POSITION AS AT 31/12/2010(3)
€ ‘000 Note 31 December2010
31 December2009
ASSETS
Non current assets
Property, plant and machinery 16 48,266 50,061
Equipment and other tangible fixed assets 16 7,569 7,370
Goodwill 17 17,921 17,438
Other intangible assets 18 26,360 23,635
Deferred tax assets 33 19,295 18,233
Other financial assets and non-current receivables 19 738 616
120,149 117,353
Current assets
Inventories �0 81,326 63,242
Trade receivables due from third parties �1 90,365 77,307
Trade receivables due from related parties 43 �5 0
Other current assets �� 14,316 10,073
Other current assets due from related parties 43 574 574
Derivatives 37 1 0
Cash and cash equivalents �3 25,812 31,148
212,419 182,345
TOTAL ASSETS 332,568 299,698
annual report 2010
2 In accordance with Consob Resolution no. 15519 of 27 July 2006, the effects of related party transactions and non-recurring transactions on the Income Statement are shown in the relevant schedule in Appendix 1 and, respectively, in notes 43 and 14.
INCOME STATEMENT FOR THE YEAR ENDING 31/12/2010 (2)
€ ‘000 Note 31 December 2010 31 December 2009
Revenue 5 327,522 268,006
Other operating revenue 5 4,316 4,699
Change in the inventories of finished and semi-finished goods and work in progress 5,897 (23,414)
Purchase of raw materials and consumables 7 (143,639) (105,839)
Personnel expense 8 (107,683) (92,498)
Other operating expense 9 (70,714) (59,391)
Depreciation and amortisation (12,454) (13,318)
Provisions (3,072) (10,182)
Impairment losses (68) (1,043)
Operating profit (loss) 106 (32,979)
Finance income 10 316 �76
Finance expense 11 (2,473) (3,481)
Exchange rate differences gains/(losses) 1� (478) (131)
Pre-tax loss (2,529) (36,314)
Income Taxes 13 (3,211) 9,122
Loss for the year (5,741) (27,192)
Attributable to:
Shareholders of the parent (5,392) (26,696)
Non controlling interests (349) (496)
(5,741) (27,192)
Earnings per share
Basic (€/cents) 15 (20.04) (99.52)
Diluted (€/cents) 15 (20.04) (99.52)

70 71
annual report 2010
STATEMENT OF CASH FLOWS FOR THE YEAR ENDING 31 DECEMBER 2010€ ‘000 Note 31/12/2010 31/12/2009
OPERATING ACTIVITIES
Loss for the year (5,741) (27,192)
+ Depreciation and amortisation:
of property, palnt and equipment 6,531 7,476
of intangible assets 5,922 5,888
+ Provisions:
Increase/decrease in provisions for post-employment benefits 581 739
Increase/decrease in allowance for impairment (626) 3,789
Increase/decrease allowance for inventory write-down (323) 3,251
Increase/decrease in provisions for risk and charges 2,288 5,677
Other non-financial changes in provisions (2,100) (2,098)
Gains/losses from sales of property, plant and equipment (22) (4)
Income/expense on intangible assets (14) -
Impairment losses on other assets 65 5�
Impairment losses on current assets - 991
Income from investing activity (316) (276)
Unrealised exchange rate gains/losses (1,855) (664)
Income Taxes 3,211 (9,122)
Financial expense 2,473 3,481
SUBTOTAL OPERATING ACTIVITIES 10,075 (8,012)
Post-employment benefits paid (1,516) (1,795)
Risk provisions utilised (3,530) (152)
Change in trade receivables (19,718) 22,682
Change in inventories (14,457) 36,507
Change in trade payables 48,983 (38,874)
Change in other payables 8,167 (3,980)
Income tax paid (759) (304)
Interest paid (2,270) (3,084)
CASH FLOW FROM OPERATING ACTIVITIES 24,975 2,988
INVESTING ACTIVITIES
Acquisition of property plant and equipment (3,905) (3,598)
Proceeds from sale of property plant and equipment �10 169
Acquisition of intangible assets (8,221) (6,688)
Proceeds from sale of intangible assets 6� 3
Acquisitions/increases in other financial assets (94) (404)
Income received from financial assets held for trading 18� 38
Interest received 460 �38
CASH FLOW USED IN INVESTING ACTIVITY (11,306) (10,242)
FINANCIAL ACTIVITIES
Loans repaid �7 (36,188) 47,665
Finance lease payments �9 (2,358) (2,514)
Change in bank overdrafts �7 19,074 (30,319)
Change in current derivative instrument financial assets/liabilities (678) 847
Capital injections - minority interests - �00
CASH FLOW FROM/(USED IN) FINANCIAL ACTIVITIES (20,150) 15,879
NET INCREASE/(DECREASE) IN CASH AND CASH EQUIVALENTS (6,481) 8,625
OPENING CASH AND CASH EQUIVALENTS 31,148 22,173
Effect of exchange rate fluctuations on cash held 1,145 350
CLOSING CASH AND CASH EQUIVALENTS
Cash and cash equivalents 25,812 31,148
annual report 2010
€ ‘000 Note 31 December 2010 31 December 2009
EQUITY AND LIABILITIES
SHARE CAPITAL AND RESERVES
Share capital �4 27,393 27,393
(Treausury shares) �4 (4,676) (4,676)
Equity reserves �5 36,202 36,202
Hedging and translation reserve �6 (535) (2,280)
Other reserves �7 69,703 96,391
Loss for the year (5,392) (26,696)
Equity attributable to the shareholders of the parent 122,695 126,334
Non-controlling interest �7 ��0 517
TOTAL EQUITY 122,914 126,850
NON-CURRENT LIABILITIES
Post-employment benefits 3� 10,855 11,857
Deferred tax liabilities 33 3,086 2,429
Medium and long-term bank loans and borrowings �9 5,826 13,349
Finance lease liabilities 31 2,998 5,225
Provisions for risks and charges 34 695 905
Derivatives 37 157 0
23,616 33,765
CURRENT LIABILITIES
Trade payables 35 110,748 60,866
Trade payables due to related parties 43 386 111
Other current liabilities 36 28,518 21,919
Other current liabilities due to related parties 43 0 7
Tax payables 1,933 941
Finance lease liabilities 31 2,217 2,290
Bank overdrafts and loans �9 33,535 42,988
Provisions for risks and charges 34 7,853 9,162
Derivatives 37 848 799
186,038 139,083
LIABILITIES 209,654 172,848
TOTAL EQUITY AND LIABILITIES 332,568 299,698
financial statements
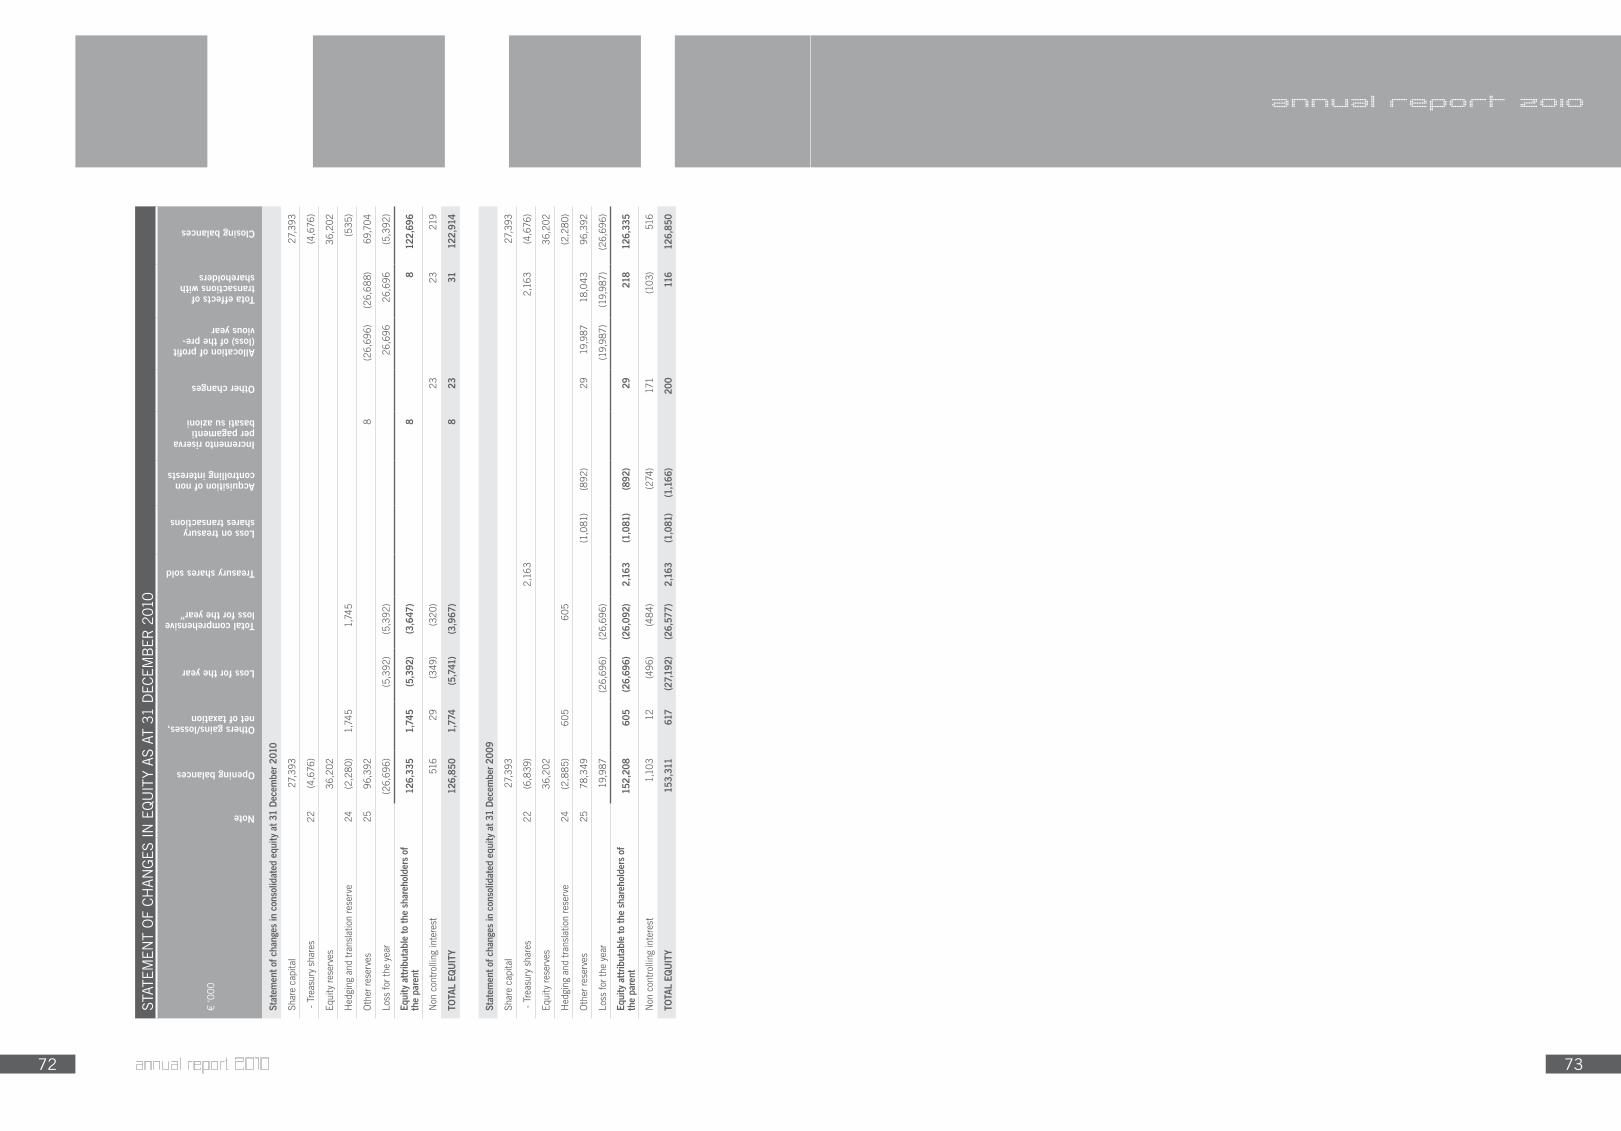
7� 73
annual report 2010
annual report 2010
STAT
EMEN
T O
F CH
ANG
ES IN
EQ
UIT
Y AS A
T 31
DEC
EMB
ER 2
010
€ ‘0
00
Note
Opening balances
Others gains/losses, net of taxation
Loss for the year
Total comprehensive loss for the year”
Treasury shares sold
Loss on treasury shares transactions
Acquisition of non controlling interests
Incremento riserva per pagamenti basati su azioni
Other changes
Allocation of profit (loss) of the pre-vious year
Tota effects of transactions with shareholders
Closing balances
Stat
emen
t of c
hang
es in
con
solid
ated
equ
ity a
t 31
Dec
embe
r 201
0
Shar
e ca
pita
l27
,393
27,3
93
- Tr
easu
ry s
hare
s��
(4,6
76)
(4,6
76)
Equi
ty re
serv
es36
,202
36,2
02
Hed
ging
and
tran
slat
ion
rese
rve
�4(2
,280
)1,
745
1,74
5(5
35)
Oth
er re
serv
es�5
96,3
928
(26,
696)
(26,
688)
69,7
04
Loss
for t
he y
ear
(26,
696)
(5,3
92)
(5,3
92)
26,6
9626
,696
(5,3
92)
Equi
ty a
ttrib
utab
le to
the
shar
ehol
ders
of
the
pare
nt12
6,33
51,
745
(5,3
92)
(3,6
47)
88
122,
696
Non
con
trol
ling
inte
rest
516
�9(3
49)
(320
)�3
�3�1
9
TOTA
L EQ
UIT
Y12
6,85
01,
774
(5,7
41)
(3,9
67)
823
3112
2,91
4
Stat
emen
t of c
hang
es in
con
solid
ated
equ
ity a
t 31
Dec
embe
r 200
9
Shar
e ca
pita
l27
,393
27,3
93
- Tr
easu
ry s
hare
s��
(6,8
39)
2,16
32,
163
(4,6
76)
Equi
ty re
serv
es36
,202
36,2
02
Hed
ging
and
tran
slat
ion
rese
rve
�4(2
,885
)60
560
5(2
,280
)
Oth
er re
serv
es�5
78,3
49(1
,081
)(8
92)
�919
,987
18,0
4396
,392
Loss
for t
he y
ear
19,9
87(2
6,69
6)(2
6,69
6)(1
9,98
7)(1
9,98
7)(2
6,69
6)
Equi
ty a
ttrib
utab
le to
the
shar
ehol
ders
of
the
pare
nt15
2,20
860
5(2
6,69
6)(2
6,09
2)2,
163
(1,0
81)
(892
)29
21
812
6,33
5
Non
con
trol
ling
inte
rest
1,10
31�
(496
)(4
84)
(274
)17
1(1
03)
516
TOTA
L EQ
UIT
Y15
3,31
161
7(2
7,19
2)(2
6,57
7)2,
163
(1,0
81)
(1,1
66)
20
0
116
126,
850

75
notes to the consolidated financial statements

76 77notes
annual report 2010
Name and registered office Currency Share Capital
Directly controlled
Indirectly controlled
Ownership vehicle
Gruppo Biesse
Foreign subsidiaries:
Biesse Iberica Woodworking Machinery s.l.Cl. Pedrosa C., 9 - Barcelona – Spain
eUr 1,233,290 100% 100%
Biesse Group Australia Pty Ltd.3 Widemere Road Wetherill Park – Australia AUD 5,046,547 100% 100%
Biesse Group New Zealand Ltd.Unit B, 13 Vogler Drive Manukau Auckland – New Zealand
NZD 334,262 100% 100%
Hsd Usa Inc.3764 SW 30th Avenue – Hollywood, Florida – USA
USD 10,000 100% Hsd S.p.A. 100%
HSD Dutschland GmbHBrükenstrasse,2 – Gingen – Deutschland eUr 25,000 100% Hsd S.p.A. 100%
Biesse Manufacturing Co. Pvt. Ltd.Jakkasandra Village, Sondekoppa rd. Nelamanga Taluk Bangalore –India
Inr 100,814,500 100% 100%
WMP- Woodworking Machinery Portugal, Unipessoal LdaSintra Business Park, 1, São Pedro de Penaferrim, Sintra - Portugal
eUr 5,000 100%BiesseIberica
W.M.s.l.100%
Biesse Trading (Shanghai) Co. LtdBuilding 10 No.205 Dong Ye Road Dong Jing Industrial Zone, Song Jiang District Shanghai 201619, China
RMB 1,000,000 100%Biesse
AsiaPte. Ltd.
100%
HSD Mechatronic (Shanghai) Co. LtdD2, first floor, 207 Taiguroad, Waigaoqiao free trade zone, Shanghai, China
RMB 1,367,360 100% Hsd S.p.A. 100%
Biesse Schweiz GmbHGrabenhofstrasse, 1 Kriens Schweiz CHF 100,000 100%
Biesse G. Deutschland
GmbH100%
Biesse Indonesia Pt.Jl. Kh.Mas Mansyur 121Jakarta, Indonesia
IDR 1,250,000,000 100% Biesse Asia Pte. Ltd. 100%
The consolidation area has changed compared to the last approved financial statements following several company reorganation transactions (which were implemented through the merger by incorporation of some companies belonging to the Biesse Group) involving Biesse S.p.A., Biesse America Inc. and Biesse Canada Inc., being the incorporating companies; the companies Digipac S.r.l., Bifin Ltd. and Sel Realty Ltd. were the companies respectively subject to merger by incorporation in the companies listed above.
In the first case, the economic reasons underlying the merger relate to the gradual company streamlining and organisational integration process aimed at achieving a more efficient utilisation of personnel and technical resources involved in the production process with a consequent improvement in the absorption of overheads.
The mergers involving Bifin Ltd. and Sel Realty Ltd. - exclusively dedicated to real estate management (their sole assets being the buildings housing the headquarters of the two North American subsidiaries) – were im-plemented with the sole purpose of simplifying the administration of the company.
In addition to the aforementioned transactions, it should be noted that three new companies were set up at the year end: Biesse Tecno System S.r.l., Viet Italia S.r.l. (by Biesse S.p.A.) and Biesse Indonesia Pt (by Biesse Asia Pte Ltd.).The first company is a joint-venture, established in partnership with one of the Group’s Italian suppliers, which is involved in design solutions, consultancy services regarding integrated production lines and turnkey solu-tions both for large companies operating in the furniture industry and companies in other industrial sectors.
Viet Italia S.r.l. is a new company set up to rent and subsequently acquire (an irrevocable purchase offer has been made to the liquidator) the business activities of the eponymous Pesaro-based brand - Viet – market leader in the wood calibrating and sanding sector, which were part of a company that was put into liquidation
1. general
Biesse S.p.A. is an Italian company, with its registered office in Pesaro. The company is listed on the STAR segment of the Milan stock exchange.
The 2010 consolidated financial statement incorporate the financial statements of Biesse S.p.A. and sub-sidiaries which it controls directly or indirectly (hereinafter defined as the “Group”) and the amount of its equity investment, in proportion to the percentage held, in associates.
The consolidated financial statements as at and for the year ended 31 December 2010 were approved du-ring the meeting of the Board of Directors held today (16 March 2011).
The consolidated financial statements of the Group are prepared in Euro and are presented in thousands of Euro except where otherwise indicated.
annual report 2010
Name and registered office Currency Share Capital
Directly controlled
Indirectly controlled
Ownership vehicle
Biesse Group
Parent
Biesse S.p.A.Via della Meccanica, 16 Loc. Chiusa di Ginestreto (PU)
eUr 27,393,042
Italian subsidiaries:
HSD S.p.A.Via della Meccanica, 16Loc. Chiusa di Ginestreto (PU)
eUr 1,141,490 100% 100%
Bre.Ma. Brenna Macchine S.r.l.Via Manzoni, sncAlzate Brianza (CO)
eUr 70,000 60% 60%
Biesse Tecno System S.r.l.Via della Meccanica, 16Loc. Chiusa di Ginestreto (PU)
eUr 25,000 50% 50%
Viet Italia S.r.l.Via della Meccanica, 16Loc. Chiusa di Ginestreto (PU)
eUr 10,000 100% 100%
Foreign subsidiaries:
Biesse America Inc.4110 Meadow Oak DriveCharlotte NC 28208 – USA
USD 11,500,000 100% 100%
Biesse Canada Inc.18005 Rue Lapointe – Mirabel (Quebec) – Canada
CAD 180,000 100% 100%
Biesse Asia Pte. LtdZagro Global Hub 5 WoodlandsTerr. – Singapore
SGD 2,655,000 100% 100%
Biesse Group UK Ltd.Lamport Drive – Daventry Northampt. – UK GBP 655,019 100% 100%
Biesse France Sarl4, Chemin de Moninsable – Brignais – France eUr 144,000 100% 100%
Biesse Group Deutschland GmbHGewerberstrasse, 6 – Elchingen (Ulm) – Deutschland
eUr 1,432,600 100% 100%
Biesservice Scandinavia ABMaskinvagen 1 Lindas – Sweden SeK 200,000 60% 60%
LIST OF COMPANIES CONSOLIDATED ON A LINE-BY-LINE BASIS

78 79notes
annual report 2010
Currency31 December 2010 31 December 2009
Average Closing Average Closing
US Dollar / Euro 1.3257 1.3362 1.3948 1.4406
Singapore Dollar / Euro 1.8055 1.7136 2.0241 2.0194
Canadian Dollar / Euro 1.3651 1.3322 1.5850 1.5128
Sterling / Euro 0.8578 0.8608 0.8909 0.8881
Swedish Krone / Euro 9.5373 8.9655 10.6191 10.2520
Australian Dollar / Euro 1.4423 1.3136 1.7727 1.6008
New Zealand Dollar / Euro 1.8377 1.7200 2.2121 1.9803
Indian Rupee / Euro 60,5878 59.7580 67.3611 67.0400
Chinese Renmimbi Yuan / Euro 8.9712 8.8220 9.5277 9.8350
Swiss Franc / Euro 1.3803 1.2504 1.5100 1.4836
Indonesian Rupiah / Euro - 12,002.1 - -
Receivables and payables, income and expense and profits and losses arising from transactions between companies included in the consolidation have been eliminated. In addition, all transactions between the companies of the Biesse Group and an independent financial services company which operates as an intermediary for most of the commercial transactions between the parent and several of the consolidated companies have been eliminated.As an exception to this general rule, given that the effects are not material and given the difficulties of re-constructing the effects, profits from the sale of inventories (in particular mechanical and electromecha-nical components) by HSD S.p.A. and Biesse Manufacturing Co. Pvt. Ltd. to other manufacturing compa-nies in the Biesse Group were not eliminated, given that these related to semi-finished products included in work in progress.Gains and losses on infragroup sales of assets are eliminated where they are deemed to be material.
The amount of share capital and reserves of subsidiaries corresponding to minority interests is included in “Non-controlling interests” included in equity; the proportion of profit(loss) for the year corresponding to third party equity investments is shown separately in the entry “Net profit(loss) for the year attributable to non-controlling shareholders”.
For the purposes of presentation of the consolidated financial statements, the assets and liabilities of foreign subsidiaries, the operating currencies of which are different to the Euro, are translated at the exchange rate prevailing at the reporting date. Income and expense are translated at the average exchan-ge rate for the year. The resulting exchange rate gains or losses are reported in the entry “Hedging and Traslation Reserve” included in equity. This reserve is recognised in the Income Statement as income or expense in the period in which the relevant subsidiary is sold.
The average and year - end exchange rates are as follows:
Equity investments in Associates Companies
An associated is one in which the Group is in a position to exercise a significant influence, but not control independently or jointly, through participation in the financial and operational decisions of the associated.The results and the assets and liabilities of associates are reported in the consolidated financial state-ments using the equity method.
Equity investments in other companies
Equity investments in other companies constituting available-for-sale financial assets are stated at fair va-lue, if it can be determined, and profits and losses deriving from changes in fair value are recognised directly in Other Comprehensive Income until they are sold or until there is an impairment loss; at that point, the total Other Comprehensive Income previously reported in the balance sheet are taken to profit or loss.Minor Equity investments in other companies, where fair value is not available, are recognised at cost adjusted for any impairment losses.
in November 2010 following a severe financial crisis. The synergy opportunities arising from the inclusion of an important brand such as Viet – renowned for the innovation and quality of its products – are numerous and unquestionably useful in the expansion of Biesse’s presence in a strategically important market segment.
Finally Biesse Indonesia Pt. Is involved in marketing and providing after-sales services for the Group’s machi-nery in Indonesia as well as the sale of Diamut branded machine tools and grinders.
Given that these three new companies were set up close to the end of the financial reporting period ended 31/12/2010, they have made no contribution to the income reported for the year just ended.
As indicated in note 4 below, the contract to acquire Bre.Ma. Brenna Macchine S.r.l. incorporates a put option in favour of the seller the remaining 40% of the share capital. The Group has evaluated the effect of the even-tual exercise of this option (please refer to note no.38 for further details).
2. declaration of compliance with international financial reporting standards and consolidation criteria
Declaration of compliance with international financial reporting standards and general principles
The consolidated financial statements have been prepared in accordance with the International Financial Reporting Standards (IFRS), issued by the International Accounting Standard Board (“IASB”) and en-dosed by the European Union, as well as the provisions issued in application of article 9 of Decree Law 38/2005 and the CONSOB regulations and recommendations regarding financial statements. The financial statements have been prepared on a historic cost basis with the exception of derivative financial instruments, financial assets held for future sale and financial instruments classified as available for sale, whi-ch are measured at fair value; the financial statements have also been prepared on a going - concern basis.This information was prepared in accordance with the provisions of CONSOB (Commissione Nazionale per le Società e la Borsa), with particular reference to resolutions no. 15519 and 15520 of 27/07/2006 and to communication no. 6064293 of 28/07/2006.
Consolidation criteria
The consolidated financial statements as at and for the year ended 31 December 2010 include the financial statements of the parent company Biesse and the Italian and foreign companies which it controls directly and indirectly. When a company is in a position to determine the financial and operational policies of an entity in such a way as to obtain a benefit from its activities it is defined as having control of that entity.
Where material differences occur, these financial statements are reclassified and adjusted as necessary to conform to the accounting principles and measurement criteria adopted by the parent. All Group com-panies have a December year-end.
In the preparation of the financial statements, all assets and liabilities, expense and income of companies included in the consolidation are entirely eliminated.
The carrying amount of equity investments in companies are eliminated to offset the corresponding share of equity of equity investments. The present value of each equity investments at the date of acquisition is attributed to the relevant individual assets or liabilities. Any residual difference, if positive, is included in non-current assets, such as goodwill. If negative the difference is taken to the Income Statement. The results of companies acquired or divested during the period are included in the Income Statement from the effective date of acquisition to the date of disposal.The interests of non-controlling (minority) shareholders in the acquired entity are initially measured in proportion to the present value of the assets, liabilities and contingent liabilities recognised.
annual report 2010

80 81
3. measurement criteriaThe most significant measurement criteria used in preparing the financial statements as at and for the year ended 31 December 2010 are illustrated below. The accounting principles adopted for the preparation of the 2010 consolidated financial statements have also been applied consistently to all periods presented for comparative purposes.
Revenue recognition
Sales of goods are recognised when goods are dispatched and the company has transferred to the buyer all major risks and benefits associated with ownership of the goods. Generally revenue from the sale of goods is recognized at the time of delivery of goods to the forwarding agent who, under the terms of the relevant contracts, represents the point of delivery of the aforementioned risks and benefits. Revenue is not reported when there is no certainty of recovering the related consideration. Revenue is stated net of discounts, reba-tes, premiums, bonuses, returns and promotional expenses which are substantially related to commercial discounts and do not include sales of raw materials and waste materials. Revenue arising from the provision of services is recognized in the income statement on the basis of the stage of completion at the reporting date, determined on the basis of work carried out or, alternatively, in relation to the percentage of completion of the total service provided.
Interest income is reported on an accruals basis, according to the amount subject to financing and the ef-fective rate of interest, which represents the rate used to discount estimated future cash inflows during the expected life of the financial asset to calculate.a carrying amount for the asset.
Dividend income is recorded when the right of shareholders to receive payment is recorded.
Construction contracts
When the result of a construction contract can be reliably estimated, the revenue and expense relating to the relevant contract are reported respectively as revenue and expense in relation to the proportion of work completed at the reporting date. These are calculated on the basis of the ratio between costs incurred for work carried out up to the reporting date and the total estimated costs of the contract, except where this is not considered to be representative of the state of progress of the contract.
Changes to the contract, price revisions and incentives are included to the extent that they have been agreed with the customer.
When the result of a contract cannot be reliably estimated, the revenue relating to the contract is reported only to the extent that costs incurred in the contract are likely to be recovered. Contract costs are reported as expense in the period in which they are incurred.
When it is probable that the total costs of a contract may exceed the revenues from the contract, the ex-pected loss is immediately reported as an expense.
Foreign currency transactions
In preparing the financial statements of individual entities, transactions in currencies other than the Euro are initially recorded at exchange rates prevailing at the time of the transaction. At the reporting date the monetary assets and liabilities denominated in these currencies are re-entered at the exchange rate prevai-ling at the reporting date. Non-monetary assets expressed at fair value in foreign currency are translated at exchange rates prevailing at the time at which fair value was determined, while non-monetary foreign currency assets and liabilities measured at historic cost are translated using the exchange rate prevailing at the date of the transaction, except in the case of exchange rate losses.
Exchange rate gains and losses arising from monetary and non-monetary adjustments and from re-exposure to current exchange rates at the end of the financial year are taken to profit or loss for the year, with the exception of the exchange currency rate gains or losses on non-monetary assets expressed at fair value. In this case changes in fair value are recognised directly to net equity as is the exchange rate component.
notes
annual report 2010
annual report 2010
Format of Financial Statements
In accordance with IAS 1 the management of the Group has made the following choices with regard to the format of the financial statements. Statement of financial position includes the separation of current assets/liabilities from non-current assets/liabilities. An asset/liability is considered to be current when it satisfies any of the following criteria:
- it is expected to be realised/liquidated or sold or utilised in the Group’s normal operating cycle;
- it is held primarily for trading;
- it is expected to be realized/liquidated within 12 months of the reporting date;
- In the absence of all three conditions, the assets/liabilities are classified as non-current.
The Income Statement distinguishes costs by nature, while highlighting interim results relative to operating income and pre-tax income. Operating profit is calculated as the difference between Net Revenues and Operating Expense(including non-monetary costs relating to depreciation and amortization and impairment losses on current and non-current assets, net of any reversal of impairment losses) and including gains and losses on the sale of non-current assets. In order to permit measurability of current trends in ongoing operations, details of the costs and revenue deriving from activities which by their nature and magnitude are considered non-recurring are given in note 14.
The Statement of Comprehensive Income incorporates the components that make up the result for the period and the expenses and income reported directly in Equity for transactions other than those carried out with shareholders.
The statement of changes in equity illustrates the changes in items which make up equity in relation to:
- the allocation of parent company and subsidiaries’ profit for the period to non controlling interest;
- amounts relating to transactions with shareholders (purchase and sale of treasury shares);
- each item of profit and loss net of potential tax effects which- as required by IFRS- are alternatively reco-gnised directly in equity (gains or losses from trading of treasury shares, actuarial gains or losses arising from the measurement of defined benefit plans) or have a corresponding entry in an equity reserve (share payments based for stock option plans);
- changes in fair value reserves relating to derivative instruments for the hedging of future cash flows net of any potential tax effect.
The statement of cash flows is prepared according to the indirect method, by which profit or loss adjusted for non-monetary entries as well as for any deferred amount or provision from previous or future cash flows or operating payments, revenue or expense relating to cash flows deriving from investing or financing acti-vities. Cash and cash equivalents included in the Statement of Cash Flow include the balance of that item at the reporting. Cash flows in foreign currency have been translated at the average exchange rate for the year..Income and expense relating to interest, dividends received and income taxes are included in cash flows from operations activities.
All the schedules conform to the minimum content requirements of International Financial Reporting Stan-dards and by the applicable rules provided by national legislation and Consob (the regulatory authority for the Italian securities market). In particular it should be noted that – in order to comply with Consob Reso-lution no.15519 of 27 July 2006 “Provisions regarding the format of financial statements” - the relative mandatory statements have been reviewed and modified where necessary in order to highlight any material related party transactions or positions.
The formats adopted are considered to be appropriate to a fair representation of the Group’s financial po-sition result of operation and cash flows; in particular it is believed that the classification of the Income Statement by nature provides reliable and relevant information for the correct representation of the groups performance.

8� 83
as controlling entity in accordance with article 117 and subsequent articles of Presidential Decree DPR 917/86 together with its subsidiaries Hsd SpA and Bre.ma. Brenna Macchine S.r.l. As a result of adopting this option, Biesse SpA will determine the Group’s IRES corporation tax in accor-dance with the aforementioned law, setting against its own result the positive and negative taxable items of the companies involved. The financial relations,, the responsibilities and reciprocal obligations between the aforementioned companies are defined in the “Regulation” of governing partecipation in the consolidated tax scheme.
The tax balance for the Group is reported in the entry “Tax payables” or “Tax receivables” in the financial statements of the company, net of paid advances. In the financial statements of subsidiaries the specific payable for taxes transferred to the parent are allocated to the account “Payables to related parties”. Recei-vable deriving from the transfer of IRES losses are allocated to the “Receivables due from related parties”.
Earnings per shareBasic earnings per share are calculated by dividing the profit or loss attributable to shareholders of the parent by the weighted average number of ordinary shares in issue during the period. Diluted earnings per share are calculated by dividing the profit or loss attributable to the shareholders of the parent company by the average weighted number of shares in issue taking into account the effect of all potential ordinary shares with a dilutive affect.
Business combinationsBusiness combinations are reported in accordance with the acquisition method. This method requires that the consideration transferred in a business combination be measured at fair value, calculated as the sum of the fair values of the assets transferred and the liabilities taken on by the Group at the date of acquisition and of the equity instruments issued in exchange for control of the acquired business. Costs related to tran-saction are recognised in the income statement when they are incurred.
At the acquisition date the identifiable assets acquired and the liabilities taken on are reported at fair value at the acquisition date; the following exceptions being measured in accordance with the relevant principles that relate specifically to them:
- Deferred tax assets and liabilities;
- Employee benefit assets and liabilities;
- Debt or equity instruments relating to payments based on the shares of the business acquired in substi-tution of contracts of the acquired business;
- Assets held for sale and Discontinued Operations.
In accordance with IFRS 3 (Business combinations), goodwill is recognised in the consolidated financial statement at the date of acquisition of control of a business and is determined as the excess of (a) compared to (b), in the following way:
a) the sum of:
- consideration paid (measured in accordance with IFRS 3 which is generally determined on the basis of the fair value at the acquisition date);
- the amount of any non-controlling interest in the acquired business measured in proportion to the non-controlling equity investment in the identifiable net assets of the business acquired expressed at their relative fair value;
- in the case of a business combination carried out in stages, the fair value at the date of acquisition of control of the equity investment already owned in the business acquired;
b) the fair value of the identifiable assets net of the identifiable liabilities take on, measured at the date of acquisition of control.
notes
annual report 2010
In order to cover its risk, the Group has taken out some forward futures and option contracts (see below for the Group’s accounting policies relating to these derivative instruments).
Finance and Operating Lease contractsLease contracts are classified as Finance leases whenever the terms of the contract transfer substantially all risks and benefits of the ownershio to the lessee. All other leases are considered operating leases.Assets that are subject to Finance Leases are reported as property, plan and equipment of the Group with a corresponding financial liability of equal value. The liability is progressively reduced on the basis of the repayment plan of the capital element of the contractual leasing fees, while the carrying amount of the asset is depreciated on the basis of the useful life of the asset.Lease expenses relating to operating leases are taken to profit or loss on a straight-line basis over the length of the contract.
Government grantsGovernment grants are reported in the financial statements when there is reasonable certainty that all of the conditions necessary for the receipt of the grant will be met and that the funds themselves will be re-ceived. Grants are recognised in the income statement over the period in which the costs relating to them are reported. The accounting treatment of benefits deriving from public sector financing obtained at a subsidised rate of interest are treated in the same way as government grants. This benefit is determined at the beginning of the financing period as a difference between the initial carrying amount of the financing (fair value plus any co-sts directly related to obtaining the financing) and the amount received and it is subsequently recognised in the income statement in accordance with the regulations relating to the recognition of government grants.
Costs and chargesCosts relating to the purchase of goods and services are recognised when their amount can be reliably de-termined. Costs for the purchase of goods are recognised at the time of delivery, which on the basis of the contracts relating to them, is identified as being the point of transfer of all risks and benefits associated with them. Service costs are recognised by category at the time the same are received.
Income taxesTaxes are recognised in the income statement, with the exception of those taxes relating to operations directly affecting equity, in which case the related effect is also reported in equity. Income taxes include current taxes and deferred tax assets and liabilities. Current taxes are reported on the basis of the estimated amount that Biesse expects to have to pay applying to the taxable income of each company in the Group the applicable tax rate at the financial statement date in the country in which each company is located. Deferred tax assets and liabilities are stated in accordance with the liability method, in other words they are calculated on all time differences arising between the amount of assets and liabilities calculated for tax purposes and their related carrying amount in the consolidated financial statement. Deferred tax assets and liabilities are not recognised in goodwill and on assets and liabilities that do not affect taxable income. Taxes relating to dividend distribution are recognised at the same time as recognition of the liability relating to the payment of dividend. The recoverability of deferred tax assets is verified at the end of each accounting period and where the probability of recovering the tax is no longer probable, the relevant amount is recogni-zed in the income statement. The tax rates used in determining the recognition of deferred tax assets and liabilities, are those which are expected to be in force in the relevant country in the tax period in which the temporary differences will be realized or will expire. Deferred tax assets are included in the financial statement if the taxes are considered to be recoverable when considering the expected taxable result for the future periods. The carrying amount of deferred tax assets is reviewed at the close of the financial year and, where necessary, is reduced.Offset between deferred tax assets and liabilities is carried out for similar items and if there is a legal right to offset current tax assets and liabilities; otherwise payables and receivables relating to these items are recognized separately.
From the 2008 financial year the parent, Biesse SpA participates in the National Consolidated Tax scheme,
annual report 2010

84 85
Buildings 2% - 3%Plant and machinery 10% - 20%Equipment 12% - 25%Fixtures and fittings 12%Motor vehicles 25%
During the financial year the depreciation rate utilised for automated operating machinery (used in the Ita-lian plants) was reduced from 15.5% to 10%. This change reflects a better estimate regarding utilisation of the same, as established in the latest approved three year business plan; the transformation into a lean company involved a significant revision of the productive processes, and envisages full utilisation of the company’s assets, with regard to just in time principles. Please refer to note 4 below for further details on the reasons for and effects of the changes to these estimates.
This item also includes assets that are subject to finance leases, which are included amongst property, plan and equipment according to the previously described methodology.
Investment propertyInvestment property, represented by property that is owned for rental and/or for capital gain, is included at cost, including related expense,less accumulated depreciation and impairment losses. Investment proper-ties are depreciated on a straight - line basis over their useful life applying a rate of 3% for buildings and 10% for plant and equipment.
Goodwill and other intangible assetsIntangible assets with a finite duration are measured at cost net of accumulated amortisation and impair-ment losses.
GoodwillGoodwill is an intangible asset with an indefinite useful life that derives from business combinations accoun-ted for using the purchase method and reported as the positive difference between acquisition cost and the Group’s interest having recognised all other identifiable assets, liabilities and potential liabilities at their fair value, attributable to the Group and non-controlling interest (full fair value method) at the acquisition date.Goodwill is not subject to amortisation, but is subject to testing measurement, at least once a year, usually at the reporting date, to verify that there has been no impairment. Any impairment losses of value are im-mediately recognised in the Income Statement and are not subsequents reversed.The determination of the amount of goodwill is carried out by identifying the cash generating units (CGU) that benefit from the synergies of the acquisition. The cash flows are discounted at the cost of capital in relation to the specific risk of the said units. Impairment losses are recognised whenever the discounted cash flow calculation indicates that the recoverable amount of the CGU is less than its carrying amount and is promptly recognised under goodwill. In the event of a sale of a subsidiary or jointly-controlled entity, the residual amount of the goodwill allocated to it is included in the determination of the gain or loss arising on the sale.
Goodwill deriving from acquisitions made prior to the transition to IFRS is maintained at the amounts arising from the application of Italian GAAP at that date and is allocated to units generating cash financial flows in order that they may be subject to impairment tests.
Internally produced assets – Research and development expense
Research and development expenses is recognised in the Income Statement in the period in which it was incurred.
Internally produced intangible assets deriving from development of the Group’s products (machine tools for working wood, glass and marble) are included amongst assets, only if all the following conditions are met:
• the asset is identifiable (for example software or new processes)
• is probable that the asset created will generate future economic benefits; and
notes
annual report 2010
IFRS 3 also requires:
- separate recognition in the income statement of costs relating to the business combination transaction;
- in the case of a business combination carried out in stages, the acquiring company must re-calculate the amount of the equity investment previously held in the business acquired at fair value at the date of the acquisition of control and report the difference separately in the income statement.
Any payments of consideration subject to conditions stipulated by the business combination contract are measured at fair value at the date of acquisition and included in the consideration paid in the business combination in order to determine goodwill. Any subsequent changes in this fair value, that are identifiable as adjustments arising in the measurement period, are included retrospectively in goodwill. Changes in fair value categorised as adjustments arising in the measurement period are those deriving from additional information pertaining to facts and circumstances that existed at the date of acquisition, obtained during the measurement period (that must not exceed the period of one year from the date of the business com-bination).
In the case of business combinations carried out in stages, the equity investment previously owned by the Group in the business acquired is remeasured at the fair value at the date of acquisition of control and any gains or losses arising therefrom are recognised in the income statement. Any amounts deriving from the equity investment previously owned and reported in Other Gains or Losses are reclassified in the income statement as though the equity investment had been sold.
If the initial amount of a business combination are incomplete at the end of the financial year in which the business combination took place, the Group reports in its own consolidated financial statements the provi-sional values of those items which have not been fully recognised. These provisional values are adjusted in the measurement period to take into account new information obtained regarding the facts and circumstan-ces existing at the date of acquisition which, if noted, would have an effect on the amount of the assets and liabilities recognised at that date.
When the IFRS were initially introduced, the Group chose not to apply IFRS 3 (Business combinations) retroactively to the acquisitions of businesses that occurred prior to 1 January 2004; consequently the good-will generated on acquisitions prior to the IFRS transition date has been maintained at the original amount calculated in accordance with Italian GAAP, with prior verification of its recoverability.
Business combinations that occurred prior to 1 January 2010 have been reported in accordance with the previous version of IFRS 3.
Property, plant, equipment and items of property, plan and equipmentProperty, plant and equipment are included at purchase or production cost including related expense, with subsequent adjustment for accumulated depreciation orimpairment losses.
Ordinary maintenance costs are fully charged to the Income Statement. Incremental maintenance expen-ses are allocated against the asset to which they relate and depreciated according to the depreciation rate applicable to the asset.
Leasehold improvements are classified under property, plan and equipment, in accordance with the nature of the expense incurred. The depreciation period corresponds to the lower of residual useful life of the asset and the residual term of the lease.
Property, plan and equipment - with the exception of land which is not subject to depreciation - are depre-ciated on a straight-line basis over their estimated useful life beginning from the date in which the asset became available for use or was capable of providing the economic benefits with which it is associated, applying the following depreciation rates:
annual report 2010

86 87
This condition is respected only when it is highly probable that the asset will be sold, the asset is available for immediate sale in its existing condition and where management has made a commitment to sell, which should take place within twelve months of its date of classification in this caption.
Inventories
Inventories are measured at the lower of cost and net realisable amount. Cost includes direct materials and, where appropriate, direct labour costs, general production expense and other expense incurred to bring the inventories to their current location and condition. Cost is calculated on a weighted average cost basis. The net realisable amount represents the estimated sale price less the estimated costs of completion and the costs necessary to complete the sale. Obsolete inventory and slow moving inventory is written down in relation to its possibility of use or sale.
Financial Assets and Liabilities
Financial assets and liabilities include equity investments in other companies available for sale, receivables and non-current receivables and loans, trade receivables, as well as other receivables and other financial assets such as cash and cash equivalents. Financial liabilities include financial payables, trade payables, other payables and other financial liabilities. Derivative instruments are also included amongst financial assets and liabilities. Financial assets and liabilities are recognised when contractual rights and obligations pertaining to financial instruments arise. Their initial recognition takes into account directly attributable transaction costs and issue costs. Subsequent measurement depends on the type of financial instrument and is subject to the categories of assets and liabilities listed below:
Loans and receivables
Includes trade receivables, financial receivables and other receivables that qualify as financial assets. These are recognised at nominal value where this is substantially representative of their fair value otherwise they are measured at amortised cost, using the effective interest rate method. Impairment losses are recognised on loans and receivables in the Income Statement to take into account expected losses. The impairment losses are calculated on the basis of the difference between the carrying amount of receivables and the pre-sent value of estimated future cash flows. Impairment losses on trade receivables are generally recognised relevant allowance for impairment.
Financial assets held to maturity
The financial assets that the Group intends to hold to maturity (securities held maturity) are recognised at cost amortised by the effective interest rate method net of impairment losses. Whenever, in subsequent periods, the reasons for impairment are no longer valid, the impairment losses may be reversed.
Financial assets held for trading
Financial assets classified as held for trading are measured at fair value at the end of each accounting period; gains and losses deriving from changes in fair value are recognised in the Income Statement for the period.
Available-for- sale financial assets
Available for sale financial assets are measured at fair value; gainss and losses deriving from changes in fair value are recognised directly in net equity until the assets are sold; at that time, total profits or losses previously reported in equity are taken to the income statement for the period. Non-quoted investments for which fair value may not reliably be determined are measured at cost reduced for impairment losses. This category principally includes non-controlling interests (minority shareholdings).
notes
annual report 2010
• the development expense of the asset can be reliably measured.
These intangible assets are amortised on a straight-line basis over their useful lives.
When the internally produced assets cannot be recognised in the financial statements, the development expense is recognised in the Income Statement in the financial year in which they were incurred.
Trademarks, licences and patentsTrademarks, licences and patents are initially reported at purchase cost and are amortised on a straight-line basis over their useful life and over a period of not more than that fixed by the licence or purchase contract.
Impairment losses on property, plant and equipment and intangible assets
At each reporting date, the Group verifies the existence of events or circumstances that may jeopardize the value of property, plant and equipment or intangible assets with a finite useful life and, where losses are indicated, it estimates the recoverable value of the assets in order to determine whether there has been an impairment loss.Intangible assets with an indefinite useful life, including goodwill, are instead tested annually and whenever there is any indication of a possible impairment loss.
In accordance with the relevant accounting principles, the impairment testing is carried out with reference to the individual asset, where possible, or to a group of assets (the so-called cash generating unit). The cash generating units have been identified consistently with the business and organizational structure of the group as single units that generate independent cash flows through the continuous use of the assets attributable to them.
The recoverability of the recognized amount is tested by comparing the carrying amount with the greater of the current market value net of sales expenses, where an active market exists, or the value in use. The value in use is determined according to the present value of future cash flows expected from the asset or group of assets and from its divestment at the end of its useful life.
Management makes many assumptions in calculating the present value of future cash flows, including estimates of future sales growth, gross operating profit, operating expense, the rate of growth of terminal values, of investments, of changes in working capital and of the weighted average cost of capital (discount rate), in considering the specific risks of the asset or the cash generating units. The forecast cash flows used in the model are instrumental in the Group’s budgeting and planning and represent the best estimates of the amounts and timing of future cash flows materialising during the Group’s long term plan, which is updated annually and reviewed by strategic management and approved by the Parent’s Board of Directors. Sales growth forecasts are based on management forecasts. The operating expense estimated in the cash flow model is also determined on the basis of management estimates for the next three years and are sup-ported by the Group’s product development and production plans. The amounts of investments and working capital used in the cash flow model are determined on the basis of several factors, including the information necessary to support forecast growth and the product development plan. The carrying amount attributed to the cash generating units is determined with reference to the consolidated statement of financial position by direct, where applicable, or indirect allocation criteria.
In the event of impairment losses, non current asset are subsequently impaired accordingly while the origi-nal cost is reinstated (with the exception of the goodwill item) if subsequent financial years show a reduction in the reasons for the impairment.
Non-current assets held for sale
Non-current assets classified as held for sale are measured at the lower of their previous carrying amount and market value net of sales expenses.Non-current assets are classified as held for sale when it expected that their carrying amount can be reco-vered through a sale transaction as opposed to their utilisation in the operating activities of the company.
annual report 2010

88 89
Treasury shares
Trasury shares are recognised at purchase cost and are shown as a reduction in consolidated equity. Gains and losses deriving from trading in treasury shares, net of related tax effects, are included in equity reserves.
Stock options
Remuneration granted to employees and directors in the form of stock options is recognised in the Income Statement by recognising a cost with a corresponding entry in equity and measured on the basis of the fair value of the options at the date of issue. This amount is determined at the time of issue of the stock options and is recognised over the period that the vesting period relating to the options matures. The fair value of the option at the date of issue is measured using mathematical financial models, that take into consideration the terms and conditions attaching to such rights.
Post-employement benefits
For defined benefit plans, the relative cost of benefits provided is determined using the projected unit credit method, with actuarial measurements conducted at the end of each financial year. Actuarial gains and losses that exceed 10 per cent of the present value of benefit liabilities defined by the Group are amortised over the period of the estimated average working life of employees participating in the programme.
Liabilities for recognized post-employement represent the present value of liabilities for the defined benefit plans adjusted to take into account unreported actuarial gains and losses.
Obligations relating to employees for pensions and other similar defined contribution plans are recognised by category in the Income Statement.
The Italian social security reforms involving post-employement benefits for Italian companies mean that post-employement benefits schemes maturing after 1 January 2007 are considered as defined contribution schemes while post-employement benefits schemes that vested prior to 31 December 2006 continue to be considered as defined benefit schemes.
Provisions for risks and charges
Provisions for risks and charges are made against Group expense obligations, whether legal or implicit (con-tractual or of any other kind) arising from an event in the past. Provisions for risks and charges are made if its is probable that these expenses will be incurred and where it is possible to make a reliable estimate of them. Whenever it is estimated that these obligations will materialise beyond twelve months and that the related charges will be material the same are discounted at a discounted rate that takes into account the cost of money and the specific risk of the liability recognised. Any change in the estimate of provisions is reflected in the Income Statement in the period in which it occurs. Where they have been discounted to present value the increase in the provision due to the passage of time and any change arising from a change in the discount rate is recognised as a financial expense. They include, amongst other things, the provision for product guarantee which is recognised i to allow the economic impact of the costs of the guarantee to be anticipated in accordance with the sales-guarantee costs matching principle.
Accounting principles, amendments and interpretations effective from 1 January 2010 and not relevant to the Group
The following principles, amendments, improvements and interpretations, effective from 1° January 2010, govern matters and cases that do not apply to the Group at the reporting date date but which could have an accounting effect on future transactions or agreements:
• IFRS 3 (2008) – Business combinations,
• IAS 27 (2008) – Consolidated and separate financial statements,
notes
annual report 2010
Trade payables
Trade payables are recognised at nominal amount where this is substantially representative of their fair va-lue, otherwise they are measured at amortised cost, utilising the effective interest rate method.
Financial liabilities and equity instruments
Financial liabilities and equity instruments issued by the Group are classified according to the content of the contractual agreements that generated them and in accordance with the respective definitions of the liabi-lities and equity instruments. The latter are defined as those contracts which, freed from any incorporated liabilities, give the right to a share of the group’s assets. The accounting principles adopted for specific financial assets and equity instruments are given below.
Due to banks and other financial institutions
Due to banks, consisting of long-term bank loans and other bank overdrafts and payables to other lenders including payables in respect of fixed assets acquired through finance lease contracts, are reported on the basis of amounts received, net of transaction costs, and are subsequently measured at amortised cost using the effective interest rate method.
Equity Instruments
Equity instruments are reported on the basis of the amount received net of direct issue costs.
Derivative instruments and hedge accounting
Derivative instruments are initially recognised at fair value at the date of subscription and are remeasured at fair value at each subsequent reporting date. Where applicable the hedge accounting method is adopted, which provides for the recognition of derivatives at their fair value. Changes in fair value of derivative instruments are treated differently according to the type of cover provided at the measurement date.
• For those derivatives that provide cover for future transactions (i.e. cash flow hedges), changes in fair value of derivative instruments are recognised in equity for the portion deemed to be effective while the ineffective portion is recognised in the income statement. If a planned hedging transaction subsequently involves the recognition of a non-financial asset or liability, the cash-flow hedging reserve is eliminated from equity to the amount corresponding to the initial cost of the non-financial asset or liability. Whene-ver a planned hedging transaction subsequently results in the recognition of a financial asset or liability the cash flow hedging reserve is reversed to the Income Statement in the period in which the asset acquired or liability recognised have an effect on the Income Statement. In any other case the cash flow hedging reserve is reversed to the Income Statement consistently with the transaction subject to the hedging transaction, or when its related economic effect materialises.
• For those derivatives that provide cover for receivables and payables (i.e. fair value hedges), differences in fair value are entirely recognised in the income statement. In addition the amount of the item covered (receivable/payable) is adjusted for any change in the amount allocated to the risk covered with the dif-ference shown in the income statement.
Fair value gains and losses on derivative instruments that do not qualify as hedging instruments are reported in the income statement in the period in which they occur.Derivatives embedded in other financial instruments or in other contracts are treated as separate derivatives, when their risks and characteristics are not strictly related to those of host contracts and the latter are not measured at fair value with changes in fair value recognised in the related profits and losses in the income statement.
annual report 2010

90 91
• IFRS 3 (2008) – Business combinations: this amendment clarifies that non-controlling interests that give no right to the owner to receive a proportional share of the net assets of the controlled business must be measured at fair value or in accordance with the requirements of the applicable accounting principles. Therefore, for example, a stock option plan granted to employees must be measured, in the event of a business combination, in accordance with IFRS 2 and the equity component of a convertible bond must be measured in accordance with IAS 32. In addition, the Board provided more detail on share-based payments that are substituted as part of a business combination, adding a specific guide to clarify their accounting treatment.
• IFRS 7 – Financial instruments: disclosures: the amendment emphasises the interaction between the di-sclosure of qualitative information and the disclosure of quantitative information required by the principle regarding the nature and scale of risk inherent in the financial instruments. This should help users of the financial statements to draw together the information presented and to form a general description of the nature and scale of risks deriving from financial instruments. In addition the amendment eliminates the need for information previously required regarding financial assets that have expired but been renegotia-ted or impaired and that regarding the fair value of collateral has been eliminated.
• IAS 1 – Presentation of Financial Statements: the amendment requires the reconciliation of changes in each component of equity whether they are reported in the notes or in the balance sheet schedules.
• IAS 34 – Interim Financial Reporting: some examples have been given to provide clarification about additional information that must be presented in Interim Financial Statements.
The adoption of these improvements should have no significant effect on the Group’s Financial Statements.
On 7 October 2010 the IASB published some amendments to IFRS 7 – Financial instruments: disclo-sures, applicable in accounting periods beginning on or after 1July 2011. The amendments were issued in order to improve the understanding of transactions involving the transfer of financial assets, including the understanding of the possible effects deriving from any kind of risk remaining with the company that has transferred such assets. The amendments also require additional information where a disproportionate amount of such transactions are made at the end of an accounting period. At the reporting date the relevant authorities of the European Union have not yet completed the necessary endorsement process for imple-mentation of this new principle.
On 20 December 2010 the IASB issued a minor amendment to IFRS 1 – First-time Adoption of Interna-tional Financial Reporting Standards (IFRS) to eliminate the reference contained in it to 1 January 2004 described therein as the date of transition to IFRS and to provide a guide to presentation of financial state-ments in accordance with IFRS following a period of hyperinflation. These amendments will be applicable from 1 July 2011. At the reporting balance date the relevant authorities of the European Union have not yet completed the necessary endorsement process for implementation of this new principle.
On 20 December 2010 the IASB issued a minor amendment to IAS 12 – Income taxes which requires the business to measure deferred taxes arising from an asset, on the basis of the way that the carrying amount of this asset will be recovered (through use or sale). Followingthis amendment the Italian accounting princi-ple SIC-21 – Income taxes – Recoverability of a revalued non-depreciable asset will no longer be applicable. The amendment is applicable from 1 January 2012. At the reporting date the relevant authorities of the European Union have not yet completed the necessary endorsement process for implementation of this new principle.
4. measurement criteria and use of estimatesThe preparation of the financial statements and related notes in the application of IFRS requires that ma-nagement makes estimates and assumptions that have an effect on the amount of assets and liabilities in the reporting date and on information relating to potential assets and liabilities at the reporting date. The estimates and the assumptions used are based on experience and other relevant factors. The actual ou-tcome may differ from these estimates. The estimates and assumptions are reviewed periodically and the
notes
annual report 2010
• 2008 improvement to IFRS 5 – Non current assets held for sale and discontinued operations,
• Amendment to IAS 28 – Investments in Associates and to IAS 31 – Interests in joint ventures, conse-quent to amendments made to IAS 27,
• Improvements to IAS/IFRS (2009),
• Amendmen to IFRS 2 – Share-based payment: cash regulated Group share-based payments,
• IFRIC 13 – Customer loyalty programmes, the improvement clarifies that where the fair values of credits relating to incentives are measured on the basis of the value of awards where redemption is possible, the fair value of receivables relating to awards should take account of expected losses other than the discounts or incentives that would otherwise be offered to clients who have not yet earned the expected awards.
• IFRIC 14 - The Limit on a Defined Benefit Asset, Minimum Funding Requirements and their Interaction,
• IFRIC 17 – Distributions of non-cash assets to owners,
• IFRIC 18 – Transfer of assets from customers,
• IFRIC 19 – Extinguishing Financial Liabilities with Equity Instruments,
• Amendment to IAS 39 – Financial instruments: recognition and measurement– eligible hedged items.
Accounting principles, amendments and interpretations not yet applicable and not adopted in advance by the Group
On 8 October 2009, the IASB issued an amendment to IAS 32 – Financial Instruments: Presentation: Classification of rights issued to regulate the accounting of the issues of rights (rights, options or warrants) denominated in currencies different to the operating currency of the issuer. These rights were previously accounted for as liabilities of derivative financial instruments; the amendment requires that, under certain conditions, these rights should be classified in equity whatever the currency in which the exercise price is denominated.The amendment is applicable retrospectively from 1 January 2011. It is believed that the adoption of this amendment wil have no significant effect on the Group’s financial statements.
On 4 November 2009 the IASB issued a revised version of IAS 24 – Related Party Disclosures which sim-plifies disclosure regarding State controlled related party transactions and clarifies the definition of related parties. The amendment is applicable from 1 January 2011. The adoption of this amendment will have no effect on the measurement of items in the financial statements.
On 12 November 2009 the IASB published IFRS 9 – Financial instruments: the same principle was then amended on 28 October 2010. The principle, applicable from 1 January 2013, represents the first part of a phased process which is intended to entirely substitute IAS 39 and introduces new criteria for the classifica-tion and measurement of financial assets and liabilities and for the derecognition of financial assets. In par-ticular, for financial assets the new principle adopts a single approach based on the methods of managing financial instruments and on the characteristics of contractual cash flow of financial assets to determine the measurement criteria place of the various rules set out in IAS 39. For financial liabilities, however, the main change regards the accounting treatment of changes in fair value of a financial liability designated as a financial liability measured at fair value in the income statement where these are due to changes in the credit rating of the liability itself. According to the new principle, these changes must be recognised in Other Comprehensive Income and wil no longer be taken through the profit or loss. At the reporting date the relevant authorities of the European Union have not yet completed the necessary endorsement process for implementation of this new principle.
On 6 May 2010 the IASB issued a group of amendments to the IFRS (“Improvements”) which are applicable from 1 January 2011; there follows a description of those IASB amendments requiring changes to presen-tation, recognition and measurement of items in the financial statements and excludes those involving just a change in terminology or in publishing changes with accounting impact, or those which have implications for Principles and Interpretations that are not applicable to the Group:
annual report 2010

9� 93
through utilisation or sale of the same, calculated with reference to the most recent plans of the Group.
Given the current financial and economic crisis, the considerations that the Group has undertaken regarding its prospects are as follows:
• in this context, in preparing the Financial Statements as at and for the year ended 31 December 2010, and more particularly in carrying out impairment tests on property,plan and equipment and intangible assets, the various Divisions of the Group have taken into consideration the expected trend for the period 2011 - 2013, and refer to the business plan approved by the Parent’s Board of Directors on 21 December 2010. On the basis of the figures of this plan, no requirement emerged to recognised significant impair-ment losses.
• In addition, in the absence of a significant deterioration in the economic scenario compared to the alrea-dy serious current situation, the following should be noted:
- With reference to intangible assets with a finite useful life (essentially development costs), these relate to recently introduced models/products, with a high technological content, that makes them competitive in the current economic climate. Therefore, although our core market has been amongst the worst affected by the crisis, we believe that the life cycle of these products should be adequate to sufficient cash flow to cover the cost of investment;
- However, with regard to capitalised goodwill, the analysis indicates that the relevant CGU should be able to recover their value.
Product Guarantees
At the moment a product is sold, the Group makes a provision relating to the estimated cost of guaranteeing the product. Management establishes the amount of these reserves on the basis of historical information regarding the nature, frequency and average cost of repair under guarantee. The Group is working to improve product quality and to minimise the cost of repair under guarantee.
Contigent liabilities
The Group is subject to legal and tax claims regarding a wide range of issues that are within the jurisdiction of various countries. Given the uncertainties inherent in these issues, it is difficult to predict with certainty the possible payments that may derive from these disputes. The claims and disputes against the Group frequently arise from complex and difficult legal issues, characterised by different degrees of uncertainty, including the facts and circumstances relating to each case, the jurisdiction and the different laws applica-ble to each case. In the normal course of business, management consults its own legal advisors and legal and tax experts. The Group recognizes a liability with regard to these disputes when the magnitude of the losses arising from them can be reasonably estimated. Where a financial payment becomes possible but where the amount cannot be determined, the fact is reported in the notes to the accounts.
Recoverability of deferred tax assets
At 31/12/2010 the Group had deferred tax assets of € 19,295 thousand (€ 18,233 thousand in 2009). Management has reported deferred taxes to the value that it believes is recoverable. Management, in deter-mining these items, took into consideration the results of the budget and forecasts for future years that are consistent with those utilised in the impairment tests as described in the preceding paragraph relating to the recoverability of non-current assets.
Treatment of the Bre.Ma. put option.
With reference to the acquisition in August 2006 of 60% of the company Bre.Ma. Brenna Macchine S.r.l., it should be noted that the contract includes a Put option in favour of the vendors relating to the remaining 40% of the quota capital of the company. The option can be exercised no earlier than three years and no later than five years from the date of signing of the aforementioned contract.On the basis of the provisions of IFRS 3 and the guidance of best practice (OPI 4), the option has been
notes
annual report 2010
effect of any resulting change is reflected in the income statement of the period in which the revision occurs if the revision has an impact in that year only, or also in subsequent periods if the revision affects both the current year and future years.Management believes, with regard to this, that it is appropriate to reduce the depreciation rate of some auto-mated operating equipment (utilised in Italian plants) to reflect the increased estimate regarding utilisation of the same, as established in the latest approved three year business plan; the transformation into a lean company involved a significant revision of the productive processes, and envisages full utilisation of the company’s instruments, with regard to just in time principles. Had the Group kept these depreciation rates unchanged, its depreciation would have been € 345 thousand higher than that reported while the remaining useful life of these assets would have been 3.7 years instead of six years.
In the current economic environment it should be noted that the circumstances created by the severe eco-nomic and financial crisis that began in 2008 has led to the necessity of making assumptions regarding the future which are characterised by significant uncertainty, because of which it cannot be ruled out that the results achieved in the coming year may differ from those estimated and may therefore need to be su-bjected to possibly significant adjustments to the items in the financial statements that are obviously are not currently predictable or capable of being estimated. The main items in the financial statements affected by this uncertainty are the provision for allowance for impairment, and allowance for inventory write-down, non-current assets (property, plan and equipment and intangible), the product guarantees reserve and contingent liabilities.
There follows a summary of the critical key measurement procedures and the key assumptions made by management in applying the accounting principles regarding the future and which could possibly have a significant impact on the amounts reported in the consolidated financial statements or where there exists risks that might possibly lead to significant adjustments to the accounting amountsof assets and liabilities in the financial period following the period to which the financial statements relate.
Allowance for impairment
The allowance for impairment reflects management’s estimates of the impairment relating to the portfolio of receivables from final clients and the sales network. The estimate of the allowance for impairment is based on losses expected by the Group, calculated on the basis of past experience of similar receivables, of current and historic expiry rates, of losses and payments received, of the careful monitoring of credit quality and of projections of economic and market conditions. The continuation and the possible worsening of the current economic and financial crisis could result in a further deterioration in the financial situation of the Group’s debtors compared to the worsening already taken into consideration in quantifying the allowance contained in the financial statements.
Allowance for inventory write-down
Allowance for inventory write down reflects management’s estimate of the impairment losses in value ex-pected by the Group and is calculated on the basis of past experience and the historic and expected trends of the market for replacement parts and used equipment. The continuation of or deterioration in the current financial and economic scenario could lead to a further deterioration in market conditions compared with the deterioration already taken into consideration in quantifying the allowance contained in the financial statements.
Recoverable value of non-current assets (including goodwill)
Non-current assets include property, plant and equipment, intangible assets (including goodwill), equity investments and other financial assets. Management periodically revises the carrying amounts of the non-current assets it owns and uses and the assets that are to be divested, when facts and circumstances require such revisions to be made. This activity is carried out using estimates of cash flows expected from the utilisation or the sale of the good and appropriate discount rates are applied to calculate their present value. When the carrying amount of a non-current asset has suffered an impairment loss, the Group reports impairment for the difference in amount between the carrying amount of the good and the value recoverable
annual report 2010

94 95notes
annual report 2010
6. analysis by business segment and geographic sector
As mentioned previously in the Directors’ Report on operations, during 2010 the Group implemented a review of its internal organisation aimed at completing its transformation into a lean company, which had implications for the system of Corporate Reporting. In particular, the operating segment structure was changed and two new operating segments identified– Service and Tooling – previously included in the Wood and Glass & Stone divisions. The first segment is engaged in the management of replacement parts and after-sales support for machinery in the Wood and Glass & Stone divisions, while the second segment is specifically dedicated to the production and sale of grinders and tools for Glass, Stone and other composite materials. The Components segment, previously included in the “Other” segment, is essentially a vertical integration of the Wood and Glass & Stone divisions, given that its main activity consists of the production and marketing of mechanical components for machine tools.
The review of the Corporate Reporting system – which is in continuous evolution – did not result in signifi-cant amendments to the internal management reports which are periodically reviewed by management, but the internal Group calendar of financial periods was changed and a new analysis of management performan-ce details was included (profit by family of products and/or geographical areas).As required by IFRS 8, the segment information has been re-stated, beginning with these financial state-ments, to make it consistent with the information used by management in making its operating decisions. In order to ensure comparability, prior year data has also been re-stated. As the following paragraph il-lustrates, these changes have also had an impact on the identification of the CGUs used in carrying out impairment tests on goodwill.
ANALYSIS BY BUSINESS SEGMENT
The Group is currently organised into six operating divisions for management purposes – Wood, Glass & Stone, Mechatronics, Service, Tooling and Components. These divisions constitute the bases for the Group’s reporting of segment information. The principal activities are as follows:Wood – production and distribution of panel processing machines and systems,Glass & Stone – production and distribution of glass and marble processing machines and systems,Mechatronics – production and distribution of mechanical and electronic components for industry,Service – installation, testing and after-sales service of wood and glass & stone processing machinery; re-placement parts management Tooling – production and distribution of Diamut - branded grinders and tools Components – production of mechanical components for wood and glass & stone processing machinery.
The information relating to these business segments is as follows:
measured together with the contract to acquire the outstanding controlling shareholding in the company, bringing forward the effects of possible exercise of the option already in the 2006 financial statements (the first year of consolidation of the company), recognising the liability thus estimated amongst the other payables balanced by a reduction in the corresponding share of equity and, with regard to the difference, increasing the carrying amount of goodwill. On the basis of the latest forecasts available at thereporting date, it is believed that the option will not be exercised by the counterparty and therefore the related liability originally recognised in 2006 has been reversed (action taken in 2008), with corresponding adjustments made to non-controlling interests and goodwill. It should be noted that in order to provide a clearer presentation, beginning with the consolidated interim results for the six months to 30 June 2010 and from these financial statements, advance payments to suppliers of raw materials and semi-finished goods for production, previously included in Inventories have been included in trade receivables; the comparative data for the year ended 31/12/2009 have consequently been reclassified.
notes to the financial statements consolidated income statement5. revenue and other operating incomeThe analysis of Group revenue is as follows:
Please refer to the Directors’ Report for more details on the trend of revenue.
The most significant component of Other non recurring Income relates to Non-Recurring Income deriving from the reversal of unutilised provisions made at the end of 2009 against contingent liabilities. In particular at the end of the previous year a provision was made for a potential dispute with the Italian Social Security authority regarding the treatment of the company’s use of the Ordinary State Subsidised Temporary Lay-Off programme in 2009; during the year the dispute was resolved favourably, resulting in income of € 668 thousand. The item also includes provisions relating to disputes with suppliers and clients of € 1,3 million.A significant amount of provisions in 2009 related to supplementing the provision for product guarantees for estimated charges in the 2010 financial year (€ 2,089 thousand).As there was no discontinued of operations the data above relates exclusively to continuing operations.
annual report 2010
€ ‘000 31 December 2010 31 December 2009
Revenue from sales of goods 307,596 250,786
Revenue from services 19,134 16,682
Other revenue 793 538
Total Revenue 327,522 268,006
Lease and rental income 118 40
Commissions and royalties 88 19
Incomes related grants 703 �68
Gains on sales of assets 104 14
Other non-recurring income 3,303 4,359
TOTAL OTHER OPERATING REVENUE 4,316 4,699
INCOME STATEMENT DATA31/12/2010€ ‘000 Wood Glass &
Marble Service Tooling Mecha-tronics
Compo-nents Eliminations Group
Total
External revenue 195,230 51,700 54,294 7,002 17,816 1,480 327,522
Inter-segmental revenue 55 413 26,659 23,992 (51,119)
Total Revenue 195,230 51,700 54,349 7,415 44,475 25,472 (51,119) 327,522
Operating profit(loss) of segment (6,417) 1,681 5,126 119 7,653 (129) 8,033
Unallocated ordinary costs (7,927)
Operating profit 106
Unallocated financial income/expense (2,635)
Pre-tax loss (2,529)
Income taxes (3,211)
LOSS FOR THE YEAR (5,741)

96 97
All segments reported an increase in inventories (with the exception of the Glass & Stone segment). The increase in absolute and percentage terms was particularly notable in the Wood, Tooling and Components segments. As note 20 below explains in greater detail, the recovery in sales volumes was behind the increase particu-larly for raw materials and semi-finished goods.
€ ‘000 Wood Glass & Marble Service Tooling Mecha-
tronicsCompo-
nentsGroup Total
31/12/2010 46,103 5,669 12,866 1,722 10,843 4,123 81,326
31/12/2009 33,268 7,147 11,847 898 9,278 778 63,242
ANALYSIS BY GEOGRAPHICAL AREA
revenUeSGeographical area 31/12/2010 % 31/12/2009 %
Western Europe 162,402 49.6% 155,371 58.0%
Asia-Pacific 54,835 16.7% 41,050 15.3%
Eastern Europe 51,043 15.6% 27,741 10.4%
North America 30,615 9.3% 23,336 8.7%
Rest of the World 28,627 8.7% 20,508 7.7%
GROUP TOTAL 327,522 100.00% 268,006 100.0%
31/12/2009€ ‘000 Wood Glass &
Marble Service Tooling Mecha-tronics
Compo-nents Eliminations Group
Total
External revenues 157,293 43,500 44,000 6,095 17,118 268,006
Inter-segmental revenues 388 �81 14,264 11,300 (26,233)
Total Revenue 157,293 43,500 44,388 6,376 31,382 11,300 (26,233) 268,006
Operating profit(loss) of segment (20,445) (1,372) 711 (61) 777 (3,239) (23,630)
Unallocated ordinary costs (9,349)
Operating loss (32,979)
Unallocated financial income/expense (3,336)
Pre-tax loss (36,314)
Income taxes 9,122
LOSS FOR THE YEAR (27,192)
Net revenue for 2010 was € 327,522 thousand, compared with € 268,006 thousand in the year to 31 December 2009, representing an increase of 22% compared with the previous year.
Following a year in 2009 which was severely impacted by the collapse in markets resulting from the excep-tional events that occurred between end-2008 and mid-2009 (global financial crisis combined with econo-mic crisis in core markets), the Group in 2010 succeeded in taking advantage of a recovery in its markets, consolidating its leadership and confirming its position amongst the world leaders.
The Wood segment’s position as the Group’s principal sector was confirmed, generating revenues repre-senting 59.6% of total consolidated revenue (58.7% in 2009), an increase of 24.1% compared with the previous year. The increase in volumes (with obvious benefits for operating leverage) and the initiatives taken during the year on the industrialisation of products resulted in a significant improvement in the profitability of the segment.The Glass & Stone segment reported an 18.9% increase in sales, keeping its contribution to Group Sales (in percentage terms) largely unchanged. The operating loss for the segment in 2009 was € 1,372 thousand, turned positive with a profit of € 1,681 thousand.The Service segment, whose performance is less tied to broad economic trends, reflected the result at Group level (+ 22.4% compared with the previous year), representing 16.6% of consolidated revenue. The operating profit also improved rising from € 711 thousand to € 5,126 thousand.The Tooling segment rose 16.3%, in line with the result of the Glass & Stone segment which is its main client. The Mechatronic segment reported the highest increase (+41.7%), increasing its contribution to conolida-ted sales by 2 percentage points (13.6% compared with 11.7% at end 2009); it should be noted that the majority of this segment’s production (about 60%) is absorbed by the Wood and Glass & Stone segments. The operating profit rose from € 777 thousand to € 7,653 thousand.Finally, the remarkable growth (+125.4%) of the Components segment should be put into perspective taking into account that 94% of its production is taken up by companies belonging to the Group.
Statement of financial position data – Inventories
With the exception of inventories, the assets, liabilities and investments are not allocated to operating seg-ments and are examined by top management at a Group level. The following table shows the breakdown of inventories by operating segment.
7. raw materials and consumablesConsumption of raw materials and consumables rose from € 105,839 thousand to € 143,639 thousand, an incresae of 35.7% compared to the previous year. This change is in line with the increase of 35.5% in revenue from € 249,292 thousand to € 337,735 thousand (+35.5%). The recovery in core markets and the positive trend of order intake resulted in an increase in both revenues from sales and an increase in inventories of finished and semi-finished goods, leading to a consequent increase in the consumption of raw materials and consumables.
8. personnel expense€ ‘000 31 December 2010 31 December 2009
Wages, salaries and social security contributions 99,751 88,930
Productivity bonus, other bonus and related social security contributions 6,933 1,935
Accruals to pension plans 4,929 5,050
Other personnel expenses 1,003 1,186
Capitalization and recovery of personnel expense (4,934) (4,604)
STAFF COSTS 107,683 92,498
notesannual report 2010
annual report 2010

98 99notes
annual report 2010
9. other operating expenses
Remuneration paid to directors, statutory auditors and the independent audit company are included in “Other operating expense”.
As required by article 149-duodecies of the Consob Issuers Regulations, a list of the services provided by the independent auditor is shown below:
Services Services Supplier Beneficiary Fees (€’000)
Audit
Deloitte & Touche S.p.A. Biesse S.p.A. 14�
KPMG S.p.A. Biesse S.p.A. 34
Deloitte & Touche S.p.A. Subsidiaries 41
KPMG S.p.A. Subsidiaries 6
Deloitte Network Subsidiaries 47
Rete KPMG Subsidiaries 185
Other services
KPMG S.p.A. Biesse S.p.A. 111
Deloitte Network Subsidiaries 18
KPMG Network Subsidiaries �
TOTAL 586
€ ‘000 31 December 2010 31 December 2009
Production services 15,085 9,885
Maintenance 2,463 2,218
Sales services 12,942 10,570
Consultancy fees 4,698 4,614
Utilities 3,926 3,532
Exhibitions and advertising 4,015 4,150
Insurance expenses 1,287 1,235
Directors auditors and partners expenses 2,430 2,250
Travel expenses 7,857 6,887
Other services costs 4,018 2,300
Use of third parties assets 6,394 6,599
Other operating costs 5,599 5,150
OTHER OPERATING ExPENSES 70,714 59,391
annual report 2010
Personnel expense in 2010 was € 107,683 thousand, compared with € 92,498 thousand in the year to 31 December 2009, with an increase of € 15.2 million in absolute value. € 5 million of the cumulative increase is attributable to the variable element of personnel expense (results based awards, bonuses and related social security costs), which represented a cost to the Group that was broadly consistent with the nominal “target” value, while the reported amount in 2009 was more than 70% lower than the budgeted amount due to the negative result in the period. The fixed component rose by about € 10.5 million, as a result of the higher requirement for skilled labour, particularly direct labour, to respond to the increase in volumes, with a consequent reduction in the utilisa-tion of subisdised temporary lay-off schemes compared with 2009. It should be noted that the figure repor-ted for 2009 included € 911 thousand of costs relating to the employee mobility and transfer arrangements relating to the closure of the HSD plant in Turin. Capitalisation of employee wages and salaries rose slightly compared to 2009 (€ 4,934 thousand, compa-red to € 4,604 thousand in 2009) due to the almost total return to work of personnel involved in product development.
10. finance income
11. finance expenseDetails of financial expenses are reported below:
The improvement in the debt position, together with the low level of interest rates in 2010, resulted in a sharp reduction of interest expense paid to financial institutions (-29.6%, down from € 1,745 thousand to € 1,228 thousand). Interest on finance lease contracts also declined (€ 124 thousand in 2010 compared with € 358 thousand in 2009). However, the increase in sales volumes led to an increase in financial expenses related to the management of trade receivables, due to the increase in financial discounts to clients which
€ ‘000 31 December 2010 31 December 2009
Income from financial receivables 182 38
Bank interest 42 6�
Interest from customers 66 70
Other financial income 25 106
TOTAL FINANCIAL INCOME 316 276
€ ‘000 31 December 2010 31 December 2009
Bank, mortgage and financing interest 1,228 1,745
Finance lease interest 124 358
Bills discounted 80 160
Other interest 39 179
Financial discounts to customers 419 368
Other financial expense 583 671
TOTAL FINANCE ExPENSE 2,473 3,481

100 101notes
annual report 2010
rose from € 368 thousand to € 419 thousand.The item “Other financial expenses” includes the costs of discounting to present value of receivables and other financial assets with expiry beyond 12 months, which at end-2010 amounted to € 545 thousand. In addition to this were the costs of measurement at fair value of an interest/foreign exchange hedging deri-vative (Cross Currency Swap), taken out by the Indian subsidiary against an intercompany debt agreement with the Parent. As this contract does not meet the conditions of IAS 39 relating to hedge accounting, the measurement expense has been recognised in the income statement rather than in Equity. This derivative covers financing of 167,500,000 rupees (guaranteeing an exchange rate of 67 rupee/euro and an interest rate fixed at 11.5%), which expires on 30 June 2012.
12. exchange rate on gains and lossesExchange rate 2010 losses of € 478 thousand were recognised (in 2009 it was a loss of € 131 thousand).
The Group’s activities are exposed primarily to financial risks relating to currency fluctuations. The risk management policy approved by the Board of Directors of the Parent that the amount of hedging in place must never fall below the level of 70% net exposure in foreign currency and that the underlying asset must be identified at the outset of any hedging transaction. Hedging may take place using fixed term contracts (outright/currency swap) or also with derivative instruments (currency option).The particular nature of the Group’s business is such that its currency exposure can be packaged in many individual currency positions (relating to individual orders and invoices), that make it complicated (as well as uneconomic) to engage in hedging on an exact basis (i.e. with a direct correlation between the hedging instrument and the underlying asset): for this reason, hedging is carried out on an combined basis and in particular on matching of all the open positions in foreign currency. As of the second half of 2009, the Group partially modified its operating procedures regarding foreign currency hedging techniques, in order to comply with the provisions of IAS 39 as regards hedge accounting. Consequently, the part of the tansactions that satisfies the Hedge accounting rules, insofar as it relates to hedging having passed the efficacy test, has been accounted in accordance with the provisions of IAS 39. In particular exchange rate losses amounting to € 240 thousand have been reclassified under “Revenue” while € 132 thousand of exchange net of tax effects have been recognised under equity.As far as the remaining hedging goes, though effective from a managerial perspective, it cannot be conside-red as such in the context of international accounting standards. For this reason, fair value gains and losses on derivative instruments have been recognised directly in the income statement, leading to, unrealised expense of € 278 thousand.
Finally it must be noted that the item, Exchange rate on gains and losses includes the value relating to the balance of unrealised gains and losses, arising from restating at year end exchange rate the amounts of receivables and payables denominated in foreign currency (positive € 2,433 thousand).
13. income taxes
Taxes on the income of foreign subsidiaries are calculated at the rates of tax in force in each country. National taxes (IRES) are calculated at 27.5% (unchanged compared to 2009) on the taxable income for the year. IRES taxes amounting to € 1,561 thousand were offset during the year as a result of the effect of the national tax consolidation scheme adopted by the parent, Biesse to which the subsidiaries Hsd SpA and Brema Srl also adhere.
Deferred IRES taxes do not include the amount of € 47,000 recognised directly in equity in reserves deriving from the measurement at period end of open hedging contracts.
IRAP and other minor taxes, applied in other jurisdictions and calculated on taxable bases different from pre-tax profit are stated separately.
Taxes relating to previous years show a positive balance of € 323 thousand attributable to the favourable outcome of tax disputes relating to previous years for which a provision regarding the risk of an unfavourable result was made to the provision for tax.
The tax provision for the year can be reconciled with the loss for the year shown in the financial statements as follows:
€ ‘000 31 December 2010 31 December 2009
Income tax related to foreign subsidiaries 1,036 �86
IRES and other deferred taxes 77 (8,997)
IRES and other taxes for the year 1,113 (8,711)
IRAP and other current taxes 2,370 788
IRAP and other deferred taxes 51 (46)
Income tax relating to previous years (323) (591)
Other taxes - (563)
TOTAL INCOME TAx FOR THE YEAR 3,211 (9,122)
annual report 2010
€ ‘000 31 December 2010 31 December 2009
Pre-tax loss (2,529) (36,314)
National income tax rate 27.5% (696) (27.50)% (9,986) 27.50%
Tax effect of non-deductible expense/exempt profit in determining income 607 24.01% 373 (1.03)%
Tax effect of the use of previously unrecognised losses (15) (0.60)% (230) 0.63%
Reduction of deferred tax assets/liabilities, due to change in the national rate - - 43 (0.12)%
Tax effect on losses for the year of certain subsidiaries not included in the financial statement, and reassessment of deferred tax asset
1,146 45.32% 1,425 (3.93)%
Effect of the different tax rates relating to subsidiaries operating under other jurisdictions 70 2.77% (336) 0.93%
Income tax for the year and effective tax rate 1,113 (44.0)% (8,711) 23.99%
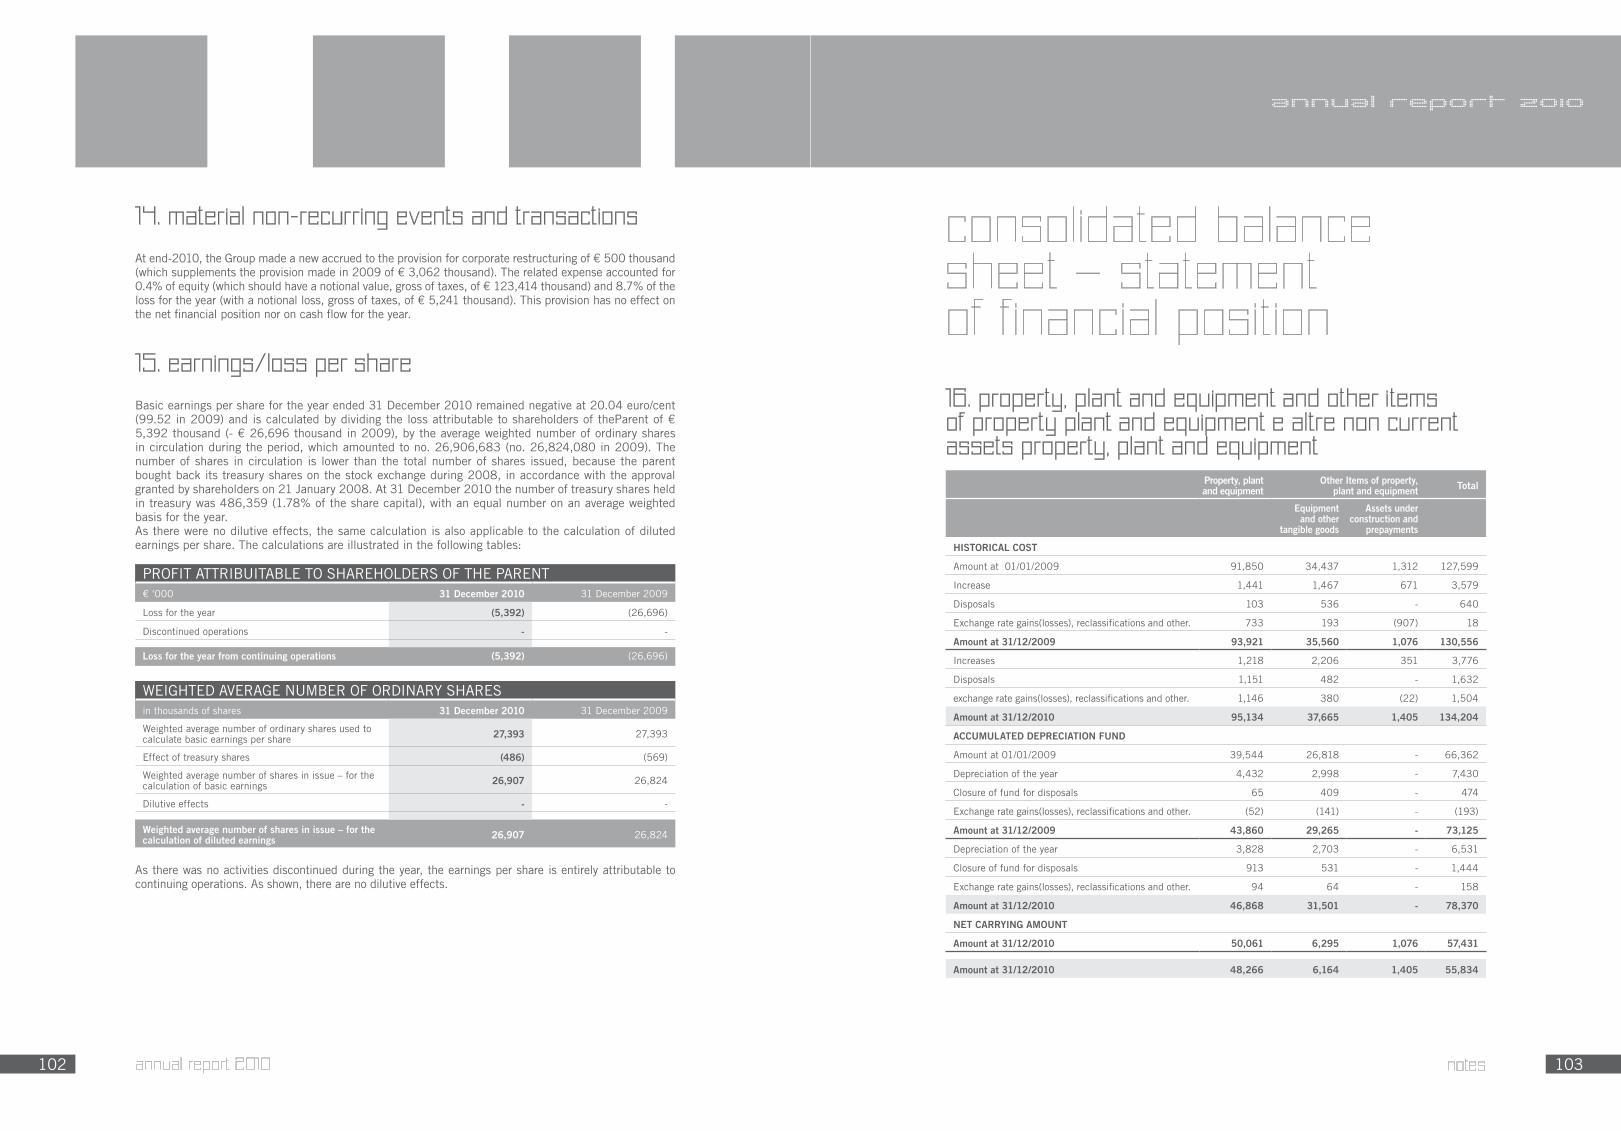
10� 103notes
annual report 2010
WEIGHTED AVERAGE NUMBER OF ORDINARY SHARESin thousands of shares 31 December 2010 31 December 2009
Weighted average number of ordinary shares used to calculate basic earnings per share 27,393 27,393
Effect of treasury shares (486) (569)
Weighted average number of shares in issue – for the calculation of basic earnings 26,907 26,824
Dilutive effects - -
Weighted average number of shares in issue – for the calculation of diluted earnings 26,907 26,824
As there was no activities discontinued during the year, the earnings per share is entirely attributable to continuing operations. As shown, there are no dilutive effects.
consolidated balance sheet – statement of financial position
16. property, plant and equipment and other items of property plant and equipment e altre non current assets property, plant and equipment
Property, plant and equipment
Other Items of property, plant and equipment Total
Equipment and other
tangible goods
Assets under construction and
prepayments
HISTORICAL COST
Amount at 01/01/2009 91,850 34,437 1,312 127,599
Increase 1,441 1,467 671 3,579
Disposals 103 536 - 640
Exchange rate gains(losses), reclassifications and other. 733 193 (907) 18
Amount at 31/12/2009 93,921 35,560 1,076 130,556
Increases 1,218 2,206 351 3,776
Disposals 1,151 48� - 1,632
exchange rate gains(losses), reclassifications and other. 1,146 380 (22) 1,504
Amount at 31/12/2010 95,134 37,665 1,405 134,204
ACCUMULATED DEPRECIATION FUND
Amount at 01/01/2009 39,544 26,818 - 66,362
Depreciation of the year 4,432 2,998 - 7,430
Closure of fund for disposals 65 409 - 474
Exchange rate gains(losses), reclassifications and other. (52) (141) - (193)
Amount at 31/12/2009 43,860 29,265 - 73,125
Depreciation of the year 3,828 2,703 - 6,531
Closure of fund for disposals 913 531 - 1,444
Exchange rate gains(losses), reclassifications and other. 94 64 - 158
Amount at 31/12/2010 46,868 31,501 - 78,370
NET CARRYING AMOUNT
Amount at 31/12/2010 50,061 6,295 1,076 57,431
Amount at 31/12/2010 48,266 6,164 1,405 55,834
annual report 2010
15. earnings/loss per share
Basic earnings per share for the year ended 31 December 2010 remained negative at 20.04 euro/cent (99.52 in 2009) and is calculated by dividing the loss attributable to shareholders of theParent of € 5,392 thousand (- € 26,696 thousand in 2009), by the average weighted number of ordinary shares in circulation during the period, which amounted to no. 26,906,683 (no. 26,824,080 in 2009). The number of shares in circulation is lower than the total number of shares issued, because the parent bought back its treasury shares on the stock exchange during 2008, in accordance with the approval granted by shareholders on 21 January 2008. At 31 December 2010 the number of treasury shares held in treasury was 486,359 (1.78% of the share capital), with an equal number on an average weighted basis for the year. As there were no dilutive effects, the same calculation is also applicable to the calculation of diluted earnings per share. The calculations are illustrated in the following tables:
PROFIT ATTRIBUITABLE TO SHAREHOLDERS OF THE PARENT€ ‘000 31 December 2010 31 December 2009
Loss for the year (5,392) (26,696)
Discontinued operations - -
Loss for the year from continuing operations (5,392) (26,696)
14. material non-recurring events and transactions
At end-2010, the Group made a new accrued to the provision for corporate restructuring of € 500 thousand (which supplements the provision made in 2009 of € 3,062 thousand). The related expense accounted for 0.4% of equity (which should have a notional value, gross of taxes, of € 123,414 thousand) and 8.7% of the loss for the year (with a notional loss, gross of taxes, of € 5,241 thousand). This provision has no effect on the net financial position nor on cash flow for the year.

104 105notes
annual report 2010
The values of goodwill recognised in the balance sheet deriving from business combinations have therefore been re-allocated in accordance with the new operating segment structure.
As stated in note 6 above, the segments are characterised by quite varying volumes and income trends, as the Wood, Glass & Stone segments are more tied to the economic cycle, while the Tooling and Service segments are less exposed to fluctuations in demand for capital goods. Their cash generating capacities are also different, with more stable trends for the latter two segments while the Wood, Glass & Stone and Mechatronics segments generate higher cash flows (in absolute terms), but are also more subject to fluctua-tions in the event of an unfavourable trend in the core markets.
In accordance with accounting principles The Group verifies the recoverability of goodwill once a year or more frequently if there are indications of a loss of value. The recoverable value of the CGU is verified throu-gh a calculation of value in use. In the discounted cash flow model incorporates a terminal value input at the end of the cash flow forecast period. The terminal value reflects the residual value that each cash-generating unit is expected to generate. The terminal value represents the present value, in the last forecast year, of all the subsequent cash flows in perpetuity. The rate of growth of the terminal value is a key parameter in determining he terminal value itself as it represents the annual growth rate of all subsequent cash flows in perpetuity and is calculated by extrapolating from the cash flow of the last forecast year, in the absence of any potential operation of normalisation and discounting this flow by the discount rate. In calculating value in use it is assumed that the growth rate is zero.
The main assumptions utilised relate to the discount rate, growth rate and expected changes in selling prices and trends in direct costs during the time horizon assumed for the calculation. Group management has therefore adopted a discount rate net of tax that reflects the correct market value of the cost of money and the specific risk. The growth rates adopted are based on growth forecasts for the relevant industrial sector. Changes in selling prices and direct costs are based on past experience and future expectations for the market.The operating cash flows deriving from the three year Industrial Plan approved by the Board of Directors on 21 December 2010 extrapolates the cash flows for the residual period on the basis of a long term sector rate of growth of 1.5%. The rate used in discounting cash flows is 8.40% (the discount rate used in 2009 was 8.19%).
The analysis of the recoverability of goodwill and values in use by the CGU do not indicate any reason that would result in on impairment loss,, insofar as the fair value of the cash-generating unit calculated in this way is significantly higher than the carrying amount of the cash-generating units concerned. In addition the group carried out a sensitivity analysis on the discount rate used in the model (reducing and increasing the rate by 1%), and on the assumptions of the Plan (by incorporating the assumption that objectives fixed for sales volumes by the plan approved by the Board of Directors are not fully achieved, particularly for the Wood and Glass & Stone divisions). Finally, given the changes made to the reporting model the re-allocation of goodwill to the new cash generating units, an ex-post analysis was carried out on the comparative data for 2009, verifying that the cash flows projected in the previous business plan would be sufficient to recover the restated amount of the CGUs; the analysis produced no signs of criticality.
The analysis of the existence of external indicators implying on impairment loss of value amongst the Group’s assets, indicates that there is no need for concern at the present time. In particular the two main causes of negative performance, that the Group experienced in 2009 (economic crisis combined with a fi-nancial market crisis), seem to have been substantially overcome, as a reversal of the trend appears evident above all in order intake.
Finally it is important to clarify that the estimates and budget figures applying to the previously indicated parameters are calculated by the Group’s management on the basis of past experience and expectations about the development of the markets in which the Group operates. It should therefore be noted that esti-mates of the recoverable value of the cash-generating units requires discretion and the use of estimates by management. The Group cannot guarantee that there will be no impairment losses recognized on goodwill in future periods. In fact various factors relating to the evolution of the difficult market conditions could demand a review of the amount of goodwill. The Group will continue to monitor the circumstances and the
annual report 2010
Investments in the period under review amounted to € 3,776 thousand. In addition to the amount relating to normal replacement of assets required for normal production activity, the investments relating to acquisition or construction of the new commercial and production sites shown below should be noted:
• expansion of the production facilities of the subsidiary Biesse Manufacturing Co. Pvt. Ltd. (€ 1,232 thousand), necessary to respond to the increase in production volumes, as outlined in the 2011-2013 three year plan;
• upgrading of the HSD S.p.A. production plant, for € 328 thousand following transfer from the previous headquarters in via della Meccanica to the current headquarters in Piazzale De Simoni (in Pesaro); this transfer became appropriate following the incorporation by HSD S.p.A. of MC (owner of the property in Piazzale De Simoni).
Biesse S.p.A.’s investments included the acquisition of a new numerically controlled lathe for € 286 thou-sand, for the mechanical processing department and the upgrading of existing plant for € 266 thousand.
It should be noted that the amounts in the financial statement include assets acquired through finance lease contracts for a net carrying amount of € 12,040 thousand (€ 13,089 thousand in 2009), depreciated during the year for € 1,084 thousand (€ 1,166 thousand in 2009); in particular the net carrying amount refers to land and industrial buildings of € 11,132 thousand (€ 11,477 thousand at end-2009), equipment for € 821 thou-sand (€ 1,523 thousand in 2009) and office equipment for € 86 thousand (€ 89 thousand at end-2009).
The item Property, plant and equipment includes land, not subject to depreciation, with a value of € 6,421 thousand (€ 6,162 thousand at the end of the previous year).
There were no outstanding commitments to acquire assets of significant value at 31 December 2010.
There are no mortgages on land and buildings.
17. goodwill
Goodwill is allocated to cash-generating units (“CGU”) identified on the same basis as the Group’s operating segments. The following table illustrates the allocation of goodwill by segment:
The end-year balance shows an increase of € 483 thousand due to exchange rate changes.
As explained in note 6 above, during 2010 the Group undertook a review of its Corporate Reporting system, bringing it into line with the new internal organisation, to complete its transformation into a lean company. This change resulted in an amendment of the information regarding segment reporting (IFRS 8), and the identification of two new operating segments – Service and Tooling – previously included in the Wood and Glass & Stone segments. Since the operating segments should correspond to the cash generating units, as dictated by accounting principles, the goodwill attributed to each segment was also updated. Consequently, in accordance with IAS 36, care has been taken to ensure that each operating area, identified as a CGU should represent the minimum level within the Group, in which goodwill is monitored for managerial purpo-ses, and that the same group should be no larger than an operating segment.
€ ‘000 31 December 2010 31 December 2009
Mechatronics 5,599 5,599
Wood 4,443 4,330
Tooling 3,940 3,940
Service 2,390 2,242
Glass & Marble 1,550 1,327
TOTAL 17,921 17,438
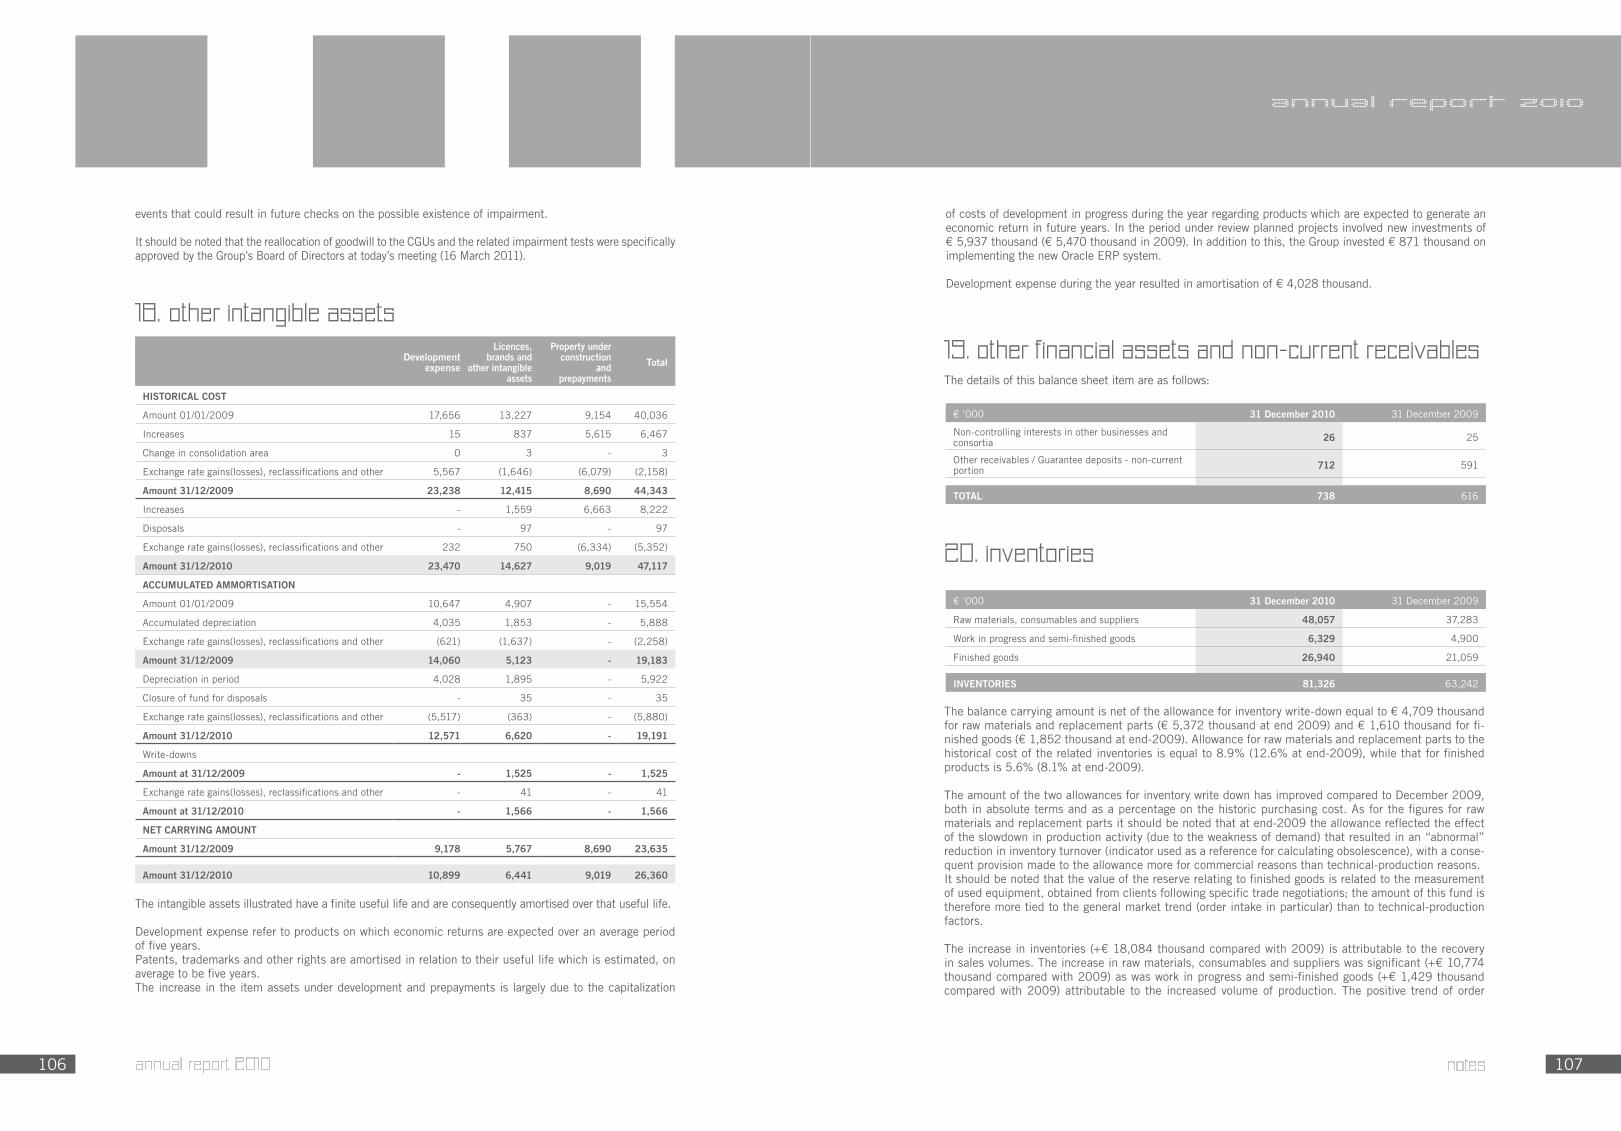
106 107notes
annual report 2010
19. other financial assets and non-current receivablesThe details of this balance sheet item are as follows:
20. inventories
The balance carrying amount is net of the allowance for inventory write-down equal to € 4,709 thousand for raw materials and replacement parts (€ 5,372 thousand at end 2009) and € 1,610 thousand for fi-nished goods (€ 1,852 thousand at end-2009). Allowance for raw materials and replacement parts to the historical cost of the related inventories is equal to 8.9% (12.6% at end-2009), while that for finished products is 5.6% (8.1% at end-2009).
The amount of the two allowances for inventory write down has improved compared to December 2009, both in absolute terms and as a percentage on the historic purchasing cost. As for the figures for raw materials and replacement parts it should be noted that at end-2009 the allowance reflected the effect of the slowdown in production activity (due to the weakness of demand) that resulted in an “abnormal” reduction in inventory turnover (indicator used as a reference for calculating obsolescence), with a conse-quent provision made to the allowance more for commercial reasons than technical-production reasons.It should be noted that the value of the reserve relating to finished goods is related to the measurement of used equipment, obtained from clients following specific trade negotiations; the amount of this fund is therefore more tied to the general market trend (order intake in particular) than to technical-production factors.
The increase in inventories (+€ 18,084 thousand compared with 2009) is attributable to the recovery in sales volumes. The increase in raw materials, consumables and suppliers was significant (+€ 10,774 thousand compared with 2009) as was work in progress and semi-finished goods (+€ 1,429 thousand compared with 2009) attributable to the increased volume of production. The positive trend of order
of costs of development in progress during the year regarding products which are expected to generate an economic return in future years. In the period under review planned projects involved new investments of € 5,937 thousand (€ 5,470 thousand in 2009). In addition to this, the Group invested € 871 thousand on implementing the new Oracle ERP system.
Development expense during the year resulted in amortisation of € 4,028 thousand.
€ ‘000 31 December 2010 31 December 2009
Non-controlling interests in other businesses and consortia 26 �5
Other receivables / Guarantee deposits - non-current portion 712 591
TOTAL 738 616
€ ‘000 31 December 2010 31 December 2009
Raw materials, consumables and suppliers 48,057 37,283
Work in progress and semi-finished goods 6,329 4,900
Finished goods 26,940 21,059
INVENTORIES 81,326 63,242
18. other intangible assets
The intangible assets illustrated have a finite useful life and are consequently amortised over that useful life.
Development expense refer to products on which economic returns are expected over an average period of five years. Patents, trademarks and other rights are amortised in relation to their useful life which is estimated, on average to be five years.The increase in the item assets under development and prepayments is largely due to the capitalization
events that could result in future checks on the possible existence of impairment.
It should be noted that the reallocation of goodwill to the CGUs and the related impairment tests were specifically approved by the Group’s Board of Directors at today’s meeting (16 March 2011).
annual report 2010
Development expense
Licences, brands and
other intangible assets
Property under construction
and prepayments
Total
HISTORICAL COST
Amount 01/01/2009 17,656 13,227 9,154 40,036
Increases 15 837 5,615 6,467
Change in consolidation area 0 3 - 3
Exchange rate gains(losses), reclassifications and other 5,567 (1,646) (6,079) (2,158)
Amount 31/12/2009 23,238 12,415 8,690 44,343
Increases - 1,559 6,663 8,222
Disposals - 97 - 97
Exchange rate gains(losses), reclassifications and other �3� 750 (6,334) (5,352)
Amount 31/12/2010 23,470 14,627 9,019 47,117
ACCUMULATED AMMORTISATION
Amount 01/01/2009 10,647 4,907 - 15,554
Accumulated depreciation 4,035 1,853 - 5,888
Exchange rate gains(losses), reclassifications and other (621) (1,637) - (2,258)
Amount 31/12/2009 14,060 5,123 - 19,183
Depreciation in period 4,028 1,895 - 5,922
Closure of fund for disposals - 35 - 35
Exchange rate gains(losses), reclassifications and other (5,517) (363) - (5,880)
Amount 31/12/2010 12,571 6,620 - 19,191
Write-downs
Amount at 31/12/2009 - 1,525 - 1,525
Exchange rate gains(losses), reclassifications and other - 41 - 41
Amount at 31/12/2010 - 1,566 - 1,566
NET CARRYING AMOUNT
Amount 31/12/2009 9,178 5,767 8,690 23,635
Amount 31/12/2010 10,899 6,441 9,019 26,360

108 109notes
annual report 2010
It should be noted that other overdue client receivable positions exist but for which impairment losses have not been recognised, either directly nor indirectly, through the allowance for impairment. Expiry details for these positions are as follows:
The ageing of receivables that are overdue but for which not impairment losses have not been recognised is less than 180 days; impairment losses have not been recognized on these receivables because of the characteristics of the sales to which they relate. These relate primarily to plant or complete production lines on which there are usually payment deferrals without which there would be an effective risk of not being able to collect the receivable at all.
Please refer to the previous note for details of the amount of receivables granted in guarantee of third parties and financial institutions.
22. other current assetsOther current assets are detailed as follows:
Other current assets consist largely of consumption tax credits and prepayments relating to income taxes.The balance of income tax assets at end-2010 relates to prepayments made in 2009 and not offset during the year; They primarily relate to Italian companies (€ 780 thousand) and Biesse Group Deutschland GmbH (€ 222 thousand). The balance of income tax credits at end-2009 related to prepayments made in 2008 and not offset during the year. It also included receivables from the US and Canadian tax authorities, relating to the respective su-bsidiaries (€ 649 thousand and € 85 thousand respectively), regarding local regulations, as local regulations permit the recovery of taxes paid in previous years against current losses (so-called loss carry-back).The item Other receivables from parents relates to receivable due to Biesse S.p.A. and Hsd S.p.A paya-ble by the parent Bi.Fin. S.r.l. for the requested rebate of 10% IRAP on IRES taxes relating to 2005; in that year the two companies participated in the national tax consolidation scheme which with the parent Bi.Fin. S.r.l.The item Other receivables from third parties rose by € 1,787 thousand. Amongst the more significant items resulting in the increase is the recognition of a receivable amounting to € 1,351 thousand, payable to the Canadian subsidiary by a local insurance company, arising from a legal dispute involving a former employee and relating to an indemnity calculated prudentially on the basis of documentation provided and the testimony of lawyers involved in the case. Although there is no risk involved, given the insurance cover, and while substantially certain of a favourable outcome to the dispute, it was considered appropriate to declare the potential liability with regard to the counterparty and the corresponding receivable with regard to the insurance company.
€ ‘000 31 December 2010 31 December 2009
Consumption tax receivables and other tax receivables 9,591 4,255
Income tax assets 1,035 3,913
Other receivables from parents 574 574
Other receivables from third parties 3,690 1,903
14,891 10,647
€ ‘000 31 December 2010 31 December 2009
Overdue by 1 to 30 days 4,820 3,685
Overdue by 30 to 180 days 5,578 4,087
TOTAL 10,398 7,772
intake was behind the increase in inventories of finished goods (+€ 5,881 thousand compared with 2009).
It should be noted that part of the inventories and trade receivables of the Canadian subsidiary was su-bject to credit line guarantees granted to the subsidiary, equal to Canadian Dollars 2 million (€ 1.5 million at end 2010); at 31 December 2010 these lines had not been utilized.
Receivables relating to deposits paid to suppliers of raw materials and semi-finished goods for production, previously classified amongst inventories, are now stated amongst trade receivables; the comparative data for 2009 have consequently been reclassified.
21. trade receivables from third parties
The management believes that the carrying amount of trade receivables reflects their fair value.
Trade receivables are recognised net of the allowance for impairment credit risk provisions which is pru-dently estimated with reference both to nonperforming receivables and to those that are more than 180 days overdue. The changes to the allowance are summarised in the following table:
The accrual to to the allowance for impairment are made on the basis of individually assessed impairment of expired receivables. Collective impairments calculated on a statistical basis on historical amounts are added to the individual assessments. The magnitude of the allowance is calculated on the basis of present value of estimated recoverable amounts having taken account of potential recovery expenses correlated to the fair value of the potential guarantees recognized to the group.
The trade receivables recognised include impairment loss on individual receivables remeasured credits with a net value of € 3,364 thousand, following impairment losses of € 5,028 thousand (net receivables of € 3,525 thousand following specific impairment losses of € 4,977 thousand, at 31 December 2009). The impairment recognized in the Income Statement are primarily carried out indirectly through accrual made to the allowance for impairrment.
Specific impairment charges are determined mainly by measurement of receivables which are the subject of specific legal disputes and are generally supported by relevant legal advice.
annual report 2010
€ ‘000 31 December 2010 31 December 2009
Trade receivables within 12 months 91,925 80,282
Trade receivables beyond 12 months 4,634 4,208
Allowance for impairment (6,193) (7,183)
TRADE RECEIVABLES FROM THIRD PARTIES 90,366 77,307
€ ‘000 31 December 2010 31 December 2009
Opening balance 7,183 6,625
Accrual for the period 784 4,554
Utilised (1,792) (3,713)
Derecognition of excess allowance (49) (351)
Exchange rate gains 62 48
Discounting 4 �0
Closing balance 6,193 7,183

110 111notes
annual report 2010
25. share capital reservesThe amount of € 36,202 thousand (unchanged compared with 2009) relates to the share premium reserve.
26. hedging and translation reservesThe carriying amount is made up as follows:
The reserve for translation of foreign currency financial statements, negative for € 403 thousand, incorpora-tes the differences arising from translation of the financial statements denominated in foreign currencies of countries that do not belong to the Euro zone (United States, Canada, Singapore, United Kingdom, Sweden, Switzerland, Australia, New Zealand, India, China and Indonesia) and show a decrease of € 1,870 thousand for the year.
27. other reserves and non-controlling interests
Retained earnings
The carrying amount is made up as follows:
As shown in the statement of changes in equity, the item Other reserves (particularly the parent’s extraor-dinary reserve and retained earnings) has changed to account for the loss recognised in 2009 (€ 26,696 thousand).
Non-controlling interests
With regards to the change in the equity of non-controlling interests, in addition to accounting for the loss reported in 2009 and the change in the foreign currency translation reserve, the increase in equity relating to the constitution of the new companies Biesse Tecno System S.r.l. and Biesse Indonesia Pt. should be noted.
€ ‘000 31 December 2010 31 December 2009
Reserve for translation of foreign currency financial statement (403) (2,273)
Reserve for gains (losses) on exchange rate cash flow hedges (132) (8)
TOTAL (535) (2,280)
€ ‘000 31 December 2010 31 December 2009
Legal reserve 5,479 5,479
Extraordinary reserve 46,937 68,734
Reserve for treasury shares 4,676 4,676
Retained earnings 12,611 17,502
OTHER RESERVES 69,703 96,391
23. cash and cash equivalentsThis includes the liquidity held by the Group and bank deposits which expire within three months. The car-rying amount of these assets reflects their fair value.
24. share capital/treasury sharesThe share capital amounts to € 27,393 thousand and is composed of no. 27,393,042 ordinary shares each of € 1 nominal value with ordinary dividend rights. At the date on which the financial statements were approved, the Group held 486,359 treasury shares at an average carrying value of € 9.61 per share.As stated in note 15 above, the Shareholders’ Meeting of Biesse S.p.A. on 21 January 2008 approved a share buyback programme. This programme involves the purchase of a maximum number of 2,739,304 ordinary shares of a nominal value of € 1 Euro in Biesse corresponding to 10% of the share capital, which may be acquired on regulated markets for a period of up to 18 months beginning 22 January 2008.The shareholders meeting mandate grants the company the right to acquire shares for a price no greater than 10% above and no greater than 20% below the average weighted official price of the shares reported by Borsa Italiana S.p.A. in the three days preceding each single purchase transaction, in accordance with the limits determined by related laws in force. The main reason for the buyback programme was to give the company the opportunity to intervene on the market, in accordance with the regulations in force, to help guarantee liquidity for Biesse’s shares, parti-cularly during periods of high volatility. The Group also believes that it is appropriate to invest part of its reserves in treasury shares when market value significantly fails to reflect the fair value of the shares.
The change in macro-economic conditions affecting the company meant that the buyback plan had not completely used the full authorised percentage at the time of expiry (21 July 2009), as Management prefer-red to preserve the company’s liquidity for the management and maintenance of the core business activities relating to its strategic industrial projects.
Finally it should be noted that, on the basis of the resolution of the shareholders’ meeting of 19 October 2010, the company’s treasury shares purchased may be used as part of a stock option plan, including through the free allocation of shares, or incentive agreements, or loyalty and/or retention plans, reserved for management, employees or consultant of the Group. The same resolution approved an incentive plan reserved for the top management of Biesse S.p.A. and com-panies belonging to the Group, with the free allocation of trasury shares and the issue of cash bonuses; the plan, called the “Retention Plan 2011 – 2013 of Biesse S.p.A.” allows for the payment of cash bonuses and the free issue of treasury shares to beneficiaries dependent on the achievement of financial and economic objectives and the emeasurement of their personal performance. The number of treasury shares allocated to this Retention Plan amounts to 26,794. The effect on the 2010 income statement is equal to € 21,000.
It should also be noted that on the basis of the agreement signed regarding the purchase of the outstanding share capital of MC S.r.l., in May 2009, 225,000 Biesse shares were exchanged with the seller as consi-deration for the purchase. This sale led to an increase in equity of € 2,163 thousand and a corresponding decrease in equity of € 1,081 thousand (given the difference between the carrying amount of the shares sold and their fair value at the date of the transaction). The following table shows a summary of treasury shares held in treasury at 31/12/2010.
annual report 2010
2010
Number of shares 486,359
Carrying amount (Euro) 4,675,804
Percent of share capital 1.78%

11� 113notes
annual report 2010
30. net financial indebtedness
At end-December 2010 Group net indebtedness was significantly lower at € 18.9 million (gearing = 0.15), down by €13.8, compared with the position at end-December 2009.
In the absence of significant non-recurring factors, the result is attributable to the improvement in net working capital and the return to positive EBITDA.
31. finance lease liabilities
At 31 December 2010, the amount of unutilised credit lines was about € 97 million.
Group bank debt fell by € 16,820 thousand compared with the situation at 31 December 2009. The current proportion of debt is composed of overdrafts and current account advances, while the non-current proportion is composed of committed medium-term credit lines (18-36 months) without financial-equity covenants and with no claim on the Group’s substantial property assets.
Please refer to the Directors’ Report for more detail regarding the trend in the net financial position and the analysis of the cash flow statement.
€ ‘000 31 December 2010 31 December 2009
Financial assets: 25,812 31,148
Liquidity 25,812 31,148
Short term finance lease liabilities (2,217) (2,290)
Short term bank and other financial liabilities (33,535) (42,988)
Short Term Net Financial Indebtedness (9,940) (14,130)
M/L term finance lease liabilities (2,998) (5,225)
M/L term bank debt (5,983) (13,349)
Medium/Long Term Net Financial Indebtedness (8,981) (18,575)
NET FINANCIAL INDEBTEDNESS (18,921) (32,704)
31 December 2010
31 December 2009
31 December 2010
31 December 2009
Minimum payments due for leasing
Present value of minimum payments due for leasing
Due within a year 2,441 2,465 2,217 2,290
Due after one year but within five years 1,825 3,899 1,339 3,265
Due after the fifth year 1,888 2,291 1,659 1,960
6,154 8,655 5,215 7,515
Charges deducted for future financial expense (940) (1,140) N/A N/A
5,215 7,515 5,215 7,515
Deducted: amount due within one year (2,217) (2,290)
Amount of debt due after 12 months 2,998 5,225
28. dividendsGiven that the company reported a loss for the financial year 2010, the Board of Directors agreed to propose to shareholders that no dividend should be distributed for the 2010 financial year.
29. overdrafts and bank loansThe table below indicates the breakdown of payables relating to bank overdrafts and loans.
These liabilities are payable as follows:
The average interest rate on loans is as follows:
annual report 2010
€ ‘000 31 December 2010 31 December 2009
Bank overdrafts and other short-term loans 1.5% 2.6%
Mortgages 2.5% 2.8%
€ ‘000 31 December 2010 31 December 2009
Bank overdrafts and financing 25,714 4,129
Mortgages without guarantees 7,821 38,859
Current liabilities 33,535 42,988
Loans 0 1,342
Mortgages without guarantees 5,826 12,007
Derivatives 157 -
Non-current liabilities 5,983 13,349
TOTAL 39,518 56,338
€ ‘000 31 December 2010 31 December 2009
On demand or within one year 33,535 42,988
Within two years 4,316 7,763
Within three years 355 4,031
Within four years 358 90
Within five years 301 9�
After five years 653 1,374
39,518 56,338
ANALYSIS OF BANK DEBT BY CURRENCY € ‘000 31 December 2010 31 December 2009
Euro 33,563 53,175
Indian Rupee 3,178 1,947
US Dollar 1,497 3
Swiss Franc 1,280 1,213
39,518 56,338

114 115notes
annual report 2010
Assumptions used for the calculation:
Average number of employees
The average number of employees in the 2010 financial year (including temporary staff) was 2,332 (2,341 in 2009), detailed as follows:
33. deferred tax assets and liabilities
The following indicates the main items of deferred tax assets and liabilities.
At the reporting date the Group had unutilised prior year tax losses of about € 13 million (€ 11 million at the end of the previous year). These losses relate to subsidiaries and there are no reasonable grounds to expect a recovery of these amounts in the short term.In addition to the deferred taxes recognised in the income statement for the year, deferred tax liabilities of € 47,000 were imputed directly to equity (€ 35,000 at the end of the previous year).
31 December 2010 31 December 2009
Blue collars 838 783
White collars 1,457 1,516
Managers 37 4�
TOTAL 2,332 2,341
€ ‘000 31 December 2010 31 December 2009
Discount rate used to determine the obligation 4.66% 4.5%
Inflation rate 1.50% 1.5%
€ ‘000 31 December 2010 31 December 2009
Deferred tax assets 19,295 18,233
Deferred tax liabilities (3,086) (2,429)
NET DEFERRED TAx ASSETS 16,210 15,805
€ ‘000 31 December 2010 31 December 2009
Accrual to provisions for risks and charges 4,690 6,322
Infragroup profits included in the amount of inventories closing 1,251 1,246
Recoverable tax losses 11,134 8,204
Other 2,220 2,460
Deferred tax assets 19,295 18,233
Amortisation 1,248 938
Capitalised costs 91 366
Goods under finance lease 53 55
Other 1,694 1,070
Deferred tax liabilities 3,086 2,429
NET DEFERRED TAx ASSETS 16,210 15,805
Finance lease liabilities mainly relate to buildings (and related plant and equipment) the current minimum payment value of which due at 31/12/2010 was € 5,215 thousand (€ 2,217 thousand of which was due within 12 months). The balance sheet figure relates mainly to two contracts relating to the acquisition of buildings: the first of ten years duration, signed by Biesse S.p.A., with a residual liability of € 2,061 thousand, expiring in June 2012 and an average term rate of 4.3%; the second with original term of 12 years, signed by MC S.r.l. (now incorporated in HSD Spa) which has a residual liability of € 3,011 thousand, expiring in December 2019 and an average effective rate of 5.5%. In addition to this are contracts, of minor individual value, relating to the purchase of machine tools for internal use by Biesse S.p.A. and MC S.r.l., with an average term of five years and an average effective rate of 4.8%.The rates of interest are set at the date the contracts are signed and are subject to fluctuation as they are tied to the trend of the cost of money. All existing leasing contracts are repayable through a constant rate plan and contractually no changes are expected to the original plan.All contracts are denominated in Euro.Finance lease liabilities are guaranteed to the issuer through rights on the goods leased.
32. post-employment benefit Defined contribution plans
As a result of the Social security reform the proportion vesting from 1 January 2007, at the discretion of em-ployees, will be assigned to pension funds or transferred by the company to the public treasury fund managed by INPS and will, once the employees choice has been formalized, be categorized as a defined contribution scheme (and therefore no longer subject to actuarial measurement).
Because of the aforementioned circumstances the total expense provided for at year end amounts to € 4,712 thousand.
Defined benefit plans
The Biesse Group accrued € 10,855 thousand, this being the present value of post-employment benefits, due at the year end to employees of the Italian companies of the Group and composed of accrual to the post-employment.benefit.
The costs for the year are included in personnel expenses.
The change of the year relating to the present value of obligations relating to post-employment benefits are as follows:
€ ‘000 31 December 2010 31 December 2009
Current labour cost 27 57
Financial expense 190 4��
217 479
€ ‘000 31 December 2010 31 December 2009
Opening liabilities 11,857 12,718
Current services 27 57
Financial expense 190 4��
Benefits paid out (1,219) (1,340)
Closing liabilities 10,855 11,857
annual report 2010
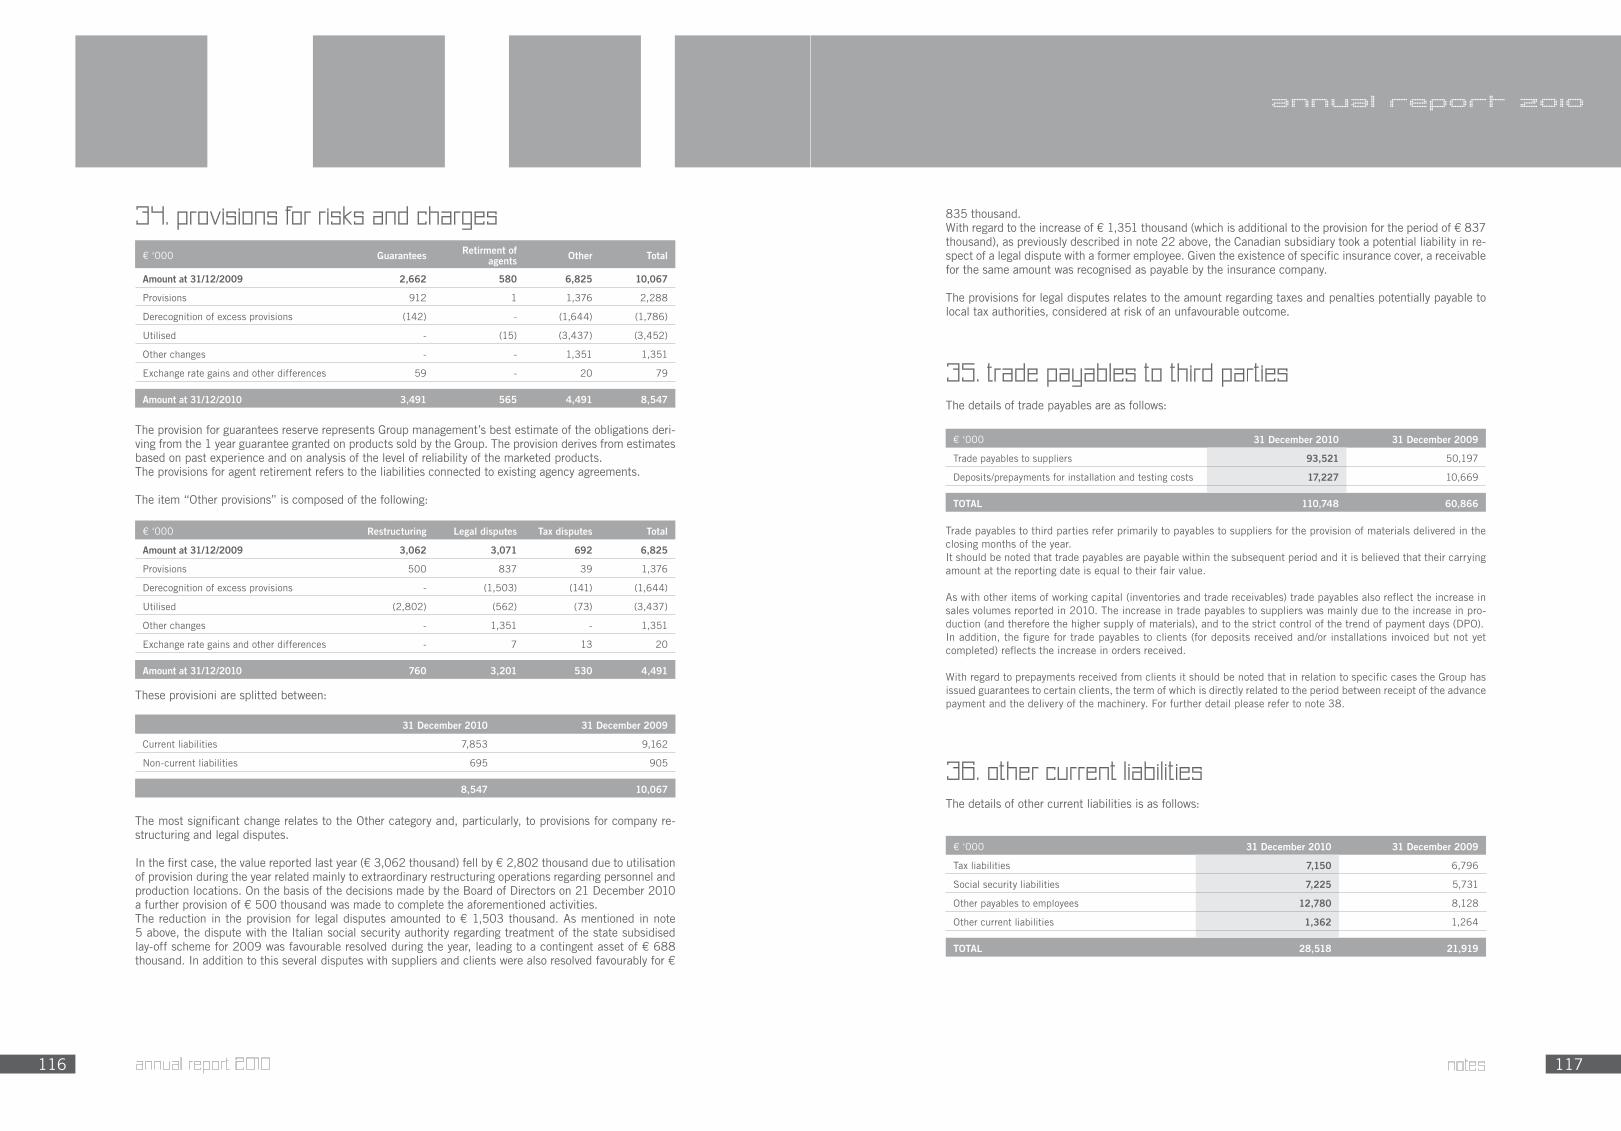
116 117notes
annual report 2010
835 thousand.With regard to the increase of € 1,351 thousand (which is additional to the provision for the period of € 837 thousand), as previously described in note 22 above, the Canadian subsidiary took a potential liability in re-spect of a legal dispute with a former employee. Given the existence of specific insurance cover, a receivable for the same amount was recognised as payable by the insurance company.
The provisions for legal disputes relates to the amount regarding taxes and penalties potentially payable to local tax authorities, considered at risk of an unfavourable outcome.
35. trade payables to third partiesThe details of trade payables are as follows:
Trade payables to third parties refer primarily to payables to suppliers for the provision of materials delivered in the closing months of the year.It should be noted that trade payables are payable within the subsequent period and it is believed that their carrying amount at the reporting date is equal to their fair value.
As with other items of working capital (inventories and trade receivables) trade payables also reflect the increase in sales volumes reported in 2010. The increase in trade payables to suppliers was mainly due to the increase in pro-duction (and therefore the higher supply of materials), and to the strict control of the trend of payment days (DPO). In addition, the figure for trade payables to clients (for deposits received and/or installations invoiced but not yet completed) reflects the increase in orders received.
With regard to prepayments received from clients it should be noted that in relation to specific cases the Group has issued guarantees to certain clients, the term of which is directly related to the period between receipt of the advance payment and the delivery of the machinery. For further detail please refer to note 38.
36. other current liabilitiesThe details of other current liabilities is as follows:
€ ‘000 31 December 2010 31 December 2009
Trade payables to suppliers 93,521 50,197
Deposits/prepayments for installation and testing costs 17,227 10,669
TOTAL 110,748 60,866
€ ‘000 31 December 2010 31 December 2009
Tax liabilities 7,150 6,796
Social security liabilities 7,225 5,731
Other payables to employees 12,780 8,128
Other current liabilities 1,362 1,264
TOTAL 28,518 21,919
34. provisions for risks and charges
The provision for guarantees reserve represents Group management’s best estimate of the obligations deri-ving from the 1 year guarantee granted on products sold by the Group. The provision derives from estimates based on past experience and on analysis of the level of reliability of the marketed products.The provisions for agent retirement refers to the liabilities connected to existing agency agreements.
The item “Other provisions” is composed of the following:
These provisioni are splitted between:
The most significant change relates to the Other category and, particularly, to provisions for company re-structuring and legal disputes.
In the first case, the value reported last year (€ 3,062 thousand) fell by € 2,802 thousand due to utilisation of provision during the year related mainly to extraordinary restructuring operations regarding personnel and production locations. On the basis of the decisions made by the Board of Directors on 21 December 2010 a further provision of € 500 thousand was made to complete the aforementioned activities. The reduction in the provision for legal disputes amounted to € 1,503 thousand. As mentioned in note 5 above, the dispute with the Italian social security authority regarding treatment of the state subsidised lay-off scheme for 2009 was favourable resolved during the year, leading to a contingent asset of € 688 thousand. In addition to this several disputes with suppliers and clients were also resolved favourably for €
€ ‘000 Guarantees Retirment of agents Other Total
Amount at 31/12/2009 2,662 580 6,825 10,067
Provisions 91� 1 1,376 2,288
Derecognition of excess provisions (142) - (1,644) (1,786)
Utilised - (15) (3,437) (3,452)
Other changes - - 1,351 1,351
Exchange rate gains and other differences 59 - �0 79
Amount at 31/12/2010 3,491 565 4,491 8,547
31 December 2010 31 December 2009
Current liabilities 7,853 9,162
Non-current liabilities 695 905
8,547 10,067
annual report 2010
€ ‘000 Restructuring Legal disputes Tax disputes Total
Amount at 31/12/2009 3,062 3,071 692 6,825
Provisions 500 837 39 1,376
Derecognition of excess provisions - (1,503) (141) (1,644)
Utilised (2,802) (562) (73) (3,437)
Other changes - 1,351 - 1,351
Exchange rate gains and other differences - 7 13 �0
Amount at 31/12/2010 760 3,201 530 4,491
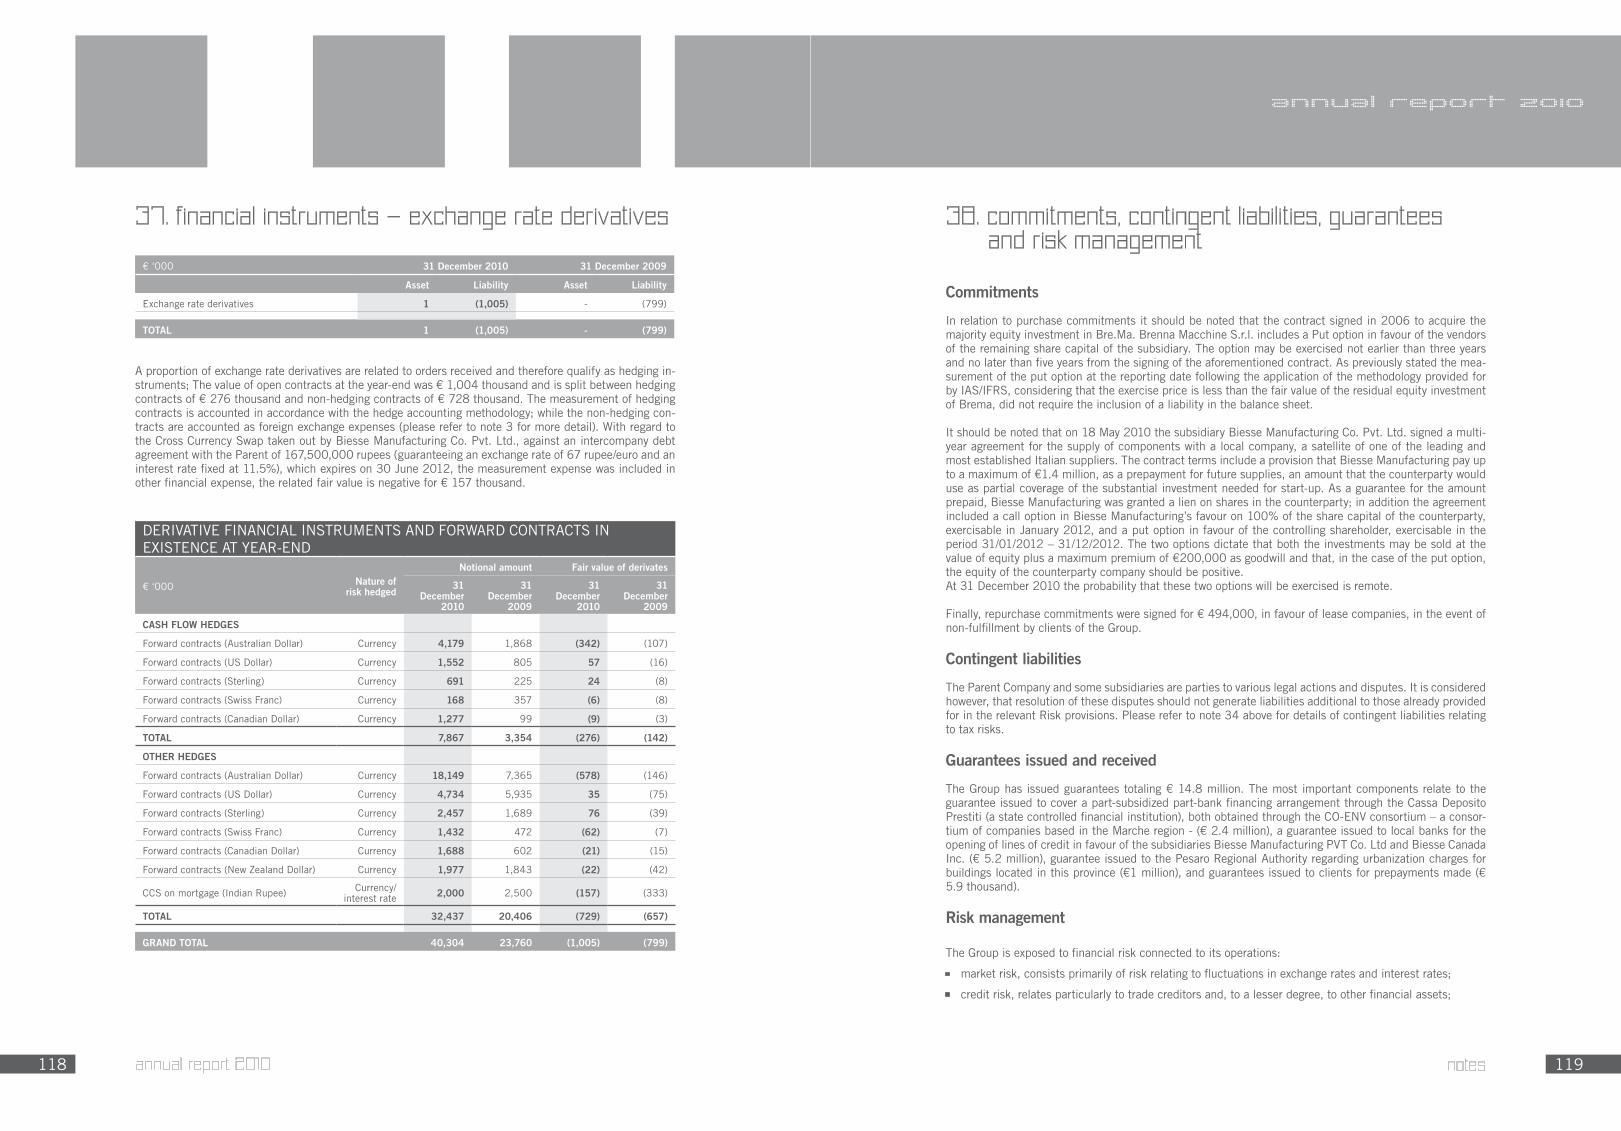
118 119notes
annual report 2010
38. commitments, contingent liabilities, guarantees and risk management
Commitments
In relation to purchase commitments it should be noted that the contract signed in 2006 to acquire the majority equity investment in Bre.Ma. Brenna Macchine S.r.l. includes a Put option in favour of the vendors of the remaining share capital of the subsidiary. The option may be exercised not earlier than three years and no later than five years from the signing of the aforementioned contract. As previously stated the mea-surement of the put option at the reporting date following the application of the methodology provided for by IAS/IFRS, considering that the exercise price is less than the fair value of the residual equity investment of Brema, did not require the inclusion of a liability in the balance sheet.
It should be noted that on 18 May 2010 the subsidiary Biesse Manufacturing Co. Pvt. Ltd. signed a multi-year agreement for the supply of components with a local company, a satellite of one of the leading and most established Italian suppliers. The contract terms include a provision that Biesse Manufacturing pay up to a maximum of €1.4 million, as a prepayment for future supplies, an amount that the counterparty would use as partial coverage of the substantial investment needed for start-up. As a guarantee for the amount prepaid, Biesse Manufacturing was granted a lien on shares in the counterparty; in addition the agreement included a call option in Biesse Manufacturing’s favour on 100% of the share capital of the counterparty, exercisable in January 2012, and a put option in favour of the controlling shareholder, exercisable in the period 31/01/2012 – 31/12/2012. The two options dictate that both the investments may be sold at the value of equity plus a maximum premium of €200,000 as goodwill and that, in the case of the put option, the equity of the counterparty company should be positive. At 31 December 2010 the probability that these two options will be exercised is remote.
Finally, repurchase commitments were signed for € 494,000, in favour of lease companies, in the event of non-fulfillment by clients of the Group.
Contingent liabilities
The Parent Company and some subsidiaries are parties to various legal actions and disputes. It is considered however, that resolution of these disputes should not generate liabilities additional to those already provided for in the relevant Risk provisions. Please refer to note 34 above for details of contingent liabilities relating to tax risks.
Guarantees issued and received
The Group has issued guarantees totaling € 14.8 million. The most important components relate to the guarantee issued to cover a part-subsidized part-bank financing arrangement through the Cassa Deposito Prestiti (a state controlled financial institution), both obtained through the CO-ENV consortium – a consor-tium of companies based in the Marche region - (€ 2.4 million), a guarantee issued to local banks for the opening of lines of credit in favour of the subsidiaries Biesse Manufacturing PVT Co. Ltd and Biesse Canada Inc. (€ 5.2 million), guarantee issued to the Pesaro Regional Authority regarding urbanization charges for buildings located in this province (€1 million), and guarantees issued to clients for prepayments made (€ 5.9 thousand).
Risk management
The Group is exposed to financial risk connected to its operations:
- market risk, consists primarily of risk relating to fluctuations in exchange rates and interest rates;
- credit risk, relates particularly to trade creditors and, to a lesser degree, to other financial assets;
annual report 2010
37. financial instruments – exchange rate derivatives
A proportion of exchange rate derivatives are related to orders received and therefore qualify as hedging in-struments; The value of open contracts at the year-end was € 1,004 thousand and is split between hedging contracts of € 276 thousand and non-hedging contracts of € 728 thousand. The measurement of hedging contracts is accounted in accordance with the hedge accounting methodology; while the non-hedging con-tracts are accounted as foreign exchange expenses (please refer to note 3 for more detail). With regard to the Cross Currency Swap taken out by Biesse Manufacturing Co. Pvt. Ltd., against an intercompany debt agreement with the Parent of 167,500,000 rupees (guaranteeing an exchange rate of 67 rupee/euro and an interest rate fixed at 11.5%), which expires on 30 June 2012, the measurement expense was included in other financial expense, the related fair value is negative for € 157 thousand.
€ ‘000 31 December 2010 31 December 2009
Asset Liability Asset Liability
Exchange rate derivatives 1 (1,005) - (799)
TOTAL 1 (1,005) - (799)
DERIVATIVE FINANCIAL INSTRUMENTS AND FORWARD CONTRACTS IN EXISTENCE AT YEAR-END
€ ‘000 Nature of risk hedged
Notional amount Fair value of derivates
31 December
2010
31 December
2009
31 December
2010
31 December
2009
CASH FLOW HEDGES
Forward contracts (Australian Dollar) Currency 4,179 1,868 (342) (107)
Forward contracts (US Dollar) Currency 1,552 805 57 (16)
Forward contracts (Sterling) Currency 691 ��5 24 (8)
Forward contracts (Swiss Franc) Currency 168 357 (6) (8)
Forward contracts (Canadian Dollar) Currency 1,277 99 (9) (3)
TOTAL 7,867 3,354 (276) (142)
OTHER HEDGES
Forward contracts (Australian Dollar) Currency 18,149 7,365 (578) (146)
Forward contracts (US Dollar) Currency 4,734 5,935 35 (75)
Forward contracts (Sterling) Currency 2,457 1,689 76 (39)
Forward contracts (Swiss Franc) Currency 1,432 47� (62) (7)
Forward contracts (Canadian Dollar) Currency 1,688 60� (21) (15)
Forward contracts (New Zealand Dollar) Currency 1,977 1,843 (22) (42)
CCS on mortgage (Indian Rupee) Currency/interest rate 2,000 2,500 (157) (333)
TOTAL 32,437 20,406 (729) (657)
GRAND TOTAL 40,304 23,760 (1,005) (799)
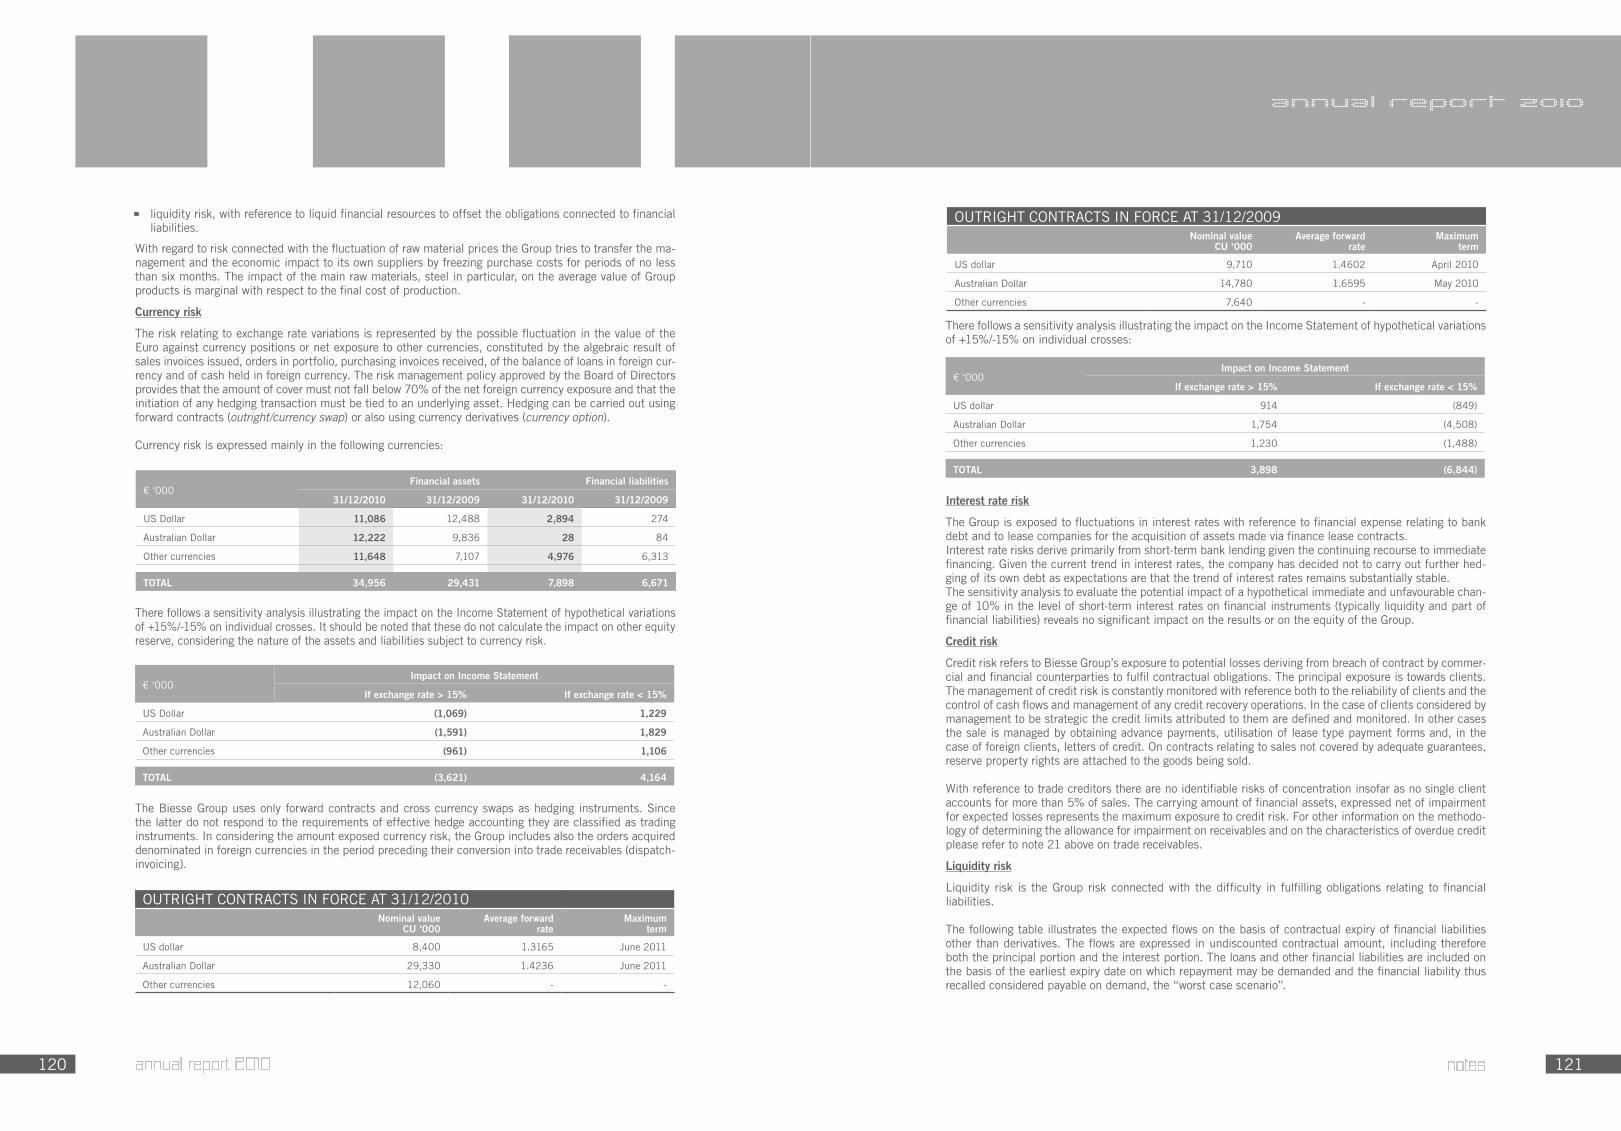
1�0 1�1
There follows a sensitivity analysis illustrating the impact on the Income Statement of hypothetical variations of +15%/-15% on individual crosses:
Interest rate risk
The Group is exposed to fluctuations in interest rates with reference to financial expense relating to bank debt and to lease companies for the acquisition of assets made via finance lease contracts.Interest rate risks derive primarily from short-term bank lending given the continuing recourse to immediate financing. Given the current trend in interest rates, the company has decided not to carry out further hed-ging of its own debt as expectations are that the trend of interest rates remains substantially stable.The sensitivity analysis to evaluate the potential impact of a hypothetical immediate and unfavourable chan-ge of 10% in the level of short-term interest rates on financial instruments (typically liquidity and part of financial liabilities) reveals no significant impact on the results or on the equity of the Group.
Credit risk
Credit risk refers to Biesse Group’s exposure to potential losses deriving from breach of contract by commer-cial and financial counterparties to fulfil contractual obligations. The principal exposure is towards clients. The management of credit risk is constantly monitored with reference both to the reliability of clients and the control of cash flows and management of any credit recovery operations. In the case of clients considered by management to be strategic the credit limits attributed to them are defined and monitored. In other cases the sale is managed by obtaining advance payments, utilisation of lease type payment forms and, in the case of foreign clients, letters of credit. On contracts relating to sales not covered by adequate guarantees, reserve property rights are attached to the goods being sold.
With reference to trade creditors there are no identifiable risks of concentration insofar as no single client accounts for more than 5% of sales. The carrying amount of financial assets, expressed net of impairment for expected losses represents the maximum exposure to credit risk. For other information on the methodo-logy of determining the allowance for impairment on receivables and on the characteristics of overdue credit please refer to note 21 above on trade receivables.
Liquidity risk
Liquidity risk is the Group risk connected with the difficulty in fulfilling obligations relating to financial liabilities.
The following table illustrates the expected flows on the basis of contractual expiry of financial liabilities other than derivatives. The flows are expressed in undiscounted contractual amount, including therefore both the principal portion and the interest portion. The loans and other financial liabilities are included on the basis of the earliest expiry date on which repayment may be demanded and the financial liability thus recalled considered payable on demand, the “worst case scenario”.
notes
annual report 2010
€ ‘000Impact on Income Statement
If exchange rate > 15% If exchange rate < 15%
US dollar 914 (849)
Australian Dollar 1,754 (4,508)
Other currencies 1,230 (1,488)
TOTAL 3,898 (6,844)
OUTRIGHT CONTRACTS IN FORCE AT 31/12/2009Nominal value
CU ‘000Average forward
rateMaximum
term
US dollar 9,710 1.4602 April 2010
Australian Dollar 14,780 1.6595 May 2010
Other currencies 7,640 - -
- liquidity risk, with reference to liquid financial resources to offset the obligations connected to financial liabilities.
With regard to risk connected with the fluctuation of raw material prices the Group tries to transfer the ma-nagement and the economic impact to its own suppliers by freezing purchase costs for periods of no less than six months. The impact of the main raw materials, steel in particular, on the average value of Group products is marginal with respect to the final cost of production.
Currency risk
The risk relating to exchange rate variations is represented by the possible fluctuation in the value of the Euro against currency positions or net exposure to other currencies, constituted by the algebraic result of sales invoices issued, orders in portfolio, purchasing invoices received, of the balance of loans in foreign cur-rency and of cash held in foreign currency. The risk management policy approved by the Board of Directors provides that the amount of cover must not fall below 70% of the net foreign currency exposure and that the initiation of any hedging transaction must be tied to an underlying asset. Hedging can be carried out using forward contracts (outright/currency swap) or also using currency derivatives (currency option).
Currency risk is expressed mainly in the following currencies:
There follows a sensitivity analysis illustrating the impact on the Income Statement of hypothetical variations of +15%/-15% on individual crosses. It should be noted that these do not calculate the impact on other equity reserve, considering the nature of the assets and liabilities subject to currency risk.
The Biesse Group uses only forward contracts and cross currency swaps as hedging instruments. Since the latter do not respond to the requirements of effective hedge accounting they are classified as trading instruments. In considering the amount exposed currency risk, the Group includes also the orders acquired denominated in foreign currencies in the period preceding their conversion into trade receivables (dispatch-invoicing).
OUTRIGHT CONTRACTS IN FORCE AT 31/12/2010Nominal value
CU ‘000Average forward
rateMaximum
term
US dollar 8,400 1.3165 June 2011
Australian Dollar 29,330 1.4236 June 2011
Other currencies 12,060 - -
€ ‘000Financial assets Financial liabilities
31/12/2010 31/12/2009 31/12/2010 31/12/2009
US Dollar 11,086 12,488 2,894 �74
Australian Dollar 12,222 9,836 28 84
Other currencies 11,648 7,107 4,976 6,313
TOTAL 34,956 29,431 7,898 6,671
annual report 2010
€ ‘000Impact on Income Statement
If exchange rate > 15% If exchange rate < 15%
US Dollar (1,069) 1,229
Australian Dollar (1,591) 1,829
Other currencies (961) 1,106
TOTAL (3,621) 4,164

1�� 1�3
39. operating lease contracts Contracts involving the Group as lessee
At the reporting date, the amount of lease charges still owed by the Group for operating lease contracts is as follows:
These contracts relate to the lease of buildings (for industrial or commercial use), motor vehicles and office equipment. The leases have an average term of three years and the instalments are fixed for the same period of time.
Contracts involving the Group as lessor
40. transactions not involving changes in cash flowIn 2010, there were no significant transactions not involving changes in cash flow.
41. atypical and unusual transactionsNo operations of this nature were reported in 2010.
42. events after the reporting datePlease refer to the note in the Directors report for details of events after the reporting date.
notes
annual report 2010
€ ‘000 31 December 2010 31 December 2009
Instalments paid during the year 6,394 6,599
TOTAL 6,394 6,599
€ ‘000 31 December 2010 31 December 2009
FINANCIAL ASSETS
Designated at fair value through profit or loss
Derivative instrument financial assets 1 -
Loans and receivables measured at amortised cost:
Trade receivables 90,390 77,307
Other assets 4,361 2,571
- other financial assets and non-current receivables 712 591
- other current assets 3,649 1,979
Cash and cash equivalents 25,812 31,148
FINANCIAL LIABILITIES
Designated at fair value through profit or loss
Derivative instrument financial liabilities 848 799
Measured at amortised cost :
Trade payables 93,907 50,308
Bank debt, finance lease and other financial liabilities 44,733 63,853
Other current liabilities 20,005 13,867
€ ‘000 31 December 2010 31 December 2009
Within one year 4,337 4,021
Between one and five years 6,003 4,283
After five years �69 ��5
TOTAL 10,609 8,529
The group monitors liquidity risk through the daily control of net flows in order to guarantee efficient mana-gement of financial resources.
The amount of trade receivables and the conditions attached to them combine to provide a balanced working capital and, in particular, coverage of payables to suppliers.The Group has available credit lines for cash recall (short-term financing) provided by leading Italian banks totalling € 93 million – of which € 68 million has not been utilised.
Classification of financial instruments
The following table illustrates the type of financial instruments in the financial statement:
The recognised amount of financial assets and liabilities described above are shown at or approximate their fair value.
31/12/2010
€ ‘000 Less than 30 days
30-180 days
180 days-1year
1-5 years
After 5 years Total
Trade and other payables 25,039 101,953 4,413 479 - 131,884
Finance lease liabilities 7 1,216 1,227 1,840 1,888 6,178
Overdrafts and bank loans 19,282 7,488 7,005 5,429 665 39,869
TOTAL 44,329 110,657 12,644 7,748 2,553 177,931
31/12/2009
€ ‘000 Less than 30 days
30-180 days
180 days-1year
1-5 years
After 5 years Total
Trade and other payables 16,175 45,799 2,200 - - 64,174
Finance lease liabilities 7� 1,306 1,240 3,898 2,291 8,807
Overdrafts and bank loans 7,324 9,636 26,759 12,283 1,376 57,378
TOTAL 23,571 56,740 30,199 16,181 3,667 130,359
annual report 2010
€ ‘000 31 December 2010 31 December 2009
Instalments received during the year 118 40
TOTAL 118 40

1�4 1�5notes
annual report 2010
€ ‘000 Costs 2010
Costs 2009
Revenues 2010
Revenues 2009
Parent
Bifin SRL - - 10 10
Other related companies
Fincobi S.r.l. 10 10 1 1
Members of the Board of Directors
Members of the Board of Directors 1,561 1,594 - -
Members of the Board of Statutory Auditors
Members of the Board of Statutory Auditors 96 70 - -
Otherrelated parties
TOTAL RELATED PARTY TRANSACTIONS 1,667 1,674 11 11
€ ‘000 Receivables 2010
Receivables 2009
Payables 2010
Payables 2009
Parent
Bifin SRL 586 574 - -
Other related companies
Edilriviera Srl - - �48 -
Members of the Board of Directors
Members of the Board of Directors 13 - 11 39
Members of the Board of Statutory Auditors
Members of the Board of Statutory Auditors - - 113 70
Otherrelated parties
TOTAL RELATED PARTY TRANSACTIONS 599 574 371 109
The contractual terms agreed with the aforementioned related parties are in line with those theoretically obtainable in negotiations with third parties.
The remuneration paid to Directors is fixed by the Remuneration Committee on the basis of average market rates.
No relevant transactions were reported in relation to the parent Bi.Fin. Srl.
Other transactions with related parties have also been conducted under contractual conditions in line with the terms that would theoretically apply in dealings with third parties.
Payables will be paid in cash. No guarantee has been given or received.
43. related party transactionsThe Group is directly controlled by Bi. Fin. S.r.l. (operating in Italy) and indirectly by Mr. Giancarlo Selci (resident in Italy).
Transactions between Biesse S.p.A. and its subsidiaries, which are entities related to the parent, have been eliminated from the consolidated financial statements and are not illustrated in these notes. Details of tran-sactions between the Group and other related entities are indicated below.
annual report 2010
REMUNERATION OF DIRECTORS, GENERAL MANAGERS, DIRECTORS WITH STRATEGIC RESPONSIBILITY AND MEMBERS OF THE BOARD OF STATUTORY AUDITORS
POSITION REMUNERATION
€ ‘000 FeesNon-
monetary benefits
Bonuses and other incentives
Other remunera-
tion
Name Position Duration of mandate
Selci Roberto Chairman 29/04/2012 553 3
Selci Giancarlo Managing Director 29/04/2012 375
Parpajola Alessandra Director 29/04/2012 ��3 3
Sibani Leone Board member* 29/04/2012 30 6
Garattoni Giampaolo Board member* 29/04/2012 �1 3
Giordano Salvatore Board member* 29/04/2012 �0 �
Porcellini Stefano Board member 29/04/2012 71 17 77 157
TOTAL 1,293 23 77 168
Ciurlo Giovanni Statutory auditor 29/04/2012 5�
Franzoni Adriano Statutory auditor 29/04/2012 30
Amadori Cristina Statutory auditor 29/04/2012 14
TOTAL 96
* Independent directors.
The Directors with strategic responsibilities have been identified as the managers of the following principal segments of the Group; Wood, Glass and Stone, Service and Mechatronics managed respectively by Luigi De Vito, Cesare Tinti, Rodolfo Scatigna and Fabrizio Pierini. The remuneration received by the managers with strategic responsibilities, including salaries, non-cash benefits, bonuses and other remuneration amounts to € 565 thousand.It should be noted that on 22 October 2010 Mr. Giovanni Barra resigned from his position as Chief Executive of the Group. During the financial year 2010, Mr. Barra received € 1,203 thousand, of which € 900 thou-sand refers to early retirement incentives and new contract settlement and € 303 thousand refers to salary and remuneration for his duties as Chief Executive.
Pesaro, 16/03/2011 Chairman of the Board of Directors Roberto Selci ddddddd

1�6 1�7appendix
annual report 2010
INCOME STATEMENT IN ACCORDANCE WITH CONSOB RESOLUTION NO, 15519 OF 27 JULY 2006
December 2010
“of whichwith”
“relatedparties”
Weight %
December2009
“of whichwith”
“relatedparties”
Weight %
Revenue 327,522 - - 268,006 - -
Other operating income 4,316 11 0.3% 4,699 11 0.2%
Change in the inventories of finished and semi-finished goods and work in progress
5,897 - 0.0% (23,414) - -
Purchase of raw materials and consumables (143,639) - 0.0% (105,839) - -
Personnel expense (107,683) (245) 0.2% (91,587) (316) 0.3%
Personnel expense - non recurring - - - (911) - -
Other operating expenses (70,714) (1,422) 2.0% (59,084) (1,358) 2.3%
Other operating expenses- non recurring - - - (306) - -
Depreciation and amortisation (12,454) - - (13,318) - -
Provisions (2,572) - - (6,120) - -
Provisions - non recurring (500) - - (4,062) - -
Impairment losses (68) - - (52) - -
Impairment losses- non recurring - - - (991) - -
Operating profit 106 (1,656) (1.562.3)% (32,979) (1,663) 5.0%
Finance income 316 - - �76 - -
Finance expense (2,473) - - (3,481) - -
Exchange Rate Gains/(Losses) (478) - - (131) - -
Pre-tax loss (2,529) (1,656) 65.5% (36,314) (1,663) 4.6%
Income Taxes (3,211) - - 9,122 - -
Losses for the year (5,741) (1,656) 28.8% (27,192) (1,663) 6.1%
annual report 2010
APPENDIx 1
STATEMENT OF FINANCIAL POSITION IN ACCORDANCE WITH CONSOB RESOLUTION NO. 15519 OF 27 JULY 2006
31 December
2010
“of whichwith”
“relatedparties”
Weight %
31 December
2009
“of whichwith”
“relatedparties”
Weight %
ASSETS
Non-current assets
Property, plant and equipment 48,266 - - 50,061 - -
Other items of property, plant and equipment 7,569 - - 7,370 - -
Goodwill 17,921 - - 17,438 - -
Other intangible assets 26,360 - - 23,635 - -
Deferred tax assets 19,295 - - 18,233 - -
Other financial assets and non-current receivables 738 - - 616 - -
120,149 - - 117,353 - -
Current assets
Inventories 81,326 - - 63,242 - -
Trade receivables 90,390 �5 - 77,307 - -
Other current assets 14,890 574 3.9% 10,648 574 5.4%
Derivatives 1 - - - - -
Cash and cash equivalents 25,812 - - 31,148 - -
212,419 599 0.3% 182,345 574 0.3%
TOTAL ASSETS 332,568 599 0.2% 299,698 574 0.2%

1�8 1�9
annual report 2010
STATEMENT OF FINANCIAL POSITION IN ACCORDANCE WITH CONSOB RESOLUTION NO. 15519 OF 27 JULY 2006
31 December
2010
“of whichwith”
“relatedparties”
Weight %
31 December
2009
“of whichwith”
“relatedparties”
Weight %
EQUITY AND LIABILITIES
SHARE CAPITAL AND RESERVES
Share capital 27,393 - - 27,393 - -
(treasury shares) (4,676) - - (4,676) - -
Share Capital reserves 36,202 - - 36,202 - -
Hedging and translation reserve (535) - - (2,280) - -
Other reserves 69,703 - - 96,391 - -
Losses of the year (5,392) - - (26,696) - -
Equity attributable to shareholders of the parent 122,695 - - 126,334 - -
Non-controlling interests ��0 - - 517 - -
TOTAL EQUITY 122,914 - - 126,850 - -
Non-current liabilities
Post-employment benefit 10,855 - - 11,857 - -
Deferred tax liabilities 3,086 - - 2,429 - -
Medium and long-term bank loans and other borrowings 5,826 - - 13,349 - -
Finance lease liabilities 2,998 - - 5,225 - -
Provisions for risks and charges 695 - - 905 - -
Derivatives 157 - - - - -
23,616 - - 33,765 - -
Current liabilities
Trade payables 111,134 371 0.3% 60,977 10� 0.2%
Other current liabilities 28,518 - - 21,926 7 -
Income taxes 1,933 - - 941 - -
Finance lease liabilities 2,217 - - 2,290 - -
Bank overdrafts and loans 33,535 - - 42,988 - -
Provisions for risks and charges 7,853 - - 9,162 - -
Derivatives 848 - - 799 - -
186,038 371 0.2% 139,083 109 0.1%
LIABILITIES 209,654 371 0.2% 172,848 109 0.1%
TOTAL EQUITY AND LIABILITIES 332,568 371 0.1% 299,698 109 -
annual report 2010
Certification of the Consolidated Financial Statements in accordance with art. 81-ter of Consob Resolution no. 11971 of 14 May 1999 and subsequent amendments and additions
1. The signatories Roberto Selci and Stefano Porcellini in their capacities as, respectively, Chairman and Managing Director and Manager with responsibility for preparing the accounts of Biesse SpA, guarantee, taking into account the provisions of art. 154-bis, paragraphs 3 and 4, of Decree Law no. 58 of 24 February 1998:
• the pertinence in relation to the characteristics of the business and
• the effective application of the administrative and accounting procedures for the preparation of the con-solidated financial statements during the 2010 financial year.
2. The administrative and accounting procedures for the formation of the consolidated financial statements to 31 December 2010 were defined and the evaluation of their appropriateness was conducted on the basis of rules and methodologies defined by Biesse consistent with the model of Internal Control – Integrated Fra-mework issue by the Committee of Sponsoring Organizations of the Treadway Commission which represents a reference framework for internationally accepted internal control systems.
3. In addition they testify that the financial statements to 31 December 2010:a) correspond to the results of the accounting books and records; b) are prepared in conformity with the international accounting principles issued by the International Ac-counting Standards Board, adopted by the European Commission according to the procedures provided for by art. 6 of Resolution (CE) no. 1606/2002 of the European Parliament and the Council of 19 July 2002 and in accordance with art 9 of Decree Law no 38/2005, according to which it is required to provide a true and correct representation of the capital, financial and economic situation of the issuer and of the group of entities included in the consolidation.
The Directors’ Report on operations incorporates a reliable analysis of the trend and the result for the period, and of the situation of the Issuer and the group of businesses included in the consolidation, together with the description of the main risks and uncertainties to which they are exposed.
16 March 2011
Chairman and Managing Director Chief Financial Officer Roberto Selci Stefano Porcellini
130 131