considerations for adding sas® visual analytics to an...
TRANSCRIPT
1
Paper SAS146-2014
Considerations for Adding SAS® Visual Analytics to an Existing SAS® Business Intelligence Deployment
Christine Vitron and James Holman, SAS Institute Inc.
ABSTRACT
If you have an existing SAS® Business Intelligence environment and you want to add SAS® Visual Analytics, you need to make some architectural choices. SAS Visual Analytics and SAS Business Intelligence can share certain components, such as a SAS® Metadata Server and the SAS Web Infrastructure Platform. Sharing metadata eliminates the need to create and maintain duplicate information, and it enables your users to take advantage of functionality that can be shared between SAS Visual Analytics and SAS Business Intelligence. Sharing the SAS Web Infrastructure Platform enables SAS middle-tier applications such as SAS® Visual Analytics Services and SAS® Web Report Studio to communicate with each other.
Intended for SAS architects and administrators, this paper explores supported architecture for SAS Visual Analytics and SAS Business Intelligence. The paper then identifies areas where the architecture can be shared as well as where resources should be kept separate. In addition, the paper offers recommendations and other considerations to keep in mind when you are managing shared resources.
INTRODUCTION
SAS Visual Analytics offers two types of deployment: distributed and non-distributed. Introduced in SAS Visual Analytics 5.1, a distributed deployment includes a cluster of high-performance computing nodes that use a co-located data provider. In addition to the SAS High-Performance Deployment of Hadoop, SAS Visual Analytics supports these three providers: Cloudera’s Distribution Including Apache Hadoop (CDH), the Pivotal Data Computing Appliance, the Teradata Data Warehouse Appliance, and Hortonworks Data Platform. The non-distributed deployment was introduced with SAS Visual Analytics 6.1 and is run on a single machine by using a SAS Workspace Server that runs locally with the SAS® LASR™ Analytic Server. Initially, both types of deployments were supported only in a Linux operating system environment. However, starting with the release of SAS Visual Analytics 6.2 on the SAS® 9.4 platform, support is available for a non-distributed deployment on a Microsoft Windows server. Regardless of the type of SAS Visual Analytics deployment that you plan to use, you can either set up SAS Visual Analytics entirely separate from your SAS Business Intelligence environment or you can create a single environment that shares certain components.
Written particularly for SAS architects and administrators, this paper describes the architecture of both a distributed and non-distributed SAS Visual Analytics environment as well as the architecture of a SAS Business Intelligence environment. In addition, the paper covers the following topics:
areas where SAS Visual Analytics and SAS Business Intelligence deployments can be shared
areas where SAS Visual Analytics and SAS Business Intelligence deployments should not be shared
considerations and recommendations to help you get the most out of your SAS Business Intelligence and SAS Visual Analytics environments
SAS® VISUAL ANALYTICS ARCHITECTURE
SAS Visual Analytics is primarily a web-based application that takes advantage of in-memory analytics.
SAS Visual Analytics includes several components that provide a range of functionality from data exploration and reporting to data preparation and administration:
Analysts can use SAS® Visual Analytics Explorer to explore data.
Report designers can use SAS® Visual Analytics Designer to create reports and dashboards.
Report designers can also use SAS® Visual Analytics Graph Builder to create graph templates that can be used in multiple reports and shared with other users.
Executives and other appropriate users can use the SAS Visual Analytics Viewer as well as native mobile viewers to surface reports and dashboards.
(list continued)
2
Data administrators can use SAS Visual Data Builder to prepare and load data into the environment.
System administrators can use SAS Visual Analytics Administrator to start and stop SAS® LASR™ Analytic Servers, to load data into memory, and to monitor the health of their distributed environments.
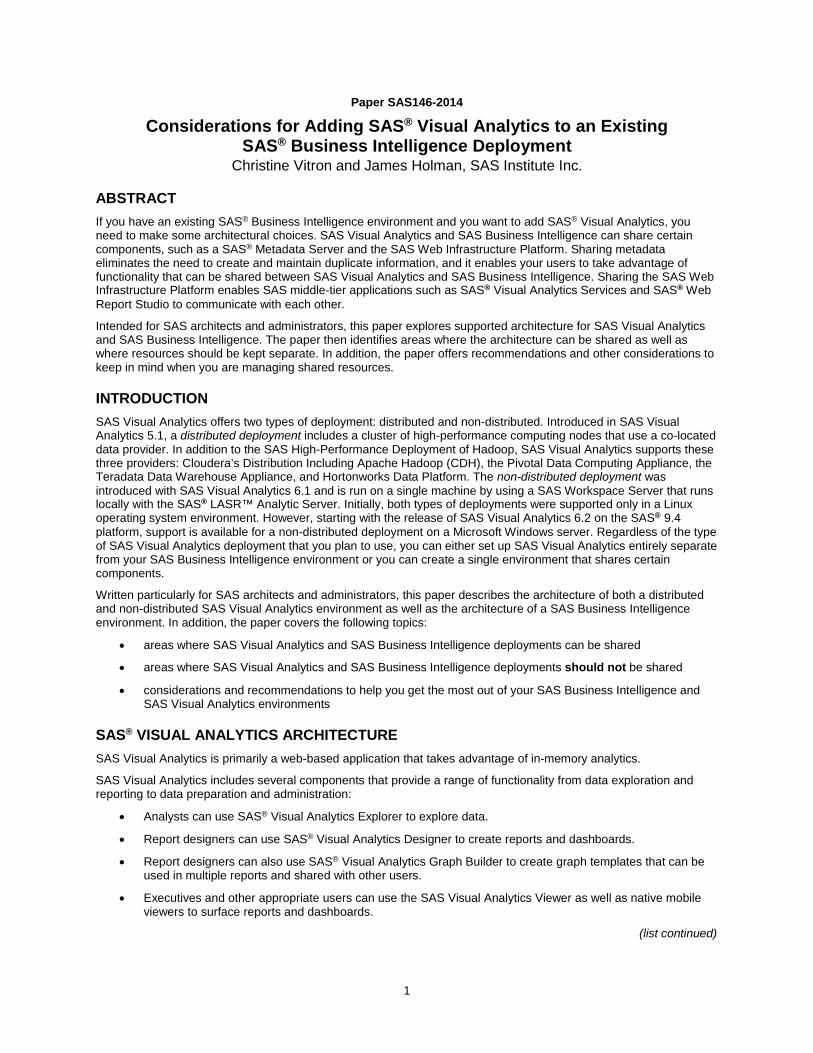
Figure 1 provides a graphical overview of the application’s entire architecture.
Figure 1. SAS® Visual Analytics Architecture
SAS® VISUAL ANALYTICS COMPONENTS
SAS® Visual Analytics Explorer
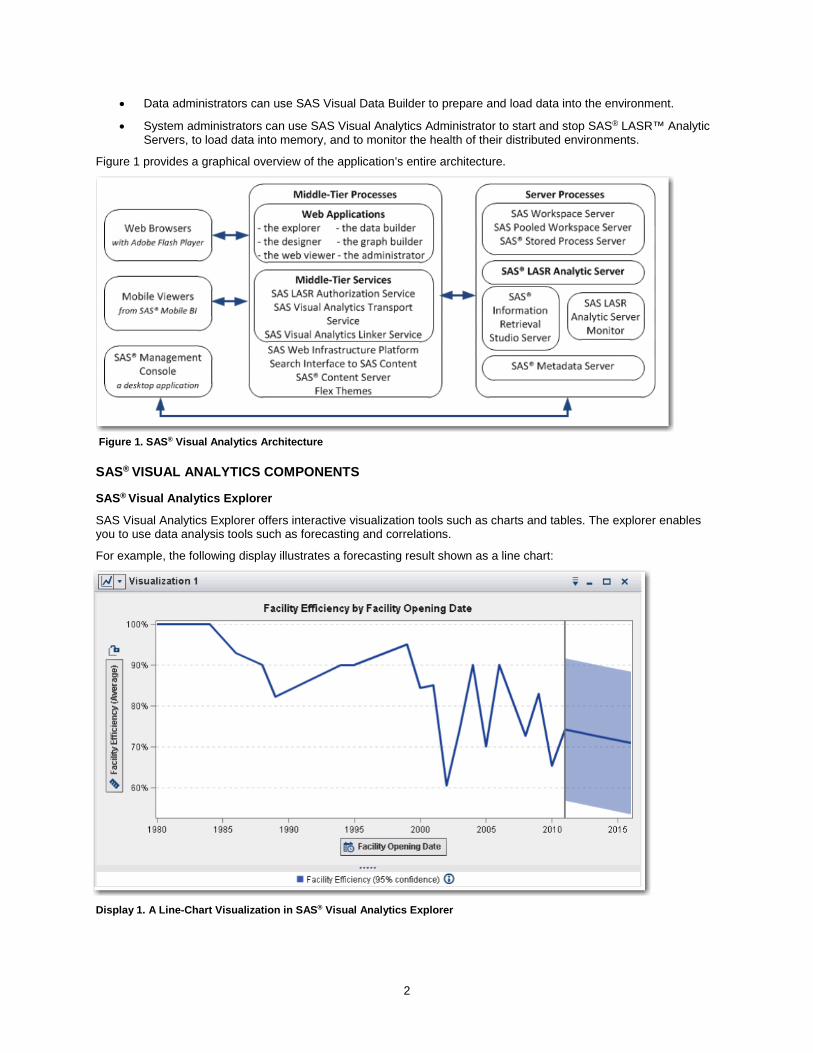
SAS Visual Analytics Explorer offers interactive visualization tools such as charts and tables. The explorer enables you to use data analysis tools such as forecasting and correlations.
For example, the following display illustrates a forecasting result shown as a line chart:
Display 1. A Line-Chart Visualization in SAS® Visual Analytics Explorer

3
Beginning with release 6.2, SAS Visual Analytics Explorer also provides the ability to create decision trees, an example of which is shown in Display 2.
Display 2. A Decision-Tree Visualization in SAS® Visual Analytics Explorer
4
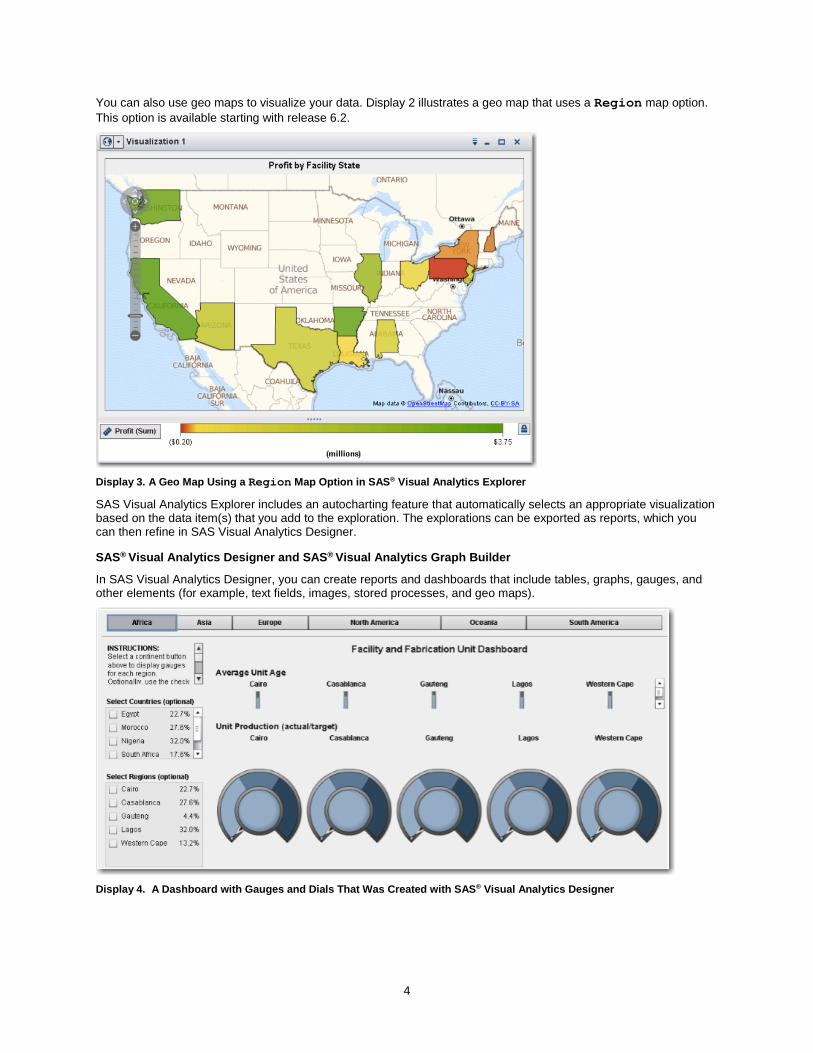
You can also use geo maps to visualize your data. Display 2 illustrates a geo map that uses a Region map option. This option is available starting with release 6.2.
Display 3. A Geo Map Using a Region Map Option in SAS® Visual Analytics Explorer
SAS Visual Analytics Explorer includes an autocharting feature that automatically selects an appropriate visualization based on the data item(s) that you add to the exploration. The explorations can be exported as reports, which you can then refine in SAS Visual Analytics Designer.
SAS® Visual Analytics Designer and SAS® Visual Analytics Graph Builder
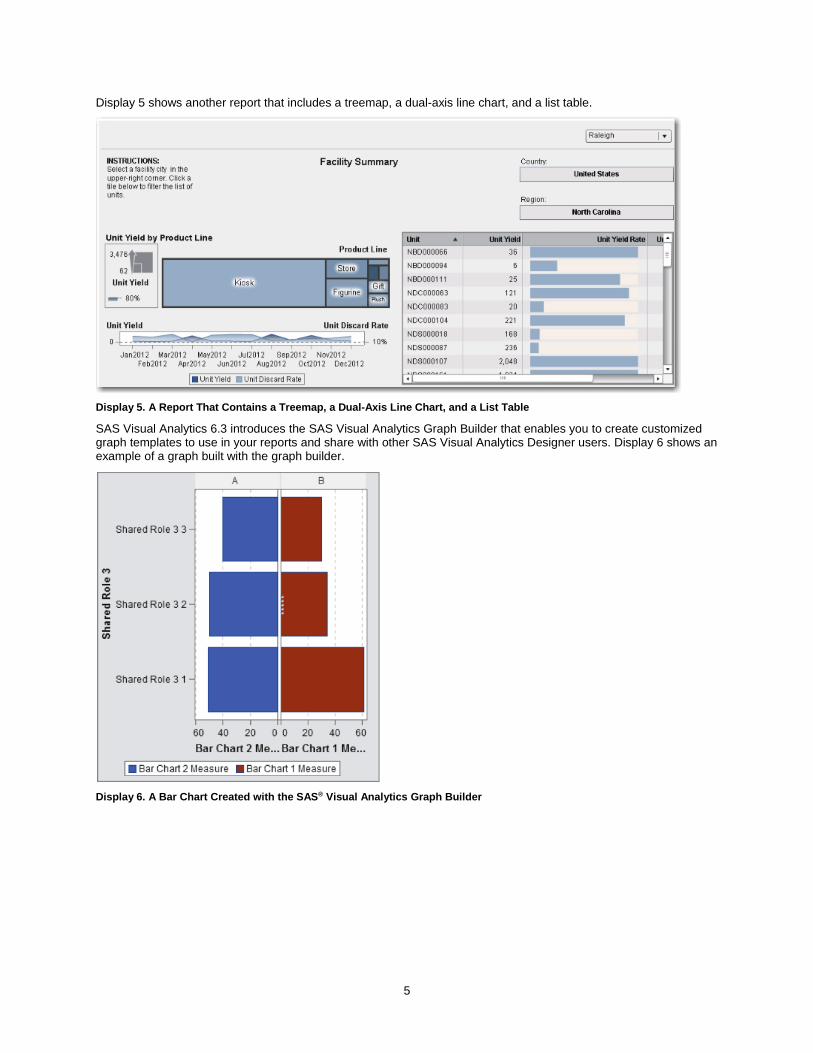
In SAS Visual Analytics Designer, you can create reports and dashboards that include tables, graphs, gauges, and other elements (for example, text fields, images, stored processes, and geo maps).
Display 4. A Dashboard with Gauges and Dials That Was Created with SAS® Visual Analytics Designer
5
Display 5 shows another report that includes a treemap, a dual-axis line chart, and a list table.
Display 5. A Report That Contains a Treemap, a Dual-Axis Line Chart, and a List Table
SAS Visual Analytics 6.3 introduces the SAS Visual Analytics Graph Builder that enables you to create customized graph templates to use in your reports and share with other SAS Visual Analytics Designer users. Display 6 shows an example of a graph built with the graph builder.
Display 6. A Bar Chart Created with the SAS® Visual Analytics Graph Builder
6
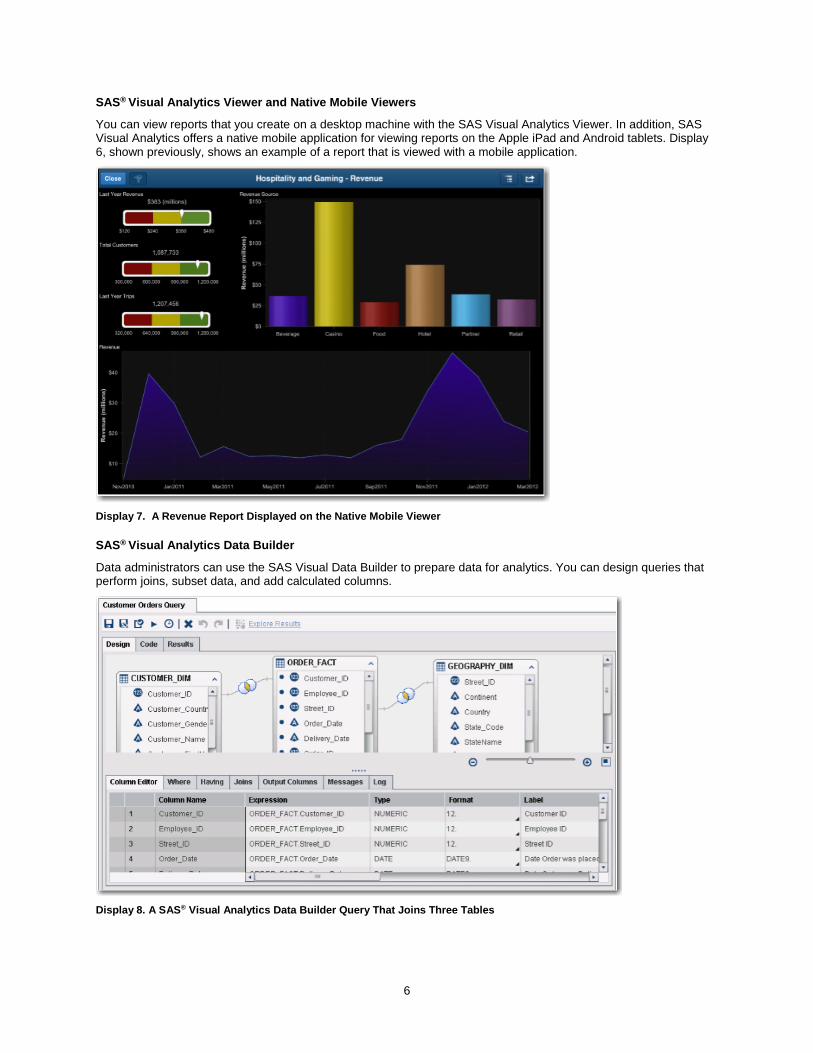
SAS® Visual Analytics Viewer and Native Mobile Viewers
You can view reports that you create on a desktop machine with the SAS Visual Analytics Viewer. In addition, SAS Visual Analytics offers a native mobile application for viewing reports on the Apple iPad and Android tablets. Display 6, shown previously, shows an example of a report that is viewed with a mobile application.
Display 7. A Revenue Report Displayed on the Native Mobile Viewer
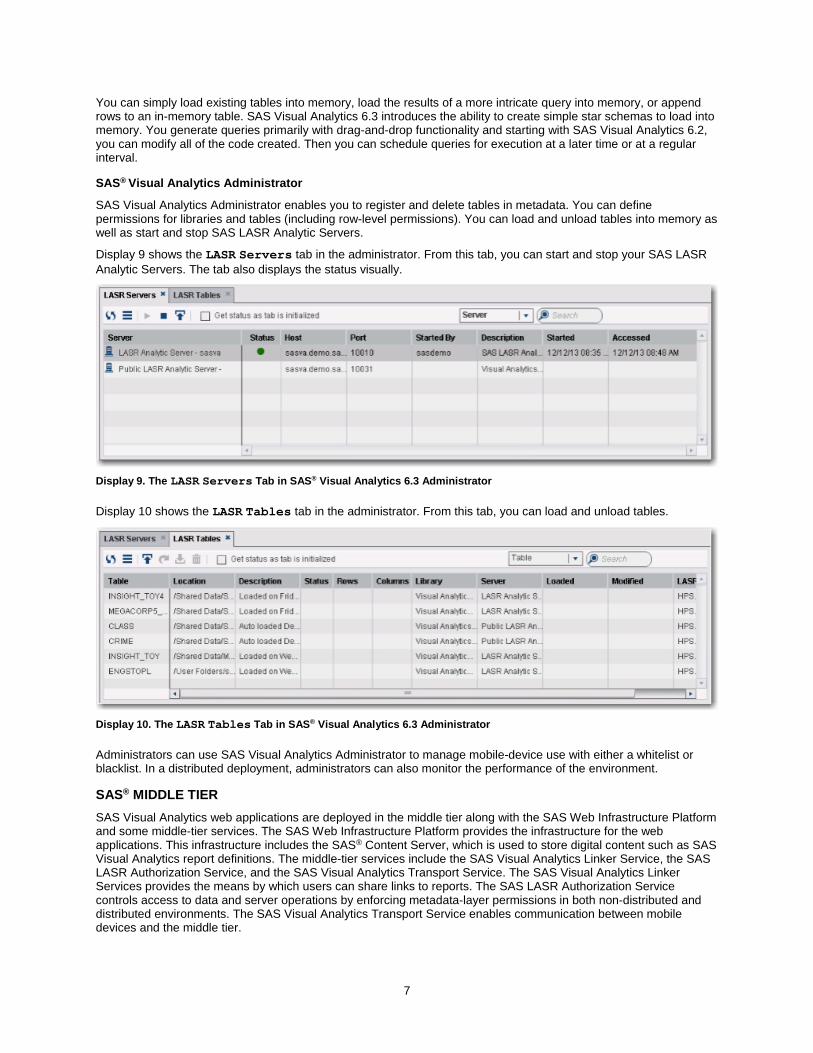
SAS® Visual Analytics Data Builder
Data administrators can use the SAS Visual Data Builder to prepare data for analytics. You can design queries that perform joins, subset data, and add calculated columns.
Display 8. A SAS® Visual Analytics Data Builder Query That Joins Three Tables
7
You can simply load existing tables into memory, load the results of a more intricate query into memory, or append rows to an in-memory table. SAS Visual Analytics 6.3 introduces the ability to create simple star schemas to load into memory. You generate queries primarily with drag-and-drop functionality and starting with SAS Visual Analytics 6.2, you can modify all of the code created. Then you can schedule queries for execution at a later time or at a regular interval.
SAS® Visual Analytics Administrator
SAS Visual Analytics Administrator enables you to register and delete tables in metadata. You can define permissions for libraries and tables (including row-level permissions). You can load and unload tables into memory as well as start and stop SAS LASR Analytic Servers.
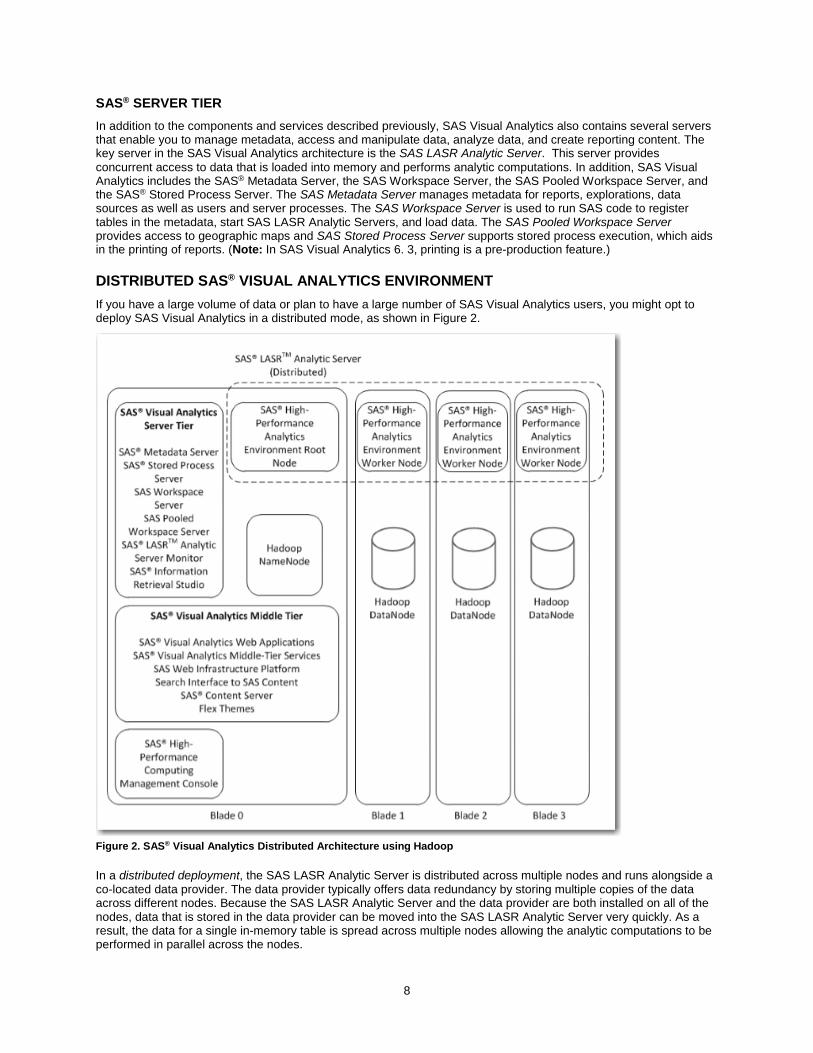
Display 9 shows the LASR Servers tab in the administrator. From this tab, you can start and stop your SAS LASR Analytic Servers. The tab also displays the status visually.
Display 9. The LASR Servers Tab in SAS® Visual Analytics 6.3 Administrator
Display 10 shows the LASR Tables tab in the administrator. From this tab, you can load and unload tables.
Display 10. The LASR Tables Tab in SAS® Visual Analytics 6.3 Administrator
Administrators can use SAS Visual Analytics Administrator to manage mobile-device use with either a whitelist or blacklist. In a distributed deployment, administrators can also monitor the performance of the environment.
SAS® MIDDLE TIER
SAS Visual Analytics web applications are deployed in the middle tier along with the SAS Web Infrastructure Platform and some middle-tier services. The SAS Web Infrastructure Platform provides the infrastructure for the web applications. This infrastructure includes the SAS® Content Server, which is used to store digital content such as SAS Visual Analytics report definitions. The middle-tier services include the SAS Visual Analytics Linker Service, the SAS LASR Authorization Service, and the SAS Visual Analytics Transport Service. The SAS Visual Analytics Linker Services provides the means by which users can share links to reports. The SAS LASR Authorization Service controls access to data and server operations by enforcing metadata-layer permissions in both non-distributed and distributed environments. The SAS Visual Analytics Transport Service enables communication between mobile devices and the middle tier.
8
SAS® SERVER TIER
In addition to the components and services described previously, SAS Visual Analytics also contains several servers that enable you to manage metadata, access and manipulate data, analyze data, and create reporting content. The key server in the SAS Visual Analytics architecture is the SAS LASR Analytic Server. This server provides concurrent access to data that is loaded into memory and performs analytic computations. In addition, SAS Visual Analytics includes the SAS® Metadata Server, the SAS Workspace Server, the SAS Pooled Workspace Server, and the SAS® Stored Process Server. The SAS Metadata Server manages metadata for reports, explorations, data sources as well as users and server processes. The SAS Workspace Server is used to run SAS code to register tables in the metadata, start SAS LASR Analytic Servers, and load data. The SAS Pooled Workspace Server provides access to geographic maps and SAS Stored Process Server supports stored process execution, which aids in the printing of reports. (Note: In SAS Visual Analytics 6. 3, printing is a pre-production feature.)
DISTRIBUTED SAS® VISUAL ANALYTICS ENVIRONMENT
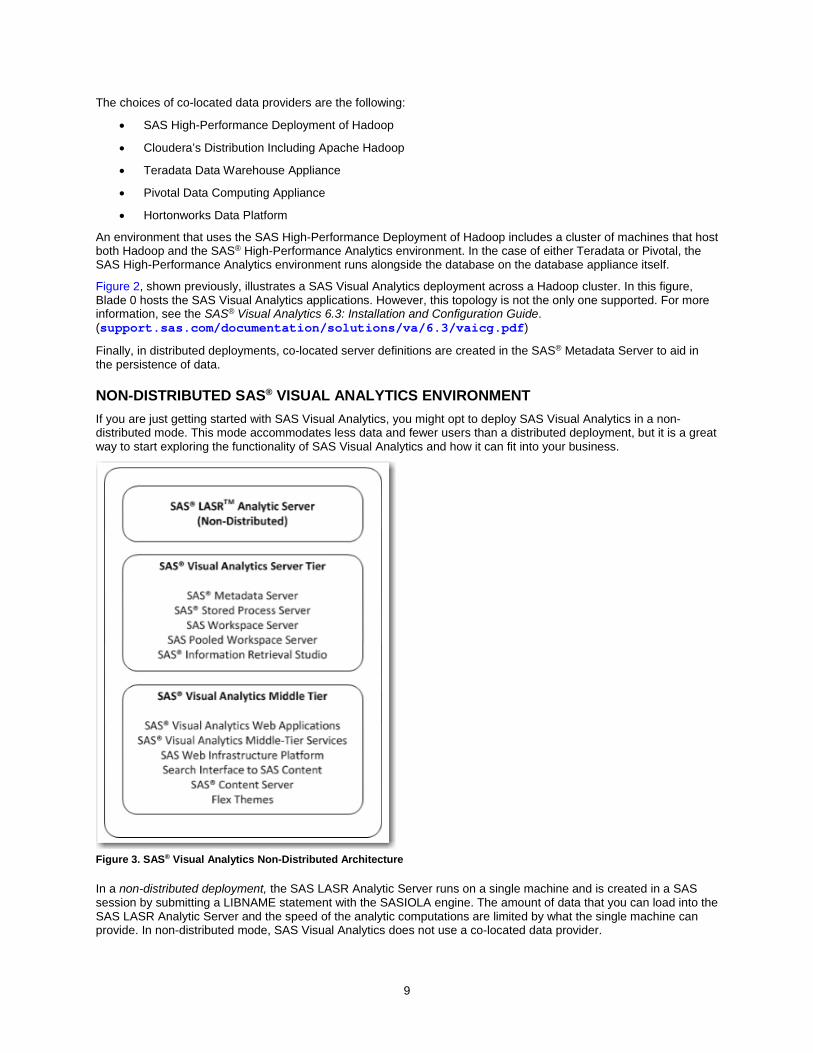
If you have a large volume of data or plan to have a large number of SAS Visual Analytics users, you might opt to deploy SAS Visual Analytics in a distributed mode, as shown in Figure 2.
Figure 2. SAS® Visual Analytics Distributed Architecture using Hadoop
In a distributed deployment, the SAS LASR Analytic Server is distributed across multiple nodes and runs alongside a co-located data provider. The data provider typically offers data redundancy by storing multiple copies of the data across different nodes. Because the SAS LASR Analytic Server and the data provider are both installed on all of the nodes, data that is stored in the data provider can be moved into the SAS LASR Analytic Server very quickly. As a result, the data for a single in-memory table is spread across multiple nodes allowing the analytic computations to be performed in parallel across the nodes.
9
The choices of co-located data providers are the following:
SAS High-Performance Deployment of Hadoop
Cloudera’s Distribution Including Apache Hadoop
Teradata Data Warehouse Appliance
Pivotal Data Computing Appliance
Hortonworks Data Platform
An environment that uses the SAS High-Performance Deployment of Hadoop includes a cluster of machines that host both Hadoop and the SAS® High-Performance Analytics environment. In the case of either Teradata or Pivotal, the SAS High-Performance Analytics environment runs alongside the database on the database appliance itself.
Figure 2, shown previously, illustrates a SAS Visual Analytics deployment across a Hadoop cluster. In this figure, Blade 0 hosts the SAS Visual Analytics applications. However, this topology is not the only one supported. For more information, see the SAS® Visual Analytics 6.3: Installation and Configuration Guide. (support.sas.com/documentation/solutions/va/6.3/vaicg.pdf)
Finally, in distributed deployments, co-located server definitions are created in the SAS® Metadata Server to aid in the persistence of data.
NON-DISTRIBUTED SAS® VISUAL ANALYTICS ENVIRONMENT
If you are just getting started with SAS Visual Analytics, you might opt to deploy SAS Visual Analytics in a non-distributed mode. This mode accommodates less data and fewer users than a distributed deployment, but it is a great way to start exploring the functionality of SAS Visual Analytics and how it can fit into your business.
Figure 3. SAS® Visual Analytics Non-Distributed Architecture
In a non-distributed deployment, the SAS LASR Analytic Server runs on a single machine and is created in a SAS session by submitting a LIBNAME statement with the SASIOLA engine. The amount of data that you can load into the SAS LASR Analytic Server and the speed of the analytic computations are limited by what the single machine can provide. In non-distributed mode, SAS Visual Analytics does not use a co-located data provider.
10
Over time, if you find that your needs exceed the resources of a non-distributed system, you can scale up to a distributed SAS Visual Analytics deployment.
SAS® BUSINESS INTELLIGENCE ARCHITECTURE
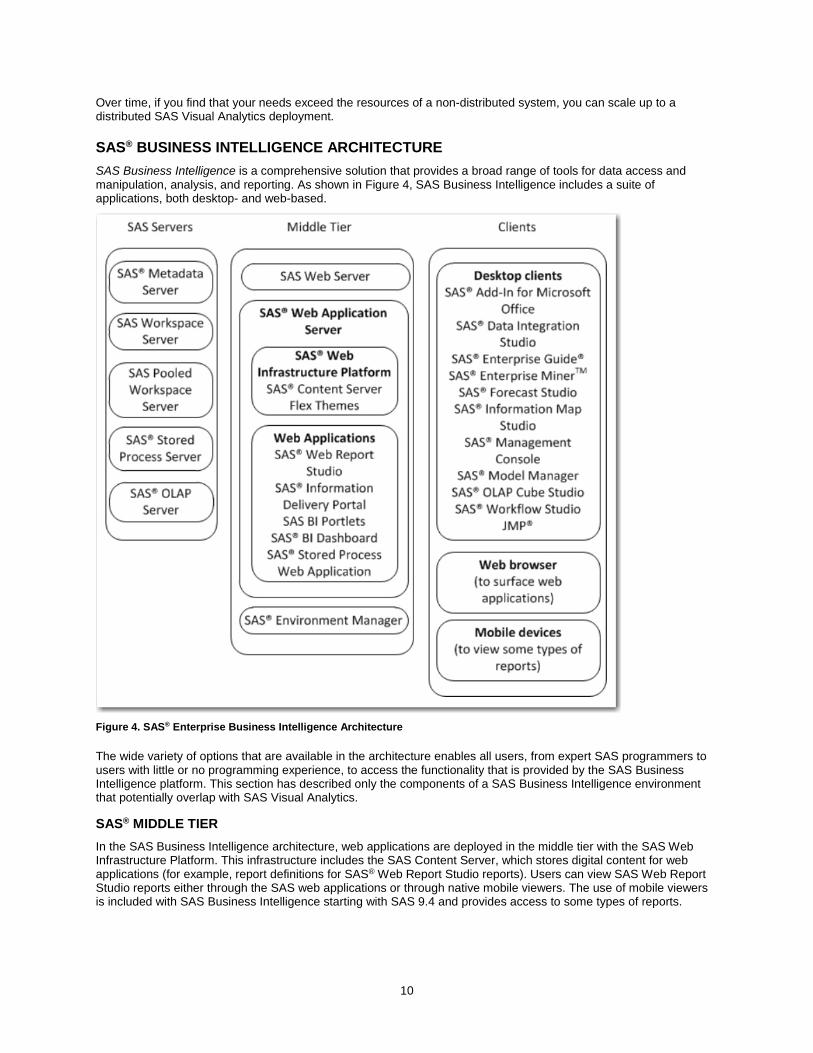
SAS Business Intelligence is a comprehensive solution that provides a broad range of tools for data access and manipulation, analysis, and reporting. As shown in Figure 4, SAS Business Intelligence includes a suite of applications, both desktop- and web-based.
Figure 4. SAS® Enterprise Business Intelligence Architecture
The wide variety of options that are available in the architecture enables all users, from expert SAS programmers to users with little or no programming experience, to access the functionality that is provided by the SAS Business Intelligence platform. This section has described only the components of a SAS Business Intelligence environment that potentially overlap with SAS Visual Analytics.
SAS® MIDDLE TIER
In the SAS Business Intelligence architecture, web applications are deployed in the middle tier with the SAS Web Infrastructure Platform. This infrastructure includes the SAS Content Server, which stores digital content for web applications (for example, report definitions for SAS® Web Report Studio reports). Users can view SAS Web Report Studio reports either through the SAS web applications or through native mobile viewers. The use of mobile viewers is included with SAS Business Intelligence starting with SAS 9.4 and provides access to some types of reports.

11
SAS® SERVER TIER
In SAS Business Intelligence, the data management, analytics, and reporting services for the desktop and web applications are provided by several SAS servers, including the SAS Workspace Server, the SAS Pooled Workspace Server, and the SAS Stored Process Server. In addition, the SAS Metadata Server manages the metadata about the SAS Business Intelligence environment.
Code that is generated by the desktop applications is often submitted to the SAS Workspace Server because it is a general-use server that can execute a wide range of SAS code and return the results to client applications. On the other hand, the SAS Pooled Workspace Server is more specialized than the workspace server. Typically, the SAS Pooled Workspace Server is used to make data sources, such as tables and information maps, accessible to web applications. Information maps create a bridge between the data sources and business users. A relational information map can access one table or join multiple tables. A map can include calculated items that do not appear in the underlying data source as well as filters that enable you to easily subset data. Information maps are commonly used as the input to SAS Web Report Studio reports. Information maps can also be based on an OLAP cube. An OLAP cube is pre-summarized data that is created by the OLAP procedure that often runs on a workspace server. When you access a cube directly or through an information map, the data is retrieved by the SAS® OLAP Server.
Another option for creating customized, parameterized reports is to use stored processes. Essentially, a stored process is SAS code that is executed by a stored process server. In a SAS Business Intelligence environment, stored processes are often created in SAS® Enterprise Guide® and can be run in most of the desktop and web applications.
In addition to the servers described previously, the SAS Business Intelligence environment includes the SAS Metadata Server. The SAS Metadata Data Server manages the metadata about the environment. That metadata includes information about users, servers, security, data sources, stored processes, and reports. Metadata is presented to users typically in a metadata folder tree. SAS administrators can use the metadata folder tree to secure metadata.
AREA WHERE SAS® VISUAL ANALYTICS AND SAS® BUSINESS INTELLIGENCE CAN OVERLAP
When you have both a SAS Visual Analytics environment and a SAS Business Intelligence environment, you can exploit certain areas where these environments overlap. Specifically, these two environments offer a number of advantages when they share metadata, relational information maps, and reporting functionality.
SHARING METADATA
The SAS Metadata Server is central to both SAS Business Intelligence and SAS Visual Analytics, and provides the same essential functionality in both environments. SAS Visual Analytics 6.1 introduces the ability to share the metadata server between a SAS Business Intelligence environment and a SAS Visual Analytics environment. If the two environments have some of the same users and resources, this shared setup enables you to maintain a single copy of this information. That is, you can define all of your users and resources for both SAS Business Intelligence and SAS Visual Analytics in one metadata repository. In addition, the users of both environments access the same metadata folder structure. Administrators can customize and secure the folder structure to allow appropriate access to users.
In order to provide high availability of the metadata server, SAS 9.4 introduces the option of implementing a metadata server cluster. This configuration option is supported for both SAS Business Intelligence and SAS Visual Analytics.
Sharing the SAS Metadata Server offers a number of benefits across both environments. For example, if you already have data sources registered in the metadata for SAS Business Intelligence, those sources can be loaded into the SAS LASR Analytic Server as well. The data sources can include SAS data sets, relational database tables, information maps, and other data types. In SAS Visual Analytics, you can use the SAS Visual Analytics Administrator application to access tables that are available in the metadata server’s folder tree. In addition, the SAS Visual Data Builder can use tables that are registered in metadata as input to queries. All access to metadata is controlled by the user’s metadata permissions and capabilities.
SHARING RELATIONAL INFORMATION MAPS
Relational information maps can also be shared between SAS Visual Analytics and SAS Business Intelligence. The use of relational information maps was extended to SAS Visual Analytics with release 6.2. Information maps serve as the primary input to SAS Web Report Studio reports in a SAS Business Intelligence environment, and relational information maps can be a data source in SAS Visual Analytics. For example, you can import certain relational information maps into queries in the SAS Visual Data Builder. Therefore, if you have a SAS Web Report Studio report based on a relational information map, you can easily use that same map to create a SAS Visual Analytics report.
12
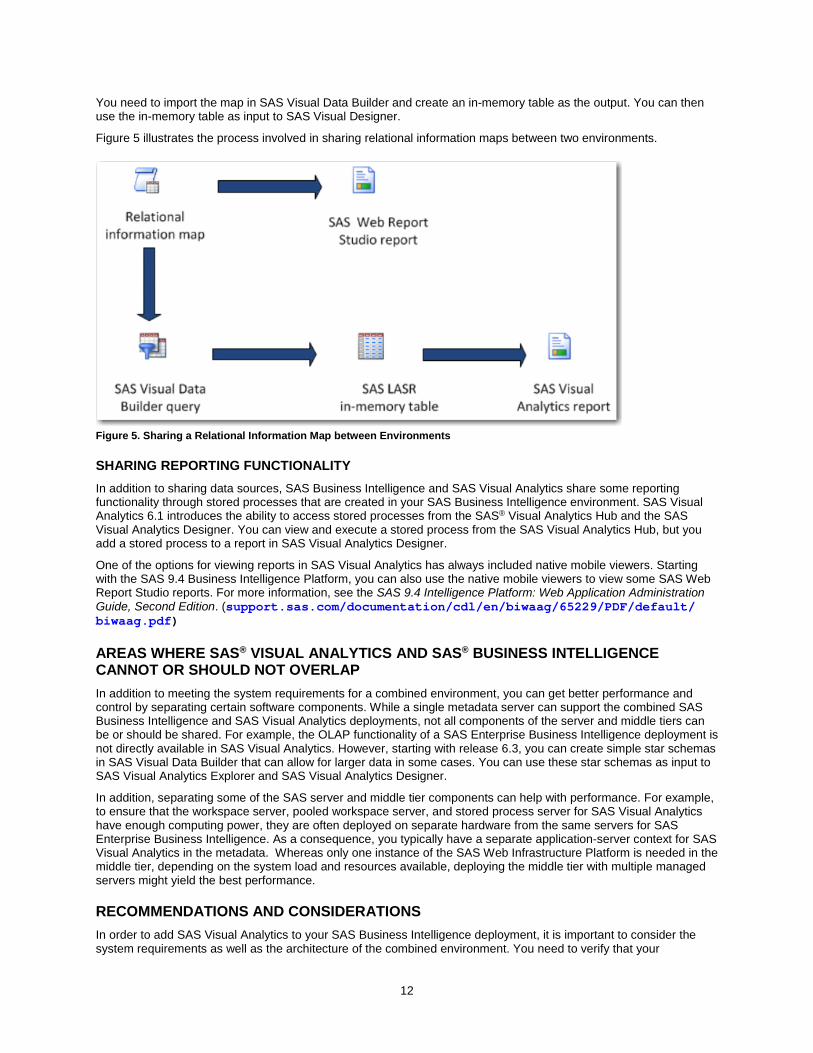
You need to import the map in SAS Visual Data Builder and create an in-memory table as the output. You can then use the in-memory table as input to SAS Visual Designer.
Figure 5 illustrates the process involved in sharing relational information maps between two environments.
Figure 5. Sharing a Relational Information Map between Environments
SHARING REPORTING FUNCTIONALITY
In addition to sharing data sources, SAS Business Intelligence and SAS Visual Analytics share some reporting functionality through stored processes that are created in your SAS Business Intelligence environment. SAS Visual Analytics 6.1 introduces the ability to access stored processes from the SAS® Visual Analytics Hub and the SAS Visual Analytics Designer. You can view and execute a stored process from the SAS Visual Analytics Hub, but you add a stored process to a report in SAS Visual Analytics Designer.
One of the options for viewing reports in SAS Visual Analytics has always included native mobile viewers. Starting with the SAS 9.4 Business Intelligence Platform, you can also use the native mobile viewers to view some SAS Web Report Studio reports. For more information, see the SAS 9.4 Intelligence Platform: Web Application Administration Guide, Second Edition. (support.sas.com/documentation/cdl/en/biwaag/65229/PDF/default/ biwaag.pdf)
AREAS WHERE SAS® VISUAL ANALYTICS AND SAS® BUSINESS INTELLIGENCE CANNOT OR SHOULD NOT OVERLAP
In addition to meeting the system requirements for a combined environment, you can get better performance and control by separating certain software components. While a single metadata server can support the combined SAS Business Intelligence and SAS Visual Analytics deployments, not all components of the server and middle tiers can be or should be shared. For example, the OLAP functionality of a SAS Enterprise Business Intelligence deployment is not directly available in SAS Visual Analytics. However, starting with release 6.3, you can create simple star schemas in SAS Visual Data Builder that can allow for larger data in some cases. You can use these star schemas as input to SAS Visual Analytics Explorer and SAS Visual Analytics Designer.
In addition, separating some of the SAS server and middle tier components can help with performance. For example, to ensure that the workspace server, pooled workspace server, and stored process server for SAS Visual Analytics have enough computing power, they are often deployed on separate hardware from the same servers for SAS Enterprise Business Intelligence. As a consequence, you typically have a separate application-server context for SAS Visual Analytics in the metadata. Whereas only one instance of the SAS Web Infrastructure Platform is needed in the middle tier, depending on the system load and resources available, deploying the middle tier with multiple managed servers might yield the best performance.
RECOMMENDATIONS AND CONSIDERATIONS
In order to add SAS Visual Analytics to your SAS Business Intelligence deployment, it is important to consider the system requirements as well as the architecture of the combined environment. You need to verify that your
13
environment meets the system requirements for SAS Visual Analytics. The system requirements include supported operating systems, compatibility of software releases, and hardware requirements.
SAS Visual Analytics supports a smaller subset of operating environments than the SAS Business Intelligence Platform. The server tier of the SAS Business Intelligence environment is supported in the Windows, UNIX, and z/OS environments whereas the middle tier is supported under Windows and UNIX. In SAS Visual Analytics 6.1, the only supported operating system is Linux. SAS Visual Analytics 6.2 introduces support for Windows in a non-distributed deployment. With that said, infrastructure pieces of SAS Visual Analytics (logical types, service extension, and so on) are capable of running on all other SAS Business Intelligence supported platforms with the exception of z/OS. For a distributed environment, the SAS Visual Analytics server tier and middle tier must run on the Linux operating system. For a non-distributed deployment, the tiers can run in either Windows or Linux operating systems.
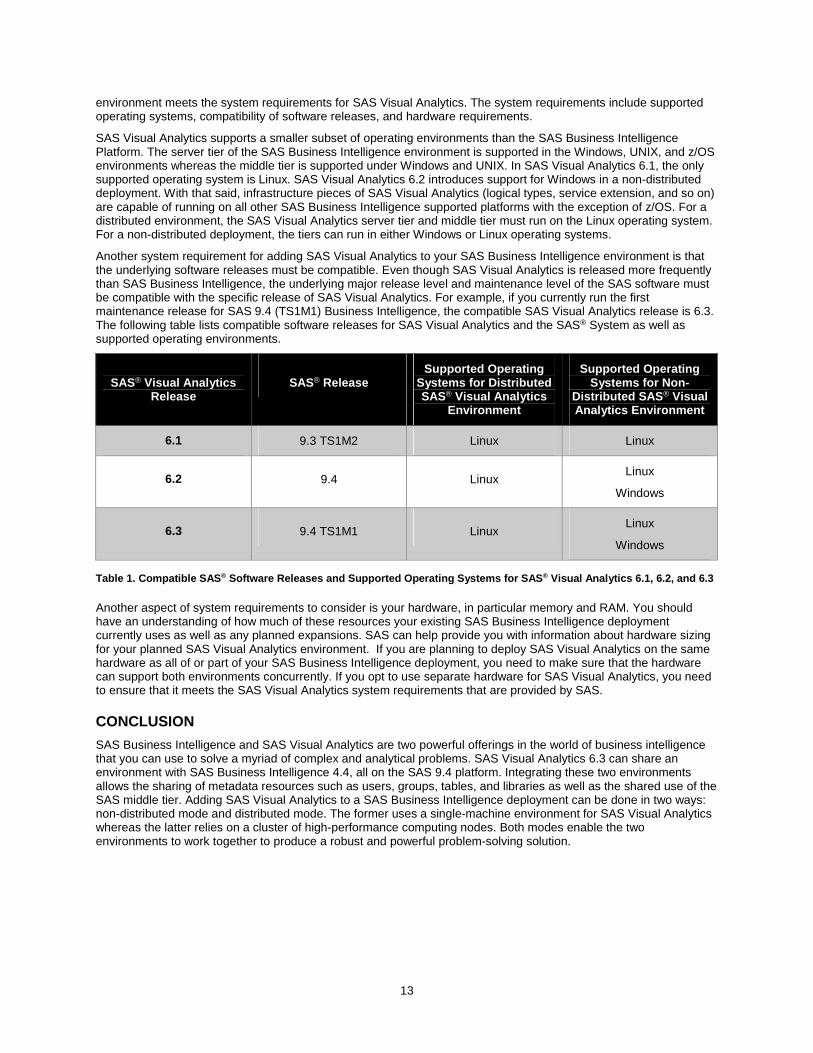
Another system requirement for adding SAS Visual Analytics to your SAS Business Intelligence environment is that the underlying software releases must be compatible. Even though SAS Visual Analytics is released more frequently than SAS Business Intelligence, the underlying major release level and maintenance level of the SAS software must be compatible with the specific release of SAS Visual Analytics. For example, if you currently run the first maintenance release for SAS 9.4 (TS1M1) Business Intelligence, the compatible SAS Visual Analytics release is 6.3. The following table lists compatible software releases for SAS Visual Analytics and the SAS® System as well as supported operating environments.
SAS® Visual Analytics Release
SAS® Release Supported Operating
Systems for Distributed SAS® Visual Analytics
Environment
Supported Operating Systems for Non-
Distributed SAS® Visual Analytics Environment
6.1 9.3 TS1M2 Linux Linux
6.2 9.4 Linux Linux
Windows
6.3 9.4 TS1M1 Linux Linux
Windows
Table 1. Compatible SAS® Software Releases and Supported Operating Systems for SAS® Visual Analytics 6.1, 6.2, and 6.3
Another aspect of system requirements to consider is your hardware, in particular memory and RAM. You should have an understanding of how much of these resources your existing SAS Business Intelligence deployment currently uses as well as any planned expansions. SAS can help provide you with information about hardware sizing for your planned SAS Visual Analytics environment. If you are planning to deploy SAS Visual Analytics on the same hardware as all of or part of your SAS Business Intelligence deployment, you need to make sure that the hardware can support both environments concurrently. If you opt to use separate hardware for SAS Visual Analytics, you need to ensure that it meets the SAS Visual Analytics system requirements that are provided by SAS.
CONCLUSION
SAS Business Intelligence and SAS Visual Analytics are two powerful offerings in the world of business intelligence that you can use to solve a myriad of complex and analytical problems. SAS Visual Analytics 6.3 can share an environment with SAS Business Intelligence 4.4, all on the SAS 9.4 platform. Integrating these two environments allows the sharing of metadata resources such as users, groups, tables, and libraries as well as the shared use of the SAS middle tier. Adding SAS Visual Analytics to a SAS Business Intelligence deployment can be done in two ways: non-distributed mode and distributed mode. The former uses a single-machine environment for SAS Visual Analytics whereas the latter relies on a cluster of high-performance computing nodes. Both modes enable the two environments to work together to produce a robust and powerful problem-solving solution.

14
RECOMMENDED READING
SAS Institute Inc. 2013. SAS® Visual Analytics 6.3: User’s Guide. Cary, NC: SAS Institute Inc. Available at support.sas.com/documentation/cdl/en/vaug/66720/PDF/default/vaug.pdf.
SAS Institute Inc. 2013. SAS® 9.4 Intelligence Platform: Overview. Cary, NC: SAS Institute Inc. Available at support.sas.com/documentation/cdl/en/biov/64876/PDF/default/biov.pdf.
CONTACT INFORMATION
Your comments and questions are valued and encouraged. Contact the authors at:
Christine Vitron SAS Institute Inc. SAS Campus Drive Cary, NC 27513 E-mail: [email protected] Web: support.sas.com James Holman SAS Institute Inc. SAS Campus Drive Cary, NC 27513 E-mail: [email protected] Web: support.sas.com
SAS and all other SAS Institute Inc. product or service names are registered trademarks or trademarks of SAS Institute Inc. in the USA and other countries. ® indicates USA registration.
Other brand and product names are trademarks of their respective companies.