conservation tillage in oklahoma: perceptions and...
TRANSCRIPT

Conservation Tillage in Oklahoma: Perceptions and Demographics
of Producers
Conservation Tillage in Oklahoma: Perceptions and Demographics
of Producers
E-1019
Oklahoma Cooperative Extension ServiceDivision of Agricultural Sciences and Natural Resources
Oklahoma State University

Oklahoma State University, in compliance with Title VI and VII of the Civil Rights Act of 1964, Executive Order 11246 as amended, Title IX of the Education Amendments of 1972, Americans with Disabilities Act of 1990, and other federal laws and regulations, does not discriminate on the basis of race, color, national origin, gender, age, religion, disability, or status as a veteran in any of its policies, practices or procedures. This includes but is not limited to admissions, employment, financial aid, and educational services.
Issued in furtherance of Cooperative Extension work, acts of May 8 and June 30, 1914, in cooperation with the U.S. Department of Agriculture, Robert E. Whitson, Director of Oklahoma Cooperative Extension Service, Oklahoma State University, Stillwater, Oklahoma. This publication is printed and issued by Oklahoma State University as authorized by the Vice President, Dean, and Director of the Division of Agricultural Sciences and Natural Resources and has been prepared and distributed at a cost of $1.28 per copy. GH 0110

Conservation Tillage in Oklahoma: Perceptions and Demographics of Producers
Sarah WrightM.S. Graduate Student, Plant and Soil Sciences
Jeff EdwardsSmall Grains Extension Specialist
Chad GodseyCropping Systems Extension Specialist
Jeff VitaleAgricultural Economist
Francis EpplinAgricultural Economist
Randy TaylorAgricultural Engineer
January 2010
Acknowledgments This report was made possible through the hard work of several individuals. The authors thank Abdou-laye Ibrahim Mahamane Djido for guidance and assistance in analyzing survey data and interpreting re-sults. Will Hundle and the staff at Oklahoma office of the National Agricultural Statistics Service provided timely advice and service in distributing the survey. Finally, these survey data were made possible through financial support of the Oklahoma Cooperative Extension Service and the Oklahoma Agricultural Experi-ment Station.

Introduction
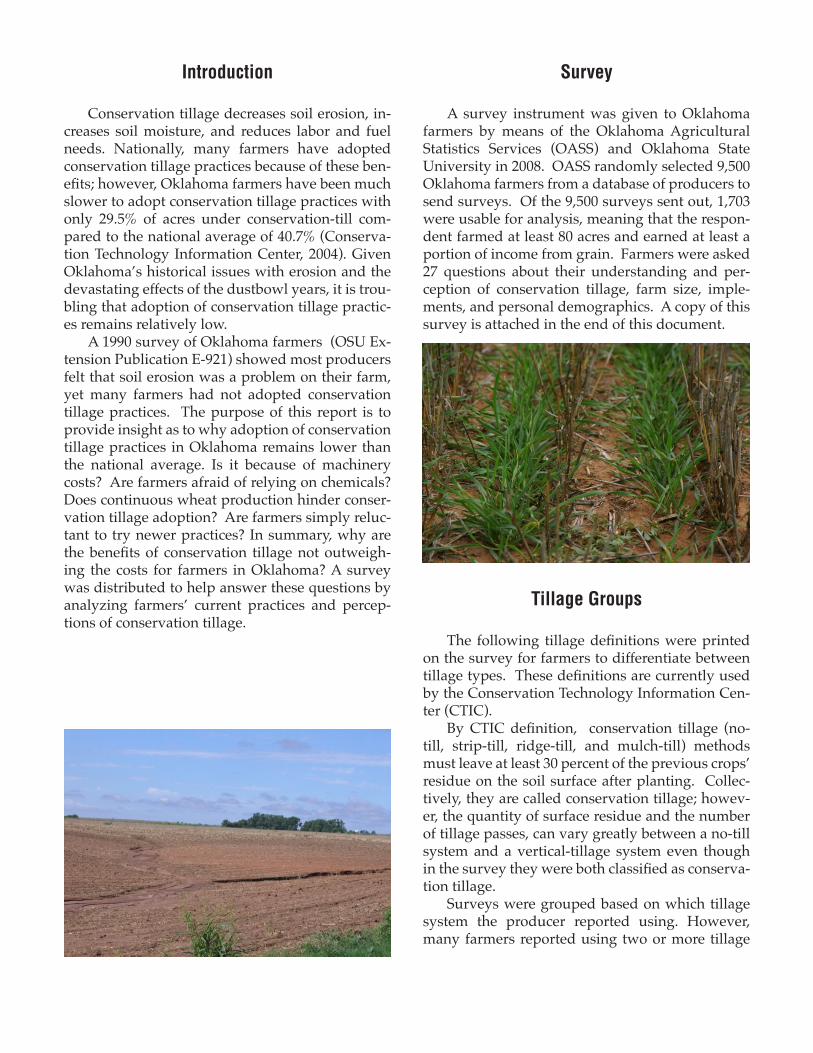
Conservation tillage decreases soil erosion, in-creases soil moisture, and reduces labor and fuel needs. Nationally, many farmers have adopted conservation tillage practices because of these ben-efits; however, Oklahoma farmers have been much slower to adopt conservation tillage practices with only 29.5% of acres under conservation-till com-pared to the national average of 40.7% (Conserva-tion Technology Information Center, 2004). Given Oklahoma’s historical issues with erosion and the devastating effects of the dustbowl years, it is trou-bling that adoption of conservation tillage practic-es remains relatively low. A 1990 survey of Oklahoma farmers (OSU Ex-tension Publication E-921) showed most producers felt that soil erosion was a problem on their farm, yet many farmers had not adopted conservation tillage practices. The purpose of this report is to provide insight as to why adoption of conservation tillage practices in Oklahoma remains lower than the national average. Is it because of machinery costs? Are farmers afraid of relying on chemicals? Does continuous wheat production hinder conser-vation tillage adoption? Are farmers simply reluc-tant to try newer practices? In summary, why are the benefits of conservation tillage not outweigh-ing the costs for farmers in Oklahoma? A survey was distributed to help answer these questions by analyzing farmers’ current practices and percep-tions of conservation tillage.
Survey
A survey instrument was given to Oklahoma farmers by means of the Oklahoma Agricultural Statistics Services (OASS) and Oklahoma State University in 2008. OASS randomly selected 9,500 Oklahoma farmers from a database of producers to send surveys. Of the 9,500 surveys sent out, 1,703 were usable for analysis, meaning that the respon-dent farmed at least 80 acres and earned at least a portion of income from grain. Farmers were asked 27 questions about their understanding and per-ception of conservation tillage, farm size, imple-ments, and personal demographics. A copy of this survey is attached in the end of this document.
Tillage Groups
The following tillage definitions were printed on the survey for farmers to differentiate between tillage types. These definitions are currently used by the Conservation Technology Information Cen-ter (CTIC). By CTIC definition, conservation tillage (no-till, strip-till, ridge-till, and mulch-till) methods must leave at least 30 percent of the previous crops’ residue on the soil surface after planting. Collec-tively, they are called conservation tillage; howev-er, the quantity of surface residue and the number of tillage passes, can vary greatly between a no-till system and a vertical-tillage system even though in the survey they were both classified as conserva-tion tillage. Surveys were grouped based on which tillage system the producer reported using. However, many farmers reported using two or more tillage

systems on their farm, and did not fit just one till-age category. Farmers who listed more than one tillage type on their farm were placed in the Oth-er Tillage (OT) group. This study compares farm demographics, farmer characteristics, farmer per-ception and understanding of tillage systems, and available farm implements based on these four till-age system groups: Intensive Tillage (IT), Reduced Tillage (RT), Conservation Tillage (CT), and Other Tillage (OT). Additionally, we will compare pro-ducers reporting only one tillage type or “unisys-tem” producers, and those with multiple tillage types or “multisystem” producers.
Farm Demographics
Survey respondents represented a total of nearly 1.5 million acres. Of these 1.5 million acres,
632,319 acres were intensively tilled and 428,077 were managed under conservation tillage (Figure 1). Producers were asked to report how many tillage passes they typically make for each tillage type. Intensive-till farmers make an average of 3.8 passes per year. Farmers reported that they usu-ally cultivate reduced till land 2.1 times and only cultivate their conservation till acres 0.5 times on average per year. Figure 2 shows the average till-age passes by type and represents the average high and low by adding or subtracting the standard de-viation. Producers were asked to approximate how many acres per crop they planted each year by till-age type. Farmers who only intensively till their land planted 89 percent of their acres to wheat, whereas wheat accounted for 85 percent of acres for reduced till farmers and only 67 percent of acres for farmers using conservation tillage. Conserva-
Intensive Tillage —includes several tillage passes and leaves less than 15 percent residue on the soil surface after planting.
Conservation Tillage—minimum soil disturbance; practices that fall under no-till including strip-till, ridge-till, and vertical-till.
Reduced Tillage—One to three full width tillage passes and leaves 15 to 30 percent of residue on the soil surface after planting.
Figure 1. Percent of Acres Farmed by Different tillage Systems in Oklahoma.
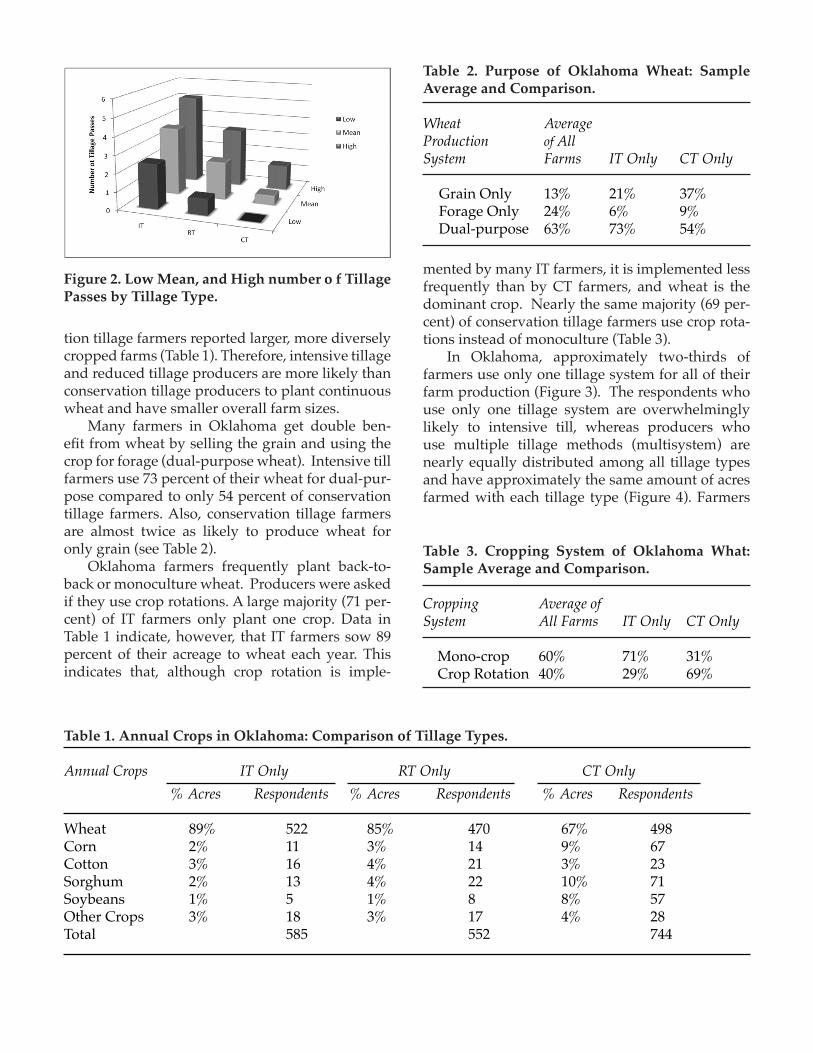
tion tillage farmers reported larger, more diversely cropped farms (Table 1). Therefore, intensive tillage and reduced tillage producers are more likely than conservation tillage producers to plant continuous wheat and have smaller overall farm sizes. Many farmers in Oklahoma get double ben-efit from wheat by selling the grain and using the crop for forage (dual-purpose wheat). Intensive till farmers use 73 percent of their wheat for dual-pur-pose compared to only 54 percent of conservation tillage farmers. Also, conservation tillage farmers are almost twice as likely to produce wheat for only grain (see Table 2). Oklahoma farmers frequently plant back-to-back or monoculture wheat. Producers were asked if they use crop rotations. A large majority (71 per-cent) of IT farmers only plant one crop. Data in Table 1 indicate, however, that IT farmers sow 89 percent of their acreage to wheat each year. This indicates that, although crop rotation is imple-
mented by many IT farmers, it is implemented less frequently than by CT farmers, and wheat is the dominant crop. Nearly the same majority (69 per-cent) of conservation tillage farmers use crop rota-tions instead of monoculture (Table 3). In Oklahoma, approximately two-thirds of farmers use only one tillage system for all of their farm production (Figure 3). The respondents who use only one tillage system are overwhelmingly likely to intensive till, whereas producers who use multiple tillage methods (multisystem) are nearly equally distributed among all tillage types and have approximately the same amount of acres farmed with each tillage type (Figure 4). Farmers
Table 1. Annual Crops in Oklahoma: Comparison of Tillage Types.
Annual Crops IT Only RT Only CT Only % Acres Respondents % Acres Respondents % Acres Respondents
Wheat 89% 522 85% 470 67% 498Corn 2% 11 3% 14 9% 67Cotton 3% 16 4% 21 3% 23Sorghum 2% 13 4% 22 10% 71Soybeans 1% 5 1% 8 8% 57Other Crops 3% 18 3% 17 4% 28Total 585 552 744
Table 2. Purpose of Oklahoma Wheat: Sample Average and Comparison.
Wheat AverageProduction of AllSystem Farms IT Only CT Only
Grain Only 13% 21% 37% Forage Only 24% 6% 9% Dual-purpose 63% 73% 54%
Table 3. Cropping System of Oklahoma What: Sample Average and Comparison.
Cropping Average ofSystem All Farms IT Only CT Only
Mono-crop 60% 71% 31% Crop Rotation 40% 29% 69%
Figure 2. Low Mean, and High number o f Tillage Passes by Tillage Type.
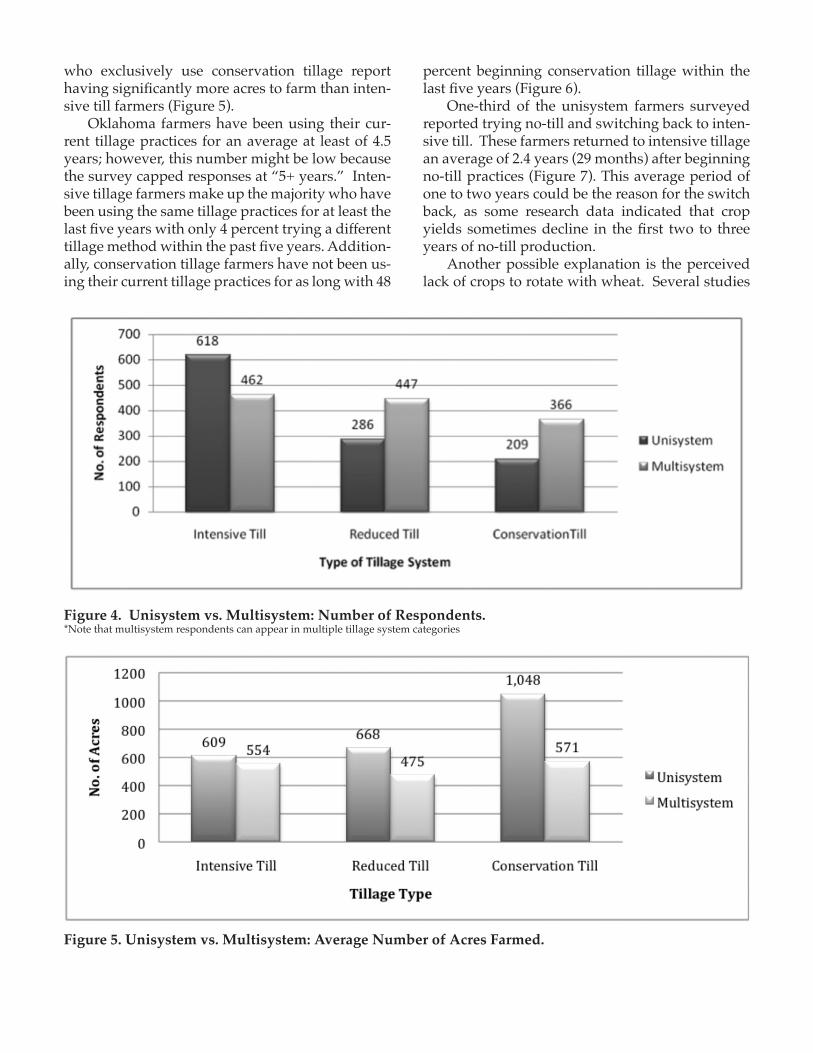
who exclusively use conservation tillage report having significantly more acres to farm than inten-sive till farmers (Figure 5). Oklahoma farmers have been using their cur-rent tillage practices for an average at least of 4.5 years; however, this number might be low because the survey capped responses at “5+ years.” Inten-sive tillage farmers make up the majority who have been using the same tillage practices for at least the last five years with only 4 percent trying a different tillage method within the past five years. Addition-ally, conservation tillage farmers have not been us-ing their current tillage practices for as long with 48
percent beginning conservation tillage within the last five years (Figure 6). One-third of the unisystem farmers surveyed reported trying no-till and switching back to inten-sive till. These farmers returned to intensive tillage an average of 2.4 years (29 months) after beginning no-till practices (Figure 7). This average period of one to two years could be the reason for the switch back, as some research data indicated that crop yields sometimes decline in the first two to three years of no-till production. Another possible explanation is the perceived lack of crops to rotate with wheat. Several studies
Figure 4. Unisystem vs. Multisystem: Number of Respondents.*Note that multisystem respondents can appear in multiple tillage system categories
Figure 5. Unisystem vs. Multisystem: Average Number of Acres Farmed.

of continuous wheat production in the region have found that when wheat is grown year after year in the same field, grain yield is reduced when a sub-stantial quantity of wheat residue from the previ-ous wheat crop is retained on the surface. There is debate, however, as to whether the yield decline
is the result of soil changes from the no-till system, differences in disease incidence and severity, more challenging weed control, or because of manage-ment skills still being learned by beginning no-till farmers.
Figure 6. Number of Years with Current Tillage Practice: Sample Average and Comparison.
Figure 7. Number of Years No-Till before Switching Back to Intensive Tillage by Percentage of Respon-dents That Tried No-till and Switched Back.
Farmer Characteristics
Respondents were asked their age by category, rather than stating their exact age. Participants were asked whether they were 18 to 25; 26 to 34, 35 to 44; 45 to 54; 55 to 65; or more than 65 years of age. The largest category of respondents was in the 65 + group with 643 respondents or 38 percent of the sample. Only 2 participants in the study were between 18 and 25 years old, making up less than 1 percent of the sample (Table 4). On average, con-servation tillage farmers are younger than inten-sive tillage farmers with more farmers represent-ing the 35 to 44 group and fewer in the 65+ group. Producers were asked the highest level of edu-cation they have attained. High school graduates made up the largest group of participants with 811 responses or 49 percent of the sample. Both those with post graduate education or those with grade school education only made up 2 percent of the re-sponses (Table 5). No significant differences were found between tillage groups for level of educa-tion.
Table 5. Producer Education Groups for Whole Sample.
Grade High Respon- school school B.S M.S. Ph.D. dents
Number 31 811 638 138 40 1,658Percent 2% 49% 38% 8% 2%
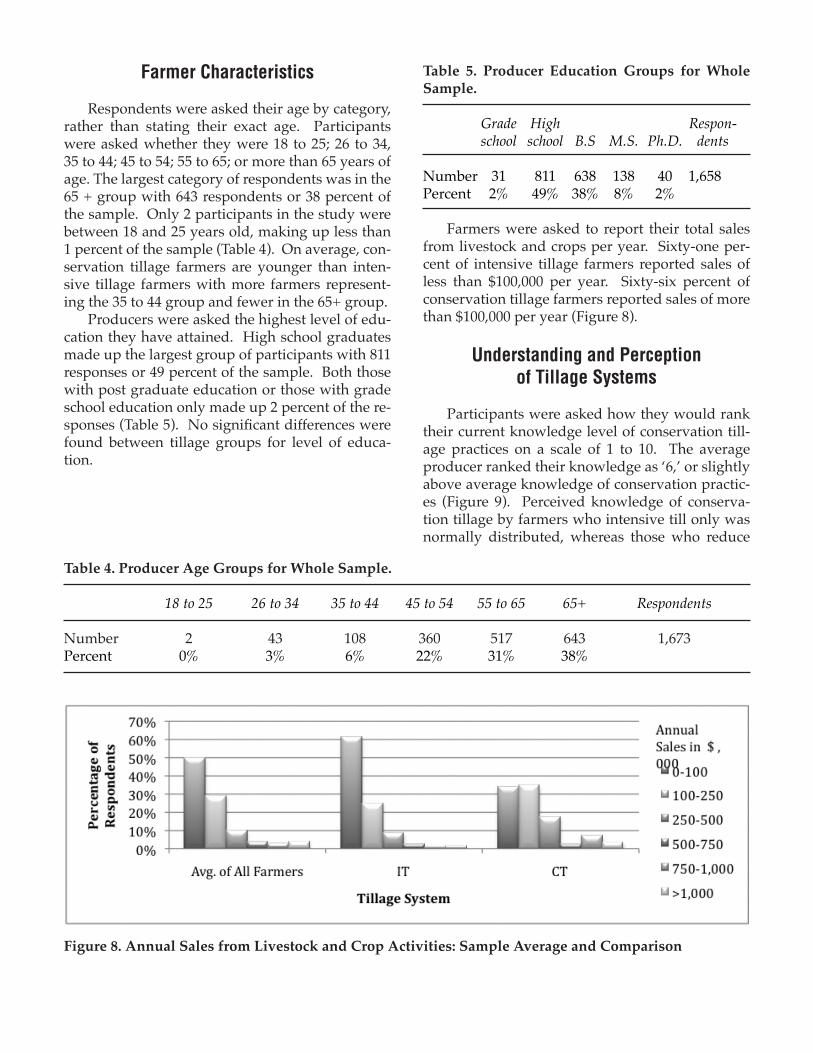
Farmers were asked to report their total sales from livestock and crops per year. Sixty-one per-cent of intensive tillage farmers reported sales of less than $100,000 per year. Sixty-six percent of conservation tillage farmers reported sales of more than $100,000 per year (Figure 8).
Understanding and Perception of Tillage Systems
Participants were asked how they would rank their current knowledge level of conservation till-age practices on a scale of 1 to 10. The average producer ranked their knowledge as ‘6,’ or slightly above average knowledge of conservation practic-es (Figure 9). Perceived knowledge of conserva-tion tillage by farmers who intensive till only was normally distributed, whereas those who reduce
Table 4. Producer Age Groups for Whole Sample.
18 to 25 26 to 34 35 to 44 45 to 54 55 to 65 65+ Respondents
Number 2 43 108 360 517 643 1,673Percent 0% 3% 6% 22% 31% 38%
Figure 8. Annual Sales from Livestock and Crop Activities: Sample Average and Comparison

till or conservation till perceived their knowledge to be higher on conservation practices (Figure 10). This might mean producers do not feel that they know enough about conservation tillage to try con-servation tillage on their own farm, or that conser-vation-tillage farmers have learned through hands-on experience.
Producers were asked to rank the benefits of conservation tillage on a scale of 1 to 8 with 8 repre-senting ‘Strongly Agree’ and 1 being ‘Strongly Dis-agree.’ On average, farmers found reducing labor and fuel costs and reducing soil erosion to be the most beneficial advantages of conservation tillage, and perceived increasing yield to be the least ben-
Figure 9. Perceived Knowledge of Conservation Tillage Practices for Whole Sample.
Figure 10. Perceived Knowledge of Conservation Tillage Practices by Tillage System.

eficial aspect. Intensive tillage farmers rated every benefit as equal to or less beneficial than the mean of all farmers. Farmers who use conservation till-age found much more benefit in conservation till-age than the intensive tillage farmers and the mean of all farmers (Table 6). Producers tend to all agree on which aspects of conservation tillage are most and least benefi-cial, however, they vary according to the amount in which they perceive each benefit by tillage group. Considering all perceived benefits, increasing yield appears to be the least important benefit to farm-ers using conservation tillage farming. Reducing fuel costs appears to be the most beneficial aspect of using conservation tillage farming to Oklahoma producers. Producers were asked to rank the problems with conservation tillage on a scale of 1 to 8 with 8 representing ‘Strongly Agree’ and 1 being ‘Strongly Disagree.’ Producers who intensively till perceive more problems with conservation tillage than the average of all producers. Conservation tillage pro-ducers perceive fewer problems with conservation tillage than the average of all producers (Table 7).
Perceived problems of conservation tillage seem to be opposing for those who intensive till versus those who currently practice conservation tillage. Lack of state and local research was seen as both one of the lowest problems for intensive tillage farmers and one of the largest problems for conservation tillage farmers. Other than research, conservation tillage producers perceive equipment cost and lack of knowledge of conservation tillage as the largest problems with conservation tillage. Again, other than research, intensive till producers perceive uncooperative landlords as the smallest problems they have with conservation tillage.
No-Till Extension
The survey included two questions pertain-ing to scholarly research and dissemination. First, producers were asked to rank the sources of infor-mation they receive through the Oklahoma Coop-erative Extension Services from 1 to 8, 8 indicat-ing ‘Very Useful’ and 1 representing ‘Not Useful.’ Farmers perceived county Extension meetings, field days, and fact sheets as being most useful
Table 7. Perceived Problems with Conservation tillage: Sample Average and Comparison.
Item Average of IT Only CT Only All Producers Producers Producers Mean Number Mean Number Mean Number
Lack of state/local research 5 1,409 4 444 6 102Increases weed pressure 6 1,514 6 491 4 106Soil fertility issues 5 1,445 5 462 4 102Increases insect pressure 6 1,468 6 475 4 105Residue management 5 1,486 6 480 4 106Equipment costs 6 1,513 6 486 5 107Increased management skills 6 1,469 5 467 6 107Poor economic returns 5 1,460 5 467 3 100Difficulty in getting a stand 5 1,474 5 468 3 105Inappropriate soil type 5 1,427 5 464 3 100Grazing concerns 5 1,476 6 475 4 104Reduces yields 5 1,462 5 468 3 103Uncooperative landlord 4 1,312 4 419 4 95Increases soil compaction 4 1,449 5 467 3 98Lack of rental equipment 5 1,373 5 447 4 96Increases soil and plant disease 5 1,440 6 459 4 101Lack of knowledge of conservation tillage 5 1,497 5 487 6 106

to them. E-mail and videoconferencing websites were shown to be least useful to these farmers. No differences were found between tillage groups (Ta-ble 8). Second, producers were asked which areas they think no-till research is appropriate. Produc-ers ranked areas of research from 1 to 8, 8 repre-senting ‘Appropriate’ and 1 as ‘Not Appropriate.’ All areas given were perceived to be appropriate, with weed control appearing most important for all farmers (Table 9).
Conclusion
Conservation tillage, or minimally disturbing the land, is practiced on approximately one-third
of crop land in Oklahoma. Farmers implementing conservation tillage practices typically use zero to one tillage pass per year, have more crop land, and plant a more diverse selection of crops. On aver-age, conservation tillage producers are younger than intensive tillage producers and have not been using their current tillage system as long as inten-sive tillers, but there are no large differences in ed-ucation level or sales between the two groups. Intensive tillage, or leaving less than 15 percent of the surface covered with residue after planting, is practiced on 43 percent of Oklahoma’s crop land. These farmers typically till their fields about four times per season, grow monoculture wheat, typi-cally for dual-purpose, grain and forage, and have been using their current tillage practice for at least
Table 8. Sources of Information: Sample Average and Comparison.
Item Average of IT Only CT Only All Producers Producers Producers Mean Number Mean Number Mean Number
County extension meeting 6 1,475 6 481 6 105Bus tours 5 1,379 5 451 5 91Equipment dealers 5 1,407 5 458 5 103Field days 6 1,448 6 469 6 105State-wide meetings 5 1,391 5 457 5 97Regional meetings 5 1,404 5 463 6 98Fact sheets 6 1,457 6 473 6 104Mass media 5 1,404 5 452 5 102E-mail 4 1,363 4 448 4 94Video conference websites 4 1,366 4 450 4 95
Table 9. Conservation tillage Research Topics: Sample Average and Comparison.
Item Average of IT Only CT Only All Producers Producers Producers Mean Number Mean Number Mean Number
Variety development 6 1,419 6 452 7 105Grazing management 7 1,444 6 455 7 107Rotational crops 7 1,452 6 454 7 110Soil compaction 6 1,446 6 454 7 106Weed control 7 1,492 7 480 7 108Equipment selection 6 1,451 6 460 7 106Soil fertility 7 1,461 6 461 7 111

the last five years. These farmers make up the larg-est portion of the sample, but have the smallest farm size (acres) on average. Between the two groups, conservation tillage farmers perceive themselves to know more about conservation tillage practices than intensive tillage farmers. Conservation tillage farmers also see more benefit in using these practices than other farmers, but both do agree on the greatest strengths of con-servation tillage. Intensive tillage farmers perceive
more problems with conservation tillage than con-servation tillage farmers do. With these results, it appears that increasing public knowledge of con-servation tillage, especially among intensive tillage farmers, will be beneficial in increasing adoption rate of conservation tillage practices. For further statistics and discussion please see Djido’s 2009 thesis, “Tillage practices in Oklahoma: Producers and farms spatial/regional characteris-tics.”

CONSERVATION TILLAGE SURVEYOklahoma State University
Division of Agricultural Sciences and Natural ResourcesDepartment of Agricultural Economics
368 Ag HallStillwater, OK 74078-6028
The following survey will ask you to respond to various questions about your tillage practices; we kind-ly request that you reflect for a moment or two on your experiences with different types of tillage practices. In particular, please review the definitions used in this survey for tillage practices, which are those used by Conservation Technology Information Center (CTIC). Your responses will provide valuable information regarding the role of reduced and no-tillage in Oklahoma. Any questions or concerns may be directed to Jeff Vitale at 405-744-6175.
Tillage Practice DefinitionConventional Till Includes several tillage passes and leaves less than 15% of residue on soil surface after planting.
Minimum or Reduced Till One to three full width tillage passes and leaves 15-30% of residue on the soil surface after planting.
No-till Minimum soil disturbance; practices that fall under no-till included strip-till, ridge-till, and vertical-till
Pleaseanswerinthespaceprovidedorwhereappropriate,circleyourresponse.
1. Rate your understanding of no-till practices:
No Knowledge Very knowledgeable 0 1 2 3 4 5 6 7 8 9 10 2. Of your acres farmed, how many are conventionallytilled? a. Wheat ______ acresb. Corn ______ acresc. Cotton ______ acres d. Sorghum ______ acres Please list other crops (include acres) that are conventionally tilled: ______________________________________________________________________
3. Of your acres farmed, how many areminimumorreducedtilled? a. Wheat ______ acresb. Corn ______ acresc. Cotton ______ acres d. Sorghum ______ acres Please list other crops (include acres) that are minimum or reduced tilled: ______________________________________________________________________

4. Of your acres farmed, how many are no-tilled? a. Wheat ______ acresb. Corn ______ acresc. Cotton ______ acres d. Sorghum ______ acres Please use this space to list other crops (include acres) that are no-tilled: ______________________________________________________________________
5. How many tillagepasses do you typically make when using the following practices?a. Conventional-till 0 1 2 3 4 5 6+b. Reduced-till 0 1 2 3 4 5 6+c. No-till 0 1 2 3 4 5 6+
6. Please list the typeoftillageimplements you use in the following practices (ex. tandem disk, offset disk, chisel plow, sweep plow, moldboard plow, or others):a. Conventional-till _______________________b. Reduced-till _______________________
7. How many years have you used your current tillage practices? 1 2 3 4 5+
8. Have you tried a form of no-till before and switched back to conventional till?
a. YES b. NO If YES, for how many years did you try no-till? 1 2 3 4 5+ and which crop(s) did you try no-till? _______________
9. Which of the following do you believe are potential benefits of no-till? Strongly Agree Strongly Disagreea. Reduces labor costs 8 7 6 5 4 3 2 1b. Reduces fuel costs 8 7 6 5 4 3 2 1c. Reduces equipment costs 8 7 6 5 4 3 2 1d. Reduces soil erosion 8 7 6 5 4 3 2 1e. Increases yield 8 7 6 5 4 3 2 1f. Generates greater profits 8 7 6 5 4 3 2 1g. Conserves soil moisture 8 7 6 5 4 3 2 1h. Reduces soil compaction 8 7 6 5 4 3 2 1i. Improves ecological diversity 8 7 6 5 4 3 2 1

10. Which of the following do you believe are potential problems that restrict the use of no-till? Strongly Agree Strongly Disagreea. Lack of state/local research 8 7 6 5 4 3 2 1b. Increases weed pressure 8 7 6 5 4 3 2 1c. Soil fertility issues 8 7 6 5 4 3 2 1d. Increases insect pressure 8 7 6 5 4 3 2 1e. Residue management 8 7 6 5 4 3 2 1f. Equipment costs 8 7 6 5 4 3 2 1g. Increased management skills 8 7 6 5 4 3 2 1h. Poor economic returns 8 7 6 5 4 3 2 1i. Difficulty in getting a stand 8 7 6 5 4 3 2 1j. Inappropriate soil type 8 7 6 5 4 3 2 1k. Grazing concerns 8 7 6 5 4 3 2 1l. Reduces yields 8 7 6 5 4 3 2 1m. Uncooperative landlord 8 7 6 5 4 3 2 1n. Increases soil compaction 8 7 6 5 4 3 2 1o. Lack of rental equipment 8 7 6 5 4 3 2 1p. Increases soil and plant disease 8 7 6 5 4 3 2 1q. Lack of knowledge on no-till 8 7 6 5 4 3 2 1
11. Which of the following sourcesofinformationdo you consider to be useful in receiving information on no-tillage practices? Very Useful Not Usefula. County Extension meetings 8 7 6 5 4 3 2 1b. Bus tours 8 7 6 5 4 3 2 1c. Equipment dealers 8 7 6 5 4 3 2 1d. Field Days 8 7 6 5 4 3 2 1e. State-wide meetings 8 7 6 5 4 3 2 1f. Regional meetings 8 7 6 5 4 3 2 1g. Fact Sheets 8 7 6 5 4 3 2 1h. Mass media 8 7 6 5 4 3 2 1i. E-mail 8 7 6 5 4 3 2 1j. Video conference websites 8 7 6 5 4 3 2 1

12. Which areas do you consider to be appropriate topics for no-tillresearch to focus on? Appropriate Not appropriatea. Variety development 8 7 6 5 4 3 2 1b. Grazing management 8 7 6 5 4 3 2 1c. Rotational crops 8 7 6 5 4 3 2 1d. Soil compaction 8 7 6 5 4 3 2 1e. Weed control 8 7 6 5 4 3 2 1f. Equipment selections 8 7 6 5 4 3 2 1g. Soil fertility 8 7 6 5 4 3 2 1
13. Please indicate the numberoftractors you own.a. 125 HP or less 0 1 2 3 4+b. 125-175 HP 0 1 2 3 4+c. 176-225 HP 0 1 2 3 4+d. > 225 HP 0 1 2 3 4+
14. Please indicate the numberofimplements you currently use in your tillage operations:a. Tandem disk 0 1 2 3 4+b. Offset disk 0 1 2 3 4+c. Chisel plow 0 1 2 3 4+d. Sweep plow 0 1 2 3 4+e. Moldboard plow 0 1 2 3 4+f. Field cultivator 0 1 2 3 4+g. Strip-till unit 0 1 2 3 4+h. Vertical till 0 1 2 3 4+i. Other ______________ 0 1 2 3 4+
15. Please indicate the numberofimplements you currently use in your plantingoperations:a. Air seeder 0 1 2 3 4+ Type: Conventional No-tillb. Row crop planter 0 1 2 3 4+ Type: Conventional No-tillc. Double disk drill 0 1 2 3 4+ Type: Conventional No-tilld. Single disk drill 0 1 2 3 4+ Type: Conventional No-tille. Hoe drill 0 1 2 3 4+ Type: Conventional No-till
16. Please indicate the numberofotherimplements currently used in your production:a. Anhydrous applicator 0 1 2 3 4+b. Combine 0 1 2 3 4+c. Sprayer 0 1 2 3 4+ d. Fertilizer spreader (dry) 0 1 2 3 4+ e. Fertilizer spreader (wet) 0 1 2 3 4+

Small Grain Growers 17. What is the primarypurpose of your small grain seedlings?Grain only Graze only Dual (grain and graze)
18. Does livestock negatively impact adoption of no-till on your small grain acres? YES NO
19. Do you graze your no-till small grain acres (circle)? YES NO____________________________________________________________________________ 20. Do you practice a croprotation (circle)? YES NO If you answered YES, please list the crops you rotate in sequence by number of years/fallow. ______________________________________________________________________
21. Please circle your agegroup:18-25 26-34 35-44 45-54 55-65 Over 65
22. What is your highest levelofeducation? Grade School High School B.S. M.S. Ph.D.
23. Your total cropandlivestock sales in an average year are:$0-100,000 $100,000-250,000 $250,000-500,000$500,000-750,000 $750,000-1,000,000 More than $1,000,000
24. What is the approximatesplit in your farm income between crop sales and livestock sales?Crops ___________ % Livestock ___________ %
25. Approximately how many hours per week do you workoff-farm? None 1-5 hours 6-10 hours11-20 hours 21-40 hours More than 40 hours
26. Approximately what percentage of your income is from off-farm? None 10 percent 25 percent 50 percent More than 75 percent
27. How many acres of cultivated land do you rent in a typical year?____________ acres
