conservation reserve program - fsa.usda.gov · this report provides statistics for land enrolled in...
TRANSCRIPT
Conservation Reserve Program
ANNUAL SUMMARY AND ENROLLMENT
STATISTICS
FY 2010
This report provides statistics for land enrolled in the Conservation Reserve Program (CRP), including a summary of FY 2010 CRP related activities, FY 2010 CRP outlays by payment type, continuous CRP enrollment activity, outlay and sign-up history, CRP practice and payment provisions, and environmental benefits index (EBI) history. The tables are based on contract data developed and maintained in CRP data files by Farm Service Agency (FSA) service centers and are generally based on the physical location of the CRP contracted land. The FY 2010 ended September 30, 2010. Data from Nevada, and Rhode Island not reported because of confidentiality concerns. Data from these States are included in the totals.
The report was prepared by Alex Barbarika, Natural Resources Analysis Group, Economic and Policy Analysis Staff (EPAS), Farm Service Agency (FSA), U.S. Department of Agriculture, with assistance from Skip Hyberg, Rich Iovanna, and Catherine Feather with EPAS/FSA. Assistance and support from the Conservation and Environmental Protection Division is greatly appreciated. CONTENTS Overview .........................................................................................................................................................1 Activities .........................................................................................................................................................2 Environmental Benefits of CRP......................................................................................................................3 CRP Description and History........................................................................................................................10 Acres Enrolled by Year and Signup ..............................................................................................................17 Number of Contracts by Year and Signup ....................................................................................................18 Outlays by Payment Type and State .............................................................................................................19 Enrollment by Signup Type and State ..........................................................................................................20 Enrollment by Conservation Practice ...........................................................................................................26 Enrollment by Erodibility Index ...................................................................................................................33 Expirations by Year ......................................................................................................................................34 Results of 2009 Contract Extension ..............................................................................................................36 Results of 2006 Re-Enrollment and Extension (REX) .................................................................................37 Sign-up Periods and Eligibility Criteria ........................................................................................................41 Conservation Practices and Payment Provisions ..........................................................................................43 Environmental Benefits Index Factors and Points ........................................................................................45

CONSERVATION RESERVE PROGRAM
CONTRACTS IN EFFECT, SEPTEMBER 30, 2010 Sign-up Type Contracts Farms Acres Annual Rental Payments b/ ($Million) ($/Acre) General 342,584 225,595 26,664,009 $1,188 $44.57 Continuous Non-CREP 320,160 191,008 3,205,013 $297 $92.56 CREP 68,624 45,203 1,197,175 $155 $129.63 Farmable Wetland 13,274 10,492 232,048 $26 $114.61 Total Continuous 402,088 233,555 a/ 4,634,236 $478 $103.22 Total 744,672 416,459 a/ 31,298,245 $1,667 $53.25 a/ Number of farms not additive across sign-up types because a farm may participate in multiple sign-up types. b/ Approximates payments which were paid October 2010 (FY 2011), before adjustments for haying/grazing, non-compliance, terminations, part-year contracts. Includes annual incentive and maintenance allowance, but not one-time up-front signing and practice incentive payments.
-1-

CRP ACTIVITIES, FY 2010 October, 2009 $ $1.7 billion in CRP rental payments issued for lands enrolled as of September 30, 2009. November 2009 $ 100,000-acre South Dakota James River CREP agreement signed. February 2010 $ Increases allocations for SAFE (+150,000 acres), Duck Nesting (+50,000 acres), and Upland
Bird Buffers (+100,000 acres). $ USDA announces MOU with Pheasants Forever to enhance conservation efforts. May 2010 $ USDA announces signup for Transitions Incentive Program.
July 2010 $ USDA announces general signup 39 to begin on August 2, 2010. August 2010 $ USDA announces acceptance of 4.3 million acres under general signup 39. Conservation Reserve Program Outlays ($1,000) 1/
Payment FY 2005 FY 2006 FY 2007 FY 2008 FY 2009 FY 2010
Annual Rental $1,630,585 $1,666,462 $1,727,408 $1,785,767 $1,720,631 $1,709,079
Signing Incentive $25,304 $32,577 $18,366 $25,164 $25,828 $70,181*Practice Incentive $49,238 $49,573 $39,026 $43,246 $45,855
Haying/Grazing Adj. ($11,316) ($8,545) ($9,542) ($12,147) ($12,504) ($9,518)
Wetland Restoration Incent. $1,289 $1,105 $1,030 $932 $517 *
Cost-Share $93,235 $100,096 $89,844 $84,238 $74,947 $66,721
Total $1,788,334 $1,841,268 $1,866,131 $1,927,200 $1,855,274 $1,836,614 * Breakdown of incentive outlays no longer provided. 1/ Not including technical assistance. Some outlay totals may have been updated from previous Annual Summaries.
-2-

Environmental Benefits of the Conservation Reserve Program United States 2010
Fiscal Year 2006 2007 2008 2009 2010 Land enrolled million acres 36.0 36.8 34.6 33.8 31.3
In Buffers million acres 1.84 1.90 2.00 2.01 2.02 Wetlands million acres 2.01 2.06 1.98 1.98 2.05
HEL million acres 25.2 25.5 23.6 22.8 20.5
Reductions (not leaving field or intercepted by buffers)Sediment million tons 210 216 219 220 220 Nitrogen million lbs 607 623 616 611 607
Phosphorus million lbs 121 124 123 123 122 Greenhouse Gas Reduction ( CO2 equivalent/Year)CO2 Sequestered million metric tons 51 50 48 47 44 Energy and Fertilizer million metric tons 9 9 9 8 8
Total million metric tons 60 60 57 55 52 CRP improves water quality. Water quality benefits accrue in two ways:
CRP reduces the nitrogen and phosphorus leaving a field in runoff and percolate. Using models developed by the Food and Agricultural Policy Research Institute (FAPRI), in FY 2010 an estimated 607 million pounds less nitrogen and 122 million pounds less phosphorus left fields due to CRP, 95 and 86 percent reductions, respectively.
Grass filters and riparian buffers (partial field enrollments) intercept sediment, nutrients, and other contaminants before they enter waterways. Based on FAPRI’s model, an estimated 356 million pounds of nitrogen and 72 million pounds of phosphorus were intercepted by CRP buffers, nationally in FY 2010.
In 2010, grass and tree plantings reduced nitrate loss by 109 million pounds. Nitrate is a form of nitrogen that is biologically available to algae. Excess nitrate contributes to the formation of hypoxic zones in the Gulf of Mexico, Chesapeake Bay, and other waters.
Wetlands restored and constructed by CRP improve water quality by converting nitrate / nitrogen into benign atmospheric nitrogen. In 2010, Iowa’s 65 CREP constructed wetland projects on 1,808 acres reduced nitrate runoff by nearly 650,000 pounds.
-3-
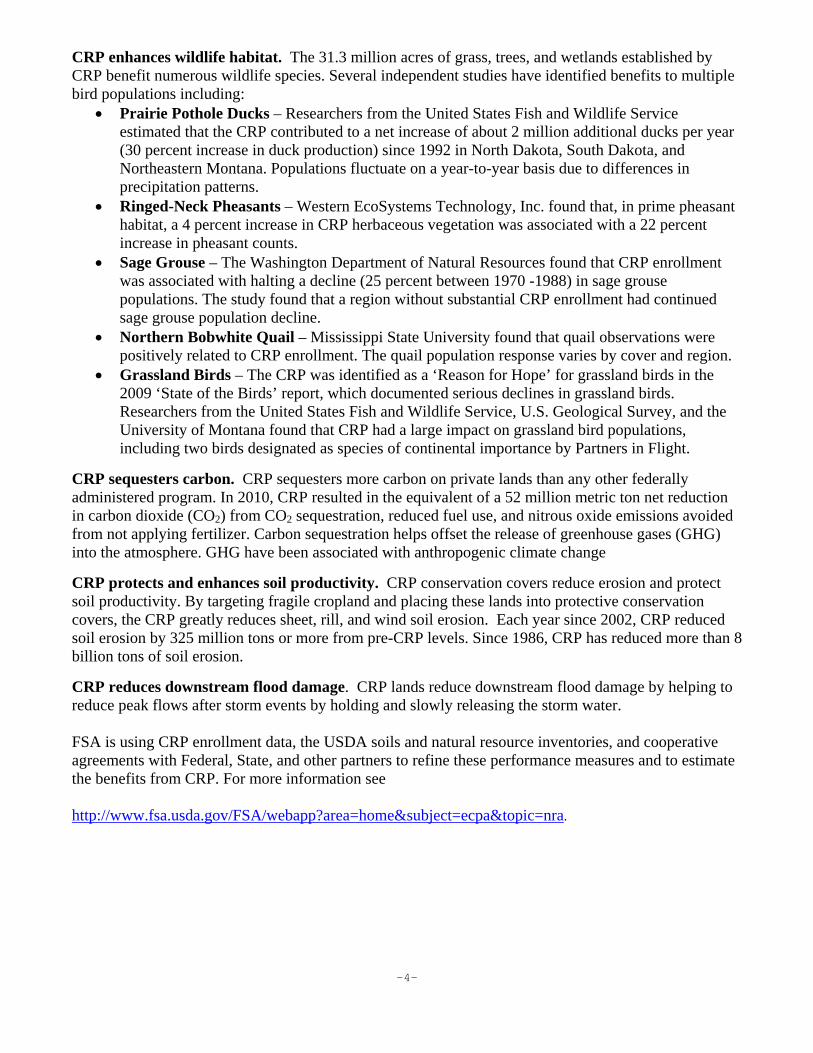
CRP enhances wildlife habitat. The 31.3 million acres of grass, trees, and wetlands established by CRP benefit numerous wildlife species. Several independent studies have identified benefits to multiple bird populations including:
Prairie Pothole Ducks – Researchers from the United States Fish and Wildlife Service estimated that the CRP contributed to a net increase of about 2 million additional ducks per year (30 percent increase in duck production) since 1992 in North Dakota, South Dakota, and Northeastern Montana. Populations fluctuate on a year-to-year basis due to differences in precipitation patterns.
Ringed-Neck Pheasants – Western EcoSystems Technology, Inc. found that, in prime pheasant habitat, a 4 percent increase in CRP herbaceous vegetation was associated with a 22 percent increase in pheasant counts.
Sage Grouse – The Washington Department of Natural Resources found that CRP enrollment was associated with halting a decline (25 percent between 1970 -1988) in sage grouse populations. The study found that a region without substantial CRP enrollment had continued sage grouse population decline.
Northern Bobwhite Quail – Mississippi State University found that quail observations were positively related to CRP enrollment. The quail population response varies by cover and region.
Grassland Birds – The CRP was identified as a ‘Reason for Hope’ for grassland birds in the 2009 ‘State of the Birds’ report, which documented serious declines in grassland birds. Researchers from the United States Fish and Wildlife Service, U.S. Geological Survey, and the University of Montana found that CRP had a large impact on grassland bird populations, including two birds designated as species of continental importance by Partners in Flight.
CRP sequesters carbon. CRP sequesters more carbon on private lands than any other federally administered program. In 2010, CRP resulted in the equivalent of a 52 million metric ton net reduction in carbon dioxide (CO2) from CO2 sequestration, reduced fuel use, and nitrous oxide emissions avoided from not applying fertilizer. Carbon sequestration helps offset the release of greenhouse gases (GHG) into the atmosphere. GHG have been associated with anthropogenic climate change
CRP protects and enhances soil productivity. CRP conservation covers reduce erosion and protect soil productivity. By targeting fragile cropland and placing these lands into protective conservation covers, the CRP greatly reduces sheet, rill, and wind soil erosion. Each year since 2002, CRP reduced soil erosion by 325 million tons or more from pre-CRP levels. Since 1986, CRP has reduced more than 8 billion tons of soil erosion.
CRP reduces downstream flood damage. CRP lands reduce downstream flood damage by helping to reduce peak flows after storm events by holding and slowly releasing the storm water. FSA is using CRP enrollment data, the USDA soils and natural resource inventories, and cooperative agreements with Federal, State, and other partners to refine these performance measures and to estimate the benefits from CRP. For more information see http://www.fsa.usda.gov/FSA/webapp?area=home&subject=ecpa&topic=nra.
-4-
Nitrogen, Phosphorus, and Sediment Reduction Estimates Estimates are based on the results of the modeling done in support of a 2007 study of the water and air quality impacts of the CRP using the Environmental Policy Integrated Climate (EPIC) model and the Agricultural Policy Environmental eXtender (APEX) model 1/. CRP contract data are sorted to identify acres in grass, trees, and buffers. For whole-field (grass and tree plantings), the models are used to estimate per-acre N, P, and sediment losses from CRP fields, as compared with the losses that would occur if those fields instead cropped, i.e., “with-” vs. “without-” CRP scenarios. The impact of CRP is estimated as the difference between these two scenarios. N and P impacts of CRP buffers are estimated based on the sediment, N, and P losses from the (state) average acres buffered by a typical buffer enrollment and trapping efficiency estimates from NRCS. The total impact on sediment, N, and P is the sum of the grass, tree, and buffer impacts. 1/ Food, and Agricultural Policy Research Institute (FAPRI). Estimating the Water Quality, Air Quality, and Soil Carbon Benefits of the Conservation Reserve Program. FAPRI -UMC Report #01-07. University of Missouri, Columbia, MO. January 2007.
Carbon Sequestration Estimates Estimates of total carbon sequestered are developed using CRP contract data. These data are sorted to identify CRP acres in grass, wetlands, and trees. For grasslands and wetlands, estimates of the carbon sequestered per acre are obtained from published reports, and estimates developed by the Agricultural Research Service and U.S. Geological Survey. These data are merged with CRP contract data to estimate total carbon sequestered by CRP grasslands and wetlands. Because the carbon sequestered by forestlands varies by tree species and the age of the stand, the CRP tree data are sorted by region and age. U.S. Forest Service estimates of carbon sequestered per acre by region, tree species, and age are merged with the corresponding data from CRP contract data. Total carbon sequestered is the sum of the grassland, wetland, and forestland estimates.
-5-

Environmental Benefits of the Conservation Reserve Program
Chesapeake Bay
Basin 2010
Fiscal Year 2006 2007 2008 2009 2010 Land Enrolled 1,000 acres 314 322 316 303 302 In Buffers 1,000 acres 96 100 105 103 107 In Wetlands 1,000 acres 5 5 5 6 6
Reductions (intercepted by buffers or not leaving field)
Sediment million tons 11 11 11 11 11 Nitrogen million lbs 26 27 27 27 27 Phosphorus million lbs 7 7 7 7 7
Carbon Sequestered million metric tons 0.5 0.5 0.5
0.5 0.5 CRP buffers intercept sediment, nitrogen, and phosphorus from farmed fields:
In the Chesapeake Bay watershed, buffers intercepted 8 million tons of sediment, 16 million pounds of nitrogen, and 5 million pounds of phosphorus in 2010.
Fields enrolled in CRP reduce the amount of nitrogen, phosphorus, and sediment leaving fields in runoff and percolate:
CRP reduces the nitrogen, phosphorus, and sediment leaving a field in runoff and percolate. Ninety five percent less nitrogen and 86 percent less phosphorus is lost from CRP fields than fields that are not in CRP.
-6-

Environmental Benefits of the Conservation Reserve Program
Great Lakes
Region 2010
2006 2007 2008 2009 2010 Land Enrolled 1,000 acres 602 613 565 531 507
In Buffers 1,000 acres 100 104 106 103 106 In Wetlands 1,000 acres 28 31 32 34 33
Reductions (intercepted by buffers or not leaving field)
Sediment million tons 4 4 4 4 4 Nitrogen million lbs 16 17 17 15 15 Phosphorus million lbs 3 3 3 3 3
Carbon Sequestered million metric tons 0.8 0.8 0.8 0.8
0.7
CRP buffers intercept sediment, nitrogen, and phosphorus from farmed fields:
In 2010, in the Great Lakes Region 106 thousand acres of CRP grass filters and riparian buffers intercepted 3 million tons of sediment, 10 million pounds of nitrogen, 3 million pounds of phosphorus, and other contaminants before they entered waterways.
Fields enrolled in CRP reduce nitrogen, phosphorus, and sediment leaving fields in runoff and percolate:
CRP reduces the nitrogen, phosphorus, and sediment leaving a field in runoff and percolate. 95 percent less nitrogen and 86 percent less phosphorus is lost from CRP fields. In 2010, grass and tree plantings reduced nitrate loss by 3 million pounds.
-7-

Environmental Benefits of the Conservation Reserve Program
Mississippi River
Basin 2010
Fiscal Year 2006 2007 2008 2009 2010Land Enrolled million acres 24.4 25.0 23.4 22.7 21.0 In Buffers million acres 1.27 1.31 1.39 1.32 1.40 In Wetland million acres 1.22 1.27 1.21 1.22 1.29 HEL million acres 18.4 18.6 17.3 16.7 14.9
Reductions (intercepted by buffers or not leaving field)
Sediment million tons 170 175 175 164 159 Nitrogen million lbs 442 454 430 431 431 Phosphorus million lbs 90 93 89 89 89
Carbon Sequestered million metric tons 32 30 30 29 28
CRP improves water quality.
In 2010, CRP grass filters and riparian buffers intercepted 113 million tons of sediment in the Mississippi River Basin, 269 million pounds of nitrogen, 54 million pounds of phosphorus, and other contaminants, before they entered waterways.
In 2010, grass and tree plantings reduced nitrate loss by 60 million pounds. Nitrate is a form of nitrogen that is biologically available to algae, and excess nitrate contributes to the formation of the Gulf of Mexico hypoxic zone.
Wetlands restored and constructed by CRP improve water quality by converting nitrate / nitrogen into benign atmospheric nitrogen through denitrification. In 2010, Iowa’s 65 CREP constructed wetland projects on 1,808 acres reduced nitrate runoff by nearly 650,000 pounds.
CRP enhances wildlife habitat and reduces downstream flood damage In prime ringed-neck-pheasant habitat, a 4 percent increase in CRP herbaceous vegetation was
associated with a 22 percent increase in pheasant counts. CRP lands reduce downstream flood damage by helping to reduce peak flows after storm events
by holding and slowly releasing the stormwater.
-8-

Environmental Benefits of the Conservation Reserve Program
Prairie Pothole
Region 2010
2006 2007 2008 2009 2010Land Enrolled million acres 8.4 8.5 7.7 7.4 7.2 In Wetlands 1,000 acres 1,645 1,661 1,567 1,558 1581 In Buffers 1,000 acres 309 314 316 321 321
Reductions (intercepted by buffers or not leaving field)
Sediment million tons 22 23 23 23 23 Nitrogen million lbs 113 116 113 113 113 Phosphorus million lbs 11 12 12 11 11
Carbon Sequestered million metric tons 10 10 9 9 9
CRP improves water quality.
CRP buffers intercept sediment, nitrogen, and phosphorus from farmed fields in the Prairie Pothole Region. In 2010, 321 thousand acres of CRP grass filters and riparian buffers intercepted 20 million tons of sediment in the Prairie Pothole Region, 70 million pounds of nitrogen, and 10 million pounds of phosphorus.
CRP reduces nitrogen, phosphorus, and sediment leaving fields. In 2010, grass and tree plantings reduced nitrate loss by 31 million pounds.
CRP enhances wildlife habitat.
The CRP was identified as a ‘Reason for Hope’ for grassland birds in the ‘State of the Birds’ report (FWS, 2009).
CRP increased Prairie Pothole duck populations by an average of 2 million ducks per year between 1992 and 2004 (FWS).
CRP can reduce downstream flood damage.
CRP restores Prairie Pothole floodwater storage function – USGS estimated that CRP wetland catchments could store approximately 458,000 acre-feet of water annually.
-9-
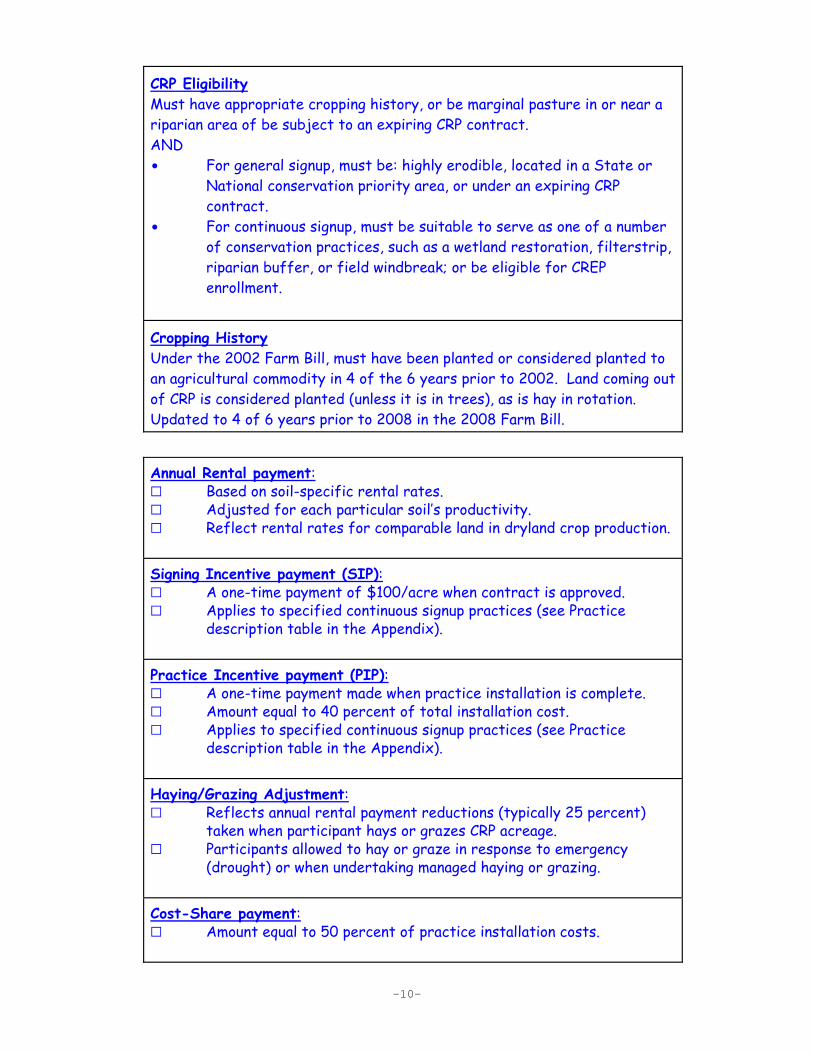
CRP Eligibility Must have appropriate cropping history, or be marginal pasture in or near a riparian area of be subject to an expiring CRP contract. AND $ For general signup, must be: highly erodible, located in a State or
National conservation priority area, or under an expiring CRP contract.
$ For continuous signup, must be suitable to serve as one of a number of conservation practices, such as a wetland restoration, filterstrip, riparian buffer, or field windbreak; or be eligible for CREP enrollment.
Cropping History Under the 2002 Farm Bill, must have been planted or considered planted to an agricultural commodity in 4 of the 6 years prior to 2002. Land coming out of CRP is considered planted (unless it is in trees), as is hay in rotation. Updated to 4 of 6 years prior to 2008 in the 2008 Farm Bill.
Annual Rental payment: G Based on soil-specific rental rates. G Adjusted for each particular soil’s productivity. G Reflect rental rates for comparable land in dryland crop production.
Signing Incentive payment (SIP): G A one-time payment of $100/acre when contract is approved. G Applies to specified continuous signup practices (see Practice
description table in the Appendix).
Practice Incentive payment (PIP): G A one-time payment made when practice installation is complete. G Amount equal to 40 percent of total installation cost. G Applies to specified continuous signup practices (see Practice
description table in the Appendix).
Haying/Grazing Adjustment: G Reflects annual rental payment reductions (typically 25 percent)
taken when participant hays or grazes CRP acreage. G Participants allowed to hay or graze in response to emergency
(drought) or when undertaking managed haying or grazing.
Cost-Share payment: G Amount equal to 50 percent of practice installation costs.
-10-
CONSERVATION RESERVE PROGRAM
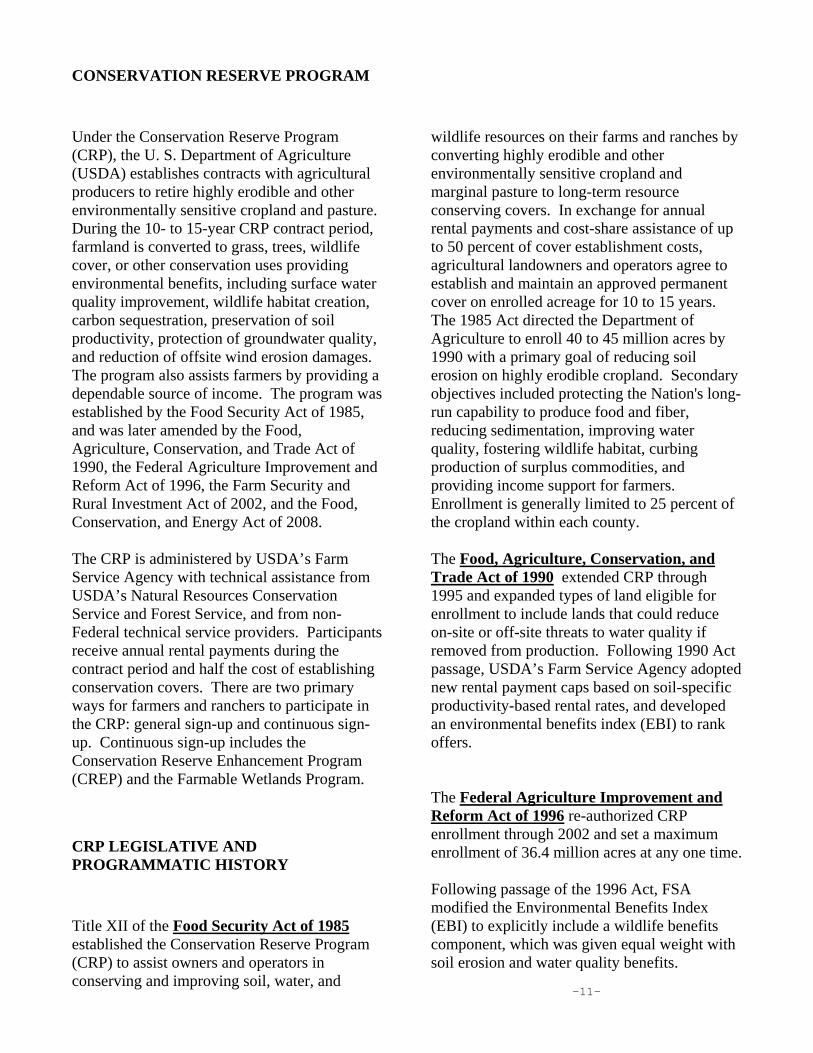
Under the Conservation Reserve Program (CRP), the U. S. Department of Agriculture (USDA) establishes contracts with agricultural producers to retire highly erodible and other environmentally sensitive cropland and pasture. During the 10- to 15-year CRP contract period, farmland is converted to grass, trees, wildlife cover, or other conservation uses providing environmental benefits, including surface water quality improvement, wildlife habitat creation, carbon sequestration, preservation of soil productivity, protection of groundwater quality, and reduction of offsite wind erosion damages. The program also assists farmers by providing a dependable source of income. The program was established by the Food Security Act of 1985, and was later amended by the Food, Agriculture, Conservation, and Trade Act of 1990, the Federal Agriculture Improvement and Reform Act of 1996, the Farm Security and Rural Investment Act of 2002, and the Food, Conservation, and Energy Act of 2008. The CRP is administered by USDA’s Farm Service Agency with technical assistance from USDA’s Natural Resources Conservation Service and Forest Service, and from non-Federal technical service providers. Participants receive annual rental payments during the contract period and half the cost of establishing conservation covers. There are two primary ways for farmers and ranchers to participate in the CRP: general sign-up and continuous sign-up. Continuous sign-up includes the Conservation Reserve Enhancement Program (CREP) and the Farmable Wetlands Program.
CRP LEGISLATIVE AND PROGRAMMATIC HISTORY
Title XII of the Food Security Act of 1985 established the Conservation Reserve Program (CRP) to assist owners and operators in conserving and improving soil, water, and
wildlife resources on their farms and ranches by converting highly erodible and other environmentally sensitive cropland and marginal pasture to long-term resource conserving covers. In exchange for annual rental payments and cost-share assistance of up to 50 percent of cover establishment costs, agricultural landowners and operators agree to establish and maintain an approved permanent cover on enrolled acreage for 10 to 15 years. The 1985 Act directed the Department of Agriculture to enroll 40 to 45 million acres by 1990 with a primary goal of reducing soil erosion on highly erodible cropland. Secondary objectives included protecting the Nation's long-run capability to produce food and fiber, reducing sedimentation, improving water quality, fostering wildlife habitat, curbing production of surplus commodities, and providing income support for farmers. Enrollment is generally limited to 25 percent of the cropland within each county. The Food, Agriculture, Conservation, and Trade Act of 1990 extended CRP through 1995 and expanded types of land eligible for enrollment to include lands that could reduce on-site or off-site threats to water quality if removed from production. Following 1990 Act passage, USDA’s Farm Service Agency adopted new rental payment caps based on soil-specific productivity-based rental rates, and developed an environmental benefits index (EBI) to rank offers. The Federal Agriculture Improvement and Reform Act of 1996 re-authorized CRP enrollment through 2002 and set a maximum enrollment of 36.4 million acres at any one time. Following passage of the 1996 Act, FSA modified the Environmental Benefits Index (EBI) to explicitly include a wildlife benefits component, which was given equal weight with soil erosion and water quality benefits.
-11-

Also in 1996, USDA initiated enrollment of selected practices, such as filter strips and riparian buffers, on a continuous basis without competition. An annual incentive payment equal to 20 percent of the annual rental rate was provided for many of these practices. In 1997, FSA created the Conservation Reserve Enhancement Program (CREP), further advancing CRP’s environmental targeting. CREP authorizes State-Federal conservation partnerships that address specific State and nationally significant water quality, soil erosion, and wildlife habitat concerns related to agriculture. CREP enrollment is held on a continuous basis; enrollment may include both general and continuous sign-up practices, and additional financial incentives are generally provided. An up-front signing payment and a practice incentive payment were established in 2000 to further enhance continuous enrollment, including CREP. Descriptions of practices and corresponding payment provisions are provided in the Appendix. The FY 2001 Agriculture Appropriations Act established the Farmable Wetland Program (FWP), which provided for non-competitive enrollment under continuous sign-up provisions and incentives for up to 500,000 acres of small non-flood plain wetlands and adjacent uplands in 6 States (Nebraska, Iowa, Minnesota, North Dakota, South Dakota, and Montana). Enrollment was limited to 100,000 acres per State. The Farm Security and Rural Investment Act of 2002 extended CRP enrollment authority through 2007 and increased the enrollment cap by 2.8 million acres to 39.2 million acres. Basic cropland eligibility is re-defined to be land that has been cropped or considered cropped in at least 4 of the 6 years preceding enactment. Previously, basic cropland eligibility required cropping in at least 2 of the 5 years preceding sign-up.
In addition, the 2002 Act permitted non-emergency (managed) harvesting of forage (subject to the requirement that environmental benefits be maintained or enhanced) and required equal consideration be given for soil
erosion, water quality, and wildlife. Practices eligible under marginal pasture criteria, which have no cropping history requirement, are expanded to permit appropriate vegetative covers, rather than requiring the land be planted only to trees. Other changes included extending eligibility to field remnants made infeasible for farming where buffer practices are enrolled; cropland where enrollment would provide water conservation benefits; and land subject to expiring CRP contracts. The 2002 Act also expanded FWP from the original six States to all States and raised the enrollment cap to 1,000,000 acres, while keeping the 100,000 acre State maximum. While maximum wetland size was increased to 10 acres, only 5 acres are eligible to receive rental payments. Re-enrollment and extension of 2007- to 2010-expiring contracts (REX). To ensure that CRP’s benefits continue without interruption, FSA in 2006 offered holders of contracts set to expire between 2007 and 2010 (28 million acres) the opportunity to re-enroll or extend their contracts. FSA divided expiring contracts into five equal-size categories (quintiles) based on environmental benefits index (EBI) scores of the land under contract. FSA offered the quintile with the highest EBI scores new 10 or 15-year contracts. The 2nd highest quintile were offered 5-year contract extensions, the 3rd highest were offered 4-year extensions, and so forth. This action preserved farmers’ ability to protect America’s most sensitive agricultural lands. Holders of approximately 82% of expiring contract acres were approved for re-enrollment or extension. Updated tables detailing REX results as of February, 2008 are provided in the Appendix. The Emergency Supplemental Appropriations Act of 2006 established the Emergency Forestry Conservation Reserve Program (EFCRP). Provides assistance to timberland damaged by the Gulf Coast Hurricanes of 2005 (mainly Katrina and Rita). Acreage enrolled does not count against the CRP enrollment cap.
-12-

The Food, Conservation, and Energy Act of 2008 extended Conservation Reserve Program (CRP) enrollment authority through September 30, 2012 and requires that enrollment be reduced to no more than 32 million acres beginning October 1, 2009. Created the Transitions Incentive Program to encourage the sale or lease of expiring CRP lands to beginning or socially disadvantaged farmers. Other changes include: (1) expansion of Farmable Wetland Pilot Program eligibility criteria; (2) provision of 50-percent cost-share for tree thinning activities; (3) implementation of new payment limitation applicability and new adjusted gross income based eligibility criteria, (4) updated eligibility to require cropping history in at least 4 of 6 years during 2002 to 2007, and (5) provided additional authority to waive county cropland enrollment limit.
-13-

General Sign-up. Landowners and operators with eligible lands compete nationally for acceptance based on an environmental benefits index (EBI) during specified enrollment periods. Producers may submit offers below soil-specific maximum rental rates to increase their EBI ranking.
Continuous Sign-up G Non-CREP. Landowners and operators with eligible lands may enroll certain high priority
conservation practices, such as filter strips and riparian buffers, at any time during the year without competition. In addition to annual soil rental payment and cost-share assistance, many practices are eligible for additional annual and one-time up-front financial incentives.
G Conservation Reserve Enhancement Program (CREP). Under federal-state cooperative conservation efforts, landowners and operators implement projects designed to address specific environmental objectives through targeted CRP enrollments. Sign-up is held on a continuous non-competitive basis and additional financial incentives are generally provided.
G Farmable Wetland Program (FWP). Landowners and operators enroll and restore small cropped wetlands and other lands on a continuous sign-up basis. Lands are also eligible for additional annual and one-time up-front financial incentives. Includes new practices added by the 2008 Farm Bill.
-14-
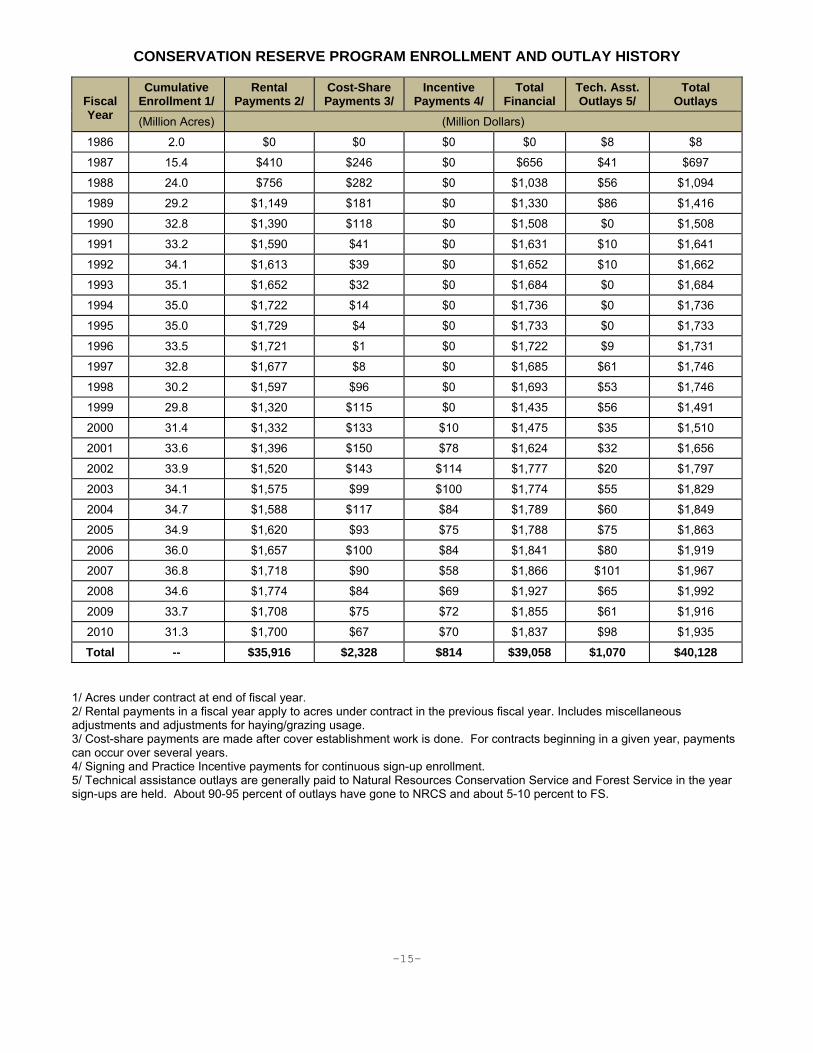
CONSERVATION RESERVE PROGRAM ENROLLMENT AND OUTLAY HISTORY
Fiscal Year
Cumulative Enrollment 1/
Rental Payments 2/
Cost-Share Payments 3/
Incentive Payments 4/
Total Financial
Tech. Asst. Outlays 5/
Total Outlays
(Million Acres) (Million Dollars)
1986 2.0 $0 $0 $0 $0 $8 $8
1987 15.4 $410 $246 $0 $656 $41 $697
1988 24.0 $756 $282 $0 $1,038 $56 $1,094
1989 29.2 $1,149 $181 $0 $1,330 $86 $1,416
1990 32.8 $1,390 $118 $0 $1,508 $0 $1,508
1991 33.2 $1,590 $41 $0 $1,631 $10 $1,641
1992 34.1 $1,613 $39 $0 $1,652 $10 $1,662
1993 35.1 $1,652 $32 $0 $1,684 $0 $1,684
1994 35.0 $1,722 $14 $0 $1,736 $0 $1,736
1995 35.0 $1,729 $4 $0 $1,733 $0 $1,733
1996 33.5 $1,721 $1 $0 $1,722 $9 $1,731
1997 32.8 $1,677 $8 $0 $1,685 $61 $1,746
1998 30.2 $1,597 $96 $0 $1,693 $53 $1,746
1999 29.8 $1,320 $115 $0 $1,435 $56 $1,491
2000 31.4 $1,332 $133 $10 $1,475 $35 $1,510
2001 33.6 $1,396 $150 $78 $1,624 $32 $1,656
2002 33.9 $1,520 $143 $114 $1,777 $20 $1,797
2003 34.1 $1,575 $99 $100 $1,774 $55 $1,829
2004 34.7 $1,588 $117 $84 $1,789 $60 $1,849
2005 34.9 $1,620 $93 $75 $1,788 $75 $1,863
2006 36.0 $1,657 $100 $84 $1,841 $80 $1,919
2007 36.8 $1,718 $90 $58 $1,866 $101 $1,967
2008 34.6 $1,774 $84 $69 $1,927 $65 $1,992
2009 33.7 $1,708 $75 $72 $1,855 $61 $1,916
2010 31.3 $1,700 $67 $70 $1,837 $98 $1,935
Total -- $35,916 $2,328 $814 $39,058 $1,070 $40,128
1/ Acres under contract at end of fiscal year. 2/ Rental payments in a fiscal year apply to acres under contract in the previous fiscal year. Includes miscellaneous adjustments and adjustments for haying/grazing usage. 3/ Cost-share payments are made after cover establishment work is done. For contracts beginning in a given year, payments can occur over several years. 4/ Signing and Practice Incentive payments for continuous sign-up enrollment. 5/ Technical assistance outlays are generally paid to Natural Resources Conservation Service and Forest Service in the year sign-ups are held. About 90-95 percent of outlays have gone to NRCS and about 5-10 percent to FS.
-15-

-16-
1986 1988 1990 1992 1994 1996 1998 2000 2002 2004 2006 2008 2010
Fiscal Year
0
10
20
30
40
Mill
ion
Acr
es
Continuous
General
CRP Enrollment at End of Each Fiscal Year (Acres)
1 9 8 6 1 9 8 8 1 9 9 0 1 9 9 2 1 9 9 4 1 9 9 6 1 9 9 8 2 0 0 0 2 0 0 2 2 0 0 4 2 0 0 6 2 0 0 8 2 0 1 0
Fisc a l Y e a r
0
1 0 0
2 0 0
3 0 0
4 0 0
5 0 0
Th
ou
san
ds
G e ne ra lCo nt in uous
Number of CRP Contracts at End of Each Fiscal Year

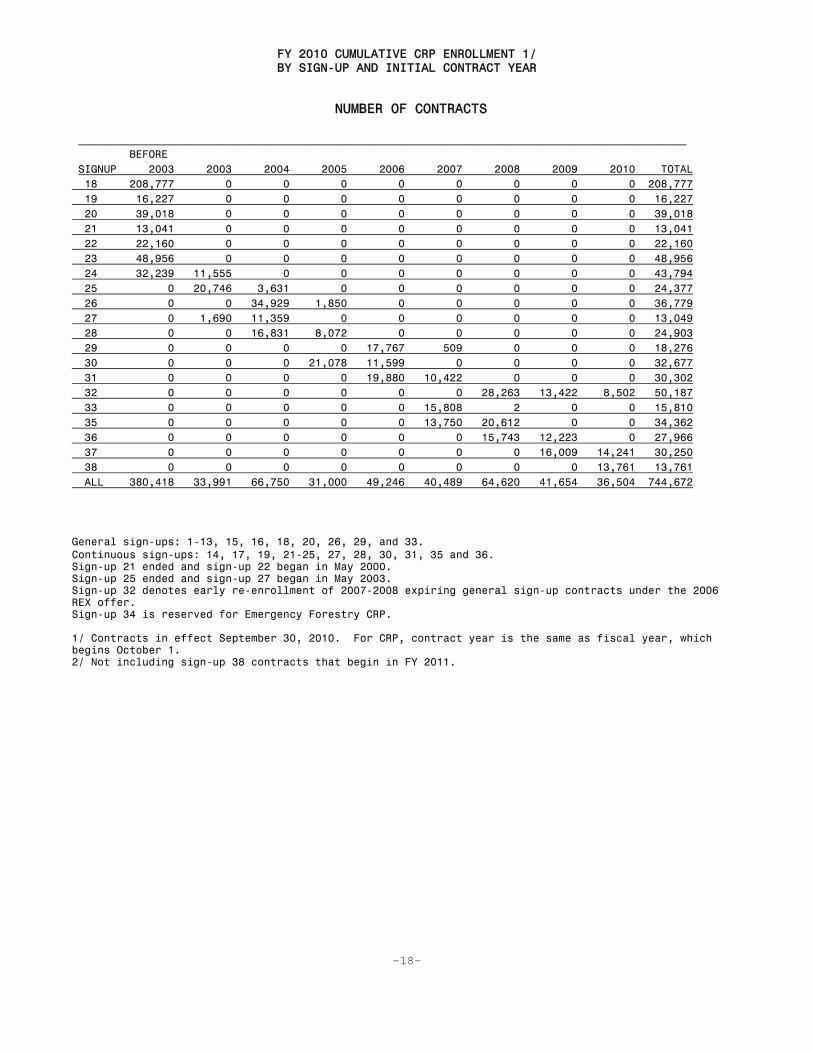
FY 2010 CUMULATIVE CRP ENROLLMENT 1/ BY SIGN-UP AND INITIAL CONTRACT YEAR
ACRES __________________________________________________________________________________ BEFORE SIGNUP 2003 2003 2004 2005 2006 2007 2008 2009 2010 TOTAL >19 17,217,176 0 0 0 0 0 0 0 0 17,217,176 19 155,350 0 0 0 0 0 0 0 0 155,350 20 2,194,638 0 0 0 0 0 0 0 0 2,194,638 21 114,261 0 0 0 0 0 0 0 0 114,261 22 198,591 0 0 0 0 0 0 0 0 198,591 23 451,906 0 0 0 0 0 0 0 0 451,906 24 280,867 149,401 0 0 0 0 0 0 0 430,268 25 0 197,928 53,774 0 0 0 0 0 0 251,703 26 0 0 1,612,757 162,144 0 0 0 0 0 1,774,902 27 0 11,418 169,652 0 0 0 0 0 0 181,071 28 0 0 150,777 99,256 0 0 0 0 0 250,033 29 0 0 0 0 1,005,925 61,758 0 0 0 1,067,684 30 0 0 0 196,801 195,040 0 0 0 0 391,840 31 0 0 0 0 197,960 146,057 0 0 0 344,017 32 0 0 0 0 0 0 2,350,133 884,807 584,697 3,819,636 33 0 0 0 0 0 843,453 78 0 0 843,532 35 0 0 0 0 0 157,594 362,120 0 0 519,714 36 0 0 0 0 0 0 214,561 183,195 0 397,756 37 0 0 0 0 0 0 0 233,301 239,139 472,439 38 0 0 0 0 0 0 0 0 221,726 221,726 ALL 20,612,790 358,748 1,986,960 458,202 1,398,925 1,208,863 2,926,892 1,301,302 1,045,562 31,298,245 General sign-ups: 1-13, 15, 16, 18, 20, 26, 29, and 33. Continuous sign-ups: 14, 17, 19, 21-25, 27, 28, 30, 31, 35 and 36. Sign-up 21 ended and sign-up 22 began in May 2000. Sign-up 25 ended and sign-up 27 began in May 2003. Sign-up 32 denotes early re-enrollment of 2007-2008 expiring general sign-up contracts under the 2006 REX offer. Sign-up 34 is reserved for Emergency Forestry CRP. 1/ Contracts in effect September 30, 2010. For CRP, contract year is the same as fiscal year, which begins October 1. 2/ Not including sign-up 38 contracts that begin in FY 2011.
-17-
FY 2010 CUMULATIVE CRP ENROLLMENT 1/ BY SIGN-UP AND INITIAL CONTRACT YEAR
NUMBER OF CONTRACTS _______________________________________________________________________________________________ BEFORE SIGNUP 2003 2003 2004 2005 2006 2007 2008 2009 2010 TOTAL 18 208,777 0 0 0 0 0 0 0 0 208,777 19 16,227 0 0 0 0 0 0 0 0 16,227 20 39,018 0 0 0 0 0 0 0 0 39,018 21 13,041 0 0 0 0 0 0 0 0 13,041 22 22,160 0 0 0 0 0 0 0 0 22,160 23 48,956 0 0 0 0 0 0 0 0 48,956 24 32,239 11,555 0 0 0 0 0 0 0 43,794 25 0 20,746 3,631 0 0 0 0 0 0 24,377 26 0 0 34,929 1,850 0 0 0 0 0 36,779 27 0 1,690 11,359 0 0 0 0 0 0 13,049 28 0 0 16,831 8,072 0 0 0 0 0 24,903 29 0 0 0 0 17,767 509 0 0 0 18,276 30 0 0 0 21,078 11,599 0 0 0 0 32,677 31 0 0 0 0 19,880 10,422 0 0 0 30,302 32 0 0 0 0 0 0 28,263 13,422 8,502 50,187 33 0 0 0 0 0 15,808 2 0 0 15,810 35 0 0 0 0 0 13,750 20,612 0 0 34,362 36 0 0 0 0 0 0 15,743 12,223 0 27,966 37 0 0 0 0 0 0 0 16,009 14,241 30,250 38 0 0 0 0 0 0 0 0 13,761 13,761 ALL 380,418 33,991 66,750 31,000 49,246 40,489 64,620 41,654 36,504 744,672 General sign-ups: 1-13, 15, 16, 18, 20, 26, 29, and 33. Continuous sign-ups: 14, 17, 19, 21-25, 27, 28, 30, 31, 35 and 36. Sign-up 21 ended and sign-up 22 began in May 2000. Sign-up 25 ended and sign-up 27 began in May 2003. Sign-up 32 denotes early re-enrollment of 2007-2008 expiring general sign-up contracts under the 2006 REX offer. Sign-up 34 is reserved for Emergency Forestry CRP. 1/ Contracts in effect September 30, 2010. For CRP, contract year is the same as fiscal year, which begins October 1. 2/ Not including sign-up 38 contracts that begin in FY 2011.
-18-

-19-
CRP OUTLAYS, FY 2010 ($1,000)
STATE RENTAL COVER INCENTIVES H/ G 1/ TOTAL
ALABAMA 19,443 540 479 0 20,462ALASKA 922 72 0 -3 991ARKANSAS 12,604 1,166 2,120 0 15,891CALIFORNIA 4,402 141 123 -29 4,637COLORADO 77,013 300 143 -155 77,301CONNECTICUT 13 0 0 0 13DELAWARE 782 24 1 0 807FLORIDA 2,481 31 14 0 2,526GEORGIA 13,739 3,357 3,450 0 20,547HAWAII 2 11 4 0 17IDAHO 31,141 734 463 -23 32,315ILLINOIS 110,200 3,874 4,312 -63 118,322INDIANA 28,485 8,743 7,139 -8 44,359IOWA 193,616 10,097 9,370 -715 212,368KANSAS 121,677 1,090 1,114 -477 123,404KENTUCKY 39,253 2,482 1,905 -1 43,639LOUISIANA 16,050 1,661 2,384 1 20,096MAINE 1,124 43 36 -1 1,202MARYLAND 10,069 708 540 0 11,317MASSACHUSETTS 2 0 0 0 2MICHIGAN 19,625 1,206 972 -4 21,799MINNESOTA 107,194 2,609 3,490 -357 112,935MISSISSIPPI 38,644 1,098 1,595 -1 41,336MISSOURI 98,471 2,756 2,046 -589 102,684MONTANA 103,697 359 439 -2,295 102,199NEBRASKA 68,161 2,232 1,726 -764 71,356NEVADA 2 0 0 0 2NEW HAMPSHIRE 3 0 0 0 3NEW JERSEY 140 299 265 0 704NEW MEXICO 18,510 19 -5 -37 18,486NEW YORK 3,673 516 519 -1 4,706NORTH CAROLINA 8,256 678 373 0 9,308NORTH DAKOTA 95,992 927 4,942 -1,983 99,878OHIO 38,243 6,368 5,335 -13 49,933OKLAHOMA 31,439 220 162 -207 31,614OREGON 27,523 1,299 1,393 -20 30,195PENNSYLVANIA 21,982 2,455 1,307 0 25,744PUERTO RICO 81 0 0 0 81RHODE ISLAND 2 0 0 0 2SOUTH CAROLINA 6,654 457 488 0 7,599SOUTH DAKOTA 55,692 1,922 6,716 -917 63,414TENNESSEE 13,743 695 488 -7 14,919TEXAS 134,833 493 746 -638 135,434UTAH 5,777 6 1 -18 5,766VERMONT 229 338 288 0 855VIRGINIA 3,584 1,729 1,527 -2 6,838WASHINGTON 81,857 1,459 751 -85 83,982WEST VIRGINIA 362 409 400 0 1,171WISCONSIN 34,197 854 591 -89 35,553WYOMING 7,485 248 184 -15 7,902NOT ASSIGNED/ MISC. 7 -3 0 4Total 1,709,079 66,721 70,335 -9,518 1,836,618
1/ Haying and grazing payment reductions.

CRP ENROLLMENT BY STATE, FY 2010, CUMULATIVE 1/ -----------TOTAL CRP (ALL SIGN-UPS)--------- NUMBER OF NUMBER OF ANNUAL RENTAL PAYMENTS 3/ STATE 2/ CONTRACTS FARMS ACRES ($1,000) ($/ACRE) U.S. 744,672 416,459 31,298,245 1,666,711 53.25 ALABAMA 9,487 6,790 417,497 19,147 45.86 ALASKA 61 39 25,823 899 34.83 ARKANSAS 5,921 3,285 248,619 14,024 56.41 CALIFORNIA 507 397 125,668 4,433 35.28 COLORADO 11,722 5,770 2,022,103 65,966 32.62 CONNECTICUT 19 15 176 14 82.22 DELAWARE 675 353 6,777 744 109.76 FLORIDA 1,434 1,162 62,126 2,438 39.24 GEORGIA 9,043 6,507 320,906 14,392 44.85 HAWAII 8 8 165 10 57.82 IDAHO 5,520 3,097 716,417 30,079 41.98 ILLINOIS 80,393 44,235 1,022,486 112,341 109.87 INDIANA 37,925 21,298 287,675 30,211 105.02 IOWA 104,219 52,860 1,637,108 196,518 120.04 KANSAS 46,818 26,919 2,782,777 111,025 39.90 KENTUCKY 18,100 9,799 382,575 40,462 105.76 LOUISIANA 4,860 3,119 318,112 18,013 56.62 MAINE 761 508 20,552 1,082 52.65 MARYLAND 6,457 3,521 79,620 10,712 134.54 MASSACHUSETTS 4 4 15 3 172.53 MICHIGAN 15,351 8,831 233,202 19,975 85.66 MINNESOTA 62,192 32,956 1,641,996 107,738 65.61 MISSISSIPPI 19,996 12,701 861,448 39,335 45.66 MISSOURI 36,223 21,299 1,391,865 98,248 70.59 MONTANA 16,136 6,245 3,077,149 99,677 32.39 NEBRASKA 28,432 16,038 1,092,753 65,426 59.87 NEW HAMPSHIRE 6 6 60 3 54.81 NEW JERSEY 260 186 2,515 170 67.73 NEW MEXICO 2,363 1,475 541,807 17,801 32.86 NEW YORK 2,871 2,044 53,633 3,716 69.29 NORTH CAROLINA 8,496 5,457 122,860 8,180 66.58 NORTH DAKOTA 34,297 16,924 2,719,334 95,009 34.94 OHIO 37,549 21,049 343,569 39,858 116.01 OKLAHOMA 7,432 5,078 860,372 28,398 33.01 OREGON 4,212 2,218 547,920 27,350 49.92 PENNSYLVANIA 12,054 7,595 221,610 22,695 102.41 PUERTO RICO 22 21 2,052 132 64.40 SOUTH CAROLINA 8,023 4,598 172,950 6,488 37.52 SOUTH DAKOTA 29,990 14,307 1,113,619 56,088 50.37 TENNESSEE 7,583 5,080 217,443 13,683 62.93 TEXAS 21,218 15,739 3,305,123 117,139 35.44 UTAH 827 516 145,349 4,465 30.72 VERMONT 352 249 2,703 267 98.84 VIRGINIA 5,687 4,349 63,021 3,712 58.90 WASHINGTON 12,245 5,067 1,444,161 79,597 55.12 WEST VIRGINIA 408 338 5,423 394 72.57 WISCONSIN 25,608 15,793 428,113 32,853 76.74 WYOMING 902 611 208,819 5,793 27.74 NOT REPORTED 3 3 179 5 27.26 1/ Contracts in effect September 30, 2010. 2/ State in which land is located. 3/ Approximates FY 2011 payments, before adjustments for haying/grazing, non-compliance, terminations, part-year contracts. Includes annual incentive and maintenance allowance payments, but not one-time up-front signing and practice incentive payments.
-20-
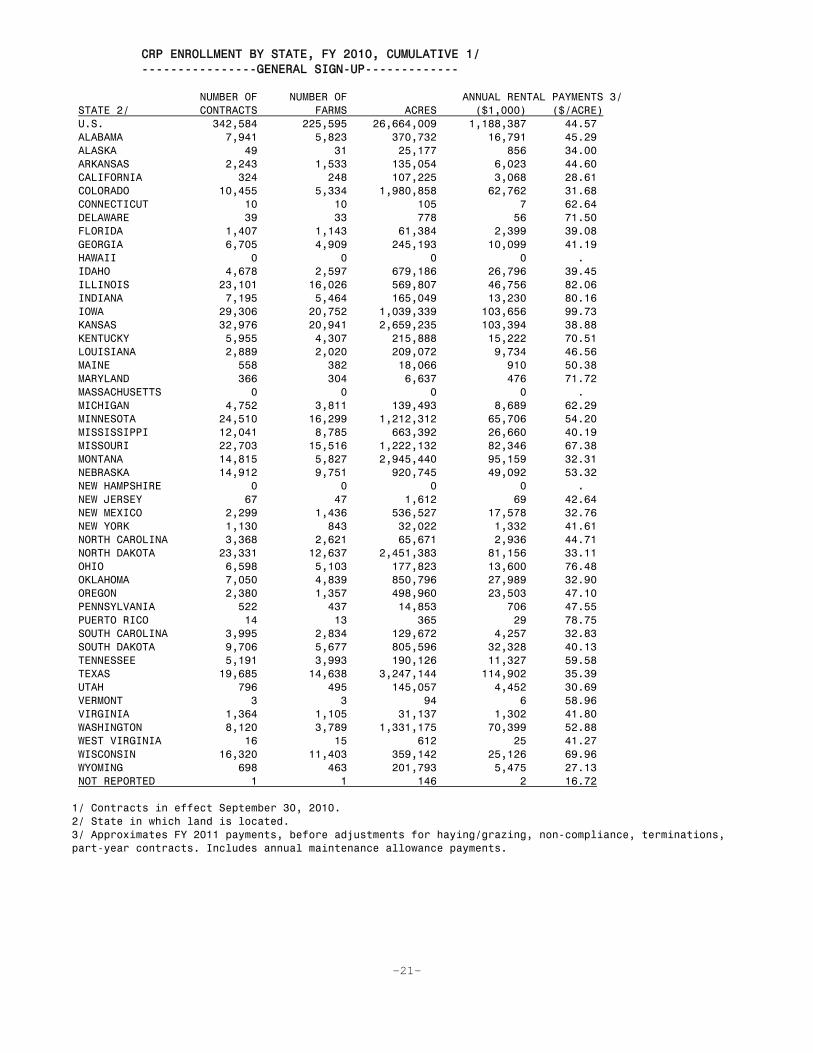
CRP ENROLLMENT BY STATE, FY 2010, CUMULATIVE 1/ ----------------GENERAL SIGN-UP------------- NUMBER OF NUMBER OF ANNUAL RENTAL PAYMENTS 3/ STATE 2/ CONTRACTS FARMS ACRES ($1,000) ($/ACRE) U.S. 342,584 225,595 26,664,009 1,188,387 44.57 ALABAMA 7,941 5,823 370,732 16,791 45.29 ALASKA 49 31 25,177 856 34.00 ARKANSAS 2,243 1,533 135,054 6,023 44.60 CALIFORNIA 324 248 107,225 3,068 28.61 COLORADO 10,455 5,334 1,980,858 62,762 31.68 CONNECTICUT 10 10 105 7 62.64 DELAWARE 39 33 778 56 71.50 FLORIDA 1,407 1,143 61,384 2,399 39.08 GEORGIA 6,705 4,909 245,193 10,099 41.19 HAWAII 0 0 0 0 . IDAHO 4,678 2,597 679,186 26,796 39.45 ILLINOIS 23,101 16,026 569,807 46,756 82.06 INDIANA 7,195 5,464 165,049 13,230 80.16 IOWA 29,306 20,752 1,039,339 103,656 99.73 KANSAS 32,976 20,941 2,659,235 103,394 38.88 KENTUCKY 5,955 4,307 215,888 15,222 70.51 LOUISIANA 2,889 2,020 209,072 9,734 46.56 MAINE 558 382 18,066 910 50.38 MARYLAND 366 304 6,637 476 71.72 MASSACHUSETTS 0 0 0 0 . MICHIGAN 4,752 3,811 139,493 8,689 62.29 MINNESOTA 24,510 16,299 1,212,312 65,706 54.20 MISSISSIPPI 12,041 8,785 663,392 26,660 40.19 MISSOURI 22,703 15,516 1,222,132 82,346 67.38 MONTANA 14,815 5,827 2,945,440 95,159 32.31 NEBRASKA 14,912 9,751 920,745 49,092 53.32 NEW HAMPSHIRE 0 0 0 0 . NEW JERSEY 67 47 1,612 69 42.64 NEW MEXICO 2,299 1,436 536,527 17,578 32.76 NEW YORK 1,130 843 32,022 1,332 41.61 NORTH CAROLINA 3,368 2,621 65,671 2,936 44.71 NORTH DAKOTA 23,331 12,637 2,451,383 81,156 33.11 OHIO 6,598 5,103 177,823 13,600 76.48 OKLAHOMA 7,050 4,839 850,796 27,989 32.90 OREGON 2,380 1,357 498,960 23,503 47.10 PENNSYLVANIA 522 437 14,853 706 47.55 PUERTO RICO 14 13 365 29 78.75 SOUTH CAROLINA 3,995 2,834 129,672 4,257 32.83 SOUTH DAKOTA 9,706 5,677 805,596 32,328 40.13 TENNESSEE 5,191 3,993 190,126 11,327 59.58 TEXAS 19,685 14,638 3,247,144 114,902 35.39 UTAH 796 495 145,057 4,452 30.69 VERMONT 3 3 94 6 58.96 VIRGINIA 1,364 1,105 31,137 1,302 41.80 WASHINGTON 8,120 3,789 1,331,175 70,399 52.88 WEST VIRGINIA 16 15 612 25 41.27 WISCONSIN 16,320 11,403 359,142 25,126 69.96 WYOMING 698 463 201,793 5,475 27.13 NOT REPORTED 1 1 146 2 16.72 1/ Contracts in effect September 30, 2010. 2/ State in which land is located. 3/ Approximates FY 2011 payments, before adjustments for haying/grazing, non-compliance, terminations, part-year contracts. Includes annual maintenance allowance payments.
-21-

CRP ENROLLMENT BY STATE, FY 2010, CUMULATIVE 1/ ------------TOTAL CONTINUOUS 2/------------- NUMBER OF NUMBER OF ANNUAL RENTAL PAYMENTS 4/ STATE 3/ CONTRACTS FARMS ACRES ($1,000) ($/ACRE) U.S. 402,088 233,555 4,634,236 478,324 103.22 ALABAMA 1,546 1,179 46,765 2,356 50.38 ALASKA 12 9 646 43 67.21 ARKANSAS 3,678 2,108 113,565 8,001 70.46 CALIFORNIA 183 157 18,443 1,365 74.03 COLORADO 1,267 736 41,244 3,205 77.70 CONNECTICUT 9 5 71 8 111.45 DELAWARE 636 336 5,999 688 114.72 FLORIDA 27 22 741 39 52.90 GEORGIA 2,338 1,774 75,712 4,293 56.70 HAWAII 8 8 165 10 57.82 IDAHO 842 623 37,231 3,283 88.17 ILLINOIS 57,292 33,653 452,679 65,585 144.88 INDIANA 30,730 17,543 122,626 16,982 138.48 IOWA 74,913 40,588 597,769 92,862 155.35 KANSAS 13,842 8,464 123,542 7,632 61.77 KENTUCKY 12,145 6,496 166,686 25,240 151.42 LOUISIANA 1,971 1,347 109,040 8,278 75.92 MAINE 203 156 2,486 172 69.08 MARYLAND 6,091 3,408 72,982 10,236 140.25 MASSACHUSETTS 4 4 15 3 172.53 MICHIGAN 10,599 5,662 93,709 11,287 120.44 MINNESOTA 37,682 21,702 429,684 42,033 97.82 MISSISSIPPI 7,955 5,348 198,056 12,674 63.99 MISSOURI 13,520 8,455 169,733 15,902 93.69 MONTANA 1,321 648 131,709 4,517 34.30 NEBRASKA 13,520 8,382 172,009 16,335 94.96 NEW HAMPSHIRE 6 6 60 3 54.81 NEW JERSEY 193 142 903 102 112.48 NEW MEXICO 64 41 5,280 223 42.32 NEW YORK 1,741 1,248 21,610 2,384 110.31 NORTH CAROLINA 5,128 2,977 57,188 5,244 91.69 NORTH DAKOTA 10,966 6,076 267,952 13,853 51.70 OHIO 30,951 17,663 165,747 26,258 158.42 OKLAHOMA 382 311 9,577 409 42.67 OREGON 1,832 1,113 48,960 3,847 78.58 PENNSYLVANIA 11,532 7,311 206,757 21,989 106.35 PUERTO RICO 8 8 1,687 103 61.29 SOUTH CAROLINA 4,028 2,280 43,278 2,232 51.56 SOUTH DAKOTA 20,284 10,530 308,023 23,760 77.14 TENNESSEE 2,392 1,594 27,317 2,356 86.25 TEXAS 1,533 1,255 57,979 2,237 38.58 UTAH 31 24 292 14 46.65 VERMONT 349 246 2,608 262 100.28 VIRGINIA 4,323 3,337 31,884 2,410 75.59 WASHINGTON 4,125 2,242 112,986 9,197 81.40 WEST VIRGINIA 392 325 4,811 368 76.56 WISCONSIN 9,288 5,846 68,971 7,727 112.03 WYOMING 204 165 7,026 318 45.22 NOT REPORTED 2 2 32 2 75.19 1/ Contracts in effect September 30, 2010. 2/ Includes CREP, non-CREP, and Farmable Wetland Program. 3/ State in which land is located. 4/ Approximates FY 2011 payments, before adjustments for haying/grazing, non-compliance, terminations, part-year contracts. Includes annual incentive and maintenance allowance payments, but not one-time up-front signing and practice incentive payments.
-22-
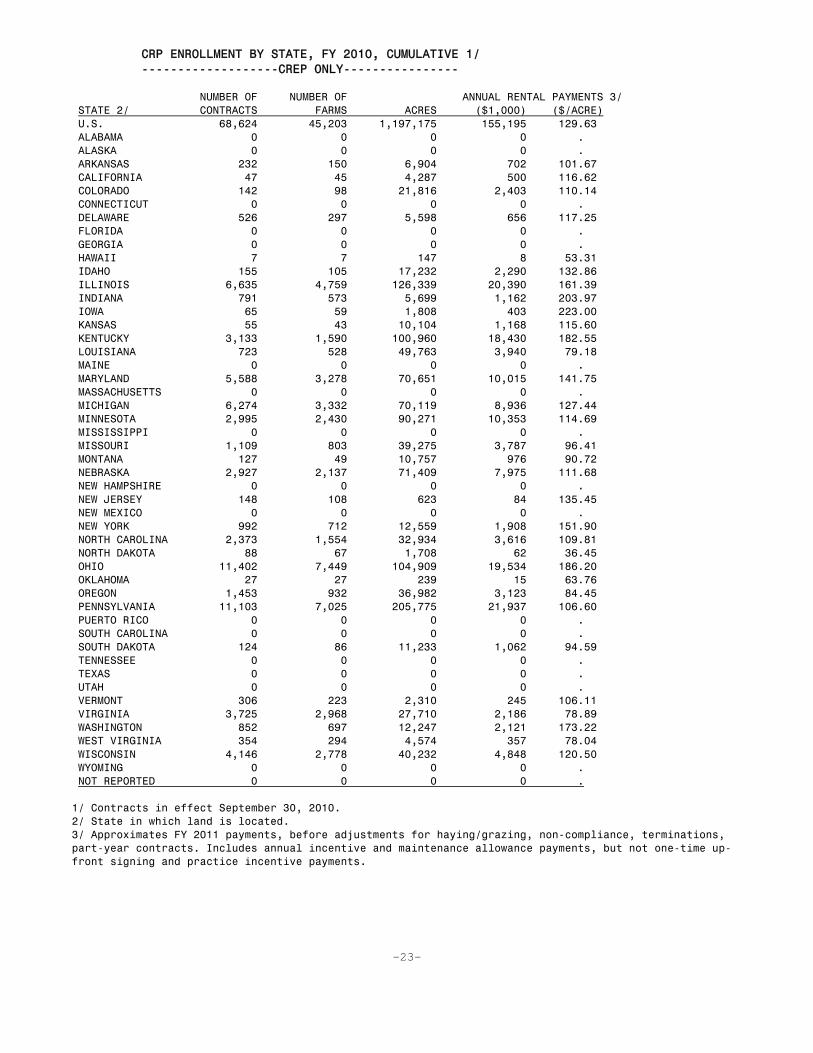
CRP ENROLLMENT BY STATE, FY 2010, CUMULATIVE 1/ -------------------CREP ONLY---------------- NUMBER OF NUMBER OF ANNUAL RENTAL PAYMENTS 3/ STATE 2/ CONTRACTS FARMS ACRES ($1,000) ($/ACRE) U.S. 68,624 45,203 1,197,175 155,195 129.63 ALABAMA 0 0 0 0 . ALASKA 0 0 0 0 . ARKANSAS 232 150 6,904 702 101.67 CALIFORNIA 47 45 4,287 500 116.62 COLORADO 142 98 21,816 2,403 110.14 CONNECTICUT 0 0 0 0 . DELAWARE 526 297 5,598 656 117.25 FLORIDA 0 0 0 0 . GEORGIA 0 0 0 0 . HAWAII 7 7 147 8 53.31 IDAHO 155 105 17,232 2,290 132.86 ILLINOIS 6,635 4,759 126,339 20,390 161.39 INDIANA 791 573 5,699 1,162 203.97 IOWA 65 59 1,808 403 223.00 KANSAS 55 43 10,104 1,168 115.60 KENTUCKY 3,133 1,590 100,960 18,430 182.55 LOUISIANA 723 528 49,763 3,940 79.18 MAINE 0 0 0 0 . MARYLAND 5,588 3,278 70,651 10,015 141.75 MASSACHUSETTS 0 0 0 0 . MICHIGAN 6,274 3,332 70,119 8,936 127.44 MINNESOTA 2,995 2,430 90,271 10,353 114.69 MISSISSIPPI 0 0 0 0 . MISSOURI 1,109 803 39,275 3,787 96.41 MONTANA 127 49 10,757 976 90.72 NEBRASKA 2,927 2,137 71,409 7,975 111.68 NEW HAMPSHIRE 0 0 0 0 . NEW JERSEY 148 108 623 84 135.45 NEW MEXICO 0 0 0 0 . NEW YORK 992 712 12,559 1,908 151.90 NORTH CAROLINA 2,373 1,554 32,934 3,616 109.81 NORTH DAKOTA 88 67 1,708 62 36.45 OHIO 11,402 7,449 104,909 19,534 186.20 OKLAHOMA 27 27 239 15 63.76 OREGON 1,453 932 36,982 3,123 84.45 PENNSYLVANIA 11,103 7,025 205,775 21,937 106.60 PUERTO RICO 0 0 0 0 . SOUTH CAROLINA 0 0 0 0 . SOUTH DAKOTA 124 86 11,233 1,062 94.59 TENNESSEE 0 0 0 0 . TEXAS 0 0 0 0 . UTAH 0 0 0 0 . VERMONT 306 223 2,310 245 106.11 VIRGINIA 3,725 2,968 27,710 2,186 78.89 WASHINGTON 852 697 12,247 2,121 173.22 WEST VIRGINIA 354 294 4,574 357 78.04 WISCONSIN 4,146 2,778 40,232 4,848 120.50 WYOMING 0 0 0 0 . NOT REPORTED 0 0 0 0 . 1/ Contracts in effect September 30, 2010. 2/ State in which land is located. 3/ Approximates FY 2011 payments, before adjustments for haying/grazing, non-compliance, terminations, part-year contracts. Includes annual incentive and maintenance allowance payments, but not one-time up-front signing and practice incentive payments.
-23-

CRP ENROLLMENT BY STATE, FY 2010, CUMULATIVE 1/ ------------CONTINUOUS NON-CREP 2/---------- NUMBER OF NUMBER OF ANNUAL RENTAL PAYMENTS 4/ STATE 3/ CONTRACTS FARMS ACRES ($1,000) ($/ACRE) U.S. 320,190 191,008 3,205,013 296,652 92.56 ALABAMA 1,542 1,175 46,747 2,356 50.39 ALASKA 12 9 646 43 67.21 ARKANSAS 3,446 1,993 106,661 7,300 68.44 CALIFORNIA 136 113 14,156 865 61.13 COLORADO 1,124 647 19,271 793 41.17 CONNECTICUT 9 5 71 8 111.45 DELAWARE 110 96 401 32 79.44 FLORIDA 27 22 741 39 52.90 GEORGIA 2,338 1,774 75,712 4,293 56.70 HAWAII 1 1 19 2 93.40 IDAHO 686 523 19,993 993 49.65 ILLINOIS 50,618 30,357 325,946 45,131 138.46 INDIANA 29,846 17,139 115,969 15,688 135.28 IOWA 69,978 38,615 519,663 79,783 153.53 KANSAS 13,689 8,363 111,793 6,380 57.07 KENTUCKY 9,012 4,932 65,726 6,810 103.61 LOUISIANA 1,235 833 58,153 4,239 72.90 MAINE 203 156 2,486 172 69.08 MARYLAND 502 380 2,327 221 94.79 MASSACHUSETTS 4 4 15 3 172.53 MICHIGAN 4,317 2,759 23,519 2,343 99.62 MINNESOTA 31,581 19,081 296,794 27,170 91.55 MISSISSIPPI 7,931 5,331 194,646 12,353 63.46 MISSOURI 12,407 7,805 130,243 12,092 92.84 MONTANA 1,180 597 120,812 3,537 29.27 NEBRASKA 10,127 6,561 96,563 8,026 83.12 NEW HAMPSHIRE 6 6 60 3 54.81 NEW JERSEY 45 37 280 17 61.33 NEW MEXICO 64 41 5,280 223 42.32 NEW YORK 749 575 9,051 476 52.60 NORTH CAROLINA 2,755 1,649 24,254 1,627 67.09 NORTH DAKOTA 9,612 5,615 228,954 11,230 49.05 OHIO 19,514 12,402 60,589 6,691 110.43 OKLAHOMA 353 282 9,307 392 42.12 OREGON 379 246 11,978 724 60.44 PENNSYLVANIA 429 358 982 52 53.38 PUERTO RICO 8 8 1,687 103 61.29 SOUTH CAROLINA 4,028 2,280 43,278 2,232 51.56 SOUTH DAKOTA 16,938 9,433 233,464 17,084 73.18 TENNESSEE 2,392 1,594 27,317 2,356 86.25 TEXAS 1,533 1,255 57,979 2,237 38.58 UTAH 31 24 292 14 46.65 VERMONT 43 40 298 16 55.14 VIRGINIA 598 479 4,174 224 53.69 WASHINGTON 3,273 1,601 100,739 7,076 70.24 WEST VIRGINIA 38 32 237 11 47.86 WISCONSIN 5,135 3,613 28,682 2,871 100.09 WYOMING 204 165 7,026 318 45.22 NOT REPORTED 2 2 32 2 75.19 1/ Contracts in effect September 30, 2010. 2/ Farmable Wetland enrollment not included. 3/ State in which land is located. 4/ Approximates FY 2011 payments, before adjustments for haying/grazing, non-compliance, terminations, part-year contracts. Includes annual incentive and maintenance allowance payments, but not one-time up-front signing and practice incentive payments.
-24-

CRP ENROLLMENT BY STATE, FY 2010, CUMULATIVE 1/ -----------FARMABLE WETLAND PROGRAM--------- NUMBER OF NUMBER OF ANNUAL RENTAL PAYMENTS 3/ STATE 2/ CONTRACTS FARMS ACRES ($1,000) ($/ACRE) U.S. 13,274 10,492 232,048 26,477 114.10 ALABAMA 4 4 18 1 33.47 ALASKA 0 0 0 0 . ARKANSAS 0 0 0 0 . CALIFORNIA 0 0 0 0 . COLORADO 1 0 157 8 52.45 CONNECTICUT 0 0 0 0 . DELAWARE 0 0 0 0 . FLORIDA 0 0 0 0 . GEORGIA 0 0 0 0 . HAWAII 0 0 0 0 . IDAHO 1 1 6 0 78.55 ILLINOIS 39 38 395 63 160.07 INDIANA 93 86 958 131 136.35 IOWA 4,870 3,901 76,298 12,676 166.13 KANSAS 98 90 1,645 84 50.86 KENTUCKY 0 0 0 0 . LOUISIANA 13 11 1,123 99 87.81 MAINE 0 0 0 0 . MARYLAND 1 1 5 0 97.00 MASSACHUSETTS 0 0 0 0 . MICHIGAN 8 8 71 8 107.57 MINNESOTA 3,106 2,642 42,618 4,509 105.80 MISSISSIPPI 24 18 3,410 321 94.21 MISSOURI 4 3 215 23 108.73 MONTANA 14 6 140 5 33.80 NEBRASKA 466 402 4,037 334 82.70 NEW HAMPSHIRE 0 0 0 0 . NEW JERSEY 0 0 0 0 . NEW MEXICO 0 0 0 0 . NEW YORK 0 0 0 0 . NORTH CAROLINA 0 0 0 0 . NORTH DAKOTA 1,266 890 37,290 2,560 68.66 OHIO 35 34 249 33 132.97 OKLAHOMA 2 2 30 1 44.68 OREGON 0 0 0 0 . PENNSYLVANIA 0 0 0 0 . PUERTO RICO 0 0 0 0 . SOUTH CAROLINA 0 0 0 0 . SOUTH DAKOTA 3,222 2,348 63,326 5,613 88.63 TENNESSEE 0 0 0 0 . TEXAS 0 0 0 0 . UTAH 0 0 0 0 . VERMONT 0 0 0 0 . VIRGINIA 0 0 0 0 . WASHINGTON 0 0 0 0 . WEST VIRGINIA 0 0 0 0 . WISCONSIN 7 7 57 8 141.59 WYOMING 0 0 0 0 . NOT REPORTED 0 0 0 0 . 1/ Contracts in effect September 30, 2010. 2/ State in which land is located. 3/ Approximates FY 2011 payments, before adjustments for haying/grazing, non-compliance, terminations, part-year contracts. Includes annual incentive and maintenance allowance payments, but not one-time up-front signing and practice incentive payments.
-25-
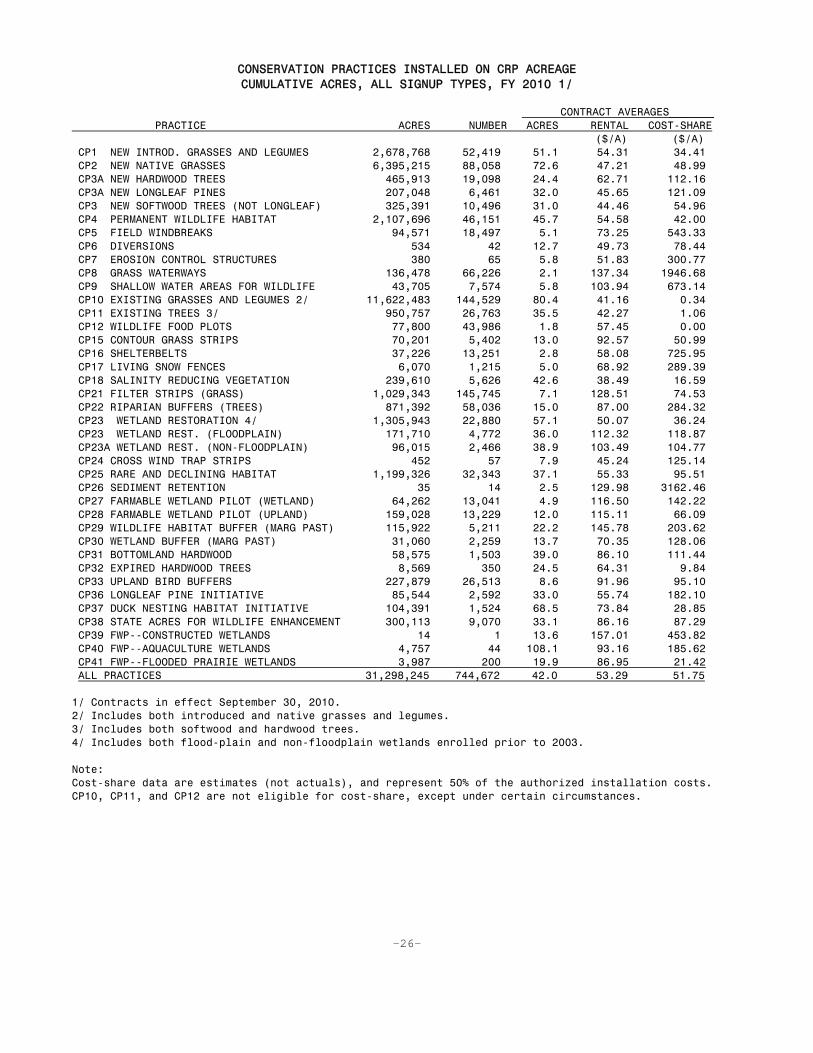
CONSERVATION PRACTICES INSTALLED ON CRP ACREAGE CUMULATIVE ACRES, ALL SIGNUP TYPES, FY 2010 1/
CONTRACT AVERAGES_______ PRACTICE ACRES NUMBER ACRES RENTAL COST-SHARE ($/A) ($/A) CP1 NEW INTROD. GRASSES AND LEGUMES 2,678,768 52,419 51.1 54.31 34.41 CP2 NEW NATIVE GRASSES 6,395,215 88,058 72.6 47.21 48.99 CP3A NEW HARDWOOD TREES 465,913 19,098 24.4 62.71 112.16 CP3A NEW LONGLEAF PINES 207,048 6,461 32.0 45.65 121.09 CP3 NEW SOFTWOOD TREES (NOT LONGLEAF) 325,391 10,496 31.0 44.46 54.96 CP4 PERMANENT WILDLIFE HABITAT 2,107,696 46,151 45.7 54.58 42.00 CP5 FIELD WINDBREAKS 94,571 18,497 5.1 73.25 543.33 CP6 DIVERSIONS 534 42 12.7 49.73 78.44 CP7 EROSION CONTROL STRUCTURES 380 65 5.8 51.83 300.77 CP8 GRASS WATERWAYS 136,478 66,226 2.1 137.34 1946.68 CP9 SHALLOW WATER AREAS FOR WILDLIFE 43,705 7,574 5.8 103.94 673.14 CP10 EXISTING GRASSES AND LEGUMES 2/ 11,622,483 144,529 80.4 41.16 0.34 CP11 EXISTING TREES 3/ 950,757 26,763 35.5 42.27 1.06 CP12 WILDLIFE FOOD PLOTS 77,800 43,986 1.8 57.45 0.00 CP15 CONTOUR GRASS STRIPS 70,201 5,402 13.0 92.57 50.99 CP16 SHELTERBELTS 37,226 13,251 2.8 58.08 725.95 CP17 LIVING SNOW FENCES 6,070 1,215 5.0 68.92 289.39 CP18 SALINITY REDUCING VEGETATION 239,610 5,626 42.6 38.49 16.59 CP21 FILTER STRIPS (GRASS) 1,029,343 145,745 7.1 128.51 74.53 CP22 RIPARIAN BUFFERS (TREES) 871,392 58,036 15.0 87.00 284.32 CP23 WETLAND RESTORATION 4/ 1,305,943 22,880 57.1 50.07 36.24 CP23 WETLAND REST. (FLOODPLAIN) 171,710 4,772 36.0 112.32 118.87 CP23A WETLAND REST. (NON-FLOODPLAIN) 96,015 2,466 38.9 103.49 104.77 CP24 CROSS WIND TRAP STRIPS 452 57 7.9 45.24 125.14 CP25 RARE AND DECLINING HABITAT 1,199,326 32,343 37.1 55.33 95.51 CP26 SEDIMENT RETENTION 35 14 2.5 129.98 3162.46 CP27 FARMABLE WETLAND PILOT (WETLAND) 64,262 13,041 4.9 116.50 142.22 CP28 FARMABLE WETLAND PILOT (UPLAND) 159,028 13,229 12.0 115.11 66.09 CP29 WILDLIFE HABITAT BUFFER (MARG PAST) 115,922 5,211 22.2 145.78 203.62 CP30 WETLAND BUFFER (MARG PAST) 31,060 2,259 13.7 70.35 128.06 CP31 BOTTOMLAND HARDWOOD 58,575 1,503 39.0 86.10 111.44 CP32 EXPIRED HARDWOOD TREES 8,569 350 24.5 64.31 9.84 CP33 UPLAND BIRD BUFFERS 227,879 26,513 8.6 91.96 95.10 CP36 LONGLEAF PINE INITIATIVE 85,544 2,592 33.0 55.74 182.10 CP37 DUCK NESTING HABITAT INITIATIVE 104,391 1,524 68.5 73.84 28.85 CP38 STATE ACRES FOR WILDLIFE ENHANCEMENT 300,113 9,070 33.1 86.16 87.29 CP39 FWP--CONSTRUCTED WETLANDS 14 1 13.6 157.01 453.82 CP40 FWP--AQUACULTURE WETLANDS 4,757 44 108.1 93.16 185.62 CP41 FWP--FLOODED PRAIRIE WETLANDS 3,987 200 19.9 86.95 21.42 ALL PRACTICES 31,298,245 744,672 42.0 53.29 51.75 1/ Contracts in effect September 30, 2010. 2/ Includes both introduced and native grasses and legumes. 3/ Includes both softwood and hardwood trees. 4/ Includes both flood-plain and non-floodplain wetlands enrolled prior to 2003. Note: Cost-share data are estimates (not actuals), and represent 50% of the authorized installation costs. CP10, CP11, and CP12 are not eligible for cost-share, except under certain circumstances.
-26-
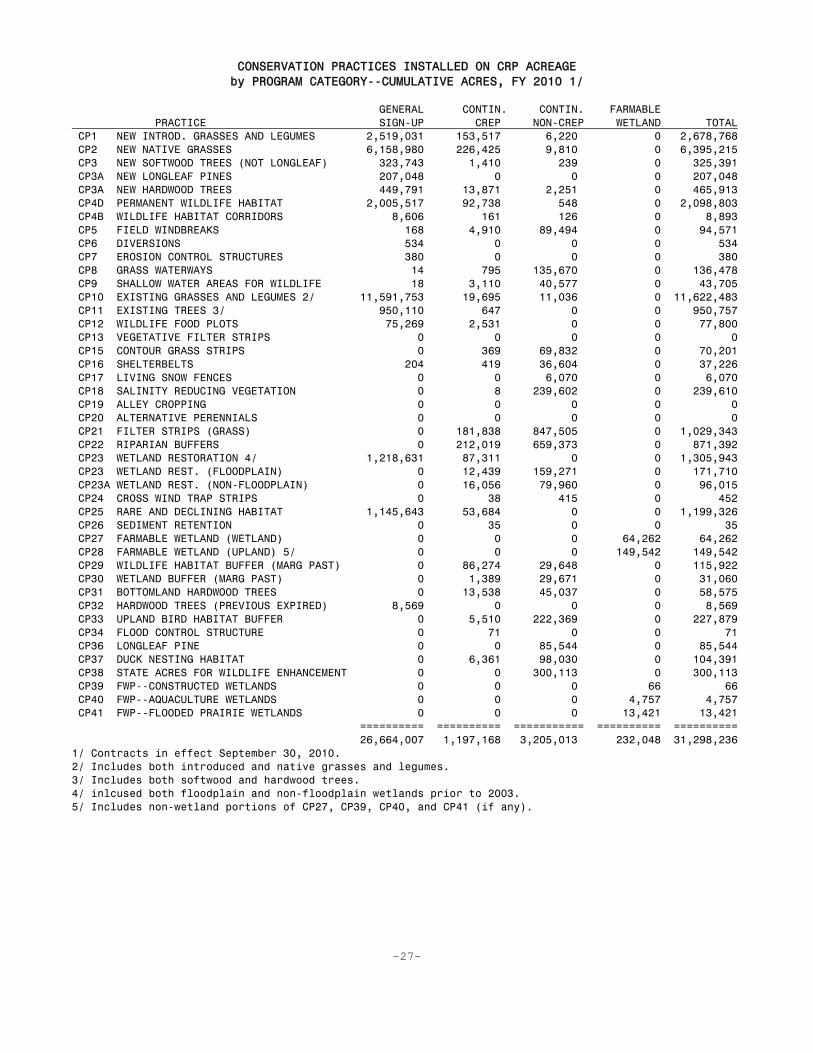
CONSERVATION PRACTICES INSTALLED ON CRP ACREAGE by PROGRAM CATEGORY--CUMULATIVE ACRES, FY 2010 1/
GENERAL CONTIN. CONTIN. FARMABLE PRACTICE SIGN-UP CREP NON-CREP WETLAND TOTAL CP1 NEW INTROD. GRASSES AND LEGUMES 2,519,031 153,517 6,220 0 2,678,768 CP2 NEW NATIVE GRASSES 6,158,980 226,425 9,810 0 6,395,215 CP3 NEW SOFTWOOD TREES (NOT LONGLEAF) 323,743 1,410 239 0 325,391 CP3A NEW LONGLEAF PINES 207,048 0 0 0 207,048 CP3A NEW HARDWOOD TREES 449,791 13,871 2,251 0 465,913 CP4D PERMANENT WILDLIFE HABITAT 2,005,517 92,738 548 0 2,098,803 CP4B WILDLIFE HABITAT CORRIDORS 8,606 161 126 0 8,893 CP5 FIELD WINDBREAKS 168 4,910 89,494 0 94,571 CP6 DIVERSIONS 534 0 0 0 534 CP7 EROSION CONTROL STRUCTURES 380 0 0 0 380 CP8 GRASS WATERWAYS 14 795 135,670 0 136,478 CP9 SHALLOW WATER AREAS FOR WILDLIFE 18 3,110 40,577 0 43,705 CP10 EXISTING GRASSES AND LEGUMES 2/ 11,591,753 19,695 11,036 0 11,622,483 CP11 EXISTING TREES 3/ 950,110 647 0 0 950,757 CP12 WILDLIFE FOOD PLOTS 75,269 2,531 0 0 77,800 CP13 VEGETATIVE FILTER STRIPS 0 0 0 0 0 CP15 CONTOUR GRASS STRIPS 0 369 69,832 0 70,201 CP16 SHELTERBELTS 204 419 36,604 0 37,226 CP17 LIVING SNOW FENCES 0 0 6,070 0 6,070 CP18 SALINITY REDUCING VEGETATION 0 8 239,602 0 239,610 CP19 ALLEY CROPPING 0 0 0 0 0 CP20 ALTERNATIVE PERENNIALS 0 0 0 0 0 CP21 FILTER STRIPS (GRASS) 0 181,838 847,505 0 1,029,343 CP22 RIPARIAN BUFFERS 0 212,019 659,373 0 871,392 CP23 WETLAND RESTORATION 4/ 1,218,631 87,311 0 0 1,305,943 CP23 WETLAND REST. (FLOODPLAIN) 0 12,439 159,271 0 171,710 CP23A WETLAND REST. (NON-FLOODPLAIN) 0 16,056 79,960 0 96,015 CP24 CROSS WIND TRAP STRIPS 0 38 415 0 452 CP25 RARE AND DECLINING HABITAT 1,145,643 53,684 0 0 1,199,326 CP26 SEDIMENT RETENTION 0 35 0 0 35 CP27 FARMABLE WETLAND (WETLAND) 0 0 0 64,262 64,262 CP28 FARMABLE WETLAND (UPLAND) 5/ 0 0 0 149,542 149,542 CP29 WILDLIFE HABITAT BUFFER (MARG PAST) 0 86,274 29,648 0 115,922 CP30 WETLAND BUFFER (MARG PAST) 0 1,389 29,671 0 31,060 CP31 BOTTOMLAND HARDWOOD TREES 0 13,538 45,037 0 58,575 CP32 HARDWOOD TREES (PREVIOUS EXPIRED) 8,569 0 0 0 8,569 CP33 UPLAND BIRD HABITAT BUFFER 0 5,510 222,369 0 227,879 CP34 FLOOD CONTROL STRUCTURE 0 71 0 0 71 CP36 LONGLEAF PINE 0 0 85,544 0 85,544 CP37 DUCK NESTING HABITAT 0 6,361 98,030 0 104,391 CP38 STATE ACRES FOR WILDLIFE ENHANCEMENT 0 0 300,113 0 300,113 CP39 FWP--CONSTRUCTED WETLANDS 0 0 0 66 66 CP40 FWP--AQUACULTURE WETLANDS 0 0 0 4,757 4,757 CP41 FWP--FLOODED PRAIRIE WETLANDS 0 0 0 13,421 13,421 ========== ========== =========== ========== ========== 26,664,007 1,197,168 3,205,013 232,048 31,298,236 1/ Contracts in effect September 30, 2010. 2/ Includes both introduced and native grasses and legumes. 3/ Includes both softwood and hardwood trees. 4/ inlcused both floodplain and non-floodplain wetlands prior to 2003. 5/ Includes non-wetland portions of CP27, CP39, CP40, and CP41 (if any).
-27-
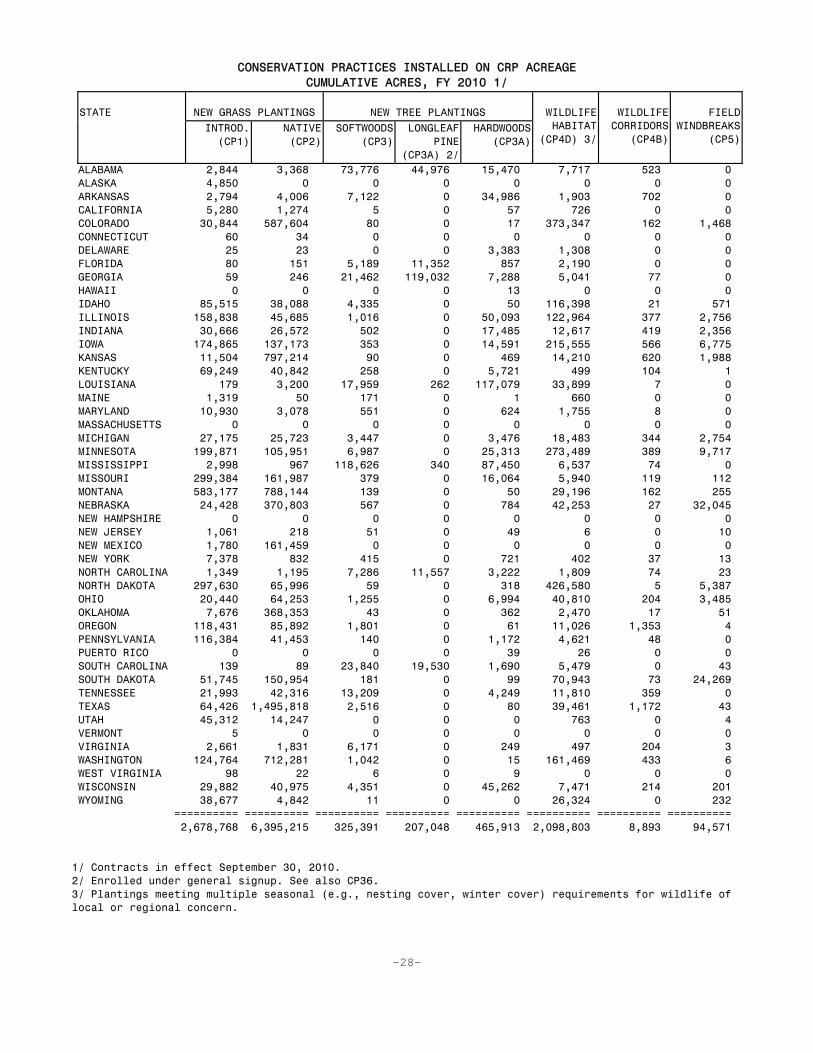
CONSERVATION PRACTICES INSTALLED ON CRP ACREAGE
CUMULATIVE ACRES, FY 2010 1/ STATE
NEW GRASS PLANTINGS
NEW TREE PLANTINGS
WILDLIFE HABITAT
(CP4D) 3/
WILDLIFE CORRIDORS
(CP4B)
FIELD
WINDBREAKS (CP5)
INTROD. (CP1)
NATIVE (CP2)
SOFTWOODS (CP3)
LONGLEAF PINE
(CP3A) 2/
HARDWOODS (CP3A)
ALABAMA 2,844 3,368 73,776 44,976 15,470 7,717 523 0 ALASKA 4,850 0 0 0 0 0 0 0 ARKANSAS 2,794 4,006 7,122 0 34,986 1,903 702 0 CALIFORNIA 5,280 1,274 5 0 57 726 0 0 COLORADO 30,844 587,604 80 0 17 373,347 162 1,468 CONNECTICUT 60 34 0 0 0 0 0 0 DELAWARE 25 23 0 0 3,383 1,308 0 0 FLORIDA 80 151 5,189 11,352 857 2,190 0 0 GEORGIA 59 246 21,462 119,032 7,288 5,041 77 0 HAWAII 0 0 0 0 13 0 0 0 IDAHO 85,515 38,088 4,335 0 50 116,398 21 571 ILLINOIS 158,838 45,685 1,016 0 50,093 122,964 377 2,756 INDIANA 30,666 26,572 502 0 17,485 12,617 419 2,356 IOWA 174,865 137,173 353 0 14,591 215,555 566 6,775 KANSAS 11,504 797,214 90 0 469 14,210 620 1,988 KENTUCKY 69,249 40,842 258 0 5,721 499 104 1 LOUISIANA 179 3,200 17,959 262 117,079 33,899 7 0 MAINE 1,319 50 171 0 1 660 0 0 MARYLAND 10,930 3,078 551 0 624 1,755 8 0 MASSACHUSETTS 0 0 0 0 0 0 0 0 MICHIGAN 27,175 25,723 3,447 0 3,476 18,483 344 2,754 MINNESOTA 199,871 105,951 6,987 0 25,313 273,489 389 9,717 MISSISSIPPI 2,998 967 118,626 340 87,450 6,537 74 0 MISSOURI 299,384 161,987 379 0 16,064 5,940 119 112 MONTANA 583,177 788,144 139 0 50 29,196 162 255 NEBRASKA 24,428 370,803 567 0 784 42,253 27 32,045 NEW HAMPSHIRE 0 0 0 0 0 0 0 0 NEW JERSEY 1,061 218 51 0 49 6 0 10 NEW MEXICO 1,780 161,459 0 0 0 0 0 0 NEW YORK 7,378 832 415 0 721 402 37 13 NORTH CAROLINA 1,349 1,195 7,286 11,557 3,222 1,809 74 23 NORTH DAKOTA 297,630 65,996 59 0 318 426,580 5 5,387 OHIO 20,440 64,253 1,255 0 6,994 40,810 204 3,485 OKLAHOMA 7,676 368,353 43 0 362 2,470 17 51 OREGON 118,431 85,892 1,801 0 61 11,026 1,353 4 PENNSYLVANIA 116,384 41,453 140 0 1,172 4,621 48 0 PUERTO RICO 0 0 0 0 39 26 0 0 SOUTH CAROLINA 139 89 23,840 19,530 1,690 5,479 0 43 SOUTH DAKOTA 51,745 150,954 181 0 99 70,943 73 24,269 TENNESSEE 21,993 42,316 13,209 0 4,249 11,810 359 0 TEXAS 64,426 1,495,818 2,516 0 80 39,461 1,172 43 UTAH 45,312 14,247 0 0 0 763 0 4 VERMONT 5 0 0 0 0 0 0 0 VIRGINIA 2,661 1,831 6,171 0 249 497 204 3 WASHINGTON 124,764 712,281 1,042 0 15 161,469 433 6 WEST VIRGINIA 98 22 6 0 9 0 0 0 WISCONSIN 29,882 40,975 4,351 0 45,262 7,471 214 201 WYOMING 38,677 4,842 11 0 0 26,324 0 232 ========== ========== ========== ========== ========== ========== ========== ========== 2,678,768 6,395,215 325,391 207,048 465,913 2,098,803 8,893 94,571 1/ Contracts in effect September 30, 2010. 2/ Enrolled under general signup. See also CP36. 3/ Plantings meeting multiple seasonal (e.g., nesting cover, winter cover) requirements for wildlife of local or regional concern.
-28-
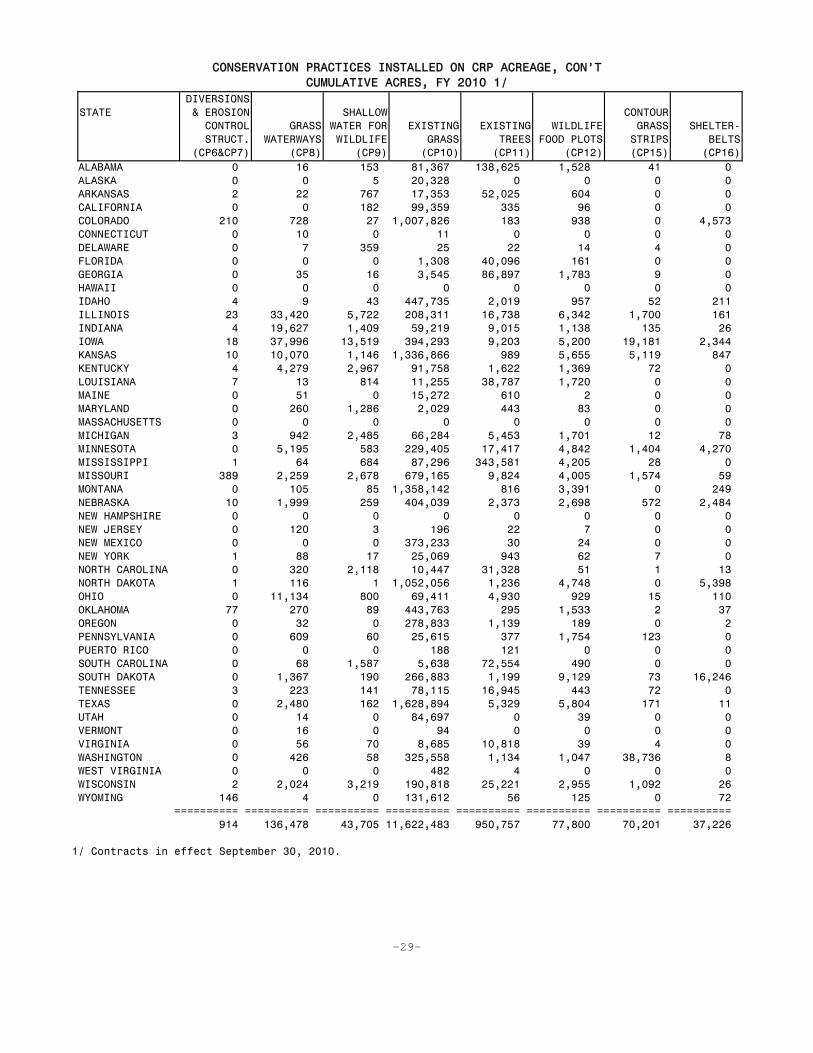
CONSERVATION PRACTICES INSTALLED ON CRP ACREAGE, CON’T
CUMULATIVE ACRES, FY 2010 1/ STATE
DIVERSIONS & EROSION CONTROL STRUCT.
(CP6&CP7)
GRASS WATERWAYS
(CP8)
SHALLOW
WATER FOR WILDLIFE
(CP9)
EXISTING GRASS
(CP10)
EXISTING TREES
(CP11)
WILDLIFE FOOD PLOTS
(CP12)
CONTOUR GRASS
STRIPS (CP15)
SHELTER- BELTS
(CP16) ALABAMA 0 16 153 81,367 138,625 1,528 41 0 ALASKA 0 0 5 20,328 0 0 0 0 ARKANSAS 2 22 767 17,353 52,025 604 0 0 CALIFORNIA 0 0 182 99,359 335 96 0 0 COLORADO 210 728 27 1,007,826 183 938 0 4,573 CONNECTICUT 0 10 0 11 0 0 0 0 DELAWARE 0 7 359 25 22 14 4 0 FLORIDA 0 0 0 1,308 40,096 161 0 0 GEORGIA 0 35 16 3,545 86,897 1,783 9 0 HAWAII 0 0 0 0 0 0 0 0 IDAHO 4 9 43 447,735 2,019 957 52 211 ILLINOIS 23 33,420 5,722 208,311 16,738 6,342 1,700 161 INDIANA 4 19,627 1,409 59,219 9,015 1,138 135 26 IOWA 18 37,996 13,519 394,293 9,203 5,200 19,181 2,344 KANSAS 10 10,070 1,146 1,336,866 989 5,655 5,119 847 KENTUCKY 4 4,279 2,967 91,758 1,622 1,369 72 0 LOUISIANA 7 13 814 11,255 38,787 1,720 0 0 MAINE 0 51 0 15,272 610 2 0 0 MARYLAND 0 260 1,286 2,029 443 83 0 0 MASSACHUSETTS 0 0 0 0 0 0 0 0 MICHIGAN 3 942 2,485 66,284 5,453 1,701 12 78 MINNESOTA 0 5,195 583 229,405 17,417 4,842 1,404 4,270 MISSISSIPPI 1 64 684 87,296 343,581 4,205 28 0 MISSOURI 389 2,259 2,678 679,165 9,824 4,005 1,574 59 MONTANA 0 105 85 1,358,142 816 3,391 0 249 NEBRASKA 10 1,999 259 404,039 2,373 2,698 572 2,484 NEW HAMPSHIRE 0 0 0 0 0 0 0 0 NEW JERSEY 0 120 3 196 22 7 0 0 NEW MEXICO 0 0 0 373,233 30 24 0 0 NEW YORK 1 88 17 25,069 943 62 7 0 NORTH CAROLINA 0 320 2,118 10,447 31,328 51 1 13 NORTH DAKOTA 1 116 1 1,052,056 1,236 4,748 0 5,398 OHIO 0 11,134 800 69,411 4,930 929 15 110 OKLAHOMA 77 270 89 443,763 295 1,533 2 37 OREGON 0 32 0 278,833 1,139 189 0 2 PENNSYLVANIA 0 609 60 25,615 377 1,754 123 0 PUERTO RICO 0 0 0 188 121 0 0 0 SOUTH CAROLINA 0 68 1,587 5,638 72,554 490 0 0 SOUTH DAKOTA 0 1,367 190 266,883 1,199 9,129 73 16,246 TENNESSEE 3 223 141 78,115 16,945 443 72 0 TEXAS 0 2,480 162 1,628,894 5,329 5,804 171 11 UTAH 0 14 0 84,697 0 39 0 0 VERMONT 0 16 0 94 0 0 0 0 VIRGINIA 0 56 70 8,685 10,818 39 4 0 WASHINGTON 0 426 58 325,558 1,134 1,047 38,736 8 WEST VIRGINIA 0 0 0 482 4 0 0 0 WISCONSIN 2 2,024 3,219 190,818 25,221 2,955 1,092 26 WYOMING 146 4 0 131,612 56 125 0 72 ========== ========== ========== ========== ========== ========== ========== ========== 914 136,478 43,705 11,622,483 950,757 77,800 70,201 37,226 1/ Contracts in effect September 30, 2010.
-29-

CONSERVATION PRACTICES INSTALLED ON CRP ACREAGE, CON’T CUMULATIVE ACRES, FY 2010 1/
STATE
LIVING SNOW FENCES
(CP17)
SALINITY REDUCING
VEGETATION (CP18)
FILTER- STRIPS (CP21)
RIPARIAN BUFFERS (CP22)
WETLAND RESTORATION CROSS
WIND TRAP STRIPS (CP24)
(CP23) 2/ FLOODPLAIN (CP23) 3/
NON-FLOODPLAIN (CP23A) 3/
ALABAMA 0 0 721 33,660 65 0 0 0 ALASKA 0 0 10 198 0 0 0 0 ARKANSAS 0 0 5,928 61,036 13,474 15,518 3,580 0 CALIFORNIA 0 0 0 12,669 5,108 0 0 0 COLORADO 27 77 319 817 1,081 0 80 32 CONNECTICUT 0 0 24 36 0 0 0 0 DELAWARE 0 0 1,156 114 255 81 0 0 FLORIDA 0 0 0 64 0 0 0 0 GEORGIA 0 0 438 1,449 511 13 0 0 HAWAII 0 0 0 152 0 0 0 0 IDAHO 63 0 1,227 7,168 1,259 0 0 0 ILLINOIS 58 6 142,215 110,721 42,129 6,500 1,581 0 INDIANA 1 1 60,607 5,843 5,218 1,382 1,723 0 IOWA 590 4 236,980 65,497 13,664 58,366 4,875 11 KANSAS 74 871 31,457 3,932 3,816 2,860 2,400 175 KENTUCKY 0 0 32,645 25,069 35 96 0 0 LOUISIANA 0 0 628 5,401 21,850 30,039 8,079 0 MAINE 0 0 107 160 0 0 0 0 MARYLAND 0 0 37,708 16,635 1,905 647 24 0 MASSACHUSETTS 0 0 10 5 0 0 0 0 MICHIGAN 3 0 46,745 3,468 10,607 2,062 7,428 0 MINNESOTA 3,930 7,066 158,268 47,575 282,434 21,069 19,862 5 MISSISSIPPI 0 0 8,176 165,202 10,569 2,871 615 0 MISSOURI 0 0 40,862 29,302 3,609 7,445 336 0 MONTANA 52 100,431 225 2,326 4,199 93 0 0 NEBRASKA 127 1,034 21,301 3,230 11,780 1,046 560 0 NEW HAMPSHIRE 0 0 45 15 0 0 0 0 NEW JERSEY 0 0 342 230 1 0 0 0 NEW MEXICO 0 0 0 5,280 0 0 0 0 NEW YORK 0 0 464 13,492 46 12 31 0 NORTH CAROLINA 0 0 5,906 31,514 1,201 1,008 0 0 NORTH DAKOTA 575 113,510 9,687 557 599,785 992 15,920 10 OHIO 3 0 75,098 7,069 3,404 2,499 3,339 4 OKLAHOMA 0 2,263 748 1,519 835 0 1,479 0 OREGON 0 0 2,417 35,805 394 3 0 0 PENNSYLVANIA 0 0 1,854 24,777 317 691 0 0 PUERTO RICO 0 0 0 717 0 0 0 0 SOUTH CAROLINA 0 0 4,304 26,864 254 0 0 0 SOUTH DAKOTA 530 13,822 9,959 5,586 244,580 15,176 23,533 11 TENNESSEE 0 0 9,476 6,399 689 1 0 0 TEXAS 0 501 1,541 33,275 9,052 10 280 167 UTAH 0 0 39 209 0 0 0 0 VERMONT 0 0 225 2,359 0 0 0 0 VIRGINIA 0 0 4,896 23,977 193 43 0 38 WASHINGTON 0 24 48,053 23,051 3,378 0 0 0 WEST VIRGINIA 0 0 372 4,429 0 0 0 0 WISCONSIN 34 0 26,150 16,552 8,243 1,187 290 0 WYOMING 3 0 9 5,959 0 0 0 0 ========== ========== ========== ========== ========== ========== ========== ========== 6,070 239,610 1,029,343 871,392 1,305,943 171,710 96,015 452 1/ Contracts in effect September 30, 2010. 2/ Acres enrolled under general sign-up and CREP through 2003. 3/ Acres enrolled under continuous/CREP sign-up after 2003.
-30-

CONSERVATION PRACTICES INSTALLED ON CRP ACREAGE, CON’T CUMULATIVE ACRES, FY 2010 1/
STATE
RARE AND DECLINING HABITAT (CP25)
FARMABLE WETLAND PROGRAM
MARGINAL PASTURE BUFFERS
BOTTOMLAND HARDWOOD
TREES (CP31)
EXPIRED HARDWOOD
TREES (CP32)
UPLAND BIRD
HABITAT BUFFERS (CP33)
WETLAND (CP27)
BUFFER (CP28)
WILDLIFE (CP29)
WETLAND (CP30)
ALABAMA 474 0 0 63 0 801 0 1,099 ALASKA 0 0 0 0 433 0 0 0 ARKANSAS 0 0 0 385 1 10,185 393 5,409 CALIFORNIA 0 0 0 578 0 0 0 0 COLORADO 381 33 123 189 19 0 0 0 CONNECTICUT 0 0 0 0 0 0 0 0 DELAWARE 0 0 0 0 0 0 0 0 FLORIDA 0 0 0 0 0 0 0 0 GEORGIA 0 0 0 3 0 25 0 2,197 HAWAII 0 0 0 0 0 0 0 0 IDAHO 37 4 2 228 171 0 0 0 ILLINOIS 2,147 138 257 243 24 2,764 637 51,551 INDIANA 1,904 332 626 78 51 3,212 575 12,649 IOWA 79,450 22,062 54,111 9,734 2,292 2,025 1,550 24,119 KANSAS 500,801 551 1,094 19 0 171 0 38,800 KENTUCKY 16,888 0 0 73,138 5 280 234 7,748 LOUISIANA 0 0 0 0 0 24,173 922 439 MAINE 0 0 0 0 12 0 0 0 MARYLAND 265 1 4 687 6 4 0 688 MASSACHUSETTS 0 0 0 0 0 0 0 0 MICHIGAN 216 23 48 0 235 11 6 787 MINNESOTA 135,489 12,764 29,604 873 4,072 228 1,862 398 MISSISSIPPI 0 0 0 37 24 9,974 775 2,231 MISSOURI 73,281 4 5 1,148 2,006 936 546 31,653 MONTANA 188,257 50 90 98 0 0 0 0 NEBRASKA 132,385 1,548 2,488 1,145 209 9 0 5,851 NEW HAMPSHIRE 0 0 0 0 0 0 0 0 NEW JERSEY 0 0 0 0 0 0 0 0 NEW MEXICO 0 0 0 0 0 0 0 0 NEW YORK 0 0 0 2,276 901 2 0 0 NORTH CAROLINA 0 0 0 54 0 14 0 7,460 NORTH DAKOTA 6,141 7,695 19,275 0 0 0 0 0 OHIO 6,562 75 174 2,743 82 61 39 15,133 OKLAHOMA 25,458 9 22 6 9 416 80 1,054 OREGON 7 0 0 10,427 105 0 0 0 PENNSYLVANIA 0 0 0 1,170 441 2 0 0 PUERTO RICO 0 0 0 961 0 0 0 0 SOUTH CAROLINA 0 0 0 50 86 0 0 5,688 SOUTH DAKOTA 13,957 18,952 41,583 4,179 19,821 0 0 1,318 TENNESSEE 0 0 0 9 0 2,902 1 4,991 TEXAS 52 0 0 2,086 2 381 0 4,791 UTAH 0 0 0 26 0 0 0 0 VERMONT 0 0 0 0 3 0 0 0 VIRGINIA 0 0 0 526 20 0 0 1,524 WASHINGTON 108 0 0 837 0 0 0 0 WEST VIRGINIA 0 0 0 0 0 0 0 0 WISCONSIN 15,064 22 35 1,176 30 0 950 304 WYOMING 0 0 0 745 0 0 0 0 ========== ========== ========== ========== ========== ========== ========== ========== 1,199,326 64,262 149,542 115,922 31,060 58,575 8,569 227,879 1/ Contracts in effect September 30, 2010.
-31-

CONSERVATION PRACTICES INSTALLED ON CRP ACREAGE, CON’T
CUMULATIVE ACRES, FY 2010 1/
STATE
LONGLEAF PINE
INITIATIVE (CP36)
DUCK NESTING HABITAT
INITIATIVE (CP37)
STATE ACRES FOR WILDLIFE ENHANCEMENT (CP38)
CONSTRUCTED
WETLANDS (CP39)
AQUACULTURE
WETLANDS (CP40)
FLOODED PRAIRIE WETLANDS (CP41) 1/
TOTAL
ALABAMA 8,152 0 2,041 0 18 0 417,497 ALASKA 0 0 0 0 0 0 25,823 ARKANSAS 0 0 10,423 0 0 0 248,619 CALIFORNIA 0 0 0 0 0 0 125,668 COLORADO 0 0 10,915 0 0 0 2,022,103 CONNECTICUT 0 0 0 0 0 0 176 DELAWARE 0 0 0 0 0 0 6,777 FLORIDA 677 0 0 0 0 0 62,126 GEORGIA 67,518 0 3,262 0 0 0 320,906 HAWAII 0 0 0 0 0 0 165 IDAHO 0 0 10,247 0 0 0 716,417 ILLINOIS 0 0 7,368 0 0 0 1,022,486 INDIANA 0 0 12,229 0 0 0 287,675 IOWA 0 12 30,007 0 0 125 1,637,108 KANSAS 0 0 8,958 0 0 0 2,782,777 KENTUCKY 0 0 7,692 0 0 0 382,575 LOUISIANA 59 0 215 0 1,123 0 318,112 MAINE 0 0 2,137 0 0 0 20,552 MARYLAND 0 0 0 0 0 0 79,620 MASSACHUSETTS 0 0 0 0 0 0 15 MICHIGAN 0 0 3,090 0 0 0 233,202 MINNESOTA 0 5,395 25,947 66 0 185 1,641,996 MISSISSIPPI 397 0 4,315 0 3,410 0 861,448 MISSOURI 0 0 16,588 0 206 0 1,391,865 MONTANA 0 28 17,387 0 0 0 3,077,149 NEBRASKA 0 0 24,694 0 0 0 1,092,753 NEW HAMPSHIRE 0 0 0 0 0 0 60 NEW JERSEY 0 0 198 0 0 0 2,515 NEW MEXICO 0 0 0 0 0 0 541,807 NEW YORK 0 0 423 0 0 0 53,633 NORTH CAROLINA 4,308 0 598 0 0 0 122,860 NORTH DAKOTA 0 48,168 27,167 0 0 10,319 2,719,334 OHIO 0 0 2,512 0 0 0 343,569 OKLAHOMA 0 0 1,438 0 0 0 860,372 OREGON 0 0 0 0 0 0 547,920 PENNSYLVANIA 0 0 0 0 0 0 221,610 PUERTO RICO 0 0 0 0 0 0 2,052 SOUTH CAROLINA 4,042 0 514 0 0 0 172,950 SOUTH DAKOTA 0 50,658 53,814 0 0 2,792 1,113,623 TENNESSEE 0 0 3,096 0 0 0 217,443 TEXAS 0 0 6,618 0 0 0 3,305,123 UTAH 0 0 0 0 0 0 145,349 VERMONT 0 0 0 0 0 0 2,703 VIRGINIA 392 0 126 0 0 0 63,021 WASHINGTON 0 0 1,731 0 0 0 1,444,161 WEST VIRGINIA 0 0 0 0 0 0 5,423 WISCONSIN 0 0 4,361 0 0 0 428,113 WYOMING 0 0 0 0 0 0 208,819 ========== ========== ========== ========== ========== ========== ================= 85,544 104,391 300,113 66 4,757 13,421 31,298,245 1/ Contracts in effect September 30, 2010.
-32-

CRP ENROLLMENT BY ERODIBILITY INDEX (EI) CATEGORY CUMULATIVE ACRES ENROLLED AS OF FY 2010 ----------------General Signup------------------ EI>=8 EI>=15 STATE All Continuous EI<8 1/ and <15 and <20 EI>=20 ALABAMA 417,497 46,765 60,165 146,142 73,755 90,671 ALASKA 25,823 646 0 1,083 3,029 21,065 ARIZONA 4 4 0 0 0 0 ARKANSAS 248,619 113,565 54,358 41,476 18,873 20,347 CALIFORNIA 125,668 18,443 16,673 32,771 24,578 33,203 COLORADO 2,022,103 41,244 55,029 940,930 728,122 256,777 CONNECTICUT 176 71 49 54 3 0 DELAWARE 6,777 5,999 641 83 49 6 FLORIDA 62,126 741 15,565 32,408 11,619 1,793 GEORGIA 320,906 75,712 128,921 79,329 23,285 13,659 HAWAII 165 165 0 0 0 0 IDAHO 716,417 37,231 221,692 334,649 35,438 87,407 ILLINOIS 1,022,486 452,679 42,025 119,256 141,935 266,590 INDIANA 287,675 122,626 43,450 41,949 30,129 49,522 IOWA 1,637,108 597,769 68,068 74,064 154,814 742,392 KANSAS 2,782,777 123,542 574,927 1,652,749 255,318 176,241 KENTUCKY 382,575 166,686 3,063 11,070 24,969 176,786 LOUISIANA 318,112 109,040 127,320 60,682 7,944 13,127 MAINE 20,552 2,486 2,191 12,994 1,965 916 MARYLAND 79,620 72,982 3,082 1,519 1,050 986 MASSACHUSETTS 15 15 0 0 0 0 MICHIGAN 233,202 93,709 98,649 31,978 6,150 2,715 MINNESOTA 1,641,996 429,684 976,401 185,129 19,269 31,512 MISSISSIPPI 861,448 198,056 158,523 98,743 70,779 335,346 MISSOURI 1,391,865 169,733 49,934 125,636 204,296 842,267 MONTANA 3,077,149 131,709 135,842 1,955,569 576,808 277,221 NEBRASKA 1,092,753 172,009 71,999 486,988 223,697 138,062 NEVADA 146 0 0 146 0 0 NEW HAMPSHIRE 60 60 0 0 0 0 NEW JERSEY 2,515 903 156 646 525 284 NEW MEXICO 541,807 5,280 1,968 160,112 98,070 276,377 NEW YORK 53,633 21,610 5,605 11,644 8,710 6,064 NORTH CAROLINA 122,860 57,188 12,168 13,506 14,157 25,840 NORTH DAKOTA 2,719,334 267,952 1,287,426 1,040,002 102,625 21,329 OHIO 343,569 165,747 66,454 61,717 22,637 27,015 OKLAHOMA 860,372 9,577 116,075 458,893 156,150 119,678 OREGON 547,920 48,960 27,318 298,187 123,997 49,457 PENNSYLVANIA 221,610 206,757 169 1,487 3,183 10,013 PUERTO RICO 2,052 1,687 24 0 0 341 RHODE ISLAND 28 28 0 0 0 0 SOUTH CAROLINA 172,950 43,278 57,718 46,746 13,709 11,498 SOUTH DAKOTA 1,113,619 308,023 528,591 247,064 23,338 6,602 TENNESSEE 217,443 27,317 5,374 25,515 35,269 123,968 TEXAS 3,305,123 57,979 740,132 1,296,973 570,905 639,133 UTAH 145,349 292 96,761 42,494 2,982 2,819 VERMONT 2,703 2,608 0 49 0 45 VIRGINIA 63,021 31,884 1,402 9,940 9,633 10,162 WASHINGTON 1,444,161 112,986 569,222 478,803 135,991 147,160 WEST VIRGINIA 5,423 4,811 180 163 84 185 WISCONSIN 428,113 68,971 73,134 51,763 37,877 196,367 WYOMING 208,819 7,026 182 84,792 69,058 47,761 ========== ========== ========== ========== ========== ========== 31,298,245 4,634,236 6,498,629 10,797,892 4,066,777 5,300,711 1/ Land with EI<8 includes other environmentally sensitive lands such as wetland restorations and land in conservation priority areas.
-33-

CRP CONTRACT EXPIRATIONS BY YEAR (ACRES) 1/ STATE 2007 2008 2009 2010 2011 2012 2013 ALABAMA 49,800 12,985 32,392 70,048 81,289 79,081 35,464 ALASKA 3,811 0 871 7,137 64 990 50 ARKANSAS 12,881 2,405 6,678 25,638 12,676 33,464 15,431 CALIFORNIA 19,493 5,104 2,322 11,323 18,071 24,403 8,190 COLORADO 41,460 23,390 409,399 463,909 346,038 572,318 223,653 CONNECTICUT 133 0 37 13 13 72 10 DELAWARE 358 445 591 435 100 300 289 FLORIDA 13,083 2,863 3,475 11,909 9,596 11,882 6,223 GEORGIA 21,438 5,703 24,371 33,181 23,394 33,773 15,779 HAWAII 0 0 0 0 0 0 0 IDAHO 45,821 13,201 46,395 159,586 118,084 166,964 67,471 ILLINOIS 52,820 43,046 37,439 77,297 68,744 111,212 187,285 INDIANA 25,723 19,752 10,864 19,094 22,229 36,694 48,485 IOWA 145,804 143,779 99,843 170,521 72,255 231,819 185,382 KANSAS 130,079 43,010 331,165 615,469 532,085 519,641 214,324 KENTUCKY 41,718 16,089 13,243 46,557 37,233 46,725 35,434 LOUISIANA 9,040 1,076 5,941 18,923 11,862 38,148 23,747 MAINE 2,780 1,302 1,106 4,065 5,605 5,302 433 MARYLAND 3,253 5,045 5,560 3,492 3,230 8,623 10,013 MASSACHUSETTS 19 14 11 0 5 0 0 MICHIGAN 17,797 22,003 11,961 17,706 11,083 19,181 45,180 MINNESOTA 78,676 107,119 57,216 79,799 127,861 293,147 130,474 MISSISSIPPI 77,664 14,590 31,396 106,956 101,020 166,250 65,448 MISSOURI 146,649 48,873 32,620 151,501 196,422 377,905 184,791 MONTANA 257,631 81,680 138,388 409,852 496,515 696,283 366,576 NEBRASKA 89,936 45,373 116,621 185,817 151,975 201,968 97,512 NEW HAMPSHIRE 90 17 0 6 45 0 0 NEW JERSEY 481 99 30 209 326 171 255 NEW MEXICO 28,531 2,530 29,264 103,137 164,748 120,549 9,643 NEW YORK 7,965 6,296 2,083 2,880 2,526 3,729 4,352 NORTH CAROLINA 9,761 4,324 7,093 17,262 12,908 10,793 7,872 NORTH DAKOTA 400,828 134,905 191,777 259,848 386,817 845,568 259,964 OHIO 24,678 13,755 10,574 19,362 13,396 26,734 56,572 OKLAHOMA 89,081 22,490 101,359 211,511 192,188 191,613 75,910 OREGON 10,643 5,421 14,696 77,235 104,633 90,002 56,402 PENNSYLVANIA 21,804 9,189 4,588 1,911 21,421 27,340 13,821 PUERTO RICO 157 264 0 20 0 167 0 SOUTH CAROLINA 17,438 5,035 17,481 31,830 20,591 35,567 14,756 SOUTH DAKOTA 301,794 118,663 183,719 152,054 126,607 227,009 106,982 TENNESSEE 41,452 9,752 8,920 39,928 34,112 29,078 51,436 TEXAS 151,718 109,082 561,493 696,787 684,506 827,344 362,743 UTAH 12,872 10,186 49,923 85,310 17,368 27,344 5,072 VERMONT 66 8 30 0 58 27 0 VIRGINIA 6,060 2,406 2,597 3,559 5,086 5,737 4,773 WASHINGTON 30,168 36,652 85,442 207,054 88,727 275,549 254,270 WEST VIRGINIA 131 49 129 0 188 103 212 WISCONSIN 72,832 64,816 31,550 57,295 44,310 70,058 74,317 WYOMING 11,493 3,544 62,618 75,217 49,378 61,233 5,366 ========= ========= ========= ========= ========= ========= ========= 2,527,910 1,218,330 2,785,271 4,732,787 4,417,389 6,551,862 3,332,362 1/ Includes general and continuous sign-up acreage. Contracts expire at the end of the fiscal year, September 30. Note: Data for fiscal years 2007-2009, are acres that were not re-enrolled under new contracts. For fiscal year 2010 and later, data includes acres that will likely be re-enrolled and starting new contracts in fiscal year 2011.
-34-

CRP CONTRACT EXPIRATIONS BY YEAR (ACRES) 1/ STATE 2014 2015 2016 2017 2018 2019 2020+ ALABAMA 34,872 28,160 14,085 33,484 15,786 5,197 20,032 ALASKA 459 103 0 14,732 0 2,146 143 ARKANSAS 11,167 17,838 12,169 16,545 25,738 14,594 63,359 CALIFORNIA 1,784 5,018 4,337 41,479 1,966 1,924 7,173 COLORADO 93,975 95,100 87,847 29,954 47,487 27,713 34,108 CONNECTICUT 10 0 0 20 34 3 0 DELAWARE 234 1,777 1,684 534 414 270 739 FLORIDA 6,998 5,077 694 5,883 2,516 407 942 GEORGIA 63,737 42,786 3,599 14,876 23,135 3,645 63,001 HAWAII 0 0 19 0 0 0 147 IDAHO 43,338 23,625 14,280 74,352 10,097 10,540 28,081 ILLINOIS 98,150 118,313 84,564 100,768 69,967 46,241 59,944 INDIANA 19,585 27,256 19,394 32,668 16,340 13,229 32,702 IOWA 92,988 114,160 98,645 226,728 166,363 135,976 142,271 KANSAS 120,763 113,542 99,021 143,156 108,248 51,006 265,523 KENTUCKY 20,634 26,255 14,964 26,273 37,936 13,200 77,364 LOUISIANA 50,231 28,461 3,414 8,918 32,579 8,251 93,579 MAINE 74 451 61 2,281 123 3 2,156 MARYLAND 6,198 8,995 10,013 13,459 6,425 3,826 5,344 MASSACHUSETTS 0 0 0 0 0 10 0 MICHIGAN 7,547 24,348 39,243 20,788 12,257 7,483 28,386 MINNESOTA 208,017 101,910 91,075 105,147 215,609 105,424 183,532 MISSISSIPPI 45,514 64,881 41,145 127,609 57,350 29,888 55,387 MISSOURI 57,467 79,248 67,990 136,901 48,813 20,051 70,777 MONTANA 251,236 114,106 36,108 416,454 123,551 109,230 57,240 NEBRASKA 72,287 65,617 50,098 72,199 51,462 25,235 118,584 NEW HAMPSHIRE 0 0 8 0 1 0 0 NEW JERSEY 95 72 81 434 169 73 631 NEW MEXICO 5,998 1,909 2,363 122,956 8,367 1,734 401 NEW YORK 969 6,245 5,639 11,715 5,077 3,930 6,570 NORTH CAROLINA 12,526 15,613 9,721 9,047 9,275 4,647 13,195 NORTH DAKOTA 149,452 54,338 39,501 365,547 22,836 46,355 289,109 OHIO 13,440 28,031 20,900 43,326 17,377 16,868 87,564 OKLAHOMA 20,106 25,077 27,082 70,832 19,067 9,098 17,887 OREGON 32,982 35,041 29,981 80,675 13,023 10,052 17,891 PENNSYLVANIA 13,999 16,394 9,944 19,666 24,351 27,701 45,061 PUERTO RICO 436 0 0 0 1,409 20 0 SOUTH CAROLINA 19,733 18,806 3,174 17,076 2,784 2,172 6,460 SOUTH DAKOTA 71,725 46,517 58,052 50,281 33,014 47,418 193,964 TENNESSEE 9,533 13,855 9,261 13,576 5,742 3,484 7,437 TEXAS 170,371 140,347 61,295 140,617 103,810 87,845 29,457 UTAH 396 3,327 3,133 3,361 34 0 5 VERMONT 54 133 596 207 199 177 1,251 VIRGINIA 2,411 8,311 8,722 10,278 5,913 2,374 5,856 WASHINGTON 141,093 131,436 103,688 10,709 166,363 48,221 17,050 WEST VIRGINIA 42 95 357 765 678 383 2,600 WISCONSIN 26,851 32,449 17,332 46,510 30,250 8,435 20,306 WYOMING 4,853 3,881 932 1,579 2,590 2,315 1,473 ========= ========= ========= ========= ========= ========= ========= 2,004,357 1,688,904 1,206,212 2,684,367 1,546,528 958,797 2,174,680 1/ Includes general and continuous sign-up acreage. Contracts expire at the end of the fiscal year, September 30.
-35-

EXTENSIONS OF FY 2009-EXPIRING CRP CONTRACTS (ACRES)1/ ____________________________________________________________________________________ ORIGINALLY 2-YEAR 5-YEAR TOTAL NET STATE EXPIRING EXTENSIONS EXTENSIONS EXTENSIONS EXPRIATIONS ALABAMA 43,178 9,019 1,443 10,462 32,716 ALASKA 1,544 673 . 673 871 ARKANSAS 10,039 2,881 479 3,361 6,678 CALIFORNIA 4,068 1,476 270 1,746 2,322 COLORADO 719,687 307,229 3,188 310,417 409,270 CONNECTICUT 37 . . . 37 DELAWARE 591 . . . 591 FLORIDA 4,428 448 506 954 3,475 GEORGIA 30,670 5,404 736 6,139 24,531 IDAHO 62,393 12,667 3,332 16,000 46,393 ILLINOIS 43,773 17 6,309 6,326 37,446 INDIANA 12,597 27 1,714 1,741 10,856 IOWA 107,630 59 8,384 8,443 99,187 KANSAS 426,543 92,935 2,560 95,495 331,047 KENTUCKY 14,410 76 1,082 1,158 13,252 LOUISIANA 8,016 1,379 428 1,807 6,209 MAINE 1,106 . . . 1,106 MARYLAND 5,662 . 102 102 5,560 MASSACHUSETTS 11 . . . 11 MICHIGAN 12,835 17 857 874 11,961 MINNESOTA 62,199 168 4,930 5,099 57,100 MISSISSIPPI 46,219 11,978 3,437 15,415 30,804 MISSOURI 42,130 1,199 8,409 9,608 32,521 MONTANA 197,124 46,020 12,770 58,790 138,334 NEBRASKA 153,818 34,002 2,301 36,302 117,515 NEW HAMPSHIRE . . . . . NEW JERSEY 30 . . . 30 NEW MEXICO 41,895 11,615 1,016 12,631 29,264 NEW YORK 2,247 . 164 164 2,083 NORTH CAROLINA 9,763 1,733 937 2,670 7,093 NORTH DAKOTA 224,700 30,384 2,892 33,276 191,424 OHIO 11,951 . 1,377 1,377 10,574 OKLAHOMA 161,490 57,433 2,157 59,590 101,900 OREGON 20,852 5,737 419 6,156 14,696 PENNSYLVANIA 4,949 20 341 361 4,588 PUERTO RICO . . . . . SOUTH CAROLINA 26,863 8,986 396 9,381 17,481 SOUTH DAKOTA 226,184 41,619 379 41,998 184,186 TENNESSEE 12,665 2,367 1,547 3,914 8,751 TEXAS 778,801 204,876 12,810 217,686 561,115 UTAH 64,612 14,546 143 14,689 49,923 VERMONT 30 . . . 30 VIRGINIA 3,096 . 499 499 2,597 WASHINGTON 106,624 17,176 4,005 21,180 85,444 WEST VIRGINIA 129 . . . 129 WISCONSIN 38,020 1,368 5,101 6,469 31,550 WYOMING 97,276 34,424 234 34,658 62,618 U.S. 3,842,885 959,957 97,656 1,057,614 2,785,271
1/ General signup only.
-36-

2006 REX RESULTS * CONTRACTS ORIGINALLY SET TO EXPIRE IN 2007
DATA AS OF FEBRUARY 2008 _______________________________________________________________________________________________ RE- EX- TOTAL PERCENT DECLINED STATE ELIGIBLE ENROLLED TENDED REX REX REX U.S. 15,685,540 2,531,449 10,866,548 13,397,997 85 2,287,543 ALABAMA 230,396 30,060 150,601 180,660 78 49,736 ALASKA 24,034 14,475 6,156 20,632 86 3,402 ARKANSAS 46,378 5,283 29,500 34,783 75 11,595 CALIFORNIA 93,779 41,885 32,334 74,219 79 19,560 COLORADO 1,350,741 28,562 1,263,621 1,292,183 96 58,558 CONNECTICUT 167 20 17 37 22 130 DELAWARE 399 108 95 203 51 196 FLORIDA 42,769 6,506 22,218 28,725 67 14,045 GEORGIA 96,214 9,736 64,347 74,083 77 22,131 IDAHO 528,598 76,494 401,881 478,375 90 50,223 ILLINOIS 167,422 67,844 63,599 131,443 79 35,978 INDIANA 67,492 27,003 18,560 45,563 68 21,928 IOWA 497,091 204,143 152,960 357,103 72 139,988 KANSAS 1,610,000 135,038 1,333,279 1,468,317 91 141,684 KENTUCKY 132,719 14,693 76,179 90,872 68 41,847 LOUISIANA 41,083 7,597 25,943 33,540 82 7,543 MAINE 15,155 2,411 10,024 12,435 82 2,720 MARYLAND 4,217 2,117 409 2,527 60 1,690 MASSACHUSETTS 15 0 0 0 0 15 MICHIGAN 45,248 11,505 17,390 28,895 64 16,353 MINNESOTA 381,729 59,856 255,098 314,954 83 66,775 MISSISSIPPI 417,689 100,825 243,655 344,480 82 73,209 MISSOURI 781,389 129,151 502,418 631,569 81 149,820 MONTANA 1,545,823 354,033 1,070,037 1,424,070 92 121,753 NEBRASKA 558,043 65,877 397,972 463,849 83 94,194 NEW JERSEY 992 380 155 535 54 458 NEW MEXICO 533,768 124,614 383,164 507,778 95 25,990 NEW YORK 24,645 11,313 4,753 16,066 65 8,579 NORTH CAROLINA 40,162 3,486 25,637 29,124 73 11,038 NORTH DAKOTA 1,652,787 553,567 740,231 1,293,798 78 358,989 OHIO 75,769 35,283 18,726 54,009 71 21,761 OKLAHOMA 620,777 70,777 462,405 533,182 86 87,594 OREGON 295,609 75,612 208,989 284,601 96 11,007 PENNSYLVANIA 30,810 7,827 1,196 9,023 29 21,787 PUERTO RICO 157 0 17 17 11 140 SOUTH CAROLINA 94,532 14,940 59,934 74,874 79 19,658 SOUTH DAKOTA 683,628 52,684 370,650 423,335 62 260,294 TENNESSEE 122,600 11,014 68,063 79,077 64 43,523 TEXAS 2,055,713 126,645 1,779,363 1,906,008 93 149,705 UTAH 143,549 3,334 131,160 134,494 94 9,055 VERMONT 116 45 49 94 81 22 VIRGINIA 22,613 6,766 8,019 14,786 65 7,827 WASHINGTON 220,680 2,593 203,226 205,818 93 14,862 WEST VIRGINIA 497 133 187 320 64 177 WISCONSIN 190,222 34,900 76,538 111,439 59 78,783 WYOMING 197,320 310 185,791 186,102 94 11,218 * REX stands for 2006's re-enrollment and extension offer for general signup contracts set to expire 2007-2010. Contracts re-enrolled are under new 10-15 year contracts. Extensions are for 2-5 years.
-37-

2006 REX RESULTS * CONTRACTS ORIGINALLY SET TO EXPIRE IN 2008
DATA AS OF FEBRUARY 2008 _______________________________________________________________________________________________ RE- EX- TOTAL PERCENT DECLINED STATE ELIGIBLE ENROLLED TENDED REX REX REX U.S. 5,893,381 934,629 3,859,389 4,794,018 81 1,099,364 ALABAMA 58,839 4,052 39,732 43,784 74 15,055 ARKANSAS 7,716 130 4,891 5,022 65 2,694 CALIFORNIA 15,777 0 10,735 10,735 68 5,041 COLORADO 393,400 45,974 319,984 365,957 93 27,443 CONNECTICUT 34 24 10 34 100 0 DELAWARE 272 20 115 135 50 137 FLORIDA 5,184 813 1,580 2,393 46 2,790 GEORGIA 16,313 600 10,217 10,817 66 5,496 IDAHO 69,046 11,574 43,974 55,548 80 13,498 ILLINOIS 119,639 31,606 55,748 87,354 73 32,285 INDIANA 40,992 6,416 19,019 25,436 62 15,556 IOWA 329,418 123,254 96,418 219,671 67 109,746 KANSAS 386,640 16,821 322,481 339,302 88 47,338 KENTUCKY 44,661 8,728 21,234 29,962 67 14,699 LOUISIANA 9,833 301 7,099 7,400 75 2,433 MAINE 5,146 112 3,687 3,799 74 1,347 MARYLAND 1,875 488 274 761 41 1,113 MASSACHUSETTS 1 0 0 0 0 1 MICHIGAN 45,636 9,510 15,436 24,946 55 20,689 MINNESOTA 390,160 174,574 124,386 298,960 77 91,200 MISSISSIPPI 70,189 8,421 45,817 54,239 77 15,950 MISSOURI 181,611 14,533 121,217 135,750 75 45,861 MONTANA 757,306 114,115 581,722 695,837 92 61,468 NEBRASKA 177,055 16,176 115,933 132,109 75 44,946 NEVADA 151 0 146 146 97 5 NEW JERSEY 572 86 421 507 89 65 NEW MEXICO 36,882 8,043 26,310 34,354 93 2,528 NEW YORK 10,648 2,776 1,675 4,450 42 6,198 NORTH CAROLINA 10,980 581 5,545 6,127 56 4,854 NORTH DAKOTA 473,519 23,818 318,642 342,460 72 131,059 OHIO 30,700 8,172 12,120 20,292 66 10,408 OKLAHOMA 173,588 15,248 132,669 147,917 85 25,671 OREGON 63,189 4,480 54,755 59,235 94 3,954 PENNSYLVANIA 12,424 2,079 863 2,943 24 9,481 PUERTO RICO 322 0 0 0 0 322 SOUTH CAROLINA 19,355 724 13,540 14,265 74 5,090 SOUTH DAKOTA 148,335 6,528 68,973 75,501 51 72,834 TENNESSEE 27,165 2,201 13,595 15,796 58 11,369 TEXAS 1,007,831 107,838 792,611 900,449 89 107,382 UTAH 41,202 0 30,841 30,841 75 10,361 VIRGINIA 6,356 1,403 2,578 3,981 63 2,375 WASHINGTON 534,092 141,001 343,136 484,138 91 49,955 WEST VIRGINIA 37 0 0 0 0 37 WISCONSIN 121,821 19,576 37,115 56,691 47 65,130 WYOMING 47,469 1,830 42,142 43,972 93 3,497 * REX stands for 2006's re-enrollment and extension offer for general signup contracts set to expire 2007-2010. Contracts re-enrolled are under new 10-15 year contracts. Extensions are for 2-5 years.
-38-

2006 REX RESULTS * CONTRACTS ORIGINALLY SET TO EXPIRE IN 2009
DATA AS OF FEBRUARY 2008 _______________________________________________________________________________________________ RE- EX- TOTAL PERCENT DECLINED STATE ELIGIBLE ENROLLED TENDED REX REX REX U.S. 4,140,502 633,620 2,600,998 3,234,619 78 905,883 ALABAMA 29,441 2,071 20,412 22,482 76 6,959 ALASKA 4,999 2,158 476 2,634 53 2,365 ARKANSAS 7,259 57 4,979 5,037 69 2,222 CALIFORNIA 9,276 1,484 6,942 8,426 91 850 COLORADO 302,961 27,082 261,897 288,979 95 13,983 CONNECTICUT 34 3 30 34 100 0 DELAWARE 558 3 0 3 1 555 FLORIDA 6,071 387 2,793 3,180 52 2,892 GEORGIA 13,020 601 7,226 7,828 60 5,192 IDAHO 85,405 12,413 55,180 67,593 79 17,812 ILLINOIS 93,668 23,097 40,533 63,631 68 30,037 INDIANA 25,347 4,278 11,298 15,576 61 9,770 IOWA 223,422 88,063 50,263 138,325 62 85,096 KANSAS 352,040 9,269 295,578 304,847 87 47,192 KENTUCKY 25,947 5,308 10,271 15,579 60 10,368 LOUISIANA 11,712 249 7,166 7,415 63 4,297 MAINE 1,785 0 1,085 1,085 61 700 MARYLAND 2,702 777 487 1,264 47 1,438 MICHIGAN 21,600 4,260 6,619 10,879 50 10,722 MINNESOTA 260,886 110,532 93,166 203,698 78 57,188 MISSISSIPPI 67,542 13,189 38,613 51,802 77 15,740 MISSOURI 125,284 13,308 74,435 87,744 70 37,540 MONTANA 510,299 123,364 335,509 458,873 90 51,425 NEBRASKA 153,572 16,753 105,073 121,827 79 31,746 NEW JERSEY 101 52 22 74 73 27 NEW MEXICO 11,563 405 8,453 8,858 77 2,705 NEW YORK 4,135 784 1,024 1,808 44 2,327 NORTH CAROLINA 8,160 489 4,113 4,602 56 3,558 NORTH DAKOTA 504,279 13,360 339,565 352,925 70 151,353 OHIO 25,600 5,676 9,848 15,524 61 10,076 OKLAHOMA 134,605 8,747 106,460 115,207 86 19,398 OREGON 38,574 4,280 31,832 36,113 94 2,462 PENNSYLVANIA 6,122 198 783 980 16 5,142 SOUTH CAROLINA 11,270 592 7,225 7,817 69 3,452 SOUTH DAKOTA 224,941 9,652 101,188 110,840 49 114,101 TENNESSEE 21,897 1,612 11,910 13,521 62 8,375 TEXAS 527,490 85,774 377,498 463,273 88 64,217 UTAH 6,111 0 3,958 3,958 65 2,153 VIRGINIA 4,653 719 1,954 2,672 57 1,981 WASHINGTON 187,366 35,654 122,561 158,215 84 29,151 WEST VIRGINIA 283 0 171 171 60 113 WISCONSIN 58,749 5,083 19,009 24,092 41 34,657 WYOMING 29,772 1,836 23,392 25,227 85 4,544 * REX stands for 2006's re-enrollment and extension offer for general signup contracts set to expire 2007-2010. Contracts re-enrolled are under new 10-15 year contracts. Extensions are for 2-5 years.
-39-

2006 REX RESULTS * CONTRACTS ORIGINALLY SET TO EXPIRE IN 2010
DATA AS OF FEBRUARY 2008 _______________________________________________________________________________________________ RE- EX- TOTAL PERCENT DECLINED STATE ELIGIBLE ENROLLED TENDED REX REX REX U.S. 2,054,699 292,216 1,195,567 1,487,783 72 566,916 ALABAMA 35,506 2,781 21,298 24,078 68 11,427 ALASKA 200 0 0 0 0 200 ARKANSAS 26,433 1,234 12,970 14,204 54 12,229 CALIFORNIA 6,712 0 2,819 2,819 42 3,893 COLORADO 113,463 12,592 91,062 103,654 91 9,809 DELAWARE 296 81 0 81 27 215 FLORIDA 9,133 916 3,281 4,197 46 4,935 GEORGIA 26,598 2,744 14,376 17,120 64 9,478 IDAHO 31,162 5,060 18,767 23,827 76 7,335 ILLINOIS 76,590 20,288 27,866 48,154 63 28,436 INDIANA 15,417 2,072 6,577 8,649 56 6,768 IOWA 161,260 57,822 36,767 94,589 59 66,671 KANSAS 118,728 2,483 97,899 100,382 85 18,345 KENTUCKY 33,165 5,533 13,924 19,457 59 13,708 LOUISIANA 15,702 2,398 7,276 9,674 62 6,028 MAINE 506 0 365 365 72 141 MARYLAND 1,370 211 203 414 30 956 MASSACHUSETTS 30 0 0 0 0 30 MICHIGAN 19,526 3,681 5,782 9,463 48 10,063 MINNESOTA 75,587 10,583 33,755 44,338 59 31,249 MISSISSIPPI 56,179 10,182 32,790 42,972 76 13,207 MISSOURI 127,697 22,271 61,933 84,204 66 43,493 MONTANA 206,021 26,898 155,644 182,541 89 23,480 NEBRASKA 79,982 8,478 45,748 54,226 68 25,755 NEW JERSEY 198 0 111 111 56 87 NEW MEXICO 526 130 115 244 46 281 NEW YORK 3,025 589 762 1,351 45 1,674 NORTH CAROLINA 6,468 575 3,609 4,184 65 2,284 NORTH DAKOTA 141,940 3,540 94,834 98,374 69 43,565 OHIO 22,516 5,582 7,770 13,351 59 9,165 OKLAHOMA 36,668 989 26,987 27,976 76 8,692 OREGON 34,441 3,083 29,217 32,300 94 2,141 PENNSYLVANIA 1,707 143 223 365 21 1,342 PUERTO RICO 20 0 0 0 0 20 SOUTH CAROLINA 21,122 2,970 10,084 13,055 62 8,067 SOUTH DAKOTA 85,532 3,921 36,355 40,276 47 45,256 TENNESSEE 25,178 2,567 10,414 12,981 52 12,197 TEXAS 190,222 29,794 135,610 165,403 87 24,818 UTAH 8,540 0 7,062 7,062 83 1,478 VIRGINIA 1,700 411 718 1,129 66 572 WASHINGTON 181,045 32,810 124,744 157,553 87 23,491 WISCONSIN 56,211 6,806 15,755 22,561 40 33,649 WYOMING 376 0 95 95 25 281 * REX stands for 2006's re-enrollment and extension offer for general signup contracts set to expire 2007-2010. Contracts re-enrolled are under new 10-15 year contracts. Extensions are for 2-5 years.
-40-

Conservation Reserve Program Sign-up Periods and Eligibility Criteria SIGN-UP Type DATES CRITERIA 1/
1 General March 3-14, 1986 A-B
2 General May 5-16, 1986 A-B
3 General August 4-15, 1986 A-C
4 General February 9-27, 1987 A-D
5 General July 20-31, 1987 A-D
6 General February 1-19, 1988 A-F
7 General July 18-31, 1988 A-F
8 General February 6-24, 1989 A-H
9 General July 17-August 4, 1989 A-H
10 General March 4-15, 1991 A-C, E, G, I-K
11 General July 8-19, 1991 A-C, E, G, I-K
12 General June 15-26, 1992 A-C, E, G, I-K
13 General September 11-22, 1995 E, G, I-K
14 Continuous September 3, 1996 - September 30, 1997 L
15 General March 3-28, 1997 G, K, M-O
16 General October 14 - November 14, 1997 G, K, M-O
17 Continuous October 1, 1997 - September 30, 1998 L, P
18 General October 26, - December 11, 1998 G, K, M-O, Q
19 Continuous October 1, 1998 - September 30, 1999 L, P
20 General January 18 - February 11, 2000 G, K, M-O, Q
21 Continuous October 1, 1999 - April 6, 2000 L, P
22 Continuous April 7 - September 30, 2000 L, P
23 Continuous October 1, 2000 - September 30, 2001 L, P
24 Continuous October 1, 2001 - September 30, 2002 L, P, R
25 Continuous October 1, 2002 - May 5, 2003 L, P, R
26 General May 5, 2003 - June 13, 2003 K, N, Q, W
27 Continuous May 6, 2003 - September 30, 2003 L, P, R
28 Continuous October 1, 2003 - September 30, 2004 L, P, R, S
29 General August 30, 2004 - September 24, 2004 K, N, Q, W
30 Continuous October 1, 2004 - September 30, 2005 L, P, R, S, T, U
31 Continuous October 1, 2005- September 30, 2006 L, P, R, S, T, U
32 REX 2/ April 2006, June 2006 Expiring Contracts
33 General March 22, 2006 - April 28, 2006 K, N, Q, W
35 Continuous October 1, 2006- September 30, 2007 L, P, R, S, T, U
36 Continuous October 1, 2007- September 30, 2008 L, P, R, S, T, U
37 Continuous October 1, 2008 - September 30, 2009 L, P, R, S, T, U, V
38 Continuous October 1, 2009 - September 30, 2010 L, P, R, S, T, U, V
39 General August 2, 2010 - August 27, 2010 K, N, Q, W
1/ See attached eligibility criteria description. 2/ Re-enrollments under new contracts only.
-41-
Eligibility Criteria: A Land capability classes 6 - 8 B Land capability classes 2 - 5 with predicted average annual erosion rate greater than 3T C Land capability classes 2 - 5 with predicted average annual erosion rate greater than 2T and with gully erosion D Land with EI > 8 and predicted average annual erosion rate greater than T E Land for filter strips alongside wetlands, streams, or other water bodies F Land for tree planting-eligible when 1/3 of field meets criteria A or Class 2-5 soil with predicted average annual
erosion rate greater than 2T G Land having evidence of scour erosion caused by out-of-bank water flows H Wetland as follows: � cropped wetland of at least 6 acres � a field of which 1/3 or more is cropped wetland � a field of 6 to 9 acres on which wetlands are present I Land in designated national conservation priority areas � Chesapeake Bay Region � Great Lakes Region � Long Island Sound Region Land in designated State water quality priority areas
� Public wellhead protection area established by EPA � Hydrologic Unit Areas approved by the Secretary
� Land located in areas designated as Clean Water Act “319" priority areas J Lands to be established in specified eligible practices, including filter strips, riparian buffers, windbreaks, grass waterways, and salt tolerant grasses
Wetland eligibity suspended K Land with an EI > 8, regardless of the predicted annual erosion rate relative to T L Eligible for continuous sign-up beginning with sign-up 14: � Land identified as suitable for field windbreaks, grass waterways, shallow water areas for wildlife, contour
grass strips, shelterbelts, living snow fences, salt tolerant vegetation, filter strips, or riparian buffers � Marginal pasture land suitable for riparian buffers devoted to trees. � Land within a wellhead protection area established by EPA M Land classified as highly erodible land (HEL) according to conservation compliance provisions. N Land in designated national conservation priority areas: � Chesapeake Bay Region � Great Lakes Region � Long Island Sound Region � Prairie Pothole Region Land in designated State water, air, or wildlife quality priority areas O Wetlands, including associated acreage, expiring Water Bank lands, and land serving as buffers for non-cropped
wetlands P Land suitable for cross wind trap strips Q Land in the Longleaf Pine national conservation priority area R Wetland and buffer acreage according to Farmable Wetland Program provisions S Restoration of flood plain wetland, including bottomland hardwood tree plantings T Establishment of upland bird habitat buffers U Restoration of non-flood plain wetland and playa lakes V Constructed wetlands, aquaculture ponds, and flooded prairie wetlands W Land under CRP contracts that expire during the year of the signup.
-42-

CRP Practices and Payment Provisions 1/
Practice
Sign-up Type 2/
Annual Rental Pmt. 3/
Signing Incentive Pmt. 4/
Practice IncentivePmt. 4/
CP1 Introduced grasses and legumes - new seedings General SRR No No
CP2 Native grasses - new seedings General SRR No No
CP3 New softwood trees (not longleaf pine) General SRR No No
CP3A New hardwood trees General SRR No No
CP3A New longleaf pines (see also CP36) General SRR No No
CP4 Permanent wildlife habitat General SRR No No
CP5 Field windbreaks Continuous SRR+20% Yes Yes
CP6 Diversions General SRR No No
CP7 Erosion control structures General SRR No No
CP8 Grass waterways Continuous SRR+20% Yes Yes
CP9 Shallow water areas for wildlife Continuous SRR No Yes
CP10 Existing grasses and legumes General SRR No No
CP11 Existing trees General SRR No No
CP12 Wildlife food plots General SRR No No
CP15 Contour grass strips Continuous SRR No Yes
CP16 Shelterbelts Continuous SRR Yes Yes
CP17 Living snow fences Continuous SRR Yes Yes
CP18 Salinity reducing vegetation Continuous SRR No Yes
CP21 Filter strips (grass) Continuous SRR+20% Yes Yes
CP22 Riparian buffers (trees) Continuous SRR+20% 6/ Yes Yes
CP23 Wetland restoration General SRR No No
CP23 Wetland restoration - flood plain Continuous SRR+20% 7/ Yes 7/ Yes 7/
CP23A Wetland Restoration - Non-flood plain and playas Continuous SRR+20% 7/ Yrs 7/ Yes 7/
CP24 Cross wind trap strips Continuous SRR No Yes
CP25 Rare and declining habitats General SRR No No
CP27 Farmable wetland (wetland) Continuous SRR+20% Yes Yes
CP28 Farmable wetland (upland) Continuous SRR+20% Yes Yes
CP29 Wildlife habitat buffer on marginal pasture Continuous SRR+20% 6/ Yes Yes
CP30 Wetland buffer on marginal pasture Continuous SRR+20% 6/ Yes Yes
CP31 Bottomland hardwood trees Continuous SRR+20% 7/ Yes 7/ Yes 7/
CP32 Hardwood trees ( previously expired contracts) General SRR No No
CP33 Upland bird habitat (quail) buffers Continuous SRR Yes Yes
CP36 Longleaf pine Continuous SRR Yes Yes
CP37 Duck Habitat (Paririe Pothole area) Continuous SRR+20% 7/ Yes 7/ Yes 7/
CP38 State acres for wildlife enhancement Continuous SRR Yes Yes
CP39 Constructed Wetlands Continuous SRR+10% Yes Yes
CP40 Aquaculture Wetlands Continuous SRR+10% Yes Yes
CP41 Flooded Prairie Wetlands Continuous SRR+10% Yes Yes
-- Wellhead protection areas Continuous SRR+10% Yes Yes
-43-

1/ Practices enrolled under CREP may be eligible for additional incentives. 2/ General sign-up practices may be enrolled under certain CREP agreements and may be eligible for additional financial incentives. 3/ Soil rental rates (SRR) are soil-specific maximum rental payment rates for predominant soils (up to 3) for the land offered. Beginning with general sign-up 16, producers offering land for general sign-up enrollment requesting rental payments below the maximum receive higher EBI scores. Participants in continuous sign-up receive the maximum allowable rate. Annual incentives of 20% and 10% of annual rental rate are provided as indicated. Practices enrolled under CREP may be eligible for additional incentives. 4/ Signing incentive payments (SIP) implemented in June 2000 are one-time up-front bonus payments of $100 per acre. 5/ Practice incentive payments (PIP) implemented in June 2000 equal 40-percent of practice installation cost. 6/ For marginal pasture, a county-specific flat rate is used instead of the SRR. 7/ Incentives approved March 2008.
-44-
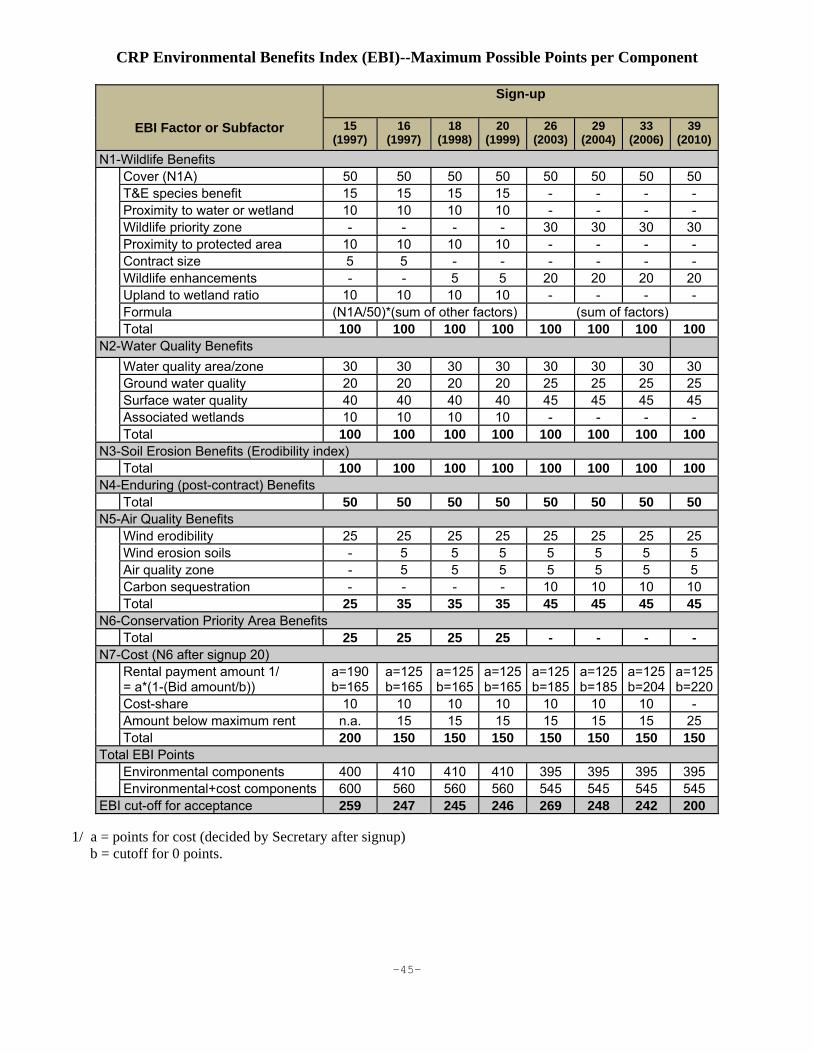
CRP Environmental Benefits Index (EBI)--Maximum Possible Points per Component
EBI Factor or Subfactor
Sign-up
15 (1997)
16 (1997)
18 (1998)
20 (1999)
26 (2003)
29 (2004)
33 (2006)
39 (2010)
N1-Wildlife Benefits Cover (N1A) 50 50 50 50 50 50 50 50
T&E species benefit 15 15 15 15 - - - - Proximity to water or wetland 10 10 10 10 - - - - Wildlife priority zone - - - - 30 30 30 30 Proximity to protected area 10 10 10 10 - - - - Contract size 5 5 - - - - - - Wildlife enhancements - - 5 5 20 20 20 20 Upland to wetland ratio 10 10 10 10 - - - - Formula (N1A/50)*(sum of other factors) (sum of factors) Total 100 100 100 100 100 100 100 100
N2-Water Quality Benefits
Water quality area/zone 30 30 30 30 30 30 30 30 Ground water quality 20 20 20 20 25 25 25 25 Surface water quality 40 40 40 40 45 45 45 45 Associated wetlands 10 10 10 10 - - - - Total 100 100 100 100 100 100 100 100
N3-Soil Erosion Benefits (Erodibility index) Total 100 100 100 100 100 100 100 100N4-Enduring (post-contract) Benefits Total 50 50 50 50 50 50 50 50N5-Air Quality Benefits Wind erodibility 25 25 25 25 25 25 25 25
Wind erosion soils - 5 5 5 5 5 5 5 Air quality zone - 5 5 5 5 5 5 5 Carbon sequestration - - - - 10 10 10 10 Total 25 35 35 35 45 45 45 45
N6-Conservation Priority Area Benefits Total 25 25 25 25 - - - - N7-Cost (N6 after signup 20) Rental payment amount 1/
= a*(1-(Bid amount/b)) a=190 b=165
a=125 b=165
a=125b=165
a=125b=165
a=125b=185
a=125 b=185
a=125b=204
a=125b=220
Cost-share 10 10 10 10 10 10 10 - Amount below maximum rent n.a. 15 15 15 15 15 15 25 Total 200 150 150 150 150 150 150 150
Total EBI Points Environmental components 400 410 410 410 395 395 395 395
Environmental+cost components 600 560 560 560 545 545 545 545 EBI cut-off for acceptance 259 247 245 246 269 248 242 200
1/ a = points for cost (decided by Secretary after signup) b = cutoff for 0 points.
-45-

For questions about this summary, contact Alex Barbarika at 202-720-7093 or at [email protected]. This and prior annual and monthly summaries are posted at http://www.fsa.usda.gov/FSA/webapp?area=home&subject=copr&topic=css Additional information on the Conservation Reserve Program environmental benefits is posted at: http://www.fsa.usda.gov/FSA/webapp?area=home&subject=ecpa&topic=nra Farm Service Agency’s conservation programs website: http://www.fsa.usda.gov/FSA/webapp?area=home&subject=copr&topic=landing
The U.S. Department of Agriculture (USDA) prohibits discrimination in all its programs and activities on the basis of race, color, national origin, age, disability, and where applicable, sex, marital status, familial status, parental status, religion, sexual orientation, genetic information, political beliefs, reprisal, or because all or part of an individual’s income is derived from any public assistance program. (Not all prohibited bases apply to all programs.) Persons with disabilities who require alternative means for communication of program information (Braille, large print, audiotape, etc.) should contact USDA’s TARGET Center at (202) 720-2600 (voice and TDD). To file a complaint of discrimination, write USDA, Director, Office of Civil Rights, 1400 Independence Ave., SW, Washington, D.C. 20250-9410 or call (800) 795-3272 (voice) or (202)-720-6382 (TDD). USDA is an equal opportunity provider and employer.