conservation of matter assessment manual - george washington
TRANSCRIPT
Conservation of Matter Assessment Manual
Curtis Pyke
Rob Ochsendorf

Conservation of Matter Assessment Manual 2
NOTICE This material is based upon work supported by the National Science Foundation, the U.S. Department of Education, and the National Institute of Health (REC-0228447). Any opinions, findings, conclusions, or recommendations are those of the authors and do not necessarily reflect the position, policy or endorsement of the funding agencies.
2004 SCALE-uP The Conservation of Matter Assessment, Assessment Map, and Rating Guide materials may be copied by the teacher in quantities sufficient for the students in his or her classroom. Also, for the purposes of classroom use only, the teacher may make an overhead transparency of any specific pages in the manual. Otherwise, no other part of this book may be reproduced for public or private use without permission in writing from SCALE-uP.
SCALE-uP 2004

Conservation of Matter Assessment Manual 3
Conservation of Matter
Assessment Manual
WRITERS
Curtis Pyke Rob Ochsendorf
SCALE-uP RESEARCH STAFF
Principal Investigators
Sharon Lynch Professor of Secondary Education
George Washington University
Curtis Pyke Professor of Secondary Education
George Washington University
Joel Kuipers Professor of Anthropology
George Washington University
Michael Szesze Program Supervisor, Science, PreK-12 Montgomery County Public Schools
Project Directors
Carol O’Donnell
Senior Research Associate, SCALE-uP George Washington University
Bonnie Hansen-Grafton
Project Director Montgomery County Public Schools
SCALE-uP 2004
Conservation of Matter Assessment Manual 4
SCALE-uP 2004
Conservation of Matter Assessment Manual 5
Conservation of Matter Assessment Manual
Introduction 7 Chapter 1. Assessment of Standards in Science Education 9 Chapter 2. Conservation of Matter: Ideas, Contexts and Expectations 13 Chapter 3. Conservation of Matter Assessment Items and Sample Responses 19
Chapter 4. Rating COMA Constructed Response Items 37
Chapter 5. Validity of the Items and the Assessment 41
Chapter 6. Distribution of Responses from Different Samples 45
Chapter 7. Making Use of the Diagnostic Qualities of COMA 51
References 53 Appendix A. The Conservation of Matter Assessment Map 55 Appendix B. The Complete Conservation of Matter Assessment 57
Appendix C. Rating Guides and Rater Recording Form 65
SCALE-uP 2004

Conservation of Matter Assessment Manual 6
SCALE-uP 2004

Conservation of Matter Assessment Manual 7
Introduction
In the current climate of standards-based accountability, researchers, teachers, administrators, and policy makers increasingly need assessments that produce standards-relevant data to make curricular decisions for diverse populations. We believe the Conservation of Matter Assessment (COMA) presented in this manual is just such an assessment. In creating COMA for a diverse population we focused on (a) the alignment of the items of COMA with the middle grades conservation of matter benchmark found in the American Association for the Advancement of Science Project 2061’s Benchmarks for Science Literacy (AAAS, 1993) and (b) the ability of items to elicit student responses that permit valid inferences about conservation of matter understanding. To this end, a rigorous assessment item evaluation and design process was developed and employed in collaboration with Project 2061. COMA has since been used by SCALE-uP (Lynch, Pyke, Kuipers, Szesze, 2004), providing empirical data showing its efficacy when used in a diverse population of 8th grade students. It was our intent to develop an assessment that had the desirable characteristics of both a criterion-referenced test and a norm-referenced test. We believe we have achieved this end, producing an assessment useful at the classroom level by teachers and at the aggregate level for administrators and researchers.
This manual is for classroom teachers and researchers who want to use COMA to diagnose students’ ideas about conservation of matter and explore differences in understandings across various groups. The manual provides the background knowledge needed to administer, score, and interpret COMA. The first few sections discuss the nature of science assessment today, describe the assessment criteria used, and present the development process. A discussion of the conservation of matter ideas and standards follow. Next, the items of the assessment are described and sample student responses discussed. Then, a brief discussion of validity from the measurement perspective is provided with empirical data concerning the measurement qualities of the individual items and COMA as a whole1. Lastly, the assessment and rating materials are provided.
1 All of the data presented in this manual was collected during the 2002-03 academic year from 8th grade students (n=2660) in 10 schools as part of the SCALE-uP research study. Students in five of these 10 schools were taught conservation of matter using a highly-rated curriculum unit entitled Chemistry that Applies (CTA). This 6-10 week curriculum unit is student-centered, hands-on, and phenomenon-based. Students in the other five schools were taught using approved curriculum materials that ranged from traditional and textbook-based, to new NSF-funded materials, to teacher-designed materials.
SCALE-uP 2004

Conservation of Matter Assessment Manual 8
SCALE-uP 2004

Conservation of Matter Assessment Manual 9
Chapter 1 Assessment of Standards in Science Education
Critical Issues for School Assessment
A set of items, or even a single item, can never give a complete picture of a
student’s understanding, nor can a single assessment be a perfect tool for measuring personal understanding across the range of differences that exist in society. However, the feasibility of developing and implementing individualized assessments tailored to each student is unrealistic at this time. Yet the accountability reports required by current policy calls for more, and more valid, data for individuals and groups of students. Given the state of assessment practice and state budgets, a single assessment will need to be used to make decisions at multiple levels (i.e. classroom, school, district, and state). Even the best assessments today are challenged to be blind to group differences so as to provide valid data for individuals, subgroups, and entire school populations. Clearly, it is not likely that any one assessment can do everything well, but can assessments get better? We concur with the National Research Council’s (NRC) recent committee on assessment that suggest the interpretations that arise from the analysis of relevant data play a critical role in the effectiveness of assessment (Pellegrino, Chudowsky, & Glaser, 2001). Our work on COMA is consistent with this idea as well as emerging frameworks for evaluation and development of assessments (Mislevy, Steinberg, & Almond, 2003; Ruiz-Primo, 2003). COMA is a case study of showing how to improve an assessment by focusing on closer links among student ideas, the nature of observations of their performances, and standards from the science community that specify valued science knowledge.
The 2061 Assessment Analysis Criteria
The American Association for the Advancement of Science’s Project 2061 (Project 2061), with funding from the National Science Foundation (NSF), developed the assessment analysis criteria above to examine the alignment of assessment items to standards. The Project 2061 assessment analysis is grounded in the argument that the alignment of an item to a standard is not based on whether both the item and standard fall within the same general topic-heading (e.g., “light”), or whether they contain some of the same key-words (e.g., reflection, refraction). Rather, the item must provide trustworthy inferences that indicate students have achieved the ideas or skills in a specified standard (AAAS, 2003b). Project 2061’s focus on the qualities of assessment items that produce sound inferences from standards-relevant data resulted in the assessment item analysis criteria. These criteria extend traditional ideas about the qualities of accurate assessment items and meeting these criteria was the driving force behind the COMA item development.
The Project 2061 assessment analysis criteria are (AAAS, 2003a): Content Alignment - to examine if the exact ideas or skills specified in a
standard are required to make a satisfactory response (versus there being another way to obtain a response) and to determine if those ideas or skills are enough by themselves (versus there being additional ideas or skills needed)
SCALE-uP 2004
Conservation of Matter Assessment Manual 10
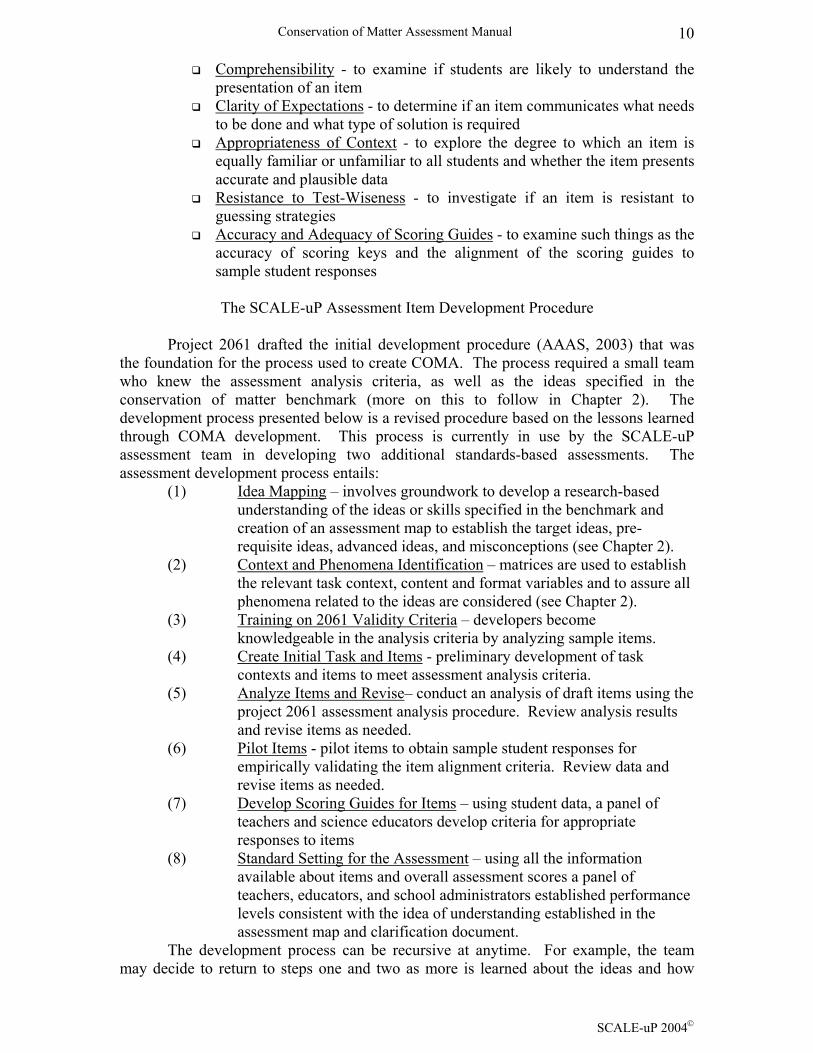
Comprehensibility - to examine if students are likely to understand the presentation of an item
Clarity of Expectations - to determine if an item communicates what needs to be done and what type of solution is required
Appropriateness of Context - to explore the degree to which an item is equally familiar or unfamiliar to all students and whether the item presents accurate and plausible data
Resistance to Test-Wiseness - to investigate if an item is resistant to guessing strategies
Accuracy and Adequacy of Scoring Guides - to examine such things as the accuracy of scoring keys and the alignment of the scoring guides to sample student responses
The SCALE-uP Assessment Item Development Procedure
Project 2061 drafted the initial development procedure (AAAS, 2003) that was
the foundation for the process used to create COMA. The process required a small team who knew the assessment analysis criteria, as well as the ideas specified in the conservation of matter benchmark (more on this to follow in Chapter 2). The development process presented below is a revised procedure based on the lessons learned through COMA development. This process is currently in use by the SCALE-uP assessment team in developing two additional standards-based assessments. The assessment development process entails:
(1) Idea Mapping – involves groundwork to develop a research-based understanding of the ideas or skills specified in the benchmark and creation of an assessment map to establish the target ideas, pre-requisite ideas, advanced ideas, and misconceptions (see Chapter 2).
(2) Context and Phenomena Identification – matrices are used to establish the relevant task context, content and format variables and to assure all phenomena related to the ideas are considered (see Chapter 2).
(3) Training on 2061 Validity Criteria – developers become knowledgeable in the analysis criteria by analyzing sample items.
(4) Create Initial Task and Items - preliminary development of task contexts and items to meet assessment analysis criteria.
(5) Analyze Items and Revise– conduct an analysis of draft items using the project 2061 assessment analysis procedure. Review analysis results and revise items as needed.
(6) Pilot Items - pilot items to obtain sample student responses for empirically validating the item alignment criteria. Review data and revise items as needed.
(7) Develop Scoring Guides for Items – using student data, a panel of teachers and science educators develop criteria for appropriate responses to items
(8) Standard Setting for the Assessment – using all the information available about items and overall assessment scores a panel of teachers, educators, and school administrators established performance levels consistent with the idea of understanding established in the assessment map and clarification document.
The development process can be recursive at anytime. For example, the team may decide to return to steps one and two as more is learned about the ideas and how
SCALE-uP 2004

Conservation of Matter Assessment Manual 11
students experience them. Or, steps five and six may be repeated as many times as needed to produce aligned items that work for the intended populations.
SCALE-uP 2004

Conservation of Matter Assessment Manual 12
SCALE-uP 2004

Conservation of Matter Assessment Manual 13
Chapter 2 Conservation of Matter: Ideas, Contexts, and Expectations
The Target Benchmark Ideas and Prior Knowledge of Matter and Atoms
Target Ideas
Many scientists consider the conservation laws (e.g. mass and energy) to be the most fundamental laws in nature. Understanding of the idea that ‘matter and/or energy can not be created or destroyed’ is critical in helping us to explain and understand the natural world, the mission of science. Conservation laws, in their simplest form, state that in a closed system, the mass of a given quantity of matter will remain unchanged over time. At the middle school level, students are expected to begin to understand conservation of matter. The Benchmarks for Science Literacy (AAAS, 1993), state that by the end of 8th grade students should know that:
No matter how substances within a closed system interact with one another, or how they combine or break apart, the total weight of the system remains the same. The idea of atoms explains the conservation of matter: If the number of atoms stays the same no matter how they are rearranged, then their total mass stays the same (p. 79).
The benchmark presented above prescribes the specific conservation of matter
ideas that middle school students must learn to be scientifically literate at that age. Specifically, grade-8 students should be aware of observations from the real world that reveal weight remains the same after physical and chemical transformations in closed systems and they should already posses an understanding of atoms that they can use to explain their observations. Given the importance of the conservation laws, considerable research has attempted to focus on how particular aspects of conservation are understood by students as they learn science. Noteworthy is the work of Piaget and Inhelder (1974) that shows how difficult and complex conservation of matter understanding is for young students. In particular, they showed for the first time that when students are challenged to explain many different conservation phenomena that most lack commitment to a complete scientifically appropriate explanation. In studies that followed it has been confirmed that many science students, of all ages, have considerable trouble understanding conservation of matter (Ozmen & Ayas, 2003; Paixao & Cachapuz, 2000; Gomez, Pozo, & Sanz, 1995; Driver, Squires, Rushworth, & Wood-Robinson, 1994; Stavy, 1991; Stavy, 1990a).
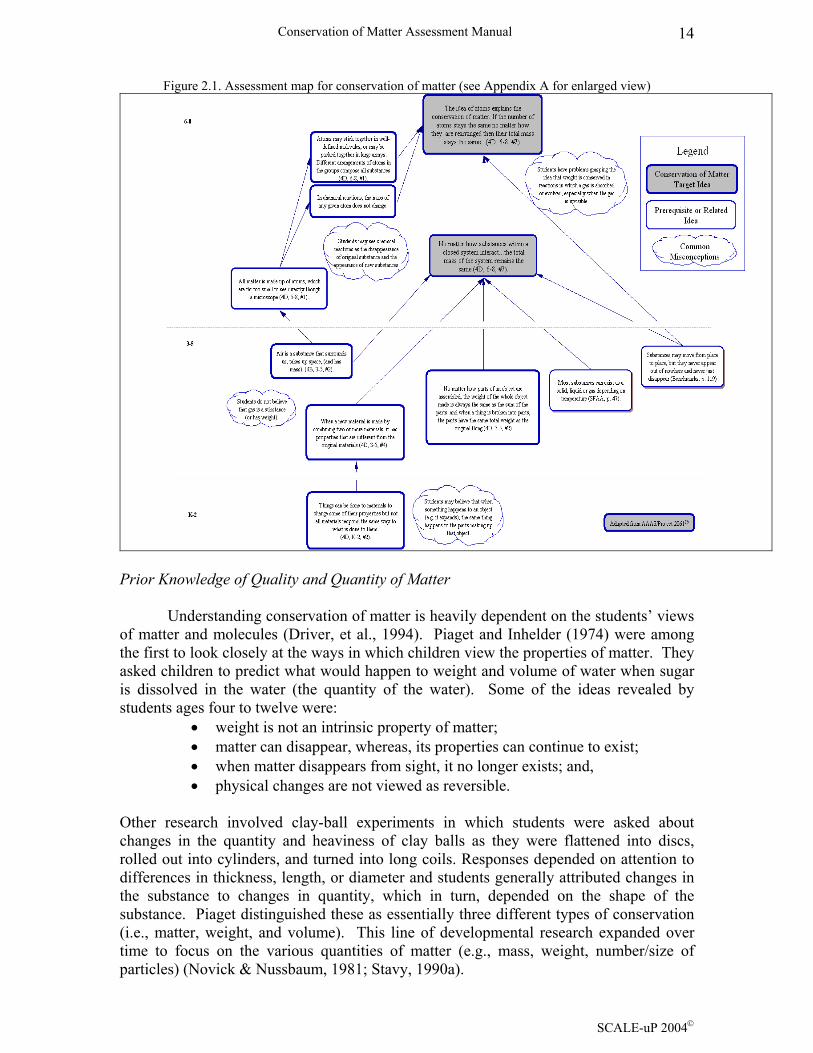
Given the complexity of the conservation idea presented in benchmarks the clarification of the benchmark required the construction of The Conservation of Matter Assessment Map (Figure 2.1). The map depicts prerequisite and related ideas that contribute to understanding this conservation of matter benchmark and commonly held misconceptions. As the map was initially being developed, undergoing numerous revisions, it became a critical tool for judging alignment of items to the target idea(s) contained in the benchmark.
SCALE-uP 2004
Conservation of Matter Assessment Manual 14
Figure 2.1. Assessment map for conservation of matter (see Appendix A for enlarged view)
Prior Knowledge of Quality and Quantity of Matter
Understanding conservation of matter is heavily dependent on the students’ views of matter and molecules (Driver, et al., 1994). Piaget and Inhelder (1974) were among the first to look closely at the ways in which children view the properties of matter. They asked children to predict what would happen to weight and volume of water when sugar is dissolved in the water (the quantity of the water). Some of the ideas revealed by students ages four to twelve were:
• weight is not an intrinsic property of matter; • matter can disappear, whereas, its properties can continue to exist; • when matter disappears from sight, it no longer exists; and, • physical changes are not viewed as reversible.
Other research involved clay-ball experiments in which students were asked about changes in the quantity and heaviness of clay balls as they were flattened into discs, rolled out into cylinders, and turned into long coils. Responses depended on attention to differences in thickness, length, or diameter and students generally attributed changes in the substance to changes in quantity, which in turn, depended on the shape of the substance. Piaget distinguished these as essentially three different types of conservation (i.e., matter, weight, and volume). This line of developmental research expanded over time to focus on the various quantities of matter (e.g., mass, weight, number/size of particles) (Novick & Nussbaum, 1981; Stavy, 1990a).
SCALE-uP 2004
Conservation of Matter Assessment Manual 15
More recent work has attempted to focus on the conservation of quality or substance after a change has occurred. An important finding is that students’ ideas about the physical properties of the material influence how they interpret and explain observed change. If for example, students regard gases as being weightless, then they are unlikely to understand conservation of matter when changes involve gases, such as in the evaporation of water. In these cases, students may believe that ‘matter’ can only exist as a concrete, solid object and not as a gas. Students may also think that matter only exists when there is perceptual evidence of its existence (Stavy, 1990b). For example, a colorful gas (e.g., iodine) is perceived as matter whereas a colorless gas (acetone), even though it can be smelled, is not as likely to be perceived as a substance. Similarly, when substances are dissolved, students may believe that they are no longer present because they cannot be seen in the liquid. When this is the case, students will not factor in these ‘hidden’ substances in their determination of conservation. To understand that substances are still there will require the student to draw on some knowledge that is outside the event itself (Driver, Guesne, & Tiberghien, 1985). Prior Knowledge of the Particulate Nature of Matter
Students’ views on the kinetic molecular theory also influence their understandings of conservation of matter. An understanding of the theory, which states that all matter is composed of tiny particles,—a pre-requisite idea according to Benchmarks (AAAS, 1993),—and that these tiny particles are constantly in motion, does seem to be required for students to conserve mass across various contexts. For example, understanding that salt and the water are both comprised of tiny particles facilitates the conservation of quantities of both substances. However, there is evidence that kinetic molecular theory introduces a new set of naïve conceptions that may impede progress of learning conservation (Lee, Eichinger, Anderson, Berkheimer, & Blakeslee, 1993; Stavy, 1990a). For example, when salt particles are dissolved in water, some students “see” the salt particles as so small that their weight is negligible or so spread out they are not as heavy, less dense (Driver, et al., 1994). Other students may believe that the atoms themselves have expanded during the change and therefore are heavier. In these instances students are beginning to assimilate the particulate ideas with the views of the properties of matter that they already have, with observations of the world presented to them (Driver, et al., 1985). Students’ knowledge is essentially competing to explain the various phenomenon (Stavy, 1990b). A full understanding of conservation is not possible however without understanding the particulate nature of matter and as students progress, understanding of the kinetic molecular theory will prove useful in mastering conservation and more advanced ideas.
Deep understanding of conservation of matter requires students to move from perceptionally dominated reasoning (i.e., things appear and disappear) to conceptually dominated thinking (matter is particulate, does not disappear, and can change its configuration). Although students may have been presented such views of matter, many are unable to incorporate these ideas into their own thinking or see them as useful and appropriate in the interpretation of actual events. Some of the perceptionally dominated examples of student reasoning are:
• When something happens to an object (expanding), the same thing happens to the parts that make up the object (atoms expanding).
• Weight is not conserved in a reaction in which gas is absorbed or evolved (especially invisible gases).
SCALE-uP 2004
Conservation of Matter Assessment Manual 16
• Gas is not a substance and does not have weight. • Chemical changes involve the disappearance and appearance of
substances. • Volume is directly related to mass (more volume an object has, the greater
its mass). In addition to those examples of student reasoning, it is clear that students' ideas about conservation of matter are influenced by how they perceive chemical reactions. Research has shown that there are six common student ideas about chemical reactions:
• Matter just disappears (when gas is used as a fuel, it just disappears). • Resulting materials must be contained within the starting materials (gases
evolving from reactions must have existed within the substance). • The resulting material is just a modified form of the starting material
(burning alcohol turns into alcohol vapor). • The starting material undergoes a transmutation (burned steel wool has
turned into carbon). • Starting materials interact and form a different product (oxygen reacts
with copper and forms copper oxide). • No real conception other than 'it just happens like that' (Driver, et
al., 1985).
Context Variables and Phenomena
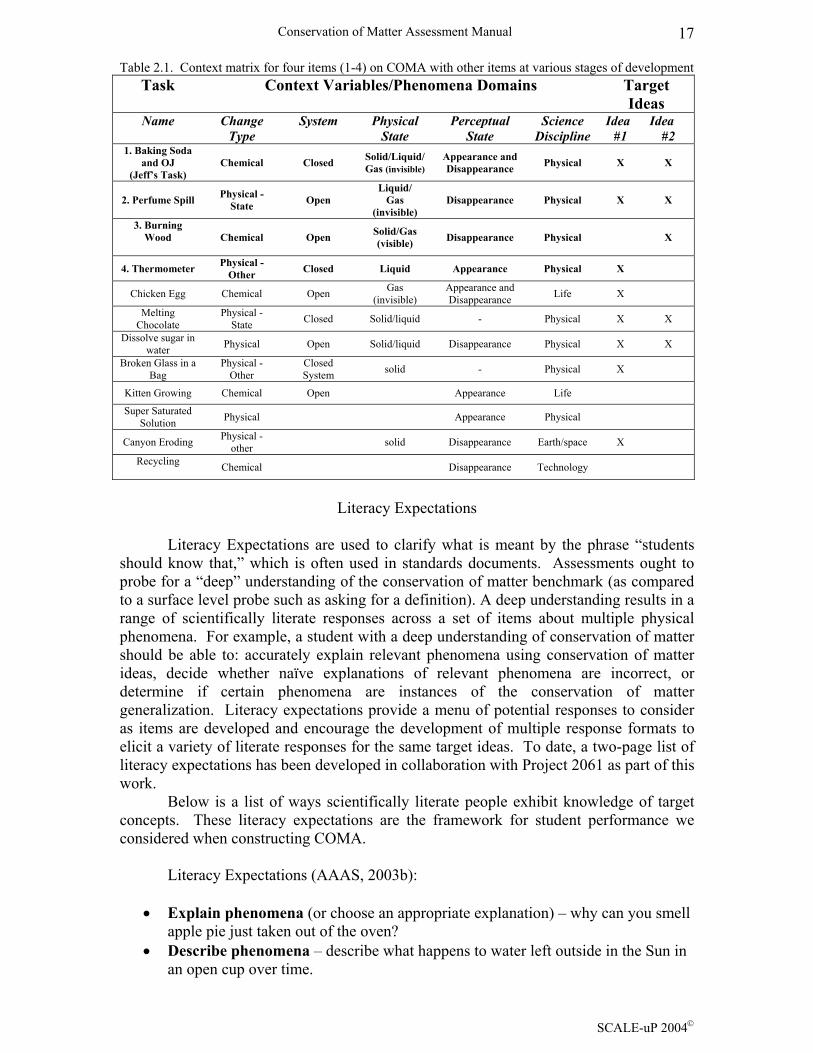
Whether or not students demonstrate understanding of conservation of quantity or quality can also depend on context variables (Gomez, Pozo, & Sanz, 1995). For example, if the context involves a chemical reaction (e.g., rusting) the student will be less likely to conserve quantity (i.e., the amount of iron and/or rust) and the student may or may not observe the change in the quality of the substance (i.e., that the rust is different from the iron). But if the context involves a physical change (e.g., water evaporating), then the student may be more likely to conserve the qualities (of the water) and perhaps, will conserve the quantity as well (i.e., the amount of water). Students’ ideas about the conservation of matter used to explain physical changes can differ from those used to explain chemical reactions. These ideas about conservation can differ both among and within students. The range of contexts or phenomena that give rise to conservation of matter reasoning became so salient and difficult to manage for the assessment development team that it was necessary to construct the Conservation of Matter Context Matrix (Table 2.1). The context matrix organizes three types of information: the task problem (or type/description) is in the first column, the context variables/phenomena domain that distinguishes different types of conservation of matter contexts are in the next five columns, and the set of target ideas identified and clarified in the assessment map are placed in the last two columns. In the end, there is a total of 195 idea-task-phenomena combinations defined by the conservation matrix. Since the team did not intend to develop 195 items to probe all the possible cases, the matrix became the organizational tool that ensured items were included that covered a range of contexts.
SCALE-uP 2004
Conservation of Matter Assessment Manual 17
Table 2.1. Context matrix for four items (1-4) on COMA with other items at various stages of development Task Context Variables/Phenomena Domains Target
Ideas Name Change
Type System Physical
State Perceptual
State Science
Discipline Idea
#1 Idea
#2 1. Baking Soda
and OJ (Jeff’s Task)
Chemical Closed Solid/Liquid/Gas (invisible)
Appearance and Disappearance Physical X X
2. Perfume Spill Physical - State Open
Liquid/ Gas
(invisible) Disappearance Physical X X
3. Burning Wood
Chemical Open Solid/Gas
(visible) Disappearance Physical X
4. Thermometer Physical - Other Closed Liquid Appearance Physical X
Chicken Egg Chemical Open Gas (invisible)
Appearance and Disappearance Life X
Melting Chocolate
Physical - State Closed Solid/liquid - Physical X X
Dissolve sugar in water Physical Open Solid/liquid Disappearance Physical X X
Broken Glass in a Bag
Physical - Other
Closed System solid - Physical X
Kitten Growing Chemical Open Appearance Life
Super Saturated Solution Physical Appearance Physical
Canyon Eroding Physical - other solid Disappearance Earth/space X
Recycling Chemical Disappearance Technology
Literacy Expectations
Literacy Expectations are used to clarify what is meant by the phrase “students
should know that,” which is often used in standards documents. Assessments ought to probe for a “deep” understanding of the conservation of matter benchmark (as compared to a surface level probe such as asking for a definition). A deep understanding results in a range of scientifically literate responses across a set of items about multiple physical phenomena. For example, a student with a deep understanding of conservation of matter should be able to: accurately explain relevant phenomena using conservation of matter ideas, decide whether naïve explanations of relevant phenomena are incorrect, or determine if certain phenomena are instances of the conservation of matter generalization. Literacy expectations provide a menu of potential responses to consider as items are developed and encourage the development of multiple response formats to elicit a variety of literate responses for the same target ideas. To date, a two-page list of literacy expectations has been developed in collaboration with Project 2061 as part of this work.
Below is a list of ways scientifically literate people exhibit knowledge of target concepts. These literacy expectations are the framework for student performance we considered when constructing COMA.
Literacy Expectations (AAAS, 2003b):
• Explain phenomena (or choose an appropriate explanation) – why can you smell apple pie just taken out of the oven?
• Describe phenomena – describe what happens to water left outside in the Sun in an open cup over time.
SCALE-uP 2004

Conservation of Matter Assessment Manual 18
• Predict phenomena – if the tilt of the Earth were to change what would happen to our seasons?
• Distinguish cases from generalizations – Are fossils of the same type found on two different continents good evidence of continental drift?
• Identify an appropriate generalization from cases – what should be concluded by measuring the apparent diameter of the sun at different times of the year?
• Explain exceptions to generalizations – if objects in motion want to stay in motion, why do they stop?
• Rephrase theoretical proposition in own words – can you tell me what a scientist means when he says an object in motion tends to stay in motion?
• Decide if explanations are correct – my friend says when you heat a metal ball the atoms in the ball get bigger, is that correct?
• Describe evidence in support of an idea – what evidence do we have to show the Earth orbits around the Sun?
• Evaluate representations, models, analogies – the book says plants are like food factories, is that true?
• Compare representations to the real things – how is my model of the solar system like the real thing?
• Create representations – if you could see gravity can you draw for me how it makes a ball move down a hill?
SCALE-uP 2004
Conservation of Matter Assessment Manual 19
Chapter 3 Conservation of Matter Assessment Items
and Sample Responses
This section provides explanations of the individual COMA items along with some of the history of their development. For each of the tasks, students are expected to read text statements describing physical changes or chemical reactions and respond to prompts for responses. COMA contains four tasks (the first four tasks in Table 2.1) that require either selecting a response or writing extended responses to multiple probes within each task. The four tasks cover a range of phenomena domains (closed vs. open systems, appearance or disappearance of substances, states of matter, and chemical vs. physical change) that will be described for each item in this chapter.
Baking Soda and Orange Juice (Jeff’s Activity) Description
This task requires that students respond to four items that refer to the chemical reaction that occurs between a solid (i.e., baking soda) and a liquid (i.e., orange juice) in a closed system (i.e., a sealed plastic bag). There are two selected response items and two constructed response items that ask for students to consider independently a) the quantity of atoms in a closed system after a chemical reaction has occurred and b) the mass of the closed system after the chemical reaction has occurred.
The task describes an individual (Jeff) placing a cup of orange juice and some baking soda in a sealed plastic bag. Jeff turns the bag upside down and allows the contents to mix, small bubbles form, and the plastic bag expands. Students are asked about the number of atoms in the system after the mixing has occurred and the relative mass of the system after the mixing has occurred. Specifically, students must select whether there are the same, more, or less atoms in the bag after the reaction as compared to before the reaction and whether the mass of the bag and its contents are the same, more, or less after the reaction. Students justify their selected responses by explaining their answers.
Jeff’s Activity is presented in Figure 3.1 and a frequency distribution of student responses to the selected and constructed response items is presented in Table 3.1.
Target Ideas
Jeff’s Activity targets both components of the conservation of matter benchmark. Responses must consider both the conservation of mass in the system and the idea that atoms explain the conservation of mass. Question a requires students to decide first if “the number of atoms in the bag after the baking soda and orange juice mixed is the same, more, or less than the number of atoms in the bag before the baking soda and orange juice mixed.” Second, they must decide if “the mass of the bag is the same, more, or less than before the baking soda and orange juice mixed.” At this point, students are explicitly instructed to consider atoms in their explanations of the mass of the system. Their ability to accurately discuss the idea of atoms when explaining the mass of the system is carefully considered in the rating of this item.
SCALE-uP 2004
Conservation of Matter Assessment Manual 20
Context Variables/Phenomena
The Baking Soda and Orange Juice Task (Jeff’s Activity) allows students to provide evidence of their understanding of conservation of matter in the physical sciences for a closed system where an invisible gas appears as a result of a chemical reaction. Inclusion of a sealed plastic bag provides the closed system and, to emphasize that fact, the task instructs students that “nothing could get in or out of the bag, not even atoms.” With this closed system, it is possible to consider the properties (quantity and quality) of the entire system both before and after a reaction has occurred.
The third phenomena domain of interest involves the quality or state of the matter in the given context. In this case, Jeff’s Activity involves a solid and liquid combining to produce an invisible gas. The law of conservation of matter applies to all types of matter and Jeff’s Activity offers a complex interaction of three states of matter (solid, liquid, and gas). Here, substances in two of the states (solid and liquid) combine to produce a substance in the third state (gas).
The fourth characteristic of the task is the appearance of a new substance from previously existing substances, in this case observed as bubbles and the expanding of the bag. Students holding correct conceptions about conservation of matter and the particulate nature of matter will be aware that the appearance of a new substance was not spontaneous but rather derived from previously existing substances.
The last phenomena domain involves the type of change that is occurring (chemical vs. physical). Because a new substance (carbon dioxide gas) is being formed in Jeff’s Activity, the reaction is considered a chemical change. The formation of new substances from existing substances during a chemical reaction provides a unique context for individuals to use their knowledge about conservation of matter. Literacy Expectations For this task, the students are expected to predict phenomena (is the number of atoms….the same, more, or less) and explain phenomena.
SCALE-uP 2004

Conservation of Matter Assessment Manual 21
Figure 3.1. Jeff’s Activity as presented to students
SCALE-uP 2004
Conservation of Matter Assessment Manual 22
Sample Student Responses
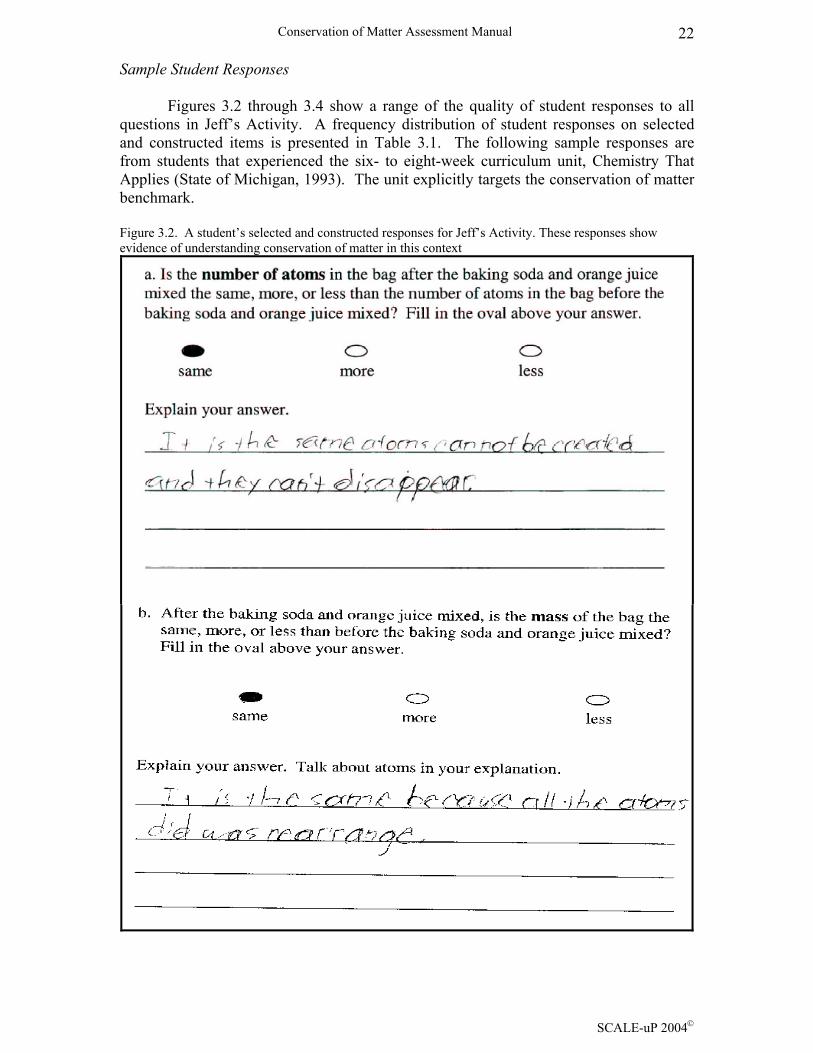
Figures 3.2 through 3.4 show a range of the quality of student responses to all questions in Jeff’s Activity. A frequency distribution of student responses on selected and constructed items is presented in Table 3.1. The following sample responses are from students that experienced the six- to eight-week curriculum unit, Chemistry That Applies (State of Michigan, 1993). The unit explicitly targets the conservation of matter benchmark. Figure 3.2. A student’s selected and constructed responses for Jeff’s Activity. These responses show evidence of understanding conservation of matter in this context
SCALE-uP 2004
Conservation of Matter Assessment Manual 23
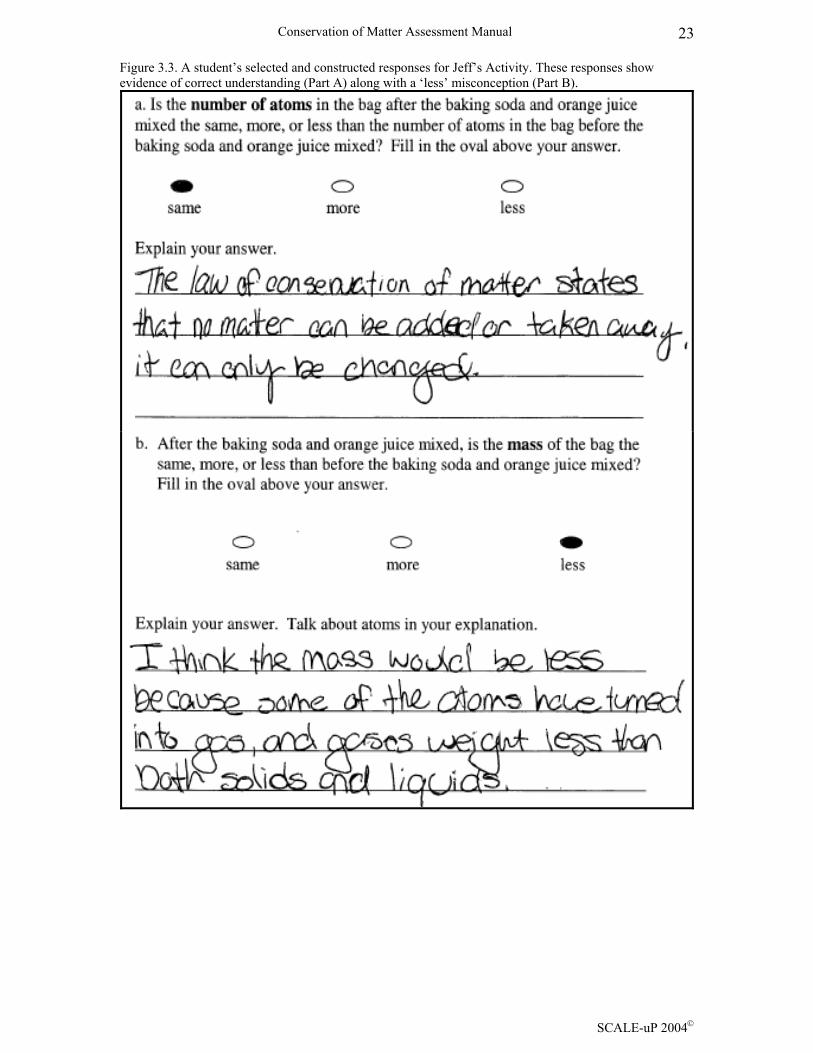
Figure 3.3. A student’s selected and constructed responses for Jeff’s Activity. These responses show evidence of correct understanding (Part A) along with a ‘less’ misconception (Part B).
SCALE-uP 2004
Conservation of Matter Assessment Manual 24
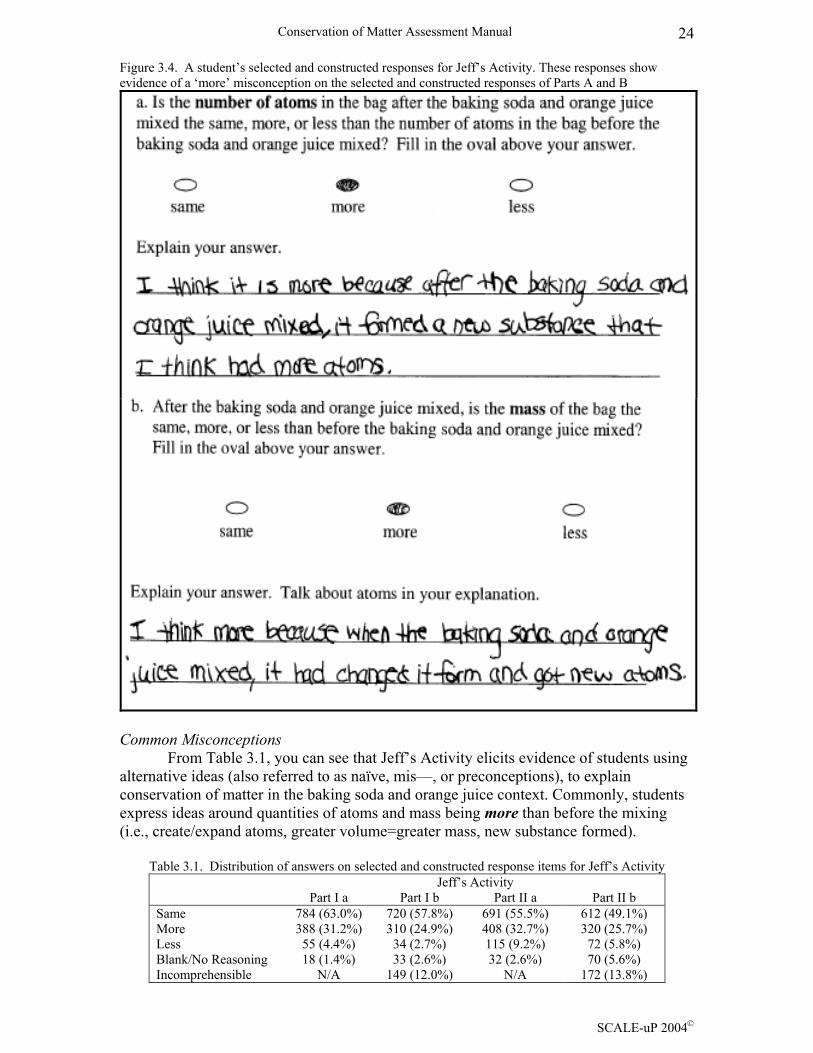
Figure 3.4. A student’s selected and constructed responses for Jeff’s Activity. These responses show evidence of a ‘more’ misconception on the selected and constructed responses of Parts A and B
Common Misconceptions From Table 3.1, you can see that Jeff’s Activity elicits evidence of students using alternative ideas (also referred to as naïve, mis—, or preconceptions), to explain conservation of matter in the baking soda and orange juice context. Commonly, students express ideas around quantities of atoms and mass being more than before the mixing (i.e., create/expand atoms, greater volume=greater mass, new substance formed).
Table 3.1. Distribution of answers on selected and constructed response items for Jeff’s Activity Jeff’s Activity
Part I a Part I b Part II a Part II b Same 784 (63.0%) 720 (57.8%) 691 (55.5%) 612 (49.1%) More 388 (31.2%) 310 (24.9%) 408 (32.7%) 320 (25.7%) Less 55 (4.4%) 34 (2.7%) 115 (9.2%) 72 (5.8%) Blank/No Reasoning 18 (1.4%) 33 (2.6%) 32 (2.6%) 70 (5.6%) Incomprehensible N/A 149 (12.0%) N/A 172 (13.8%)
SCALE-uP 2004

Conservation of Matter Assessment Manual 25
Spilled Perfume
Description
Spilled Perfume contains two selected response items and two constructed response items. The task context involves a physical change in which a liquid substance (perfume) quickly evaporates into a gas in an open system. Students consider a) the number of atoms in the system after the physical change has occurred and b) the mass of the atoms in the system after the physical change has occurred.
The task involves an individual (Lara) spilling a small amount of perfume on the floor as she is putting it on. After a few minutes, the spilled perfume cannot be seen because it turns into a gas. The first two questions ask about the number of atoms of perfume after it turns into a gas compared to the liquid perfume spilled on the floor. The selected response in Part A asks if Lara could count atoms, would the total number of atoms be the same, more, or less after the perfume spill. This is followed by a constructed response that asks students to explain their answer to the selected response item. Part B asks if Lara could collect all of the atoms would the total mass of the gaseous perfume be the same, more, or less than when the atoms were in the liquid perfume spilled on the floor.
It is worth noting that this task context formerly involved a gasoline spill rather than a perfume spill. However, it was found that some students had difficulty believing that spilled gasoline would disappear completely as a result of stains or residues left behind (i.e., at gas stations). Also, the use of the word ‘gasoline’ in conjunction with descriptions of phase changes from liquid to ‘gas’ had the potential for unnecessary confusion for some students so the substance was changed to a similarly novel context, spilling perfume.
Spilled Perfume is presented in Figure 3.5 and a frequency distribution of student responses to the selected and constructed response items is presented in Table 3.2.
Target Ideas
Spilled Perfume targets both components of the conservation of matter benchmark. Responses must consider both the number of atoms in the system and the mass of the system. Part A requires students to determine if the total count of the atoms in the gaseous perfume would be the same, more, or less than the number of atoms before Lara spilled the perfume. In Part B, they must decide if the mass of those atoms is the same, more, or less after the spill. Again, their ability to accurately discuss the idea of atoms when explaining the mass of the system is carefully considered in the rating of this item. Context Variables/Phenomena
In the previous chapter, we described student difficulties in understanding quantity and quality of conservation within chemical changes and physical changes. The first phenomena domain of the Spilled Perfume task involves the type of change that is occurring (chemical vs. physical). In the physical change context of Spilled Perfume, there is evidence from prior research that students may be more likely to conserve the quality of the perfume but the quantity of the perfume may present more challenges. The state change involved in this task provides another context for students to apply their knowledge about conservation of matter.
SCALE-uP 2004

Conservation of Matter Assessment Manual 26
Spilled Perfume also asks students to provide evidence of their understanding of
conservation of matter in an open system where a liquid substance disappears as a result of a physical change (evaporation). The open system provides another context in which students can consider their understanding of conservation of matter. With this open system, it is possible to consider the properties (quantity and quality) of the system both before and after the physical change occurred.
The third phenomena domain of interest involves the state(s) of matter in the given context. Spilled Perfume involves a liquid changing phase into a gas. More specifically, there is an apparent disappearance of a liquid when it changes into an invisible gas. As mentioned in Chapter 2, research by Stavy showed that students were less likely to consider colorless or invisible gases as substances when compared to colorful gases. In this case, when applying their knowledge of conservation of matter, it will be necessary to perceive the colorless perfume as first, a substance, and second, a substance that has mass.
Whereas Jeff’s Activity involves the appearance of a new substance, this item describes the apparent disappearance of a substance, spilled perfume. The fourth phenomena domain involved in this task describes liquid perfume changing in a few minutes from a liquid state to a gas state and therefore, disappearing. Students holding correct conceptions about conservation of matter should be able to demonstrate that the molecules (or atoms) did not disappear but rather, they changed from a liquid state into a gas state. And if it were possible to count or collect all of those atoms, their number and mass would be unchanged. Literacy Expectations
For Spilled Perfume, the students are expected to again predict phenomena (is the number of atoms….the same, more, or less…) and explain phenomena.
SCALE-uP 2004

Conservation of Matter Assessment Manual 27
Figure 3.5. Spilled Perfume as presented to students
SCALE-uP 2004

Conservation of Matter Assessment Manual 28
Sample Student Responses
Figures 3.6 through 3.8 show a range of the quality of student responses to all questions in Spilled Perfume. A frequency distribution of student responses on selected and constructed items is presented in Table 3.2. Again, the following sample responses are provided by students that experienced CTA, which targets conservation of matter for 6-8 weeks of instruction.
Figure 3.6. Sample student response demonstrating evidence of understanding conservation of matter in the context of the Spilled Perfume task
SCALE-uP 2004

Conservation of Matter Assessment Manual 29
Figure 3.7. Student response demonstrating evidence of a less misconception on all of the selected and constructed response items
SCALE-uP 2004

Conservation of Matter Assessment Manual 30
Figure 3.8. Sample response showing evidence of a more misconception on all selected and constructed response items
Common Misconceptions In Table 3.2, you can see that Spilled Perfume is likely to elicit evidence of students using alternative ideas to explain conservation of matter in this context. Whereas Jeff’s Activity was more likely to elicit evidence of quantities being more, Spilled Perfume elicits more evidence for students believing that quantities of atoms and mass will be less than before the spill (i.e., atoms disappear, are destroyed or evaporate, atoms getting lighter and weighing less, or gases weighing less or nothing).
Table 3.2. Distribution of answers on selected and constructed response items for Perfume Spill Perfume Spill
Part I a Part I b Part II a Part II b Same 739 (59.3%) 569 (45.7%) 651 (52.2%) 522 (41.9%) More 122 (9.8%) 87 (7.0%) 176 (14.1%) 101 (8.1%) Less 349 (28.0%) 240 (19.3%) 360 (28.9%) 284 (22.8%) Blank/No Reasoning 36 (2.9%) 80 (6.4%) 59 (4.7%) 121 (9.7%) Incomprehensible N/A 270 (21.7%) N/A 218 (17.5%)
SCALE-uP 2004

Conservation of Matter Assessment Manual 31
Burning Wood
Description
The Burning Wood task involves a single selected response item. The task context involves a chemical change in which a solid substance (wood) partially combusts leaving behind a pile of ash. For this task, students are asked to choose the best explanation that describes the difference in weight between the wood that was present before the burning and a pile of ash that is present after the burning. In this case, an individual, Kim, weighed the wood, then burned the wood, and finally weighed the ash. Students are asked to offer the best explanation for why the ash weighs less. The first selection explains that all of the atoms are in the ash; they did not combine with anything else but got smaller and lighter when the wood burned. The second selection explains that some of the atoms are in the ash and the rest of the atoms combined with atoms from the air and went into the air as gas when the wood burned. The third selection explains that some of the atoms from the wood are in the ash and some are burned up and are no more, there are fewer atoms after the wood burned. Target Idea Burning Wood focuses on only a portion of the larger conservation of matter target idea. Students are asked to focus specifically on the idea of atoms explaining the conservation of matter. In essence, there is an observed weight change that is described in the task description, but the students must apply their understanding of atoms (the particulate nature of matter) to explain the weight change that has occurred in this chemical reaction. In order to choose the correct explanation for why the ash weighs less than the wood, students must consider the rearrangement of atoms in the chemical reaction (burning). A conceptual understanding of the idea of atoms and their potential for rearrangement is necessary for students to select the appropriate atomic-level explanation for the difference in weight after the wood was burned. Context Variables/Phenomena
The Burning Wood task involves a chemical change between a solid and gas occurring in an open system with the partial disappearance of the solid substance and the appearance of a colorful gas (see Table 3.1).
The previous two items on COMA describe both chemical and physical changes and Burning Wood is similar to Jeff’s Activity in that it describes another chemical change. However, whereas Jeff’s activity involves a solid reacting with a liquid (orange juice), Burning Wood involves a solid reacting with a gas (oxygen). Because new substances are being formed (solid ash and carbon dioxide gas) it is considered a chemical reaction.
Unlike the previous two tasks, Burning Wood involves a solid and gas combining to produce a different solid substance (ash) and a colorful gas (smoke). Here, substances in two states of matter (solid and gas) combine to produce two new substances in the same states of matter. At this point, it is possible to begin to appreciate the range of states (solid, liquid, gas) that are involved in both chemical and physical changes within COMA. Finally, Burning Wood is another task in which change is occurring in an open system. In this way, it is similar to the Perfume Spill task.
Burning Wood, similar to the Perfume Spill, describes a context in which there is an apparent disappearance of a substance from previously existing substances. As
SCALE-uP 2004
Conservation of Matter Assessment Manual 32
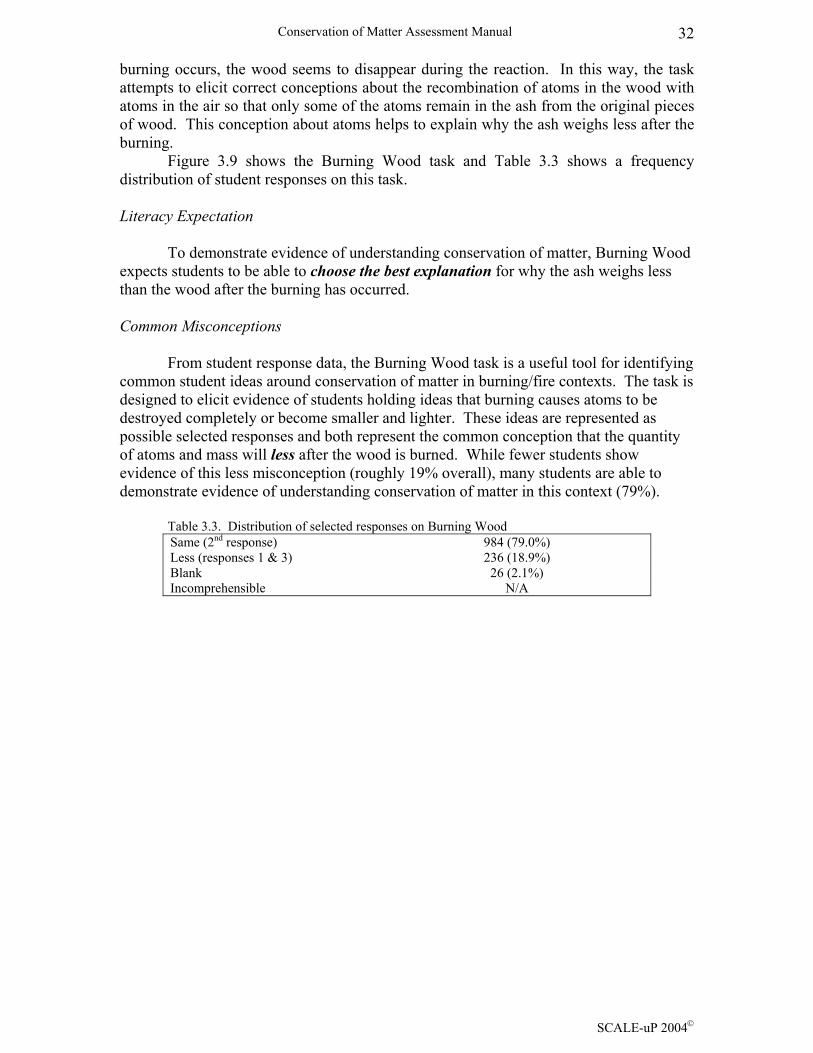
burning occurs, the wood seems to disappear during the reaction. In this way, the task attempts to elicit correct conceptions about the recombination of atoms in the wood with atoms in the air so that only some of the atoms remain in the ash from the original pieces of wood. This conception about atoms helps to explain why the ash weighs less after the burning. Figure 3.9 shows the Burning Wood task and Table 3.3 shows a frequency distribution of student responses on this task. Literacy Expectation To demonstrate evidence of understanding conservation of matter, Burning Wood expects students to be able to choose the best explanation for why the ash weighs less than the wood after the burning has occurred. Common Misconceptions From student response data, the Burning Wood task is a useful tool for identifying common student ideas around conservation of matter in burning/fire contexts. The task is designed to elicit evidence of students holding ideas that burning causes atoms to be destroyed completely or become smaller and lighter. These ideas are represented as possible selected responses and both represent the common conception that the quantity of atoms and mass will less after the wood is burned. While fewer students show evidence of this less misconception (roughly 19% overall), many students are able to demonstrate evidence of understanding conservation of matter in this context (79%).
Table 3.3. Distribution of selected responses on Burning Wood Same (2nd response) 984 (79.0%) Less (responses 1 & 3) 236 (18.9%) Blank 26 (2.1%) Incomprehensible N/A
SCALE-uP 2004

Conservation of Matter Assessment Manual 33
Figure 3.9. Burning Wood as presented to students
SCALE-uP 2004
Conservation of Matter Assessment Manual 34
Thermometer Description
The Thermometer task involves a single selected response item. The task context involves a physical change in the shape of the mercury inside the thermometer as it measures something cold to when it measures something warm. Given the different appearance of the thermometer, students are asked to decide if the thermometer weighs the same, more, or less when it is measuring the warmer environment. In this case, Maria, weighed the thermometer outside on a very cold day, brought it back inside and after an hour, weighed it again. Students are asked to make a prediction about the results of the two weight measurements (outside and inside). The first selection predicts that the two thermometers weigh the same inside and outside because nothing could get in or out of the thermometer. The second selection predicts that the thermometer weighed less inside than outside because inside the thermometer was warmer and lighter. The third selection predicts that the thermometer will weigh more inside than outside because inside, there was more liquid in the thermometer. Target Ideas
Thermometer also focuses on only a portion of the larger conservation of matter target idea. Students are asked to focus specifically on the idea that no matter how substances within a closed system interact with one another, or how they combine or break apart, the total weight of the system remains the same. Students observe a physical change that occurs within a closed system and must then make a prediction about the weight of that closed system. Context Variables/Phenomena
The Thermometer task involves a liquid undergoing a physical change in a closed system with the appearance of more of the substance inside the thermometer (see Table 3.1).
Thermometer is similar to the Perfume Spill task in that it describes another physical change. However, the thermometer task is different in that it does not involve a change in the state of matter, as was the case in the Perfume Spill. In fact, this is the only task that involves no change in the state(s) of matter involved in the reaction
In addition, this task describes a context in which there is an apparent appearance of a substance. As the temperature changes from cold to warm, the mercury rises; giving the appearance that there is more mercury inside the thermometer. This appearance of more of the substance will demand that students are aware that nothing was added to the thermometer, the same amount of mercury simply changed its shape, and this will not have an impact on the weight of the thermometer.
Finally, the Thermometer task occurs in a closed system. For this task, the closed system nature becomes a critical component as students make their predictions about the weight of the thermometer. Recognizing that the thermometer is a closed system and that there is the same amount of ‘stuff’ in the thermometer at both times is important for students to make the correct prediction. Figure 3.10 shows the Thermometer task and Table 3.4 shows a frequency distribution of student responses on this task.
SCALE-uP 2004

Conservation of Matter Assessment Manual 35
Figure 3.10. Thermometer task as presented to students
Common Misconceptions The Thermometer task is able to elicit evidence of students believing that the mass of the thermometer is more or less when it reads a higher temperature (inside). However, in this context, more students are likely to show evidence that they believe the thermometer weighs more because it has more liquid (31.2%) than students who believe that the thermometer is warmer and lighter (4.4%).
Table 3.4. Distribution of selected responses on Thermometer task Same (1st response) 784 (63.0%) More (3rd response) 388 (31.2%) Less (2nd response) 55 (4.4%) Blank 18 (1.4%)
SCALE-uP 2004

Conservation of Matter Assessment Manual 36
SCALE-uP 2004
Conservation of Matter Assessment Manual 37
Chapter 4 Rating COMA Constructed Response Items
Rating Categories
Through a careful rating guide development process using two rounds of data
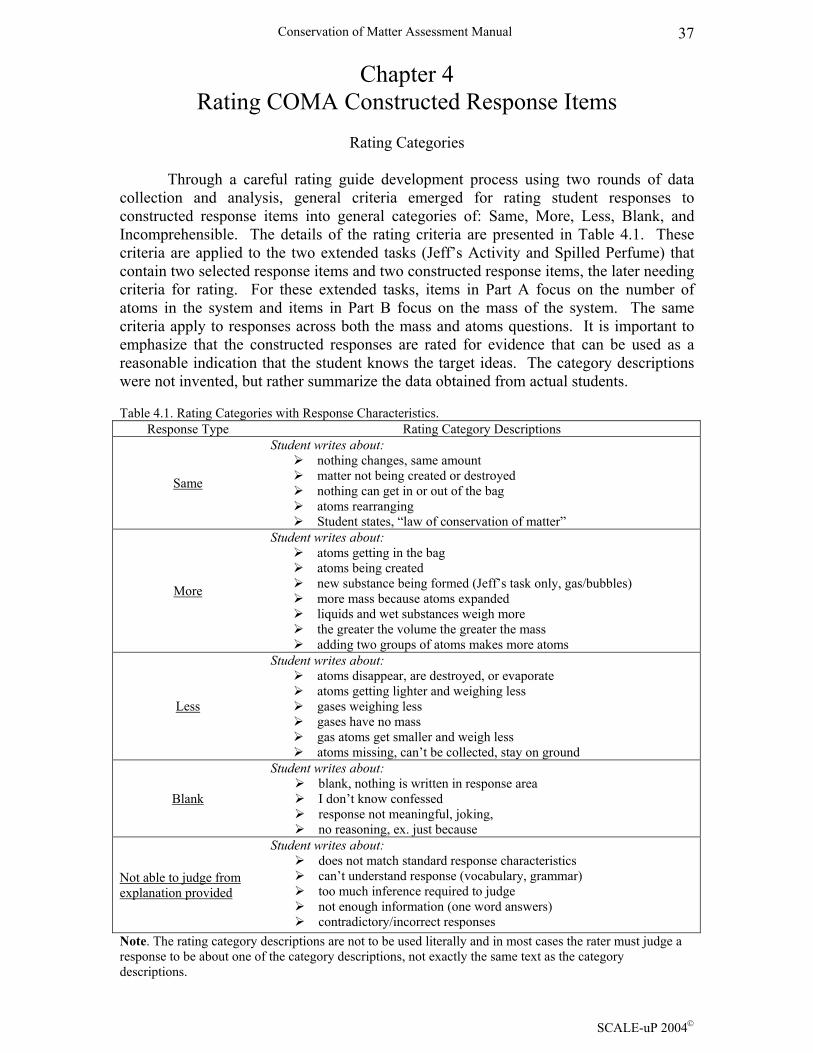
collection and analysis, general criteria emerged for rating student responses to constructed response items into general categories of: Same, More, Less, Blank, and Incomprehensible. The details of the rating criteria are presented in Table 4.1. These criteria are applied to the two extended tasks (Jeff’s Activity and Spilled Perfume) that contain two selected response items and two constructed response items, the later needing criteria for rating. For these extended tasks, items in Part A focus on the number of atoms in the system and items in Part B focus on the mass of the system. The same criteria apply to responses across both the mass and atoms questions. It is important to emphasize that the constructed responses are rated for evidence that can be used as a reasonable indication that the student knows the target ideas. The category descriptions were not invented, but rather summarize the data obtained from actual students.
Table 4.1. Rating Categories with Response Characteristics.
Response Type Rating Category Descriptions
Same
Student writes about: nothing changes, same amount matter not being created or destroyed nothing can get in or out of the bag atoms rearranging Student states, “law of conservation of matter”
More
Student writes about: atoms getting in the bag atoms being created new substance being formed (Jeff’s task only, gas/bubbles) more mass because atoms expanded liquids and wet substances weigh more the greater the volume the greater the mass adding two groups of atoms makes more atoms
Less
Student writes about: atoms disappear, are destroyed, or evaporate atoms getting lighter and weighing less gases weighing less gases have no mass gas atoms get smaller and weigh less atoms missing, can’t be collected, stay on ground
Blank
Student writes about: blank, nothing is written in response area I don’t know confessed response not meaningful, joking, no reasoning, ex. just because
Not able to judge from explanation provided
Student writes about: does not match standard response characteristics can’t understand response (vocabulary, grammar) too much inference required to judge not enough information (one word answers) contradictory/incorrect responses
Note. The rating category descriptions are not to be used literally and in most cases the rater must judge a response to be about one of the category descriptions, not exactly the same text as the category descriptions.
SCALE-uP 2004

Conservation of Matter Assessment Manual 38
Table 4.2 shows the relationships among the characteristics or qualities of students’ reasoning from the table above, the inference about understanding related to each of the five categories above and a suggested coding scheme. Table 4.2. Rating Categories
Response Type
Category Description Inference Code
Same
Explanation provided for “same”
Evidence of Correct Understanding
S
More
Explanation provided for “more”
Evidence of More Misconception
M
Less
Explanation provided for “less”
Evidence of Less Misconception
L
Blank
No evidence of reasoning about the task (i.e., blank, I don’t know confession, joking response)
No Evidence of understanding due to no effort
B
Not able to judge/High inference
Not able to judge reasoning from response (does not fit standard response
characteristics, it is difficult to interpret due to vocabulary and grammar, requires to
much inference to make a judgment, lacks sufficient information
Evidence of effort with lack of ability to communicate effectively
NJ
General Note about Molecules. Students may talk about molecules in their responses. In most cases the idea of atoms and the idea of molecules will be interchangeable. However, in some cases the idea of molecules may cause a response to fail to be scientifically correct. When the idea of molecules is used, consider responses carefully.
Reliability of Rating Constructed Response Items with Multiple Raters
The data that follow report on the work of a small set of trained raters who scored approximately 6,000 assessments in year 1 of the SCALE-uP project (2002-2003). The raters individually scored students’ responses using the rating chart in Table 4.1 and multiple raters scored approximately 2% of the items for reliability purposes. Across all pairs of raters scoring common items, inter-rater reliability Kappa scores ranged from .70 to .81. Cohen’s Kappa coefficient provides an index of agreement between ratings by two raters when the same scale is used for both. A value of 1 indicates perfect agreement, a value of 0 indicates that agreement is no better than chance, while a value of –1 indicates perfect disagreement. Generally, a Kappa greater than .7 is considered satisfactory (Howell, 1997). Tables 4.3 and 4.4 show inter-rater agreement for constructed responses on Jeff’s Activity and Spilled Perfume.
SCALE-uP 2004

Conservation of Matter Assessment Manual 39
Table 4.3. Average rater agreement for constructed responses on Jeff’s Task Jeff's Task A Constructed Response Rater 1 Rater 2 Rater 3 Rater 4 Rater 1 0.77 0.79 0.83 Rater 2 0.81 0.81 Average Kappa=0.81 Rater 3 0.86 Rater 4 Jeff's Task B Constructed Response Rater 1 Rater 2 Rater 3 Rater 4 Rater 1 0.68 0.72 0.76 Rater 2 0.76 0.81 Average Kappa=0.75 Rater 3 0.75 Rater 4
Table 4.4. Average rater agreement for constructed responses on Perfume Spill
Perfume Task A Constructed Response Rater 1 Rater 2 Rater 3 Rater 4 Rater 1 0.63 0.65 0.66 Rater 2 0.84 0.92 Average Kappa=0.76 Rater 3 0.84 Rater 4 Perfume Task B Constructed Response Rater 1 Rater 2 Rater 3 Rater 4 Rater 1 0.64 0.70 0.63 Rater 2 0.74 0.73 Average Kappa=0.70 Rater 3 0.76 Rater 4
SCALE-uP 2004

Conservation of Matter Assessment Manual 40
SCALE-uP 2004

Conservation of Matter Assessment Manual 41
Chapter 5 Validity of the Items and the Assessment
In its most general form validity refers to, “the degree to which evidence and
theory support the interpretation of assessment scores” (Pellegrino, Chudowsky, & Glaser, 2001). In COMA, evidence comes in the form of students’ selected and constructed written responses to questions asked about conservation of matter phenomena. Conceptual Change Theory (Posner, Strike, Hewson, & Getzog, 1982; Strike & Posner, 1992) provides the framework used for eliciting and interpreting responses. Specifically, that students’ knowledge interacts with a task to produce their task responses, and that they will respond to a range of tasks in a consistent manner if they use adequate conceptual knowledge. As such, the evidence collected here is only relevant based on the assumption that the phenomena and questions presented provoke students to use conceptual knowledge related to conservation of matter. We believe this assumption is met because the Project 2061 assessment alignment criteria were used during item development. In simple terms, we believe students’ written responses to COMA questions are an adequate means to discover what they know. A more detailed discussion of our attention to COMA’s validity follows.
Validity of COMA Items
Item characteristics are at the core of any good assessment and that is why so much time was spent assuring the quality of items in the development of COMA. If the individual items of the assessment do not align with the competencies expected at the grade-8 level then the overall assessment will be of little use. Also, if the items are too easy or too hard, or do not discriminate among learners at the appropriate level of understanding then judgments from the data will be equally useless. At this time, the only tools available to ensure items are valid and that they discriminate well are; (a) expert panel judgments, (b) analysis of pilot data, and (c) student interviews. All three methods of validation were employed in the development of COMA prior to its use in the SCALE –up year 1 study. Experts used in the development and analysis of items included faculty selected from the sciences and science education, along with middle school science teachers. All were trained in using the Project 2061 assessment analysis criteria described in Chapter 1 (i.e., Content Alignment, Comprehensibility, Clarity of Expectations, Appropriateness of Context, and Test Wiseness).
For empirical evidence of validity, a pilot of the assessment was conducted with samples of students specifically selected to be at three different levels of understanding relative to the conservation of matter idea set. The pilot data was used to make judgments about the difficulty of items and their ability to discriminate among those that understood the conservation of matter concept and those that did not. Analysis of the pilot data played a role in the final selection of specific items to be included in COMA. With data from the SCALE-uP year one study presented in Table 5.1 we can observe the excellent difficulty and discrimination properties of the items.
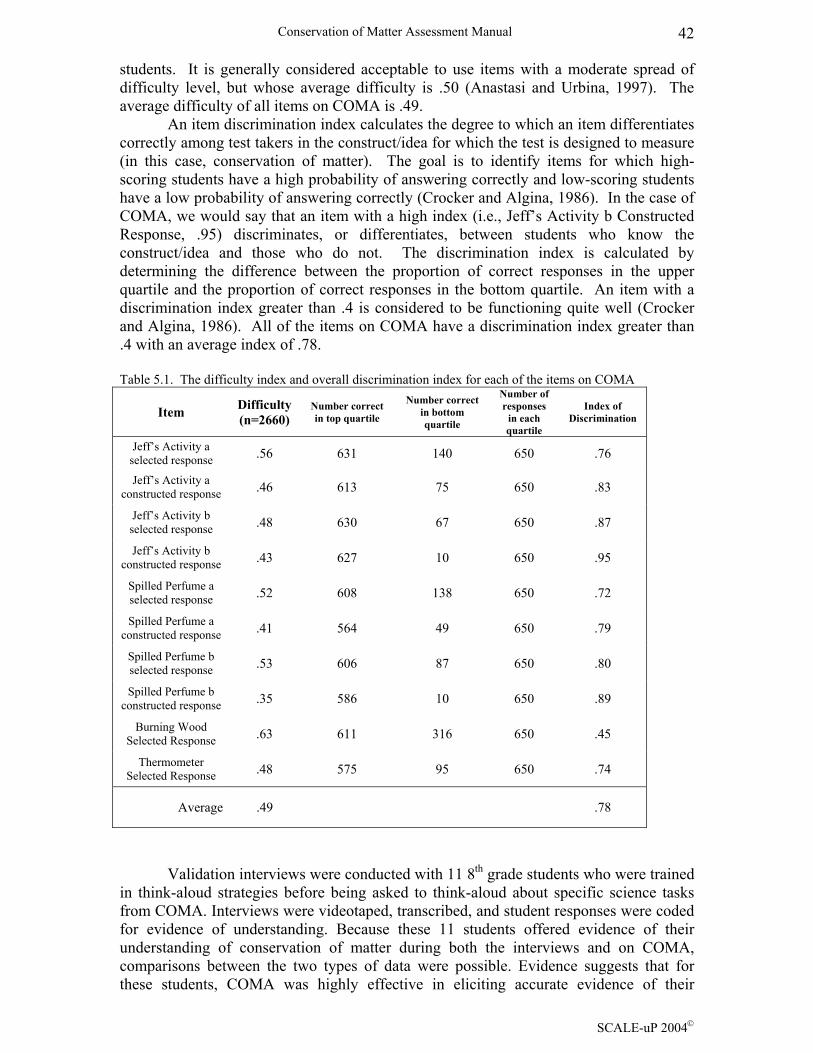
The difficulty index is simply a measure of the percent correct on a given item. Therefore, a lower difficulty index (i.e., .35) will indicate a more difficult item (Spilled Perfume b constructed response) and a higher difficulty index (i.e., .63) will indicate an easier item (Burning Wood). The closer the difficulty of an item is to 1 or 0, the less differential information about test takers it contributes. Conversely, the closer the difficulty level is to .50, the better the item for making relevant distinctions among more
SCALE-uP 2004
Conservation of Matter Assessment Manual 42
students. It is generally considered acceptable to use items with a moderate spread of difficulty level, but whose average difficulty is .50 (Anastasi and Urbina, 1997). The average difficulty of all items on COMA is .49.
An item discrimination index calculates the degree to which an item differentiates correctly among test takers in the construct/idea for which the test is designed to measure (in this case, conservation of matter). The goal is to identify items for which high-scoring students have a high probability of answering correctly and low-scoring students have a low probability of answering correctly (Crocker and Algina, 1986). In the case of COMA, we would say that an item with a high index (i.e., Jeff’s Activity b Constructed Response, .95) discriminates, or differentiates, between students who know the construct/idea and those who do not. The discrimination index is calculated by determining the difference between the proportion of correct responses in the upper quartile and the proportion of correct responses in the bottom quartile. An item with a discrimination index greater than .4 is considered to be functioning quite well (Crocker and Algina, 1986). All of the items on COMA have a discrimination index greater than .4 with an average index of .78. Table 5.1. The difficulty index and overall discrimination index for each of the items on COMA
Item Difficulty (n=2660)
Number correct in top quartile
Number correct in bottom quartile
Number of responses
in each quartile
Index of Discrimination
Jeff’s Activity a selected response .56 631 140 650 .76
Jeff’s Activity a constructed response .46 613 75 650 .83
Jeff’s Activity b selected response .48 630 67 650 .87
Jeff’s Activity b constructed response .43 627 10 650 .95
Spilled Perfume a selected response .52 608 138 650 .72
Spilled Perfume a constructed response .41 564 49 650 .79
Spilled Perfume b selected response .53 606 87 650 .80
Spilled Perfume b constructed response .35 586 10 650 .89
Burning Wood Selected Response .63 611 316 650 .45
Thermometer Selected Response .48 575 95 650 .74
Average .49 .78
Validation interviews were conducted with 11 8th grade students who were trained in think-aloud strategies before being asked to think-aloud about specific science tasks from COMA. Interviews were videotaped, transcribed, and student responses were coded for evidence of understanding. Because these 11 students offered evidence of their understanding of conservation of matter during both the interviews and on COMA, comparisons between the two types of data were possible. Evidence suggests that for these students, COMA was highly effective in eliciting accurate evidence of their
SCALE-uP 2004

Conservation of Matter Assessment Manual 43
understanding of conservation of matter. Overall, students that were able to demonstrate evidence of understanding conservation of matter during the interviews also were able to demonstrate similar levels of understanding on COMA. In contrast, students that were unable to demonstrate evidence of understanding conservation of matter during the interviews were also unable to demonstrate that understanding on COMA. In general, the interview data was consistent with COMA.
Combining Items for “Test” Validity
There are many questions to answer concerning how to combine items into a test.
For example: How much evidence is needed to make a sound inference about what a student knows and can do? Is one item enough? An investigation into the research on students’ understandings about conservation of matter suggests that students’ reaction to changes in context provide great insight into their thinking (see Chapter 2). Complicating the context issue for conservation of matter assessment is that our development process revealed more than 200 different contexts are possible for targeted items. Adding another dimension to the complexity of decisions about test construction is the list of literacy expectations that suggest conceptual understanding can be demonstrated through a number of proficiencies, the literacy expectations of someone knowledgeable about conservation of matter. Finally, there are the constraints of school-based assessment processes that we needed to consider. COMA could only take 30-40 minutes with in-classroom implementation using paper and pencil techniques.
Before discussing COMA’s test validity it is important to recall that traditional notions of “test” validity emerged from a focus on distinguishing among differences in groups assumed to possess different “traits”. However, current notions about cognitive abilities assume more similarity in the core of cognitive foundations of thinking and knowing and relegate differences in groups to the unique yet systematic effects of differences in cultural contexts. From a test validity standpoint, this shift in beliefs about students’ concept knowledge necessarily implies a relationship between what one knows and how they have come to acquire their knowledge. Hence, test making has become more focused on providing every opportunity possible for students to demonstrate commonality in thought rather than seeking evidence to confirm “trait” differences. However, the fundamental test validity question for us is - does our data provide an accurate representation of what each student knows? One of the more traditional indicators of a good test is the degree to which the items are related. The logic being that if a single idea is at the core of the assessment then students will respond consistently to each item (because the items are internally consistent). In the measurement literature this is called Scale Reliability (often measured by a statistic called Cronbach’s Alpha). Using a sample of students’ posttest scores from the treatment group of the SCALE-uP study, internal consistency for COMA was found to be satisfactory (Cronbach’s Alpha = 0.85). The alpha can range between 0 and 1. If a reliability scale has an alpha above .60, it is usually considered to be internally consistent.
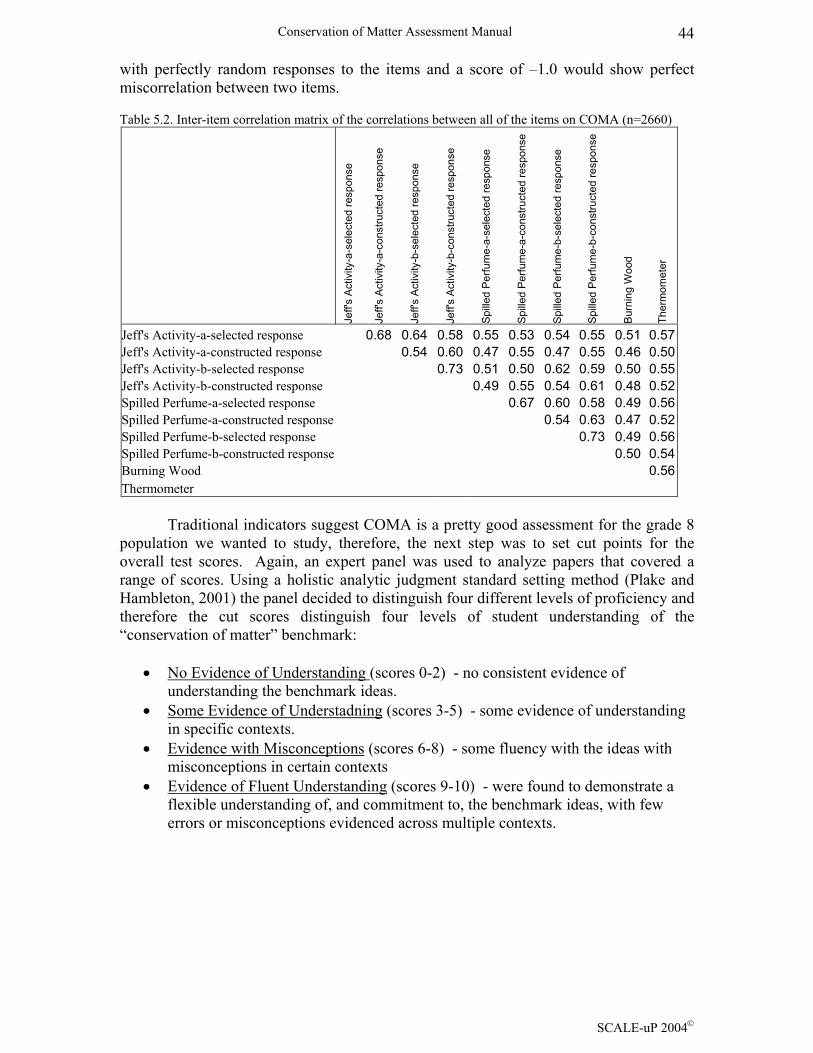
A more detailed picture of the relationships among the ratings on the individual items of COMA is observed by studying the bivariate correlations among the items. Table 5.2 presents the bivariate zero-order correlations with high correlations suggesting that if a student does well on one, they are likely to do well on the other. This is particularly true when correlating the selected and constructed portions of Jeff’s Activity Part B (0.73) as well as many other items with acceptable bivariate correlations. A score of 1.0 shows perfect correlation between two items, a score of 0 would be the correlation
SCALE-uP 2004
Conservation of Matter Assessment Manual 44
with perfectly random responses to the items and a score of –1.0 would show perfect miscorrelation between two items.
Table 5.2. Inter-item correlation matrix of the correlations between all of the items on COMA (n=2660)
Jeff'
s A
ctiv
ity-a
-sel
ecte
d re
spon
se
Jeff'
s A
ctiv
ity-a
-con
stru
cted
resp
onse
Jeff'
s A
ctiv
ity-b
-sel
ecte
d re
spon
se
Jeff'
s A
ctiv
ity-b
-con
stru
cted
resp
onse
Spi
lled
Per
fum
e-a-
sele
cted
resp
onse
Spi
lled
Per
fum
e-a-
cons
truct
ed re
spon
se
Spi
lled
Per
fum
e-b-
sele
cted
resp
onse
Spi
lled
Per
fum
e-b-
cons
truct
ed re
spon
se
Bur
ning
Woo
d
Ther
mom
eter
Jeff's Activity-a-selected response 0.68 0.64 0.58 0.55 0.53 0.54 0.55 0.51 0.57Jeff's Activity-a-constructed response 0.54 0.60 0.47 0.55 0.47 0.55 0.46 0.50Jeff's Activity-b-selected response 0.73 0.51 0.50 0.62 0.59 0.50 0.55Jeff's Activity-b-constructed response 0.49 0.55 0.54 0.61 0.48 0.52Spilled Perfume-a-selected response 0.67 0.60 0.58 0.49 0.56Spilled Perfume-a-constructed response 0.54 0.63 0.47 0.52Spilled Perfume-b-selected response 0.73 0.49 0.56Spilled Perfume-b-constructed response 0.50 0.54Burning Wood 0.56Thermometer Traditional indicators suggest COMA is a pretty good assessment for the grade 8 population we wanted to study, therefore, the next step was to set cut points for the overall test scores. Again, an expert panel was used to analyze papers that covered a range of scores. Using a holistic analytic judgment standard setting method (Plake and Hambleton, 2001) the panel decided to distinguish four different levels of proficiency and therefore the cut scores distinguish four levels of student understanding of the “conservation of matter” benchmark:
• No Evidence of Understanding (scores 0-2) - no consistent evidence of
understanding the benchmark ideas. • Some Evidence of Understadning (scores 3-5) - some evidence of understanding
in specific contexts. • Evidence with Misconceptions (scores 6-8) - some fluency with the ideas with
misconceptions in certain contexts • Evidence of Fluent Understanding (scores 9-10) - were found to demonstrate a
flexible understanding of, and commitment to, the benchmark ideas, with few errors or misconceptions evidenced across multiple contexts.
SCALE-uP 2004
Conservation of Matter Assessment Manual 45
Chapter 6 Distribution of Responses from Different Samples
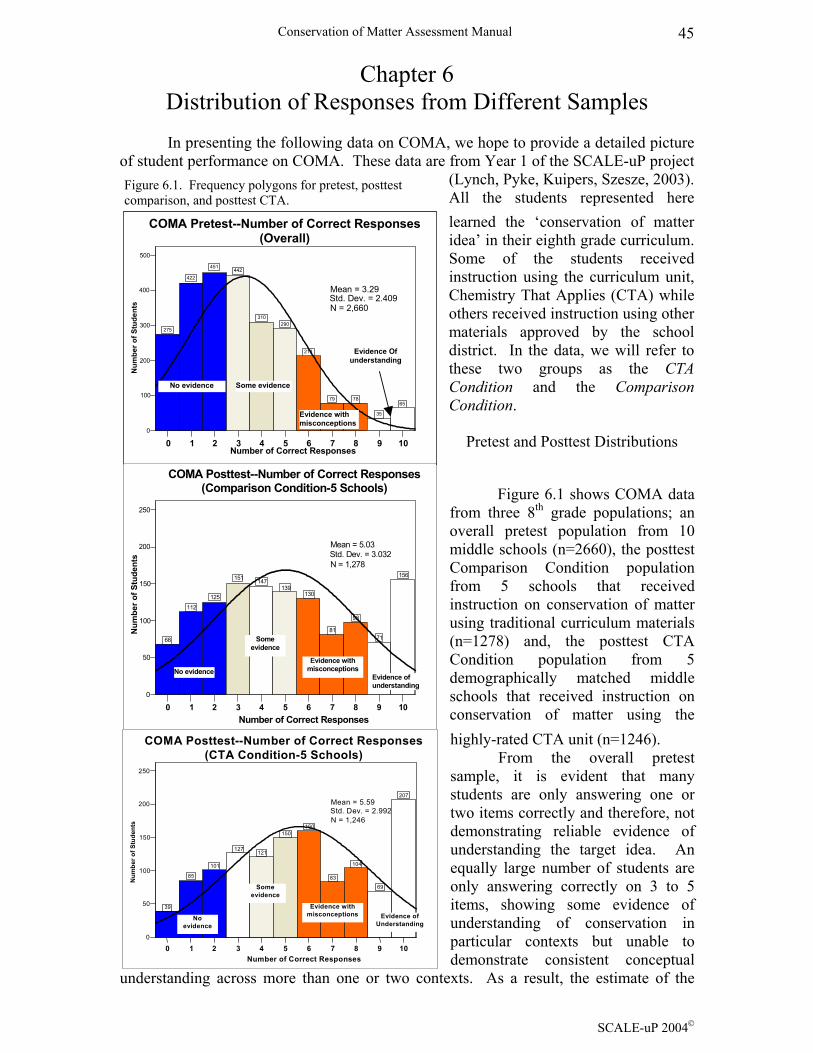
Figure 6.1. Frequency polygons for pretest, posttest comparison, and posttest CTA.
In presenting the following data on COMA, we hope to provide a detailed picture of student performance on COMA. These data are from Year 1 of the SCALE-uP project
(Lynch, Pyke, Kuipers, Szesze, 2003). All the students represented here learned the ‘conservation of matter idea’ in their eighth grade curriculum. Some of the students received instruction using the curriculum unit, Chemistry That Applies (CTA) while others received instruction using other materials approved by the school district. In the data, we will refer to these two groups as the CTA Condition and the Comparison Condition.
0 1 2 3 4 5 6 7 8 9 10Number of Correct Responses
0
50
100
150
200
250
Num
ber o
f Stu
dent
s
68
112 125
151 147 139
130
81
98
71
156
Mean = 5.03Std. Dev. = 3.032N = 1,278
COMA Posttest--Number of Correct Responses(Comparison Condition-5 Schools)
No evidence
Some evidence
Evidence with misconceptions
Evidence of understanding
0 1 2 3 4 5 6 7 8 9 10Number of Correct Responses
0
100
200
300
400
500
Num
ber o
f Stu
dent
s
275
422 451
442
310 290
213
79 78
35
65
Mean = 3.29Std. Dev. = 2.409N = 2,660
COMA Pretest--Number of Correct Responses (Overall)
No evidence Some evidence
Evidence with misconceptions
Evidence Of understanding
Pretest and Posttest Distributions
Figure 6.1 shows COMA data
from three 8th grade populations; an overall pretest population from 10 middle schools (n=2660), the posttest Comparison Condition population from 5 schools that received instruction on conservation of matter using traditional curriculum materials (n=1278) and, the posttest CTA Condition population from 5 demographically matched middle schools that received instruction on conservation of matter using the highly-rated CTA unit (n=1246). From the overall pretest sample, it is evident that many students are only answering one or two items correctly and therefore, not demonstrating reliable evidence of understanding the target idea. An equally large number of students are only answering correctly on 3 to 5 items, showing some evidence of understanding of conservation in particular contexts but unable to demonstrate consistent conceptual
understanding across more than one or two contexts. As a result, the estimate of the
0 1 2 3 4 5 6 7 8 9 10Number of Correct Responses
0
50
100
150
200
250
Num
ber o
f Stu
dent
s
39
85 101
127 121 150 160
83
104
69
207Mean = 5.59Std. Dev. = 2.992N = 1,246
COMA Posttest--Number of Correct Responses(CTA Condition-5 Schools)
Some evidence
Evidence with misconceptions No
evidence Evidence of
Understanding
S
CALE-uP 2004
Conservation of Matter Assessment Manual 46
normal curve is slightly positively skewed with an overall mean of 3.29 correct responses. It is clear that at pretest very few students are demonstrating consistent levels of understanding of conservation of matter consistently across all contexts.
However, post-instruction COMA scores shift considerably as more students are showing evidence of understanding in both the CTA and Comparison Conditions. Many more students are answering correctly on between 5 and 10 items, thus, demonstrating higher levels of understanding of conservation of matter across more contexts on COMA. The distribution of scores is more normal with a mean score of 5.03 in the Comparison Condition and 5.59 in the CTA Condition. It is worth noting there is a statistically significant difference on COMA mean scores across curriculum condition in favor of CTA with F (1, 2253)=21.88, p<0.001. For the purposes of the SCALE-uP project, COMA has been an effective instrument for understanding conceptual change among students. For example, the figures above show that after the curricular experiences some students do learn quite a bit and achieve a fluent understanding and many of the students with little understanding to begin with make progress to higher levels.
Gender
r
Figure 6.2. Posttest frequency polygons for all 10 schools by gender.
0 1 2 3 4 5 6 7 8 9 10Number of Correct Responses
0
50
100
150
200
Num
ber o
f Stu
dent
s
52
101 113
127 134 151
138
90
103
68
169
Mean = 5.28 Std. Dev. = 3.001 N = 1,246
COMA Posttest--Number of Correct Responses (Females)
Some evidence
No evidence
Evidence with misconceptions
Evidence of understanding
Figures 6.2 shows the frequency of correct responses on COMA (posttest) by gender for all 8th graders in the 10 schools studied. (total n=2474). Both gender groups have similar proportions of students demonstrating flexible understanding of conservation of matter, answering correctly on all 10 items on COMA. However, a majority of students are still only responding correctly to between 3 and 6
items (means=5.33 and 5.28), even though there are no apparent gender differences.
Ethnicity Figure 6.3 shows the frequency of correct responses on COMA (posttest) by Ethnicity for 8th graders in the same 10 schools (total n=2524). The distribution of responses across Ethnicity groups is again, relatively normal with the White subgroup distributions having a slight negative skew due to the
elatively large proportion of students achieving a fluent understanding of the ideas.
0 1 2 3 4 5 6 7 8 9 10Number of Correct Responses
0
50
100
150
200
Num
ber o
f Stu
dent
s
55
96 113
151 134 138
152
74
99
72
194Mean = 5.33Std. Dev. = 3.049N = 1,278
COMA Posttest--Number of Correct Responses (Males)
Some evidence
No evidence
Evidence with misconceptions
Evidence of understanding
SCALE-uP 2004

Conservation of Matter Assessment Manual 47
Within the White and Asian American subgroups there are more items correct on average at posttest (means= 6.72 and 5.98) than Hispanic and African Americans (means =4.22 and 4.36). These data are consistent with other large-scale assessments in which gaps are noted in student learning between ethnic groups. Figure 6.3. Posttest frequency polygons for all 10 schools by Ethnicity subgroup.
0 1 2 3 4 5 6 7 8 9 10Number of Correct Responses
0
50
100
150
200
250
Num
ber o
f Stu
dent
s
12 24 36
64 64 89
117
59
89 72
227
Mean = 6.72 Std. Dev. = 2.821 N = 853
COMA Posttest--Number of Correct Responses (White Students)
Some evidence
No evidence
Evidence with misconceptions Evidence of
understanding
(Asian American Students)
0 1 2 3 4 5 6 7 8 9 10Number of Correct Responses
0
50
100
150
200
250
Num
ber o
f Stu
dent
s 4
21 18
3322 34 36
1929
22
57
Mean = 5.98Std. Dev. = 2.986N = 295
COMA Posttest—Number of Correct Responses(Asian American Students)
Some evidence
No evidence
Evidence of understandingEvidence with
misconceptions
0 1 2 3 4 5 6 7 8 9 10Number of Correct Responses
0
50
100
150
200
250
Num
ber o
f Stu
dent
s
58 81 86
108 109 98
73 46 50
20
41
Mean = 4.22 Std. Dev. = 2.711 N = 770
COMA Posttest--Number of Correct Responses (African American Students)
Some evidence
No evidence Evidence with misconceptions
Evidence of understanding
0 1 2 3 4 5 6 7 8 9 10Number of Correct Responses
0
50
100
150
200
250
Num
ber o
f Stu
dent
s
33
71
86
73 73 68 64
4034
26
38
Mean = 4.36Std. Dev. = 2.802N = 606
COMA Posttest--Number of Correct Responses (Hispanic Students)
No evidence
Some evidence
Evidence with misconceptions
Evidence of understanding
English for Speakers of Other Languages (ESOL) Status Figures 6.10 through 6.12 show the frequency of correct responses on COMA (posttest) by ESOL Status for 8th graders in the same 10 schools (total n=2757). Students classified as Never-ESOL have never been eligible for second language instruction services by the district, students classified as Prior-ESOL were eligible at one time for services but have transitioned out and are no longer eligible, and students classified as Now-ESOL are currently eligible to receive second language instruction.
SCALE-uP 2004

Conservation of Matter Assessment Manual 48
The distribution of correct responses across ESOL status groups is again, relatively normal. The Never-ESOL group mean of 5.71 correct responses is higher than group means in the other two groups (4.38, 3.51). The Never-ESOL group is able to demonstrate more evidence of understanding of the target idea at the highest levels. However, there are clearly some students receiving ESOL services that are able to make sense of the task contexts, use their scientifically appropriate knowledge, and respond in meaningful ways to COMA. That some ESOL students are demonstrating evidence at each of the levels of understanding on COMA suggests COMA is functioning well for ESOL students.
0 1 2 3 4 5 6 7 8 9 10Number of Correct Responses
0
50
100
150
200
250
300
350
Num
ber o
f Stu
dent
s
58
115 139
182 198
217 232
124
172
111
325
Mean = 5.71 Std. Dev. = 2.986 N = 1,873
COMA Posttest—Number of Correct Responses (ESOL Never)
Some evidence
No evidence
Evidence with misconceptions Evidence of
understanding
Figure 6.4. Posttest frequency polygons for all 10 schools by ESOL subgroup. Scores range from 0 to 10.
0 1 2 3 4 5 6 7 8 9 10Number of Correct Responses
0
50
100
150
200
250
300
350
Num
ber o
f Stu
dent
s
33 43 56 57 45 47 41
26 20 2232
Mean = 4.38Std. Dev. = 2.925N = 422
COMA Posttest—Number of Correct Responses (ESOL Prior)
Some evidence No evidence
Evidence with misconceptions Evidence of
understanding
Free And Reduced Meals Status
(FARMS) Figures 6.5 shows the frequency of correct responses on COMA (posttest) by FARMS for 8th graders in the same 10 schools (total n=2457). Students classified as Never-FARMS have never been eligible for free or reduced meals services by the district, students classified as Prior-FARMS were eligible at one time for these services but are no longer eligible, and
students classified as Now-FARMS are currently eligible to receive free and reduced meals. Eligibility for these services is contingent upon household income and therefore, is a useful proxy for socioeconomic status.
0 1 2 3 4 5 6 7 8 9 10Number of Correct Responses
0
50
100
150
200
250
300
350
Num
ber o
f Stu
dent
s
12 31
22 29 17 20
7 9 6 5 4
Mean = 3.51Std. Dev. = 2.545N = 162
COMA Posttest—Number of Correct Responses (ESOL Now)
Some evidence No evidence Evidence with misconceptions
Evidence of understanding
SCALE-uP 2004
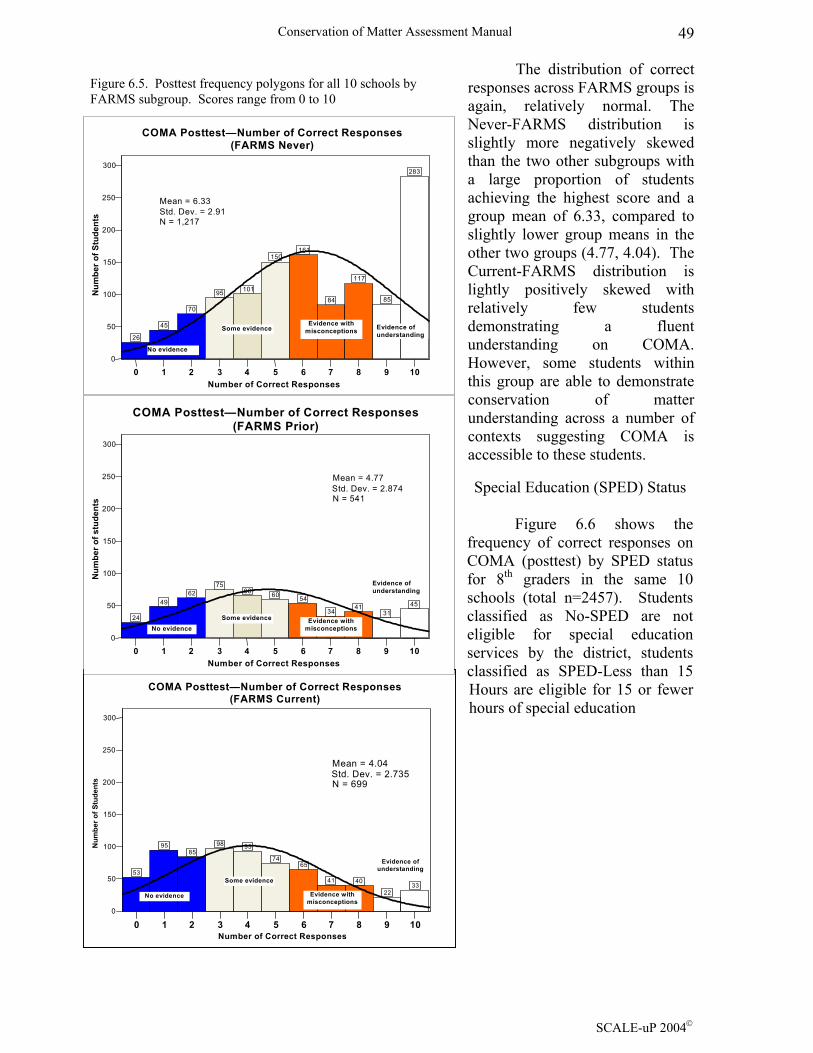
Conservation of Matter Assessment Manual 49
The distribution of correct responses across FARMS groups is again, relatively normal. The Never-FARMS distribution is slightly more negatively skewed than the two other subgroups with a large proportion of students achieving the highest score and a group mean of 6.33, compared to slightly lower group means in the other two groups (4.77, 4.04). The Current-FARMS distribution is lightly positively skewed with relatively few students demonstrating a fluent understanding on COMA. However, some students within this group are able to demonstrate conservation of matter understanding across a number of contexts suggesting COMA is accessible to these students.
0 1 2 3 4 5 6 7 8 9 10Number of Correct Responses
0
50
100
150
200
250
300
Num
ber o
f Stu
dent
s
26 45
70 95 101
150 161
84
117
85
283
Mean = 6.33 Std. Dev. = 2.91 N = 1,217
COMA Posttest—Number of Correct Responses (FARMS Never)
Some evidence
No evidence
Evidence with misconceptions Evidence of
understanding
Figure 6.5. Posttest frequency polygons for all 10 schools by FARMS subgroup. Scores range from 0 to 10
0 1 2 3 4 5 6 7 8 9 10Number of Correct Responses
0
50
100
150
200
250
300
Num
ber o
f Stu
dent
s
53
95 85
98 93 74
65 41 40
2233
Mean = 4.04Std. Dev. = 2.735N = 699
COMA Posttest—Number of Correct Responses (FARMS Current)
Some evidence
No evidence Evidence with misconceptions
Evidence of understanding
0 1 2 3 4 5 6 7 8 9 10Number of Correct Responses
0
50
100
150
200
250
300
Num
ber o
f stu
dent
s
24 49
62 75 66 60 54
3441
3145
Mean = 4.77Std. Dev. = 2.874N = 541
COMA Posttest—Number of Correct Responses(FARMS Prior)
No evidence Some evidence Evidence with
misconceptions
Evidence of understanding
Special Education (SPED) Status
Figure 6.6 shows the
frequency of correct responses on COMA (posttest) by SPED status for 8th graders in the same 10 schools (total n=2457). Students classified as No-SPED are not eligible for special education services by the district, students classified as SPED-Less than 15 Hours are eligible for 15 or fewer hours of special education
SCALE-uP 2004
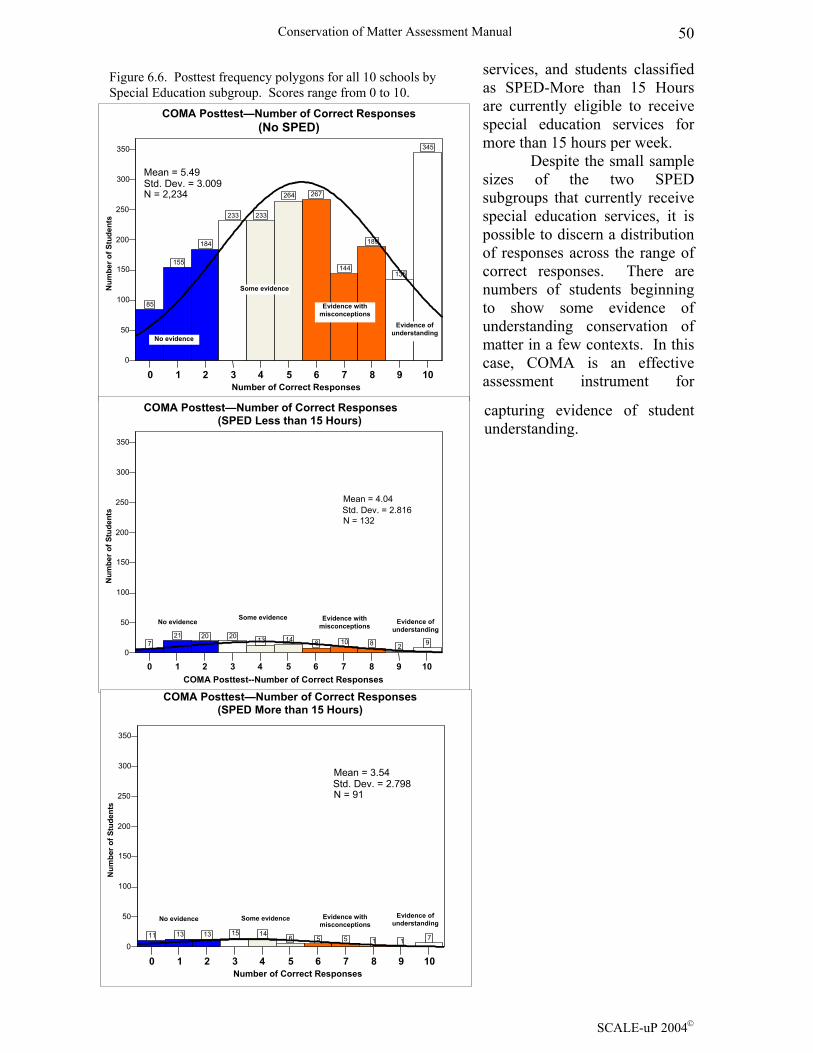
Conservation of Matter Assessment Manual 50
services, and students classified as SPED-More than 15 Hours are currently eligible to receive special education services for more than 15 hours per week.
0 1 2 3 4 5 6 7 8 9 10Number of Correct Responses
0
50
100
150
200
250
300
350
Num
ber o
f Stu
dent
s
85
155 184
233 233 264 267
144
189
135
345
Mean = 5.49 Std. Dev. = 3.009 N = 2,234
COMA Posttest—Number of Correct Responses (No SPED)
No evidence
Some evidence
Evidence with misconceptions
Evidence of understanding
Figure 6.6. Posttest frequency polygons for all 10 schools by Special Education subgroup. Scores range from 0 to 10.
Despite the small sample sizes of the two SPED subgroups that currently receive special education services, it is possible to discern a distribution of responses across the range of correct responses. There are numbers of students beginning to show some evidence of understanding conservation of matter in a few contexts. In this case, COMA is an effective assessment instrument for
capturing evidence of student understanding.
0 1 2 3 4 5 6 7 8 9 10COMA Posttest--Number of Correct Responses
0
50
100
150
200
250
300
350
Num
ber o
f Stu
dent
s
7 21 20 20 13 14 8 10 8 2 9
Mean = 4.04Std. Dev. = 2.816N = 132
COMA Posttest—Number of Correct Responses (SPED Less than 15 Hours)
Some evidence No evidence Evidence with misconceptions Evidence of
understanding
0 1 2 3 4 5 6 7 8 9 10Number of Correct Responses
0
50
100
150
200
250
300
350
Num
ber o
f Stu
dent
s
11 13 13 15 14 6 5 5 1 1 7
Mean = 3.54Std. Dev. = 2.798N = 91
COMA Posttest—Number of Correct Responses (SPED More than 15 Hours)
Some evidence No evidence Evidence with misconceptions
Evidence of understanding
SCALE-uP 2004

Conservation of Matter Assessment Manual 51
Chapter 7 Making Use of the Diagnostic Qualities of COMA
Background on the Evolution of the Diagnostic Qualities of COMA
One of the goals of the collaboration between Project 2061 and SCALE-uP was to
explore techniques for getting more out of “testing” than only information about the correctness across a set of responses. Drawing from conceptual change theory, we believe that most students begin their conceptual learning with pre-conceptions that are altered through instruction, giving way to more scientifically accurate conceptions. This theoretical lens suggests that an assessment that accurately diagnoses the state of students’ knowledge ought to be useful in support of instruction. For example, a teacher’s knowledge of the state of a student or class’s understanding can be used for planning instruction, or planning remediation and future instruction. Our vision of instructionally supportive assessment requires that rating and scoring capture more than correctness. To this end, we created a rating process to code both the correct and incorrect responses. The coding scheme was presented in chapter 4.
Establishing the non-correct response categories entailed an interactive analytic process where the research literature and actual student responses were brought into alignment. First, recall that in chapter 2 we briefly discussed research on conservation of matter learning and identified a number of common conceptions held by students. For example:
• When something happens to an object (expanding), the same thing happens to the parts that make it up (atoms expanding).
• Weight is not conserved in a reaction in which gas is absorbed or evolved (especially invisible gases).
• Gas is not a substance and does not have weight. • Chemical changes involve the disappearance and appearance of
substances. • Volume is directly related to mass (more volume an object has, the greater
its mass). These misconceptions cited in the research stimulated awareness of students’ alternative conceptions and facilitated an analysis of the incorrect responses from students for the purpose of creating the additional rating categories. It was relatively easy to sort incorrect responses into categories of; blank or joking responses, attempted responses that were incomprehensible due to hand writing or language, and other non-correct responses. The later became the focus of attention for misconception coding and it quickly became clear that there were distinctions at the item level. In almost all cases there was evidence suggesting either a student believed matter was created leaving “more” or matter was destroyed leaving “less”. In the end, the coding of responses produce a profile for each students consisting of correct, more, less, incomprehensible and blank answers, telling a different story for each student and class.
Sample Results for Individual Students and Classrooms One use of the scoring profile is a case-by-case analysis of students. Consider three students receiving raw scores for correct responses of 1, 8 and 4 out of the 10-point total. Without any additional information, and using our expert panel cut scores for
SCALE-uP 2004
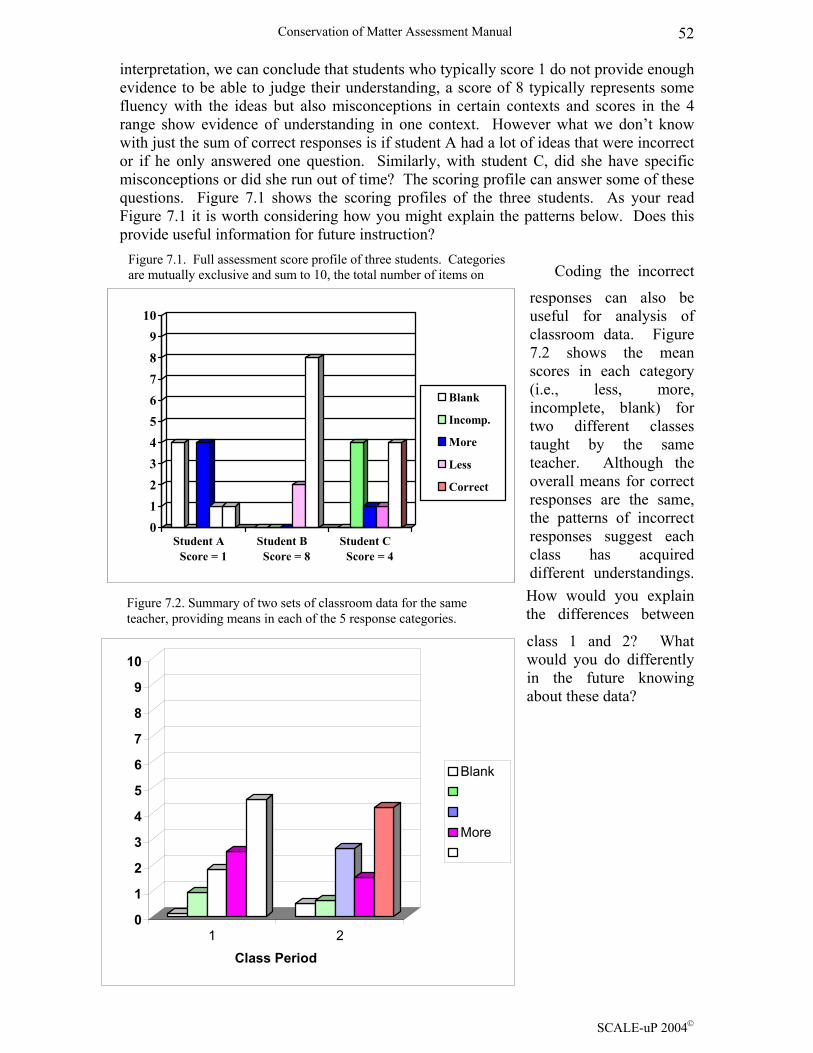
Conservation of Matter Assessment Manual 52
interpretation, we can conclude that students who typically score 1 do not provide enough evidence to be able to judge their understanding, a score of 8 typically represents some fluency with the ideas but also misconceptions in certain contexts and scores in the 4 range show evidence of understanding in one context. However what we don’t know with just the sum of correct responses is if student A had a lot of ideas that were incorrect or if he only answered one question. Similarly, with student C, did she have specific misconceptions or did she run out of time? The scoring profile can answer some of these questions. Figure 7.1 shows the scoring profiles of the three students. As your read Figure 7.1 it is worth considering how you might explain the patterns below. Does this provide useful information for future instruction?
Coding the incorrect
Figure 7.1. Full assessment score profile of three students. Categories are mutually exclusive and sum to 10, the total number of items on
Blank
More
responses can also be useful for analysis of classroom data. Figure 7.2 shows the mean scores in each category (i.e., less, more, incomplete, blank) for two different classes taught by the same teacher. Although the overall means for correct responses are the same, the patterns of incorrect responses suggest each class has acquired different understandings. How would you explain the differences between
class 1 and 2? What would you do differently in the future knowing about these data?
0123456789
10
Student A Score = 1
Student B Score = 8
Student C Score = 4
Incomp.
Less
Correct
IncompLess
Correct
0
1
2
3
4
5
6
7
8
9
10
1 2Class Period
Blank
More
Figure 7.2. Summary of two sets of classroom data for the same teacher, providing means in each of the 5 response categories.
SCALE-uP 2004

Conservation of Matter Assessment Manual 53
References
American Association for the Advancement of Science (AAAS). (1993). Benchmarks for science literacy. New York: Oxford University Press. AAAS. (2001). Atlas of science literacy. New York: Oxford University Press. AAAS. (2003a). Project 2061 analysis of science and mathematics assessment tasks. (manuscript in preparation). AAAS. (2003b). Project 2061 development of science and mathematics assessment tasks. (manuscript in preparation). Anastasi, A. & Urbina, S. (1997). Psychological testing. Prentice Hall: Upper Saddle River, NJ. Crocker, L. & Algina, J. (1986). Introduction to classical and modern test theory. Harcourt Brace Jovanovich College Publishers: New York. Driver, R., Guesne, E., & Tiberghien, A. (1985). Children’s ideas in science. Philadelphia, PA: Open University Press. Driver, R., Squires, A., Rushworth, P., & Wood-Robinson, V. (1994). Making sense of secondary science: Research into children’s ideas. London: Routledge. Gomez, M. Pozo, J., & Sanz, A. (1995). Students’ ideas on conservation of matter: Effects of expertise and context variables. Science Education, 79, 77-93. Hewson, P., & Hewson, M. (1984). The role of conceptual conflict in conceptual change and the design of science instruction. Instructional Science, 13, 1-13. Howell, D.C. (1997). Statistical methods for psychology. Belmont, CA: Wadsworth Publishing. Lee, O., Eichenger, D.C., Anderson, C.W., Berkheimer, G.D., Blakeslee, T.S. (1993). Changing middle school students’ conceptions of matter and molecules. Journal of Research in Science Teaching, 30, 249-270. Lynch, S., Kuipers, J., Pyke, C., & Szesze, M. (accepted for publication). Examining the effects of a highly rated science curriculum unit on diverse populations: Results from a planning grant. Article accepted for publication in the Journal of Research in Science Teaching, September, 2003. Mislevy, R.J. Steinberg, L.S. & Almond, R.G. (2003). Integrating substantive and statistical arguments in educational assessment. Measurement: Interdisciplinary Research and Perspectives, 1(1), 3-62. Novick, S. & Nussbaum, J. (1981). Pupils’ understanding of the particulate nature of matter: A cross age study. Science Education, 65, 187-196.
SCALE-uP 2004
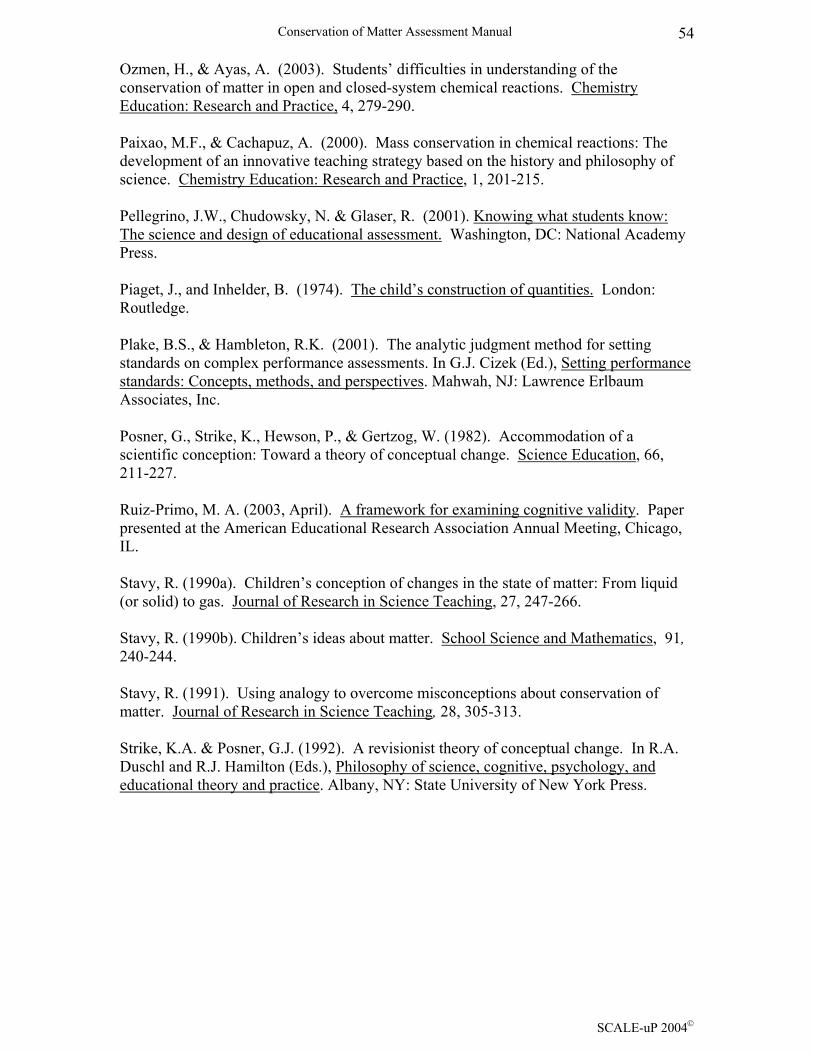
Conservation of Matter Assessment Manual 54
Ozmen, H., & Ayas, A. (2003). Students’ difficulties in understanding of the conservation of matter in open and closed-system chemical reactions. Chemistry Education: Research and Practice, 4, 279-290. Paixao, M.F., & Cachapuz, A. (2000). Mass conservation in chemical reactions: The development of an innovative teaching strategy based on the history and philosophy of science. Chemistry Education: Research and Practice, 1, 201-215. Pellegrino, J.W., Chudowsky, N. & Glaser, R. (2001). Knowing what students know: The science and design of educational assessment. Washington, DC: National Academy Press. Piaget, J., and Inhelder, B. (1974). The child’s construction of quantities. London: Routledge. Plake, B.S., & Hambleton, R.K. (2001). The analytic judgment method for setting standards on complex performance assessments. In G.J. Cizek (Ed.), Setting performance standards: Concepts, methods, and perspectives. Mahwah, NJ: Lawrence Erlbaum Associates, Inc. Posner, G., Strike, K., Hewson, P., & Gertzog, W. (1982). Accommodation of a scientific conception: Toward a theory of conceptual change. Science Education, 66, 211-227. Ruiz-Primo, M. A. (2003, April). A framework for examining cognitive validity. Paper presented at the American Educational Research Association Annual Meeting, Chicago, IL. Stavy, R. (1990a). Children’s conception of changes in the state of matter: From liquid (or solid) to gas. Journal of Research in Science Teaching, 27, 247-266. Stavy, R. (1990b). Children’s ideas about matter. School Science and Mathematics, 91, 240-244. Stavy, R. (1991). Using analogy to overcome misconceptions about conservation of matter. Journal of Research in Science Teaching, 28, 305-313. Strike, K.A. & Posner, G.J. (1992). A revisionist theory of conceptual change. In R.A. Duschl and R.J. Hamilton (Eds.), Philosophy of science, cognitive, psychology, and educational theory and practice. Albany, NY: State University of New York Press.
SCALE-uP 2004

Conservation of Matter Assessment Manual 55
Appendix A
The Conservation of Matter Assessment Map This appendix contains the assessment map, which shows how the conservation of matter ideas develop over time. It may be reproduced for teacher use.
SCALE-uP 2004

Conservation of Matter Assessment Manual 56
SCALE-uP 2004

57
Appendix B
The Complete Conservation of Matter Assessment
This appendix contains the complete Conservation of Matter Assessment as it is to be presented to students. This assessment may be duplicated for use by the teacher in their classroom. It is to be presented in front to back booklet format.
SCALE-uP 2004

58
SCALE-uP 2004

59
Date _______________ ID___________
Science Questions
Please write complete answers to the following questions about a scientific idea called conservation of matter.
When you answer these questions you should think about the idea
that everything in the world is made up of atoms or combinations of atoms.
Please describe what you know in as much detail as possible.
Thank you for answering these questions.
SCALE-uP 2004
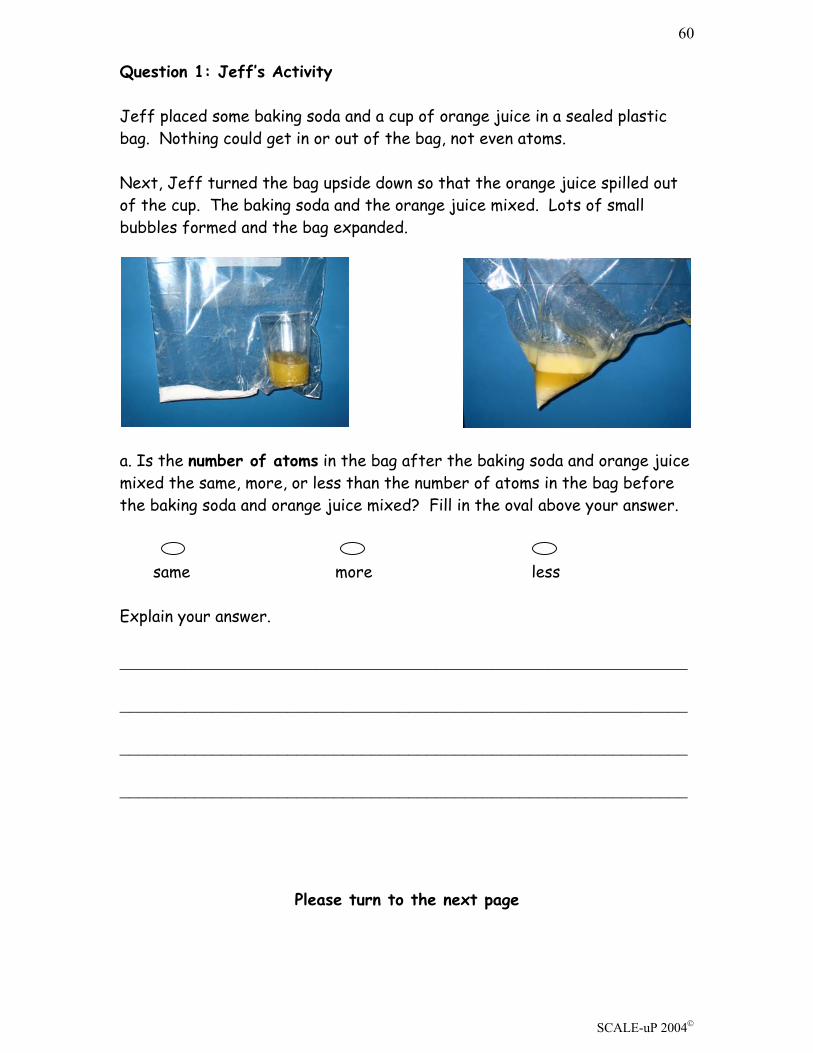
60
Question 1: Jeff’s Activity Jeff placed some baking soda and a cup of orange juice in a sealed plastic bag. Nothing could get in or out of the bag, not even atoms. Next, Jeff turned the bag upside down so that the orange juice spilled out of the cup. The baking soda and the orange juice mixed. Lots of small bubbles formed and the bag expanded. a. Is the number of atoms in the bag after the baking soda and orange juice mixed the same, more, or less than the number of atoms in the bag before the baking soda and orange juice mixed? Fill in the oval above your answer.
same more less Explain your answer. _____________________________________________________________ _____________________________________________________________ _____________________________________________________________ _____________________________________________________________
Please turn to the next page
SCALE-uP 2004
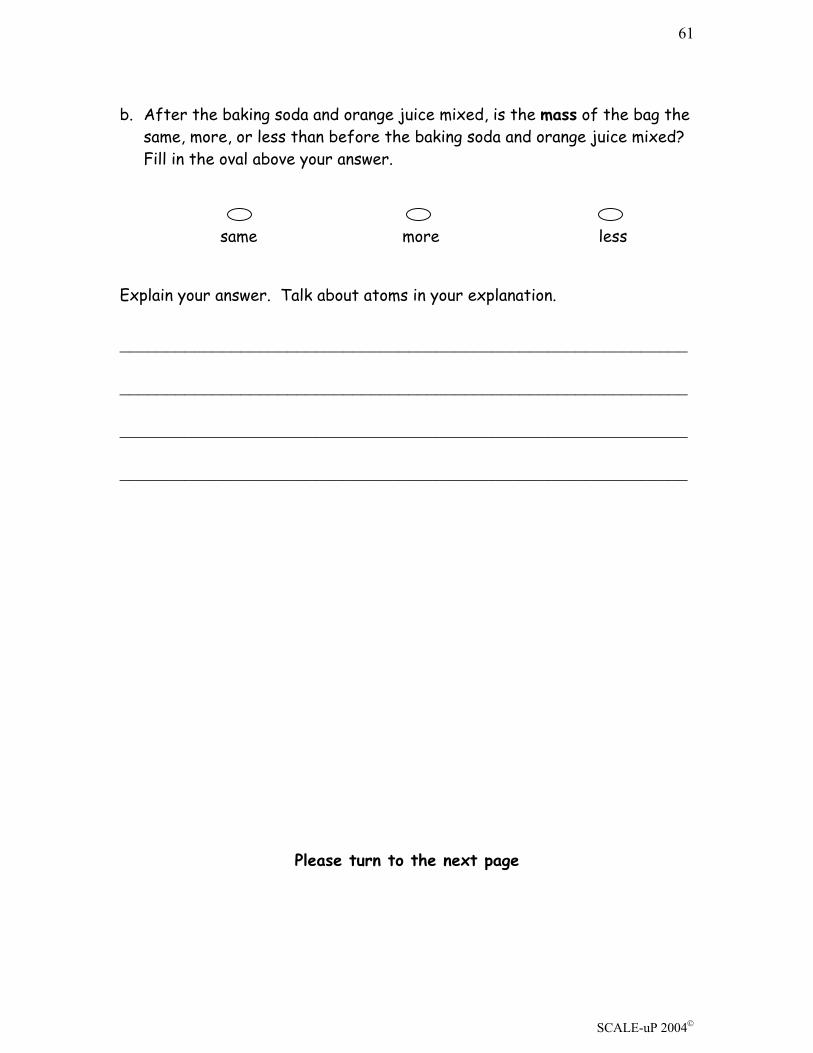
61
b. After the baking soda and orange juice mixed, is the mass of the bag the
same, more, or less than before the baking soda and orange juice mixed? Fill in the oval above your answer.
same more less
Explain your answer. Talk about atoms in your explanation. _____________________________________________________________ _____________________________________________________________ _____________________________________________________________ _____________________________________________________________
Please turn to the next page
SCALE-uP 2004
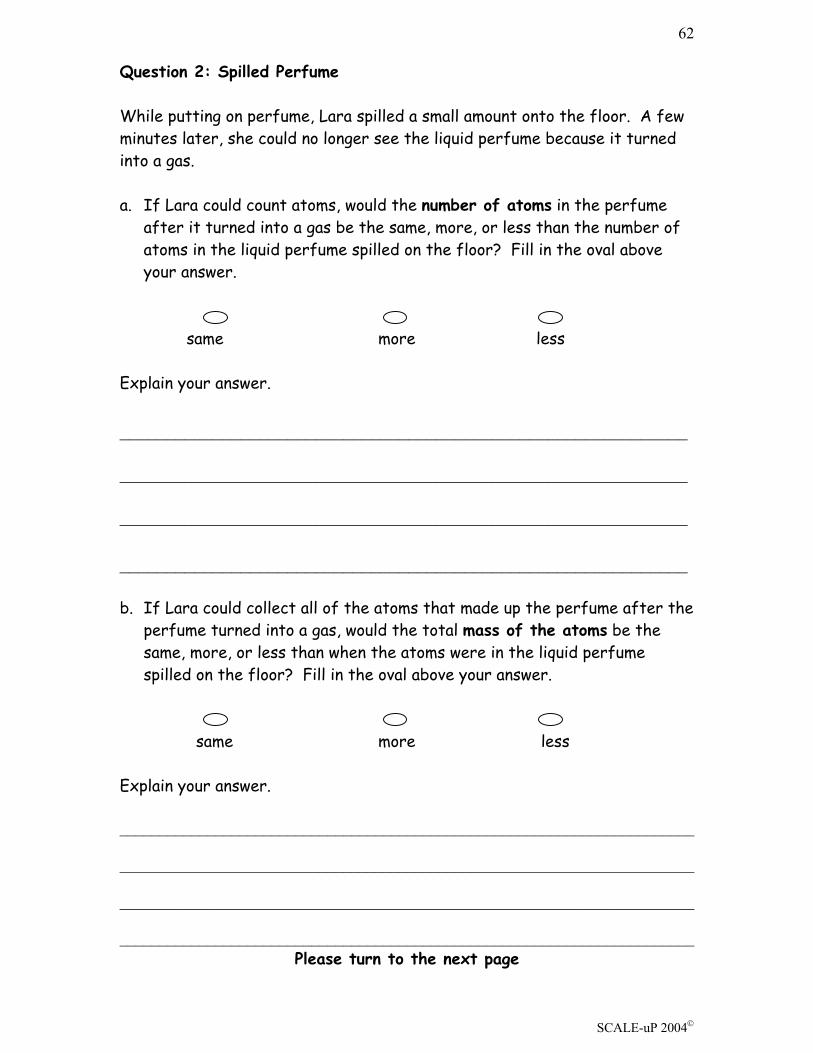
62
Question 2: Spilled Perfume While putting on perfume, Lara spilled a small amount onto the floor. A few minutes later, she could no longer see the liquid perfume because it turned into a gas. a. If Lara could count atoms, would the number of atoms in the perfume
after it turned into a gas be the same, more, or less than the number of atoms in the liquid perfume spilled on the floor? Fill in the oval above your answer.
same more less Explain your answer. _____________________________________________________________ _____________________________________________________________ _____________________________________________________________ _____________________________________________________________ b. If Lara could collect all of the atoms that made up the perfume after the
perfume turned into a gas, would the total mass of the atoms be the same, more, or less than when the atoms were in the liquid perfume spilled on the floor? Fill in the oval above your answer.
same more less
Explain your answer. ________________________________________________________________________ ________________________________________________________________________ ________________________________________________________________________ ________________________________________________________________________
Please turn to the next page
SCALE-uP 2004

63
Question 3: Burning Wood Kim burned some wood. When the wood stopped burning a pile of ash was left.
Burning Wood Ash Kim weighed the wood before it was burned. Then he weighed the ash. The ash weighed less than the wood. Kim wants to know why. Fill in the oval next to the best explanation. All the atoms from the wood are in the ash. The atoms did not
combine with anything else but got smaller and lighter when the wood burned.
Only some of the atoms from the wood are now in the ash. The rest of the atoms combined with atoms from the air and went into the air as a gas when the wood burned.
Only some of the atoms from the wood are in the ash. Some were
burned up and are no more. There are fewer atoms after the wood burned.
Please turn to the next page
SCALE-uP 2004

64
Question 4: Thermometer Maria took a thermometer outside on a very cold day. She weighed it. She brought the thermometer inside and after one hour weighed it again. See what happened below.
Outside Inside Fill in the oval next to the statement that best explains what she found. The thermometer weighed the same inside and outside because
nothing could get in or out of the thermometer. The thermometer weighed less inside than outside because inside
the thermometer was warmer and lighter. The thermometer weighed more inside than outside because inside
there was more liquid in the thermometer.
SCALE-uP 2004
65
Appendix C
Rating Guides and Rater Recording Form
This appendix contains materials for the rating and recording of student responses on COMA. These pages may be duplicated for use by the teacher.
SCALE-uP 2004
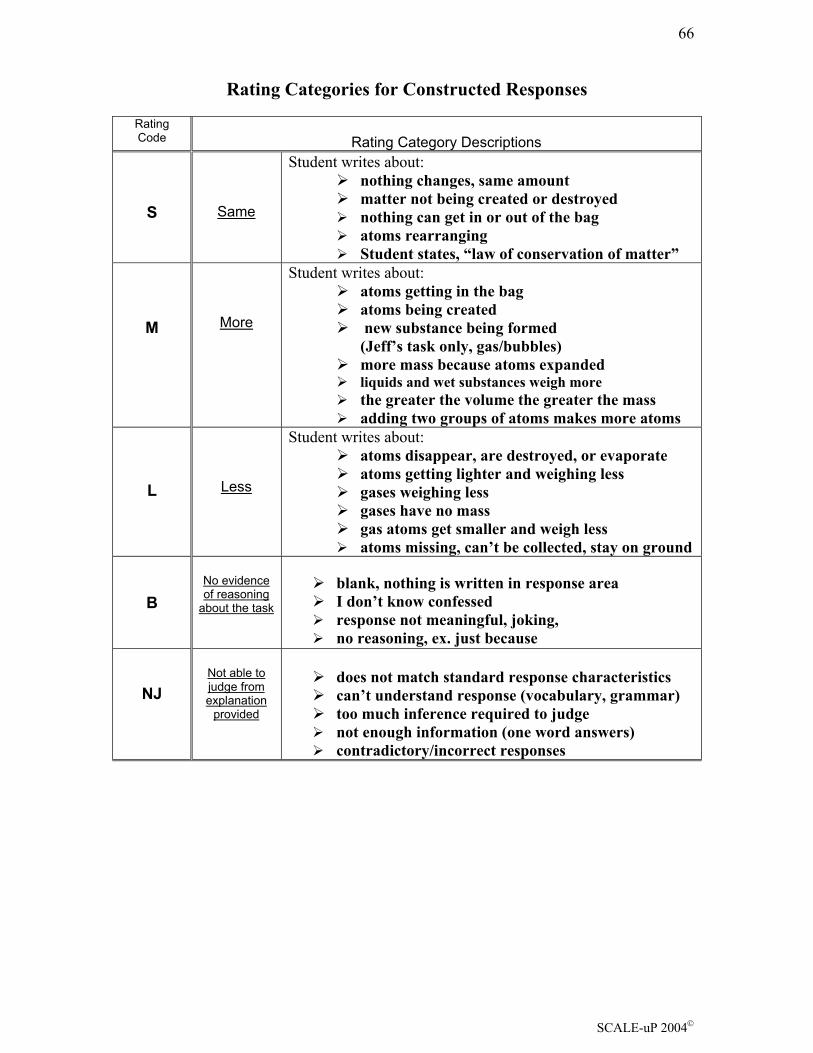
66
Rating Categories for Constructed Responses
Rating Code
Rating Category Descriptions
S
Same
Student writes about: nothing changes, same amount matter not being created or destroyed nothing can get in or out of the bag atoms rearranging Student states, “law of conservation of matter”
M
More
Student writes about: atoms getting in the bag atoms being created new substance being formed
(Jeff’s task only, gas/bubbles) more mass because atoms expanded liquids and wet substances weigh more the greater the volume the greater the mass adding two groups of atoms makes more atoms
L
Less
Student writes about: atoms disappear, are destroyed, or evaporate atoms getting lighter and weighing less gases weighing less gases have no mass gas atoms get smaller and weigh less atoms missing, can’t be collected, stay on ground
B
No evidence of reasoning
about the task
blank, nothing is written in response area I don’t know confessed response not meaningful, joking, no reasoning, ex. just because
NJ
Not able to judge from explanation
provided
does not match standard response characteristics can’t understand response (vocabulary, grammar) too much inference required to judge not enough information (one word answers) contradictory/incorrect responses
SCALE-uP 2004

67
Rating Guide for Burning Wood Selected Response
Rating Code
Student Response Rating Category Descriptions
L top is darkened Less
S middle is darkened Same
L bottom is darkened Less
B blank No Evidence
The Correct Response is Rating S.
Rating Guide for Thermometer Selected Response
Rating Code
Student Response Rating Category Descriptions
S top is darkened Same
L middle is darkened Less
M bottom is darkened More
B blank No Evidence
The Correct Response is Rating S.
SCALE-uP 2004
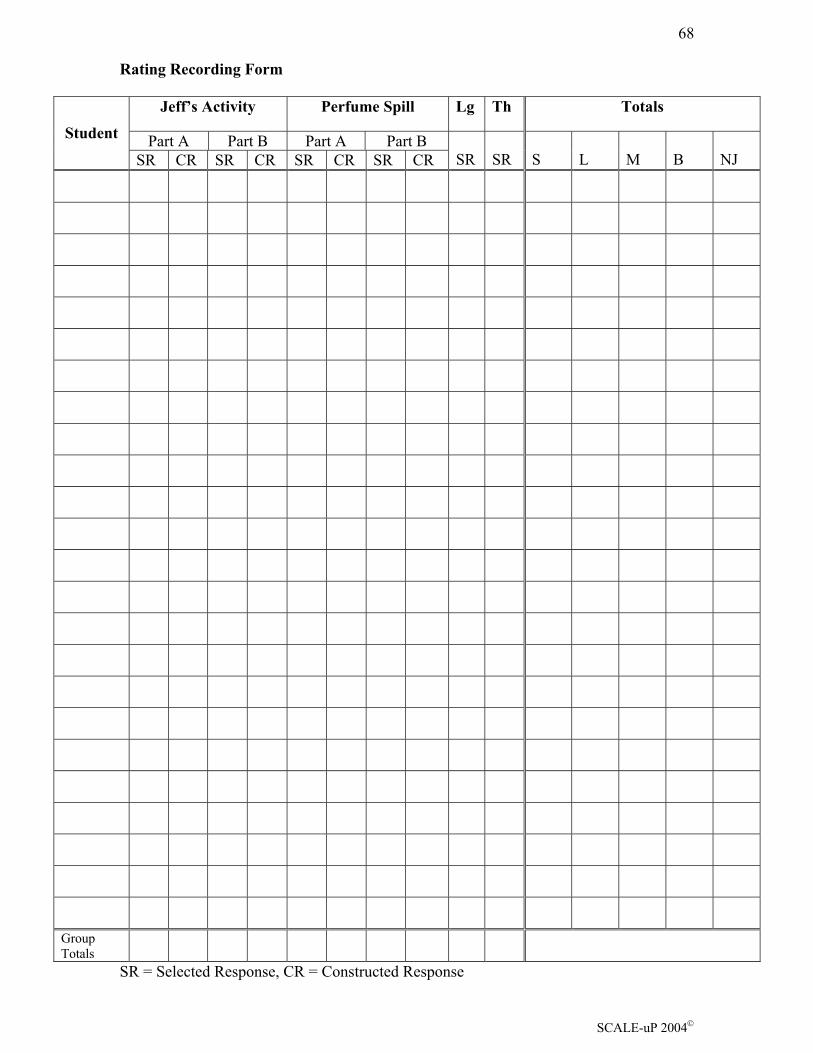
68
Rating Recording Form
Jeff’s Activity Perfume Spill Lg Th Totals
Part A Part B Part A Part B Student
SR CR SR CR SR CR SR CR SR
SR
S
L
M
B
NJ
Group Totals
SR = Selected Response, CR = Constructed Response
SCALE-uP 2004