consequences of feeder delays for the … using a case study of lufthansa german airline (lh) at...
TRANSCRIPT

Journal of Air Transportation Vol. 11, No. 1 -2006
CONSEQUENCES OF FEEDER DELAYS FOR THE SUCCESS OF A380 OPERATIONS
Jens Ruehle
University of Cologne
Bjoern Goetsch University of Cologne
Cologne, Germany
Benjamin Koch Lufthansa Consulting GmbH
Cologne, Germany
ABSTRACT Due to existing slot and infrastructure constraints at international hub-and-spoke airports, an increase in feeder traffic seems only possible if larger feeder aircraft are used. Using a case study of Lufthansa German Airlines at Frankfurt International Airport, three possible A380 routes (Beijing, Tokyo-Narita, Los Angeles) were examined to assess the extent to which delays of feeder traffic may impact the economic performance of very large aircraft. On the basis of today’s delays and anticipated traffic growth in the future, we found that between 9.5% and 13.5% of connecting passengers are unable to transfer to their respective intercontinental flights. In addition, the results demonstrate that a further increase in delays can be detrimental to the profitable operation of very large aircraft, as demonstrated by two out of three simulated routes. We suggest options for airlines operating very large aircraft to counteract the negative impacts of feeder delays.
_____________________________________________________________________________ Jens Ruehle studied Business Administration and majored in Strategic Management, Logistics, Controlling and Statistics in Cologne, Germany; Copenhagen, Denmark; and Vancouver, Canada. Since 2003, Ruehle has been a doctoral candidate, and research and teaching assistant at the Department of Business Policy and Logistics, University of Cologne Bjoern Goetsch studied Business Administration and majored in Strategic Management, Logistics, Finance and Transport Economics in Cologne, Germany; Helsinki, Finland; and Penn State, United States. Since December 2003, Goetsch has been a doctoral candidate, research and teaching assistant at the Department of Business Policy and Logistics, University of Cologne. Benjamin Koch studied Business Administration and majored in Strategic Management, Logistics, Corporate Finance and Public Finance in Cologne, Germany and St. Gallen, China. Since 2000, Koch has been a consultant with Lufthansa Consulting GmbH in Cologne, Germany, and since 2003 has been a doctoral candidate at the Department of Business Policy and Logistics, University of Cologne.
https://ntrs.nasa.gov/search.jsp?R=20060053392 2018-06-27T07:05:43+00:00Z

44 Journal of Air Transportation
INTRODUCTION
With the introduction of the A380, airlines need to fill a larger plane with more passengers to achieve profitability (Pilling, 2005a; Thompson, 2005a). Due to existing slot and infrastructure constraints at international hub-and-spoke airports, an increase in feeder traffic only seems possible if larger feeder aircraft are used. Delays of these larger aircraft and, thus the possibility of missing a connecting A380 flight, could impact profitability. Since traffic volume at secondary feeder airports and air route congestion are likely to increase, the risk of delays is expected to grow.
Recent research into delays in air transportation has identified: (a) reasons behind air traffic delays (Mayer & Sinai, 2003); (b) reasons behind airport delays (Hansen, 2002; Reynolds-Feighan & Button, 1999); (c) airline recovery policies (Rosenberger et al., 2002); and (d) implications for policymakers (Golaszewski, 2002). However, the impact of feeder delays on airline profitability has not been a prominent topic in the literature so far. We argue that for airlines operating very large aircraft, such as the A380 in a hub-and-spoke environment, the increasing level of air traffic delays may become a critical issue in terms of scheduling and profitability.
In this paper, we simulate the effects of feeder delays on A380 operations using a case study of Lufthansa German Airline (LH) at Frankfurt International Airport (FRA) to assess implications on load factors and profitability. Based on our findings, we suggest a set of possible countermeasures which may alleviate the negative effects of feeder delays.
THE ROLE OF FEEDER DELAYS FOR THE SUCCESS OF MEGA-CARRIER OPERATIONS
The hub-and-spoke philosophy To a large extent air traffic on intercontinental routes is organized
according to the hub-and-spoke system. Instead of having several point-to-point connections, a hub-and-spoke network is based on the idea of bundling. All connections are routed over the respective airline hub in order to bundle incoming and outgoing airline passengers and to reallocate them via the hub airport. This technique enables the airlines to cover significantly more markets with the same amount of flights than would be covered within a point-to-point network structure (Auerbach & Delfmann, 2005). In addition, a hub-and-spoke network leads to economies of scope and, consequently, to cost savings arising from increased load-factors between the hub-to-hub connections (Pompl, 2002). The downside of the hub-and-spoke philosophy is the higher complexity in terms of scheduling feeding flights to and connecting flights from the hub airport. Since incoming and outgoing
Ruehle, Goetsch and Koch 45
patterns at hubs are organized in highly complex and interdependent waves,1 the minimum connecting time (MCT) becomes a highly relevant issue. The MCT specifies the period of time that is allowable at the airport to transfer passengers and luggage between flights.2 Thus, incoming traffic which does not meet the MCT will not be available to fill the aircraft of the outgoing wave. Given this situation, it becomes obvious that major airline hubs rely heavily on punctual feeding traffic to be able to profitably organize their scheduled operations.
On most routes, the new Airbus A380 will require an efficiently operating hub-and-spoke network since the local traffic is insufficient to fill planes at profitable levels. The efficiency of such a hub-and-spoke system is challenged for two reasons: (a) massive increase in capacity through A380 operations, and (b) rising level of traffic delays. The combination of both factors will have negative impacts on A380 operations.
The capacity issue
Depending on the outlay, an A380 aircraft may provide 130 more seats than an average Boeing 747-400 aircraft.3 With a seating capacity of 550 seats and an average break-even load factor of 70%, 385 seats need to be filled in order to reach profitability. Thus, a load factor of 70% for the new mega-carrier A380 is equivalent to a 100% load factor of the current flagship, the B747-400, with about 390 seats.
A distinction can be made between three sources of additional passenger volume (in a hub-and-spoke network). The first and most likely option is the utilization of larger feeder aircraft coming from destinations with higher passenger potential (e.g., for the Frankfurt case from other major airports such as Amsterdam, Paris or Madrid). Thus, these origin and destination (O/D) pairs will become increasingly more important as they provide a larger percentage of feeding traffic to the hub. Consequently, a cancellation or delay of one of these major feeders causes a profitability problem for the airlines since a significant portion of passengers for the outgoing A380 aircraft is missing.
1 The term wave or bank describes the bundled incoming or outgoing traffic (i.e., group of flights), which is designed to allow for a seamless and efficient transfer between flights, whereas the combination of an incoming and the following outgoing wave is referred to as a complex (Holloway, 2003). 2 The minimum connecting time differs from airport to airport depending on various criteria such as airport layout, capacity, congestion levels, etc. (Hanlon, 1999). 3 See Pilling, 2005b, p. 44. Compared to the planned LH configuration with 550 seats (see Thompson, 2005b, p. 11) an A380 provides additional capacity for even 160 passengers.
46 Journal of Air Transportation
The second option would be to increase frequencies and, thus, to bring in a larger number of feeder flights before the departure of the mega carrier. The implications of this alternative are twofold. First, scheduling and coordination complexity increases as the new flights have to be linked with the overall schedule and the additional passenger and baggage volume must be handled accordingly. Second, the connectivity ratio4 decreases as the waiting time for those passengers who arrive in earlier waves becomes longer compared to the existing status quo. Probably the strongest arguments against this option are the existing slot scarcity and capacity constraints at major hub airports.
The last option would be to increase the catchment area of the respective hub, that is, its originating traffic. For example, FRA is trying to attract more passengers by linking the airport to the German high-speed train network. This seems to be a very reasonable option as the originating traffic is usually less vulnerable to punctuality issues. However, this option leads to a significant financial investment compared to its observable impact on passenger numbers.
Due to the problems described above, airlines at major hub airports will probably need to rely on the option of larger aircraft to feed their flights.
Effects of air traffic delays on airline profitability
Accurate data on delays became widely available in the late 1990s when the Central Office for Delay Analysis (CODA) at EUROCONTROL was established. CODA publishes monthly delay reports.5 However, the available data does not reveal a clear long-term trend as the statistics have been strongly influenced by various external factors.6 Referring to the data from the past two years—which can be considered as being relatively unbiased—there is strong evidence that the level of delays will increase in the future. Compared to 2003 the average delay per movement (ADM) used as an indicator for the overall level of delays, increased by 4.9% to 10.4 minutes for arrivals in 2004 (CODA, 2004). The data from the first eight
4 The connectivity ratio refers to “the degree to which linkages are more than purely random” at hub airports (Doganis, 2002, p. 258). 5 These reports are mainly based on data reported by the Association of European Airlines, by the Central Flow Management Units at EUROCONTROL, and by the International Air Transport Association (IATA). 6 Among these effects was the Balkan war in 1998/99 which contributed to a significant increase in air traffic delays due to severe military action in Europe (+29.2% in 1999). In contrast, other incidents with global implications such as the terrorist attacks in 2001 (-27.0% in 2002), and the SARS epidemic in 2003 (-7.0% in 2003) which lead to a major decrease in air traffic delays since the overall traffic volume decreased drastically.

Ruehle, Goetsch and Koch 47
months of 2005 shows an ADM of 10.8 minutes for arrivals, which represent an increase of 3.8% compared to 2004 (CODA, 2005).
Each passenger who misses a connecting flight due to delays of feeding aircraft reduces the profit of an airline.7 In the worst case scenario, the number of delayed passengers is so high that the outgoing aircraft does not reach its break-even load factor.8
In summary, the combination of both the capacity increase due to the introduction of the A380 and the increasing level of flight delays have significant effects on the overall profitability of airline operations. Although not all of the described effects are unique to the A380 case, the mega carrier takes the stated problem areas into another dimension compared to the B747 level.
SAMPLING AND RESEARCH DESIGN
The data Lufthansa German Airlines at Frankfurt International Airport as a case study
LH is the largest carrier in Germany and one of the leading carriers in Europe. With a total order volume of 15 A380 as of 2005, LH is currently the second most important customer for the new Airbus A380—topped only by Emirates Airlines of Dubai. LH’s main home base is FRA in Germany, Continental Europe’s largest airport. In 2004, FRA served over 51 million passengers, handled about 1.8 million tons of cargo and operated approximately 480,000 aircraft movements. It currently ranks number seven among the world’s largest passenger airports and is one of the world’s most important intercontinental hubs. This traffic was achieved with the help of a three runway system.9 FRA is operating almost entirely at congestion levels, which makes it one of the most slot constrained airports in Europe.
7 Experts already claim that due to the high level of delays a reliable operation of European hubs cannot be ensured (Klingenberg, 2001). 8 The respective no-show passenger due to feeder delays leads to compensation payments and reduces the number of available seats on later flights to the respective destination. 9 Of the currently available three runways one is only open for take-offs, which results in bottlenecks during peak-hours for landing aircraft. The construction of a fourth runway, which would be open only for landings, has been slowed-down by long-term political and security discussions.

48 Journal of Air Transportation
The demand data A selection of the most probable routes has been chosen on which LH
plans to operate the A380.10 For these routes historic demand figures were analyzed and projected for the first year of permanent operation of the A380 in 2008.
The data set was mainly compiled from booking data from the airline Global Distribution Systems, which was then adjusted with various correction factors to account for missing bookings (e.g., own sales of the airline) as well as for itineraries not flown. These calibration processes resulted in true passenger demand figures for 2004, the total being approximately 73,000 passengers. All analyses were performed on a true O/D basis. A total of 4,587 itineraries were considered. All data was analyzed for a typical week, that is, a week that did not show specific peaks or off-peaks due to major sports events, vacation traffic or holiday downturns. Weekday specific variations were balanced out by including all traffic days and by not neglecting the typically higher (e.g., Monday) or lower (e.g., Thursday) traffic days.
Demand for 2008 was forecasted by applying country-related specific forecasts to each sector covered in the data set. Thus, the current IATA international passenger forecasts were applied to each single relation (e.g., Germany-to-Japan or South Africa-to-United States), resulting in a calculated demand for each relation.11 The result is a forecast demand table for the potential A380 routes, reflecting not only the expected future traffic development of the German market, but also of each respective single country-to-country market. In total, 1,188 country pairs were analyzed and projected to 2008 demand levels, resulting in a total demand of about 90,000 passengers for the sample week.
The supply data
For the selected routes an evaluation of the current LH operating patterns was performed. Also, for a set of 8 routes—covering several Asian and North American destinations, as well as Johannesburg—a deeper analysis was performed covering several weeks in 2004. Thus, the past passenger numbers on the specific flights were evaluated to again verify the general demand data generated in an earlier step. This made it possible to determine real load factors during the research period, which have been used to develop possible operating patterns for 2008. We presuppose that the
10 Currently, about 15-20 potential destinations are being discussed as potential A380 destinations from FRA. These include airports in Asia, the Middle East, North America and South Africa. 11 For those country pairs that were not covered in the IATA forecast, an average growth rate for the respective regions was applied.

Ruehle, Goetsch and Koch 49
current load factors are a benchmark which will also be reached by the A380.
We discuss the results of our study for three of those eight routes, namely FRA-to-Beijing Capital International Airport (PEK), FRA-to-Tokyo Narita International Airport (NRT) and FRA-to-Los Angeles International Airport (LAX). These destinations do not only represent routes to different geographical regions, they are also representative of fast developing markets such as East Asia and China as well as the more saturated North American market, and are therefore the best examples for further discussion within the context of this paper. Based on the previous findings, several potential operating patterns were evaluated, using typical service patterns as a basis and the identified past seat load factors.
Table 1. Case study base data, Lufthansa German Airlines at Frankfurt International Airport (FRA) to three destinations
Number of itineraries considered 4,587
Number of country pairs analyzed and projected to 2008 1,188
Total number of feeder origin airports 166
Total number of analyzed feeder flights 97,035
To Beijing Capital International Airport (PEK):
To Tokyo-Narita International Airport (NRT):
To Los Angeles International Airport (LAX):
15,678
17,892
16,039
To distribute the forecasted passenger demand—which in our case study
accounts for the demand of a total week—amongst a specific number of flights within this week, it was necessary to define the operational pattern for the destinations in question. This allows us to evaluate respective load factors and the profitability situation of each single flight.
It was assumed that any operation below 7/7 (daily flights) would be inadequate, while any pattern above 14/7 (twice daily) for the A380 seemed unrealistic. Additionally, patterns of 10/7 and 12/7 were analyzed, both of which reflect typical standard operational models in the industry. A 12/7 pattern reflects daily flights accompanied by second flights each working day, while the 10/7 operational pattern consists of a daily flight along with a second flight every other weekday. For these calculations, the expected capacity of the A380 of 550 in the standard LH layout was used.12
12 It is important to realize that five A380 flights account for the same number of capacity offered per week as a daily B747-400 flight with 390 seats per flight. Thus, from a capacity point of view the 12/7 scenario is equivalent in terms of offered
50 Journal of Air Transportation
A scenario combining two A380 flights on peak days with one A380 flight and one B747-400 flight on low-demand days has not been considered due to the operational complexity and costs of such an operational pattern. The flight deck and cabin crews do not usually hold the type rating for such different aircraft types but operate either the Boeing or the Airbus fleet. A mixed operation based on an alternation of both aircraft types therefore results in the need to account for longer layovers for the crews at the destination and thus considerably higher crew costs. These are accompanied by the need to provide technical crews and spare parts for both aircraft types at each destination—directly or indirectly by using partner companies. Nevertheless, both approaches of guaranteeing reliable operations from the technical point of view result in additional costs. In sum, the mentioned facts seem to make a mixed operation an unfavorable option which has therefore been disregarded in our analyses.
Based on the current operations as offered by LH on the FRA-to-PEK and FRA-to-NRT routes, we feel that the 12/7 pattern of A380 operations is the preferred option for analyzing the situation in 2008. The generated demand figures for 2008, reflecting the high-growth markets in South-East Asia, support that decision. For FRA-to-LAX, one of the gateways to the far more saturated North American air transport market, a 7/7 operational pattern was considered, offering a single daily A380 flight.
The delay data
While the route specific traffic forecasts are a means of identifying potential A380 markets, this study focuses on an analysis of the impact of delays of feeder flights on the success of such operations. Thus, to provide a basis for our scenarios a comprehensive analysis of past delays at FRA was undertaken. All relevant feeder flights, identified in the booking data as linking the true origins of the passengers with FRA, were selected for the year 2004. For the three chosen destinations, a total of 166 origin airports had to be considered, leading to a total of 97,035 flights from these airports to FRA in 2004. For those flights the respective actual delays for each single day of the year were collected.
Only those flights which had a scheduled arrival time of between 2 hours and 45 minutes before the scheduled time of departure of the long-haul flight were selected for our simulation. The total number of feeder flights relevant for these analyses was 15,678 for FRA-to-PEK, 16,039 for FRA-to-LAX and 17,892 for FRA-to-NRT. We assume that existing waves and bank patterns will also be kept for the introduction of the A380. We also assume that it will be possible to maintain the current minimum connecting time of
capacity to the combination of a daily A380 flight with a daily B747-400 flight on the same route or the currently used 14/7 pattern employing B747-400.
Ruehle, Goetsch and Koch 51
45 minutes at FRA and that every itinerary including a missed connection time of more than 2 hours is not likely to experience critical delays in terms of missed connections.13 If a feeder connection had more than one feeding flight, we thus attributed 50% of the respective passengers to the last arriving feeder flight. The remaining 50% were equally distributed between the earlier flights.
A distinction can be made between two classes of feeder flights. The first class is typical short- and medium-haul flights within Germany and Europe, of up to 2.5 hours of total flying time. These account for the majority of feeder flights in any typical hub structure. The second class is intercontinental feeder flights. These long-haul flights serve passengers who have to transfer at the hub between two intercontinental flights, thus only remaining on the European continent for a change of aircraft, for example, a connection from Dubai-to-LAX. Table 2 summarizes the data taken into account for our analyses.
However, the descriptive data also reveals that the proportion of simulated feeder passengers differs for the selected destinations. While 92.2% (FRA-to-PEK) and 83.9% (FRA-to-NRT) of all feeder passengers are included in the simulation, for the FRA-to-LAX connection only 68.5% of the feeder passengers will be simulated. This shows that a large percentage of passengers connecting to LAX arrive at FRA early enough to allow for delays of their respective feeder aircraft, thus they do not miss connecting flights. Hence, it can be expected that the FRA-to-LAX flight tends to be less affected by profitability problems which may arise due to feeder delays.
The results are previous punctuality patterns for each feeder flight within 2 hours and the minimum connecting time before the A380 departure for the three selected routes. Together with the demand data which was developed earlier, these results form the basis of our scenarios for the evaluation of changes in the delay situation and their impact on the operations of the A380. Differentiating between level 1 (non-coordinated airport), level 2 (schedules facilitated airport), and level 3 (fully coordinated airport) airports,14 our analysis shows varying levels of delays for feeders coming from these destinations. We see an ADM of 9.96 minutes for level 1, 9.32 minutes for level 2, and 12.13 minutes for level 3 airports, that is, the
13 Experience shows, that almost 95% of all flights are booked from the first screen on the computer reservation systems, which are arranged by total travel time. With longer transit times at hub airports, the flights switch to the following screen pages and thus are more unlikely to be booked. 14 The basis for our classification is the structure used by IATA in their World Scheduling Guidelines. Thus, we distinguish between fully coordinated (level 3), schedule facilitated (level 2) and non coordinated (level 1) airports. See IATA, 2005.

52 Journal of Air Transportation
delays at hub airports (level 3) are 2.17 and 2.81 minutes higher compared to lower level airports, respectively.
Table 2. Descriptive data of chosen flights analyzed for case study: Lufthansa German Airlines at Frankfurt International Airport (FRA) to 3 destinations
FRA-to-Beijing Capital
International Airport (PEK)
FRA-to-Tokyo-Narita International
Airport (NRT)
FRA-to-Los Angeles
International Airport (LAX)
Passengers per week 5214.7 5369.6 3142.8
Chosen operating patterns 12/7 12/7 7/7
Envisaged load factor 79.0 % 81.4 % 81.6 %
Percentage of connecting passengers 55.1 % 63.1 % 63.2 %
Total feeder passengers 239.29 282.22 283.72
Simulated feeder passengers 220.60 236.81 194.47
Proportion of simulated feeder passengers
92.2% 83.9% 68.5%
Number of simulated feeding flights 164 171 146
Time of departure 4:20 pm 11:45 am 11:30 am
The simulation model The number of transported passengers for each A380 flight is the sum of
all connecting passengers arriving prior to a specified minimum connecting time of 45 minutes and the passengers originating at the hub airport. The past delays are incorporated into the model by constructing empirical delay distributions. Our model uses these empirical delay distributions and attempts to determine whether feeder flights transfer their respective connecting passengers to one single A380 flight, the same being repeated for j simulation runs with j=1,…..,M. We then calculate the difference between the potential transferring passengers and the average simulated amount of passengers boarding the A380 as well as the percentage of simulated flights not reaching the break-even load factor.
Each feeder flight is scheduled to arrive at a particular time hi of the day, with i=1,…,N representing the set of feeder flights.15 The number of connecting passengers pi is deterministic, derived as described in the
15 Arrival times were taken from current schedules, which are timed to feed the current B747-400 operations on the routes analyzed.

Ruehle, Goetsch and Koch 53
paragraph above. Frequencies for A380 legs were determined by comparing total traffic demand per week with resulting estimated load factors of a chosen frequency, as well as with current frequency levels of B747-400 operations. This led to the aforementioned operating pattern of 12 flights per week to the Asian destinations (PEK and NRT) analyzed and a daily flight to LAX.
Given a departure time HA380 for one A380 operation, we can then calculate individual cut-off times ti in minutes for each feeder flight after its scheduled arrival time:
iAi hHt −−= )45( 380 . (1)
We introduce the delay time jid , which represents the number of minutes feeder flight i arrives after its scheduled arrival time hi at run j with j = 1,…..,M and 0, Ν∈jid . We assume that delays jid , are independent of each other. Thus we can define an index variable for each feeder flight,
⎩⎨⎧
>≤
=iji
ijiji td
tdy
,
,, 0
1 (2)
giving us connecting passengers pi if iji td ≤, , or resulting in the loss of
connection, if iji td >, . As delay times vary significantly for each feeder flight depending on
the airport of origin (hub, secondary, regional) and stage length, we find different empirical distributions )~(~
ii dF , with id~ as the observed past delays for each feeder carrier i. These were then transferred into discrete empirical distribution functions to facilitate further programming. Class width was chosen to be 5 minutes and total number of classes is 21. The upper limit of 120 minutes of delay was set for the last class as well as the larger class width of 25 minutes to represent an upper bound.
We use the Monte Carlo simulation to make inferences about the number of people reaching the specified A380 at one single flight by simulating a random number ui,j, which is uniformly distributed between [0, 1]:
]1,0[,1,1 ,....., Uuu MjNiji ←==== (3) and gives us the simulated delay time

54 Journal of Air Transportation
jijii duF ,,1 ˆ)(~ =− (4)
for any feeder flight i for run j. Hence, the number of passengers which reaches the specified A380 flight at one single run j:
)(ˆ1
,380 ∑
=
⋅=N
ijii
Aj ypp (5)
The number of simulated runs M was chosen to be 5000 to gain robust results for the A380 distribution, which resulted in
)()(ˆ~)ˆ,.....,ˆ( 380380380
5000380
1AASimAA pFpFpp ≈ (6)
for each destination.
This approach simulates the status quo delay scenario with today’s delay patterns when applied to feeders with forecasted passenger numbers. However, this does not incorporate an expected further tightening of the congestion situation, due to airport and air route congestion which will ultimately result in higher delays for feeder carriers. Therefore we assume different growth rates for the different classified IATA types of airports. Adjustments to the empirical delay distributions were performed as depicted in Table 3.
Table 3. Adjustments to the empirical delay distributions for the different classified types of airports
Scenario Fully Coordinated
Airports (Level 3)
Schedules Facilitated Airports
(Level 2)
Non Coordinated Airports (Level 1)
Status Quo Current status Current status Current status
Most likely + 4 minutes / flight + 2 minutes / flight Current status
Worst Case + 8 minutes / flight + 4 minutes / flight + 2 minutes / flight
For example, past observations of d~ for Paris Charles de Gaulle (CDG)
airport, a level 3 airport, were adjusted in the most likely scenario by adding 4 minutes to each observation CDGd~ . This, in turn, leads to a right-hand shift of the empirical density functions for each feeder. This approach is an attempt to adjust the assumed growth rates of congestion at different types of airports which ultimately leads to a further delay of the feeder to the A380 outgoing airport. The most likely scenario shows our hypothesis for 2008

Ruehle, Goetsch and Koch 55
under the assumption that no policy changes and/or schedule measures are made. The worst case scenario is fairly unrealistic, as it is merely supposed to represent the ultimate upper limit.
The exact figures in table 3 are based on the following logic: Extrapolating the last available full year ADM data16 to 2008 with a yearly increase of the aforementioned 4.9%, we would arrive at 12.6 minutes of ADM for arrivals. Compared to the figures from 2004 (10.4 minutes ADM), this represents an absolute increase of around 2 minutes per flight by 2008. This figure is indicated in the table for level 2 airports as the most likely scenario. Based on the aforementioned findings another 2 minutes of delay per flight were added for level 3 airports (i.e,. 4 minutes in total) since hub airports tend to show higher levels of delays. These additional 2 minutes for hubs are fully consistent with the results of the study by Mayer & Sinai (2003) which indicate a range of 1.5 to 4.5 minutes of extra delays per arriving flight at hub airports.17
The most important analysis in respect to profitability is to test the percentage of flights which are not filled above the break-even load factors. As described above we suggest break-even load factors for A380 operations to be in the region of 70% or 385 passengers respectively. Therefore the percentage of unprofitable flights is:
M
pc
M
jp
Aj A
j∑=
<Ι⋅
= 1385ˆ
380
1
380
ˆ (7)
with 0020⎪⎩
⎪⎨⎧
≥<
=Ι385ˆ0385ˆ1
380
380
Aj
Aj
pp
Furthermore, we calculate the average percentage of passengers missing
their A380 flight:
16 Calculations are based on CODA Annual Report 2004. It expels 10.4 minutes ADM for arrivals which represents an increase of 4.9% compared to 2003 (CODA, 2004). 17 Although the study is mainly based on US domestic traffic data, there is evidence that the findings are at least in tendency applicable to European feeder networks.
56 Journal of Air Transportation
∑
∑∑
=
=
=−= N
ii
N
i
M
j
Aj
i
p
M
pp
c
1
1
1
380
2
ˆ
ˆ (8)
The average load factor (L) for the A380 is:
M
pL
M
j
Aj∑
=
⋅= 1
380 550ˆˆ (9)
RESULTS
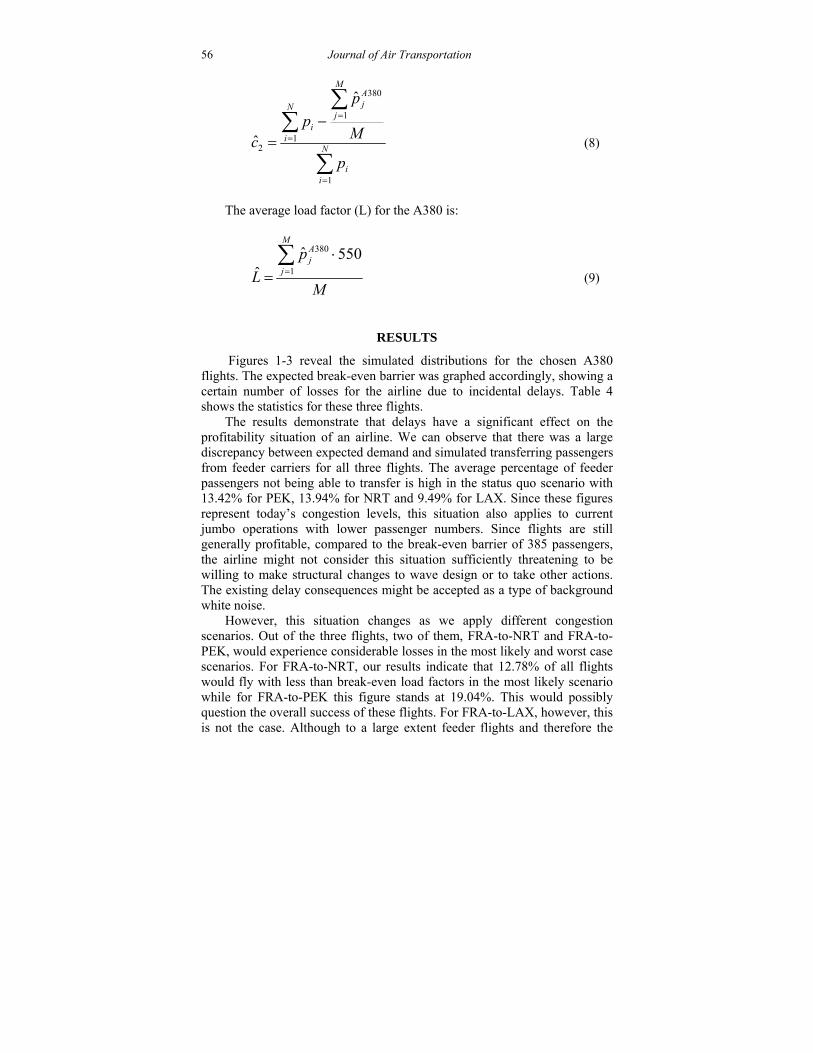
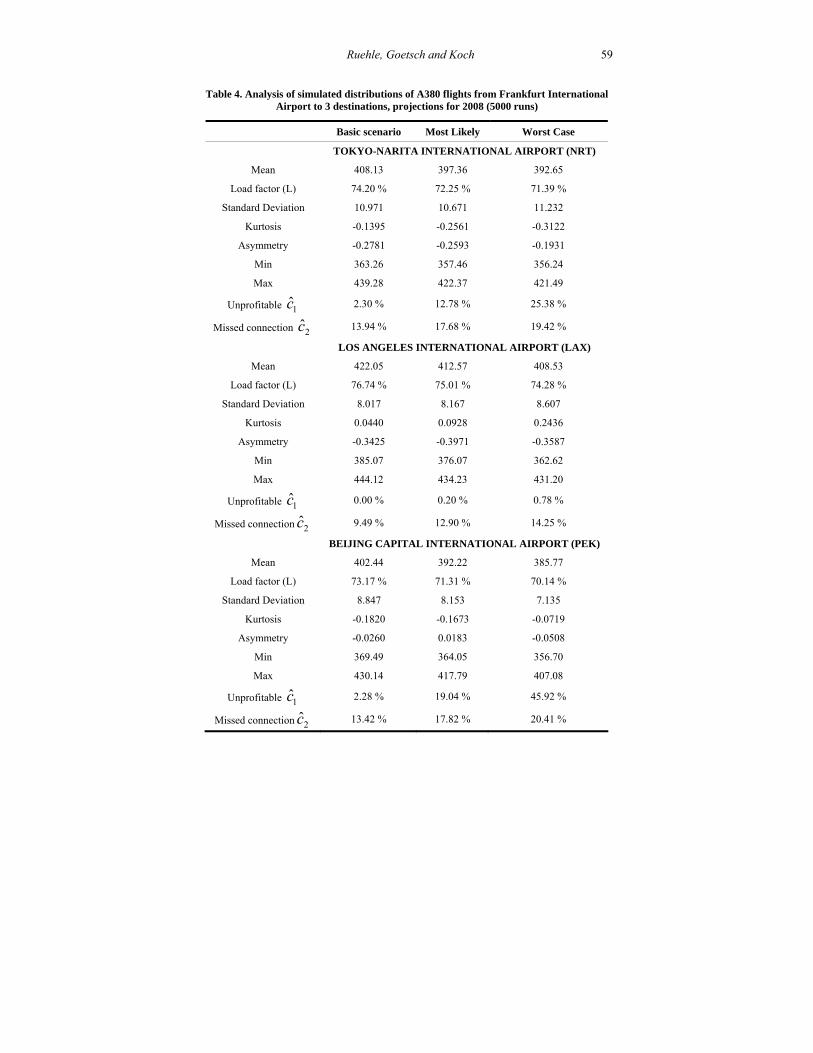
Figures 1-3 reveal the simulated distributions for the chosen A380 flights. The expected break-even barrier was graphed accordingly, showing a certain number of losses for the airline due to incidental delays. Table 4 shows the statistics for these three flights.
The results demonstrate that delays have a significant effect on the profitability situation of an airline. We can observe that there was a large discrepancy between expected demand and simulated transferring passengers from feeder carriers for all three flights. The average percentage of feeder passengers not being able to transfer is high in the status quo scenario with 13.42% for PEK, 13.94% for NRT and 9.49% for LAX. Since these figures represent today’s congestion levels, this situation also applies to current jumbo operations with lower passenger numbers. Since flights are still generally profitable, compared to the break-even barrier of 385 passengers, the airline might not consider this situation sufficiently threatening to be willing to make structural changes to wave design or to take other actions. The existing delay consequences might be accepted as a type of background white noise.
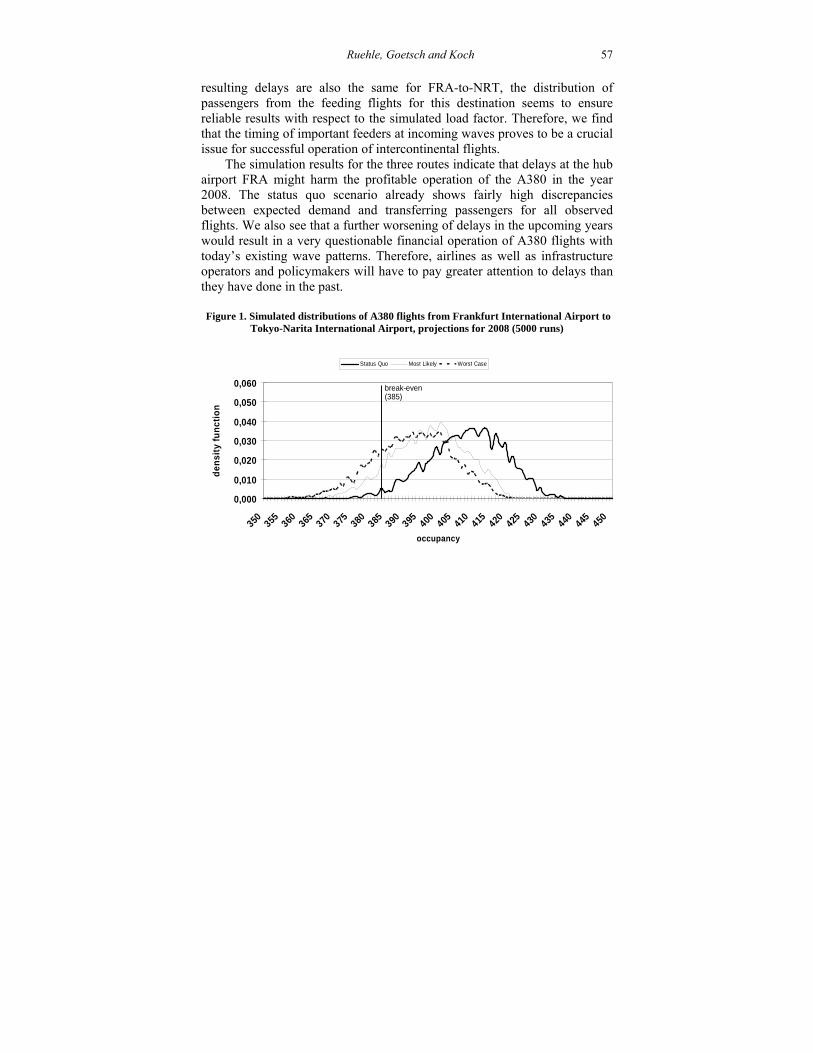
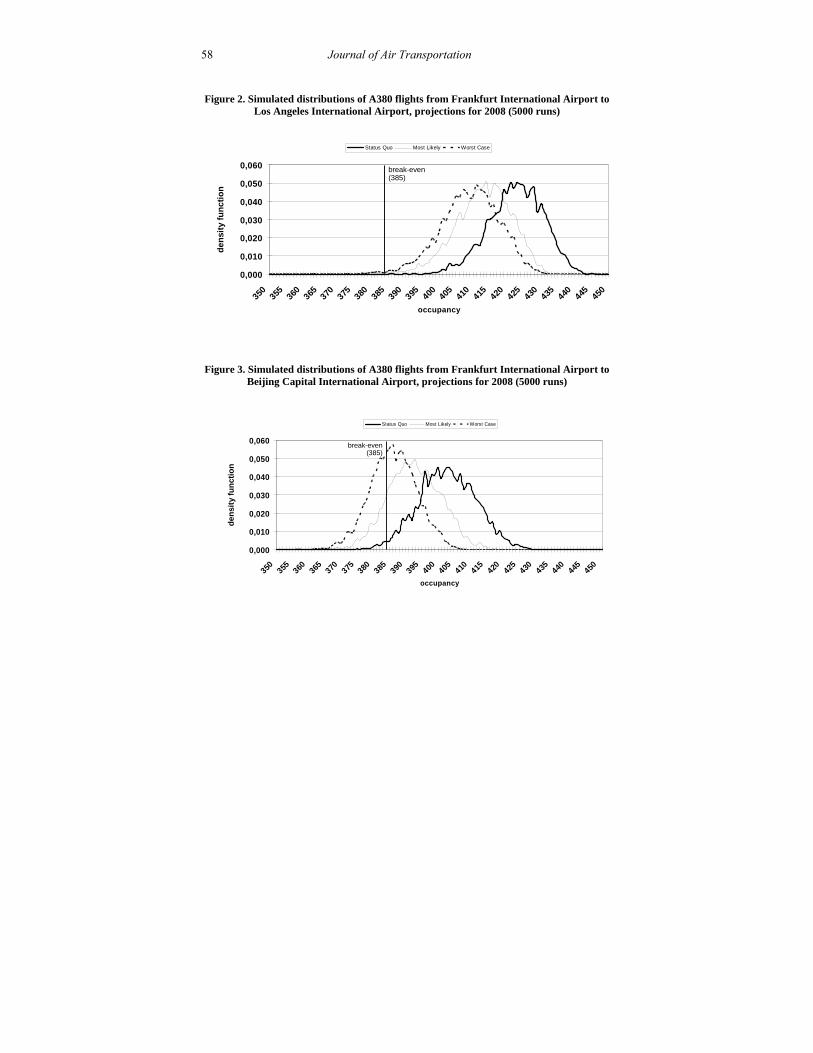
However, this situation changes as we apply different congestion scenarios. Out of the three flights, two of them, FRA-to-NRT and FRA-to-PEK, would experience considerable losses in the most likely and worst case scenarios. For FRA-to-NRT, our results indicate that 12.78% of all flights would fly with less than break-even load factors in the most likely scenario while for FRA-to-PEK this figure stands at 19.04%. This would possibly question the overall success of these flights. For FRA-to-LAX, however, this is not the case. Although to a large extent feeder flights and therefore the
Ruehle, Goetsch and Koch 57
resulting delays are also the same for FRA-to-NRT, the distribution of passengers from the feeding flights for this destination seems to ensure reliable results with respect to the simulated load factor. Therefore, we find that the timing of important feeders at incoming waves proves to be a crucial issue for successful operation of intercontinental flights.
The simulation results for the three routes indicate that delays at the hub airport FRA might harm the profitable operation of the A380 in the year 2008. The status quo scenario already shows fairly high discrepancies between expected demand and transferring passengers for all observed flights. We also see that a further worsening of delays in the upcoming years would result in a very questionable financial operation of A380 flights with today’s existing wave patterns. Therefore, airlines as well as infrastructure operators and policymakers will have to pay greater attention to delays than they have done in the past.
Figure 1. Simulated distributions of A380 flights from Frankfurt International Airport to Tokyo-Narita International Airport, projections for 2008 (5000 runs)
0,000
0,010
0,020
0,030
0,040
0,050
0,060
350 355 360 365 370 375 380 385 390 395 400 405 410 415 420 425 430 435 440 445 450
occupancy
Status Quo Most Likely Worst Case
break-even (385)
dens
ity fu
nctio
n
58 Journal of Air Transportation
Figure 2. Simulated distributions of A380 flights from Frankfurt International Airport to Los Angeles International Airport, projections for 2008 (5000 runs)
Figure 3. Simulated distributions of A380 flights from Frankfurt International Airport to Beijing Capital International Airport, projections for 2008 (5000 runs)
0,000
0,010
0,020
0,030
0,040
0,050
0,060
350
355
360
365
370
375
380
385
390
395
400
405
410
415
420
425
430
435
440
445
450
occupancy
Status Quo Most Likely Worst Case
break-even (385)
dens
ity fu
nctio
n
0,000
0,010
0,020
0,030
0,040
0,050
0,060
350
355
360
365
370
375
380
385
390
395
400
405
410
415
420
425
430
435
440
445
450
occupancy
Status Quo Most Likely Worst Case
break-even(385)
dens
ity fu
nctio
n
Ruehle, Goetsch and Koch 59
Table 4. Analysis of simulated distributions of A380 flights from Frankfurt International Airport to 3 destinations, projections for 2008 (5000 runs)
Basic scenario Most Likely Worst Case
TOKYO-NARITA INTERNATIONAL AIRPORT (NRT)
Mean 408.13 397.36 392.65
Load factor (L) 74.20 % 72.25 % 71.39 %
Standard Deviation 10.971 10.671 11.232
Kurtosis -0.1395 -0.2561 -0.3122
Asymmetry -0.2781 -0.2593 -0.1931
Min 363.26 357.46 356.24
Max 439.28 422.37 421.49
Unprofitable 1c 2.30 % 12.78 % 25.38 %
Missed connection 2c 13.94 % 17.68 % 19.42 %
LOS ANGELES INTERNATIONAL AIRPORT (LAX)
Mean 422.05 412.57 408.53
Load factor (L) 76.74 % 75.01 % 74.28 %
Standard Deviation 8.017 8.167 8.607
Kurtosis 0.0440 0.0928 0.2436
Asymmetry -0.3425 -0.3971 -0.3587
Min 385.07 376.07 362.62
Max 444.12 434.23 431.20
Unprofitable 1c 0.00 % 0.20 % 0.78 %
Missed connection 2c 9.49 % 12.90 % 14.25 %
BEIJING CAPITAL INTERNATIONAL AIRPORT (PEK)
Mean 402.44 392.22 385.77
Load factor (L) 73.17 % 71.31 % 70.14 %
Standard Deviation 8.847 8.153 7.135
Kurtosis -0.1820 -0.1673 -0.0719
Asymmetry -0.0260 0.0183 -0.0508
Min 369.49 364.05 356.70
Max 430.14 417.79 407.08
Unprofitable 1c 2.28 % 19.04 % 45.92 %
Missed connection 2c 13.42 % 17.82 % 20.41 %

60 Journal of Air Transportation
DISCUSSION
Implications for further research In order to counteract the significant effects of air traffic delays, we
suggest several domains of action. Some aim to reduce the impact of delays on airline operations and others aim to reduce the delays themselves.
The first option would be to improve the schedule so as to make it more resilient to delays, that is, reducing the direct implications of delays on the hub-and-spoke operations. This could be accomplished by spreading the feeder traffic. A disadvantage of this measure, however, is the increase in travel time for preferred flights and thus a possible loss of demand.
Slot swaps of feeder flights could also provide substantial improvements. It is important here to know which flights could be shifted within the current wave pattern. Going back to the empirical results, we can observe different delay distributions for each feeder flight. One possible solution would be to pre-schedule those feeder flights which are delayed in most cases but which are also important due to their feeding passenger volume. Another solution could be to reschedule the departure of the A380. These solutions obviously depend on slot availability at the origin airport as well as at the destination airports.
Airlines can also try to shift feeding traffic to alternative modes of transportation that is usually not affected by air traffic delays, although close cooperation with the involved airports is necessary. LH’s AIRail approach can serve as a prime example (Fakiner, 2005).
A different approach to mitigating the delay issue is to reduce delays themselves. Critics of the air traffic control system claim that its current capacity shortage is responsible for the dramatic delay situation. They demand a coordinated European solution to the problem. In 2004, however, airlines were also responsible for a certain share of the delays recorded by CODA. Possible solutions are streamlining the operations and the relocation of hub activities to less congested airports (e.g., LH established Munich as secondary hub besides its primary anchor FRA).18 Finally, the airports might need to invest in additional terminal and runway capacity to enable them to handle additional passengers in the future. Although regulatory restrictions in most European countries hinder the introduction of innovative methods to use existing capacity more efficiently (e.g., alternative slot allocation schemes), all involved parties need to address this issue intensively.
Irrespective of the problems caused by delays, the deployment of large feeder aircraft to meet the additional demand generated by the A380, in particular, causes further problems for airports and airlines. Both need to
18 Problems associated with this option are a lower number of transfer passengers at the primary hub and in many cases lower yields at the secondary hub.
Ruehle, Goetsch and Koch 61
ensure the compliance with the minimum connecting time despite increased passenger volumes. Moreover, this strategy requires the airlines to invest in larger feeder aircraft or to cooperate more closely with feeder airlines operating adequate aircraft. Considering these additional financial investments as well as the increased bargaining power of related feeder airlines, it may turn out that operating an A380 is associated with some hidden costs which also need to be taken into account.
Given the problems of hub-and-spoke systems introduced here, we have to ask whether the original hub-and-spoke model is still the adequate type of network structure for intercontinental airline operations. By subjecting the A380 to the financial test, it is revealed that the A380 requires quite favorable conditions for its profitability.
Limitations
Our method might be criticised for disregarding the correlation between the delays of feeder flights. In reality, however, it is likely that the delay of one flight has an impact on subsequent flights.
Furthermore, bad weather conditions are likely to result in delays for the entire feeder wave. This limitation had to be taken into account, however, as available data did not make it possible to compare delays of the same days and thus the ability to adjust the correlations in the distribution. Moreover, we see a limitation in the missing translation of empirical distributions into inferential distributions. However, the elimination of outliers would not play a significant role here.
CONCLUSION
We used the case study of LH at FRA to simulate the consequences of feeder delays for the success of the new mega airplane A380 which will fly from FRA as early as 2008. As a first step, we took today’s wave patterns of jumbo operations and applied demand forecasts for each O/D pair to the chosen destinations. Our simulation of A380 load factors was then based on past delay distributions for relevant feeders.
The results demonstrate that delays are extremely detrimental to the profitable operation of the A380 since a fairly high percentage of feeder carriers do not arrive on time to transfer their connecting passengers. We indicated that the status quo delay scenario might not be considered so harmful to the airline as the flights are usually operated above break-even load factors. Our analysis, however, revealed that a further increase of delays would result not only in a significant loss of profitability but could also threaten overall profitability for two of the three simulated routes. Thus, LH would have to reconsider their current scheduling pattern to take into account possible escalation of flight delays in the future.

62 Journal of Air Transportation
We suggested two main options with which the airline may counteract these developments. First, a spread of feeder operations, which would, in turn, result in an increase in overall travel time. Second, a close monitoring of feeder delays could lead to rescheduling options within the existing wave patterns. The latter option is particularly relevant to voluminous feeder flights likely to experience delays on a regular basis.
Further research might broaden the context of this study by explicitly examining possible consumer and competitor responses and changes in market demand due to a change of pricing structures with the introduction of the A380.
In conclusion, delays seem to be one of the major issues which will concern the airline industry in the future; not only for airlines operating large hub-and-spoke systems but also for infrastructure operators and policymakers. Since the introduction of the A380 is imminent, pre-emptive action from all participants is required.
ACKNOWLEDGMENTS The authors wish to thank David Gillen, Peter Forsyth, Sascha Albers,
Jadran Dobric, and Werner Delfmann for their invaluable comments. Finally, the reviewers and the editor helped tighten the focus of this final draft considerably. Any errors or shortcomings in the paper, however, remain our responsibility.
REFERENCES Auerbach, S. & Delfmann, W. (2005). Consolidating the network carrier business
model in the European airline industry. In Delfmann, W.; Baum, H.; Auerbach, S. & Albers, S. (Eds.), Strategic management in the aviation industry (pp. 65-97). London, Aldershot: Ashgate.
CODA. (2004). 2004 annual report. Retrieved from http://www.eurocontrol.int/ecoda/portal.
CODA. (2005, August). Monthly delay report, August. Retrieved from http://www.eurocontrol.int/ecoda/portal.
Doganis, R. (2002). Flying off course. London, New York: Routledge.
Fakiner, H. G. (2005). The role of intermodal transportation in airport management. In Delfmann, W.; Baum, H.; Auerbach, S. & Albers, S. (Eds.), Strategic management in the aviation industry (pp. 427-451). London, Aldershot: Ashgate.
Golaszewski, R. (2002). Reforming air traffic control: An assessment from the American perspective. Journal of Air Transport Management, 8(1), 3-11.
Ruehle, Goetsch and Koch 63
Hanlon, P. (1999). Global airlines—competition in a transnational industry. Oxford: Butterworth Heinemann.
Hansen, M. (2002). Micro-level analysis of airport delay externalities using deterministic queuing models: A case study. Journal of Air Transport Management, 8(2), 73-87.
Holloway, S. (2003). Straight and level: Practical airline economics. London, Aldershot: Ashgate.
IATA. (2005). World scheduling guidelines, 11th ed., Montreal, Geneva: International Air Transport Association.
Klingenberg, C. (2001). Die Forderungen der Fluggesellschaften an eine effektive europäische Flugsicherung der kommenden Jahre. Deutsche Verkehrswissenschaftliche Gesellschaft (DVWG): 8. Luftverkehrsforum der DVWG (B 239): Die europäische Flugsicherung – auf Dauer ein Problem des Luftverkehrs? (pp. 36-41).
Mayer, C. & Sinai, T. (2003). Network effects, congestion externalities, and air traffic delays: Or why not all delays are evil. The American Economic Review, 93(4), 1194-1215.
Pilling, M. (2005a). Feeding time. A380—A flight group special report, June 2005, Surrey: Reed Business Information Ltd., 20-22.
Pilling, M. (2005b). On a roll. Airline Business, 21(4), 44-51.
Pompl, W. (2002). Luftverkehr—eine ökonomische und politische Einführung. Berlin, Heidelberg, New York et al.: Springer.
Reynolds-Feighan, A. J., & Button, K. J. (1999). An assessment of the capacity and congestion levels at European airports. Journal of Air Transport Management, 5(3), 113-134.
Rosenberger, J.M.; Schaefer, A.J.; Goldsman, D.; Johnson, E.L.; Kleywegt, A.J. & Nemhauser, G.L. (2002). A stochastic model of airline operations. Transportation Science, 36(4), 357-377.
Thompson, J. (2005a). Show down. Airline Business, 21(5), 6-47.
Thompson, J. (2005b). Airlines reveal A380 plans. Airline Business, 21(2), 11.