connection investigations for cold-formed steel modular...
TRANSCRIPT

Connection Investigations for Cold-Formed
Steel Modular Building Structure Systems
by
HANWEN ZHANG
A thesis submitted to the
University of Birmingham
for the degree of
DOCTOR OF PHILOSOPHY
Department of Civil Engineering
School of Engineering
College of Engineering and Physical Sciences
University of Birmingham
October 2017

University of Birmingham Research Archive
e-theses repository This unpublished thesis/dissertation is copyright of the author and/or third parties. The intellectual property rights of the author or third parties in respect of this work are as defined by The Copyright Designs and Patents Act 1988 or as modified by any successor legislation. Any use made of information contained in this thesis/dissertation must be in accordance with that legislation and must be properly acknowledged. Further distribution or reproduction in any format is prohibited without the permission of the copyright holder.

I
ABSTRACT
Modular construction is a kind of construction that is prefabricated off-site and easily
assembled on site. Because of its advantages, such as high efficiency and productivity,
modular buildings are widely used for hotel, residential, school and shop buildings. Cold-
formed steel (CFS) with its advantages of high strength-to-weight ratio is commonly utilised
in the modular constructions. The benefits brought by this kind of structure are prominent and
reflected in aspects of technology development, economy and sustainability.
The construction industrialisation promoted construction innovation. The integrated
pipeline production process of each module can provide good standardisation and quality
control. It lowers down the construction cost and saves building cost due to the economics of
scale and the reduced construction timescale. The application of recyclable materials reduces
environmental pollution. However, problems of modular construction are also presented. The
challenge comes about due to the connections, as generally consume a substantial part of the
expenditure. An easy erection and effective connection method could considerably achieve a
great cost saving. The investigations for CFS modular structure and connections have been
carried out since 1980‟s. As the types of connections and fasteners between components or
units become more complex and diversified nowadays, current codes and standards cannot
cover the connection configuration and precision requirements in design.
To investigate and improve the structural behaviours of connections employed in CFS
modular building constructions, the unsolved issues in connections of off-site CFS modular
building structures were identified in this thesis. The research investigated the connections in
the CFS modular panel structure through experimental, analytical and numerical methods
including the behaviours of the purlin-to-sheeting, stud-to-track and joist-to-post connections.
In the CFS roof system, purlin sections are often attached to the corrugated steel sheet by self-
drilling screws. The magnitude of the rotational stiffness of the purlin-to-sheeting connection

II
affects the load carrying capacity of the purlin. The current prediction does not provide
appreciated accuracy. Off-site CFS modular structures are often organised by thin-walled
galvanized stud and track section components. The structural behaviour differences are
mainly derived from steel material properties, connections and dimensions of the members.
However, due to the limitation of the component dimensions and manufacture tolerance, gaps
may exist between the connected sheets. This clearance may lead to warping in the early
stages, and may impact the structural behaviour of the connection. The response of the stud-
to-track connection is also determined by the connecting method. Progressive collapse of CFS
structures has been concerned and specified in the General Service Administration (GSA)
guidelines and the Department of Defense (DoD) guidelines. In the structure, the load transfer
path can be changed due to the removal of the structural components through potential beam
action and catenary action. The alternative loading will be imposed on the connections in a
certain range. Considering high strength material (S550) applied in modular structure and
complex loading conditions, it is necessary to analyse the entire structural behaviour of the
connections, and find out the most efficient and effective connecting method as well as the
reasonable fasteners.
A finite element (FE) model was developed which made a good agreement with the numerical
results. Based on the numerical studies, a modified calculation method for the rotational
stiffness of purlin-to-sheeting connection was proposed in this thesis. This study carried out
parametric studies to figure out the influence of the variables on stud-to-track connection
performance. A comparison was also conducted between single-bolted connections and
double-screwed connections applied in the CFS structure. In order to investigate and improve
the performance of the connection between panels under normal and abnormal loading
conditions, this research intends to predict the responses of screwed connection with high
strength materials under combined loadings. A comparative study of joining solutions was
rendered. In this investigation, a series of tests about screw joints under pure and mixed
loading scenarios were conducted. The results of a well-established FE model present a great
accordance with the test outcomes. The connection configurations applied in CFS panel

III
system with high strength material were introduced in this research. The screw joint
properties were employed in the simulation of the proposed connection configurations. It was
proved that the new connecting methods can provide a great improvement to the structural
behaviour under either normal or abnormal loading conditions.
Keywords CFS structures; off-site modular building; high strength material; connection
configuration; fasteners; stiffness and strength; screwed connection

IV
ACKNOWLEDGEMENTS
First of all, I would like to express my sincere gratitude to Prof. Charalampos Baniotopoulos
for his continues support, encouragement and supervision during my PhD study. He is more
than a supervisor. His enthusiasm in life and expertise in the research field have set the great
example for me to learn from.
I express my deepest appreciation to Dr. Jian Yang for his supervision throughout my PhD
study. He has provided expert guidance and a number of opportunities to improve myself.
With his assistance, I have won the Student Development Scholarship during my research
period. The thesis would not have been possible to be completed without his valuable
suggestions and persistent support.
I am indebted to Dr. Pedro Martinez-Vazquez, Dr. Yingang Du and Dr. Marios Theofanous
for their constructive suggestions and advices for the thesis.
I am also grateful to my friends and colleagues for providing help to me in study and life,
particularly to Feiliang Wang and Zijun Li who have kindly assisted me completing the
experimental work and paperwork issues.
My thanks to the Department of Civil Engineering, School of Engineering, University of
Birmingham and School of Naval Architecture, Ocean and Civil Engineering, Shanghai Jiao
Tong University, for providing support for assistance, facilities and supports throughout the
research.
Finally, I would like to extend my heartfelt thanks to my family. Their love, understanding
and caring have always encourage me to continue moving forward.

V
TABLE OF CONTENTS
ABSTRACT ................................................................................................................................ I
ACKNOWLEDGEMENTS ..................................................................................................... IV
TABLE OF CONTENTS .......................................................................................................... V
LIST OF FIGURES ................................................................................................................... X
LIST OF TABLES .............................................................................................................. XVII
LIST OF ABBREVIATIONS ............................................................................................... XIX
CHAPTER 1 INTRODUCTION ............................................................................................ 1
1.1 Introduction .................................................................................................................. 1
1.1.1 Containers ............................................................................................................. 3
1.1.2 CFS panel system ................................................................................................. 4
1.1.3 Plate-column system ............................................................................................. 5
1.1.4 Frame structure cassettes ...................................................................................... 6
1.1.5 Connections .......................................................................................................... 7
1.2 Novelty ......................................................................................................................... 8
1.3 Aim and objectives ...................................................................................................... 9
1.4 Methodology .............................................................................................................. 10
1.5 Outline of thesis ......................................................................................................... 10
1.6 Summary .................................................................................................................... 11
CHAPTER 2 LITERATURE REVIEW ............................................................................... 12
2.1 Introduction ................................................................................................................ 12
2.2 Modular construction ................................................................................................. 12
2.2.1 Technology development ................................................................................... 14
2.2.2 Economic benefits .............................................................................................. 18
2.2.3 Sustainability ...................................................................................................... 19

VI
2.2.4 Society ................................................................................................................ 20
2.3 Purlin-to-sheeting system .......................................................................................... 21
2.4 Joints and connections ............................................................................................... 23
2.4.1 Experimental studies .......................................................................................... 23
2.4.2 Numerical studies ............................................................................................... 31
2.4.3 Theoretical studies .............................................................................................. 33
2.5 Construction robustness ............................................................................................. 38
2.5.1 Research status ................................................................................................... 38
2.5.2 Load redistribution mechanism .......................................................................... 41
2.5.3 Design method .................................................................................................... 45
2.6 Knowledge gaps ......................................................................................................... 54
2.6.1 Purlin-to-sheeting system ................................................................................... 54
2.6.2 Stud-to-track connection..................................................................................... 55
2.6.3 Screw and bolt joints .......................................................................................... 55
2.6.4 Joist-to-post connection ...................................................................................... 56
2.6.5 Robustness of CFS modular structure ................................................................ 56
2.7 Summary .................................................................................................................... 57
CHAPTER 3 PURLIN-TO-SHEETING CONNECTION ................................................... 58
3.1 Introduction ................................................................................................................ 58
3.2 Experimental and analytical studies........................................................................... 59
3.2.1 Laboratory tests .................................................................................................. 59
3.2.2 Analytical design approach in EC3 .................................................................... 61
3.3 Numerical approach ................................................................................................... 65
3.3.1 Modelling process .............................................................................................. 65
3.3.2 Result discussions ............................................................................................... 66
3.3.3 Parametric studies ............................................................................................... 71
3.4 Modification approach ............................................................................................... 75
3.5 Summary .................................................................................................................... 78

VII
CHAPTER 4 STUD-TO-TRACK CONNECTION ............................................................. 80
4.1 Introduction ................................................................................................................ 80
4.1.1 Bolted connection ............................................................................................... 80
4.1.2 Screwed connection ............................................................................................ 81
4.1.3 Welded connection ............................................................................................. 82
4.1.4 Other connections ............................................................................................... 83
4.2 Specimens of connection ........................................................................................... 84
4.3 Modelling process ...................................................................................................... 86
4.3.1 Material properties .............................................................................................. 86
4.3.2 Loading and boundary conditions ...................................................................... 87
4.3.3 Constraint and Interaction properties ................................................................. 87
4.3.4 Solution scheme .................................................................................................. 88
4.3.5 Element type and meshing .................................................................................. 89
4.4 Sensitivity .................................................................................................................. 90
4.5 Results ........................................................................................................................ 91
4.6 Parametric study ........................................................................................................ 95
4.7 Summary .................................................................................................................... 98
CHAPTER 5 EXPERIMENTAL STUDY OF SCREW JOINTS ........................................ 99
5.1 Introduction ................................................................................................................ 99
5.2 Experimental study .................................................................................................... 99
5.2.1 Test program ....................................................................................................... 99
5.2.2 Test specimens and set-up ................................................................................ 100
5.2.3 Test procedure .................................................................................................. 105
5.2.4 Test results ........................................................................................................ 107
5.2.5 Discussion and analysis .................................................................................... 118
5.3 Numerical analysis and validation ........................................................................... 125
5.3.1 Modelling development .................................................................................... 125
5.3.2 Numerical results .............................................................................................. 128

VIII
5.4 Summary .................................................................................................................. 135
CHAPTER 6 CONNECTION BETWEEN MODULAR PANELS ................................... 136
6.1 Introduction .............................................................................................................. 136
6.1 Connection investigation ......................................................................................... 136
6.1.1 Connection configurations ................................................................................ 136
6.1.2 Theoretical analysis .......................................................................................... 140
6.1.3 Numerical analysis ........................................................................................... 144
6.2 Robustness investigation .......................................................................................... 158
6.2.1 Cantilever and beam action of floor panels ...................................................... 159
6.2.2 Nonlinear catenary action analysis ................................................................... 165
6.3 Summary .................................................................................................................. 175
CHAPTER 7 CONCLUSIONS AND FUTURE WORKS ................................................. 177
7.1 Introduction .............................................................................................................. 177
7.2 Contributions and conclusions ................................................................................. 177
7.2.1 Benefits and challenges of CFS modular building constructions ..................... 177
7.2.2 Investigation on purlin-to-sheeting connections............................................... 177
7.2.3 Investigation on screwed and bolted connections ............................................ 178
7.2.4 Investigation on the connection behaviour between modular panels ............... 179
7.3 Limitations and future works ................................................................................... 181
7.4 Summary .................................................................................................................. 182
Appendix I .............................................................................................................................. 183
Appendix II ............................................................................................................................. 185
Appendix III ........................................................................................................................... 186
Appendix IV ........................................................................................................................... 188
Appendix V ............................................................................................................................ 190
Appendix VI ........................................................................................................................... 193
Appendix VII .......................................................................................................................... 196

IX
Appendix VIII ........................................................................................................................ 197
Appendix IX ........................................................................................................................... 199
REFERENCES ....................................................................................................................... 201

X
LIST OF FIGURES
Figure 1-1 Off-site CFS modular building constructions (SCI., 2006) ...................................... 1
Figure 1-2 Modular panel configurations (From Rautaruukki Corporation) ............................. 2
Figure 1-3 Container structure unit ............................................................................................ 4
Figure 1-4 Modular wall panel (From The Modular Home) ...................................................... 5
Figure 1-5 Interconnection of boxes ........................................................................................... 6
Figure 1-6 Light steel keel structure box sketch ........................................................................ 6
Figure 1-7 Interconnection of boxes ........................................................................................... 7
Figure 2-1 Typical arrangements of modules (Lawson et al., 2012) ........................................ 16
Figure 2-2 Buckling models of CFS section ............................................................................ 22
Figure 2-3 Schematic diagram of press join (Pedreschi et al., 1997) ....................................... 25
Figure 2-4 Rosette joint (Mӓkelӓinen and Kesti, 1999) ........................................................... 25
Figure 2-5 Details of connection configurations (Chung and Lawson, 2000) ......................... 28
Figure 2-6 Purlin-rafter connections with four bolts (Dundu and Kemp, 2006) ..................... 29
Figure 2-7 Configurations of lapped Z section connection (Ho and Chung, 2006) ................ 30
Figure 2-8 Connection classification (From SteelConstruction.info) ....................................... 33
Figure 2-9 Common purlin sections (Ye et al., 2013) .............................................................. 38
Figure 2-10 Catenary action sketch (Tohidi et al., 2014b) ....................................................... 40
Figure 2-11 Beam action (Li et al., 2011) ................................................................................ 42
Figure 2-12 Catenary action (Li et al., 2011) ........................................................................... 43
Figure 2-13 Catenary action with curve arch ........................................................................... 43
Figure 2-14 Membrane action .................................................................................................. 44
Figure 2-15 Basic tie strength calculation in the British code (BS., 1997) .............................. 45

XI
Figure 2-16 Catenary action sketch (Tohidi et al., 2014a) ....................................................... 47
Figure 2-17 Tie forces in the structure ..................................................................................... 50
Figure 2-18 Continuity of the structure .................................................................................... 52
Figure 3-1 Test setup ................................................................................................................ 59
Figure 3-2 Diagram of Σ-, C- and Z- sections .......................................................................... 60
Figure 3-3 Configurations of sheeting (Zhao et al., 2014) ....................................................... 60
Figure 3-4 Coupon test setup .................................................................................................... 60
Figure 3-5 Stress-strain curve of the material .......................................................................... 60
Figure 3-6 Model for calculation ................................................................................... 63
Figure 3-7 Illustration of the rotational deformation (Zhao et al., 2014) ................................. 64
Figure 3-8 Meshed model ......................................................................................................... 66
Figure 3-9 Boundary conditions ............................................................................................... 66
Figure 3-10 Structural displacement of the purlin .................................................................... 67
Figure 3-11 Deformation of the sheeting ................................................................................. 67
Figure 3-12 Moment to rotation curves (20012) ...................................................................... 68
Figure 3-13 Moment to rotation curves (20016) ...................................................................... 68
Figure 3-14 Moment to rotation curves (20025) ...................................................................... 68
Figure 3-15 Moment to rotation curves (24015) ...................................................................... 69
Figure 3-16 Moment to rotation curves (24023) ...................................................................... 69
Figure 3-17 Moment to rotation curves (24030) ...................................................................... 69
Figure 3-18 Moment to rotation curves (30018) ...................................................................... 69
Figure 3-19 Moment to rotation curves (30025) ...................................................................... 70
Figure 3-20 Moment to rotation curves (30030) ...................................................................... 70
Figure 3-21 The effect of fastener spacing (20012) ................................................................. 72
XII
Figure 3-22 The effect of fastener spacing (20012) ................................................................. 72
Figure 3-23 The effect of fastener spacing (20025) ................................................................. 73
Figure 3-24 The effect of sheeting thickness (20012) .............................................................. 73
Figure 3-25 The effect of sheeting thickness (20016) .............................................................. 74
Figure 3-26 The effect of sheeting thickness (20025) .............................................................. 74
Figure 3-27 with different web depths ........................................................................... 74
Figure 3-28 with different shell thickness ...................................................................... 74
Figure 3-29 with different flange widths........................................................................ 75
Figure 3-30 β-t relationship under downward load .................................................................. 76
Figure 3-31 β-t relationship under uplift load .......................................................................... 76
Figure 3-32 Rotational stiffness with downward & uplift load ...................................... 77
Figure 3-33 Results comparison of ................................................................................ 77
Figure 4-1 Bolt ......................................................................................................................... 83
Figure 4-2 Screw ...................................................................................................................... 83
Figure 4-3 MIG welding ........................................................................................................... 83
Figure 4-4 Spot welding ........................................................................................................... 83
Figure 4-5 Sketch of the sections ............................................................................................. 86
Figure 4-6 Double linear stress-strain curve............................................................................. 86
Figure 4-7 Bolt load .................................................................................................................. 87
Figure 4-8 Configurations of T-joint ........................................................................................ 87
Figure 4-9 Element types of ABAQUS (Abaqus-6.13, 2013) .................................................. 89
Figure 4-10 Finite element meshing ......................................................................................... 90
Figure 4-11 Sensibility of modelling ........................................................................................ 91
Figure 4-12 Meshed by Hex element shape (F1G1A) .............................................................. 92
XIII
Figure 4-13 The effect of gap in bolted connection ................................................................. 93
Figure 4-14 Comparison of bolted connection ......................................................................... 93
Figure 4-15 Meshed by Hex element shape (F2G1A) .............................................................. 94
Figure 4-16 Influence of the variables ...................................................................................... 97
Figure 5-1 Hexagon washer head drilling screws (mm)......................................................... 100
Figure 5-2 Hexagon head M8 bolt and nut (mm) ................................................................... 100
Figure 5-3 Steel strip for material property test ..................................................................... 100
Figure 5-4 Screw shear test .................................................................................................... 101
Figure 5-5 Double screw shear test ........................................................................................ 101
Figure 5-6 Double shear screw test ........................................................................................ 101
Figure 5-7 Bolt shear test ....................................................................................................... 101
Figure 5-8 Fixture .................................................................................................................. 102
Figure 5-9 Specimen of tension test ...................................................................................... 102
Figure 5-10 Schematic illustration of tension test ................................................................. 103
Figure 5-11 Dimensions of shear-tension test specimen ........................................................ 104
Figure 5-12 Specimens of sloped tension test ....................................................................... 104
Figure 5-13 Schematic illustration of sloped tension test ..................................................... 105
Figure 5-14 Illustration of the measurement .......................................................................... 106
Figure 5-15 S550 steel specimens and failure mode ............................................................. 107
Figure 5-16 Strain-to-stress curve of S550 steel ................................................................... 108
Figure 5-17 Failure modes of screw joint .............................................................................. 109
Figure 5-18 Single screw lap joint test failure mode (S3) ..................................................... 110
Figure 5-19 Double screws lap joint test failure mode (S5) .................................................. 110
Figure 5-20 Screw joint double shear test failure mode (S7) ................................................ 110

XIV
Figure 5-21 Bolt single lap-joint test failure mode (B2) ....................................................... 111
Figure 5-22 Force-to-displacement curve of screw and bolt joints ........................................ 112
Figure 5-23 Single screw tension test failure mode .............................................................. 113
Figure 5-24 Cross-head force-displacement curves .............................................................. 114
Figure 5-25 Failure mode of screw joint in combined shear and tension tests ...................... 115
Figure 5-26 Force-to-displacement curve of specimens......................................................... 116
Figure 5-27 Deformation of screw hole in slop tension tests ................................................. 117
Figure 5-28 Result comparison of proposed expression and test ........................................... 122
Figure 5-29 β-to-θ curve ......................................................................................................... 123
Figure 5-30 Comparison of different angles scenarios ........................................................... 124
Figure 5-31 Bushing element (Abaqus-6.13, 2013) ............................................................... 125
Figure 5-32 Sketch diagram of “tie” contact in FEM5 ........................................................... 127
Figure 5-33 Force-to-displacement curves of coupon test and FEM simulation ................... 128
Figure 5-34 Von Mises stress diagram and force-to-displacement curve of S4 ..................... 130
Figure 5-35 Von Mises stress diagram and force-to-displacement curve of S8 ..................... 130
Figure 5-36 Force-to-displacement curve of T2 ..................................................................... 132
Figure 5-37 Von Mises stress distribution diagram of FEM1 ................................................ 132
Figure 5-38 Force-to-displacement curve of the joint in TS1 ................................................ 134
Figure 5-39 Force-to-displacement curve of the joint in TS2 ................................................ 134
Figure 5-40 Force-to-displacement curve of the joint in TS3 ................................................ 135
Figure 6-1 Sections in CFS modular panel system ................................................................ 137
Figure 6-2 Perspective and explosion diagram of connection type A .................................... 138
Figure 6-3 Perspective and explosion diagram of connection type B .................................... 139
Figure 6-4 Perspective and explosion diagram of connection type C .................................... 139
XV
Figure 6-5 Perspective and explosion diagram of connection type D .................................... 140
Figure 6-6 Meshing and stress contour of the connection type A .......................................... 145
Figure 6-7 Meshing and stress contour of the connection type B .......................................... 146
Figure 6-8 Illustration of connection translation and rotation (Abaqus-6.13, 2013) .............. 148
Figure 6-9 Connection type A subjected to pure tension ....................................................... 149
Figure 6-10 Connection type A subjected to pure shear ........................................................ 150
Figure 6-11 Moment-rotation curve of connection A subjected to bending .......................... 150
Figure 6-12 Connection type A subjected to bending ............................................................ 150
Figure 6-13 Connection type B subjected to pure tension...................................................... 151
Figure 6-14 Connection type B subjected to pure shear ......................................................... 152
Figure 6-15 Connection type B subjected to bending ............................................................ 153
Figure 6-16 Connection type C subjected to pure tension...................................................... 154
Figure 6-17 Connection type C subjected to pure shear ......................................................... 155
Figure 6-18 Connection type C subjected to bending ............................................................ 155
Figure 6-19 Connection type D subjected to pure tension ..................................................... 156
Figure 6-20 Connection type D subjected to pure shear ........................................................ 157
Figure 6-21 Connection type D subjected to bending ............................................................ 157
Figure 6-22 Modular construction configurations .................................................................. 161
Figure 6-23 Equivalent connection......................................................................................... 161
Figure 6-24 Analytical process of progressive collapse resistance ........................................ 162
Figure 6-25 Analysed cases of progressive collapse resistance ............................................. 163
Figure 6-26 DCR result of construction collapse in Case 1 ................................................... 163
Figure 6-27 DCR result of construction collapse in Case 2 ................................................... 164
Figure 6-28 Components in the modelling ............................................................................. 166

XVI
Figure 6-29 Connection idealized properties.......................................................................... 167
Figure 6-30 Stress envelope of modular structure .................................................................. 168
Figure 6-31 UDL to displacement curve ................................................................................ 169
Figure 6-32 Axial tensile force in J2 ...................................................................................... 169
Figure 6-33 Shear force in J2 ................................................................................................. 169
Figure 6-34 Bending moment in C2 and C3 .......................................................................... 170
Figure 6-35 Reactions of C2 with connection D .................................................................... 172
Figure 6-36 Resistance mechanism of the CFS panel system ................................................ 172
Figure 6-37 Surface load of the structure with connection D ................................................ 174
Figure III-1 Bolt group details ................................................................................................ 186
Figure V-1 Four bolt connection computation model ............................................................ 190
Figure V-2 Six bolt connection computation model .............................................................. 191
Figure V-3 Experimental model of truss ................................................................................ 192
Figure VI-1 Bolt groups in the analysis.................................................................................. 193
Figure VI-2 Main steps of the connection stiffness determination ........................................ 194
Figure VII-1 Shapes of connectors ......................................................................................... 196
Figure IX-1 a) Experimental model and b) Analytical model ................................................ 199

XVII
LIST OF TABLES
Table 1-1 Connections involved in steel modular systems ........................................................ 8
Table 2-1 Deflection criteria (Kraus, 1997) ............................................................................. 35
Table 2-2 Risk categories and design requirements ................................................................. 49
Table 2-3 Deformation-Controlled and Force-Controlled Actions .......................................... 52
Table 2-4 Load increase factors for LSP .................................................................................. 53
Table 2-5 Dynamic increase factors for LS analysis ................................................................ 54
Table 3-1 Geometric dimensions of Σ- sections ....................................................................... 61
Table 3-2 Geometric dimensions of C- and Z- sections ........................................................... 61
Table 3-3 Geometric dimensions of Σ- sections ....................................................................... 64
Table 3-4 Comparison of results .................................................................................... 71
Table 3-5 Comparison of with C- and Z-section purlins ............................................... 78
Table 4-1 Bolt dimensions and properties of fasteners ............................................................ 84
Table 4-2 Material properties ................................................................................................... 84
Table 4-3 Dimensions and properties of Specimens ................................................................ 85
Table 4-4 Comparison of numerical results ............................................................................. 94
Table 4-5 Numerical study results of series 1 .......................................................................... 96
Table 4-6 Numerical study results of series 2 .......................................................................... 97
Table 5-1 Screw shear joint test samples ............................................................................... 102
Table 5-2 Tension test samples .............................................................................................. 103
Table 5-3 Combined tension and shear test samples .............................................................. 104
Table 5-4 Specimen dimensions of material property tests .................................................... 107
Table 5-5 Screw shear joint test results .................................................................................. 109

XVIII
Table 5-6 Tension tests ........................................................................................................... 113
Table 5-7 Tests under combined tension and shear force ...................................................... 114
Table 5-8 Resistance comparison of shear specimens............................................................ 119
Table 5-9 Result comparison of tension specimens ............................................................... 119
Table 5-10 Ultimate force distribution in shear and tension directions ................................. 120
Table 5-11 Displacement and force comparison .................................................................... 124
Table 5-12 Settings of joint simulation methods .................................................................... 127
Table 5-13 Comparison of test and FEM with macroscopic results....................................... 129
Table 5-14 Comparison of test and FEM with macroscopic results....................................... 129
Table 5-15 Comparison of test and FEM with macroscopic results....................................... 131
Table 5-16 Comparison of test and FEM1 with macroscopic results .................................... 134
Table 6-1 Dimensions and properties of the connected sections............................................ 144
Table 6-2 Dimensions and properties of the connected sections............................................ 147
Table 6-3 Connection simulation results ................................................................................ 158
Table 6-4 Section properties ................................................................................................... 160
Table 6-5 Construction loading condition .............................................................................. 160
Table 6-6 Analysis results of cases......................................................................................... 165
Table II-1 Assessment of the bearing coefficient for circular press-joints ......................... 185
Table III-1 Rotational stiffness of bolt-group for different arrays of bolts ............................ 187
Table VIII-1 Modification factor for bolted connections (AISI S100 (2007)) ................. 197
Table VIII-2 Bearing factor C for bolted connections (AISI S100 (2007)) ........................... 197
Table VIII-3 New modification factor for bolted connections ......................................... 198
Table VIII-4 New bearing factor C for bolted connections.................................................... 198

XIX
LIST OF ABBREVIATIONS
ACI
AEM
AISI
AS
ASCE
BFcsw
BS
BSI
CFS
CL
CPB
DB
DoD
E
EC
FD
FEM
FFcs
FFgp
FU
GSA
LB
LBW
LTBgp
MBS
MIG
American Concrete Institute
Applied Element Method
American Iron and Steel Institute
Australian Standards
American Society of Civil Engineers
Bearing failure in section web around bolt hole
British Standard
British Standards Institution
Cold-formed steel
Concentrated load
Cement particle board
Distortional buckling
Department of Defence
Young‟s Modulus
Eurocode
Face-down position
Finite element method
Flexural failure of connected cold-formed steel section
Flexural failure of gusset plate
Face-up position
General Services Administration
Local Buckling
Laser beam welding
Lateral torsional buckling of gusset plate
Modular building structure
Metal inert gas

XVI
MZ
OSB
PCA
SPR
SHS
SCI
UDL
Modified Z
Oriented strand board
Portland Cement Association
Self-piercing rivet
Square hollow section
Steel Construction Institute
Uniformly distributed load

1
CHAPTER 1 INTRODUCTION
1.1 Introduction
Innovation in the construction industry has always been slower than in other sectors. In an
early UK report by Egan (1998), off-site modular construction was proposed as a modern
method for improving aspects of construction performance such as efficiency and quality. An
extensive survey by Gibb and Isack (2003) has listed the benefits of modular construction. It
concluded that less construction time on site, higher quality and lower costs were considered
as the key benefits from the clients‟ perspective. Additional benefits, such as better health and
safety control, less environmental disturbance, and high productivity, were also reported for
off-site construction (Hampson and Brandon, 2004).
a) Light steel module with an internal corridor b) Installation of modules in a social housing project, London
c) Modular student accommodation, Manchester d) Mixed modules and panels in medium-rise apartments
Figure 1-1 Off-site CFS modular building constructions (SCI., 2006)

2
a) External wall panel b) Intermediate floor panel c) Roof panel
Figure 1-2 Modular panel configurations (From Rautaruukki Corporation)
Recently, sustainable construction, the concept of personalisation and an emphasis on
customer experience have become the new directions of focus in the construction industry
(Zabihi et al., 2013). The pictures in Figure 1-1 illustrate the applications of CFS modular
construction.
In practice, off-site cold-formed modular buildings are increasing world-widely because of
their numerous advantages, e.g. waste reduction, recyclability, reusability, fast assembling, etc.
A great thermal and acoustic insulation performance can be obtained with the in-filled
materials (see Figure 1-2).
However, this kind of construction presents both benefits and challenges. Connections
between components or units are getting more complex and diversified. But current design
guidance cannot cover the state. This research aims to study the connections in off-site CFS
modular building structures and provide relevant design guidance. The genetic forms of steel
modules are introduced as follows.
Innovation and revolution have always been the driving force behind most industries. In
contrast, the automation and productivity of the construction industry are still progressing at a

3
comparatively slower rate. On the research side, off-site CFS modular building structures are
recognised as a future trend in the industrialisation of the construction process.
1.1.1 Containers
Container modular constructions are made of multiple boxes as unit. Boxes can be produced
by either used standard containers or open-section steel components. Coupled with mature
transportation and handling facilities, this kind of modular construction is recently developing
rapidly which is appropriate for temporary registration. Container modular unit realized the
maximum proportion of prefabricated structure and notably shorten the on-site construction
time. Due to the regular shape of the boxes, container modular construction is widely utilised
for hotels, accommodations, offices, canteens as well as garages. In order to obtain larger
space, modular units can be designed with partially or fully open sides and placed together.
Container buildings represent low-cost, easy build and generally use for low-rise temporary
construction.
Besides, sound insulation, air circulation problems and thermal insulation issue are
ineluctable to be solved. In order to make freight container be able to satisfy habitation
requirements, windows and doors are merged with the steel boxes. The implementation of
embedded material in containers leads to good seal and thermal insulation effect. As for the
transportation usage, the design of freight container follows general standards. However, the
dimensions of containers can be adjusted according to the requirement. The regular
dimensions of the boxes are of 6m or 12m in length, 2.5m in height with the width of 2.438m.
Although the shape and dimensions of containers are limited, there are many combinations
consisting of individual units and sometimes modified boxes.
Containers are mainly used to estabilsh low-rise construction, the corner column and walls
carry the vertical loading. Box units can be connected by corner eyes with cleats and bolts.
Welding is still the main method to connect components in this system. For some practical
requirements, the container can be strengthened by welding a stiffener to either the inside or
outside of the walls (see Figure 1-3).

4
a) Schematic diagram b) Strengthening in container structure
Figure 1-3 Container structure unit
1.1.2 CFS panel system
Component modular structure is erected by pre-cast 2D wall and floor panels (see Figure 1-4),
accompanied by 3D-modules for functional parts, such as kitchens, bathrooms and toilets
(Lawson and Ogden, 2008). Despite the lack of relative integrity and easy assemblage, this
system is generally applied in low-rise and medium-rise residential sector and more flexible in
design. The connection between each panel needs further analysis and innovation, such as
connection configuration and the structural behaviours.
For the low-rise buildings with less than 3 floors, it is permitted to place floor panels on walls
directly. In terms of medium-rise construction, it is required to make the load transfer directly
through the walls by carrying the floors (Gorgolewski et al., 2001a).
This system is very flexible in use. The thermal and acoustic insulation is implemented by
embedded materials. Relative to sheeting diaphragms effect caused by corrugated steel sheet
and floor slab, it is believed that these panels provide more effective support to the open
Top end frame Roof
Corner eyes
Corner structures
Top side frame
Side wall
End wall

5
section members, preventing torsion caused by eccentric loading. Global stability and strength
of the structure are enhanced by the in-filled materials as well. However, this hypothesis
needs to be proved and quantified as well.
Figure 1-4 Modular wall panel (From The Modular Home)
1.1.3 Plate-column system
The steel modular plate-column system consists of truss lattice plates and precast steel
columns (see Figure 1-5). Square hollow section (SHS) is usually adopted as columns. At the
connection between the floor and the column, the bracings are needed to enhance the strength
of the floor and reduce the span of the floor. The imposed loading is carried by the truss floor
and transferred to the braced steel column through the connection between the components.
Its feature is that there is no beam under the interior floor and the layout is flexible.
This kind of construction is applicable for multi-story buildings, warehouses, public buildings,
office buildings and residences. Additional shear walls or other anti-lateral force components,
such as diagonal bracing can be added to limit the horizontal displacement of the structure and
enhance the ability to resist earthquakes and wind.

6
Figure 1-5 Interconnection of boxes
1.1.4 Frame structure cassettes
In the frame cassette, corner columns and frames beams are the vertical load carrying
members and the diagonal bracing (see Figure 1-6) is used to resist horizontal forces. This
system is similar to containers but the shape and dimensions are more flexible in use as
compared to container boxes. Unlike traditional light steel constructions, this box is
considered as a combination of hot rolled corner column and light steel keel in-filled, of
which the corner columns serve as the dominant member resisting vertical loads from upper
modules when the boxes are stacked and hoisting the load.
Figure 1-6 Light steel keel structure box sketch

7
Other components are made of CFS open C or U sections which are supposed to strengthen
the steel frame to some extent. Square hollow section (SHS) and angle sections are regularly
adopted as corner columns.
In the wall panels, rigid or flexible diagonal bracing is applied to resist horizontal force
caused by wind or earthquake. The connections of the modular construction include
interconnection between modular cassettes (see Figure 1-7).
(a) Two boxes (b) Four boxes
Figure 1-7 Interconnection of boxes
1.1.5 Connections
Table 1-1 shows the connections involved in steel modular building structure systems.
Connection behaviour is the key factor to ensure the safety of the structure under loading
conditions, including the resistance of each unit and the integrity of the assembled
construction. The strength redundancy of each connection determines the structure responses
event under abnormal loading conditions, like fire and blast.
According to the scope of application, the connections can be divided into connections linking
accessory structures, connections installing units and connections assembling units. The
current design method cannot cover the practical situations, and the predictions accuracy need
to be further improved. Therefore, this thesis studied the connections applied in CFS modular
building structures.
Length
Width
External wall
Hot-rolled channel Detachable inner
partition wall Hot-rolled angle

8
Table 1-1 Connections involved in steel modular systems
Scope of application Connection position Annotation
Connections linking
accessory structures 1. Purlin-to-sheeting connection Roof system
2. Floor-to-frame connection Concrete slab, composite slabs
with corrugated steel sheet
3. Wall-to-frame connection
Connection between in-filled
light steel stud wall and
structural frame
4. Connection to attach finishing materials
Such as plasterboard, sheathing,
floor boarding, insulation and
decking to light steel structures
Connections installing a
unit 1. Stud-to-track connection In modular panels
2. Connection between structural sections and
bracings
Connections between vertical
and horizontal load carrying
element
Connections assembling
units
1. Joist-to-post connection between floor panel
and wall panel In modular panel system
2. Connection between column and floor panel In column-floor panel system
3. Connection to link adjacent frame cassettes In frame structure cassette
system
4. Connection to link adjacent containers In frame container system
The investigation of this thesis involves purlin-to-sheeting connection, stud-to-track
connection and joist-to-post connection between wall panel and floor panel. Purlin-to-sheeting
connection is used in roof system. The rotational stiffness of the connection significantly
affects the system performance. Stud-to-track connections play crucial role to guarantee the
resistance of modular panels. These units are assembled by joist-to-post connections. The
behaviour of the connections determines the structural integrity and the responses under
normal and abnormal loading conditions.
1.2 Novelty
The main novelties that are worth to be investigated in this thesis are listed as follows:
Analysis of benefits and challenges of off-site CFS modular building construction
systems and the supply chain.
Modified calculation method of rotational stiffness of Σ purlin-corrugated sheet

9
connections.
Analysis of bolted and screwed stud-to-track connections with gaps.
Screw joint tests under pure and mixed loading conditions.
Simulation method of screw joint connecting high strength steel (S550) sheets
subjected to shear, tension and combined shear and tension loading scenarios.
Analytical method of screw joint subjected to mixed loads.
A comparative study of proposed connection configurations and the current typical
connection.
Structural behaviour and load resistance mechanism of CFS modular panel structures
with different connection configurations under normal and abnormal loading
conditions, with regard to geometric shape and nonlinear resistance of the connections
as well as the attached materials.
1.3 Aim and objectives
The aim of this research is to investigate and improve the structural behaviours of connections
employed in CFS modular building constructions under normal operational or abnormal
loading conditions. This is achieved through the following objectives.
To develop a design method for predicting the rotational stiffness of the screwed
purlin-to-sheeting connection.
To compare joining solutions of the CFS stud-to-track connections.
To examine the structural properties and develop a resistance prediction method of the
screw joint under pure or mixed loading conditions.
To develop numerical methods to simulate the screw joint applied in the CFS
structures.
To measure the structural properties of different connection configurations of the joist-
to-post connection.
To evaluate influence of the connections on the robustness of the structures.

10
1.4 Methodology
To achieve the aforementioned aim and objectives and thoroughly understand the structural
performance of the connections in CFS modular constructions, an extensive literature review
is conducted to understand the state-of-the-art research development in this field and identify
the existing knowledge gaps. A series of laboratory tests are carried out to obtain the first
hand data of screw and bolt joint behaviour. The existing test outcomes from the previous
studies are also used for reference. The test results are used as the basis and validation of
numerical simulation. FEM is employed for numerical analysis to extend the range of
geometric dimension beyond the tested specimens. For the investigation of structural
robustness, 2D and 3D analytical models are adopted. Based on the test and numerical
analysis, design recommendations for the connections are developed through the analytical
models.
1.5 Outline of thesis
Chapter 1 introduces the background knowledge of the investigation. An extensive literature
review is conducted in this field in Chapter 2. Based on the comprehension of development of
CFS connections and modular construction systems, knowledge gaps are identified. In
consequence, the corresponding problems are addressed by using numerical, experimental and
analytical approaches. Finite element methods (FEMs) are developed to predict the structural
responses of the joints and connections. In Chapter 3 and Chapter 4, the proposed simulation
methods are verified by existing experimental results and specification predictions, and the
modified design methods of purlin-to-sheeting connections are achieved through numerical
and analytical approaches. As a validation of the numerical studies of screw joints under
complicated loading conditions, a series of tests are conducted in Chapter 5. When the screw
joints are subjected to mixed loads, the thesis uses the derived equations to predict the
ultimate resistance of the joints. For the further investigation of connection configurations,
FEM is employed to carry out the analysis of joist-to-post connections under tension, shear

11
and rotation actions. The connection properties are attached to the 2D and 3D construction
simulations by using commercial software package ABAQUSv6.13 and SAP2000v14.1 in
Chapter 6. The collapse reaction mechanism of the CFS modular panel constructions is
studied through analytical method, and the theory to analyse the load carrying capacity of the
structure under abnormal loading conditions is established, which is verified using the
numerical results. The thesis studied the structural performance of the connections applied in
CFS modular building structures. Chapter 7 provides a summary of the investigations
conducted in each chapter and recommendations for the future works.
1.6 Summary
This chapter addressed the background, novelty, the aim and the objectives and methodology
of the investigation. The outline of each chapter has been presented in this chapter. The details
of the research are presented in the following chapters.

12
CHAPTER 2 LITERATURE REVIEW
2.1 Introduction
The conventional construction process is usually completed on construction sites. Cast-in-
place concrete structure is one of the representatives. The connection featuring high strength
and stiffness can achieve a high level of structure continuity. However, the off-site CFS
construction consisting of light steel components provides advantages in sustainability,
quality control, economic benefit, etc. The connection configurations and joint performance
determine the structural behaviour of the structure. To understand the development of the
research about CFS connections, literature review was carried out to illustrate research
background and mechanism. The researches on the relevant areas were presented as the
foundation of the further study. The knowledge gaps of connections and joints in CFS
modular constructions were identified based on this following analysis in aspects of modular
construction, purlin-sheeting system, connection and joints as well as structural robustness.
2.2 Modular construction
Energy conservation and environmental protection are becoming major concerns in various
industrial sectors particularly in the construction industry, which normally accounts for 40%
of energy consumption and one third of carbon emissions. In the past two decades, modern
construction methods, such as off-site modular construction, have been actively encouraged
and pursued by policy makers and industrial leaders in order to tackle these problems
throughout the world. Meeting all conventional requirements such as safety, serviceability and
durability, off-site modular construction has emerged as a more advantageous construction
method featuring material efficiency, high quality, flexible adaptability, reduced waste and
lower energy demands. This new construction technology has been adopted worldwide but
with variations in the extent and scope of technological progress and engineering applications.
Nowadays, modular construction is mainly used for residential projects, schools, hotel

13
buildings or shops, and the building components or the entire building units are produced at
manufacturing sites. One of the most commonly used materials for this type of construction is
CFS.
The use of modular buildings has not been without challenges. The high upfront costs, the
long lead time, the complex connections and the acceptance level all affect the appeal of
building modularisation (Pan et al., 2007). By 2004, the use of off-site construction in the UK
was still at a low level (Goodier and Gibb, 2005). With current high demands for housing in
the UK (Barker, 2003), it is necessary to promote the development of construction
industrialisation. In parallel with this, it is prerequisite to enhance the overall understanding
of off-site construction (Pan et al., 2005). This status similarly occurs in other countries.
Recent surveys in Sweden (Larsson et al., 2014), Australia (Blismas and Wakefield, 2009)
and China (Zhai et al., 2014) reveal that a lack of skills and sufficient knowledge together
with conventional social attitudes are the biggest obstacles in implementing off-site
construction. With the development of technology and a change in people‟s perception of
construction industrialisation, the number of off-site modular buildings is continuously
increasing in Europe, particularly in the UK (SCI., 2007). One of the key materials that
facilitate off-site construction is CFS. Its favourable features, such as high strength-to-weight
ratio, excellent structural performance, high recyclability, and good compatibility with other
fill-in materials help promote its use in modular buildings.
By conducting an extensive survey, this section reports the enabling benefits and challenging
obstacles in off-site modular construction with CFS and identifies problems that need to be
addressed in the construction process for off-site modular buildings. The state-of-the-art
development of off-site modular building construction with CFS is reviewed in terms of the
technical progress, economic behaviour, sustainability and social impact, and based on this a
market outlook is proposed.

14
2.2.1 Technology development
2.2.1.1 Technical enablers of modular construction
One of the main merits of modular construction is the construction speed. Based on existing
experience, the construction time on-site can be reduced to 20% of that taken under
conventional construction methods (Miles and Whitehouse, 2013). In addition to the
economic benefits due to saving time, this advantage is also important when modular
construction is applied in emergency circumstances, such as post-disaster reconstruction.
Moreover, modular construction can also be used together with new building products and
technologies to create energy efficient buildings. Many projects completed in the UK have
proved successful in this field. For instance, with additional mineral wools placed between the
steel frame sections, nearly 90% (Miles and Whitehouse, 2013) of direct heat loss can be
prevented, and the U value of wall components can reach 0.25w/m2 ℃ or below. Excellent
acoustic performance can also be achieved by the incorporation of inner gypsum boards
attached to the wall panels.
From manual fabrication to automated production, standard modular units have proved
popular and necessary due to their flexibility as well as for their better controlled construction
quality. In traditional construction, the quality of buildings depends to a large extent on the
skills of the construction workers on site. However, this is difficult to quantify or standardise.
In contrast, with the development of manufacturing techniques, the components made from
CFS can be accurately manufactured off site.
In addition, cold-formed structures are much lighter in weight than other structures such as
concrete frame structures, or even timber frame structures. The high strength-to-weight ratio
can reduce the foundation loads and allows for a longer span and larger structures, which also
significantly improves the flexibility of buildings. As modular cold-formed structures can be
easily disassembled and reinstalled, and most steel members can be reused and recycled, this
type of building can be moved in part or as a whole.

15
2.2.1.2 Technical challenges of off-site modular construction
In general, applications have shown that galvanised CFS can meet the structural and
functional requirements of the projects (Outinen et al., 2000). However, as a newly emerging
construction method, there are many technical challenges that need to be addressed.
Modern method of construction is supposed to achieve benefits with highly automated
manufacture and fast construction and is widely used for low and medium rise buildings
(Miles and Whitehouse, 2013). The study (Lawson and Ogden, 2008) introduced generic
forms of light steel framing and modular constructions by case study. Wind forces on K-
braced frame were also evaluated by using FE method. The wall panel shear tests were
summarised. The results indicated that the additional elements attached on structure provide
considerable structural behaviour reserve in global stability. The „Hybrid‟ construction and
the corresponding design methods were proposed as the economic form in medium-rise sector.
High-rise modular buildings (12 storeys or more) have more complex and higher
requirements for their structural properties, in particular, concerning wind and seismic
resistance and stability. The investigation (Lawson and Richards, 2010) reviewed main
technologies employed in high-rise residential buildings and some application cases. It was
indicated that wind loads, robustness as well as the eccentricities caused by tolerances,
leading to the horizontal forces, are important due to the scale and height of the construction.
The research (Lawson et al., 2012) presented some typical cases related to the application of
modular constructions in multi-story buildings, including high-rise residential buildings up to
25 stories. The essential modular technologies and structural behaviour analysis of high-rise
modular construction were also demonstrated. Based on the information and modular building
design concept derived from the cases, a summary of sustainability, economic benefits as well
as the issues that required attention were presented in this research. In general, clustered
modular construction and corridor arrangement of modules are applied as typical layout of
modules in high rising modular buildings, see Figure 2-1. For high-rise construction,
resistance of horizontal forces caused by wind loads or robustness to accidental actions is one

16
of the crucial elements in the design process. Given this consideration, concrete or steel core
is employed. The corners of modules are tied together to transfer horizontal loads and
alternative load paths will occur in the event of accident damage. For taller buildings,
technologies of improving stabilities in medium rise building, such as diaphragm action,
bracing in lifts and stair area using hot-rolled steel components are not applicable.
Nevertheless, compression resistance and overall stability of the light steel sections and
connections in load-bearing walls require a deeper understanding. Moreover, robust
performance is also very important when accident failure occurs in partial structure.
a) Clustered arrangement of modules b) Corridor arrangement of modules
Figure 2-1 Typical arrangements of modules (Lawson et al., 2012)
Shear walls are recognised as one of the key load bearing components of modular buildings.
The choice of in-fill materials for the walls, floors and roofs, along with the arrangement of
the internal studs and fasteners, significantly determines the strength, stiffness, overall
stability, and other structural performance (Landolfo et al., 2010). Compression tests on
modular walls were carried out taking into account the effects of attached boards (Lawson and
Richards, 2010). It was found that the minor axis buckling can be prevented, event only one
side attached board. The carrying capacity of walls increased by 10 to 40 present compared
with BS 5950-5 due to the attached boards. The bending stiffness significantly increased up to
62 present resulted from the attachment of OSB and CPB boards on both sides. The effect of
eccentricity was also determined in this research. For the highly stacked modules, tolerance
due to installation and manufacture was evaluated and considered in the design. The design

17
method of stability of corner post in modular construction was proposed, involving the shear
stiffness of the wall panel and second-order effects. The design of such members is not well
covered by codes of practice or other design guides. Hence, research into the design of
modular buildings should be carried out in order to standardise the design method.
Connection is one of the key challenges in design. A wide variety of connection types are
used for building components or units, but there is a lack of standardisation. Components in
modular building structures may be subjected to complicated loadings, such as the combined
action of bending, shear and torsion. The connections dominate the performance of a structure
and occupy a large proportion of construction cost. Further research is required on the
connections and joints within and between the modular units.
As the case stands (Nair, 2004), the components of construction can be suddenly ineffective
or compromised due to abnormal loadings, such as fire, blast or impact, which may lead to
disproportional or progressive collapse. Existing guidelines DoD and GSA permit the
structure to respond nonlinearly once a column was removed in the disproportional or
progressive collapse analysis. If the horizontal and vertical tie force is sufficient, the catenary
may occurs, leading to the change of the load transfer path. Whereas, the structure may
remain elastic in the construction, causing no plastic hinge to dissipate energy through
inelastic material deformation (Ruth et al., 2015) which is performed as a beam action. The
inherent characteristic of robustness and integrity of CFS modular construction is relevant to
construction shapes and connection configurations (Foley et al., 2007). In case of unaccounted
scenarios, load resistance mechanism of the initial connections may be changed from pure
shear to rotation and tension which puts forward new demands on the connection ductility and
bearing capacity. The reduction of structural redundancy increases the economic efficiency
but weakens robustness to some extent.
Intermediate plates, end plates, fin plates, and tee or angle cleats are frequently used in
structural connections to transfer the forces from one member to another. Plates or cleats are
relatively strong and stiff to transfer the forces by in-plane actions. However, they are weak to

18
transfer the forces in out-of-plane bending (Trahair et al., 2007). For thin-walled steel
members, due to the thin thickness and stress concentration around fasteners, local buckling
likely occurs in connection zones. Gussets and cleats can directly increase connected
thickness, stiffen partial components or redistribute force transfer path to improve structural
performance of the original connection. Connections with stiffeners are proposed in this
research. In order to find out the most effective and efficient connection configuration and
comprehend the connection response in the modular construction, a numerical investigation
was carried out involving either normal or abnormal loading conditions.
2.2.2 Economic benefits
The cost of off-site construction can be divided into four main categories: fabrication,
transportation, erection and operation costs.
Most components of CFS modular buildings can be produced off-site. They can be
transported and assembled on site in the form of panels and prefabricated shapes and hence
significant savings can be made to construction time. This method also requires fewer site
workers and cranes. Therefore, costs of labour, equipment and on-site overheads can be
significantly reduced. For developers, shorter construction duration means a shorter payback
period.
In traditional construction, material waste on construction sites accounts for 10% of the
construction material, most of which ends up as landfill. Factory manufacture can avoid such
wastage and can even optimise the use of raw materials.
Manufacturing units in the factory can also enhance their quality and can reduce the number
defects occurring in products and thus also reduce the operational costs for maintenance and
repairs (SCI., 2006).
According to a report (SCI., 2007), high volume production can further reduce the cost of
manufacturing due to the economies of scale.

19
2.2.3 Sustainability
2.2.3.1 Environmental sustainability
The steel frames used in modular buildings are galvanised and hence are durable even under
hostile environmental conditions. Steel is a highly recyclable material, and no steel frames
should end up in landfill. The water used in production is also reused with this pollution-
reducing and energy saving construction method (SCI., 2006). Moreover, for CFS structures,
CO2 emissions can be reduced both in construction and during the life-cycle of the buildings
(Coimbra and Almeida, 2013).
Since the prefabrication process is carried out in the factory, there is significantly less
pollution from noise, dust and waste on site. By using this type of construction, a clean and
less environmentally damaging construction site can be created leading to a reduced impact
on the environment and improved air quality.
2.2.3.2 Energy consumption
Steel itself is a heat conductive material. However, the air-tightness of steel framed buildings
can reduce heat loss due to the leakage of air through the building envelope. This is further
improved by added insulation materials such as mineral wool and gypsum. Nowadays,
modular units can also incorporate renewable energy systems such as solar panels.
Another important factor is that less transportation is needed for the construction materials for
off-site construction, leading to less pollution and lower energy consumption. A report (Miles
and Whitehouse, 2013) indicated that on-site energy consumption can be reduced to around
20% of that of traditional construction projects.
2.2.3.3 Reduced waste
In the traditional construction industry, a lot of waste is produced from construction materials,
including cutting bricks or boards, packaging, damaged elements, and material wasted on site
or in transportation. In Europe, cement and brickwork make up the largest proportion of waste
produced, at percentages of 32% and 25%, respectively (SCI., 2006). Unfortunately, the

20
majority of this waste cannot be reused or recycled and is usually sent to landfill.
Consequently, how to reduce the levels of waste is a major challenge for the construction
industry. Off-site cold-formed structures can minimise wastage in production to 90% of that
in conventional construction (Miles and Whitehouse, 2013), in the following ways. Firstly,
the great majority of the materials used in modular building are reusable or recyclable. Most
CFS components can be reused or recycled at rates approaching 90%. With good practice,
there could be reduced waste both on-site and off-site. Secondly, off-site CFS modular
buildings are easily disassembled or extended, which provides flexibility, potentially leading
to reduced building demolition waste as well. In addition, considering the current excessive
levels of steel production capacity, this type of structure is also efficient in the use of
resources.
2.2.4 Society
Compared with traditional construction, the construction duration is notably reduced in
modular construction. The off-site construction supply chain is also significantly more
integrated and better controlled. At least 60% (Miles and Whitehouse, 2013) of the completed
construction product is made off-site, requiring fewer workers on site but creating more
manufacturing based jobs. As a result, off-site construction tends to convert jobs for low
skilled construction workers into properly trained technicians or engineers.
Because the construction methods and skills are quite different from those of traditional
building construction, some new jobs will be created. For example, experienced designers and
engineers in this field are needed for the design of modular building structures. Based on the
requirements of the construction process, a highly skilled and transferrable workforce (Miles
and Whitehouse, 2013) is indispensable for the prefabrication and assembly processes in order
to ensure engineering quality and efficiency.
Particularly in developing countries (Zhang et al., 2014), high initial cost, low level supply
chain, the lack of a developed legal system and government incentives, poor productivity, low
skilled labour and product quality problems emerge as the factors which hinder the progress

21
of construction industrialisation. In the initial stages of development in construction
modularisation, developing countries may invite a number of overseas workers from
developed countries, which will generate high costs. It is also necessary to carry out training
of the local workforce at an early stage.
In fact, the challenges of modular construction are not only confined to the technical level.
The growth of this construction method coincides with a rapidly developing society and the
on-going process of integration of suppliers. Therefore, it cannot achieve its full potential
benefits without the support of government and optimised supply chains (Doran and
Giannakis, 2011).
2.3 Purlin-to-sheeting system
In recent decades, the screw connections of CFS sections have been studied extensively by
various researchers through experimental and numerical approaches (Tan, 1996, Mills, 2004,
Kwon, 2006, Bambach, 2007, Fiorino et al., 2007, Gutierrez et al., 2011). Special
considerations of the connection performance of purlins attached to sheeting have been
implemented into design standards such as EC3 (Eurocode, 2006b). In the code, the lateral
and rotational restraints provided by the sheeting are considered as lateral and rotational
springs respectively, and the spring stiffness is obtained analytically. However, the method in
EC3 for modelling rotational stiffness has been criticized over years due to its relatively low
accuracy (Vraný, 2002). Hence modifications to the current design standard are required and
the topic has drawn increasing interests from researchers. An analytical model was developed
in (Vraný, 2006) to determine the effect of external loading on the rotational restraint. It was
found that a higher stiffness of the rotational restraint provided by sheeting results in a
reduction of stress in the free flange and a reduction of buckling length in hogging moment
areas. Mechanics-based expressions were introduced by (Gao and Moen, 2012) for calculating
the rotational restraint provided by through-fastened metal panels to Z- and C-section girts or
purlins. The equations considered the effect of local panel deformation at a screw, and the girt
or purlin flange bending at a through-fastened connection. An analytical formulae was derived

22
by (Ren et al., 2012) to calculate the bending stress of the partially restrained C-section
purlins by using the classic bending theory of thin-walled beams. In order to further consider
the interactional effect at screw points and the effect of loading directions, an improved
analytical method based on experimental studies was proposed in (Zhao et al., 2014) to
predict the rotational stiffness of cold-formed Z and Σ purlin/sheeting systems.
The restraining effect provided by sheeting has an influence on the buckling (see Figure 2-2)
resistance capacity of the purlin. For the purlin-sheeting system under uplift loading scenario,
it was found that translational spring stiffness can affect the local buckling of purlin while
rotational spring stiffness has influence on lateral-torsional buckling, and the rotational spring
stiffness has no influence compared to the translational spring stiffness on the maximum
tensile and compressive stress (Ye et al., 2004, Ye ZM, 2002). Moreover, the influence of the
initial geometric imperfections on the purlin performance was found only in purlins of
medium or long length with no or low rotational spring stiffness (Zhu et al., 2013). For the
purlin subjected to pure bending, the lateral restraint provided by the sheeting has almost no
effect on the lateral-torsional buckling of the member (Li, 2004). The influence of lateral
restraint provided by cladding on the lateral-torsional buckling of Z-purlin beams was
examined in (Chu et al., 2005) by using the energy method. Moreover, an analytical model
that describes the bending and twisting behaviour of partially restrained CFS purlins subjected
to uplift loading was further developed by (Li et al., 2012). For a fully restrained thin-walled
C- or Z-section beam subjected to uplift loading, it will not buckle in lateral-torsional mode,
but may exhibit a web-flange distortional buckling mode (Yuan et al., 2014).
a) Local buckling b) Distortional buckling c) Lateral-torsional
Figure 2-2 Buckling models of CFS section

23
2.4 Joints and connections
A plethora of research studies have been recently performed on the structural behaviour of
steel connections where the failure modes, strength and stiffness of joints and connections
have been examined through experimental, numerical and theoretical studies.
2.4.1 Experimental studies
2.4.1.1 Joints
The joint properties normally affect the structural performance of the connection. The bolt
joint has been studied. As early as 1986, Kirk (1986) presented a comprehensive review on
the research development of cold-formed construction, including stiffness and strength of
their joints, design and materials standards, technical developments, etc. A full scale tests of
cold-formed section portal frame building system was carried out in this research, which
emphasized that cold-formed sections not only can be utilised as secondary structural
members but can be qualified for primary framing as well. In the tests, it was found that the
stiffness and strength of joints were strong enough, leading to the failure occurred in the
members. The study suggested that the eaves and ridge connections with bolt joints can be
considered as fully rigid connections but for elastic design. However, because of the small
thickness of the member section, bolted connections in cold-formed structure cannot provide a
full rigidity in practice. Through analysis and tests, Zadanfarrokh and Bryan (1992) quantified
the affecting factors of the strength and rigidity of bolt joints, e.g. the thickness of the section,
full shank diameter, threaded portion, etc. They also presented the design expressions for
calculating the bearing strength and flexibility of the bolt joints and compared it with those
calculated using AISI, EC3 Part 1, BS 5950 Part 5 and BS 5950 Part 1. Based on tensile tests
of bolted lap joints and parametric analysis, Bryan (1993) developed the design equation for
the joint with compliance of a single lap bolt joint made of Z28 steel with the yield stress of
280MPa and the ultimate bearing strength of 390MPa, and =1.25 was recommended as
safety factor for design. An investigation (He and Wang, 2011) of the whole load-deflection
behaviour of bolted thin-walled steel plates in shear was performed using experimental,

24
numerical and analytical approaches. It was found that the initial stiffness of thin-walled steel
connections can be predicted using the equations in Eurocode3 (Eurocode, 2006b). Three pure
failure modes (e.g. solely bearing, shear and tearing) and combined failure modes were
identified. The bolt-hole elongation determines the resistance of the joint. The elongation is
the sum of effects from the deformation of the bolt-hole circumference in tension and the
wrinkling in front of the bolt. The methods of calculating the ultimate deformation were
proposed and the calculated deformation agreed well with experimental and numerical ones
(He and Wang, 2011). In a research (Draganić et al., 2014), bolt joints were studied to ensure
bolt-hole elongation that enables a progressive collapse mechanism, focusing on the plastic
behaviour of single lap joints. Experimental, numerical and analytical analyses were
conducted using bolt-hole centre to plate edge distance as a parameter. S235 steel and M16 of
class 5.6 were adopted in the tests. It was found that with the centre to edge distance
increasing from 22mm to 40mm, 7.9% higher ultimate load and 20.2% larger plate rotations
at ultimate load were achieved. The ARAMIS optical system was employed to record the
displacement and deformations of the joints in experimental testing. In contrast with European
and American standards, improved prediction equations of ultimate and serviceability loads
were proposed.
There are also some other connecting methods which provide both advantages and
disadvantages. Based on Eurocode 3, Tomà et al. (1993) performed research on the
mechanical properties of joints with fasteners, welding and adhesive bonding in the cold-
formed construction. Predreschi et al. (1997) came up with the press-joining, which is a new
technique of cold-formed section joints (see Figure 2-3). This joint was demonstrated by
small-scale shear, bending tests as well as full-scale tests of trusses. Correspondingly,
calculation method of the strength was presented as Eq. 2-1.
( ) ( ) (Eq. 2-1)
where is the angle of applied shear, t is the thickness of the steel, and UTS stands for the
ultimate tensile strength of the steel.
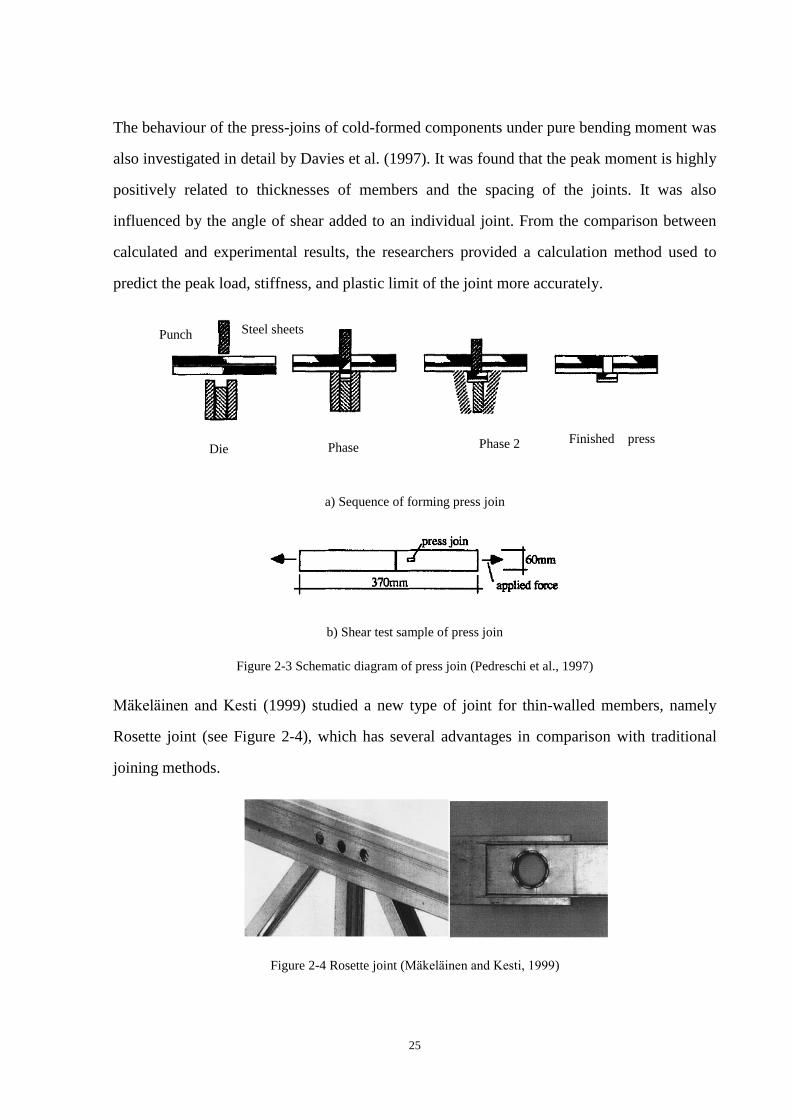
25
The behaviour of the press-joins of cold-formed components under pure bending moment was
also investigated in detail by Davies et al. (1997). It was found that the peak moment is highly
positively related to thicknesses of members and the spacing of the joints. It was also
influenced by the angle of shear added to an individual joint. From the comparison between
calculated and experimental results, the researchers provided a calculation method used to
predict the peak load, stiffness, and plastic limit of the joint more accurately.
a) Sequence of forming press join
b) Shear test sample of press join
Figure 2-3 Schematic diagram of press join (Pedreschi et al., 1997)
Mӓkelӓinen and Kesti (1999) studied a new type of joint for thin-walled members, namely
Rosette joint (see Figure 2-4), which has several advantages in comparison with traditional
joining methods.
Figure 2-4 Rosette joint (Mӓkelӓinen and Kesti, 1999)
Punch
Die Phase
Steel sheets
Phase 2 Finished press
join

26
Rosette joint is made of a part of the components without extra fastenings or heating in the
installation process. In the study, the new type of connection was verified by shear,
compression and tension tests and was compared with traditional joints. The tests given
demonstrated that Rosette-joining has very good capacity of tensile and shearing resistance,
which can be applied in roof-truss structure. Laser beam welding (LBW) is widely utilised in
auto industry. Landolfo et al. (2009) studied the application of LBW in CFS beam
connections. The lap-shear and tension tests were carried out. It was found that the parameters
of sheet thickness, gap, loading direction, weld shapes and zinc coating influenced the
strength or deformation of the joints in various degrees. Compared with the experiments, for
spot welds loaded in shear, the results of Eurocode 3 overvalued the strength of the joint. In
contrast, for tensile strength, the code obtained good collaboration with the test results. Mucha
and Witkowski (2013) investigated double and single joints in the destruction process by
means of uniaxial shearing tests. Fasteners, e.g. clinch rivet, blind rivet, self-piercing rivet
(SPR), self-drilling screw, etc., were applied in the tests and diverse actions in failure were
detected in details. In the conclusion, clinch rivet joints achieved high efficiency and peak
load; for the overlap joints, the alignment order of fasteners is important, but self-drilling
screw is less sensitive; the combination of different fasteners leads to considerable change of
separation work, particularly for a combination made by blind rivet and self-drilling screw;
the SPR joint presented nonlinear characteristic in the test. Researchers (Wahyuni, 2015) also
investigated CFS joins with screw, adhesive and combination connection method. The
ultimate loads and failure modes were achieved by conducting materials, single lap joint and
flexural joint tests. Material properties of epoxy resin and polyester resin were obtained.
Screw and combination joints on CFS structures could prevent premature structural collapse
and both epoxy resin and polyester resin have good properties to minimize the bearing failure,
while increasing structural rigidity of combined connection. However, an anomaly occurred
with the screw and a polyester resin adhesive combination joint, since polyester adhesive was
not distributed uniformly in the joint area by screw drilling. This caused a dislocation of the
adhesive connection, resulting in reduction in the maximum performance of joint strength.

27
However, the joint may not only be subjected to pure shear or tension, but also to a
combination of them, which makes the prediction of the structural behaviour of a joint more
complicated. Sønstabø et al. (Sønstabø et al., 2015) reported an investigation on the force-
displacement responses and failure behaviour of the aluminium sheet joints using the flow-
drill screws (FDS) under tension, shear and the combined tension and shear loading by the
experimental study. The experiments included the single connection tests and the connection
component tests. A literature review of the SPR joints subjected to the combined loads with
various shear/tension was carried out. It was found that the strength of the joints increased
while the ductility decreased with the ratio of shear to tension. Deformations and four failure
modes of the screw joints were observed in the component tests, i.e., the screw rotation, the
screw pull-over, the screw push-out and the screw fracture, which do not occur in the single
lap tests. Based on these comparisons, the differences of the structural behaviour between
FDS and SPR can be identified under the shear dominated loading condition. Another
research investigated the failure mechanisms of the spot weld joint used in vehicle industry
subjected to tensile, shear or their combination (Asme, 2003). The strength, the overall
deformation and failure process were identified from the cross tension and the lap-shear
sample tests. The model for calculating the failure load of a lap-shear sample was proposed.
Based on the classical von Mises and Tresca failure criteria as well as the respective stress
distribution, the ultimate load of cross tension tests can be predicted by the developed
equations. Moreover, as for the combined normal/shear loading, design equations were also
proposed in the chapter to examine their resistance. The theoretical analysis has been
validated by previous experimental or numerical results. A special testing rig was designed
for the connection specimens under the mixed loading conditions (Barkey and Kang, 2010,
Lee et al., 1998, Lin et al., 2002).
2.4.1.2 Connections
Except for the performance of the joint and fastener, the well-designed connection
configuration can also significantly improve the structural properties of the connection.
Researchers (Chung and Lau, 1999) presented system tests on bolted moment connections of

28
cold-formed components. It was found that at the structure failure, the moment carried by
bolted moment connections with four bolts per member ranged from 42% to 84% of the
moment carrying capacity of the connected members, which embodied the efficiency and
effectiveness of the bolted moment connections. Subsequently, an experimental study (Chung
and Lawson, 2000) about the shear resistance of connection using CFS cleats was presented.
Four connection configurations (see Figure 2-5) and three failure modes were identified.
Figure 2-5 Details of connection configurations (Chung and Lawson, 2000)
This joint is made of a part of the components without extra fastenings or heating in the
installation process. In their study, the new type of connection was verified by shear,
compression and tension tests and was compared with traditional joints. The tests given
demonstrated that Rosette-joining has very good capacity of tensile and shearing resistance,
which can be applied in roof-truss structure. In a later research (Wong and Chung, 2002),
bolted moment connections of CFS structure were studied by means of a series tests of

29
connections in CFS beam-column and sub-frames. Four typical failure modes were identified
namely BFcsw, LTBgp, FFgp and FFcs. In general, the proposed connection configurations
could transmit moment effectively. It was demonstrated that, for mode BFcsw, the bearing
moment of the connections were below 50% of the moment capacity. For mode LTBgp and
FFgp, the proportions were raised up to 60% and 75% respectively. However, for mode FFcs,
the connections have the best transmission efficiency with the figure of over 85%. Dundu and
Kemp (2006) performed experimental investigation about portal frames comprising cold-
formed channels connected back to back at the eaves and apex. The study involved semi-rigid
and inelastic joints and the lateral-torsional buckling of the eaves region. It was shown that
the back to back bolted connections provided considerable ductility. Further ductility was
achieved in mild steel channels than that of high-strength channels. In the comparison of the
purlin-rafter connections with two vertical (marked 1-1 in Figure 2-6), two diagonal (marked
1-2 in Figure 2-6), and four bolted (see Figure 2-6) systems under critical elastic lateral
buckling load, the two vertical and two diagonal bolts did not reduce the effectiveness of the
connection.
Figure 2-6 Purlin-rafter connections with four bolts (Dundu and Kemp, 2006)
Ho and Chung (2006) presented experimental and theoretical investigation on the CFS Z
sections with lapped connections. Comparisons were carried out between connections with
different lap lengths and different numbers of bolts configured on the webs and flanges. It was
found that the performance of connections with Config. W2F2 and W4F2 were close to those
with Config. W4 and W6 (see Figure 2-7). Furthermore, rational design rules for overlapped
multi-span purlin systems were proposed.

30
Figure 2-7 Configurations of lapped Z section connection (Ho and Chung, 2006)
Yang and Liu (2012) studied sleeve connections of CFS Σ purlins. In their investigation,
response of the sleeve connections was divided into three stages, the friction at the contact
interfaces, slips of bolt and the interaction among purlin, sleeve and the bolts. It was also
found that, with low level of loading, the slippages of bolts significantly impacted the
response of rotation. In contrast, the bearing forces between bolts and the components in
sleeve connection presented a limited adverse effect on the moment resistance.
Tensile membrane action tests (TMA) and bending-prying action tests (BPA) were carried out
by Bewick et al. (2013). It showed that current codes use large safety factors to design stud-
to-track connection and therefore are not economical. Through laboratory experiments
considering large deformations and inelastic material response, the results showed that the
overall stiffness and strength of steel stud walls can be significantly greater than those
calculated using the standards. According to the tests, using single screw connection is
insufficient to reach tensile membrane behaviour of the stud wall system. Additional screws
enhance the ductility and strength of the connection which help to achieve tensile membrane
response. In the load tree tests (LTT), three studs were placed with space 406mm on the
centre. The variables of the analysis included the screw size, the stud and track geometry and
the type of sheathing. It was found that sheathing effectively resist rotation caused by the
eccentricity to the shear centre of the applied load. In terms of the unsheathed load tree
specimens, the magnitude of the strength increase was less than that of the TMA series. It was

31
because that a pure tension load acted on the connection in the TMA series, whereas the
screws in unsheathed load tree specimens were subjected to bending and prying, torque and
tension loads.
2.4.2 Numerical studies
The accuracy of finite element software and computer computing power are greatly improved
in the past decades. Based on the technology development, numerical method has become a
powerful tool for studying complex subjects and being a supplement to the limited
experimental data. Bursi and Jaspart (1997) used three-dimensional FEM to study tee stub
bolted steel connections by means of LAGAMINE program. This model simulated the large
deformation and the natural strain-true stress curves and reproduced the property of
displacement field. The comparison between numerical and test results verified the
effectiveness and the accuracy of the suggested model. The LAGAMINE finite element
program was also used to study lap screw joints to predict the ultimate resistance, the
deformation, screw rotation behaviour and the stress distribution of the joints between thin
steel sheets and the results corresponded well to the test results. The precise finite element
model presented provided a good demonstration for the further research (Fan et al., 1997a,
Fan et al., 1997b). For CFS strips with high strength but low ductility, current expressions
may not be applicable. Chung and Ip (2000) established a three dimensional solid nonlinear
finite element modelling to study the performance of the bolt joints between high strength
CFS strips and hot rolled steel plates under the action of shear force. In order to accurately
predict the load-extension curves and the bearing resistance of the strips, a stress-strain curve
was suggested and also validated by experimental results. It should be noticed that around 20%
of the load bearing capacity of the bolted connection is contributed by frictional resistance
between element interfaces. Ju et al. (2004) simulated the crack behaviour of the steel bolt
joints under shear loads by using three-dimensional plastoelastic FEM. In the modelling, bolt
clearance, bolt head, washer, deformable bolt, friction, plate distortion and bolt bending were
included which made the simulation closer to the actual and obtained good agreement with
the AISC specification. It was suggested that the linear elastic fracture mechanics is

32
applicable in most cases. At nonlinear stage, the bolt nominal capacities are nearly linearly
proportional to the number of the bolts. Kim et al. (2007) introduced four FE solid bolt
models, coupled bolt model, spider bolt model and no-bolt model and compared the FEM
results with the tests. It was found that the solid bolt model predicted the physical
characteristics of the structure most accurately. Gutierrez et al. (2011) investigated slotted Z
profile sleeve connections on the performances of strength and rotational stiffness by means
of experimental and numerical methods. An adequately accurate FEM model with semi-rigid
connection in multi-span model was proposed. Researchers (Bewick and Williamson, 2014)
developed a model to predict the ultimate load and deformation of steel stud wall systems. In
details, the screws were simulated using nonlinear discrete beam element and a piecewise
linear plasticity constitutive relationship for the CFS according to LS-DYNA, which were
capable of capturing the essential failure modes (local buckling and lateral-torsional response),
peak strength and peak displacement. It was suggested that additional screws in stud-to-track
connections can improve the carry capacity; a 76.2mm track is recommended to allow for
extra screws and satisfying the specification of AISI (2007) and a fixed-track wall presents
better structural behaviour than the slip track wall. Screwed joint featuring with easy
installation and the economic efficiency is extensively employed in thin-walled steel
constructions nowadays. Bondok et al. (2015) studied the effects of utility holes and sheathing
in stud-to-track wall systems with screw joint was conducted. In the study, full-scaled tests
and modified finite element model acted quasi-static loading were conducted. Three phases
were presented in the resistance-to-deflection curve, elastic flexure range, yielded beam with
plastic hinge and softening and plastic tension range. In general, the stud was conservatively
supposed to fail when more than 8% of the stud length deforms plastically, which may lead to
a local buckling or a lateral torsional buckling. It was also noted that failure of the track-to-
floor connection commonly started with the middle bolt pulled over. In contrast, a stud-to-
track connection failed where screw tilting and bearing failure mixed. In general, oriented
strand board (OSB) sheathing made positive contribution to the stud behaviour in either the
softening zone or the ultimate load, however, for the specimens with utility holes, the effects

33
turned to be negative. In the numerical modelling, the screws joining the stud and the lateral
wood bracing were simulated by Multi-Point Constraint (MPC) connectors as a rigid
connection. Since the bolted floor-to-track connection was not the research objectives, it was
simplified as pinned joint. In the stud-to-track connection, beam connector elements were
employed to model the screw behaviour. To simulate screw tilting and bearing capacity, an
additional defined spring element with linear stiffness k were adopted. The numerical
modelling presented good agreement with test results.
2.4.3 Theoretical studies
In the global analysis of a structure, the connections can be assumed not to transmit bending
moments and hence are simple connections. If a connection is strong enough and does not
influence the force transmission of the model, it is considered as continuous connection.
Otherwise, the behaviour of the semi-continuous connection should be considered in the
analysis model. The characteristics of connection affect the load distribution and the structural
behaviour. The classification system is generally based on the stiffness or strength of the
connection. In EC3 (Eurocode, 2005), if the connections are classified by stiffness,
connection categories include nominally pinned connections, rigid connections and semi-rigid
connections (see Figure 2-8).
Figure 2-8 Connection classification (From SteelConstruction.info1)
1 http://www.steelconstruction.info/Modelling_and_analysis

34
Pinned connections are capable of transmitting the internal forces and the allowable rotations
but developing insignificant moments in the structure. Rigid connections are supposed to have
amply rotational stiffness to obtain full continuity of connected components. The stiffness of
semi-rigid connections is between pinned and rigid connections. The classification boundaries
are shown in Figure 2-8. This classification is commonly used in elastic analysis.
In terms of strength classification criterion, connections can be divided into nominally pinned
connections, full-strength connections and partial-strength connections which can be applied
in plastic analysis. The design resistance of full-strength connections is not less than that of
the connected components. The pinned connections can resist the internal forces, but the
design ultimate moment needs not be larger than 25% of the requirement for full-strength
connections. Connections with structural properties between the upper boundary of nominal
pinned connections and lower boundary of full-strength connections are defined as partial-
strength connections. Stiffness and strength of the connection changes in the entire process of
the connection response and the connection with high moment resistance but low stiffness
may be not capable of a full-strength connection. However, the aforementioned classifications
concerned stiffness and strength criteria separately. While Nethercot et al. (Nethercot et al.,
1998) proposed a classification method in which both of the stiffness and strength were
involved simultaneously by the developed expressions and the ultimate limit state and
serviceability limit state were taken into account:
[
] (Eq. 2-2)
(Eq. 2-3)
where Mj is the connection moment; q is the uniformly distributed load; L is beam span length;
EI is beam section rigidity; K is connection stiffness; α is column-to-beam rotational stiffness
ratio; Kc is the sum of the rotational stiffness of the connected member except the beam
considered. EIc is column section rigidity; Lc is column height; if the connection moment
capacity is over 95% of that of the beam, it can be considered as a fully-connected connection.
If the connection moment capacity is smaller than 25% of that of the beam, the connection is

35
classified to pin-connected connection. The partially-connected connection is between these
two categories. If the connection cannot deliver the required rotation capacity, this connection
is categorized as non-structural connection.
The design of structure includes deflection and carrying capacity at serviceability and ultimate
states. The deflection consists of end slip of connections and beam deflection involving
bending and shearing deflection. In the light of the serviceable limitation, the deflection
criteria (see Table 2-1) of joists under working condition are proposed below, including static
deflection criteria (a and b) and vibration sensitivity criteria (c and d) (Gorgolewski et al.,
2001a, Kraus, 1997, Lawson et al., 2008).
Table 2-1 Deflection criteria (Kraus, 1997)
Serial
number
Scope of
application Criteria
a static The maximum deflection under dead and imposed loads is limited to span/350, or a
maximum of 12 mm, including the effect of composite actions – this generally ensures
that the minimum natural frequency is satisfied (see criterion c).
b The maximum deflection under imposed loads is limited to span/450 - this only applies
to floor areas under higher imposed loads, such as corridors and public areas, as in
general, criterion a) will control.
c vibration The natural frequency of lightweight floors should exceed 8 Hz for the loading case of
self-weight plus 0.3 kN/m2, which represents the permanent loading considered in
domestic buildings. This criterion is satisfied by limiting the maximum deflection of the
floor to 5 mm for this loading condition. The natural frequency limit should be increased
to 10 Hz for corridors and public areas, where impulsive actions may increase.
d The local deflection of the floor, using the relevant value of Neff under a nominal 1kN
point load, is limited to a maximum of 1.5 mm or (3/span2) for spans (in m) exceeding
4m, based on the criteria suggested by Kraus and Murray (Kraus, 1997)
This reduction in deflection limit with span reflects the need for higher stiffness to
counteract the increase in the possibility of impulsive actions that may occur in longer
spans. The structural response is different at the serviceability and ultimate limit states.
And the failure modes should be detected.
This reduction in deflection limit with span reflects the need for higher stiffness to counteract
the increase in the possibility of impulsive actions that may occur in longer spans. The
structural response is different at the serviceability and ultimate limit states and the failure
modes can be detected.
The research development of CFS bolt joints and the comparison of current design rules was
presented by Chung and Ip (2001). However, these design rules are not competent to CFS

36
strip with high strength low ductility. Based on parametric study by using FEM model,
calibrated semi-empirical design rules were proposed (see Appendix I). It is shown that this
calculation method can be utilised to predict bearing resistances of the bolt joints of low or
high strength steels with variable ductility.
New CFS connecting systems were developed by Di Lorenzo and Landolfo (2004). Shear
experimental investigation was carried out in order to evaluate the shear strength and ductility
of them which made contribution to the choice of mechanical fasteners. The comparative
study included mono-component blind rivets, bi-component blind rivets, circular press-joints
and self-piercing rivets. Based on the results in the tests, the bi-component blind rivets
achieved better strength and ductility. In contrast, there was no significant difference in
strength and ductility between bi-component blind rivets and mono-component blind rivets.
According to test results, ductility is the mostly negative factor for carrying capacity of the
joints. Particularly, for mono-component blind rivets, the strength reduced by around 50%. It
is also concluded that bi-component blind rivets fully fit for ductility-restoring joints. The
circular press-joints can be used for the connection with shear strength no more than 3kN.
Furthermore, the shear resistance of the symmetrical joints is underestimated in previous
regulation due to the wrong bearing coefficient for circular press-joints, which was revised by
the author (see Appendix II).
As the eaves and apex connections are not rigid in practice, Lim and Nethercot (2004)
developed a process (see Appendix III) to predict the stiffness of bolted moment connections
between CFS components of portal frames using nonlinear spring FEM modelling. Full-scale
tests were also carried out, which verified the results of the numerical simulation.
Yu et al. (2005) investigated bolted moment connections of CFS beam-column sub-frames
under lateral loads. With larger bolt pitches and thick gusset plates in the connections, flexural
failure of the connected sections was always the governing factor. Taking into account the
combined action of bending and shear force, design rules for the bearing resistance of the
connection were proposed. A nonlinear finite element model of the beam-column sub-frames

37
was shown and semi-rigid connections were presented in the FEM modelling. The results of
the modelling followed closely to the experimental investigation. Based on the test results, a
modified semi-empirical formula for calculating the flexibility of the bolted moment
connections was proposed (see Appendix IV).
As the AISI CFS Truss Design Standard do not provide predictions for the connection
stiffness, Zaharia and Dubina (2006) studied the stiffness of the bolted connections in CFS
trusses. Tests were carried out on single lap joints, typical truss connections and a full-scale
truss. It was demonstrated that rotational stiffness and axial stiffness of the connections
mutual affect the response of the truss structure. It was also found that the initial rotational
slippages did not notably influence the initial rotational stiffness of the truss connection. The
formulas for predicting the rotational stiffness and axial stiffness of the bolted connection
were developed. Moreover, considering the rotational stiffness of the connections, equations
for calculating buckling length of truss web members were presented (see Appendix V).
Dubina (2008) investigated the stiffness and strength of the bolted connections in cold-formed
truss structure by experimental and numerical methods. Three factors affecting the stiffness of
the given connection bolts in shear, bolts in bearing on cold-formed member and bolts in
bearing on the bracket were taken into consideration and a set of formulas for connection
stiffness and moment resistance were presented (see Appendix VI). Furthermore, it was found
that the connection model with combined initial rigid and semi-rigid response was more close
to the experimental results.
Kwon et al. (2008) investigated the stiffness and strength of PRY sections applied in CFS
portal frames. Tests on the connections were carried out with variation of plate thicknesses
and connection types. According to the results of numerical analysis and full scale tests, semi-
rigid concept and secant stiffness of the connections are applicable in the portal frames.
Moreover, simple expressions for calculating the shear resistances of the screwed connections
were proposed (see Appendix VII).

38
Yu and Panyanouvong (2013) considered the effect of gaps in CFS bolted connections, e.g.
connections in truss structure. It was concluded that the current norm (AISI S100 2007) works
for the truss connections with thick plates. However, for thin materials, AISI prediction
overestimated the test results. Therefore, according to the tests, calibration factors (see
Appendix VIII) for design of the truss connection with gaps were proposed.
Ye et al. (2013) presented an investigation of sleeved connection on the load-deflection
behaviour. A modified Z purlin section (see Figure 2-9) was presented in the tests. It was
found that the interlocking and friction made greater contributions to the rotational stiffness of
the connections than the bolts. For the flexural stiffness of the sleeved modified Z connections,
the length of sleeve and the bending moment of the connections played critical roles.
Furthermore, the expression for predicting the flexural stiffness of the connections was
proposed (see Appendix IX).
Figure 2-9 Common purlin sections (Ye et al., 2013)
2.5 Construction robustness
2.5.1 Research status
Apart from the traditional design scenario considering the failure of the floors above the
removed column with regard to kinetic energy transmission, a progressive collapse
assessment of multi-story buildings impacted from above failed floor was investigated.
Researchers (Vlassis et al., 2009) have proposed a theoretical method to calculate the energy
transfer with regard to the fully plastic and the fully rigid impact scenarios. The crucial
parameters, such as energy absorption capacity, strength and ductility of the floor as well as
the shear capacity of typical steel bolted connection were taken into account. It was shown
that the latter scenario presents greater energy transfer ratio (close to 100%) from the

39
impacting floor to the impacted floor (around 40%). Numerical study was also carried out
using ADAPTIC and shows good agreement with the theoretical method. Gerasimidis and
Baniotopoulos (2015) investigated progressive collapse of strengthened moment-resisting
steel frames, considering suddenly missing single column in the ground floor. Finite element
software ABAQUS was employed to simulate the 2D steel frames selected in the analysis,
ranging from 6 floors to 15 floors. Six schemes of strengthening were proposed involving
beam and column reinforcement. The results illustrated that the removal of column negatively
influences the stability and carrying capacity of the frames. However, the mitigation of the
affect due to strengthening varied in different scenarios. There is no general method that is
applicable for all collapse mechanisms. A research (Foley et al., 2007) intended to quantify
the level of inherent robustness. The 3D numerical analysis of progressive collapse of
moment-resisting steel frames from 3 to 20 storeys was conducted. With the successive
removal of the structural element, two-way membrane and catenary action likely affect the
load transfer mechanisms in the rest system. DoD guidelines (DoD., 2009) provide the
requirement of tie force as follows.
If it was an interior tie element, the calculation of the required tie force is
[ ] (Eq. 2-4)
If it was an exterior tie element, the calculation of the required tie force is
[ ] (Eq. 2-5)
where GRAV (psf) is the gravity loading taken as 1.2D+1.6L; is the spacing between ties;
is the beam or girder span. The minimum interior tie force is 16.9 kips, and the minimum
exterior tie force is 8.4 kips.
However, based on the inelastic analysis of the 3-storey frame, it was found that the axial
force demands in the beam-to-column connections were less than 5% of the carrying capacity.
Based on the design specifications GSA guidelines and DoD guidelines, the possibility of
progressive collapse of the CFS frame structure due to the damage of a part of the exterior
wall stud column was evaluated by Bae et al. (2008). It was point out that improving the

40
column compression capacity and the horizontal connection capacity which is directly
associated with the removed stud column is the efficient measure to stop the collapse. In 2013,
Mohamed et al. (2013) investigated the framing components of CFS stud bearing wall system
according to the nonlinear static analysis by Applied Element Method (AEM). It was proved
that enhance the lateral bracing and use double studs beside the removed wall panel can
improve the system performance of progressive collapse resistance. One element loss in a
structure possibly affects not only one adjacent structural element. A research (Gerasimidis et
al., 2014) demonstrated the partial damage of structural elements through the alternate load
path method. Finite element method was employed in analysis of damaged steel frame. Based
on the result of numerical simulation of disproportionate collapse, robustness measures were
presented involving single and multiple column damage. A sudden loss of one or more
structural members may lead to a catenary action in progressive collapse, which can be
assessed by the tensile tie force method. However, in some certain circumstance, TF method
seems to be unsafe. Therefore, a study (Tohidi et al., 2014b) has identified the alternative load
path in catenary effect (see Figure 2-10) and the corresponding calculation method. Moreover,
the 3D nonlinear numerical studies of steel strand and floor-to-floor joint system were carried
out by using ABAQUS and verified by full scale tests. The parametric analysis illustrated that
the bond behaviour of ties determines the joint reaction in developing the catenary action. In
the analytical analysis, the catenary action was taken into account. The connection is assumed
to provide ample ductility. The study neglected the local damage in the progressive collapse
process. The alternative force transfer path is derived (see Eq. 2-6 to 2-8).
Figure 2-10 Catenary action sketch (Tohidi et al., 2014b)
( )
(Eq. 2-6)

41
Let,
(Eq. 2-7)
( )
(Eq. 2-8)
where w is the uniformly distributed load (including permanent and variable loads); is the
spacing of ties; is the floor span length; is the force in the longitudinal tie joining
adjacent slabs; is the vertical displacement at the middle wall support; is the line load
exerted by the upper wall and is the percentage increase of the line load considering the
number of storeys.
In the view of the steel frame with abrupt removal of a column, researchers (Chen et al., 2016)
established a simplified beam model and developed the progressive collapse assessment
method with regard to structure energy absorption and catenary action at large deflections.
This method presents a good agreement with the experimental results.
2.5.2 Load redistribution mechanism
The disabled member caused by abnormal loading actually changes the force transferring path
in the structure. In the frame structure, if the internal load carrying column failed, structure
general response can be divided into three stages i.e. beam action stage, transition phase stage
and catenary action stage. Besides the main frame, accessories, such as slab floor and in-filled
walls of the construction, can also influence the structural behaviour due to abnormal loading.
Therefore, membrane action needs to be taken account in progressive collapse analysis.
2.5.2.1 Beam action
The connections provide moment resistance to carry the upper loads (see Figure 2-11). The
removed column possibly leads to the local damage of the joint. Plastic hinge is firstly formed
in the middle connection and then it occurs in the end connections. Thus, the beam action may
be transferred to catenary action and the force transfer path will change. Based on analysis of

42
reinforced concrete frame structure, Yi et al. (Li et al., 2011) suggested the ultimate
deformation for beam action as 0.06L.
Figure 2-11 Beam action (Li et al., 2011)
(Eq. 2-9)
(Eq. 2-10)
Due to the plastic hinge, the moment resistance of the middle connection is conservatively
neglected,
(Eq. 2-11)
(Eq. 2-12)
It is similar in the perpendicular direction.
2.5.2.2 Compressive arching action
This action is formed in the transition phase between beam action and catenary action. Cracks
occur at top beam end section and bottom middle span section. As a result, the neutral axis of
cross section shifts down at the ends and shifts up at the middle span. The force transferring
route forms an arc shape.
2.5.2.3 Catenary action
The horizontal forces are needed to be taken into account for the robustness of accident action.
The code (BS., 1997) requires the horizontal resistance of each floor should more than 15% of
the dead load. If the horizontal restraint of the connections is sufficient, catenary action can
occur during column loss and the beams are supposed to be in tension (see Figure 2-12).

43
Figure 2-12 Catenary action (Li et al., 2011)
√
√
(Eq. 2-13)
Considering and . (Eq. 2-13) can be simplified as
(Eq. 2-14)
( )
√
√
(
) (Eq. 2-15)
(Eq. 2-16)
It is similar in the perpendicular direction.
The beams appear like a bridge arch, hanging the upper weight, supported only by the ends.
There are two shapes of the arches (Lu et al., 2011). One is the curve (see Figure 2-13), with
the axial pull force T1=w0(L1+L2)2/8h.
Figure 2-13 Catenary action with curve arch
If it is straight line arch, with reference to Figure 2-12, the axial pull force is T2=L1L2 w0/h
(where L1 and L2 are the span of each beam. w0 is the uniformly distributed load (UDL). h is
the allowable deflection of the beam). When the span lengths are equal (L1=L2=L), the axial
pull force is given by: T1=T2/2. The shape of the curve depends on the horizontal restraint
which can be assumed as a spring. PCA (1979) performed full scale floor-to-floor tests to

44
evaluate the longitudinal ties. Based on the results, the catenary action can be achieved in the
range of 0.05L to 0.15L. For beams with a span-to-depth ratio greater than 5, the maximum
deformation due to catenary action is suggested as 0.2L (θ = 12˚) in specifications (DoD.,
2013).
2.5.2.4 Membrane action
The floor panel in construction is composited with concrete slab floor above the CFS joists.
As is shown in Figure 2-14, the joists are forced to deform with slab floor in a compatible
fashion of both directions. The interaction between joists and slab can lead to restrain on the
deflection caused by the ineffective interior column or panel. In fact, the membrane action
also affects the joists under normal working condition.
Figure 2-14 Membrane action
Due to the abnormal loads, load path is changed in the connection and structural members.
The potential failures of the structure are listed Shear rupture of the screw; Pull-over failure or
pull-out failure of screw; bearing tear-out failure in the connected sections; bearing tear-out
failure in the cleats; block shear rupture in the connected sections; block shear rupture in the
cleats; tension rupture in the cleats; beam failure and column failure.

45
2.5.2.5 Cantilever action
The removal of the external primary column or wall may result in cantilever action of the
adjacent beam or the floor in the structure. The cantilever element is anchored at one end to
the support which is forced against by moment, shear or tensile stress.
2.5.3 Design method
2.5.3.1 Tie force (TF) method
The Tie Force (TF) method is an indirect design approach for progressive collapse e.g. ties to
columns and walls and vertical ties, in which the horizontal and vertical tie force capacity
must be satisfied. In 1968, the British Standards (BS., 1997) firstly started to incorporate
provisions to deal with the problem of progressive collapse of concrete structure. The design
of internal ties at each floor and roof panel in each direction requires ties to carry tensile force
Fl in each direction, which is determined from the greater of
( )
(Eq. 2-17)
and
(Eq. 2-18)
In the expressions, gk is the characteristic dead load and qk is the imposed floor loads (in
kN/m2). L is the length of the floor span. The basic tie strength Ft is obtained from the minor
value of 4n0+20kN/m, where n0 is the number of stories and 60kN/m. The former is an
empirical formula, which emphasized the floor influence of basic tie strength. The latter is
obtained according to Figure 2-15.
Figure 2-15 Basic tie strength calculation in the British code (BS., 1997)

46
It is assumed that the horizontal members effectively provide ample tie strength resulting in a
catenary behaviour. The tie force Fl= qL2/(2Δ)=60kN/m (Δ is the middle deflection which is
adopted as L/5. The typical values were supposed in the expression L=5m, q=5kN/m2).
The prescriptive tie requirements were adopted in engineering practice and employed in DoD
(DoD., 2005). Base on British standard (BS., 1997), researchers (Li et al., 2011, Tohidi et al.,
2014a) developed an improved TF method for progressive collapse resistance. Numerical and
experimental studies of reinforced concrete (RC) frame structures were also presented by Li et
al. (Li et al., 2011) to reveal that the current TF method cannot make assurance to prevent
progressive collapse of all the RC structure and may lead to underestimation of the design
demand for low-rise frames by using fibre beam element model THUFIBER. The resistance
of progressive collapse can be improved in proportion to the number of frame stories. A
typical moment-to-curvature relationship of the plastic hinge was found out through the test,
presenting the reduction of the connection maximum moment due to the rotation. It was
suggested that the tie force Fi and Fj for beams i and j and the beam-end moment capacity Mi
in each direction should satisfy the following expressions:
(Eq. 2-19)
(Eq. 2-20)
where =0.67 is the internal force correction factor; q is the imposed loading; Li, Lj are the
span lengths of beams i and j in specific directions respectively; is the allowable limit of the
middle joint deflection (1/5 of the shortest span length).
Tohidi (Tohidi et al., 2014a) proposed a calculation of pull-out slip of longitudinal ties in
floor-to-floor system (see Figure 2-16) of precast concrete cross wall structures. The
equilibrium equation of the catenary system can be derived.
Based on the compatibility condition of deformation,
√
(Eq. 2-21)
(Eq. 2-22)
( )
(Eq. 2-23)

47
( )
(Eq. 2-24)
√
(Eq. 2-25)
where δl is the increase in the length of each floor slab; δls and δlm represent the extension
experienced at the side and middle supports respectively; bp is the spacing of ties.
Figure 2-16 Catenary action sketch (Tohidi et al., 2014a)
Nair (2004) conducted a case study based on five current codes and standards, which was
considered would not provide assurance against the progressive collapse. The inadequacy of
the TF method was also revealed in (Abruzzo et al., 2006). To achieve the efficiency of TF
method, DoD (2013) developed an improved TF method in which the required tie strength Fl
(lb/ft or kN/m) in the longitudinal or transverse direction is
(Eq. 2-26)
where floor load wF=1.2DL+0.5LL (DL=dead load, LL=live load). L1=either the greater of the
distances between the centres of the walls supporting any two adjacent floor spaces in the
longitudinal direction or the lesser between 5hw and the building width in the transverse
direction (ft or m). hw = clear story height (ft or m).
2.5.3.2 Alternative path (AP) method
The Alternative Path (AP) method requires the designer to seek an alternate load path for the
event of losing a member. The compromised member may be located at internal or peripheral
area where the surrounding components may mechanically tie together to provide the

48
alternative load path, carrying the dead and imposed loads (BS., 1997). According to the
position of the ineffectiveness occurred, the alternative load resistance mechanism can be
classified into seven types catenary action of beams or floors panels in one or two direction:
cantilever action of beam or panels; vertical tie action of wall panels; membrane action of
floor panels; partition wall action; vierendeel action; compressive arching action.
The current TF method is a static design method which is an idealized assumption. In order to
simulate the dynamic effect acting on the structure because of the sudden compromised
column, in accordance with the GSA guidelines (GSA., 2000), an amplified factor 2 for the
typical structural configuration or 1.5 for the atypical structural configuration is applied to the
evaluation, and the vertical static load is presented.
Load=2 or 1.5 (DL+0.25LL) (Eq. 2-27)
For linear and nonlinear static analyses of all construction types, DoD guidelines (DoD., 2005)
requires the amplified factored load combination as follow.
Load=2[(0.9 or 1.2) DL+ (0.5LL or 0.2SL)] +0.2WL (Eq. 2-28)
where SL=snow load, WL=wind load.
It was also specified that the collapse area of the floor directly above the removed element
must be less than the smaller of 70m2 or 15% of the total area. In addition, for the structures
with low level of protection (LLOP), AP method is not mandatory. Base on DoD and GSA
guidelines, (Bae et al., 2008) conducted a case study of the CFS framed structures (the army
barracks) under abnormal loading conditions using SAP2000. In each scenario, the vulnerable
part of the structure was detected. According to 2D and 3D numerical analysis carried out by
Ruth et al. (Ruth et al., 2015) the dynamic amplified factor of 2.0 suggested by both GSA
guidelines and DoD guidelines for static-nonlinear design is conservative relative to dynamic-
nonlinear analysis and the equivalent dynamic factors obtained in 3D models were higher than
that of 2D models but slightly lower than 1.50.

49
2.5.3.3 DoD and GSA guidelines
DoD and GSA guidelines provide the design methods of buildings, involving reinforced
concrete, structural steel, masonry, wood and CFS constructions, to resist progressive collapse.
The purpose of these guidelines is to reduce the progressive collapse risk in new and
renovated buildings when the primary element failed. In the new version (DoD., 2016, GSA.,
2016), the incongruities between DoD and GSA guidelines have been reduced in order to
bring uniform standard. These guidelines apply to constructions with three or more stories.
The design approaches include direct and indirect design approaches. The former includes
Alternate Path (AP) method which requires the structural can bridge over the missing
structural element, Enhanced Local Resistance (ELR) method which requires sufficient
strength of the building or parts to resist the specific load and Tie Force (TF) method is used
to enhance continuity, ductility and structural redundancy to resist abnormal load. The design
approach selection depends on the risk category (see Table 2-2) of the structure.
Table 2-2 Risk categories and design requirements
Risk Category Nature of Occupancya Design requirement
I
Low occupancy buildings that
represent a low hazard to human
life in the event of failure
No specific requirements
II
Inhabited buildings with less than
50 personal, primary gathering
buildings, billeting, and high
occupancy family housing
Option 1: TF for the entire structure
and ELR for the corner and
penultimate columns or walls at the
first story.
Option 2: AP for specified column
and wall removal locations.
III
Buildings and other structures that
represent a substantial hazard to
human life in the event of failure,
for example, the primary
occupancy is public assembly with
an occupant load greater than 300.
AP for specified column and wall
removal locations and ELR for all
perimeter first story columns or
walls.
IV
Buildings and other structures
designed as essential facilities, for
example, fire, rescue, ambulance
and police stations and emergency
vehicle garages.
TF and AP for specified column
and wall removal locations and
ELR for all perimeter first story
columns or walls.
a Section 1604.5.1 Multiple occupancies of the International Building Code (IBC).

50
The frame columns and load-bearing walls are used to carry the required vertical tie strength.
The connections and the structural elements should be capable of carrying the tie forces and
meet the continuity requirement (see Figure 2-17).
(Eq. 2-29)
where
= Design strength
= Strength reduction factor in LRFD approach
= Nominal strength
= Required strength ∑
= Load factor
= Load effect
Figure 2-17 Tie forces in the structure
The guidelines suggest the floor load to determine the required tie strengths:

51
(Eq. 2-30)
where
= Floor Load (lb/ft2 or kN/m
2)
= Dead Load (lb/ft2 or kN/m
2)
= Live Load (lb/ft2 or kN/m
2)
The required longitudinal tie force Fi (lb/ft2 or kN/m
2) is
(Eq. 2-31)
where
= Floor load (lb/ft2 or kN/m
2)
= Greater of the distances between the centres of the columns, frames, or walls supporting
any two adjacent floor spaces in the direction under consideration (ft or m)
The required peripheral tie strength in framed and two-way load-bearing wall buildings is
(Eq. 2-32)
In terms of one-way load-bearing wall buildings,
(Eq. 2-33)
where
= 3.3 ft or 1.0 m
= 1.2Dead load of cladding over the length of
= 1.2 Dead load of cladding over the length of
= Clear story height (ft or m)
In AP analysis procedure, the structural elements and components resisting collapse due to
removal of a vertical load-bearing element are classified as primary components. All other

52
elements and components are considered as secondary. The secondary beams are assumed to
be pinned at both connections without any flexural strength. The analysis includes force- and
deformation-controlled actions (see Table 2-3). The continuity of the element directly above
the removed component is assumed to be maintained (see Figure 2-18).
Table 2-3 Deformation-Controlled and Force-Controlled Actions
Component Deformation-Controlled Action Force-Controlled Action
Moment Frames:
Beams
Columns
Joints
Moment (M)
M
--
Shear (V)
Axial load (P), V
V1
Shear Walls M, V P
Braced Frames:
Braces
Beams
Columns
Shear Link
P
--
--
V
--
P
P
P, M
Connections P, V, M2 P, V, M
1 Shear may be a deformation-controlled action in steel moment frame construction.
2 Axial, shear, and moment
may be deformation-controlled actions for certain steel and wood connections
Figure 2-18 Continuity of the structure
The AP method includes three analysis procedures: linear static (LS), nonlinear static (NS)
and nonlinear dynamic (ND) procedures. To evaluate a building, a three-dimensional model
should be employed rather than two-dimensional models. In the linear static procedure (LSP),

53
The DCRs are introduced for the deformation controlled actions, which can be calculated by
the ratio of resulting actions and expected strength of the component or element. The
increased gravity loads for floor areas above removed column or wall is applied (see Table
2-4). The m-factor is defined in the guidelines for deformation controlled actions.
Table 2-4 Load increase factors for LSP
Material Structure Type Deformation-controlled Force-controlled
Steel Framed 0.9 mLIF + 1.1 2.0
Reinforced Concrete Framed 1.2 mLIF + 0.8 2.0
Load-bearing Wall 2.0 mLIF 2.0
Masonry Load-bearing Wall 2.0 mLIF 2.0
Wood Load-bearing Wall 2.0 mLIF 2.0
Cold-formed Steel Load-bearing Wall 2.0 mLIF 2.0
mLIF is the smallest m of any primary beam, girder, spandrel or wall element that is directly connected to the
columns or walls directly above the column or wall removal location.
All primary and secondary components shall be checked by:
For deformation-controlled actions,
(Eq. 2-34)
For force-controlled actions,
(Eq. 2-35)
where
= Strength reduction factor from the appropriate material specific code (such as ACI 318,
AISC Steel Construction Manual, etc).
= Component or element demand modifier (m-factor).
= Expected strength of the component or element for deformation-controlled actions.
= Lower-bound strength of a component or element for force-controlled actions.
= Force-controlled action from Linear Static model.

54
It should be note that overall and local stability must be considered, however, a P-Δ analysis
is not required for the LS approach due to the small deformations. In NSP, the dynamic
increase factors (DIF) are given in Table 2-5 to simulate the dynamic effects. Gravity
loads modified by DIF are applied to the entire structure.
Table 2-5 Dynamic increase factors for LS analysis
Material Structure Type
Steel Framed 1.08 +0.76/(pra/y + 0.83)
Reinforced Concrete Framed 1.04 +0.45/(pra/y + 0.48)
Load-bearing Wall 2.0
Masonry Load-bearing Wall 2.0
Wood Load-bearing Wall 2.0
Cold-formed Steel Load-bearing Wall 2.0
pra is the plastic rotation angle. y is the yield rotation.
In NDP, the loads starting at zero monotonically and proportionately increase to the entire
model until equilibrium is reached. Then, the column or wall section shall be removed
instantaneously less than one tenth of the period associated with the structural response mode
for the vertical motion of the bays above the removed element. The analysis shall stop when
the maximum displacement is reached or one cycle of the vertical motion occurs.
The ELR method requires the column, wall and connections between the structural elements
must not fail in shear before the maximum flexural strength reached. All strength reduction
factors (see Eq. 2-29) shall be 1.0. The material strengths for shear, flexure and all other
actions shall be the expected material strength (i.e., with the appropriate over-strength factor
applied to the lower bound material strength = 0.85 expected strength values for CFS
structures).
2.6 Knowledge gaps
2.6.1 Purlin-to-sheeting system
Eurocode3 (EC3) provides the calculations for the rotational stiffness of purlin-to-sheeting
connection. Based on the test results (Zhao et al., 2014), it was found that the prediction of

55
EC3 is not accurate due to the neglect or underestimate the effect of parameters, such as
purlin thickness, depth and flange width.
2.6.2 Stud-to-track connection
As for stud-to-track connection, the joining methods employed in light steel modular
construction has been introduced by researchers (Gorgolewski et al., 2001b, Trahair et al.,
2007). Many types of joints can be used in CFS construction industry, including bolts, screws,
rivet, etc. (SCI., 2015). Previous studies focusing on the optimization of conventional stud-to-
track wall systems have suggested using extra screws as a practical and an efficient solution
for the improvement of the resistance of the thin-walled systems. Although bolts with nut and
head are expected to be overly strong when applied in thin-walled structures, they might be an
alternative for extra screws.
The current norms and specifications have provided the design provision of single lap screw
and bolt joints. However, in the CFS component assemblies, there usually are gaps between
the connected sheets. The clearance of the joint may reduce the bearing strength of the
screwed or bolted connections because of warping or local buckling occurs. It needs to be
further investigated.
2.6.3 Screw and bolt joints
Connections with bolt/screw joints have been widely adopted in CFS constructions. Although
codified models are available to predict the initial stiffness and resistance of CFS bolt joint
(Eurocode, 2005), no method has been yet proposed to evaluate its overall behaviour which
significantly impacts the entire structural behaviour in progressive collapse analysis (Stoddart
and E., 2012, Stylianidis and Nethercot, 2015, Lim and Krauthammer, 2006, Liu, 2010) and
the quasi-plastic analysis (Liu et al., 2011).
Specification AISI-S100 provides a model to predict the resistance of connections subjected
to the combined tension and shear, which is only based on one failure mode, i.e. the pull-
through. Chinese technical code (GB., 2002) for cold-formed thin-walled steel structures

56
suggests an interaction model for the combined shear and tension, in which the resistance
models for the sole tension or shear and their corresponding failure models are not clearly
indicated though.
The structural behaviour of the screw joint has rarely investigated, in particular, when they are
subjected to the combined shear and tension. The use of high strength steel also causes new
challenges due to its differing material properties. One of the key differences is that the high
strength steel has lower ductility compared with the mild steel. The yield stress of high
strength steel is closer to its ultimate strength. Therefore, further research is required to
illustrate the potential implications on the structural behaviour of the connections made of
high strength steel. The design recommendation should be made through examining the
resistance, the stiffness and the ductility of the screw connected joints.
2.6.4 Joist-to-post connection
Thin-walled members are often open sections. Transverse loads applied on cold-formed open
section joists do not pass through the shear centre of the section, leading to torsion acting on
the connection. The torsion may induce twisting and/or warping deformations in the
connected zones, which is likely to lead to local failure in the connection. The more effective
and efficient connection method needs to be developed to improve the structural performance.
2.6.5 Robustness of CFS modular structure
The design methods described in current guidelines (DoD and GSA) apply to the framed and
load-bearing wall buildings do not include modular panel systems. The ineffectiveness of the
unit in the modular structure may lead to different load resistance mechanism.
The connections for modular building systems seem to be more complicated than traditional
cast-in-place construction. These guidelines could not cover the design requirements for
modular construction systems, and the suggestion of connection configurations is not
involved in these guidelines.

57
In fact, the robustness and the load redistribution of the structure due to the removal of the
structural element may be determined by the responds of the load carrying members and the
connections between primary elements. The mechanical properties, involving stiffness and
strength under tension, shear and rotation actions, of the connection are usually nonlinear and
vary depending on the type of connection configuration between modules. The entire
structural behaviours of different connection configurations under normal and abnormal
loading conditions and the influence of that on the robustness of the CFS modular
constructions have not been widely studied.
2.7 Summary
An extensive literature was reviewed for understanding the status of relevant research
development. Basic concepts of modular constructions were established. A limited knowledge
scope of connection technologies was presented, such as screwed connection, bolted
connection, press joint, rosette joint, etc. The advantages of this construction such as waste
reduction, recyclability, reusability, fast assembling, energy saving, carbon emission
reduction, etc. have been realized in construction industry. However, challenges still exist.
Connection is known as the pivotal issue in CFS structures as well as modular structures. The
various fasteners, high-strength materials, thin-walled sections and various configurations
applied have made the connection become one of the key issues in the development of off-site
CFS modular structures. In the progressive collapse process, beam action and the catenary
action usually lead to mixed loads imposed on the connection. In order to find out the
effective and efficient connection method, the entre response of the connection should be
estimated with regard to the structural robustness.

58
CHAPTER 3 PURLIN-TO-SHEETING CONNECTION
3.1 Introduction
In roof systems, CFS purlins attached to corrugated sheeting are widely used due to its shorter
construction time. Traditional CFS purlin cross-section types include C-section and Z-section;
the former is usually applied on flat roofs and the latter is generally used on the pitch roofs. Σ-
section purlin, which evolved from C-section purlin but with two more insets, has been
proposed since it has better torsional resistance capacity. These open-section purlins are
known to be vulnerable to various buckling modes. The attachment of corrugated sheeting can
provide lateral restraints to the purlins and therefore enhance the overall load bearing capacity.
The magnitude of the additional rotational stiffness offered by the sheeting will affect the load
bearing capacity of the purlin. A series of laboratory tests of purlin-sheeting system were
conducted in the companion study (Zhao et al., 2014). The rotational stiffness of the each
purlin specimen was obtained by the vertical load and the corresponding rotation captured.
The scenarios of uplift and gravity loads were involved.
Based on the test results, it was found that the current design method in Eurocode3 (EC3)
cannot accurately predict the purlin-sheeting rotational stiffness. The effect of wall thickness,
flange width and depth of the purlin are neglected in EC3.
In this chapter, an integral model established numerically for predicting the rotational stiffness
provided by corrugated sheeting to the Σ purlin is presented. The model is validated against
existing experiments. Parametric studies are conducted to reveal the effect of varying the
geometric dimensions of the purlin and the interval of the screws on the rotational stiffness.
Based on the numerical results, compensation coefficients are proposed to the current EC3
approach to calculating the rotational stiffness of Σ purlin-corrugated sheeting system.

59
3.2 Experimental and analytical studies
3.2.1 Laboratory tests
Laboratory tests of purlin-sheeting system were conducted and the results were presented in
the companion study (Zhao et al., 2014). The experiment was set up according to
requirements stated in EC3 (Eurocode, 2006b). During the test, the Σ purlin with a length of
1m was attached to the corrugated sheeting by five self-drilling screws with a diameter of
5.5mm. The screws were located at the centreline of one flange of the purlin connected to the
sheeting‟s trough, as shown in Figure 3-1. The point load was distributed on the free flange by
using a steel bracket with 7 bolts.
In the test, the sheeting was fixed on the ground via bottom cleats and M10 bolts. Two
scenarios: face-up (gravity/downward loading case) and face-down (uplift loading case), were
conducted during the test as shown in Figure 3-1.
Figure 3-1 Test setup
The configurations of tested purlin sections and corrugated sheeting are shown in Figures 3-2
and 3-3, where W is the total cross-section depth; F is the flange width; t is the thickness; L is
the lip length; O is the depth of the top and bottom parts of the web adjacent to the flanges in
the Σ-section; I is the middle part of the modified web in the Σ-section; S is the width of the
inward bend of the web and r is the corner radius Figure 3-2.

60
a) Σ-section b) C-section c) Z-section
Figure 3-2 Diagram of Σ-, C- and Z- sections
(a) Profile of the sheeting (b) Geometric dimensions of sheeting
Figure 3-3 Configurations of sheeting (Zhao et al., 2014)
Figure 3-4 Coupon test setup Figure 3-5 Stress-strain curve of the material
The cross-section dimensions of each specimen are provided in Table 3-1 and 3-2. The
material properties of the specimen were obtained from tensile coupon tests (BSI., 2009). The
coupons were cut from the flat region of CFS Σ-sections and the tests were conducted by
0
100
200
300
400
500
600
700
0 0.05 0.1 0.15 0.2
Str
ess (
MP
a)
Strain

61
using a SANS 20t displacement controlled test machine (see Figure 3-4). The average stress-
strain curve is shown in Figure 3-5.
Table 3-1 Geometric dimensions of Σ- sections
Specimen W(mm) F(mm) L(mm) O(mm) S(mm) t(mm)
∑20012 200 62.5 20 45 16 1.2
∑20016 200 62.5 20 45 16 1.6
∑20025 200 62.5 20 45 16 2.5
∑24015 240 62.5 20 45 16 1.5
∑24023 240 62.5 20 45 16 2.3
∑24030 240 62.5 20 45 16 3.0
∑30018 300 75 20 60 16 1.8
∑30025 300 75 20 60 16 2.5
∑30030 300 75 20 60 16 3.0
Table 3-2 Geometric dimensions of C- and Z- sections
Specimen W(mm) F(mm) L(mm) t(mm)
C20012 200 62.5 20 1.2
C24023 240 62.5 20 2.3
C30030 300 75 20 3.0
Z14614 145 62.5 20 1.4
Z14618 145 62.5 20 1.8
Z20617 200 65 20 1.7
Z30720 300 75 20 2.0
3.2.2 Analytical design approach in EC3
The analytically derived equation for calculating the total rotational stiffness ( ) contributed
by the sheeting to the purlin is specified in Equation 10.14 of EC3 (Eurocode, 2006b) and
given by:
( ) (Eq. 3-1)
where is the rotational stiffness of the connection between the sheeting and the purlin;
and is the rotational stiffness corresponding to the flexural stiffness of the sheeting.
The value of can be determined by using Eq. 3-2.

62
(Eq. 3-2)
where
(
)
if
(
) if
(
)
if
(
)
if negative position;
(
)
if positive position;
if
when the sheet thickness less than 0.75mm;
√
if otherwise
is the width of the purlin flange;
is the thickness of the sheeting;
is the corrugation width;
is the width of the sheeting flange through which it is fastened to the purlin;
is given in Table 10.3 EN 1993-1-3;
is a rotation coefficient, representing the value of if ba=100mm.
The value of may be taken as the minimum value calculated based on the models of the
type shown in Figure 3-6, taking account of the rotations of the adjacent purlins and the
degree of continuity of the sheeting, using:

63
(Eq. 3-3)
where is the applied moment per unit width of sheeting; is the resulting rotation.
The conservative value of may be obtained from:
(Eq. 3-4)
where is the numerical coefficient with values as shown in Figure 3-6; is the Young‟s
module of the material; is the effective second moment of area per unit width of the
sheeting; is the spacing of the purlins.
Figure 3-6 Model for calculation
Base on the experimental study, the value of is 2 as end, upper case of Figure 3-6. The
distance between the purlin and the fixed end of the sheeting is 700mm. is determined by
the dimension of the corrugated sheeting as shown in Figure 3-3b. The Young‟s module E is
obtained by the result of coupon test (see Figure 3-4 and 3-5). The specimen geometric
dimensions of Σ-sections have been introduced in Table 3-1. The analytically rotational
stiffness can be calculated involving downward and uplift loading scenarios. The results
are shown in Table 3-3.
In the test, the total applied load and the applied moment per unit width of the sheeting M can
be obtained. The test electrical inclinometer recorded the rotation angle of the purlin . The
total rotation angle includes the rotation angle of the cantilever sheet , the rotation angle
caused by the localised deformation of the sheet (see Figure 3-11), the rotation angle

64
because of the separation between the sheeting and the purlin at the connected point and
the rotation angle due to the bending of purlin flange (see Figure 3-7).
Table 3-3 Geometric dimensions of Σ- sections
Specimen k E(MPa) (cm4/m) (mm) (Nm/m/rad) (Nm/m/rad) (Nm/m/rad)
∑20012
2 210000 6.21 700 37260
970 (downward)
470 (uplift)
946 (downward)
464 (uplift)
∑20016 970 (downward)
470 (uplift)
946 (downward)
464 (uplift)
∑20025 970 (downward)
470 (uplift)
946 (downward)
464 (uplift)
∑24015 970 (downward)
470 (uplift)
946 (downward)
464 (uplift)
∑24023 970 (downward)
470 (uplift)
946 (downward)
464 (uplift)
∑24030 970 (downward)
470 (uplift)
946 (downward)
464 (uplift)
∑30018 1397 (downward)
677 (uplift)
1347 (downward)
665 (uplift)
∑30025 1397 (downward)
677 (uplift)
1347 (downward)
665 (uplift)
∑30030 1397 (downward)
677 (uplift)
1347 (downward)
665 (uplift)
Figure 3-7 Illustration of the rotational deformation (Zhao et al., 2014)
Pivot point line M
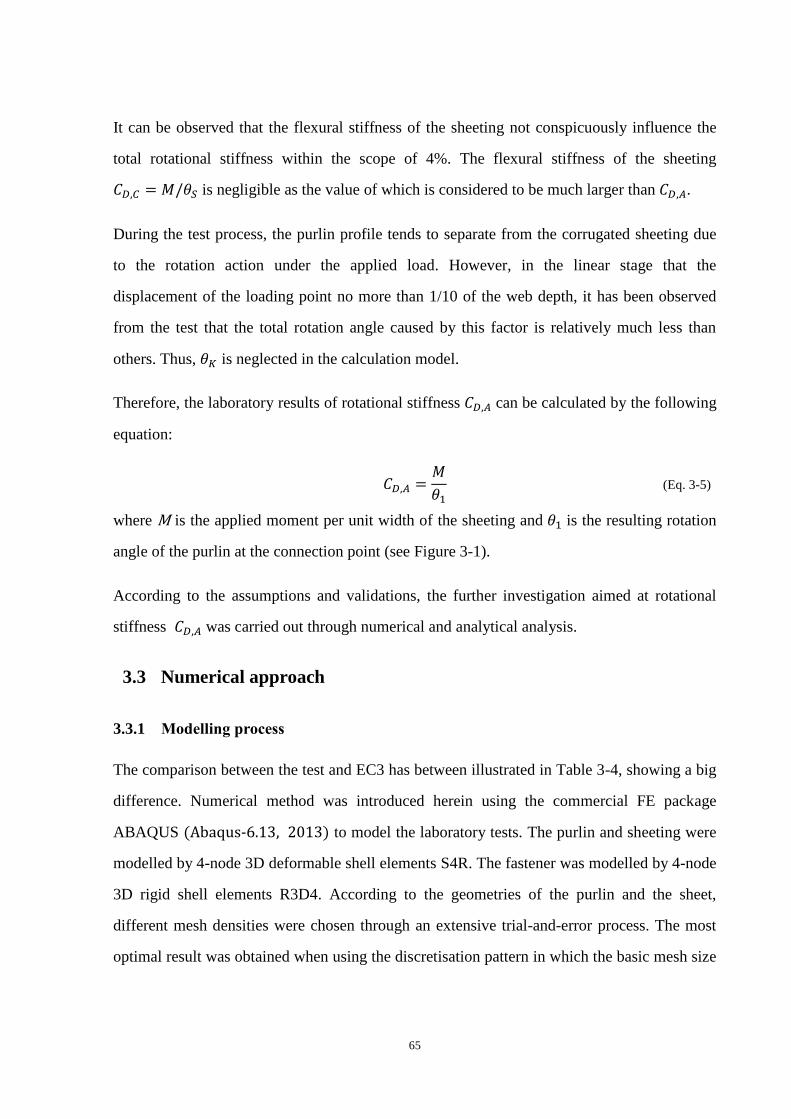
65
It can be observed that the flexural stiffness of the sheeting not conspicuously influence the
total rotational stiffness within the scope of 4%. The flexural stiffness of the sheeting
is negligible as the value of which is considered to be much larger than .
During the test process, the purlin profile tends to separate from the corrugated sheeting due
to the rotation action under the applied load. However, in the linear stage that the
displacement of the loading point no more than 1/10 of the web depth, it has been observed
from the test that the total rotation angle caused by this factor is relatively much less than
others. Thus, is neglected in the calculation model.
Therefore, the laboratory results of rotational stiffness can be calculated by the following
equation:
(Eq. 3-5)
where M is the applied moment per unit width of the sheeting and is the resulting rotation
angle of the purlin at the connection point (see Figure 3-1).
According to the assumptions and validations, the further investigation aimed at rotational
stiffness was carried out through numerical and analytical analysis.
3.3 Numerical approach
3.3.1 Modelling process
The comparison between the test and EC3 has between illustrated in Table 3-4, showing a big
difference. Numerical method was introduced herein using the commercial FE package
ABAQUS (Abaqus-6.13, 2013) to model the laboratory tests. The purlin and sheeting were
modelled by 4-node 3D deformable shell elements S4R. The fastener was modelled by 4-node
3D rigid shell elements R3D4. According to the geometries of the purlin and the sheet,
different mesh densities were chosen through an extensive trial-and-error process. The most
optimal result was obtained when using the discretisation pattern in which the basic mesh size

66
of 13mm for the member and a refined mesh of 1mm were applied around the bolt hole. An
example of the mesh pattern is shown in Figure 3-8.
The interaction between the shell and bolt was “tie” contact and the “hard contact” condition
was applied between purlin and the sheeting to remove over-closure between surfaces and the
sheeting was simply supported and the purlin was restrained in the longitudinal direction (z
axis) to prevent overall movement because of the previous assumptions.
A point load was applied at the mid-span of the purlin by creating a reference point located at
the flange-to-web junction line or the flange-to-lip junction line to represent the uplift or
downward case (as shown in Figure 3-9). A nonlinear incremental-iterative, Full-Newton
solution was adopted in the analysis for solving the nonlinear equilibrium equations. The
principal advantage of Newton‟s method is the high convergence rate. The material property
for the purlin element was simulated by a multi-linear stress-strain curve based on the true
stress-strain curve from the coupon tests (see Figure 3-5); for the sheeting element, the
material property was given by a bilinear stress-strain curve with nominal yield strength of
235MPa.
Figure 3-8 Meshed model Figure 3-9 Boundary conditions
3.3.2 Result discussions
The structural displacement of the purlin and the local deformation of the sheeting in the FE
model are shown in Figures 3-10 and 3-11 respectively. The comparison of the moment-
rotation curves from experimental and numerical results is shown from Figure 3-12 to 3-20.

67
a) Under uplift load
b) Under downward load
Figure 3-10 Structural displacement of the purlin
Figure 3-11 Deformation of the sheeting

68
Rotational stiffness obtained from the FEM CFEM is compared with the calculated ones
using EC3 ( ) and the measured ones from the laboratory test , as listed in Table 3.
The values in FEM are determined when the displacement of free edge of the purlin
equal to 1/10 of the web depth (Zhao et al., 2014). It can be observed that some FEM results
are above the test ones, but some below the test results. The deviation may be caused by the
measurement error in the tests.
Figure 3-12 Moment to rotation curves (20012)
Figure 3-13 Moment to rotation curves (20016)
Figure 3-14 Moment to rotation curves (20025)
0
50
100
150
200
250
300
350
0 0.1 0.2 0.3 0.4 0.5
Mom
ent (N
m)
Rotation (Radian)
20012 downward
Test
FEM
0
50
100
150
200
250
300
350
0 0.1 0.2 0.3 0.4 0.5
Mom
ent (N
m)
Rotation (Radian)
20012 uplift
Test
FEM
0
50
100
150
200
250
300
350
0 0.1 0.2 0.3 0.4 0.5
Mom
ent (N
m)
Rotation (Radian)
20016 downward
Test
FEM
0
50
100
150
200
250
300
350
0 0.1 0.2 0.3 0.4 0.5
Mom
ent (N
m)
Rotation (Radian)
20016 uplift
Test
FEM
0
50
100
150
200
250
300
350
0 0.1 0.2 0.3 0.4 0.5
Mom
ent (N
m)
Rotation (Radian)
20025 downward
TestFEM
0
50
100
150
200
250
300
350
0 0.1 0.2 0.3 0.4 0.5
Mom
ent (N
m)
Rotation (Radian)
20025 uplift
TestFEM

69
Figure 3-15 Moment to rotation curves (24015)
Figure 3-16 Moment to rotation curves (24023)
Figure 3-17 Moment to rotation curves (24030)
Figure 3-18 Moment to rotation curves (30018)
0
50
100
150
200
250
300
350
0 0.1 0.2 0.3 0.4 0.5
Mom
ent (N
m)
Rotation (Radian)
24015 downward
TestFEM
0
50
100
150
200
250
300
350
0 0.1 0.2 0.3 0.4 0.5 0.6
Mom
ent (N
m)
Rotation (Radian)
24015 uplift
TestFEM
0
50
100
150
200
250
300
350
0 0.1 0.2 0.3 0.4 0.5
Mom
ent (N
m)
Rotation (Radian)
24023 downward
Test
FEM
0
50
100
150
200
250
300
350
0 0.1 0.2 0.3 0.4 0.5
Mom
ent (N
m)
Rotation (Radian)
24023 uplift
Test
FEM
0
50
100
150
200
250
300
350
0 0.1 0.2 0.3 0.4 0.5
Mom
ent (N
m)
Rotation (Radian)
24030 downward
Test
FEM
0
50
100
150
200
250
300
350
0 0.1 0.2 0.3 0.4 0.5
Mom
ent (N
m)
Rotation (Radian)
24030 uplift
Test
FEM
0
50
100
150
200
250
300
350
0 0.1 0.2 0.3 0.4 0.5
Mom
ent (N
m)
Rotation (Radian)
30018 downward
Test
FEM
0
50
100
150
200
250
300
350
0 0.1 0.2 0.3 0.4 0.5 0.6
Mom
ent (N
m)
Rotation (Radian)
30018 uplift
Test
FEM

70
Figure 3-19 Moment to rotation curves (30025)
Figure 3-20 Moment to rotation curves (30030)
According to Figure 3-12 to 3-20, a good agreement can be found between the FEM and the
test results, implying that the numerical model is valid.
Table 3-4 demonstrates that the average ratio of the predicted rotational stiffness between the
numerical model and the test is 1.09, with a standard deviation of 0.07, whereas the average
analytical-to-test ratio is 1.03, with a standard deviation of 0.42. The test results indicate that
the purlin thickness significantly affect the rotational stiffness. However, this factor is not
concerned by EC3, leading to the rotational stiffness for thinner purlins (no less than 1.5mm)
overestimated and for thicker purlins (less than 1.5mm) under-estimated by the analytical
method in downward load cases. The similar outcomes happen in upward load cases.
It can be concluded that FEM has a better capability in predicting rotational stiffness than the
current analytical expressions. One reason for the discrepancy between FEM and test result is
the negligence of the washer in the numerical model, which was used in the test to avoid local
failure by reducing concentration stress around the bolt hole. In the modelling, the screws
0
50
100
150
200
250
300
350
0 0.1 0.2 0.3 0.4 0.5 0.6
Mom
ent (N
m)
Rotation (Radian)
30018 uplift
Test
FEM
0
50
100
150
200
250
300
350
0 0.1 0.2 0.3 0.4 0.5
Mom
ent (N
m)
Rotation (Radian)
30025 uplift
TestFEM
0
50
100
150
200
250
300
350
0 0.1 0.2 0.3 0.4 0.5
Mom
ent (N
m)
Rotation (Radian)
30030 downward
Test
FEM
0
50
100
150
200
250
300
350
0 0.1 0.2 0.3 0.4 0.5
Mom
ent (N
m)
Rotation (Radian)
30030 uplift
TestFEM

71
were simulated as rigid element and the mutual movement between the fastener and
components was restrained, which leads to an enhancement of the screw joint stiffness in the
connection. As a result, the rotational stiffness is overestimated by 9% in FEM.
Table 3-4 Comparison of results
Specimen
FEM Comparison
Load
(N)
(rad) CFEM
(Nm/m/rad)
CTest
(Nm/m/rad) CFEM/CTest
(Nm/m/rad)
/CTest
∑20012D 150 0.065 573 502 1.14 970 1.93
∑20012U 125 0.073 450 394 1.14 470 1.19
∑20016D 256 0.066 756 691 1.09 970 1.40
∑20016U 238 0.077 638 622 1.03 470 0.76
∑20025D 606 0.079 1049 1024 1.02 970 0.95
∑20025U 606 0.089 943 895 1.05 470 0.53
∑24015D 230 0.060 760 696 1.09 970 1.39
∑24015U 148 0.066 582 593 0.98 470 0.79
∑24023D 484 0.081 980 1009 0.97 970 0.96
∑24023U 438 0.085 876 848 1.03 470 0.55
∑24030D 641 0.091 1156 1047 1.10 970 0.93
∑24030U 641 0.099 1057 909 1.16 470 0.52
∑30018D 202 0.074 943 753 1.25 1397 1.86
∑30018U 150 0.073 785 735 1.07 677 0.92
∑30025D 338 0.080 1181 1078 1.10 1397 1.30
∑30025U 275 0.080 1050 921 1.14 677 0.74
∑30030D 430 0.085 1292 1191 1.08 1397 1.17
∑30030U 353 0.083 1171 977 1.20 677 0.69
Mean 1.09 1.03
S.D. 0.07 0.42
Note: CFEM is the rotational stiffness obtained from FEM; is the analytical rotational stiffness achieved by
EC3; CTest is the rotational stiffness obtained from the laboratory tests; D represents the downward load case and
U represents the uplift load scenario.
3.3.3 Parametric studies
A series of parametric studies are conducted to investigate the influence of the fastener
spacing and sheeting thickness on the rotational stiffness, and only one variable is changed at
a time during the analysis.

72
3.3.3.1 Fastener spacing
In the following figures, the y-axis represents the rotational stiffness and the x-axis represents
the ratio between fastener spacing (e) and corrugation width ( according to
the test). The fastener used in the models is rigid shell elements with the diameter of 5.5mm.
From Figure 3-21 to 3-23, the rotational stiffness decreases with the increase of e/ . In
general, the results of FEM are in good accordance with the test outcomes. It can be observed
that the prediction of EC3 does not change with the increase of the specimen thickness, while
the results of FEM and test increase.
The figures show that as the fastener spacing increases, the rotational stiffness decreases as
expected. The FEM results show good accordance with the test results. The mean value in
FEM drops by 36% and 33% for downward loading case and uplift loading cases,
respectively, when increasing fastener spacing from 1.0 to 2.0 .
Figure 3-21 The effect of fastener spacing (20012)
Figure 3-22 The effect of fastener spacing (20012)
0
200
400
600
800
1000
1200
0.5 1 1.5 2 2.5
CD
,A(
Nm
/m/r
ad)
e/bR
20012 downward
FEM
EC3
Test0
100
200
300
400
500
0.5 1 1.5 2 2.5
CD
,A(
Nm
/m/r
ad)
e/bR
20012 uplift
EC3
Test
FEM
0
200
400
600
800
1000
1200
0.5 1 1.5 2 2.5
CD
,A(
Nm
/m/r
ad)
e/bR
20016 downward
EC3
Test
FEM 0
100
200
300
400
500
600
700
0.5 1 1.5 2 2.5
CD
,A(
Nm
/m/r
ad)
e/bR
20016 uplift
EC3
Test
FEM

73
Figure 3-23 The effect of fastener spacing (20025)
3.3.3.2 Sheeting thickness
The corrugated sheeting with three thicknesses ( ), 0.7mm, 1.0mm and 1.5mm, are analysed
herein (see Figure 3-24 to 3-26). With the increase of the shell thickness, the rotational
stiffness obtained by FEM presents the same trend with EC3. However, the deviation also can
be found. When the purlin thickness changes from 1.2mm to 2.5mm, this deviation grows
significantly in the uplift load cases and the ratio between EC3 prediction and FEM result
decreases in the downward load cases. It is found that the sheet thickness has a significant
effect on the rotation behaviour of the Σ purlin-corrugated sheeting system. Rotational
stiffness increases for the 200 series purlin with increasing sheet thickness from 0.7mm to
1.2mm. The EC3 and FEM show an increase of 71% and 87% in the rotational stiffness under
downward load when the thickness increases from 0.7mm to 1.0mm, and an increase of 31%
and 43% when the thickness increases from 1.0mm to 1.2mm, respectively. A similar trend
can be identified for the 200 series purlin under uplift load, with the corresponding values
being 71% and 31% for EC3 method, and 75% and 35% for FEM.
Figure 3-24 The effect of sheeting thickness (20012)
0
200
400
600
800
1000
1200
0.5 1 1.5 2 2.5
CD
,A(
Nm
/m/r
ad)
e/bR
20025 downward
EC3
Test
FEM0
200
400
600
800
1000
0.5 1 1.5 2 2.5
CD
,A(
Nm
/m/r
ad)
e/bR
20025 uplift
EC3
Test
FEM
0
500
1000
1500
2000
2500
0.6 0.8 1 1.2
CD
,A(
Nm
/m/r
ad)
ts (mm)
20012 downward
EC3
FEM
0
200
400
600
800
1000
1200
0.6 0.8 1 1.2
CD
,A(
Nm
/m/r
ad)
ts (mm)
20012 uplift
EC3
FEM

74
Figure 3-25 The effect of sheeting thickness (20016)
Figure 3-26 The effect of sheeting thickness (20025)
3.3.3.3 Purlin web depth, flange width and shell thickness
The effect of varying web depth (W), shell thickness (t) and flange width (F) on the rotational
stiffness of the purlin-sheeting connection is demonstrated in Figure 3-27 to 3-29.
Figure 3-27 with different web depths Figure 3-28 with different shell thickness
0
500
1000
1500
2000
2500
0.6 0.8 1 1.2
CD
,A(
Nm
/m/r
ad)
ts (mm)
20016 downward
EC3FEM
0
500
1000
1500
2000
0.6 0.8 1 1.2
CD
,A(
Nm
/m/r
ad)
ts (mm)
20016 uplift
EC3FEM
0
500
1000
1500
2000
2500
3000
0.6 0.8 1 1.2CD
,A(
Nm
/m/r
ad)
ts (mm)
20025 downward
EC3
FEM
0
500
1000
1500
2000
2500
0.6 0.8 1 1.2
CD
,A(
Nm
/m/r
ad)
ts (mm)
20025 uplift
EC3
FEM
0
200
400
600
800
1000
∑20018 ∑22518 ∑24018 ∑26518
CD
,A(
Nm
/m/r
ad)
Σ-sections
downward uplift
0
200
400
600
800
1000
1200
CD
,A (
Nm
/m/r
ad)
Σ-sections
downward uplift

75
Figure 3-29 with different flange widths
Comparisons demonstrated in Figure 3-27 indicate that the effect of increasing web depths on
the rotational stiffness is not obvious. It shows in the Figure 3-28 that the rotational stiffness
increases remarkably with increasing section thickness for both downward and uplift load.
Figure 3-29 also demonstrates an increase trend with increasing flange width. Since the
analytical method does not consider factors such as the thickness and the overall depth of the
purlin, a modification method is hence presented herein to improve the accuracy of the
codified method. Since the influence caused by web depth is insignificant on the rotational
stiffness, the effect is discarded in the following modification process.
3.4 Modification approach
The experimental and numerical outcomes show that the codified design approach in EC3 is
less accurate for predicting the rotational stiffness as it neglects the effect of the purlin
thickness and underestimate the effect of flange width. Therefore, a compensation
coefficient ( ), given by Eq. 3-6, is introduced herein to modify the EC3 approach. The
relationship between obtained by the modified analytical value and the EC3 codified
value is given by Eq. 3-7.
( ) (Eq. 3-6)
( )
(Eq. 3-7)
where βt and βf are the correction coefficients for shell thickness and flange width
respectively; is the modified analytical value.
0
200
400
600
800
1000
1200
1400
1600
37.5 50 62.5 75 87.5
CD
,A(
Nm
/m/r
ad)
Flange width
Downward
EC3
FEM
0
200
400
600
800
1000
1200
37.5 50 62.5 75 87.5
CD
,A(
Nm
/m/r
ad)
Flange width
Uplift
EC3
FEM

76
The design formula for is derived from the parametric study and the formulae for is
obtained based on the regression analysis. In the analysis, the purlin thickness (t) is
determined as the main variables affecting stiffness of purlin system. According to the
relationship between (t) and dependent variable( ), the nonlinear expectation function is
assumed to be parabola (see Figure 3-30 and 3-31):
(Eq. 3-8)
The expressions (Eqs. 3-10 and 3-11) of for downward and uplift load can be obtained
using data analysis software ORIGIN8.0. In order to improve the accuracy of the analysis, the
equations (Eqs. 3-9 to 3-11) are employed when determination coefficients are over 0.98 in
the regression analysis.
(Eq. 3-9)
For downward load,
(Eq. 3-10)
and for uplift load,
(Eq. 3-11)
where t is the thickness of section and is the width of flange.
Figure 3-30 β-t relationship under downward load Figure 3-31 β-t relationship under uplift load
The comparison of rotational stiffness ( ) between modified analytical method and other
approaches is shown in Figure 3-32 and 3-33.
y = -0.4247t2 + 3.1328t - 0.5583 R² = 0.9841
0
1
2
3
4
5
6
1 1.5 2 2.5 3 3.5
β
t(mm)
Downward
y = -0.7194t2 + 6.0644t - 2.1918 R² = 0.9992
0
2
4
6
8
10
12
1 1.5 2 2.5 3 3.5
β
t(mm)
Uplift

77
As shown in Figure 3-32, in contrast to test results, predictions obtained by the current
specification (EC3) generally overestimate the rotational stiffness of the purlin-to-sheet
connection under gravity load. On the contrary, when uplift load is applied on the sheet,
conservative results are obtained from the analytical approach (EC3).
Meanwhile, the modified method shows better agreement with the test results, with the
average ratio being 1.10 and 1.00, and the standard deviation being 0.07 and 0.08 for the
download and uplift scenario, respectively (see Figure 3-33).
Figure 3-32 Rotational stiffness with downward & uplift load
Figure 3-33 Results comparison of
In order to further validate the modified method, more purlin-sheeting models with C- and Z-
sections are analysed. The comparison is listed in Table 3-5.
0
200
400
600
800
1000
1200
1400
1600
CD
,A(
Nm
/m/r
ad)
Sections
Downward
EC3 Test FEM Modification
0
200
400
600
800
1000
1200
1400
CD
,A(
Nm
/m/r
ad)
Sections
Uplift
EC3 Test FEM Modification
0.40
0.60
0.80
1.00
1.20
1.40
1.60
1.80
2.00
CD
,A/C
test
sections
Download
Cm/Ctest
CA,DA/Ctest0.40
0.50
0.60
0.70
0.80
0.90
1.00
1.10
1.20
1.30
CD
,A/C
test
sections
Uplift
Cm/Ctest
CA,DA/Ctest

78
Table 3-5 Comparison of with C- and Z-section purlins
Specimen βt βF CTest
(Nm/m/rad)
(Nm/m/rad)
(Nm/m/rad)
/
CTest
/
CTest
C20012D 2.54 0.24 579 970 581 1.68 1.00
C20012U 4.12 0.24 455 470 456 1.03 1.00
C24023D 4.41 0.24 986 970 1007 0.98 1.02
C24023U 7.95 0.24 883 470 879 0.53 1.00
C30030D 5.10 0.18 1297 1397 1295 1.08 1.00
C30030U 9.53 0.18 1176 677 1173 0.58 1.00
Z14614D 2.96 0.24 762 970 675 1.27 0.89
Z14614U 4.89 0.24 512 470 541 0.92 1.06
Z14618D 3.68 0.24 820 970 841 1.18 1.03
Z14618U 6.39 0.24 730 470 707 0.64 0.97
Z20617D 3.51 0.22 876 1050 820 1.20 0.94
Z20617U 6.04 0.22 680 508 682 0.75 1.00
Z30720D 4.00 0.18 955 1397 1016 1.46 1.06
Z30720U 7.06 0.18 791 677 869 0.86 1.10
Mean 1.01 1.00
S.D. 0.33 0.05
It is showed that the test results of C- and Z-section purlins are also in good agreement with
the modified analytical method. The average value of
/CTest shows a very slightly better
agreement than
/CTest (1.00 to 1.01), and the former also shows more stability than latter,
with the standard deviations being 0.05 and 0.33, respectively.
3.5 Summary
In this chapter, the investigation on rotational stiffness in the purlin-sheeting system under
both downward and uplift load scenarios has been presented. Based on the comparison
between the test results and the analytical values predicted by current design code, it is found
that the purlin thickness and flange width have a significant impact on the rotational stiffness
in the purlin-sheeting system and therefore modification of the current design method is
required. In order to improve the accuracy of codified method, a series of numerical and
parametric studies are carried out involving Σ-, C- and Z- sections, and the following
conclusions can be drawn based on the studies.

79
The purlin thickness has a significant effect on the rotation behaviour of the purlin-corrugated
sheeting system whereas the effect of increasing web depths is negligible. It shows that the
rotational stiffness increases remarkably with increasing section thickness for both downward
and uplift load scenarios.
The compensation coefficient that consider the influence of shell thickness ( ) and flange
width ( ) on the rotational stiffness can lead to a better agreement with the test results for Σ
purlins. This approach is also approved to be applicable on Z and C purlins.

80
CHAPTER 4 STUD-TO-TRACK CONNECTION
4.1 Introduction
A numerical comparison was conducted between a double screw connection and a single
bolted connection with similar opening areas. In addition, a parametric study was performed
to investigate the influence of factors contributing to optimization of the stud-to-track wall
systems, such as width of the stud flange, depth of the stud and the stud thickness. In order to
predict the ultimate strength of the stud-to-track connection with a gap, numerical methods
were discussed in this chapter. The finite element analysis (FEA) results are in good
accordance with those of the existing experimental studies. The parametric findings show that
thickness plays a more important role in raising the resistance of the stud-to-track walls
compared to effects of other potential parameters. The resistance of samples considerably
reduced with the presence of gap between the sheets. In contrast, bolts and self-drilling screws
are more suitable for the stud-to-track wall system and mostly applied to link cold-formed
components in the modular structures. The stud and track connection as the basic connection
employed in modular construction was selected to conduct a comparative study of connection
solutions. The predictions of current specification AISI (2007) are presented in this chapter as
a comparison. It should be noted that the safety factors are excluded in calculations of AISI.
The characteristics of the common connection methods are listed as follows.
4.1.1 Bolted connection
Bolts are a common choice for connecting steel members. The bolted joints (see Figure 4-1)
require to be pre-punched in the molding process and are often arranged to be subjected to
shear and tension. The washer also affects the structural resistance of the bolted joint. In
practice, because of the bolt intensity and rigidity far above thin-walled component, the
bearing capacity of the bolted connection is often dominated by the bearing strength of the
thinner material. Therefore, this connection method does not fully utilise the resistance of its
bolts.

81
In general, bolts are classified by steel materials as class 4.6, class 8.8, class 10.9, class 12.9
and A-2 stainless bolts2. As for class 8.8 bolt, the applied material is quenched and tempered
medium carbon steel. It is galvanized at the surface to resist corrosion. In this research, M8
class 8.8 bolt was selected as the study object (see Table 4-1). The material properties are
shown in Table 4-2. In order to prevent loose in the connection, bolts are usually tightened
properly. The versions of the pre-tightening force are varied. As for M8 bolt, the bolt load of
1640N was applied in the following analysis in accordance with engineering application.
However, CFS is covered with galvanizing coat which has a very smooth surface. Hence, the
influence of the friction resulted from preload is not significant (Zadanfarrokh and Bryan,
1992, Bryan, 1993).
Results of tests initially conducted by George Winter (Winter, 1956) indicated that there are
four basic types of failure usually occur in the CFS bolted connections, i.e., longitudinal
shearing failure, ring buckling in front of the bolt, tearing failure in the net cross section and
shearing of the bolt. In practice, the minimum distance between centres of bolt holes is
suggested to be 3d, where d is the diameter of the bolt. The distance from the centre of any
standard hole to the end or other boundary of the connecting member should not be less than
1.5d. The clear distance between edges of two adjacent holes should not be less than 2d. The
distance between the edge of the hole and the end of the member should not be less than d
(AISI., 2007).
4.1.2 Screwed connection
Self-drilling and self-tapping screws are widely adopted in light steel structures (see Figure 4-
2). The drilling or tapping part of the screw forms a hole in the steel section with a single
operation. Without pre-drilled opening, screws are compatible with the installation tolerance.
This technique is also used to inter-connect either steel panels or frames on site. It should be
note that the protruding head of the screw may interfere with other components. Two or more
2 https://www.boltdepot.com/fastener-information/materials-and-grades/Bolt-Grade-Chart.aspx

82
screws are suggested to be used for each connection. In addition, self-drilling and self-tapping
screws also provide a form of attachment between finishing materials, such as plasterboard,
sheathing, floor boarding, insulation and decking and light steel structures.
Screw is made of high quality grade casehardened carbon steel. JT2-NH3 Range self-drilling
screw (see Table 4-1) was applied in this research. The material of the screws is based on the
reference from E-Z LOK3,4
. The details of the properties are presented in Table 4-2. Screwed
connections can be assembled without pre-openings, which will avoid the effect caused by
installation deviations. Screws can carry shear and tension strength in structures. Without nuts,
screws may be pulled out or pulled over under tension action, which is determined by the
thicknesses of the connection sections. Moreover, the screw joint may fail with bearing failure
in the connected sheet, tilting or mix modes. The bearing capacity of the screw joint depends
on the minimum value of the tilting resistance and bearing strength of the sheet. Under shear
force, the tilting of the fastener is more notable within thin-walled sheets.
In applications, the distance between the centres of fasteners shall not be less than 3d. The
distance from the centre of a fastener to the edge of any part shall not be less 3d. If the
connection is subjected to shear force in one direction only, the minimum edge distance shall
be 1.5d in the direction perpendicular to the force (AISI., 2007).
4.1.3 Welded connection
The thin-walled sections can be also joined by the continuous metal inert gas (MIG) welded
(see Figure 4-3) or spot welded joints (see Figure 4-4). Because of the parent metal is
extremely thin, the damage may be occurred during the MIG welding process. After welding,
the joint should be protected by zinc rich paint for the durability reason. Spot welding is
commonly applied for workshop fabrication as shown in Figure 4-3. The steel elements can
be joined through the arc created between the tips of the welding tool on either side, which
3 http://www.ezlok.com/TechnicalInfo/MPCarbonSteel.html
4 http://www.ejot.co.uk/medias/sys_master/products/8797589045278/JT2_NH3_range.pdf

83
requires the welding tool can be supported and easily moved into the position to form the joint.
A minimum of 3 spot welds should be used for each connection.
Figure 4-1 Bolt Figure 4-2 Screw
Figure 4-3 MIG welding Figure 4-4 Spot welding
4.1.4 Other connections
Blind rivets are fitted into pre-drilled holes and a mandrel is pulled by a special tool so that
the rivet expands into and around the hole. Different from the blind rivet, pre-drilled hole is
not required for self-piercing rivet. The rivet can be used both to pierce and to form a
permanent fastening within the materials and provide relatively good pull-out resistance
between thin-walled attachments. The assembly of rivet joints needs the special tool, which
requires sufficient installation space on both sides.
Press joint does not need any additional fastener which is proved to be applicable in light steel
connection. A specific tool is required during the installation process. Clinching joint is also a

84
fastener-less method that can lock two or more layers of thin-walled steel components
together. A hydraulically operated punch is needed to drive the layers into a die and make an
impression. The cost of making a press joint is high because of the machining required and
difficulties in assembly.
Table 4-1 Bolt dimensions and properties of fasteners
SERIES FASTENER APPLICATION EMBEDMENT
PILOT
HOLE
DIA
LENGTH/MATERIAL
F1
M8 grade 8.8
Bolt head and
nut
With washers on both
sides 8.4mm
Carbon Steel quenched
and tempered
F2
EJOT JT2-
NH3 5.5x19
P2 Drive
Fixing cold rolled
section to cold rolled
section to a total of
3.0mm in thickness
where a flat headed
fastener is required.
Organically coated
carbon steel.
Table 4-2 Material properties
Components Density
(g/cm3)
Elastic Plastic
Young‟s Modulus
(GPa) Poisson‟s Ratio
Yield Stress/
Ultimate Stress
(MPa)
Plastic Strain
S450 Section
S450GS+Z 7.85 200 0.3
450 0
500 0.14
Bolts
M8 grade 8.8 7.85 200 0.3
580 0
800 0.12
Screw
JT2-NH3 5.5×19 7.87 200 0.3
415 0
540 0.1
4.2 Specimens of connection
Specimens selected in the research were selected from Albion Sections products. Twenty
seven specimens were modelled in the simulation. They were divided into 2 series and 3
groups. Each of series respects either bolted or screwed T-joint. To be noticed, with the same
group, the only differences between series F1 and F2 were the number and the type of
fasteners, where F1 means the T-joint with one single bolt (see Figure 4-1); F2 stands for the

85
T-joint with two screws (see Figure 4-2). The variant in group 1 (G1) was the thickness of the
stud section. Group 2 (G2) aims to find out the effect caused by the dimensions of the sections,
with the same thickness. The influence of flange width and stud thickness was considered in
group 3 (G3). Each group contents three specimens (A, B and C). The sections (see Figure 4-5)
are manufactured from S450 steel with Z275 galvanized coating sheets. Dimensions and
information of the fasteners are presented in Table 4-3.
Table 4-3 Dimensions and properties of Specimens
Specimen Sections WEIGHT
Kg/m
DEPTH
mm
FLANGE
mm
LIPS
mm
THICKNESS
mm
Area
cm2
G1A
AS1005712 2.15 100 57 12 1.2 2.80
AT1045013 2.03 104 50 0 1.3 2.62
G1B
AS1005713 2.32 100 57 12 1.3 3.03
AT1045013 2.03 104 50 0 1.3 2.62
G1C
AS1005715 2.66 100 57 12 1.5 3.48
AT1045013 2.03 104 50 0 1.3 2.62
G2A
AS2007620 5.75 200 76 15 2.0 7.48
AT2046320 5.06 204 63 0 2.0 6.52
G2B
AS2257620 6.14 225 76 15 2.0 7.98
AT2297520 5.82 229 75 0 2.0 7.50
G2C
AS3007620 7.32 300 76 15 2.0 9.48
AT3067220 6.94 306 72 0 2.0 8.92
G3A
AS1506012 2.74 150 60 15 1.2 3.54
AT1545820 4.11 154 58 2.0 5.32 190.23
G3B
AS1506320 4.55 150 63 15 2.0 5.96
AT1545820 4.11 154 58 2.0 5.32 190.23
G3C
AS1506730 6.84 150 67 15 3.0 9.06
AT1545820 4.11 154 58 2.0 5.32 190.23

86
a) AS section b) AT section
Figure 4-5 Sketch of the sections
4.3 Modelling process
Two FEM models were established in the analysis. The differences between the initial and
modified models came to the constraint and interaction properties and the element type and
meshing. The modelling process is listed as follows.
4.3.1 Material properties
Material properties of the steel C-sections were modelled by using a double linear stress-strain
model (see Figure 4-6) with Von Mises yield criterion and the isotropic hardening rule.
Figure 4-6 Double linear stress-strain curve
yf
y
E

87
4.3.2 Loading and boundary conditions
With regard to the bolt in the simulation, the bolt load of 1640N was applied on each bolt (see
Figure 4-7) to simulate pre-tightening force in the installation process. It was added by Apply
force method. The Fix at current length method was selected in the following analysis step. In
the third step of the T-joint analysis, a displacement load (DL) was directly applied at the top
of the cross-section in the analysis step. In order to increase the computing efficiency, only
half of the specimen was modelled. Symmetry constraint was applied at the symmetrical
sections. The bottom of the T-joint was fixed. The lengths of the stud and track sections were
600mm and 300mm respectively (see Figure 4-8).
Figure 4-7 Bolt load
a) Bolted T-joint b) Screwed T-joint
Figure 4-8 Configurations of T-joint
4.3.3 Constraint and Interaction properties
General contact was employed in the modelling. Friction coefficient 0.3 was considered in all
contact surfaces and was isotropic. The modelling applied “Hard” contact relationship to the

88
minimizes the penetration of the slave surface into the master surface at the constraint
locations and does not allow the transfer of tensile stress across the interface. “Tie” constraint
was applied on bolts and screws. In details, the inner faces of the nuts and heads were tied on
the surface of the contacted components. As a simplification for screw joint, the tie constraint
was also applied between screw shank and the edges of the openings with regard to the
occlusal force around the holes.
In the contact definition, the surface-to-surface discretization method includes two sliding
formulations, being finite sliding and small sliding. The finite-sliding formulation permits any
arbitrary motion of the surfaces. The software continually tracks the interactive master surface
and the slave nodes, even if the contacting parts are deformable. It is a complex calculation in
the software. The small sliding assumes relatively little movement between the surfaces even
the two element undergo large motions. The relationship of the slave nodes and the master
surface are established at the beginning. Through the analysis, the determined master surface
and the interacted slave surface maintain the original relationships. Any rotation and
deformation of the master surface and the load path update are only considered in the
geometric nonlinear analysis.
In the modification of bolted connection, small-sliding interaction was set between nut and
correspondingly contacted surfaces. A quarter of the bolt head interface was tied to the track.
Besides, the interaction of the shank surface and the bolted holes was defined by finite-sliding.
As for the self-drilling screw, in the contact surfaces between screw and components, finite-
sliding was also applied. But tie constraint was used in the second drilled plate. It is assumed
that, in the drilling process, the first drilled hole is supposed to be loose. However, the second
plate can present better occlusion.
4.3.4 Solution scheme
This research focused on obtaining the full range of load-deflection connection responses in
the FE modelling. The pre-load of the bolt was added in the previous analysis steps by using
general static method. The geometric nonlinearity and a nonlinear incremental-iterative Full

89
Newton solution technique were applied in the following analysis step. The linear and
nonlinear global buckling analysis of the stud components is not the research emphasis. The
installation procedure of the fasteners may cause deficiency around the opening holes. In the
experiments, this deficiency is infinitesimally small. Therefore, the imperfection settings were
not included in this case.
4.3.5 Element type and meshing
3D solid element was used in the simulation process, which is more capable of analysing
connections and fasteners (Kim et al., 2007). The 10-node solid element C3D10 (A 10-node
quadratic tetrahedron) was applied around pre-opening area the area. While the 8-node solid
element C3D8R (An 8-node linear brick, reduced integration, hourglass control) was used for
the rest parts and fasteners (see Figure 4-9). The degrees of freedom of each node include 3
translations for the solid element.
Meshing is closely related to the convergence and precision of FEM modelling. For the
fasteners, the approximate global sizing was defined as 1.6mm. In terms of CFS components,
the value was 10mm. The area with open hole was separated by using the element shape of
Tet (see Figure 4-10). Other parts were meshed by the element shape of Hex-dominated with
Sweep technique.
a) Linear element b) Quadratic element c) Second-order element
(8-node brick, C3D8) (20-node brick, C3D20) (10-node tetrahedron, C3D10)
Figure 4-9 Element types of ABAQUS (Abaqus-6.13, 2013)

90
a) Meshing near bolt holes b) Meshing near screw holes
Figure 4-10 Finite element meshing
By experience, Hex or Hex-dominated element shape are more regular, presenting more
accurate and better convergence than other element shapes (Shi and Zhou, 2006). Therefore,
Tet element shape was replaced by Hex element shape with structured technique in the
modified modelling (see Figure 4-12). The element type was C3D20 (20-node quadratic
brick). For the the fasteners, the approximate global sizing was defined as 1.6mm. In terms of
CFS components, the value was 10mm.
4.4 Sensitivity
Finite element analysis software ABAQUSv6.13 was employed in the numerical study. The
sensibility of modelling, as an indication, assists to find out the effective and efficient
numerical analysis method. Taken single lapped shear joint as study subject, the dimension of
connected plates was: length 100mm; width 50mm; thickness 1mm. The diameter of the
screw shank was 5.5mm. The results of FEM simulation are presented in Figure 4-11.
In general, higher density meshes produce more accurate results. On the other hand, more
number of elements needs more computing time in the analysis. As a result, the resistances of
the models changed with the increasing of the mesh density. However, when number of the
element exceeded 2000, the sensibility of the modelling became insignificant (see Figure 4-
11). After making balance between the accuracy and time consumption, the appropriate
meshing was selected as the sixth modelling and applied in the following simulation.

91
Figure 4-11 Sensibility of modelling
4.5 Results
The stress distribution of specimen F1G1A is demonstrated in Figure 4-12. Figure 4-13
illustrates four steps in the failure process. In the first step, friction between the surfaces of
bolt and plates resists the loading. As the force rises, the displacement of the connection
increases linearly. After that, the curve reached a flat. The reason is that the diameter of pre-
opening hole (8.4mm) is larger than that of the shank (8.0mm). The clearance is supposed to
lead to the slipping between the contacted interfaces. In the next step, shearing, slope and
tension developed in the bolt. The stiffness of the connection is reduced along this period.
With the displacement of the stud increased by the pressure, the bottom surface of stud hit the
track, which is the reason that the force-to-displacement curves go up dramatically in the last
step.
The gap of 0.7 mm exists in the specimen F1G1A. The gap can be eliminated by slightly
adjusting section AS1005712. It can be found that, even the magnitude is very small, the
strength and stiffness of the connection are changed considerably (see Figure 4-13). It should
0
2000
4000
6000
8000
10000
12000
14000
16000
18000
0 2 4 6 8 10 12
Forc
e(N
)
Displacement(mm)
Sensibility of Modelling (modelling/number of elements)
first modelling/169
second modelling/1131
third modelling/7623
forth modelling/1914
fifth modelling/10949
sixth modelling/2116
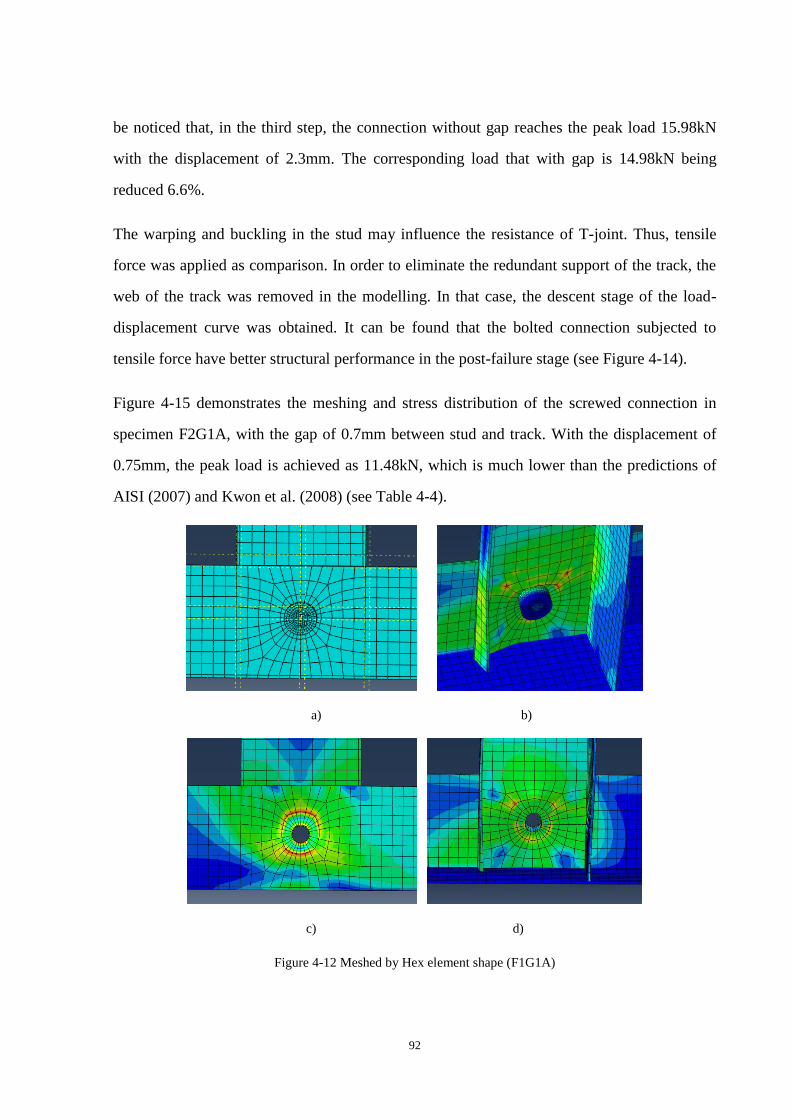
92
be noticed that, in the third step, the connection without gap reaches the peak load 15.98kN
with the displacement of 2.3mm. The corresponding load that with gap is 14.98kN being
reduced 6.6%.
The warping and buckling in the stud may influence the resistance of T-joint. Thus, tensile
force was applied as comparison. In order to eliminate the redundant support of the track, the
web of the track was removed in the modelling. In that case, the descent stage of the load-
displacement curve was obtained. It can be found that the bolted connection subjected to
tensile force have better structural performance in the post-failure stage (see Figure 4-14).
Figure 4-15 demonstrates the meshing and stress distribution of the screwed connection in
specimen F2G1A, with the gap of 0.7mm between stud and track. With the displacement of
0.75mm, the peak load is achieved as 11.48kN, which is much lower than the predictions of
AISI (2007) and Kwon et al. (2008) (see Table 4-4).
a) b)
c) d)
Figure 4-12 Meshed by Hex element shape (F1G1A)

93
Figure 4-13 The effect of gap in bolted connection
Figure 4-14 Comparison of bolted connection
As shown in Table 4-4, there is notable difference between the resistance predictions of the
initial and modified modelling. The peak load of specimen F1G1A dropped from 47.03kN to
14.98kN. The initial modelling provides stronger constraints, leading to the ultimate load of
the bolted connection apparently higher than the modified modelling. The result of the
modified modelling is in good accordance with the bearing strength predicted by the semi-
empirical formula (Yu and Panyanouvong, 2013). Whereas, the bearing strength obtain by the
modified modelling is supposed to undervalue the resistance of the screwed connection,
indicating that the constraints between the fastener and connected components were
insufficient.
0
5
10
15
20
25
30
0 1 2 3 4
Pre
ss f
orc
e (k
N)
Displacement of the loaded surface (mm)
S450/Pressure/withgap 0.7mm
S450/Pressure/nogap
0
5
10
15
20
25
30
0 2 4 6 8
Pre
ss f
orc
e (k
N)
Displacement of the loaded surface (mm)
S450/Pressure/withgap 0.7mm
S450/Pressure/no gap
S450/Tensile/withgap 0.7mm
S450/Pressue/withgap 0.7mm/nobottom
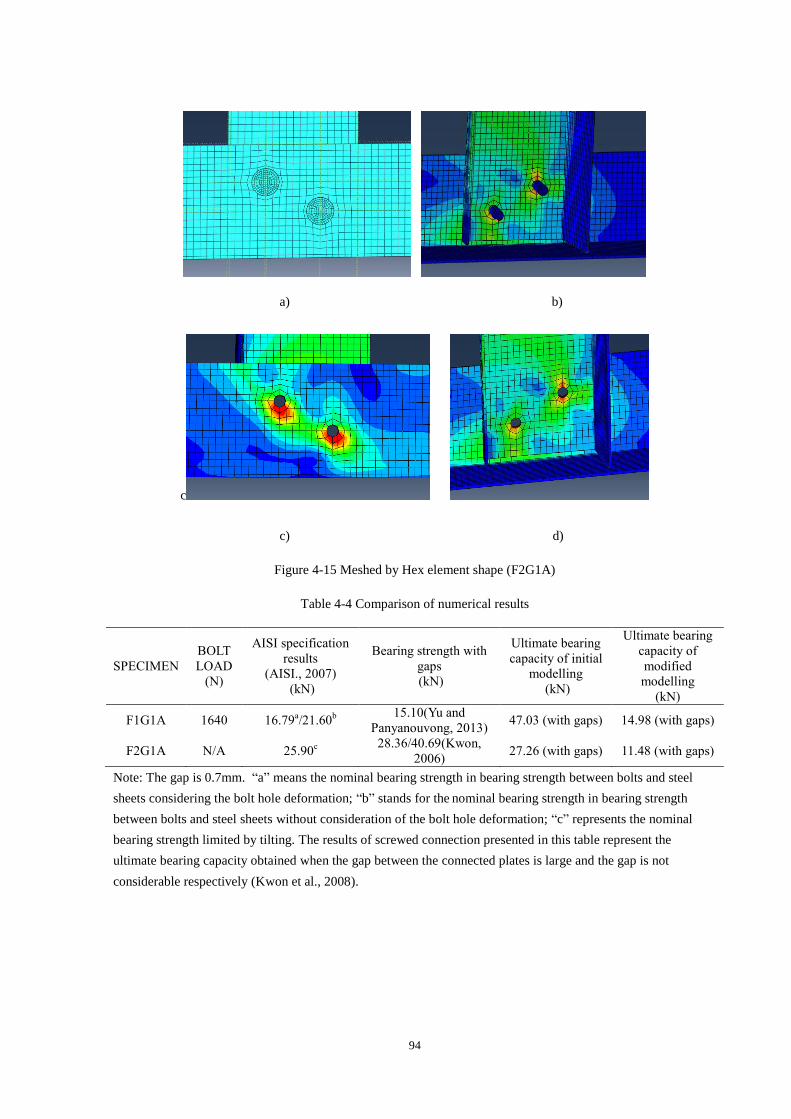
94
a) b)
c
c) d)
Figure 4-15 Meshed by Hex element shape (F2G1A)
Table 4-4 Comparison of numerical results
SPECIMEN
BOLT
LOAD
(N)
AISI specification
results
(AISI., 2007)
(kN)
Bearing strength with
gaps
(kN)
Ultimate bearing
capacity of initial
modelling
(kN)
Ultimate bearing
capacity of
modified
modelling
(kN)
F1G1A 1640 16.79a/21.60
b
15.10(Yu and
Panyanouvong, 2013) 47.03 (with gaps) 14.98 (with gaps)
F2G1A N/A 25.90c
28.36/40.69(Kwon,
2006) 27.26 (with gaps) 11.48 (with gaps)
Note: The gap is 0.7mm. “a” means the nominal bearing strength in bearing strength between bolts and steel
sheets considering the bolt hole deformation; “b” stands for the nominal bearing strength in bearing strength
between bolts and steel sheets without consideration of the bolt hole deformation; “c” represents the nominal
bearing strength limited by tilting. The results of screwed connection presented in this table represent the
ultimate bearing capacity obtained when the gap between the connected plates is large and the gap is not
considerable respectively (Kwon et al., 2008).

95
4.6 Parametric study
Based on the comparison, the constraint and interaction properties of the initial modelling are
employed to simulate screwed connections. The simulation analysis of bolted connection
adopts the modified FE method. In contrast with the bolted connections, the screwed
connections provide much greater bearing capacity in the modellings (see Table 4-5 and Table
4-6).
The prediction of connections resistance provides a good agreement with the results of the
semi-empirical studies (Kwon, 2006, Yu and Panyanouvong, 2013) and the prediction of
current specification AISI (2007). Whereas, a deviation can be observed in the prediction of
bolted connection resistance compared to the nominal bearing strength without consideration
of bolt-hole deformation.
Apart from fasteners, the connection resistance is also influenced by the dimensions of the
connected components, such as section depth, width and thickness. The connection featuring
higher level of strength with less steel consumption presents better structural efficiency.
Regarding to gaps and increasing dimensions, the relationship between the steel volume
increase of the T-joints and connection resistance increase is shown in Figure 4-6.
According to numerical results of the bolted connections, the ultimate bearing capacity of the
connection is improved by 14.51%, with the increasing of steel volume due to the stud
thickness by 12.83%. The results of Group 2 indicate that the flange and web dimensions
present insignificant effect on the load carrying capacity of the connection. As shown in group
3, when the thickness increases, the steel volume grows by 53.85% with the connection
resistance improved by 136.53%. The similar trend is obtained by the screw connections.
It can be concluded that increasing stud thickness is the efficient way to enhance the bearing
capacity of the stud-to-track connections. However, the influence of the thickness increasing
on screwed connections with gaps is greater than that on the bolted connections with gaps in

96
group 1 (see Figure 4-16) which reveals that the bolted connection is more sensitive to the gap.
The increasing of web depth and flange width made the ultimate resistance decreased slightly.
Table 4-5 Numerical study results of series 1
Specimen Gap
(mm)
Bolt
load
(N)
AISI specification results
(kN) Ultimate
bearing
strength of
connection
with gaps (Yu
and
Panyanouvong,
2013)
(kN)
Ultimate
bearing
capacity
obtained by
FEM
(kN)
Nominal
bearing
strength
without
consideration
of bolt hole
deformation
Nominal
bearing
strength with
consideration
of bolt hole
deformation
Ultimate shear
strength/resistance
of bolts
F1G1A 0.7 0
21.60 16.79 80.38 15.10 14.16
1640 14.98
F1G1B 0.7
0
23.40 18.38 80.38 17.52
14.86
1640 15.38
F1G1C 0.7
0
23.40 18.38 80.38 17.52
16.40
1640 17.15
F1G2A 0 0
36.00 30.33 80.38 32.40 36.33
1640 37.82
F1G2B 0
0
36.00 30.33 80.38 32.40
36.82
1640 38.15
F1G2C 1
0
36.00 30.33 80.38 32.40
33.21
1640 34.12
F1G3A 0 0
21.60 16.79 80.38 15.10 16.83
1640 17.03
F1G3B 0
0
36.00 30.33 80.38 32.40
36.44
1640 38.14
F1G3C 0
0
36.00 30.33 80.38 32.40
38.06
1640 40.29
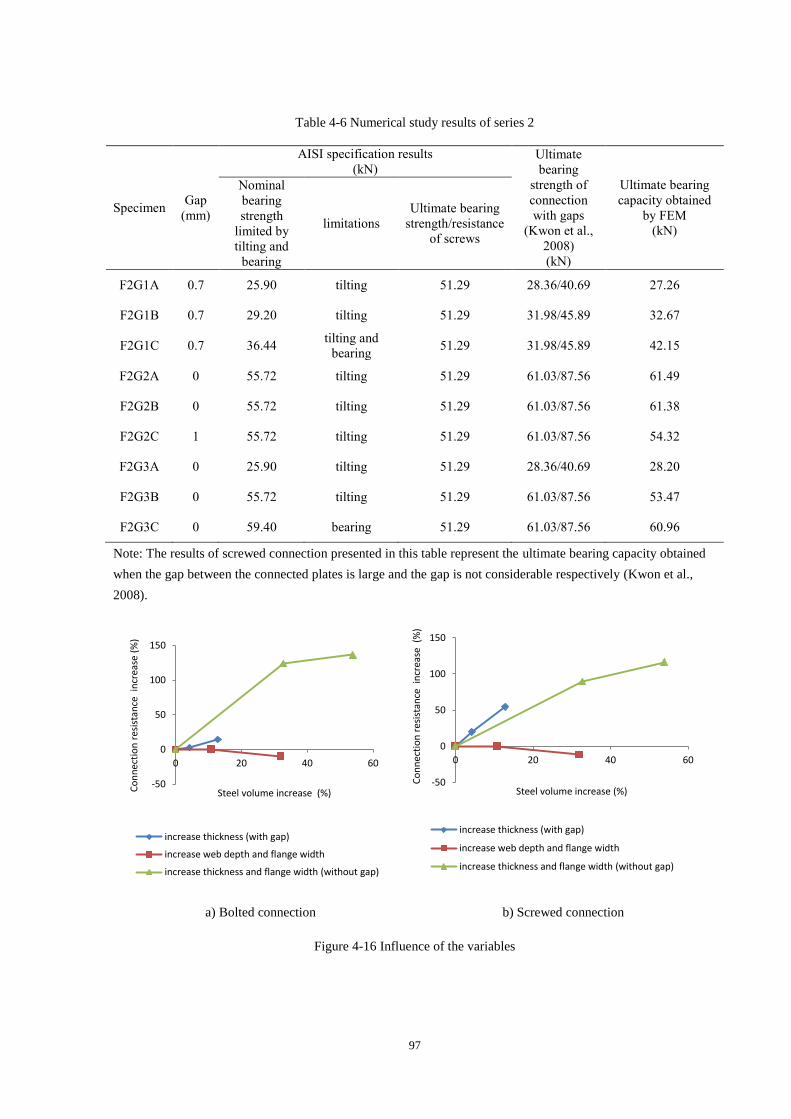
97
Table 4-6 Numerical study results of series 2
Specimen Gap
(mm)
AISI specification results
(kN) Ultimate
bearing
strength of
connection
with gaps
(Kwon et al.,
2008)
(kN)
Ultimate bearing
capacity obtained
by FEM
(kN)
Nominal
bearing
strength
limited by
tilting and
bearing
limitations
Ultimate bearing
strength/resistance
of screws
F2G1A 0.7 25.90 tilting 51.29 28.36/40.69 27.26
F2G1B 0.7 29.20 tilting 51.29 31.98/45.89 32.67
F2G1C 0.7 36.44 tilting and
bearing 51.29 31.98/45.89 42.15
F2G2A 0 55.72 tilting 51.29 61.03/87.56 61.49
F2G2B 0 55.72 tilting 51.29 61.03/87.56 61.38
F2G2C 1 55.72 tilting 51.29 61.03/87.56 54.32
F2G3A 0 25.90 tilting 51.29 28.36/40.69 28.20
F2G3B 0 55.72 tilting 51.29 61.03/87.56 53.47
F2G3C 0 59.40 bearing 51.29 61.03/87.56 60.96
Note: The results of screwed connection presented in this table represent the ultimate bearing capacity obtained
when the gap between the connected plates is large and the gap is not considerable respectively (Kwon et al.,
2008).
a) Bolted connection b) Screwed connection
Figure 4-16 Influence of the variables
-50
0
50
100
150
0 20 40 60
Co
nn
ecti
on
res
ista
nce
in
crea
se (
%)
Steel volume increase (%)
increase thickness (with gap)
increase web depth and flange width
increase thickness and flange width (without gap)
-50
0
50
100
150
0 20 40 60
Co
nn
ecti
on
res
ista
nce
in
crea
se (
%)
Steel volume increase (%)
increase thickness (with gap)
increase web depth and flange width
increase thickness and flange width (without gap)

98
4.7 Summary
Various joining methods have been presented in this chapter. In contrast, screw and bolt with
easy installation is more appropriate for CFS modular constructions. The FE models of stud-
to-track connection with screw and bolt joint were discussed in this chapter. It can be found
that the settings of constraint and interaction between the fasteners and the connected
components significantly influence the analysis outcomes. In terms of bolted connection, the
modified model with pre-tightening force and clearance between connected components
presented a good agreement with the existing semi-empirical formula achieved by test results.
Whereas, the initial modelling have been proved to be applicable to simulate screwed
connection. The parametric study was also conducted using the dimensions of the exist
products. It was concluded that increasing the component thickness is an efficient measure to
improve the connection resistance. However, the gaps can significantly limit the performance
improvement of the bolted connection. M8 bolt is overly strong for the thin-walled sections,
whereas, double-screw joint is a relatively more effective solution in the thin-walled systems.
In addition, the resistance reduction of the connection caused by the gap (1mm) was evaluated
to be around 10%.

99
CHAPTER 5 EXPERIMENTAL STUDY OF SCREW JOINTS
5.1 Introduction
The traditional connection methods of CFS include weld, bolt and screw joints. The current
codified design approaches are not adequate to consider those joints subjected to the
combined loading scenario. Due to the diversely designed connections, complex loading
scenarios may act on a joint. Thus, it has become significant to have a deep understanding the
behaviour of a joint under combination of the different actions. In this chapter, an
experimental study of screwed joints with high strength steel (S550) was conducted. The
loading scenarios include the single and double shear, tension, and the combination of tension
and shear. In addition, finite element models (FEMs) were developed to reproduce the
physical experiments and reveal the mechanism of a joint under action. Results showed that
the shearing resistance of screw joints will be decreased significantly in the presence of the
combined action. In the experimental investigations reported in this chapter, the S550 steel
was employed. A number of loading scenarios that can be encountered in the light steel frame
or modular system were considered in the test regime. A test configuration was designed to
facilitate the variation of the tension/shear ratio. The entire–process behaviours of the
connections would be recorded and presented in this chapter. The first-hand test results can be
used for the calibration of the parameters needed in FE modelling.
5.2 Experimental study
5.2.1 Test program
To examine the structural behaviour of S550 CFS screw and bolt joint, a series of tests were
arranged using testing machine ZwickReoll-Z100. The material properties of the connection
components were evaluated through the coupon tests. It was then followed by three groups of
tests, i.e. (1) pure shear tests detonated as “S” for screw joints and “B” for bolt joints; (2) pure

100
tension test detonated as “T”; (3) combined shear and tension detonated as “TS”. The group S
involved three variables, i.e. the thickness of plate, the number of screws and the type of shear
tests (single and double shear). The groups B and T only concerned the variable of plate
thickness. The group TS included the variable of tension to shear. Each sample was tested
until failure, from which the load-displacement curves and failure modes were recorded. In
the test program, the 0.8mm and 1.0mm S550 steel plates were employed, which were
galvanized on the surface, with the nominal yield stress 550MPa and the ultimate strength
600MPa. Thin-walled plates were connected by hexagon washer head drilling screws with
tapping screw thread (see Figure 5-1). The nominal diameter (d) of the screw was 5.5mm.
There was a 1mm plastic washer at the bottom of the screw head. The sketch of the hexagon
head M8 bolt and nut is shown in Figure 5-2. Details of test specimens and the test instrument
are illustrated in Table 5-1.
Figure 5-1 Hexagon washer head drilling screws (mm) Figure 5-2 Hexagon head M8 bolt and nut (mm)
5.2.2 Test specimens and set-up
5.2.2.1 Coupon test
As shown in Figure 5-3, S550 steel strips were used to test the material properties according
to ISO 6892-1:2009 B4 (ISO., 2009).
Figure 5-3 Steel strip for material property test

101
In this part, steel strips were clamped by the jaws of testing machine before a tensile force
was applied until its rupture. The stress-strain curve was obtained by the average of three
duplicate tests in each group.
5.2.2.2 Shear connection tests
The dimension of plates in shear tests was 100mm in length and 50mm in width, with 50mm
overlapping length. Screws were installed by using self-tapping screw gun while pre-drilling
hole was not requested for the very thin thicknesses. The distances from the centre of each
screw to the edge of the plate and between the centres of screws were more than 3d (AISI.,
2007, Eurocode, 2006b) in order to avoid screw longitudinal shearing failure and tearing
failure in the net cross section respectively. Observations included failure modes and force-to-
displacement curves of the joints. The thicknesses of connected plates are respectively
represented by t1, t2 and t3 as indicated in Figure 5-4 to 5-7. The ID and geometric
dimensions are listed in Table 5-1.
Figure 5-4 Screw shear test Figure 5-5 Double screw shear test
Figure 5-6 Double shear screw test Figure 5-7 Bolt shear test

102
Table 5-1 Screw shear joint test samples
Specimen Pattern Length
(mm)
Width
(mm)
Over-lap
(mm)
t1/t2/t3
(mm) Duplicated
S1 single shear/one screw 100 50 50 0.8/0.8 2
S2 single shear/one screw 100 50 50 0.8/1.0 2
S3 single shear/one screw 100 50 50 1.0/0.8 2
S4 single shear/one screw 100 50 50 1.0/1.0 2
S5 single shear/two screws 100 50 50 0.8/0.8 2
S6 single shear/two screws 100 50 50 1.0/1.0 2
S7 double shear/one screw 100 50 50 All 0.8 2
S8 double shear/one screw 100 50 50 All 1.0 2
B1 single shear/one bolt 100 50 50 0.8/0.8 2
B2 single shear/one bolt 100 50 50 1.0/1.0 2
5.2.2.3 Tension connection tests
The test specimens were made by two U-sections connected back-to-back by a screw at the
centre of the webs. The angle between web and flange of the U section is 90°. A fixture (see
Figure 5-8) was designed to restrain the specimen (see Figure 5-9) to the test machine (see
Figure 5-10).
The eight M8 bolts employed to connect the specimen and the fixture had adequate strength
and stiffness. The fixture was clamped by jaws and can be reused. The description of samples
is listed in Table 5-2.
Figure 5-8 Fixture Figure 5-9 Specimen of tension test

103
Figure 5-10 Schematic illustration of tension test
Table 5-2 Tension test samples
Specimen Patterns L
(mm)
F
(mm)
W
(mm)
t1/t2
(mm) Duplicated
T1 tension/one screw 60 100 78 0.8/0.8 2
T2 tension/one screw 60 100 78 1.0/1.0 2
5.2.2.4 Combined shear and tension tests
The combination of shear and tension was achieved by the sloped U-sections (see Figure 5-
11). These components involved three different loading angles such as 30°, 45° and 60°, as
shown in Figure 5-12.
To facilitate the application of screws by using the screw gun, two short flange lengths were
designed. Two extension plates were used to connect the test samples and the fixture after the
screw was applied (see Figure 5-13). The extension plates had 1.0mm thickness, 60mm width.
The length was determined by the fixed length of the short flange, i.e. 110mm as indicated in
Figure 5-13, and the slope angle of the web plate. The extension plates were bonded to the
flanges of test samples by epoxy resin adhesive.

104
The strength of the adhesive joints was also verified to have shear strength 23MPa and tensile
strength 35MPa, which meet the test requirements. The details of specimen dimensions are
shown in Figure 5-11 and Table 5-3.
At the other ends, they were connected to fixtures by bolts. The fixtures for the combined
shear and tension tests were the same as those shown in Figure 5-8 for the tension tests.
Figure 5-11 Dimensions of shear-tension test specimen
Table 5-3 Combined tension and shear test samples
Specimen Patterns web
(mm)
Width
(mm)
flange
(mm)
t1/t2
(mm)
θ
(°) Duplicated
TS1 Combined load/one screw 92 60 20 1.0/1.0 60 2
TS2 Combined load/one screw 113 60 30 1.0/1.0 45 2
TS3 Combined load/one screw 160 60 40 1.0/1.0 30 2
a) Specimen TS1 b) Specimen TS2 c) Specimen TS3
Figure 5-12 Specimens of sloped tension test

105
a) TS1
b) TS2
c) TS3
Figure 5-13 Schematic illustration of sloped tension test
5.2.3 Test procedure
The tests, including material coupon test and joint tests, were performed using the 10T
ZwickRoell static material testing machine. The machine recorded the data of applied force
F,test and cross-head displacement D,test every 0.1 second until the joint failed. Tests were
conducted by displacement control mode at a rate of 2mm/min for screw shear test and
1mm/min for pure tension and combined shear and tension tests. When the applied load
dropped more than 80% between two consecutive loading increments, the test stopped
automatically. In the pure tension and combined shear and tension tests, the separations at the

106
web centre (Dc) and those of 30mm distance from the centre were also recorded by demec
strain gauge at around 100N increments. In that case, U-section (see Figure 5-9) and sloped
U-section (see Figure 5-11) components were connected by screw in the web. In fact, the
cross-head displacement consists of bending in the flanges, rotation at the section corner, web
deformation and the movement of the screw joint. However, the diverse dimensions of
specimens brought about different deformation under loading. To make the results
comparable, a 60×60 (mm) plate was taken into account.
a) Locations of measuring points
b) Initial and developed separations
Figure 5-14 Illustration of the measurement
Measure points (MPs) are shown in Figure 5-14. In details, D0,1, D0,2 and D0,3 stand for the
initial distance between the up and down surfaces at each MP respectively. During the test,
the distance at each MP was represented by D1, D2 and D3. Hence, it can be derived that the
relative displacement Dc = D2-D0,2. The same processing method was applied for the
measurement at MP1 and MP3. Considering the symmetry of the test sample, the separation
at 30mm away from the screw centre (D30) was assumed to be the average of those at MP1
and MP3, i.e. (D1-D0,1 + D3-D0,3)/2.

107
5.2.4 Test results
5.2.4.1 Coupon test
Specimens were loaded until rupture (see Figure 5-15) occurred. Results are listed in Table 5-
4 comprising of three duplications.
Figure 5-15 S550 steel specimens and failure mode
Table 5-4 Specimen dimensions of material property tests
Specimen material Thickness(mm) b0(mm) E(GPa) fy (MPa) fu(MPa)
1
S550
0.98 18.96 223 543 559.8
2 1.00 21.60 257 513 514.31
3 0.99 20.82 200 483 550.46
Note: b0 is the middle width of the specimen.
On the average, elastic module was taken as E=211.5GPa. Yield strength fy= 513MPa was
obtained when the strain reached εy=0.42%. The ultimate strength fu=555MPa and the
corresponding strain εu=4.82%. Figure 5-16 exhibits the strain-to-stress curve of the material.
In the final stage of the tests, the stress of the specimen dropped sharply. However, the
fracture of the coupon occurred when the stress decreased to zero. Before the fracture, the
strain still increased.

108
Figure 5-16 Strain-to-stress curve of S550 steel
5.2.4.2 Shear tests
5.2.4.2.1 Failure mode
Failure mode determines the response of lap shear tests (Lorenzo and Landolfo, 2004). In
light-gauge steel shear joint made of mechanical fasteners, there are six main types of failure
listed as follows: (1) shear failure of fastener (2) fastener fracture (3) tilting and pull-out of
fastener (4) bearing failure of either both sheets or thinner sheet only (5) sheet tearing in net
section and (6) longitudinal shearing of the sheet. In fact, mixed failure types often occurred
in tests. During the tests, the screw appeared to be strong enough, and did not fail in the test
scenarios. Due to the amply screw edge and interval distances of the specimens, (5) and (6)
were also not involved in current single lap shear tests.
In this case, the combination of tilting and bearing failure of both sheets took place. Besides,
in double screw single shear joint tests, screws were observed to be pulled out from the
bottom sheet. As for the double shear joint, bearing failure occurred ahead of the longitudinal
shearing in the middle sheet. Assuming the edge distance between screws and plate ends are
sufficient, the bearing capacity of the plate, the tilting resistance and shearing strength of the
screw determine the structural behaviour of the screw joint (see Figure 5-17). In the case of
the single shear, tilting was supposed to be the most likely failure mode based on
specifications (AISI., 2007, Eurocode, 2006b) duo to the eccentrically applied load. To
minimize the tilting deformation, the double shear tests were also adopted. The latter can
eliminate the effect of bending effect on the connection. Thus, the tilting effect was not
0
100
200
300
400
500
600
0 2 4 6 8ζ
(M
Pa)
ε (%)

109
dominant. In order to find out a better connecting solution, single bolt joints were employed
as a comparison of double screw joints.
a) Bearing in the sheet b) Screw tilting c) Shearing in the shank
Figure 5-17 Failure modes of screw joint
In Table 5-5, specimen dimensions, failure modes (see Figure 5-18 to 5-21) and the
performance of lap shear tests are reported. The comparison between single screw shear
specimens (S1, S4) and double screw shear specimens (S5, S6) aims to identify the cluster
effect. In terms of single screw single shear tests, it can be found that initial stiffness of the
joint is quite small because of the influence of screw tilting. Taking specimen S4 for instance,
as plate slip over the screw thread, the curve drops after reaching the peak point and then
increases until bearing failure occurs in the sheet. The bolt joint failed with warping and
bearing in the sheet (see Figure 5-21).
Table 5-5 Screw shear joint test results
Specimen L
(mm)
W
(mm)
t1/t2/t3
(mm) Failure mode in test
Fu,test
(kN)
Du,test
(mm)
Dm,test
(mm)
S1 99.8 50.2 0.79/0.78 T+B 3.91 4.81 11.14
S2 99.7 50.0 0.80/1.01 T+B 4.18 5.76 8.16
S3 100.2 50.0 1.02/0.79 T+B 4.14 6.31 8.33
S4 99.9 49.8 1.00/1.01 T+B 4.71 4.48 8.11
S5 100.0 49.9 0.80/0.80 T+B+P 8.24 5.57 9.63
S6 99.8 50.0 0.99/1.01 T+B+P 9.66 5.10 10.97
S7 100.0 49.8 0.80/0.79/0.78/0.80 B 5.28 4.45 15.17
S8 99.8 50.2 0.99/1.01/1.00/1.01 B 8.12 7.72 15.15
B1 99.2 50.0 0.78/0.78 B+W 7.44 7.49 11.21
B2 99.1 50.1 0.99/1.01 B+W 8.90 10.88 14.01
Note: The overlapped length was 50mm. T=tilting; B=bearing in the board; P=pull out failure; W=warping in the
board; Fu,test=the ultimate force; Du,test=the deformation of joint obtained by testing machine when the
ultimate force was achieved; Dm,test=the deformation of joint obtained by testing machine when the joint failed.

110
Figure 5-18 Single screw lap joint test failure mode (S3)
Figure 5-19 Double screws lap joint test failure mode (S5)
a) Original specimen b) Failed specimen
Figure 5-20 Screw joint double shear test failure mode (S7)

111
Figure 5-21 Bolt single lap-joint test failure mode (B2)
5.2.4.2.2 Bearing resistance
Force-displacement responses are presented in Figure 5-22. It is clear that double screw shear
specimens achieve about twice of the carrying capacity of the single screw shear specimens
with the same thick sheets (see Figure 5-22a and 5-22b), whereas a better ductility can be
observed from the single bolt joint (see Figure 5-22d). As regards the design aspects, it is
small enough to be neglected.
The double shear joint is also a common scenario in light steel constructions. The most
striking differences between single shear joints and double shear joints were the failure mode
and join motion. The bending moment was balanced by the exterior plates of the joint. These
two plates effectively restrained the out of plane movement of the inner plate. Therefore, the
bearing capacity of a joint depends on bearing resistance of the sheet, and fastener tilting was
not occurred.
The test observation suggests the use of double shear joint when high initial stiffness or
ductility-restoring connection is required (see Figure 5-22c). The analysis of the single screw
test results emphasizes that the double shear joints provide greater strength and ductility
accompanied by different failure modes. The wave in the cure of S7 indicates the compressive
pile up of plates in front the screw.

112
It can be observed from Figure 5-22 that the initial force-displacement curves tend more flat
before sharply increasing. This trend formed by some potential causes. Slippage existing
between the clamps and specimens at the beginning of loading procedure caused extra
displacement which is recorded by the test machine. Besides, the fastener is easier to tilt in the
initial stages.
a) One screw single shear tests b) Double screw shear tests
c) Screw double shear tests d) Single bolt joint and double screw joint
Figure 5-22 Force-to-displacement curve of screw and bolt joints
5.2.4.3 Tension test
The failure mode of tension test specimens depended on the thickness of the connected sheets.
In this research t2/t1<2.5 (AISI., 2007), the main failure mode was screw pull-out as shown
in Figure 5-23. Force-displacement curves of specimens from the tension tests are shown in
0
1
2
3
4
5
0 2 4 6 8 10 12
Forc
e (k
N)
Displacement (mm)
S1 S2 S3 S4
0
2
4
6
8
10
12
0 2 4 6 8 10 12
Forc
e (k
N)
Displacement (mm)
S5 S6
0
1
2
3
4
5
6
7
8
9
0 2 4 6 8 10 12 14 16 18
Forc
e (k
N)
Displacement (mm)
S7 S8
0
1
2
3
4
5
6
7
8
9
10
11
0 2 4 6 8 10 12 14 16
Forc
e (k
N)
Displacement (mm)
B1 B2

113
Figure 5-24. An increasing of force was observed until failure occurred. Thread stripping of
the bottom sheet appeared on the screw hole. There was a small linear displacement between
U-sections at the connected point, while a much larger deformation of U-section components
took place. As the joint was further loaded, the joint suddenly failed with screw pull-out
failure. Meanwhile, a rapid resilience reduced section deflection and the plastic deformation
was placed in Figure 5-23. The tensile mode exhibits much lower resistance but higher
displacement relative to shear tests. There was no visible plastic deformation observed in the
screw. The residue material on the screw after failure indicated that the bottom screw hole
damaged due to the threads shear action. Table 5-6 lists the detailed dimensions, failure
modes and responses of tension tests. It also can be found that thickness has a great influence
on the peak load and corresponding deformation. As shown in the table, the ultimate force
Fu,test of specimen T2 is more than twice of that of T1 and the macroscopic displacement
Du,test increases 48%.
Table 5-6 Tension tests
Specimen L
(mm)
F
(mm)
W
(mm)
t1/t2
(mm)
Fu,test
(kN) Failure mode in test
Du,test
(mm)
Du,30
(mm)
Du,c
(mm)
T1 60.5 101.2 78.1 0.79/0.80 1.11 P 27.08 16.20 2.13
T2 60.2 100.5 78.3 1.00/1.01 1.58 P 39.96 26.24 2.20
Note: Fu and Du represent the ultimate force and the corresponding displacement respectively. „test‟ stands for
the data obtained by obtained by ZwickReoll-Z100 machine.
Figure 5-23 Single screw tension test failure mode

114
Figure 5-24 Cross-head force-displacement curves
5.2.4.4 Combined shear and tension tests
When the screw joint is subjected to tension accompanied by shear, the bearing effect on the
screw and plate interface increases. Such increase may enhance the friction resistance and
thus the tension resistance but may also deteriorate the bearing failure at shear. Both effects
are contradictory and need to be detected in the tests. The mixed loading actions in tests TS1,
TS2, TS3 have three different slope angles 30, 45 and 60 degree respectively. The
experimental set-up is presented in Figure 5-25. In order to inspect the entire-process response
of the specimen, the force-to-displacement curves obtained at each MP were also recorded in
Figure 5-26. Figure 5-27 illustrates the screw hole deformation of the tests. Table 5-7 lists the
dimensions and resistance of specimens under different loading angles.
Table 5-7 Tests under combined tension and shear force
Specimen web
(mm)
Width
(mm)
flange
(mm)
t1/t2
(mm)
Fu,test
(kN)
Failure
mode in
test
Du,test
(mm)
Du,30
(mm)
Du,c
(mm)
TS1 92.3 60.1 21.2 1.02/1.01 1.78 P 36.48 26.10 4.40
TS2 113.2 60.5 30.3 1.01/1.00 2.16 P+B 30.52 20.94 4.34
TS3 160.8 60.2 41.1 1.01/1.0.2 2.71 B+T+S 25.30 14.41 4.30
Note: S=screw head fracture.
0
0.5
1
1.5
2
0 10 20 30 40 50
Forc
e (k
N)
Displacement (mm)
T1 T2

115
a) TS1
b) TS2
c) TS3
Figure 5-25 Failure mode of screw joint in combined shear and tension tests

116
a) Measured by test machine (ZwickReoll-Z100)
b) Measured at the 30mm point
c) Measured at the centre point
Figure 5-26 Force-to-displacement curve of specimens
0
1
2
3
0 5 10 15 20 25 30 35 40
Forc
e (k
N)
Displacement (mm)
TS1 TS2 TS3
0
1
2
3
0 5 10 15 20 25 30
Forc
e (k
N)
Displacement (mm)
TS1 TS2 TS3
0
0.5
1
1.5
2
2.5
3
0 2 4 6 8 10
Forc
e (k
N)
Displacement (mm)
TS1 TS2 TS3

117
a) TS1 b) TS2
c) TS3
Figure 5-27 Deformation of screw hole in slop tension tests
As aforementioned, the combination of tension (Ft) and shearing (Fv) force was implemented
by slope tension tests. Similar to T2, brittle failure occurred and the screw was pulled out
from the bottom section in TS1 (see Figure 5-25a). With the slope angle increased in TS2 and
TS3, the elongation deformation of screw hole became larger (see Figure 5-27b and 5-27c)
and yielding of sheet material made joint softened after reaching the peak load until the joint
failed with bearing in the sheet (see Figure 5-26). In the case of specimen TS3 screw fracture
occurred without pulling out from the bottom sheet. It also can be found out that deformation
of specimens decreased when the slope angle increased (see Figure 5-26a and 5-26b), whereas
the screw joint showed the opposite result (see Figure 5-26c). The reason is that tension
component led to screw thread slipping from the bottom sheet. Likewise, the visible waves in
the curves were also caused by the threads slipping.

118
5.2.5 Discussion and analysis
The flexibility and bearing resistance of a joint with mechanical fasteners connecting thin-
walled steel sheets have been concerned. The codes, such as Eurocode 3 (Eurocode, 2006b),
AISI-S100 (AISI., 2007) and Chinese technical code (GB., 2002), specify expressions
calculating joint resistance and displacement. In the specifications, tilting failure mode is
occurred based on the thicknesses of the connected sheets. The range of validation in GB only
refers to Q235 and Q345 steel material. Besides, based on the tests with reference to the
typical case of a 16mm bolt in Z28 steel (yield stress 280N/mm2, ultimate stress 390N/mm
2),
researcher (Bryan, 1993) proposed the design expressions (see Eq. 5-1 and 5-2) for the joint
flexibility C and bearing capacity Pbs of a single bolted lap joint. Although the flexibility of
screw lap joint has not been developed, the comparison involved this method as a reference.
Table 5-8 lists the results of predictions as a comparison.
(
) (Eq. 5-1)
(Eq. 5-2)
where t1、t2 are the connected thicknesses and no more than 8mm, n is a factor which
depends on the position of the shear plane and the number of utilised bolts, Us is the ultimate
strength of the sheet (N/mm2), t is the minimum thickness of the connected sheet (mm), d is
the nominal bolt diameter (mm) and k1-k7 are influence factors, referring to bolt diameter,
sheet thickness, sheet yield strength, washer diameter, number of washers end distance and
shear plane respectively.
A better agreement can be found between the AISI calculations and the test results, whereas
EC3 makes a conservative prediction. GB overestimates the carrying capacity of screw joint
for the high strength material. According to the table, the average ratio of the predicted
bearing resistance between AISI and experiment is 1.09, with a standard deviation of 0.16.
The result shows that when the ultimate force is achieved, the analytical-to-test ratio is 0.80,
with a standard deviation of 0.06. Eq. 5-1and 5-2 pronounce smaller flexibility than other
predictions and overly large carrying capacity of the joint, which is because that bolt joint,

119
installed with nut, is stronger that the screw. It can be concluded that GB is not applicable to
S550 material in the test scenarios. With regard to screw tension test, comparison
demonstrated in Table 5-9 indicates that the joint failed before the predicted carrying force in
the specifications.
Table 5-8 Resistance comparison of shear specimens
Specimen Fu,AISI
(kN)
Fu,EC3
(kN)
Fu,GB
(kN)
Pbs
(kN)
C
(mm/kN)
Du,Bryan
(mm)
Fu,AISI/
Fu,test
Fu,EC3/
Fu,test
Fu,GB/
Fu,test Pbs/ Fu,test
Du,Bryan/
Du,test
S1 3.91 2.98 5.86 6.62 0.58 3.80 1.00 0.76 1.50 1.69 0.79
S2 5.65 3.27 6.64 6.62 0.51 3.39 1.35 0.78 1.59 1.58 0.59
S3 3.91 3.27 6.64 6.62 0.51 3.39 0.94 0.79 1.60 1.60 0.54
S4 5.47 4.17 7.33 8.43 0.45 3.79 1.16 0.89 1.56 1.79 0.78
S5 7.82 5.96 11.72 13.23 0.35 4.57 0.95 0.72 1.42 1.61 0.82
S6 10.94 8.34 14.66 16.86 0.27 4.55 1.13 0.86 1.52 1.75 0.89
S7 N/A N/A N/A N/A N/A N/A N/A N/A N/A N/A N/A
S8 N/A N/A N/A N/A N/A N/A N/A N/A N/A N/A N/A
Mean 1.09 0.80 1.53 1.67 0.74
S.D. 0.16 0.06 0.07 0.09 0.14
B1 5.95 7.6 3.55 7.98 0.58 4.59 0.80 1.02 0.48 1.07 0.61
B2 7.6 10.21 4.44 10.17 0.45 4.58 0.85 1.15 0.50 1.14 0.42
Note: AISI, EC3 and GB stand for Eurocode 3, AISI-S100 and Chinese technical code respectively. Du,Bryan is
the deflection of single bolted lap joint, calculated by C times Pbs. In AISI, the failure mode of specimen S1 to
S6 are tilting failure; S7 and S8 are double shear screw joints which are not involved in the above norms.
Table 5-9 Result comparison of tension specimens
Specimen Fu,AISI
(kN)
Fu,EC3
(kN)
Fu,GB
(kN)
Fu,AISI/
Fu,test
Fu,EC3/
Fu,test
Fu,GB/
Fu,test
T1 2.08 1.59 1.83 1.87 1.43 1.65
T2 2.59 1.98 2.29 1.64 1.25 1.45
Mean 1.76 1.34 1.55
S.D. 0.17 0.13 0.14
The single-bolt joint is usually considered to be replaced by the double-screw joint. Based on
the test results, the double-screw joint provides better resistance (S5: 8.24kN, S6: 9.66kN)
than the single bolt joint (B1: 7.44kN, B2: 8.90kN) with the thicknesses of connected sheets
respectively. It can be concluded that the bolt is overdesigned to the thin-walled component.
However, an opposite prediction can be obtained by the norms. EC3 (Eurocode, 2005)
provides the design resistance for individual fasteners subjected to shear and/or tension. Based
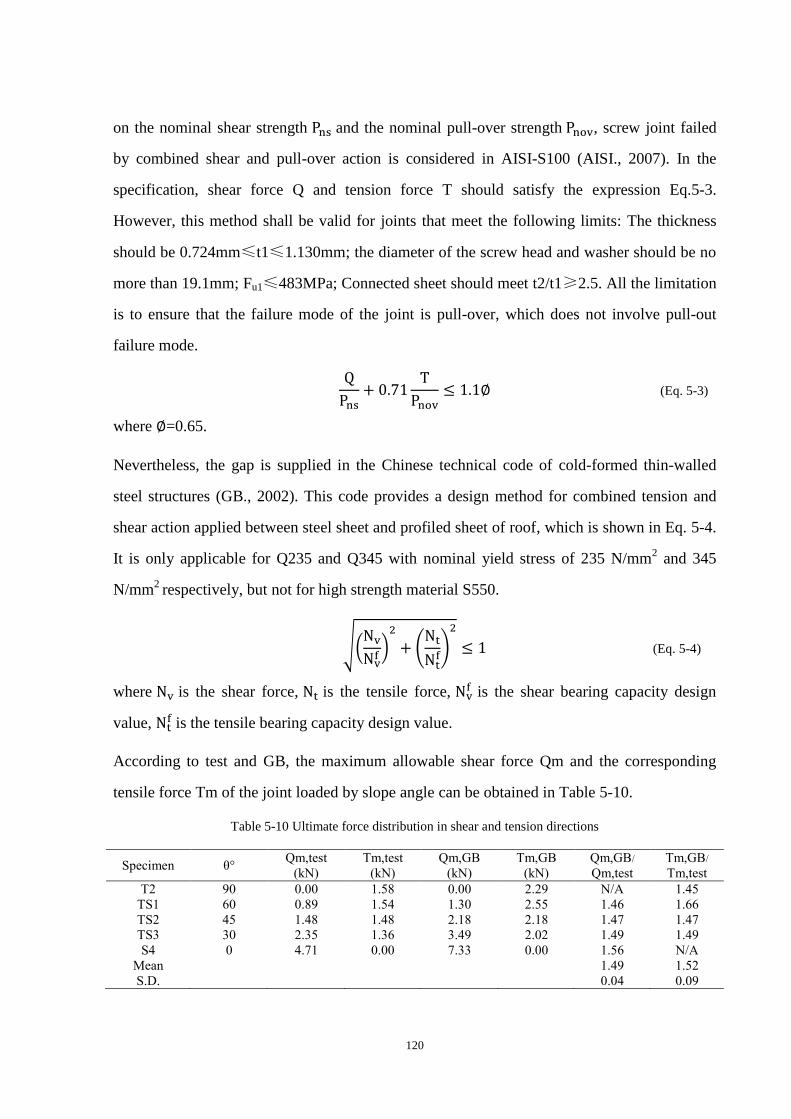
120
on the nominal shear strength and the nominal pull-over strength , screw joint failed
by combined shear and pull-over action is considered in AISI-S100 (AISI., 2007). In the
specification, shear force Q and tension force T should satisfy the expression Eq.5-3.
However, this method shall be valid for joints that meet the following limits: The thickness
should be 0.724mm≤t1≤1.130mm; the diameter of the screw head and washer should be no
more than 19.1mm; Fu1≤483MPa; Connected sheet should meet t2/t1≥2.5. All the limitation
is to ensure that the failure mode of the joint is pull-over, which does not involve pull-out
failure mode.
(Eq. 5-3)
where =0.65.
Nevertheless, the gap is supplied in the Chinese technical code of cold-formed thin-walled
steel structures (GB., 2002). This code provides a design method for combined tension and
shear action applied between steel sheet and profiled sheet of roof, which is shown in Eq. 5-4.
It is only applicable for Q235 and Q345 with nominal yield stress of 235 N/mm2 and 345
N/mm2
respectively, but not for high strength material S550.
√(
)
(
)
(Eq. 5-4)
where is the shear force, is the tensile force, is the shear bearing capacity design
value, is the tensile bearing capacity design value.
According to test and GB, the maximum allowable shear force Qm and the corresponding
tensile force Tm of the joint loaded by slope angle can be obtained in Table 5-10.
Table 5-10 Ultimate force distribution in shear and tension directions
Specimen θ° Qm,test
(kN)
Tm,test
(kN)
Qm,GB
(kN)
Tm,GB
(kN)
Qm,GB/
Qm,test
Tm,GB/
Tm,test
T2 90 0.00 1.58 0.00 2.29 N/A 1.45
TS1 60 0.89 1.54 1.30 2.55 1.46 1.66
TS2 45 1.48 1.48 2.18 2.18 1.47 1.47
TS3 30 2.35 1.36 3.49 2.02 1.49 1.49
S4 0 4.71 0.00 7.33 0.00 1.56 N/A
Mean 1.49 1.52
S.D. 0.04 0.09

121
The results illustrate that the average ratios of the predicted Qm and Tm between GB and the
test are 1.49 and 1.52, with standard deviations of 0.04 and 0.09 respectively, implying that
GB overestimated the value of the ultimate shear and tension resistances. The ultimate pure
shearing and tensile resistance Qu and Tu were obtained by test S4 and T2. Thus, the
nonlinear expectation function is assumed:
√(
)
(
)
(Eq. 5-5)
√ (
)
(Eq. 5-6)
Regression variation is
∑ ( ̂ ̅)
2 (Eq. 5-7)
Residual variation is
∑ ( ̂)
2 (Eq. 5-8)
Total variance is
∑ ( ̅)
2 (Eq. 5-9)
where ̂ is the variable predicted by the regression model, ̅ is the mean of the test
Qm,test; RSS+ESS=TSS.
The determination coefficient
R2=RSS/TSS (Eq. 5-10)
is the proportion of regression variation in total variance.
Overall, the shear and tension forces should satisfy Eq. 5-11 under the mixed loading
conditions.

122
√(
)
(
)
(Eq. 5-11)
where Q is the required allowable shear strength of joint, T is the allowable tension strength
of joint. The tested pure shear strength and pure tension strength of the screw joint are
Qu=4.71kN and Tu=1.58kN respectively.
Figure 5-28 Result comparison of proposed expression and test
Regarding the test data, determination coefficient R2=0.9954 indicates that the regression
model is acceptable with a good accuracy. Thus, it is demonstrated that the combination of
shear and tensile force acting on the joint, with 1mm thickness and S550 material, can be
precisely predicted by the proposed expression (see Figure 5-28).
As is mentioned above, the interaction of shearing and pulling action declined the both
bearing resistances in each direction. The proportional coefficient β in shear (βv=Qm/Qu) and
tension (βt=Tm/Tu) directions is introduced in the analysis. Figure 5-29 presents the
relationship between β and θ. It can be found that, with increasing of θ, the proportion of the
maximum shear strength is declined. At the beginning, the dropping increases until the curves
intersect. Then the gradient of the curve decreases. From the curve of βt, it also can be
observed that the ratio of Tm/Tu rapidly rises in the beginning. After reaching the crossover
point, the value flattens out. The two curves intersect at θ=18.34°. The expressions of the
proportional coefficient βv and βt were regressed as follows.
0.0
1.0
2.0
3.0
4.0
5.0
0.0 0.5 1.0 1.5 2.0
Qm(
kN)
Tm(kN)
Test
Proposed expression

123
Figure 5-29 β-to-θ curve
Assume the modified ultimate strength Fu of screw joint is:
√
(Eq. 5-12)
(Eq. 5-13)
(Eq. 5-14)
(Eq. 5-15)
( ) (Eq. 5-16)
with ,
( ) (Eq. 5-17)
with ,
( ) (Eq. 5-18)
with ,
( ) (Eq. 5-19)
with .
For further details of the slope angle effect, the ultimate forces in the experiment Fu, test are
listed with regard to the angle θ. Due to the softening of the joint after reaching the maximum
0.0
0.5
1.0
1.5
0.0 0.5 1.0 1.5 2.0
β
θ (rad)
βv
βt

124
resistance, the load response of joint decreases while the deformation increases until the joint
is damaged. Herein, the maximum displacements of joint at MPs are presented in Table 5-11.
It shows that the Dm and the ratio between Du and Dm rises up to 1.00 with slope angle drops,
implying that shear action provides better ductility of the screw joint and brittle fracture
occurs with low slope angle.
Table 5-11 Displacement and force comparison
Specimen θ
(°)
Fu,test
(kN)
Dm,test
(mm)
Dm,30
(mm)
Dm,c
(mm)
Du,test/
Dm,test
Du,30/
Dm,30
Du,c/
Dm,c
T2 90 1.58 40.05 27.00 2.20 1.00 0.97 1.00
TS1 60 1.78 36.91 26.20 4.50 0.99 1.00 0.98
TS2 45 2.61 34.46 23.44 7.54 0.89 0.89 0.58
TS3 30 2.71 29.96 18.60 8.60 0.84 0.77 0.50
S4 0 4.71 8.11 8.11 8.10 0.55 0.55 0.55
As shown in Figure 5-30, when the section acute angle θ increases, the carrying capacity
decreases. On the contrary, macroscopic displacement of specimen becomes larger.
Meanwhile, the change is flattening out. The same trend is observed for the displacement at
30mm measure point. However, the relative movement between the connected points present
an opposite result, showing a decline with ascending of slope angle.
It is proved that shear force acting on screw joint is actually in proportion to the joint
elongation. The larger macroscopic deformation of the specimen is only by the reason of the
larger dimension of the sloped U-section.
Figure 5-30 Comparison of different angles scenarios
0
1
2
3
4
5
0 30 60 90
Fu (
kN)
θ (˚)
0
10
20
30
40
50
0 30 60 90
Dis
pla
cem
ent
(mm
)
θ (˚)
Dm,c Dm,test Dm,30

125
5.3 Numerical analysis and validation
5.3.1 Modelling development
5.3.1.1 Elements
In the present study, commercial FE package ABAQUS was used to simulate the experimental
results and carry out further analysis of joints implemented in modular construction. Three-
dimensional SHELL element S4R (A 4-node doubly curved thin or thick shell, reduced
integration, hourglass control, and finite membrane strains), SOLID element C3D8R (An 8-
node linear brick, reduced integration, hourglass control) and BUSHING connector element
were employed in the analysis. For 3D SOLID element, the degrees of freedom of each node
include 3 translations. Shell element involves six degrees of freedom-three translations and
three rotations. Bushing Connector Section (BCS) is flexible in usage without specific shape.
Between the two joint points, six degrees including three translations and three rotations (see
Figure 5-31) can be defined linearly or nonlinearly. The settings of damage condition of the
joint were also contained in BCS. When the joint reached the defined limitation, the connector
was demolished.
Figure 5-31 Bushing element (Abaqus-6.13, 2013)

126
5.3.1.2 Meshing
It was proved that Hex or Hex-dominated element shape are more regular, presenting more
accurate and better convergence than other element shapes (SHI, 2006), which was employed
in the meshing of solid element. The shell element shape was “Quad”, with “Structured”
technique. Through an extensive trial-and-error process and sensitivity analysis, the most
satisfactory results were achieved when using the following discretisation pattern. The
approximate global sizing of the screw was 1.6mm. In terms of CFS components, it was
defined as 5mm.
5.3.1.3 Material
For the sheets, the nominal stress and strain were achieved by the coupon test
results. In FE modelling, the stress and strain definition followed the true stress and
strain
(Eq. 5-20)
( ) (Eq. 5-21)
(Eq. 5-22)
Assuming that the plastic deformation is incompressible,
(Eq. 5-23)
( ) (Eq. 5-24)
where l is the final length of the specimen; l0 is the original length of the specimen.
5.3.1.4 Interaction and solution
The friction coefficient of 0.3 was applied to simulate the interface between all the contact
surfaces. The “hard contact” condition was applied between components. The analysis
adopted the Von Mises yield criterion and a nonlinear incremental-iterative Full Newton
solution technique. The displacement load was applied to the model. In the joint simulation,
the setting of contact and interaction between fastener and connected sheets is the key issue.
Table 5-12 illustrates six modelling methods as a comparison.

127
Table 5-12 Settings of joint simulation methods
Modelling Sheet
element
Fastener
element Settings
FEM1 shell bushing
Nonlinear elasticity in shear force direction and linear elasticity in
tension direction were defined based on test datum. Connector
became damaged in the shear direction when the longitudinal
elongation exceeded 8.10mm/15.15mm for single/double shear
specimens or in the tension direction with the resistance force
reached 1.58kN. The diameter of the connector was 5.5mm.
FEM2 solid bushing Same with FEM1
FEM3 shell contimuum
shell
All the contact surface between screw and sheets were tied
together.
FEM4 solid solid Same with FEM3
FEM5 solid solid
A quarter of the screw head interface was tied to the sheet as
emphasized in Figure 5-31. Besides, the interaction of the shank
surface and the edges of the holes was defined by finite-sliding.
FEM6 solid solid
This method considered friction to simulate the interaction between
thread and contacted plates. The friction coefficient was assumed to
be 5.0. The interaction between the contact surfaces was set to
finite-sliding.
Figure 5-32 Sketch diagram of “tie” contact in FEM5
5.3.1.5 Fastener modelling
As for the pure shear test, the macroscopic displacement of the joint along the load direction
includes material elongation, warping in the plate and joint motion. In fact, the motion of
screw joint under different loading scenarios consists of several factors, involving screw
rotation, screw-hole deformation, tension in the sheets, screw sliding from the connected
sheets and screw deflection. Based on the test results, the failure conditions and all stages of
joint nonlinear responses were defined in the connector settings, representing screw joint

128
motion. Regarding to material elongation, the response of bushing connector was achieved
based on the following expressions. Account to the post-failure reaction, the maximum sliding
distance determines the damage point of bushing connector under shear force.
(Eq. 5-25)
(Eq. 5-26)
where and stand for the force and displacement bushing connector,
and are the force and displacement of the test, is the material elongation.
According to the specimens T1 and T2, brittle fracture was observed when the joint reach the
bearing capacity. Thus, the critical condition in tension direction was the maximum load
obtained by the pure tension test. The linear stiffness of screw joint was assumed based on the
test results. For the screw modeled solid elements. The material property of the shaped screw
was given by a bilinear stress-strain curve with nominal yield strengths of 415MPa, ultimate
strengths of 540MPa respectively. The simplified screw included screw head and flat shank
with the diameter of 5.5mm.
5.3.2 Numerical results
5.3.2.1 Coupon analysis
The experimental and numerical results of coupon test are shown in Figure 5-33. The
comparison demonstrates a good agreement, implying the material setting is valid.
Figure 5-33 Force-to-displacement curves of coupon test and FEM simulation
0
2
4
6
8
10
12
0 1 2 3 4
Forc
e (k
N)
Displacement (mm)
Coupon test FEM

129
5.3.2.2 Shear joint
Each modelling of joint has certain superiority and certain limitation. In order to obtain the fit
FEM, taking 1mm sheets for instance, numerical investigation on the different elements and
modelling settings were carried out. Figure 5-34 presents the Von Mises stress distribution
when the specimen S4 achieved the ultimate resistance force. The comparison of force-to-
displacement curves obtained by each FEM1 and FEM2 are also shown in Figure 5-34.
According to Table 5-13, FEM1 and FEM2 show good precision in joint behaviour prediction.
On the other hand, the numerical calculation of bushing connector has less time consumption.
When the joint reach the critical limitation, the connector was demolished in the modelling.
To some extent, it is considered as the best choice to simulation fasteners of the connection in
full-scaled construction simulation. However, this method is not applicable in parametric
study. Table 5-13 indicates that ultimate force of single lap joint was overrated by FEM3 and
FEM4, with figure of 14.15kN and 9.47kN. On the contrary, the corresponding displacements
are only 12% and 25% out of the test results. That means the fully tie contact overly enhanced
the joint in the modelling. It also can be observed from Table 5-13 that shell sheet presented
better ductility after yielding. Better predictions in carrying capacity of screw joint were made
by FEM5 and FEM6, with simulation-to-test ratios are 1.12 and 0.81 respectively.
Nevertheless, the displacements obtained by these methods still cannot meet the requirement.
Table 5-13 Comparison of test and FEM with macroscopic results
Modelling Specimen Fu,test
(kN)
Du,test
(mm)
Fu,FEM
(kN)
Du,FEM
(mm)
Fu,FEM/
Fu,test
Du,FEM/
Du,test
FEM1
S4 4.71 4.84
4.71 4.95 1.00 1.02
FEM2 4.71 4.98 1.00 1.03
FEM3 14.15 0.58 3.00 0.12
FEM4 9.47 1.23 2.01 0.25
FEM5 5.28 0.62 1.12 0.13
FEM6 3.82 1.26 0.81 0.33
Table 5-14 Comparison of test and FEM with macroscopic results
Specimen Fu,test
(kN)
Du,test
(mm)
Fu,FEM
(kN)
Du,FEM
(mm)
Fu,FEM/
Fu,test
Du,FEM/
Du,test
S8 8.12 7.72 7.75 9.03 0.95 1.17

130
a) FEM1
b) FEM2
Figure 5-34 Von Mises stress diagram and force-to-displacement curve of S4
Figure 5-35 Von Mises stress diagram and force-to-displacement curve of S8
0
1
2
3
4
5
0 2 4 6 8 10
Forc
e (k
N)
Displacement (mm)
FEM1 S4
0
1
2
3
4
5
0 2 4 6 8 10
Forc
e (k
N)
Displacement (mm)
FEM2 S4
0
1
2
3
4
5
6
7
8
9
0 2 4 6 8 10 12 14 16 18
Forc
e (k
N)
Displacement (mm)
S8 FEM1

131
In terms of double shear scenario S8, the results in Figure 5-35 and Table 5-14 are achieved
by using FEM1. It demonstrates that the bushing connector is applicable in predicting
structural behaviour of double shear screw joint.
5.3.2.3 Single tension joint
Based on the same settings of bushing connector in FEM1 and material property, specimen
T2 was simulated under tension. The following figures and table presents ultimate force,
displacement (see Figure 5-36) and the loading process (see Figure 5-37) from the simulation.
As shown in Figure 5-36, bushing connector accurately predicted the behaviour of the joint.
However, the deformation of connected sections shows discrepancy in FEM2. Obviously, a
better agreement was obtained by FEM1, implying that shell element is more compatible with
the CFS component simulation than solid element and the numerical model is valid. As a
result, Table 5-15 shows that the ratio of the predicted ultimate resistance between numerical
model and the test is 1.00. As for the displacement, the ratio is obtained with the figure of
1.02.
The stress of the specimen varies as the displacement increases. Deformation of the section
can be observed in the central web and the corner of each C-section. The stress increases
significantly in these areas (see Figure 5-37a). The steel material at the corner of the section
firstly reaches the plastic phase with the load increasing (see Figure 5-37b). When the tension
load exceeds the load carrying capacity of the fastener, the bushing connector is disabled
leading to the stress relieved instantly (see Figure 5-37c).
Table 5-15 Comparison of test and FEM with macroscopic results
Modelling Specimen Fu,test
(kN)
Du,test
(mm)
Fu,FEM
(kN)
Du,FEM
(mm) Fu,FEM/
Fu,test
Du,FEM/
Du,test
FEM1 T2 1.58 39.96
1.58 40.91 1.00 1.02
FEM2 1.56 41.92 0.99 1.04

132
a) FEM1
b) FEM2
Figure 5-36 Force-to-displacement curve of T2
a) Stage I initial loading b) Stage II maximum loading c) Stage III pull-out failure
Figure 5-37 Von Mises stress distribution diagram of FEM1
0
0.5
1
1.5
2
0 10 20 30 40 50
Forc
e (k
N)
Displacement (mm)
FEM1(centre)
FEM1(30mm)
FEM1(macroscopic)
ZwickRoell-Z100(1mm/min)demec gauge(centre)
demec gauge(30mm)
0
0.5
1
1.5
2
0 10 20 30 40 50
Forc
e (k
N)
Displacement (mm)
FEM2(centre)
FEM2(30mm)
FEM2(macroscopic)
ZwickRoell-Z100(1mm/min)demec gauge(centre)
demec gauge(30mm)

133
5.3.2.4 Combined shear and tension joint
The slope tension imposed mixed shear and tension forces on the screw joint. The bushing
elements provide a connection between two nodes that allows independent behaviour. It was
assumed that the shear and tension response of the joint were independent in model A. The
pure shear and tension resistance of the screw joint in the tests were employed in the
modelling. Thus, based on the verified models, the features of joint in shear and tension
directions followed FEM1 in the mixed loading scenarios. However, with regard to
interaction between mixed actions, proportional coefficients βv and βt were also employed in
the bushing connector settings of model B. The comparison of the force-to-displacement
curves are shown in Figure 5-38 to 5-40. The detailed results are presented in Table 5-16.
The failure of joint did not occur in TS1 model as shown in Figure 5-38a. The reason for the
divergence is the failure in the sloped U section at the connected point. For TS2 and TS3, the
ductility of the test joint is larger than the prediction (see Figure 5-39a and 5-40a). However,
the initial stiffness of the joints acted in accordance with the test. When the proportional
efficient β was introduced in modelling, a better agreement can be observed in Figure 5-38b,
5-39b and 5-40b. The ductility of screw joint was predicted but slightly overestimated in TS1,
which was undervalued in TS2 and TS3. During the tests, tension action accelerated the
failure in shear direction leading to the failure occurred earlier than the prediction in model A.
On the other hand, screw sliding was larger than that in the pure tension test, which is not
involved in the modelling. Thus, there is a gap can be observed in the ductility between
models and tests (see Figure 5-39b and 5-40b).
Table 5-16 shows that the model overestimated the carrying capacity of the joint under
combined actions by 1.85 times in average. However, the ultimate force was obtained at the
similar displacement with the experiment outcome. It indicates that combined shear and
tension significantly declined the screw joint resistance. The average values of Fu,b/ Fu,test
and Du,b/ Du,c are 0.95 and 1.00, with the standard deviations being 0.05 and 0.04,
respectively.

134
Table 5-16 Comparison of test and FEM1 with macroscopic results
Specimen Fu,a
(kN)
Du,a
(mm)
Dm,a
(mm)
Fu,b
(kN)
Du,b
(mm)
Dm,b
(mm)
Fu,a/
Fu,test
Du,a/
Du,c
Dm,a/
Dm,c
Fu,b/
Fu,test
Du,b/
Du,c
Dm,b/
Dm,c
TS1 3.31 3.53 5.36 1.60 4.37 4.85 1.86 0.80 1.19 0.90 0.99 1.08
TS2 4.42 4.59 6.85 2.03 4.20 6.75 2.05 1.06 0.91 0.94 0.97 0.90
TS3 4.47 4.35 7.39 2.70 4.48 7.90 1.65 1.01 0.86 1.00 1.04 0.92
Mean 1.85 0.96 0.99 0.95 1.00 0.96
S.D. 0.20 0.14 0.18 0.05 0.04 0.10
Note: “a” stands for independent resistance in each direction (model A), “b” represents that the interaction of
shear and tension responds (model B) was taken into account.
a) Model A independent action b) Model B interaction action
Figure 5-38 Force-to-displacement curve of the joint in TS1
a) Model A independent action b) Model B interaction action
Figure 5-39 Force-to-displacement curve of the joint in TS2
0
1
2
3
4
5
0 1 2 3 4 5 6 7 8 9
Forc
e (k
N)
Displacement (mm)
demec gauge(centre) FEM1(centre)
0
1
2
3
4
5
0 1 2 3 4 5 6 7 8 9
Forc
e (k
N)
Displacement (mm)
demec gauge(centre) FEM1(centre)
0
1
2
3
4
5
0 1 2 3 4 5 6 7 8 9
Forc
e (k
N)
Displacement (mm)
demec gauge(centre) FEM1(centre)
0
1
2
3
4
5
0 1 2 3 4 5 6 7 8 9
Forc
e (k
N)
Displacement (mm)
demec gauge(centre) FEM1(centre)

135
a) Model A independent action b) Model B interaction action
Figure 5-40 Force-to-displacement curve of the joint in TS3
5.4 Summary
Experimental and numerical investigation on screw joint with thin thickness high strength
material S550 has been presented. The test included three typical loading scenarios including
shear, tension and mixed actions. The slope U section was proposed to implement the
combination of shear and tension force in the tests. The bearing capacity, flexibility, and
failure modes were identified in the test. A comparative study between the test results and the
analytical values predicted by specifications was presented. Based on the current code and test
results, this chapter developed expressions to prediction the ultimate resistance of screw joint
suffering combined shear and tension action, and the proportional coefficient β was also
proposed. In the numerical study, bushing connector shows good agreement with
experimental and analytical studies. The coefficient β introduced to the modelling further
proved the numerical validation. It was revealed that combined shear and tensile force can
significant reduce the resistance in the shear direction further accelerate the failure process of
the joint but enlarge the ductility. Furthermore, the interaction of the bearing capacity of
screw joint under mix loadings was detected in the paper. The developed simulation method
in this chapter can be applied in design process of screwed connections.
0
1
2
3
4
5
0 1 2 3 4 5 6 7 8 9
Forc
e (k
N)
Displacement (mm)
demec gauge(centre) FEM1(centre)
0
1
2
3
4
5
0 1 2 3 4 5 6 7 8 9
Forc
e (k
N)
Displacement (mm)
demec gauge(centre) FEM1(centre)

136
CHAPTER 6 CONNECTION BETWEEN MODULAR
PANELS
6.1 Introduction
In recent years, high strength CFS sections have begun to be commonly used as load-bearing
members in constructions especially in the low-rise dwellings. Designing an efficient
connecting method for such structures is imperative as it is a vital factor affecting the cost and
the safety controls in the CFS modular structures. This chapter presents a study of several
connection configurations. For improving the structural properties of the typical connecting
method, three connection configurations were proposed in this research. In order to reveal the
entire process response of the different connections, the numerical study was conducted by
using finite element software ABAQUS. The structural properties of each screw joint were
tested in the Chapter 5 and introduced in the connection simulation. As a result, the force-to-
displacement relationships were achieved to illustrate the resistance of the connection in shear,
tension and rotation directions. With regards to the connection structural properties, the
robustness of the CFS modular panel structure was estimated through the full-scaled 3D
modelling and 2D frame modelling. The cases involved the removal of the external and
internal wall panels, respectively.
6.1 Connection investigation
6.1.1 Connection configurations
The CFS modular panel system is composed of stud, track, pipes, thermal and acoustic
insulation, as well as internal and external decorations. The galvanized cold-formed structural
elements in the modular panels usually adopt C-section and U-section (see Figure 6-1a and 6-
1b). As is shown in Figure 6-1c, section 1 is the joist in the floor; section 2 is the floor track;
section 3 is the wall track and section 4 is the post of the load bearing wall panel.

137
a) C-section b) U-section
c) Section assembly
Figure 6-1 Sections in CFS modular panel system
In this research, screws (see Figure 5-1) were employed assembling the connections between
the wall panel and the floor panel. Although the floor panel can be either assembled on the
side of wall panel or placed on the top of wall, in a high-rise building, the vertical forces is
suggested to be transferred directly go through the wall panels in the wall bearing modular
system. Therefore, connection between floor and wall panels dominantly carries a shear force
under normal loading condition.

138
When the abrupt removal of the ineffective component occurs, the force transferring path may
be changed. Assuming the ductility and strength meet the requirement of catenary action, the
load acting on the connection consists of shear and moment. Specific to the screw joint
between jointed panels, each screw may be subject to combined shear and tension in the
typical connection method. Intermediate stiffer is supposed to improve the tension and
moment resistance, which is employed in the connection innovation. The details of the
connection configurations are described as follows.
The typical connection method introduced in this thesis is presented as connection type A (see
Figure 6-2). Load acting on the joists is transferred to the floor panel track through screw
joints on the flange. The track is restrained to the post flange with four screw joints.
Figure 6-2 Perspective and explosion diagram of connection type A
To enhance the flange and web of joist, a modified bracket was suggested as connection type
B (see Figure 6-3). The bracket connects to the webs of wall track and post by screw joints.
There is a rectangular pre-opening in the web of floor track to ensure that the bracket can pass
through and connect to the floor panel. In that case, the transverse load transfers to post
through the bracket instead of the floor panel track.

139
Figure 6-3 Perspective and explosion diagram of connection type B
Figure 6-4 Perspective and explosion diagram of connection type C
Bracket
Double cleats

140
The connection type C consists of two rectangular cleats assembled through the pre-opening
in tracks and post (see Figure 6-4). The cleats are put both sides of the connected webs. As
shown in Figure 6-5, only one rectangular cleat is employed in connection type D to connect
the back-to-back compound sections. The screw joints in connection C and D are performed
as double shear joint.
Figure 6-5 Perspective and explosion diagram of connection type D
6.1.2 Theoretical analysis
6.1.2.1 Assumptions
The structural behaviour of the screw joint follows the experimental results obtained in
Chapter 5. It should be noted that, the floor slab, brick wall, oriented strand board (OSB) or
cement particle board (CPB) are general attached in the construction system (Lawson et al.,
2012) and the lateral torsional distortion caused by the eccentricity of the open section can be
Single cleat

141
restrained (Lawson and Ogden, 2008). Compared with the ductility of the each connection,
the elongation of the joist section is small enough to be ignored.
The in-plane strength (U) and stiffness (K) of the connection between two modular panels
consist of (1) joist section in-plane deformation (Uj, Kj), (2) deformation of joint between joist
and track (Ujt, Kjt), (3) floor track deformation (Ut, Kt), (4) the deformation of connector
between the floor panel and wall panel (Uc, Kc), including joint, cleat or bracket, and (5)
deformation of the post section (Up, Kp). is the tension resistance of the screw joint; is
the ultimate resistance of single shear screw joint; the is the ultimate resistance of the
double shear joint; k1 is the stiffness of the screw single shear joint; k2 is the stiffness of the
double shear joint; k3 is the stiffness of the single tension joint.
(Eq. 6-1)
( ) (Eq. 6-2)
6.1.2.2 Longitudinal tension resistance
The longitudinal stiffness Kl and strength Ul of the connection are:
(Eq. 6-3)
( ) (Eq. 6-4)
For connection type A, joist and track are connected by four screws subjected to single
shear force pattern, therefore,
(Eq. 6-5)
(Eq. 6-6)
The track and post are connected by four screw single tension joints, the connection properties
can be expressed by,
(Eq. 6-7)
(Eq. 6-8)
The stiffness and strength of the floor track (Kt,l, Ut,l) and post (Kp,l, Up,l) depend on the
section material and dimensions.

142
For connection type B, the wall panel and floor panel are only connected through bracket. The
five joints connecting bracket and joist are subjected to shear force. The longitudinal stiffness
Kl and strength Ul of the connection are only related to and .
(Eq. 6-9)
(Eq. 6-10)
For connection type C, floor panel and wall panel are assembled by double cleats with six
double shear screw joints.
(Eq. 6-11)
(Eq. 6-12)
Connection D is the same with connection C.
6.1.2.3 Vertical shear resistance
The vertical stiffness Kv and strength Uv are:
(Eq. 6-13)
( ) (Eq. 6-14)
For connection type A, the vertical load is carried by the four fasteners linking floor panel and
wall panel. The stiffness and strength of the connector can be calculated by:
(Eq. 6-15)
(Eq. 6-16)
For connection type B, each module is connected to the bracket with five fasteners, including
two screws on the top and three screws in the middle. The calculations can be obtained:
(Eq. 6-17)
(Eq. 6-18)
The stiffness and strength of the floor track (Kt,v, Ut,v) depend on the section material and
dimensions.
For connection type C, floor panel and wall panel are assembled by double cleats with six
double shear screw joints.

143
(Eq. 6-19)
(Eq. 6-20)
Connection D is the same with connection C.
6.1.2.4 Rotation resistance
Assuming the rotation centre is at the bottom corner of the floor panel track, the rotation
stiffness Kr and moment carrying capacity Ur can be figured out. As for connection type A,
rotation stiffness Kr is contributed by screw joints between joist and track Kjt,r, track Kt,r,
screw tension joints between track and post Kc,r, and the rotation stiffness of post flange Kp,r.
(Eq. 6-21)
( ) (Eq. 6-22)
(Eq. 6-23)
Assuming that θ is small enough, sinθ=Δ/h≈θ, then
(Eq. 6-24)
(Eq. 6-25)
Du1 is the deformation when the screw joint reach the maximum shear resistance.
For the screw tension connection between wall panel and floor panel,
∑
( ) (Eq. 6-26)
∑ ( ) (Eq. 6-27)
where θ is the rotation angle, h the height of the joist,Δi is the deflection of each screw, di is
the distance of screw to the inflection point, max = Du3 which is the screw joint deformation
when the maximum tension force is achieved; Kt,r, Kp,r and Ut,r can be examined by FEM.
For connection type B, the five single shear screw joints resist transverse bending:
∑
( ) (Eq. 6-28)
∑ ( ) (Eq. 6-29)

144
Kc,r and Uc,r are the stiffness and strength of the bracket that can be examined by FEM.
For connection type C, there are six double shear screw joints resisting the moment:
∑
( ) (Eq. 6-30)
∑ ( ) (Eq. 6-31)
Kc,r and Uc,r are the stiffness and strength of the cleat that depend on the section material and
dimensions. Connection D is the same with connection C.
6.1.3 Numerical analysis
6.1.3.1 Normal loading conditions
6.1.3.1.1 Modelling process
In the models, the internal space between joists or posts was 300mm. The floor panel was 3
metres in width and 6 metres long. The wall panel was 3m high and 6m in length. The stud
and track sections were selected based on the current productions from the Albion Sections
Ltd. Table 6-1 presents the dimension properties of the sections.
Table 6-1 Dimensions and properties of the connected sections
SECTION DEPTH
mm
FLANGE
mm
LIPS
mm
THICKNESS
mm
Ixx
cm4
Zxx
cm3
Rxx
cm
b/h
mm
Section 1
AS1506115
Section 2
AT1545715
Section 3
AT1545715
Section 4
AS1506115
150 61 15 1.5 158.68 21.16 5.98 60.25/148.50
154 57 0 1.5 142.45 18.50 5.99 56.25/152.50
154 57 0 1.5 142.45 18.50 5.99 56.25/152.50
150 61 15 1.5 158.68 21.16 5.98 60.25/148.50
Iyy
cm4
Zxxc
cm3
Zyy
cm3
Ryy
cm Y̅
cm
AREA
cm2
WEIGHT
Kg/m
e
mm
22.31 19.39 5.24 2.24 1.84 4.44 3.41 14.24
12.14 13.08 2.74 1.75 1.27 3.97 3.09 12.91
12.14 13.08 2.74 1.75 1.27 3.97 3.09 12.91
22.31 19.39 5.24 2.24 1.84 4.44 3.41 14.24
The screw joints and material were established based on the modified modelling process
mentioned in Section 4.3. The screw shank was constrained with the edge of the hole by “tie”.

145
In terms of the boundary conditions, the bottom of the post was fixed. To simplify the
calculations, symmetrical modelling was employed. At the end of the joist and tracks,
symmetry constraints (ZSYMM, XSYMM) were utilised respectively.
The uniform distributed load was directly applied at the flange of the joist. Riks solution was
adopted in the nonlinear analysis to find out the critical bearing capacity of the systems.
6.1.3.1.2 Results
The lateral torsion caused by the eccentricity to the shear centre was observed under normal
loading conditions (see Figure 6-6 and 6-7). According to the numerical analysis, the ultimate
resistance of connection type A is 4.87kN. The maximum stress occurred in the screw joint of
the bottom flange. As shown in Figure 6-6, the bearing capacity of the joist-to-post
connection is limited by the local failure.
Figure 6-6 Meshing and stress contour of the connection type A
As is mentioned above, the typical joist-post connection in modular structure presents
ineffective force transferring path. According to the results, the floor panel track carried most
of the allowable load. In order to take full advantage of each member and improve the
resistance of the connection, a bracket was proposed as shown in connection type B (see
Figure 6-7). The thickness of the bracket is 3mm. The material of the bracket is the same with
the sections. The floor panel track is no longer to be considered as the load carrying member,
which is removed from the modelling. Based on the analysis, it can be observed that the
failure occurs in the proposed bracket.

146
Figure 6-7 Meshing and stress contour of the connection type B
The resistance of the system with connection B is significantly improved with the carrying
capacity of the connection being 7.60kN, which is 56% higher than the system assembled by
the typical connecting method. The deformation and Von Mises stress distribution of the
bracket are shown in Figure 6-7.
6.1.3.2 Abnormal loading conditions
The numerical analysis of connection performance involves the potential loading scenarios of
shear, tension and rotation. The structural properties of each screw joint are assumed to follow
the numerical analysis in Section 5.3. When the connection is subjected to pure bending
action, it is assumed that the connection characterises sufficient rotation capacity. In the post-
failure stage, plastic hinge can be formed when the connection loses the moment resistance.
6.1.3.2.1 Modelling process
6.1.3.2.1.1 Material and dimension
The connection impacting zoon in the analysis is assumed to be limited in 200mm of the post
and 100mm of joist, which is based on the potential deformation of the joint and connected
members. In order to identify the connection response, 200mm post and 100mm joist related
to the connection were established in the FE modelling. The tracks were 300mm long. The
section selection was based on SSMA ICBO ER-4943P.

147
This system consists of the CFS components using S550 steel plate. The material property
was based on Section 5.2.4.1 and 5.3.1.3. Table 6-2 shows the dimension properties of the
stud and track sections.
Table 6-2 Dimensions and properties of the connected sections
SECTION DEPTH
mm
FLANGE
mm
LIPS
mm
THICKNESS
mm
Ixx
cm4
Zxx
cm3
Rxx
cm
Mmax
kN·m
Section 1
600S200-43
Section 2
600T200-43
Section 3
350T162-43
Section 4
350S162-43
152 51 16 1 99.99 13.15 5.95 6.75
154 51 0 1 87.78 11.4 5.9 5.85
91 41 0 1 22.07 4.85 3.61 2.49
89 41 13 1 24.76 5.56 3.58 2.85
Iyy
cm4
Zxxc
cm3
Zyy
cm3
Ryy
cm Y̅
cm
AREA
cm2
WEIGHT
Kg/m
e
mm
10.27 6.91 2.84 1.9 1.48 2.82 2.21 16.85
5.7 5.58 1.39 1.5 1.02 2.52 1.97 16.78
2.66 2.74 0.85 1.25 0.97 1.69 1.32 14.78
4.76 3.41 1.76 1.57 1.39 1.93 1.51 14.87
6.1.3.2.1.2 Element and meshing
In the study, the commercial FE package ABAQUS was used to carry out further analysis of
joints implemented in modular construction. Three-dimensional SHELL element S4R (A 4-
node doubly curved thin or thick shell, reduced integration, hourglass control, and finite
membrane strains) was employed to predict the behaviour of the thin-walled components.
This element involves six degrees of freedom-three translations and three rotations. The screw
joint in the connection was simulated by Bushing Connector Section (BCS) which is flexible
in usage without specific shape and provides a bushing-like connection between two nodes.
Between the nodes, six degrees including three translations and three rotations of bushing
element (see Figure 5-30) can be defined linearly or nonlinearly with the damage criteria.
BCS does not constrain any components of relative motion and uses local orientation
definitions, which is equivalent to combining connection types Projection Cartesian and
Projection Flexion-torsion. The responses of the connection in three local directions are
specified by the Projection Cartesian connection. This connection applies orthonormal system
that follows the systems at both nodes a and b (see Figure 6-8). Thus, the change in position
of node b relative to node a along the (projection) coordinate directions (e1, e2, e3) are

148
measured. Connection type Projection Flexion-torsion provides rotational properties between
two nodes, accounting two component flexion angles as shown in Figure 6-8.
Figure 6-8 Illustration of connection translation and rotation (Abaqus-6.13, 2013)
In the modeling, nonlinear elasticity in shear and tension direction were defined based on test
data in Section 5.2.4. As a result, the connectors became damaged when the longitudinal
elongation exceeded 8.10mm/15.15mm for single/double shear specimens in the shear
direction. The maximum tension resistance of BCS was limited by 1.58kN. The diameter of
the connector was 5.5mm. Meshing is closely related to the convergence and precision of
FEM modelling. The shell element shape was “Quad” with “Structured” technique. Through
an extensive trial-and-error process and sensibility analysis, the most satisfactory results were
achieved while using the following discretisation pattern: the approximate global sizing of the
screw was 1.6mm; in terms of CFS components, that value was defined as 5mm.
6.1.3.2.1.3 Boundary condition and loadings
The end of the post was fixed. At the end of the track, a symmetry constraint (ZSYMM) was
applied. Displacement load was applied in the simulation in each scenario. The lateral
movement of the joist was restrained.
6.1.3.2.1.4 Interaction and solution
The friction coefficient of 0.3 was applied to the interfaces. The “hard contact” condition was
defined between components. The Von Mises yield criterion was adopted for the analysis
along with nonlinear incremental-iterative Full Newton solution technique. Material and
geometric nonlinearity were taken into account. The investigation did not involve the
buckling analysis of the joists. Therefore, the initial imperfection was not introduced in the
simulation.

149
6.1.3.2.2 Results
As shown in Figure 6-9, when the connection type A under a tension force, the tension force
rises linearly with an increase of the displacement. When the displacement reaches 8.36mm,
the side screw joints are supposed to be pulled out firstly, with ultimate loading force 3.73kN.
Hence, the tension force drops down. After that the middle screw begins to carry the load
until the failure occurred. The maximum horizontal movement of connection A is 13mm.
Figure 6-10 shows that when the connection is subjected to pure shear force, the screw joints
provide amply resistance. However, when the displacement reaches 4mm, the local buckling
in the web of the joist is observed, leading to the vertical stiffness of the connection reduced
sharply. When the deflection of the joist reaches 20mm, the shear resistance of connection A
is 5.51kN. The rotation response of connection type A is mainly determined by the screw
pull-out resistance. There are four steps during the simulation (see Figure 6-11). As shown in
Figure 6-12, the screw joints connecting the floor and wall panels fail orderly from top to
bottom. The ultimate moment of 0.22kNm is obtained when the rotation angle is 0.06rad.
Figure 6-9 Connection type A subjected to pure tension
0
1
2
3
4
0 2 4 6 8 10 12 14
Forc
e(kN
)
Displacement(mm)
idealization
Pure tensionConnection A

150
Figure 6-10 Connection type A subjected to pure shear
Figure 6-11 Moment-rotation curve of connection A subjected to bending
Figure 6-12 Connection type A subjected to bending
0
1
2
3
4
5
6
7
0 10 20 30
Forc
e(kN
)
Displacement(mm)
idealization
Pure shearConnection A
0.0
0.1
0.2
0.3
0.0 0.1 0.2 0.3 0.4 0.5
Mo
men
t(kN
·m)
Rotation(rad)
idealization
Rotation Connection A

151
Figure 6-13 Connection type B subjected to pure tension
The ultimate tension resistance of connection type B is 23.32kN, with the displacement of
5.17mm (see Figure 6-13), indicating that the enhancement of the introduced bracket is sound.
The tension resistance of connection B is around six times of that of connection A, whereas
the horizontally allowable movement (10.15mm) is smaller than connection type A.
It can be found that the fastener was supposed to be wrecked before the failure occurred in the
connected component. In the pure shearing scenario (see Figure 6-14), due to the deformation
of the bracket, the initial stiffness of connection type B is only 910kN/m, and the stiffness is
further reduced after the shear force reaching 6.98kN. Herein, a notable local buckling occurs
in the bracket. The ultimate shear force is 8.47kN, which is improved 54% of the resistance of
connection type A.
0
5
10
15
20
25
0 2 4 6 8 10 12
Forc
e(kN
)
Displacement(mm)
idealization
Pure tensionConnection B

152
Figure 6-14 Connection type B subjected to pure shear
0
1
2
3
4
5
6
7
8
9
0 5 10 15 20
Forc
e(kN
)
Displacement(mm)
idealization
Pure shearConnection B

153
a) Upward b) Downward
Figure 6-15 Connection type B subjected to bending
As shown in Figure 6-15, the upward and the downward rotation resistance are 0.28kNm and
0.53kNm respectively. The connection compromises after the rotation angle exceeding
0.073rad and 0.076rad. The allowable rotation angle is larger than that of connection type A
in either upward or downward direction.
0.0
0.1
0.2
0.3
0.00 0.05 0.10 0.15
Mo
men
t(kN
·m)
Rotation(rad)
Rotationconnection Bupward
idealizationupward
0.0
0.1
0.2
0.3
0.4
0.5
0.6
0 0.05 0.1 0.15
Mo
men
t(kN
·m)
Rotation(rad)
Rotationconnection Bdownward
idealizationdownward

154
Figure 6-16 Connection type C subjected to pure tension
Figure 6-16 shows that the tension resistance (48.54kN) can be achieved with the horizontal
movement being 7.76mm. It is found that the double cleat connection configuration
significant increase the tension resistance of the joist-to-post connection. The maximum
displacement is 17.5mm which is also greater than others. However, when the connection is
subjected to pure shear load, the resistance of the connection is limited by the local bucking
occurred around the opening in the web (see Figure 6-17). The displacement-to-force curve
shows moderate trend after reaching the peak load 11.20kN. Figure 6-18 illustrates that the
ultimate bending moment (1.05kNm) can be obtained when the rotation angle is 0.17rad. The
stress concentration appears in the post leading to the softening after reaching the peak load.
0
10
20
30
40
50
60
0 5 10 15 20
Forc
e(kN
)
Displacement(mm)
idealization
Pure tensionConnection C

155
Figure 6-17 Connection type C subjected to pure shear
Figure 6-18 Connection type C subjected to bending
0
2
4
6
8
10
12
0 1 2 3 4
Forc
e(kN
)
Displacement(mm)
Pure shearConnection C
idealization
0.0
0.2
0.4
0.6
0.8
1.0
1.2
0.0 0.1 0.2 0.3
Mo
men
t(kN
·m)
Rotation(rad)
idealization
RotationConnection C

156
As shown in Figure 6-19, the number of the fasteners in connection D is the same with
connection type C. As a result, the tension resistances of connection C (48.50kN) and
connection D (48.41kN) are almost the same. However, the connection D provides better
shearing resistance than connection C when the vertical displacement reaches 5.26mm, with
the ultimate force of 32kN (see Figure 6-20). This type of connection also provides the
greatest ultimate bending moment and initial rotation stiffness (see Figure 6-21). The peak
moment can be obtained when the rotation angle of the connection is 0.08rad. The structural
behaviour of each connection configuration and the corresponding idealized curves are listed
in Table 6-3.
Figure 6-19 Connection type D subjected to pure tension
0
10
20
30
40
50
60
0 5 10 15 20
Forc
e(kN
)
Displacement(mm)
idealization Pure tension Connection D

157
Figure 6-20 Connection type D subjected to pure shear
Figure 6-21 Connection type D subjected to bending
0
5
10
15
20
25
30
35
0 1 2 3 4 5 6
Forc
e(kN
)
Displacement(mm)
Pure shearConnection Didealization
0.0
0.5
1.0
1.5
2.0
2.5
3.0
3.5
0.00 0.05 0.10 0.15 0.20
Mo
men
t(kN
·m)
Rotation(rad)
idealization
RotationConnection D

158
Table 6-3 Connection simulation results
Connection type
Load pattern
Ultimate
force
(moment) Umax
kN
(kN·m)
Displacement (Rotation)
δ
mm (rad)
Failure mode
Initial stiffness
k0 kN/mm
(kN·m/rad)
Idealized lines
A
Tension 3.73 8.36 Screw pull-out 0.45 y=0.45x 0≤x≤8.36
y=-0.80x+10.45 8.36<x≤13
Shear 5.51 20.00
Buckling in
the joist and
floor track sections
1.00 y=x 0≤x≤4
y=0.09x+3.62 4<x≤20
Bending (0.22) (0.06) Screw pull-out (3.67)
y=3.67x 0≤x≤0.06
y=-0.71x+0.26 0.06<x≤0.30
y=0.05 x>0.3
B
Tension 23.32 5.17 Screw joint
shear failure 4.51
y=2.26x 0≤x≤5.17
y=-0.14x+12.37 5.17<x≤7.8
y=-4.62x+47.31 7.80<x≤10.15
shear 8.47 20.00 Buckling in
the bracket 0.91
y=0.91x 0≤x≤7.54
y=-0.13x+8.77 7.54<x≤8.77
Bending
Upward
(0.28)
Downward (0.53)
Upward
(0.073)
Downward (0.076)
Buckling in
the bracket
Upward
(3.84)
Downward (6.97)
Upward: y=3.84x 0≤x≤0.073
y=-32.86x+2.68 0<x≤0.08
y=0.05 x>0.08
Downward:
y=6.97x 0≤x≤0.076
y=-120x+9.65 0<x≤0.08
y=0.05 x>0.08
C
Tension 48.54 7.76 Screw joint
shear failure 10.43
y=10.43x 0≤x≤3.44
y=2.93x+25.82 3.44<x≤7.76
y=-2.41x+67.22 7.76<x≤12
y=-6.70x+117.32 12<x≤17.5
Shear 11.20 3.34 Buckling in
the post web 3.97
y=3.97x 0≤x≤2.57
y=1.29x+6.91 2.57<x≤3.34
y=-70x+245 3.34<x≤3.5
Bending (1.05) (0.17) Buckling in
the post (8.44)
y=8.44x 0≤x≤0.08
y=4.17x+0.34 0.08<x≤0.17
y=-25x+5.30 0.17<x≤0.21
y=0.05 x>0.21
D
Tension 48.41 7.76 Screw joint
shear failure 10.37
y=10.37x 0≤x≤3.44
y=2.95x+25.53 3.44<x≤7.76
y=-2.28x+66.10 7.76<x≤12.81
y=-7.77x+132.11 12.81<x≤17
Shear 32.58 5.26 Failure in the
cleat 9.33
y=9.33x 0≤x≤3
y=2.03x+21.92 3<x≤5.26
y=0 x>5.26
Bending (3.12) (0.08) Screw joint
shear failure (76.67)
y=76.67x 0≤x≤0.03
y=16.40x+1.81 0.03<x≤0.08
y=-102.33x+11.31 0.08<x≤0.11
y=0.05 x>0.11
6.2 Robustness investigation
Constructions undergo disproportional/progressive collapse when the primary elements fail.
Investigations have been conducted to prevent disproportional/progressive collapse and have
been reflected in design codes, specifications and guidelines, including the British Standard

159
(BS., 1997, BS., 1996) and Regulation (ODPM., 2004), Eurocode (Eurocode, 2004, Eurocode,
2006a), NBCC (2005), ASCE7-05 (2005), ACI318 (2011), GSA guidelines (GSA., 2000,
GSA., 2003) and DoD guidelines (DoD., 2005, DoD., 2013). However, none of them has
taken into account of CFS structure that has different connection configurations and has been
commonly used as load-carrying members in constructions.
6.2.1 Cantilever and beam action of floor panels
This investigation aims to figure out the influence of the connection resistance on the
robustness of the CFS modular panel system. With the removal of an external panel, the
failure area of the construction and the collapse components are considered as the evaluation
criterion. In order to prevent the progressive collapse, DoD guidelines requires the collapse
area of the floor directly above the comprised member should be less than the minimum value
of 70m2 and 15% of the total area of the floor.
6.2.1.1 Modelling process
The software package SAP2000v14.1 was employed in the 3D structural analysis. The
modular construction was assembled with floor panels, wall panels and the equivalent
connections (see Figure 6-22 and 6-23). As shown in Figure 6-22, the wall panel was
composed of stud, track and lateral bracing. The floor panel consists of stud and track sections.
The construction was a three-floor four-bay residence hall. The post spacing around the
window satisfies the requirement of Metsec SFS Installation Manual. The structural stud and
track sections (see Table 6-4) were selected according to the Steel Stud Manufacturers
Association (ICBO ER-4943O). Each modular panel was composed with stud and track
sections. The section selection was based on SSMA ICBO ER-4943P. The section material
was considered as S550 CFS with the material property according to curves captured from
coupon tests. The equivalent connection is illustrated in Figure 6-23. The short beams
installed in the modelling between the floor track and wall track was used to replace the
structural properties of the connection. According to the connection properties, the tension,
shear and rotation stiffness of the connections were assigned in the joint between the short

160
beam and the wall panel post. The equivalent section was applied to the short beam describing
the carrying capacity of the connection. The length of the short beam was 50mm.
In addition, 50mm thick concrete slab was laid on the floor panel, with a reinforcement ratio
of 0.15%. The structure was not designed by progressive collapse process. Thus, it is
necessary to be checked in the following cases and find out the component which should be
re-designed or enhanced.
The loading condition was assumed as shown in Table 6-5. The load combination was based
on the DoD guidelines during the numerical analysis. With regard to the dynamic influence
(Ruth et al., 2015), the amplified factor 2 was applied as the provision in DoD guidelines on
the components above the ineffective panel. The carrying capacity of each cold-formed
section was checked by using specifications in AISI-LRFD 96.
Table 6-4 Section properties
Storey Wall panel stud Wall panel track Brace Floor panel stud Floor panel
track
3rd 350S162-43 350T162-43 075U50-54 600S200-43 600T200-43
2nd 600S200-43 600T200-43 075U50-54 600S200-43 600T200-43
1st 800S250-43 800T250-43 075U50-54 600S200-43 600T200-43
Table 6-5 Construction loading condition
Load pattern Live load Dead load
Roof 1.0 kN/m2 (kPa) 0.9 kPa
Floor 2.0 kPa
50 mm in lightweight concrete including metal deck 0.9 kPa
Cold forming framing panel depends on the designed
sections
10 mm Gypsum/wood board 0.15 kPa
150 mm Mineral wool 0.03 kPa
Total 1.16 kPa
Wall N/A
Cold forming framing panel depends on the designed
sections
10 mm Gypsum/wood board 0.15 kPa
90 mm Mineral wool 0.02 kPa
Total 0.235 kPa
Window glass and mullion system 0.5 kPa
Interior 0.5 kPa
Snow 1.44 kPa N/A

161
a) Wall panels
b) Floor panels
Figure 6-22 Modular construction configurations
Figure 6-23 Equivalent connection
GSA guidelines have also provided a determination of demand-capacity ratio DCR=QUD/QCE,
in which QUD represents the acting force and QCE stands for the resistance of the component.
Blue line post section
Purple line wall track section
Green line joist section
Yellow line floor track section
Red line equivalent short beam

162
It was suggested to find out the distribution and magnitude of potential inelastic demands of
the structure in linear elastic analysis. In the redundancy analysis process, the member has the
DCR value larger than 2.0 was considered to be severely damaged. The connection was
supposed to be damaged with the DCR of 1.0. The damaged components were removed in the
further analysis process. It should be noted that when the connection was damaged, the related
component was supposed to be ineffective as well. Figure 6-24 illustrates the procedure of the
3D progressive collapse analysis.
Figure 6-24 Analytical process of progressive collapse resistance
6.2.1.2 Results
The investigation involved cases as shown in Figure 6-25. In Case 1, the construction was not
collapse with each connection type as shown in Figure 6-26. After removing the damaged
members, all elements and connections have the stress ratio less than 0.7. The progressive
collapse did not occur.
As shown in the pictures (see Figure 6-27) for Case 2, the compound sections between the
modular panels resist the exerted loads in the initial modellings. The compound sections act
as a frame in the structure. When collapsed elements are removed in the modelling, the
STEP 1 Remove the assumed ineffective wall panel as shown in Case 1 and 2
STEP 2 Perform linear analysis according to DoD guidelines
STEP 3 Check the cold-formed members by using AISI-LRFD 96 and the equivalent connections by using AISI-LRFD 99.
If DCR value of the members and connections less than 2.0 and 1.0 respectively, go to STEP 5; otherwise, go to STEP 4
STEP 4 Remove the members featuring DCR values more than or equal to 2.0; remove the connection and connected joist featuring DCR
values more than or equal to 1.0 from the modelling and go to STEP 2
STEP 5 According to DoD guidelines, check the damage member and the collapse area

163
structure reacts with cantilever action mechanism. In contrast, connection type C is stiffer
than other connection types, leading to the large magnitude of the negative moment in the
cross sections of the joists. The reason is supposed to be that the connection stiffness
determined the tension, shear and moment distribution. When the rotational stiffness
increased, the bending moment raised at the end section of the joist, which caused the joist
failure. Thus, the construction assembled by connection C presents more serious collapse. The
diagram of acting force-to-carrying capacity ratio is presented in Figure 6-27. It can be found
that none of the connection failed in the analysis, and the collapse area was only counted by
the failed joists and posts.
a) Case 1 b) Case 2
Figure 6-25 Analysed cases of progressive collapse resistance
a) Initial result b) Final result
Figure 6-26 DCR result of construction collapse in Case 1

164
a) Initial result with connection A b) Final result with connection A
c) Initial result with connection B d) Final result with connection B
e) Initial result with connection C f) Final result with connection C
Figure 6-27 DCR result of construction collapse in Case 2

165
Table 6-6 Analysis results of cases
Connection
method Case Storey
Number
of
removed
damage
members
DCR≥2
Number of
damage
connection
DCR≥1
Number of
failure
members
1.5≤DCR≤2
Number of
failure
members
1≤DCR≤1.5
Collapse
area of
the floor
m2
Collapse
area/total
floor
area
%
Connection A 1 3rd 4 0 0 0 0 0
2nd 6 0 0 0 0 0
1st 2 0 0 0 0 0
2 3rd 14 0 2 0 0 0
2nd 16 0 0 0 0 0
1st 16 0 0 7 10.8 15
Connection B 1 3rd 4 0 0 0 0 0
2nd 6 0 0 0 0 0
1st 2 0 0 0 0 0
2 3rd 16 0 0 0 0 0
2nd 16 0 0 0 0 0
1st 16 0 0 7 10.8 15
Connection C 1 3rd 4 0 0 0 0 0
2nd 6 0 0 0 0 0
1st 2 0 0 0 0 0
2 3rd 16 0 2 8 18 25
2nd 16 0 4 6 18 25
1st 16 0 4 13 19.8 27.5
Table 6-6 shows the analysis results. It demonstrates that, the number of the damage members
is proportional to the rotation stiffness of the connection. The ratio of the collapsed area to the
total area of the floor (27.5% for the first floor, 25% for the second and third floor
respectively) in the construction assembled by connection type C exceeded the criteria of
DoD guidelines. Therefore, it can be concluded that the structure with stiffer connection is
more susceptible to progressive collapse regarding the removal of the external wall panel.
6.2.2 Nonlinear catenary action analysis
The progressive collapse of a structure depends on its redundancy and may involve three steps.
When the middle column is removed, the upper loading is firstly carried by the moment
resistance of the structure. The plastic hinge may form and develop in its beams. If the
horizontal tie force can satisfy the required tie force and deformation, the catenary action will
be initiated. The joists will be subjected to longitudinal tension as well as the connections.
The successive removal of the cross wall panel P3 may leads to the load transfer path change.
The structure directly above the removed element is potentially subjected to beam action or
catenary action which is determined by the stiffness and strength of the connections.

166
The tension resistance of the connection is supposed to be the critical factor when the catenary
action is performed. In fact, the combined action including tension, shear and rotation acts in
the connections simultaneously. The interaction of tension, shear and rotation actions may
reduce the resistance of the connection. However, in order to simplify the analysis process, it
assumed to be neglected in this investigation. The load bearing capacity of a structure in
progressive collapse process is limited by the properties of members as well as the
connections.
P-post; J-joist; C-connection
Figure 6-28 Components in the modelling
In order to study the influence of the connection resistance on the structural robustness and
understand the entire process response of the connection to progressive collapse scenario, the
analysis of a nonlinear 2D frame selected in the modular panel system (see Figure 6-28) was
conducted. Herein, the influence of the concrete floor is neglected. It was assumed that the
lateral bracing of the structure is sufficient so that the horizontal movement of the posts were
restrained in the modelling. The uniformly distributed load (UDL) was added on each floor.

167
As mentioned above, the amplified factor 2 was applied on the floors directly above the
removed member.
6.2.2.1 Modelling process
The commercial finite element package ABAUQ 6.13 was employed for developing the
numerical model. The posts and joists were modelled by the 2-node beam element B21. The
material was S550 CFS. The material property was obtained by the curves captured from
coupon tests in Chapter 5.
Figure 6-29 Connection idealized properties
-6.00
-4.00
-2.00
0.00
2.00
4.00
6.00
-20.00 -10.00 0.00 10.00 20.00
Ho
rizo
nta
l fo
rce
(N)
x 1
00
00
Displacement (mm)
connection A
connection B
connection C
connection D
-4.00
-3.00
-2.00
-1.00
0.00
1.00
2.00
3.00
4.00
-25.00 -15.00 -5.00 5.00 15.00 25.00
Ver
tica
l fo
rce
(N)
x 1
00
00
Displacement (mm)
connection A
connection B
connection C
connection D
-40.00
-30.00
-20.00
-10.00
0.00
10.00
20.00
30.00
40.00
-0.40 -0.20 0.00 0.20 0.40
Mo
men
t (N·
mm
)
x 1
00
00
0
Rotation (rad)
connection A
connection B
connection C
connection D

168
The dimension property of each member was assigned according to Table 6-4. The posts and
joists were assembled by nonlinear spring connections. The shear, tension and rotation
properties of each connection solution were based on the corresponding idealized multi-linear
results (see Figure 6-29). The bottom of the ground floor posts was fixed. The horizontal
movement of the posts were restrained. Based on the balance of precision and computing time,
the most satisfactory results were achieved when mesh size was 50mm. The solution of the
analysis adopted a nonlinear incremental-iterative Full Newton solution technique.
6.2.2.2 Results and discussion
Ultimate line load: 22.92N/mm Ultimate line load: 9.71N/mm
a) Pinned connection
Ultimate line load: 3.66N/mm Ultimate line load: 0.32N/mm
b) Connection type A
Figure 6-30 Stress envelope of modular structure
Figure 6-30 shows that if a single internal wall panel is lost, the connection C3 would undergo
a downward displacement. With floor load increase, the resistance of the structure increases
until the connections compromise. The change of the force transfer path caused by the

169
removal of the primary element is revealed by the stress patterns of the modelling. In the
initial modelling, the ultimate load of the structure was controlled by the joist bending
resistance. The middle post carried more load than others. Due to the removal of the structural
element, the load added on the post directly above the removed element was reduced and the
adjacent joists were subjected to combined bending and tension leading to the stresses of the
joists increased. It indicates that the connection resistance governs the ultimate load of the
structure. The responses of each connection solution are illustrated in Figure 6-31 to 6-34.
Figure 6-31 UDL to displacement curve Figure 6-32 Axial tensile force in J2
Figure 6-33 Shear force in J2
0
1
2
3
4
0 100 200 300 400 500
Flo
or
load
(kP
a)
C3 displacement (mm)
connection A
connection B
connection C
connection D
0
10000
20000
30000
40000
50000
60000
0 100 200 300 400 500
Axi
al f
orc
e (N
)
C3 displacement (mm)
connection A
connection B
connection C
connection D
-5000
-4000
-3000
-2000
-1000
0
1000
2000
3000
4000
5000
6000
0 100 200 300 400 500
Shea
r fo
rce
(N)
C3 displacement (mm)
Connection A J2 left
Connection B J2 left
Connection C J2 left
Connection D J2 left
Connection A J2 right
Connection B J2 right
Connection C J2 right
Connection D J2 right

170
Figure 6-34 Bending moment in C2 and C3
Connection type A: The force acting on the connection A increases until the ultimate load
(0.54kPa) of the structure was achieved. In the meantime, the tension resistance was obtained
with the value of 3.26kN, whereas the shear forces acting on the connection C2 and C3 are
only 70% and 40% of the carrying capacity (0.74kN). Correspondingly, the rotation angle of
connection C2 and C3 are 0.11rad and 0.107rad respectively. It can be concluded that, the
resistance of connection type A is limited by the tension resistance in this scenario. The
failure of the connection occurred, when the displacement of C3 is 396mm.
Connection type B: Connection type B provides greater ultimate strength but less allowable
deformation than connection A. The connection lost the bending moment resistance when the
axial tension force of J2 reached 11.6kN, which is only 49.8% of the carrying capacity.
Therefore, a plastic hinge is supposed to be formed in the connection. The ultimate load
(2.58kPa) can be obtained when the displacement of C3 is 309mm. The connection failed at
the displacement of C3 being 359mm.
Connection type C: The axial force carrying capacity of connection type C also determined
the resistance of the structure. The axial tension force of J2 rises to 47.78kN with increasing
displacement of C3 from zero to 237mm. Then, the load drops until the connection fails, with
vertical displacement of C3 being 420mm. When the ultimate floor load (6.23kPa) is achieved,
the shear forces acting on J2 left and right are 4.78kN and -4.78kN respectively, and the
-4000000
-3000000
-2000000
-1000000
0
1000000
2000000
3000000
4000000
0 100 200 300 400 500
mo
men
t (N·
mm
)
C3 displacement (mm)
Connection A C2
Connection B C2
Connection C C2
Connection D C2
Connection A C3
Connection B C3
Connection C C3
Connection D C3

171
rotation angles of C2 and C3 are 0.12rad and 0.09rad, which is below the ultimate limit of
connection type C.
Connection type D: Base on the connection investigation results, connection type D shows the
greatest strength and stiffness compared with other connecting methods. The bending moment
resistance of connection D begins to drop sharply after the displacement of C3 being 263mm
(see Figure 6-34). The failure mode of screw double shear tests indicates that the deformation
of the screw-hole circumference and the wrinkling in front of the screw by tension leads to the
screw joint softening, which is the reason of the decreasing of bending resistance in
connection D. In the end, it is supposed that the plastic hinge is formed in the connection
before the ultimate tension force (48.41kN) achieved. The ultimate floor load of the structure
(6.44kPa) can be obtained when the vertical displacement of C3 reaches 315mm.
Figure 6-33 shows the shear force at the ends of the joist, which indicates that the connections
can provide sufficient shearing strength (see Figure 6-29) during the change of force transfer
path in the CFS structure. The failure of the connection is controlled by the tensile resistance.
In traditional concrete frame structures, the load redistribution mechanism of progressive
collapse includes three stages: beam action, compressive arching action and catenary action.
After the removal of load carrying element, the connection provides moment resistance. The
plastic hinge is firstly formed in the middle connection and then spread to the end supports.
The load acting on the connection transfers from bending to tension. Thereafter, the resistance
of the structure will increase until the connection fails by tension. In terms of the traditional
hot-rolled steel section frame structures which usually adopt semi-rigid or rigid connections,
the beam action and catenary action can also be observed in progressive collapse process.
However, the sections and connections in the CFS structure systems have thinner thickness
and higher flexibility. Due to the smaller initial stiffness than the traditional frame structures,
the tension resistance of the connection increases from the beginning (see Figure 6-32).
According to the classification in EC3 (Eurocode, 2005), the initially rotational stiffness of
connection type A, B and C are less than 0.5EI/L which are pinned connection.

172
In contrast, the connection D is classified to be semi-rigid connection. As shown in Figure 6-
35, the declining rate of the surface load is presented when the plastic hinge is firstly formed
at the ends of the joists. After forming the plastic hinge, the surface load rapidly increases and
the catenary action develops in the bottom beams directly above the removed element. In the
last stage, the structure compromises by the tensile failure of the connections.
Figure 6-35 Reactions of C2 with connection D
As for connection B, plastic mechanism is also completely formed at the side supports during
the analysis. In other cases (connection A and C), the plastic hinge has not been formed when
the tensile failure occurs (see Figure 6-34). The distinction of beam and catenary stages is not
notable in the CFS structure. In the comparison of connection C and D, the similar axial force
and shear force are presented in Figure 6-32 and 6-33. In contrast, the connection D shows
better load carrying capacity in the early stage (see Figure 6-31) because of the greater
rotational stiffness. It indicates that the upper loading is carried by connection moment,
tension and shear simultaneously (see Figure 6-36).
Figure 6-36 Resistance mechanism of the CFS panel system
0
1
2
3
4
5
6
7
0 100 200 300 400 500
C3 displacement (mm)
surface load(kPa)
joint moment C2 (kN×m)
axial force J2 (kN×10)
shear force J2 left (kN)

173
The maximum floor load is determined by the connection elongation (d2 and d3), connection
horizontal resistance (Fh), connection moment resistance (M1 and M2) and connection vertical
resistance (Fv). Thus, the total load can be divided into two parts:
Load carried by connection tension resistance w1 and q1:
( )
(Eq. 6-32)
Load carried by connection moment resistance w2 and q2:
(Eq. 6-33)
Load carried by connection shear resistance w2 and q3:
(Eq. 6-34)
The total load carrying capacity of the structure:
(Eq. 6-35)
(Eq. 6-36)
It can be observed in the modelling, q is very small. If ignore the influence of q,
(Eq. 6-37)
( )
(Eq. 6-38)
(Eq. 6-39)
If
√( ) (Eq. 6-40)
then
√( ) ( )
(Eq. 6-41)
(Eq. 6-42)
(Eq. 6-43)
(Eq. 6-44)
(Eq. 6-45)

174
where is the proportion of the load carried by connection moment resistance; w is the
uniformly distributed floor load; b is the internal spacing of joists; L is the floor span length;
d1 is the vertical displacement at the middle wall support; d2 and d3 represent the extension
experienced at the side and middle supports respectively; 1 and 2 stand for the rotation
experienced at the side and middle supports respectively; Kr1 and Kr2 represent the rotational
stiffness of the connection at the side and middle respectively; Kh and Kv stand for the
horizontal and vertical stiffness of the connection respectively; q is the line load imposed by
the upper wall panel; Fv is the vertical resisting force at the connection; T is the axial tension
force of the joist and Fh is the horizontal resisting force at the connection. The predictions of
the surface load carrying capacity achieved by the proposed expression present a good
agreement with the simulation outcomes (see Figure 6-37).
Figure 6-37 Surface load of the structure with connection D
The deviation is supposed to be cause by ignoring the load imposed by the upper element. If
, , then
(Eq. 6-46)
( )
(Eq. 6-47)
Assuming that , then
(Eq. 6-48)
Because of .
0
1
2
3
4
5
6
7
0 100 200 300 400 500
Surf
ace
load
(kP
a)
C3 displacement (mm)
Results obtainedby FEMsimulation
Results obtainedby proposedexpressions
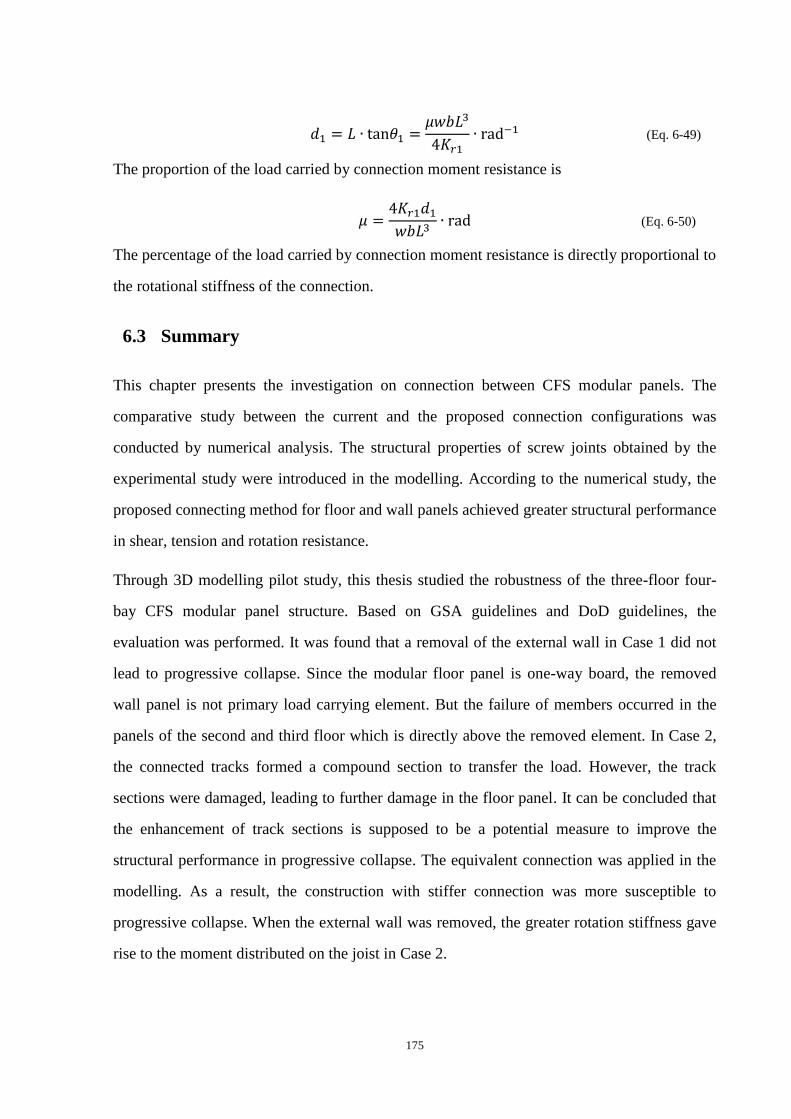
175
(Eq. 6-49)
The proportion of the load carried by connection moment resistance is
(Eq. 6-50)
The percentage of the load carried by connection moment resistance is directly proportional to
the rotational stiffness of the connection.
6.3 Summary
This chapter presents the investigation on connection between CFS modular panels. The
comparative study between the current and the proposed connection configurations was
conducted by numerical analysis. The structural properties of screw joints obtained by the
experimental study were introduced in the modelling. According to the numerical study, the
proposed connecting method for floor and wall panels achieved greater structural performance
in shear, tension and rotation resistance.
Through 3D modelling pilot study, this thesis studied the robustness of the three-floor four-
bay CFS modular panel structure. Based on GSA guidelines and DoD guidelines, the
evaluation was performed. It was found that a removal of the external wall in Case 1 did not
lead to progressive collapse. Since the modular floor panel is one-way board, the removed
wall panel is not primary load carrying element. But the failure of members occurred in the
panels of the second and third floor which is directly above the removed element. In Case 2,
the connected tracks formed a compound section to transfer the load. However, the track
sections were damaged, leading to further damage in the floor panel. It can be concluded that
the enhancement of track sections is supposed to be a potential measure to improve the
structural performance in progressive collapse. The equivalent connection was applied in the
modelling. As a result, the construction with stiffer connection was more susceptible to
progressive collapse. When the external wall was removed, the greater rotation stiffness gave
rise to the moment distributed on the joist in Case 2.

176
The removal of internal wall panel was also considered in this chapter. In general, the
construction failure is on account of the resistance of structural members and the connections.
The 2D frame nonlinear analysis was carried out to evaluate the robustness of the structure
with different connection configurations. Based on the analysis, the axial tension force of the
joist increased due to the alternative load transfer path appeared in the structure. In contrast,
connection type D is stronger and stiffer other proposed connections. The structure with
connection type D provided the greatest load carrying capacity. However, this connection
consumes much more steel and leads to an inconspicuous improvement to connection type C.
The results demonstrated that connection C is the most efficient connection solution for the
joist-to-post connection. The plastic hinge was formed in connection B and connection D
before the ultimate force achieved, leading to catenary action occurred in the structure. It was
proved that the tension resistance and deformation capacity of the connection determined the
load carrying capacity under abnormal loading conditions, and the connections most likely
fail with the tension failure. When the internal wall panel is ineffective, the floor load of the
CFS structure is carried by connection moment resistance and tension resistance of the upper
elements. The expressions for calculating the maximum floor load w and the proportion of
the load carried by connection moment resistance were proposed.

177
CHAPTER 7 CONCLUSIONS AND FUTURE WORKS
7.1 Introduction
The aforementioned aim and objectives of the research have been achieved through the
experimental, numerical and analytical analysis. According to the results obtained from this
investigation, the main contributions and conclusions could be drawn as follows.
7.2 Contributions and conclusions
7.2.1 Benefits and challenges of CFS modular building constructions
This thesis has summarized the benefits and challenges of CFS modular building
constructions through extensive literature review and case studies. In practice, reduced
construction time on site, economic benefits, energy saving, low waste, health and safety in
production, environmental protection, good thermal and acoustic insulation, and high
automation and productivity have been achieved by adopting off-site CFS modular building
structures. The potential merits of material properties and recyclability should also be
considered in the decision making process. The key barriers to the implementation of off-site
construction are focused upon the lack of norms and standards, and conventional social
concepts. In additional to these obstacles, high initial cost, low level supply chain, the lack of
a developed legal system and government incentives, poor productivity, low skilled labour
and product quality problems also impact the construction industrialisation in developing
countries.
7.2.2 Investigation on purlin-to-sheeting connections
This thesis has developed a FE model to simulate the purlin-sheeting system and predict
rotational stiffness of the purlin-sheeting connection. The rigid plate has been introduced in
the simulation to simulate screw joint. The results of the FE model are in great accordance
with the experiment results.

178
Based on the numerical analysis, this thesis quantified the factors that influence on the purlin
rotation stiffness and proposed the accurately predicting solution. It was shown that the
rotational stiffness increases remarkably with increasing section thickness for both downward
and uplift load scenarios. There is a deviation between the analytical results obtained by
design approach in EC3 and the test outcomes, because the effects of purlin thickness and the
flange width are underestimated in EC3. Based on the numerical analysis, the compensation
coefficient that relate to shell thickness ( ) and flange width ( ) was proposed, leading to a
better agreement with the test results for Σ purlins. This approach is approved to be applicable
on Z and C purlins.
A series of parametric studies have been conducted to investigate the influence of the fastener
spacing, sheeting thickness and the depth of the purlin on the rotational stiffness. The results
have demonstrated that the rotational stiffness decreases with increasing of fastener spacing,
which can be predicted by EC3. The sheet thickness has a significant effect on the rotational
stiffness. In contrast, the effect of the depth of the purlin can be neglected.
7.2.3 Investigation on screwed and bolted connections
The FE models of stud-to-track connection with screw and bolt joint have been discussed in
this thesis. It was found that the settings of constraints and interactions between the fasteners
and the connected components significantly influence structural performance of the
connections.
Validated by existing test results, the finite element models were proposed to predict the
ultimate resistance of screwed and bolted connections. Additionally, it was found that the pre-
tightening force can improve the performance of the bolted connections but in a limited range.
It was proved that the gap between connected components led to warping in the early stages,
which reduced the carrying capacity of the bolted and screwed connections. With the stud
thickness increasing, the overall resistance of the bolted connections without the gap
improved tremendously, and was much greater when compared to the connections with a gap.

179
However, this trend was not embodied in screwed connections, as the bolted connection is
more sensitive to the clearance.
The parametric study was also conducted in the analysis. It was found that increasing the
component thickness is an efficient measure to improve the resistance of the stud-to-track
connections.
A series of screw and bolt joint tests have been carried out to reveal the entire response of the
joint applied in the high strength material (S550) plates. A new test facility has been
developed to investigate the screw joint subjected to pure and mix loads. The test results and
observations have revealed the structural properties and identified the failure modes of the
joints. A comparative study has been conducted with the current codes and analytical method.
It was found that AISI can provide more accuracy than other related norms and specifications
in predicting the ultimate resistance.
The expressions were proposed to describe the interaction between the tensile and shear
actions, which can be used to predict the tensile or shear resistance of the screw joint. In
addition, the study proposed the proportional coefficients to adjust the calculations of screw
joint resistance under combined shear and tension loading conditions.
A FE model with bushing elements has been proposed to reproduce the test results, which
presented good accuracy.
7.2.4 Investigation on the connection behaviour between modular panels
The study developed three connection configurations attaching reinforcing pieces for CFS
modular panel system. The amount of increasing in weight of steel brought by the reinforcing
pieces is small. These configurations can provide great improvement of the resistance and
stiffness to the current typical connecting method when the connection was subjected to shear,
tension or rotation action. The proposed connection assembled by double shear joints
provides greater structural performance and efficiency compared with single shear joints.

180
The sudden failure and ineffectiveness of the structural element may lead to progressive
collapse. The progressive collapse resistance depends on the type selection, arrangement and
details of structure. The alternative load path method is widely employed to examine the
structural progressive collapse in engineering practice. It has been found that the structural
behaviour of the connection between primary load carrying elements highly collaborates with
the robustness and load redistribution mechanism due to the removal of load carrying element.
The numerical analysis has been conducted to evaluate the robustness of the modular
construction with the removal of either internal or external wall panels by using commercial
software package ABAQUSv6.13 and SAP2000v14.1. Based on the joint test results, the
obtained entire connection performance including stiffness and strength under normal and
abnormal loading conditions was embedded in the developed FE models through equivalent
connecting method for the investigation of modular panel system. Quantitative objectives for
the influence of connection configuration on the structural robustness have been established
by using collapse area of the floor and ultimate floor load of the structure as criteria in
analysis processes.
From the numerical analysis, it was found that when the external wall panel was removed
from the structure, cantilevered beam action occurred. The analysed connections can provide
ample strength. The moment redistribution of the floor panel above the removed element
depends on the rotational stiffness of the connection between floor panel and wall panel. The
connection with higher rotational stiffness is more likely to cause the metal component failure,
leading to larger collapse area in the floor.
On the contrary, when the internal wall panel was removed, beam action and catenary action
may be successively observed in the analysis accompanied by alternative force transfer path.
The numerical results indicated that the tension resistance and the rotation capacity of the
connections are the principal factors determining the structural behaviour of the CFS panel
system under abnormal loading conditions.

181
During the numerical analysis, it was observed that the upper loading is carried by connection
shear, tension and moment simultaneously. When the plastic hinge formed at the end
connections and then transferred to the middle connections, the catenary action occurred.
In the catenary action, the load carrying capacity of the modular panel structure is controlled
by the tension resistance of the connections. Compared with the traditional connection
solution, the proposed connection configurations with the enhanced connecting methods
presented a great improvement, especially for connection type C and D.
From the progressive collapse analysis of CFS modular panel structure, the resistance
mechanism of the CFS systems is identified to be different from the traditional frame
structures. The expressions for calculating the ultimate floor load w and the proportion of
the load carried by connection moment resistance were proposed. The prediction of the
expressions is in good accordance with the numerical result.
7.3 Limitations and future works
This thesis has provided some solutions to address the current problems in CFS modular panel
constructions. Nevertheless, the connection types studied so far are only appropriate for
limited applications. There are still many challenges in connections of CFS modular building
structures. To achieve further contributions in this field, this section lists the potential works
which need to be conducted in the future:
To conduct an experiment study for the stud-to-track connections. The simulation method
should be further validated by the test outcomes. The influence of variables, such as
component material, fastener alignment, needs to be discussed.
To carry out the experiment study for each proposed connection solution. The validation
of the numerical analysis only refers to the screw joints. Based on the assumptions in the
analysis, the interaction between the structural properties of the connection in shear,
tension and rotation directions was neglected. The resistance of the connection may be
overrated by the modelling. The numerical prediction of each connection solution needs
182
to be further examined by the full-scaled tests.
To evaluate the influence of the accessories, such as the in-filled materials, on the
structural robustness. The structure accessories can potentially improve the stability and
resistance of the main structure. The stiffness and strength enhanced by the accessories
should be identified in the future.
To develop an effective and efficient connection solution for steel frame modular cassette
system. The connection investigated in the thesis is only related to CFS modular panel
systems. However, the connection between frame modular cassettes is also a challenge in
steel modular construction.
7.4 Summary
The mean findings have been briefly stated in this chapter in aspects of features of modular
constructions, rotational stiffness of the purlin-to-sheeting system, joints and connections
between modular panels. These findings regarding connections employed in modular systems
provide instructions in construction design. However, there are still limitations and
knowledge gaps in this field, which also have been listed in this chapter.

183
Appendix I
Semi-empirical design rules for bolt joint of steels with variable ductility and strength
by Chung and Ip (2001)
For design rules comparison, the bearing resistance Pn, Vb, Pbs, Br and Fb,Rd, respectively in
AISI, AS/NZ4600, BS5950 Part 5, CSA:S136 and Eurocode 3 Part 1.3 were presented in the
paper.
• AISI:1996 Clause E3.3 and Table E3.3-1
Pn
where Pn=3.00dtfu, =0.6 for LRED; d is the bolt diameter; t is the thickness of the steel; fu is
the tensile strength of steel strips.
• AS/NZ 4600:1996 Clause 5.3.4 and Table 5.3.4.1
Vb
where Vb=3.00dftfu; =0.6 for LRED; df is the bolt diameter; t is the thickness of the steel; fu
is the tensile strength of steel strips. This is the same as design rules given by AISI.
• BS5950 Part 5:1998 Clause 8.2.5.2
Pbs=(1.65+0.45t) dtpy
where d is the bolt diameter; t is the thickness of the steel; py is the yield strength of steel
strips.
• CSA:S136:1994
Br= Cdtfu
where =0.67; when d/t<10 C when 10<d/t<15 C t/d; when d/t>15 C d is
the bolt diameter; t is the thickness of the steel; fu is the tensile strength of steel strips.

184
• Eurocode 3 Part 1.3 Clause 8.4 and Table 8.4
where =1.25; d is the bolt diameter; t is the thickness of the steel; fu is the tensile strength
of steel strips.
• New design rule in the paper
where is the resistance contribution due to bearing action (kN); is the strength
coefficient for bolt joints; d is the bolt diameter (mm) and t is the thickness of the steel (mm);
is the partial safety factor for joints at 1.25; is the design tensile strength of steel strips
and is the yield strength (N/mm2); is the resistance contribution due to frictional
action (kN); is the coefficient of friction assigned to be 0.2 for galvanized cold-formed steel
strips; is the number of contact surfaces with a value of 2 for typical joints; is the
clamping force developed at bolt shank assigned to be 12.0 kN for typical joints.

185
Appendix II
Strength function for circular press-joints (Di Lorenzo and Landolfo, 2004)
The design resistance is shown as follow,
c p p
where c is the clinching bearing coefficient (see Table II-1); p is the internal diameter
measured on punch side; p is the sheet thickness of punch side; is the partial factor for
calculating the design resistance of mechanical fasteners.
Table II-1 Assessment of the bearing coefficient for circular press-joints
General information Bearing coefficient c
Type of specimen Specimen notation e i ( i p ep i)
Asymmetrical ′ci
(specimens with two
sheets and two
clinches manufactured
by Avdel Textron)
p=5.0mm,
=6.5mm
Tests carried out in Ben
Vautier
laboratory (Italy)
′c 0.86
′c 0.90
′c 0.91
′c 0.86
′c 0.95
Tests carried out in Avdel-
Textron
laboratory (Germany)
′c 0.89
′c 0.89
′c 0.87
′c 0.89
′c 0.93
′c 0.87
′c 0.85
Statistical evaluation Mean 0.89
Standard deviation 0.02
Characteristic value
0.84

186
Appendix III
Prediction of the stiffness of bolted moment connections between cold-formed steel
components of portal frames by Lim and Nethercot (2004)
For the rotational stiffness of bolt group, the resistance Fi of each bolt-hole is positive
proportional to its distance di from the rotation centre (see Figure III-1).
i i ∑ i i
i
∑ i
where c is a constant; n is the number of the bolts in the group.
a) b)
Figure III-1 Bolt group details
The elongation stiffness of the bolt-hole is .
i i
i
The rotation can be calculated from
i
The rotational stiffness of the bolt-group is
∑ i

187
The calculation of rotational stiffness of bolt-group for different arrays of bolts is shown in
Table III-1.
Table III-1 Rotational stiffness of bolt-group for different arrays of bolts
Arrays of bolts
2×2 (
)
3×3
(
)
4×4
(
)
5×5
(
)

188
Appendix IV
Flexibility prediction for bolted moment connections (Yu et al., 2005)
The rotational stiffness of bolted moment connections is mainly influenced by such as the
connection configurations, load paths, friction in interfaces between washers and steel
sections, clamping forces developed in bolt shanks, etc. In terms of the bolted moment
connections in the paper, the effect elements for flexibility of the bolted moment connections
contain the bearing deformation around bolt holes edges; the clearance in bolt holes; flexural
and shear deformations; slippage against friction between the washers and the connected
components. A semi-empirical design rule for the flexibility prediction was proposed as
follows:
c
c
p
where
is the overall flexibility of the connection;
is the flexibility due to bending
deformation of the cold-formed steel section within the connection;
is the flexibility due to
bearing deformation of the connected section web of the cold-formed steel section around the
bolt hole;
is the flexibility due to bending deformation of the hot-rolled steel gusset plate
within the connection;
c ( )c
c
;
p ( ) p
c
where ( )c is the flexural rigidity of the cold-formed steel section; ( ) p is the flexural
rigidity of the gusset plate; c is the length of the connection; r is the distance from the bolt

189
group centre to the outermost bolt; is the bearing deformation of the section web around
bolt hole to be specified.

190
Appendix V
Calculations of buckling length of truss web members, rotational stiffness and axial
stiffness of the bolted connections (Zaharia and Dubina, 2000, Zaharia and Dubina,
2006)
With the same partial safety factor =1.25 in Eurocode 3, the stiffness of a single lap bolt
joint can be predicted
√
(
) ( )
where D is the nominal diameter of the bolt; are the thicknesses of the connected sheets.
For computation of rotational stiffness of truss connections, as the model is shown in Figure
V-1.
Figure V-1 Four bolt connection computation model
The expression with =1.25 is shown as follows:
e
( )
(
)

191
√
(
) ( )
where is the total bending moment; is the corresponding rotation; is the distance
between bolts; D is the nominal diameter of the bolt; are the thicknesses of the
connected sheets.
Considering the rotational centre is in the axis of the middle bolt (see Figure V-2), the
rotational stiffness for a similar truss connection model with six bolts can be calculated by the
following equation,
e
( )
( )
√
(
) ( )
Figure V-2 Six bolt connection computation model
The rotational stiffness can be used to determine the buckling lengths of the web members.
e e
( ) ( )
e
e e
e
e e
e e
e

192
where e is the length of the web member measured between centre lines of connections;
e is the second moment of area of the web member; e i presents the rotational stiffness
of the connection connecting the web member on the chord.
Because of the connection eccentricities (see Figure V-3), for the six bolt connection,
expression of axial stiffness of the connection is as follow:
i √
( )
ec
ec ( )
Figure V-3 Experimental model of truss

193
Appendix VI
Formulas for connection stiffness and moment resistance presented by Dubina (2008)
As is shown in Figure VI-1, the elements impacting the stiffness of the connection include
bolts in shear ( for flange bolts; for web bolts), bolts in bearing on cold-formed
member ( c for flange bolts; c for the web bolts) and bolts in bearing on the bracket
( for flange bolts; for web bolts) (see Figure VI-2).
Figure VI-1 Bolt groups in the analysis
According to Eurocode 3 (Eurocode, 2005), for each of the bolt rows r, an effective stiffness
coefficient e can be determined by individual stiffness coefficients:
e
∑ ( i )i
The effective stiffness coefficients of the bolt rows in „tension‟ zone are instead of an
equivalent spring with the stiffness e :
e ∑ e
e
where is the distance between bolt row r and the centre of compression.

194
e ∑ e
∑ e
The initial connection stiffness is:
i i e
∑ ( i)i
Figure VI-2 Main steps of the connection stiffness determination
The moment resistance of the bolt connection was divided into two steps. In the first step,
only members related to bolt resistance were considered. The moment resistance of the bolted
connection is . In the second step, the moment resistance is the minimum of moment
resistance of the bolted connection and one of the connected cold-formed steel
members e :
( e )
∑

195
where presents the effective tension resistance of the bolt row r.

196
Appendix VII
The shear resistances of the screwed connections (Kwon et al., 2008)
The width of the gap between the connected plates impacts the deformation mode and the
shear resistances. Considering the gap and different thicknesses of connected plates,
calculations for the shear resistances of the screwed connections was proposed.
When the gap between the connected plates is large:
( )
When the gap is not considerable:
( )
where t2 is the thinner thickness of the connected plate; d is the diameter of the screw; is
the ultimate tensile strength of the thinner plate. It should to be noted that the results of the
expressions are correspondingly larger than the value from AISI by 10% and 57%.
Figure VII-1 Shapes of connectors

197
Appendix VIII
Calibration factors for the truss connections with gaps (Yu and Panyanouvong, 2013)
The bearing strength of the connection depends on the strength of the connected plates, the
fasteners, the sheet thickness, the type of connection, etc.
In AISI S100 (2007), without considerations of the holes deformation, the bearing strength of
the connection can be calculated by the following expression.
where is the modification factor (see Table VIII-1); C is the bearing factor for bolted
connections (see Table VIII-2); d is the bolt diameter; t is the thickness of the thinnest sheet;
presents the tensile strength of the sheets. According the comparison with test, the results
of AISI S100 (2007) is unconventional. The author presented new modification factor (see
Table VIII-3) and bearing factor C (see Table VIII-4) in the paper (Yu and Panyanouvong,
2013).
Table VIII-1 Modification factor for bolted connections (AISI S100 (2007))
Type of bearing connection
Single shear and outside sheets of double shear connection with washers under both bolt head and nut 1.0
Single shear and outside sheets of double shear connections without washers under both bolt head and
nut,
or with only one washer
0.75
Inside sheet of double shear connection with or without washers 1.33
Table VIII-2 Bearing factor C for bolted connections (AISI S100 (2007))
Ratio of fastener diameter to member thickness, d/t C
d/t <10 3
10 ≤ d/t ≤ 22 4-0.1(d/t)
d/t > 22 1.8

198
Table VIII-3 New modification factor for bolted connections
Type of bearing connection
Single shear connection without restraints on both sides 0.675
Table VIII-4 New bearing factor C for bolted connections
Ratio of fastener diameter to member thickness, d/t C
d/t <5 3
5 ≤ d/t ≤ 28 0.33+13.33/(d/t)
d/t > 28 0.81

199
Appendix IX
Nonlinear flexural stiffness of the sleeved MZ connections (Ye et al., 2013)
Rotational behaviour model and the stiffness calculations was proposed by Bryan (1993).
However, this linear model is inapplicable for the nonlinear feature of the sleeved connections.
Figure IX-1 a) Experimental model and b) Analytical model
The effective flexural stiffness ratio is defined as follow
where is the second moment of area of the sleeved connection and is the second moment
of the purlin section.
According to Figure IX-1, the deflection at point C is
*
( )( )
+
Because two beams are tested together, the load applied is P=2F.
[( )( )
]
The rotation angle of the beam is

200
So that,
[
( ) ]
( )
The mid-span moment ( ) on one beam is
The moment resistance ratio is as follow
c
where is the moment resistance of the MZ connection; c is the moment resistance of
the continuous purlin section.
According to the numerical study,
{
{ (
) c
c
Based on the test results and parametric study, the effective flexural stiffness ratio is
( ) ( )
where is the length of the sleeve; is the mid-span moment. The sleeve length to span
ratio in the test is ranging from 18% to 39%. The expression may also applicable in a larger
scope.

201
REFERENCES
ABAQUS-6.13 2013. Analysis User's Manual, SIMULIA.
ABRUZZO, J., MATTA, A. & PANARIELLO, G. 2006. Study of Mitigation Strategies for
Progressive Collapse of a Reinforced Concrete Commercial Building. Journal of Performance
of Constructed Facilities, 20, 384-390.
ACI. 2011. Building code requirements for structural concrete (ACI 318-11).
AISI. 2007. North American Specification for the Design of Cold-Formed Steel Structural Members,
2007 Edition. (AISI-S100). Washington, DC: American Iron and Steel Institute.
ASCE. 2005. American Society of Civil Engineers (ASCE). Minimum design loads for buildings and
other structures. (ASCE7-05). Reston, VA.
ASME, M. 2003. Ultimate strength and failure mechanism of resistance spot weld subjected to tensile,
shear, or combined tensile/shear loads. Journal of Engineering Materials & Technology, 125,
125-132.
BAE, S. W., LABOUBE, R. A., BELARBI, A. & AYOUB, A. 2008. Progressive collapse of cold-
formed steel framed structures. Thin-Walled Structures, 46, 706-719.
BAMBACH, M. R., RASMUSSEN, K. J. R. 2007. Behavior of Self-Drilling Screws in Light-Gauge
Steel Construction. journal of Structural Enginnering.
BARKER, K. 2003. Review of Housing Supply: Securing our Future Housing Needs. Interim Report:
Analysis, HMSO. London.
BARKEY, M. E. & KANG, H. 2010. Tesing of spot welded coupons in combined tension and shear.
Experimental Techniques, 23, 20-22.
BEWICK, B. & WILLIAMSON, E. 2014. Computational Modeling of Steel Stud Wall Systems for
Applications to Blast-Resistant Design. Journal of Structural Engineering, 140, A4014007.
BEWICK, B. T., O‟LAUGHLIN, C. G. & WILLIAMSON, E. B. 2013. Evaluation of Conventional
Construction Techniques for Enhancing the Blast Resistance of Steel Stud Walls. Journal of
Structural Engineering Asce, 139, 1992-2002.
BLISMAS, N. & WAKEFIELD, R. 2009. Drivers, constraints and the future of offsite manufacture in
Australia. Construction Innovation: Information, Process, Management, 9, 72-83.
BONDOK, D., SALIM, H., SAUCIER, A. & DINAN, R. 2015. Static resistance function of cold-
formed steel stud walls. Thin-Walled Structures, 94, 177-187.
BRYAN, E. R. 1993. The design of bolted joints in cold-formed steel sections. Thin-Walled Structures,
16, 239-262.
BS. 1996. British Standard (BS). Loading for buildings, Part 1: Code of practice for dead and imposed
loads. (BS6399). London, United Kingdom.
BS. 1997. British Standard (BS). “The Structural use of concrete in building (BS8110-1:1997)”. Part1: Code
of practice for design and construction.
BSI. 2009. BS EN ISO 6892-1. Metallic materials. Tensile testing: Method of test at ambient
temperature.
BURSI, O. S. & JASPART, J. P. 1997. Benchmarks for finite element modelling of bolted steel
connections. Journal of Constructional Steel Research, 43, 17-42.

202
CHEN, C. H., ZHU, Y. F., YAO, Y., HUANG, Y. & LONG, X. 2016. An evaluation method to
predict progressive collapse resistance of steel frame structures. Journal of Constructional
Steel Research, 122, 238-250.
CHU, X.-T., RICKARD, J. & LI, L.-Y. 2005. Influence of lateral restraint on lateral-torsional
buckling of cold-formed steel purlins. Thin-Walled Structures, 43, 800-810.
CHUNG, K. F. & IP, K. H. 2000. Finite element modelling of bolted connections between cold-
formed steel strip and hot rolled steel plates under static shear loading. Engineering Structures,
22, 1271-1284.
CHUNG, K. F. & IP, K. H. 2001. Finite element investigation on the structural behaviour of cold-
formed steel bolted connections. Engineering Structures, 23, 1115-1125.
CHUNG, K. F. & LAU, L. 1999. Experimental investigation on bolted moment connections among
cold-formed steel members. Engineering Structures, 21, 898-911.
CHUNG, K. F. & LAWSON, R. M. 2000. Structural performance of shear resisting connections
between cold-formed steel sections using web cleats of cold-formed steel strip. Engineering
Structures, 22, 1350-1366.
COIMBRA, J. & ALMEIDA, M. 2013. Challenges and benefits of building sustainable cooperative
housing. Building and Environment, 62, 9-17.
DAVIES, R., PEDRESCHI, R. & SINHA, B. P. 1997. Moment-rotation behaviour of groups of press-
joins in cold-formed steel structures. Thin-Walled Structures, 27, 203-222.
DI LORENZO, G. & LANDOLFO, R. 2004. Shear experimental response of new connecting systems
for cold-formed structures. Journal of Constructional Steel Research, 60, 561-579.
DOD. 2005. DoD. Design building to resist progressive collapse. Unified Facilities Criteria (UFC-04-
023-03). USA: Department of Defence.
DOD. 2009. Unified facilities criteria: design of buildings to resist progressive collapse. UFC 4-023-
03. United States Department of Defense.
DOD. 2013. DoD. Design building to resist progressive collapse. Unified Facilities Criteria (UFC-04-
023-03). USA: Department of Defence.
DOD. 2016. DoD. Design building to resist progressive collapse. Unified Facilities Criteria (UFC-04-
023-03). USA: Department of Defence.
DORAN, D. & GIANNAKIS, M. 2011. An examination of a modular supply chain: a construction
sector perspective. Supply Chain Management: An International Journal, 16, 260-270.
DRAGANIĆ, H., DOKŠANOVIĆ, T. & MARKULAK, D. 2014. Investigation of bearing failure in
steel single bolt lap connections. Journal of Constructional Steel Research, 98, 59-72.
DUBINA, D. 2008. Structural analysis and design assisted by testing of cold-formed steel structures.
Thin-Walled Structures, 46, 741-764.
DUNDU, M. & KEMP, A. R. 2006. Plastic and Lateral-Torsional Buckling Behavior of Single Cold-
Formed Channels Connected Back-to-Back. Journal of Structural Engineering, 132, 1223-
1233.
EGAN, J. 1998. Rethinking Construction. London: Construction task force.
EUROCODE 2004. European Committee for Standardization. Eurocode 2: Design of concrete
structures. Part 1: General rules and rules for buildings (EN 1992-1-1). Brussels, Belgium.
EUROCODE 2005. European Committee for Standardization. Eurocode 3: design of steel structures-
cold formed structures. (EN 1993-1-8). part 1-8: Design of joints. British Standards Institution.

203
EUROCODE 2006a. European Committee for Standardization. Eurocode 1: Actions on structures.
Part 1-7: General Actions - Accidental actions. (EN 1991-1-7). Brussels, Belgium.
EUROCODE 2006b. European Committee for Standardization. Eurocode 3: Design of Steel
Structures: Part-1-3 General rules- Supplementary rules for cold-formed members and
sheeting. (EN 1993-1-3).
FAN, L., RONDAL, J. & CESCOTTO, S. 1997a. Finite element modelling of single lap screw
connections in steel sheeting under static shear. Thin-Walled Structures, 27, 165-185.
FAN, L. X., RONDAL, J. & CESCOTTO, S. 1997b. Numerical simulation of lap screw connections.
Thin-walled structure. Thin-Walled Structures, 29, 235-241.
FIORINO, L., DELLA CORTE, G. & LANDOLFO, R. 2007. Experimental tests on typical screw
connections for cold-formed steel housing. Engineering Structures, 29, 1761-1773.
FOLEY, C. M., MARTIN, K. & SCHNEEMAN, C. 2007. Robustness in structural steel framing
systems. Milwaukee, WI: Marquette University.
GAO, T. & MOEN, C. D. 2012. Predicting rotational restraint provided to wall girts and roof purlins
by through-fastened metal panels. Thin-Walled Structures, 61, 145-153.
GB. 2002. Technical code of cold-formed thin-wall steel structures. (GB50018-2002). Beijing: China
Planning Press.
GERASIMIDIS, S. & BANIOTOPOULOS, C. 2015. Progressive collapse mitigation of 2D steel
moment frames. Stahlbau, 84, 324-331.
GERASIMIDIS, S., BISBOS, C. D. & BANIOTOPOULOS, C. C. 2014. A computational model for
full or partial damage of single or multiple adjacent columns in disproportionate collapse
analysis via linear programming. Structure and Infrastructure Engineering, 10, 670-683.
GIBB, A. G. F. & ISACK, F. 2003. Re-engineering through pre-assembly: client expectations and
drivers. Building reseach & information, 31, 146-160.
GOODIER, C. & GIBB, A. 2005. The value of the UK market for offsite. Buildoffsite: promoting
construction offsite. Buildoffsite: promoting construction offsite.
GORGOLEWSKI, M., GRUBB, P. & LAWSON, R. 2001a. Building design using cold formed steel
sections: light steel framing in residential buildings. The Steel Construction Institute P, 301.
GORGOLEWSKI, M. T., GRUBB, P. & LAWSON, R. M. 2001b. Modular Construction Using Light
Steel Framing: Desing of Residential Buildings, Steel Construction Institute.
GSA. 2000. United States General Services Administration (GSA). Progressive collapse analysis and
design guidelines for new federal office buildings and major modernization projects.
Washington, DC: General Services Administration.
GSA. 2003. United States General Services Administration (GSA). Progressive collapse analysis and
design guidelines for new federal office buildings and major modernization projects.
Washington D.C.
GSA. 2016. United States General Services Administration (GSA). Alternate path analysis & Design
guidelines for progressive collapse resistance. Washington D.C.
GUTIERREZ, R., LOUREIRO, A., LOPEZ, M. & MORENO, A. 2011. Analysis of cold-formed
purlins with slotted sleeve connections. Thin-Walled Structures, 49, 833-841.
HAMPSON, K. & BRANDON, P. 2004. Construction 2020: A vision for Australia's property and
construction industry., Cooperative research centre for construction innovation.

204
HE, Y. C. & WANG, Y. C. 2011. Load–deflection behaviour of thin-walled plates with a single bolt in
shearing. Thin-Walled Structures, 49, 1261-1276.
HO, H. C. & CHUNG, K. F. 2006. Structural behavior of lapped cold-formed steel Z sections with
generic bolted configurations. Thin-Walled Structures, 44, 466-480.
ISO. 2009. International Organization for Standardization (ISO 6892-1), metallic materials –tensile
testing – part 1: method of test at room temperature. Geneva, Switzerland: ISO.
JU, S. H., FAN, C. Y. & WU, G. H. 2004. Three-dimensional finite elements of steel bolted
connections. Engineering Structures, 26, 403-413.
KIM, J., YOON, J.-C. & KANG, B.-S. 2007. Finite element analysis and modeling of structure with
bolted joints. Applied Mathematical Modelling, 31, 895-911.
KIRK, P. 1986. Design of a cold formed section portal frame building system. Eighth International
Specialty Conference on Cold-Formed Steel Structures. St. Louis, Missouri, U.S.A.
KRAUS, C. A. 1997. Floor vibration design criterion for cold-formed C-Shaped supported residential
floor systems. Virginia Polytechnic Institute and State University.
KWON, Y. B., CHUNG, H. S. & KIM, G. D. 2008. Development of cold-formed steel portal frames
with PRY sections. Advances in Structural Engineering, 11, 633-649.
KWON, Y. B., CHUNG, H. S., KIM, G. D. 2006. Experiments of cold formed steel connections and
portal frames. Journal of Structural Engineering.
LANDOLFO, R., FIORINO, L. & IUORIO, O. 2010. A specific procedure for seismic design of cold-
formed steel housing. Advance Steel Construction, 6, 603-618.
LANDOLFO, R., MAMMANA, O., PORTIOLI, F., DI LORENZO, G. & GUERRIERI, M. R. 2009.
Experimental investigation on laser welded connections for built-up cold-formed steel beams.
Journal of Constructional Steel Research, 65, 196-208.
LARSSON, J., ERIKSSON, P. E., OLOFSSON, T. & SIMONSSON, P. 2014. Industrialized
construction in the Swedish infrastructure sector: core elements and barriers. Construction
Management and Economics, 32, 83-96.
LAWSON, R. M. & OGDEN, R. G. 2008. „Hybrid‟ light steel panel and modular systems. Thin-
Walled Structures, 46, 720-730.
LAWSON, R. M., OGDEN, R. G. & BERGIN, R. 2012. Application of Modular Construction in
High-Rise Buildings. Journal of Architectural Engineering, 18, 148-154.
LAWSON, R. M., OGDEN, R. G., PEDRESCHI, R. & POPO-OLA, S. O. 2008. Developments of
Cold-Formed Steel Sections in Composite Applications for Residential Buildings. Advances in
Structural Engineering, 11, 651-660.
LAWSON, R. M. & RICHARDS, J. 2010. Modular design for high-rise buildings. Proceedings of the
Institution of Civil Engineers-Structures and Buildings, 163, 151-164.
LEE, Y. L., WEHNER, T. J., LU, M. W., MORRISSETT, T. W. & PAKALNINS, E. 1998. Ultimate
Strength of Resistance Spot Welds Subjected to Combined Tension and Shear. Journal of
Testing & Evaluation, 26, 213-219.
LI, L.-Y. 2004. Lateral–torsional buckling of cold-formed zed-purlins partial-laterally restrained by
metal sheeting. Thin-Walled Structures, 42, 995-1011.
LI, L.-Y., REN, C. & YANG, J. 2012. Theoretical analysis of partially restrained zed-purlin beams
subjected to up-lift loads. Journal of Constructional Steel Research, 70, 273-279.

205
LI, Y., LU, X., GUAN, H. & YE, L. 2011. An improved tie force method for progressive collapse
resistance design of reinforced concrete frame structures. Engineering Structures, 33, 2931-
2942.
LIM, J. & KRAUTHAMMER, T. 2006. Progressive collapse analyses of 2D steel-framed structures
with different connection models. 43, 201-215.
LIM, J. B. P. & NETHERCOT, D. A. 2004. Stiffness prediction for bolted moment-connections
between cold-formed steel members. Journal of Constructional Steel Research, 60, 85-107.
LIN, S. H., PAN, J., WU, S. R., TYAN, T. & WUNG, P. 2002. Failure loads of spot welds under
combined opening and shear static loading conditions. International Journal of Solids &
Structures, 39, 19-39.
LIU, J. L. 2010. Preventing progressive collapse through strengthening beam-to-column connection,
Part 1: Theoretical analysis. Steel Construction, 66, 229-237.
LIU, Q., YANG, J., CHAN, A. H. C. & LI, L. Y. 2011. Pseudo-plastic moment resistance of
continuous beams with cold-formed sigma sections at internal supports: A numerical study.
Thin-Walled Structures, 49, 1592-1604.
LORENZO, G. D. & LANDOLFO, R. 2004. Shear experimental response of new connecting systems
for cold-formed structures. Journal of Constructional Steel Research, 60, 561-579.
LU, X., LI, Y. & YE, W. 2011. Theory and design method for progressive collapse provision of
concrete structures, Beijing, China Building Industry Press.
MILES, J. & WHITEHOUSE, N. 2013. Offsite housing review. London: Construction industry
council.
MILLS, J. E., LABOUBE, R. 2004. Self-Drilling Screw Joints for Cold-Formed Channel Portal
Frames. Journal of Structural Enginnering, 130, 8.
MOHAMED, I., RAHMAN, N. A. & SERACINO, R. Investigation of Cold-Formed Steel Wall
Reinforcement Systems to Resist Progressive Collapse. Structures Congress, 2013. 960-969.
MUCHA, J. & WITKOWSKI, W. 2013. The experimental analysis of the double joint type change
effect on the joint destruction process in uniaxial shearing test. Thin-Walled Structures, 66,
39-49.
MӒKELӒINEN, P. & KESTI, J. 1999. Advanced method for lightweight steel joining. Journal of
Constructional Steel Research, 49, 107-116.
NAIR, R. S. 2004. Progressive collapse basics. Modern Steel Construction.
NBCC. 2005. Canadian Commission on Building and fire Codes, National Research Council of
Canada. National Building Code of Canada. Ottawa, Canada.
NETHERCOT, D. A., LI, T. Q. & AHMED, B. 1998. Unified classification system for beam-to-
column connections. Journal of Constructional Steel Research, 45, 39–65.
ODPM. 2004. Office of the Deputy Prime Minister. Office of the Deputy Prime Minister. The building
regulations 2000, Part A, Schedule 1: A3, Disproportionate collapse. London, United
Kingdom.
OUTINEN, J., PERTTOLA, H., HARA, R., KUPARI, K. & KAITILA, O. 2000. Seminar on steel
structures: Design of cold-formed steel structures. Helsinki University of Technology
Laboratory of Steel Structures Publications 15.

206
PAN, W., GIBB, A. & DAINTY, A. 2005. Offsite modern methods of construction in housebuilding:
Perspectives and practices of leading UK housebuilders. Leicestershire: Loughborough
University.
PAN, W., GIBB, A. G. F. & DAINTY, A. R. J. 2007. Perspectives of UK housebuilders on the use of
offsite modern methods of construction. Construction Management and Economics, 25, 183-
194.
PCA. 1979. Portland Cement Association (PCA). Design Methodology. Design and Construction of
Large-Panel Concrete Structures, report 1- 6 and supplementary A, B, C.
PEDRESCHI, R. F., SINHA, B. P. & DAVIES, R. 1997. Advanced connection techniques for cold-
formed steel structure. Journal of Structural Engineering, 123, 138-144.
REN, C., LI, L.-Y. & YANG, J. 2012. Bending analysis of partially restrained channel-section purlins
subjected to up-lift loadings. Journal of Constructional Steel Research, 72, 254-260.
RUTH, P., MARCHAND, K. A. & WILLIAMSON, E. B. 2015. Static Equivalency in Progressive
Collapse Alternate Path Analysis: Reducing Conservatism while Retaining Structural Integrity.
Journal of Performance of Constructed Facilities, 20, 349-364.
S NSTAB , J. K., HOLMSTR M, P. H., MORIN, D. & LANGSETH, M. 2015. Macroscopic strength
and failure properties of flow-drill screw connections. Journal of Materials Processing
Technology, 222, 1-12.
SCI. 2006. Sustainability of steel in housing and residential buildings. The steel construction institute.
SCI. 2007. Market study of modular construction in Europe and design of residential building using
modular construction. The steel construction institute.
SCI. 2015. Modular construction using light steel framing-design of residential buildings. The steel
construction institute.
SHI, Y. P. & ZHOU, Y. R. 2006. The finite element analysis example explanation. 45-51.
SHI, Y. P. Z., Y. R. 2006. The finite element analysis example explanation.
STODDART & E., P. 2012. Development of component-based connection modelling for steel framed
structures subjected to blast or progressive collapse. University of Southampton.
STYLIANIDIS, P. M. & NETHERCOT, D. A. 2015. Modelling of connection behaviour for
progressive collapse analysis. Journal of Constructional Steel Research, 113, 169-184.
TAN, K. H., SEAH L. K., FOK, S. C. 1996. Connections in cold-formed thin-walled structures.
Computers and Structures, 60, 4.
TOHIDI, M., YANG, J. & BANIOTOPOULOS, C. 2014a. An Improved Tie Force Method for
Progressive Collapse Resistance of Precast Concrete Cross Wall Structures. International
Journal of Civil, Structural, Construction and Architectural Engineering, 8, 1-9.
TOHIDI, M., YANG, J. & BANIOTOPOULOS, C. 2014b. Numerical evaluations of codified design
methods for progressive collapse resistance of precast concrete cross wall structures.
Engineering Structures, 76, 177-186.
TOM , A., SEDLACEK, G. & WEYNAND, K. 1993. Connections in cold-formed steel. Thin-Walled
Structures, 16, 219-237.
TRAHAIR, N. S., BRADFORD, M. A., NETHERCOT, D. & GARDNER, L. 2007. The behaviour
and design of steel structures to EC3, CRC Press.

207
VLASSIS, A. G., IZZUDDIN, B. A., ELGHAZOULI, A. Y. & NETHERCOT, D. A. 2009.
Progressive collapse of multi-storey buildings due to failed floor impact. Engineering
Structures, 31, 1522-1534.
VRAN , T. 2002. Torsional restraint of cold-formed beams provided by corrugated sheeting for
arbitrary input variables. Eurosteel the 3rd European conference on steel structures. Coimbra,
Portugal.
VRAN , T. 2006. Effect of loading on the rotational restraint of cold-formed purlins. Thin-Walled
Structures, 44, 1287-1292.
WAHYUNI, E. 2015. Axial and Flexural Performance of Adhesive Connection on Cold-Formed Steel
Structures. International Journal of Technology, 6, 699-708.
WINTER, G. 1956. Tests on bolted connections in light gage steel. Journal of the Structural Division,
Proc. ASCE, 82, No. ST2.
WONG, M. F. & CHUNG, K. F. 2002. Structural behaviour of bolted moment connections in cold-
formed steel beam-column sub-frames. Journal of Constructional Steel Research, 58, 253-274.
YANG, J. & LIU, Q. 2012. Sleeve connections of cold-formed steel sigma purlins. Engineering
Structures, 43, 245-258.
YE, W., WANG, C. J., MYNORS, D. J., KIBBLE, K. A., MORGAN, T. & CARTWRIGHT, B. 2013.
Load–deflection behaviour of sleeved joints in modified Z purlin system. Thin-Walled
Structures, 73, 318-328.
YE, Z.-M., KETTLE, R. & LI, L.-Y. 2004. Analysis of cold-formed zed-purlins partially restrained by
steel sheeting. Computers & Structures, 82, 731-739.
YE ZM, K. R., LI LY, SCHAFER BW 2002. Buckling behavior of cold-formed zed-purlins partially
restrained by sheeting. Thin-Walled Structures, 40, 853-864.
YU, C. & PANYANOUVONG, M. X. 2013. Bearing strength of cold-formed steel bolted connections
with a gap. Thin-Walled Structures, 67, 110-115.
YU, W. K., CHUNG, K. F. & WONG, M. F. 2005. Analysis of bolted moment connections in cold-
formed steel beam–column sub-frames. Journal of Constructional Steel Research, 61, 1332-
1352.
YUAN, W.-B., CHENG, S., LI, L.-Y. & KIM, B. 2014. Web-flange distortional buckling of partially
restrained cold-formed steel purlins under uplift loading. International Journal of Mechanical
Sciences, 89, 476-481.
ZABIHI, H., HABIB, F. & MIRSAEEDIE, L. 2013. Definitions, concepts and new directions in
Industrialized Building Systems (IBS). KSCE Journal of Civil Engineering, 17, 1199-1205.
ZADANFARROKH, B. F. & BRYAN, E. R. 1992. Testing and design of bolted connections in cold
formed steel sections. Eleventh International Specialty Conference on Cold-Formed Steel
Structures. St. Louis, Missouri, U.S.A.
ZAHARIA, R. & DUBINA, D. 2000. Behaviour of cold-formed steel truss bolted joints. In: The IV’th
international workshop on connections in steel structures.
ZAHARIA, R. & DUBINA, D. 2006. Stiffness of joints in bolted connected cold-formed steel trusses.
Journal of Constructional Steel Research, 62, 240-249.
ZHAI, X., REED, R. & MILLS, A. 2014. Factors impeding the offsite production of housing
construction in China: an investigation of current practice. Construction Management and
Economics, 32, 40-52.

208
ZHANG, X., SKITMORE, M. & PENG, Y. 2014. Exploring the challenges to industrialized
residential building in China. Habitat International, 41, 176-184.
ZHAO, C., YANG, J., WANG, F. & CHAN, A. H. C. 2014. Rotational stiffness of cold-formed steel
roof purlin–sheeting connections. Engineering Structures, 59, 284-297.
ZHU, J., CHEN, J. & REN, C. 2013. Numerical study on the moment capacity of zed-section purlins
under uplift loading. The 2013 World Congress on Advances in Structural Engineering
Mechanics (ASEM 13). Jeju, Korea.